Article

Refined Simulation of Old Urban Inundation and Assessment of Stormwater Storage Capacity Based on Surface–Pipe Network–Box Culvert–River Coupled Modeling

1
State Key Laboratory of Water Engineering Ecology and Environment in Arid Area, Xi’an University of Technology, Xi’an 710048, China
2
Xi’an Water Group Planning and Design Research Institute Co., Ltd., Xi’an 710000, China
3
PowerChina Northwest Engn Co., Ltd., Xi’an 710065, China
*
Authors to whom correspondence should be addressed.
Hydrology 2025, 12(11), 280; https://doi.org/10.3390/hydrology12110280
Submission received: 18 September 2025 / Revised: 16 October 2025 / Accepted: 20 October 2025 / Published: 28 October 2025

Abstract

Old urban districts, characterized by complex drainage networks, heterogeneous surfaces, and high imperviousness, are particularly susceptible to flooding during extreme rainfall. In this study, the moat drainage district of Xi’an was selected as the research area. A refined hydrologic–hydrodynamic simulation and an assessment of drainage and flood-retention capacities were conducted based on the coupled GAST–SWMM model. Results show that the model can accurately capture the rainfall–surface–pipe–river interactions and reproduce system responses under different rainfall intensities. The box culvert’s effective regulation capacity is limited to 1- to 2-year return periods, beyond which overflow rises sharply, with overflow nodes exceeding 80% during a 2-year event. The moat’s available storage capacity is 17.20 × 10⁴ m3, sufficient for rainfall events with 5- to 10-year return periods. In a 10-year return period event, the box culvert overflow volume (12.56 × 10⁴ m3) approaches the upper limit, resulting in overtopping. These findings provide a scientific basis for evaluating drainage efficiency and guiding flood control management in old urban districts.

1. Introduction

Driven by the dual pressures of global climate change and rapid urbanization, urban flood disasters have shown a concerning trend of increasing frequency and intensity [1,2,3,4]. According to data from the World Meteorological Organization (WMO), over the past 50 years, flood-related disasters have occurred almost daily over the past five decades, resulting in an average of 115 fatalities and approximately USD 202 million in economic losses per day [5]. This trend has been strongly evidenced in recent extreme rainfall events in several megacities: during the ‘7·20’ extreme rainstorm in Zhengzhou in 2021, the cumulative precipitation reached 449 mm, with a maximum hourly rainfall of 201.9 mm, setting a new record for hourly rainfall in mainland China. In 2016, a once-in-50-years rainstorm in Xi’an led to waterlogging depths of up to 2.5 m at Xiaozhai Crossroad, paralyzing the local transportation system [6,7,8]. These cases not only reveal the vulnerability of cities in the face of extreme rainfall but also highlight the inadequacy of traditional drainage systems under new climatic conditions, underscoring the urgent need for more precise and dynamic simulation and assessment of urban flood processes [9,10].
In response, urban flood modeling has evolved significantly over the past decades. Early studies primarily focused on either surface runoff simulations using two-dimensional (2D) models or sewer network hydraulics using one-dimensional (1D) models such as SWMM. However, these standalone applications were unable to fully capture the interactions between surface and subsurface flows, thereby limiting the accuracy of urban flood process representation [11]. With an improved understanding of the integrated nature of urban flooding, researchers have increasingly recognized the limitations of single models and turned to coupled modeling approaches to achieve more comprehensive and realistic simulations. For example, some studies have achieved coupling between open-source models such as SWMM and self-developed 2D surface flow modules [12], advancing the transition from single-model applications to multi-process and multi-dimensional coupled systems.
Currently, coupled simulations have become the mainstream in urban flood research. Common approaches include (1) coupling of hydrological models with 1D hydrodynamic models, (2) coupling of hydrological models with 2D surface flow models, (3) coupling of 1D pipe or river network models with 2D surface models, and (4) full-process coupling encompassing hydrology, surface flow, pipe networks, and river networks. Among these, 1D–2D coupled models are the most widely adopted [13], typically realized through the coupling of river networks or drainage systems with surface flow modules. Depending on spatial representation and computational complexity, these couplings can be classified as semi-distributed or fully distributed. The semi-distributed coupling is often driven by a hydrological model and activates 2D inundation calculations only when pipe overflow occurs, providing a balance between computational efficiency and accuracy. In contrast, the fully distributed coupling employs complete hydrodynamic equations to explicitly describe both surface and subsurface processes, thereby achieving higher physical realism at the cost of significantly increased computational demand.
Despite these advances, old urban districts present unique challenges. The complexity of drainage networks and the diversity of underlying surfaces often limit the effectiveness of conventional models under extreme rainfall conditions [14]. Accurate flood simulation in these areas requires consideration of multiple interacting components, including underground drainage pipelines, surface roads, and open channels, which collectively determine the spatiotemporal patterns of runoff generation, convergence, and discharge [15,16,17,18,19]. For example, Min et al. [20] developed a 1D–2D coupled model for downtown Yangon, Myanmar, integrating the open-channel “minor drain system” with the “major runoff system” of streets, sidewalks, and squares. Their results highlighted the difficulty of simulating complex hydraulic interactions in historic urban areas, emphasizing the need for both advanced coupling techniques and computational efficiency [21,22].
Moreover, constrained by spatial limitations and construction conditions, drainage system upgrades in many old urban districts can only be implemented locally, resulting in multi-level drainage systems composed of pipelines, box culverts, and river networks. The hydraulic processes within these systems are highly complex, with frequent water exchanges among pipelines, box culverts, open channels, and the surface, resulting in dynamic and heterogeneous drainage pathways. Box culverts, in particular, are large drainage structures commonly found in historic city centers. Their hydraulic behavior differs markedly from both conventional pipelines and natural river channels, exhibiting pronounced transient flow characteristics [23,24]. Nevertheless, many existing models simplify them as enlarged pipes, neglecting their unique storage capacity and flow dynamics, which can compromise simulation accuracy.
In summary, flood modeling in old urban areas faces three critical challenges: (1) Model Simplification: Conventional models typically simplify the drainage network into a single layer, neglecting the intricate hydraulic interplay between the multi-level drainage infrastructures specific to old urban areas; (2) Accuracy-Efficiency Balance: High-resolution simulation of complex systems requires capturing multi-scale processes, yet traditional models struggle to balance computational demand with physical fidelity [25,26]; and (3) Unclear System Performance: The operational principles of these unique drainage systems across different rainfall return periods are not well understood, requiring comprehensive modeling to delineate the efficacy of multi-level drainage networks.
This study employs a GPU-accelerated, high-resolution coupled modeling framework that integrates the Accelerated Surface Water Flow and Associated Transport (GAST) model with the Storm Water Management Model (SWMM). This approach enables precise and efficient simulation of water exchange processes among surface flows, sewer networks, box culverts, and open channels in old urban areas. Using detailed drainage pipeline data, high-resolution digital elevation models, land-use information, and hydrological observations, we constructed an urban rainfall–runoff model that captures surface and open-channel flows, conduit flows in underground networks, and their interactions. The framework further allows quantitative assessment of box culvert drainage capacity and urban moat flood attenuation performance, providing both scientific support for urban waterlogging mitigation and a technical foundation for high-performance simulation of complex, multi-level urban drainage systems.

2. Materials and Methods

The study area includes the urban drainage network, box culverts, and the Xi’an City Moat, forming a highly complex urban drainage system. Hydrological and hydraulic interactions are considered across multiple components, including surface runoff generation, pipe network conveyance, box culvert routing, and river network flow. To accurately represent these processes, a refined urban flood-inundation model was developed using the GAST–SWMM framework, comprising surface runoff generation, pipe network routing, and coupled 1D–2D hydrodynamic simulation modules.

2.1. Surface Runoff Generation

The conservative form of the 2D shallow water equations (SWEs) is employed to simulate flow dynamics within the 2D computational domain [27,28]. Surface runoff is computed using the dynamic wave approach, with spatial discretization implemented via a finite volume Godunov scheme. Mass and momentum fluxes are evaluated using the HLLC approximate Riemann solver, and friction source terms are treated with the bed-slope flux method. To enhance numerical accuracy, a second-order TVD-MUSCL scheme is applied, and stability is ensured under the CFL condition [29,30]. Time integration is performed using a two-stage Runge–Kutta method to maintain second-order temporal accuracy [31]. GPU-based parallel computing is further employed to accelerate the simulation.
q t + F x + G y = S
q = h q x q y · F = u h u q x + g h 2 / 2 u q y · G = v h v q x v q y + g h 2 / 2
S = i g h z b / x C f u u 2 + v 2 g h z b / y C f v u 2 + v 2
where t is the time, s; q is a variable vector including the water depth h, m; qx and qy are the single-width flows along the x and y directions, respectively, m2/s; F and G are the fluxes along the x and y directions, respectively; g is the gravitational acceleration, m3/s; u and v are the flow velocities along the x and y directions, respectively, m/s; S is the source term vector; i is the infiltration source term; zb is the riverbed bottom elevation; and Cf is the Xie Cai coefficient, which can be expressed as Cf = gn2/h1/3, where n is the Manning coefficient, s/m1/3.

2.2. Pipe Network Flow Routing

The SWMM model, developed with support from the U.S. Environmental Protection Agency, is widely used for simulating urban 1D drainage networks [32]. It solves the Saint-Venant equations to simulate flow movement within pipe networks and provides three computational approaches: kinematic wave, diffusive wave, and dynamic wave [33]. Considering that the dynamic wave method can account for inlet and outlet losses in pipe segments and simulate pressurized flow as well as other complex and variable flow conditions in closed conduits, the present study employs the dynamic wave approach for drainage network routing. The governing equations are as follows:
A t + Q x = 0
g A H x + Q 2 / A x + Q x + g A S f = 0
where A is the cross-sectional flow area of the pipe, m2; Q is the discharge in the pipe, m3/s; x is the longitudinal distance along the fixed cross-section, m; t is time, s; g is the gravitational acceleration, m/s2; and Sf is the friction slope, S f = K / g A R 4 / 3 Q V , K is the resistance coefficient, K = g n 2 , where n is the Manning roughness coefficient of the pipe; R is the hydraulic radius of the flow cross-section, m; and V is the flow velocity, m/s.
The inflow of surface runoff into the stormwater inlet is calculated using the weir flow equation, as follows:
Q = m b 2 g h 3 / 2
where Q is the inflow of surface runoff into the stormwater inlet, m3/s; m is the discharge coefficient; b is the width of the inlet, m; and h is the water depth in the inlet, m.

2.3. 1D–2D Coupled Model

The coupling of urban surface runoff and pipe network drainage primarily involves resolving the water exchange between the 2D surface model and the 1D pipe network model. In the model, stormwater inlets or grates are conceptualized as nodes, which serve as the sole conduits for water exchange between the 2D surface model and the 1D pipe network model [34,35]. Research on water exchange between 2D surface models and 1D pipe networks remains limited, with few validations from physical experiments. Computationally, overflow and inflow are typically calculated using weir flow or orifice flow equations [36]. Therefore, in this study, the same approach is adopted for calculating water exchange at the nodes.
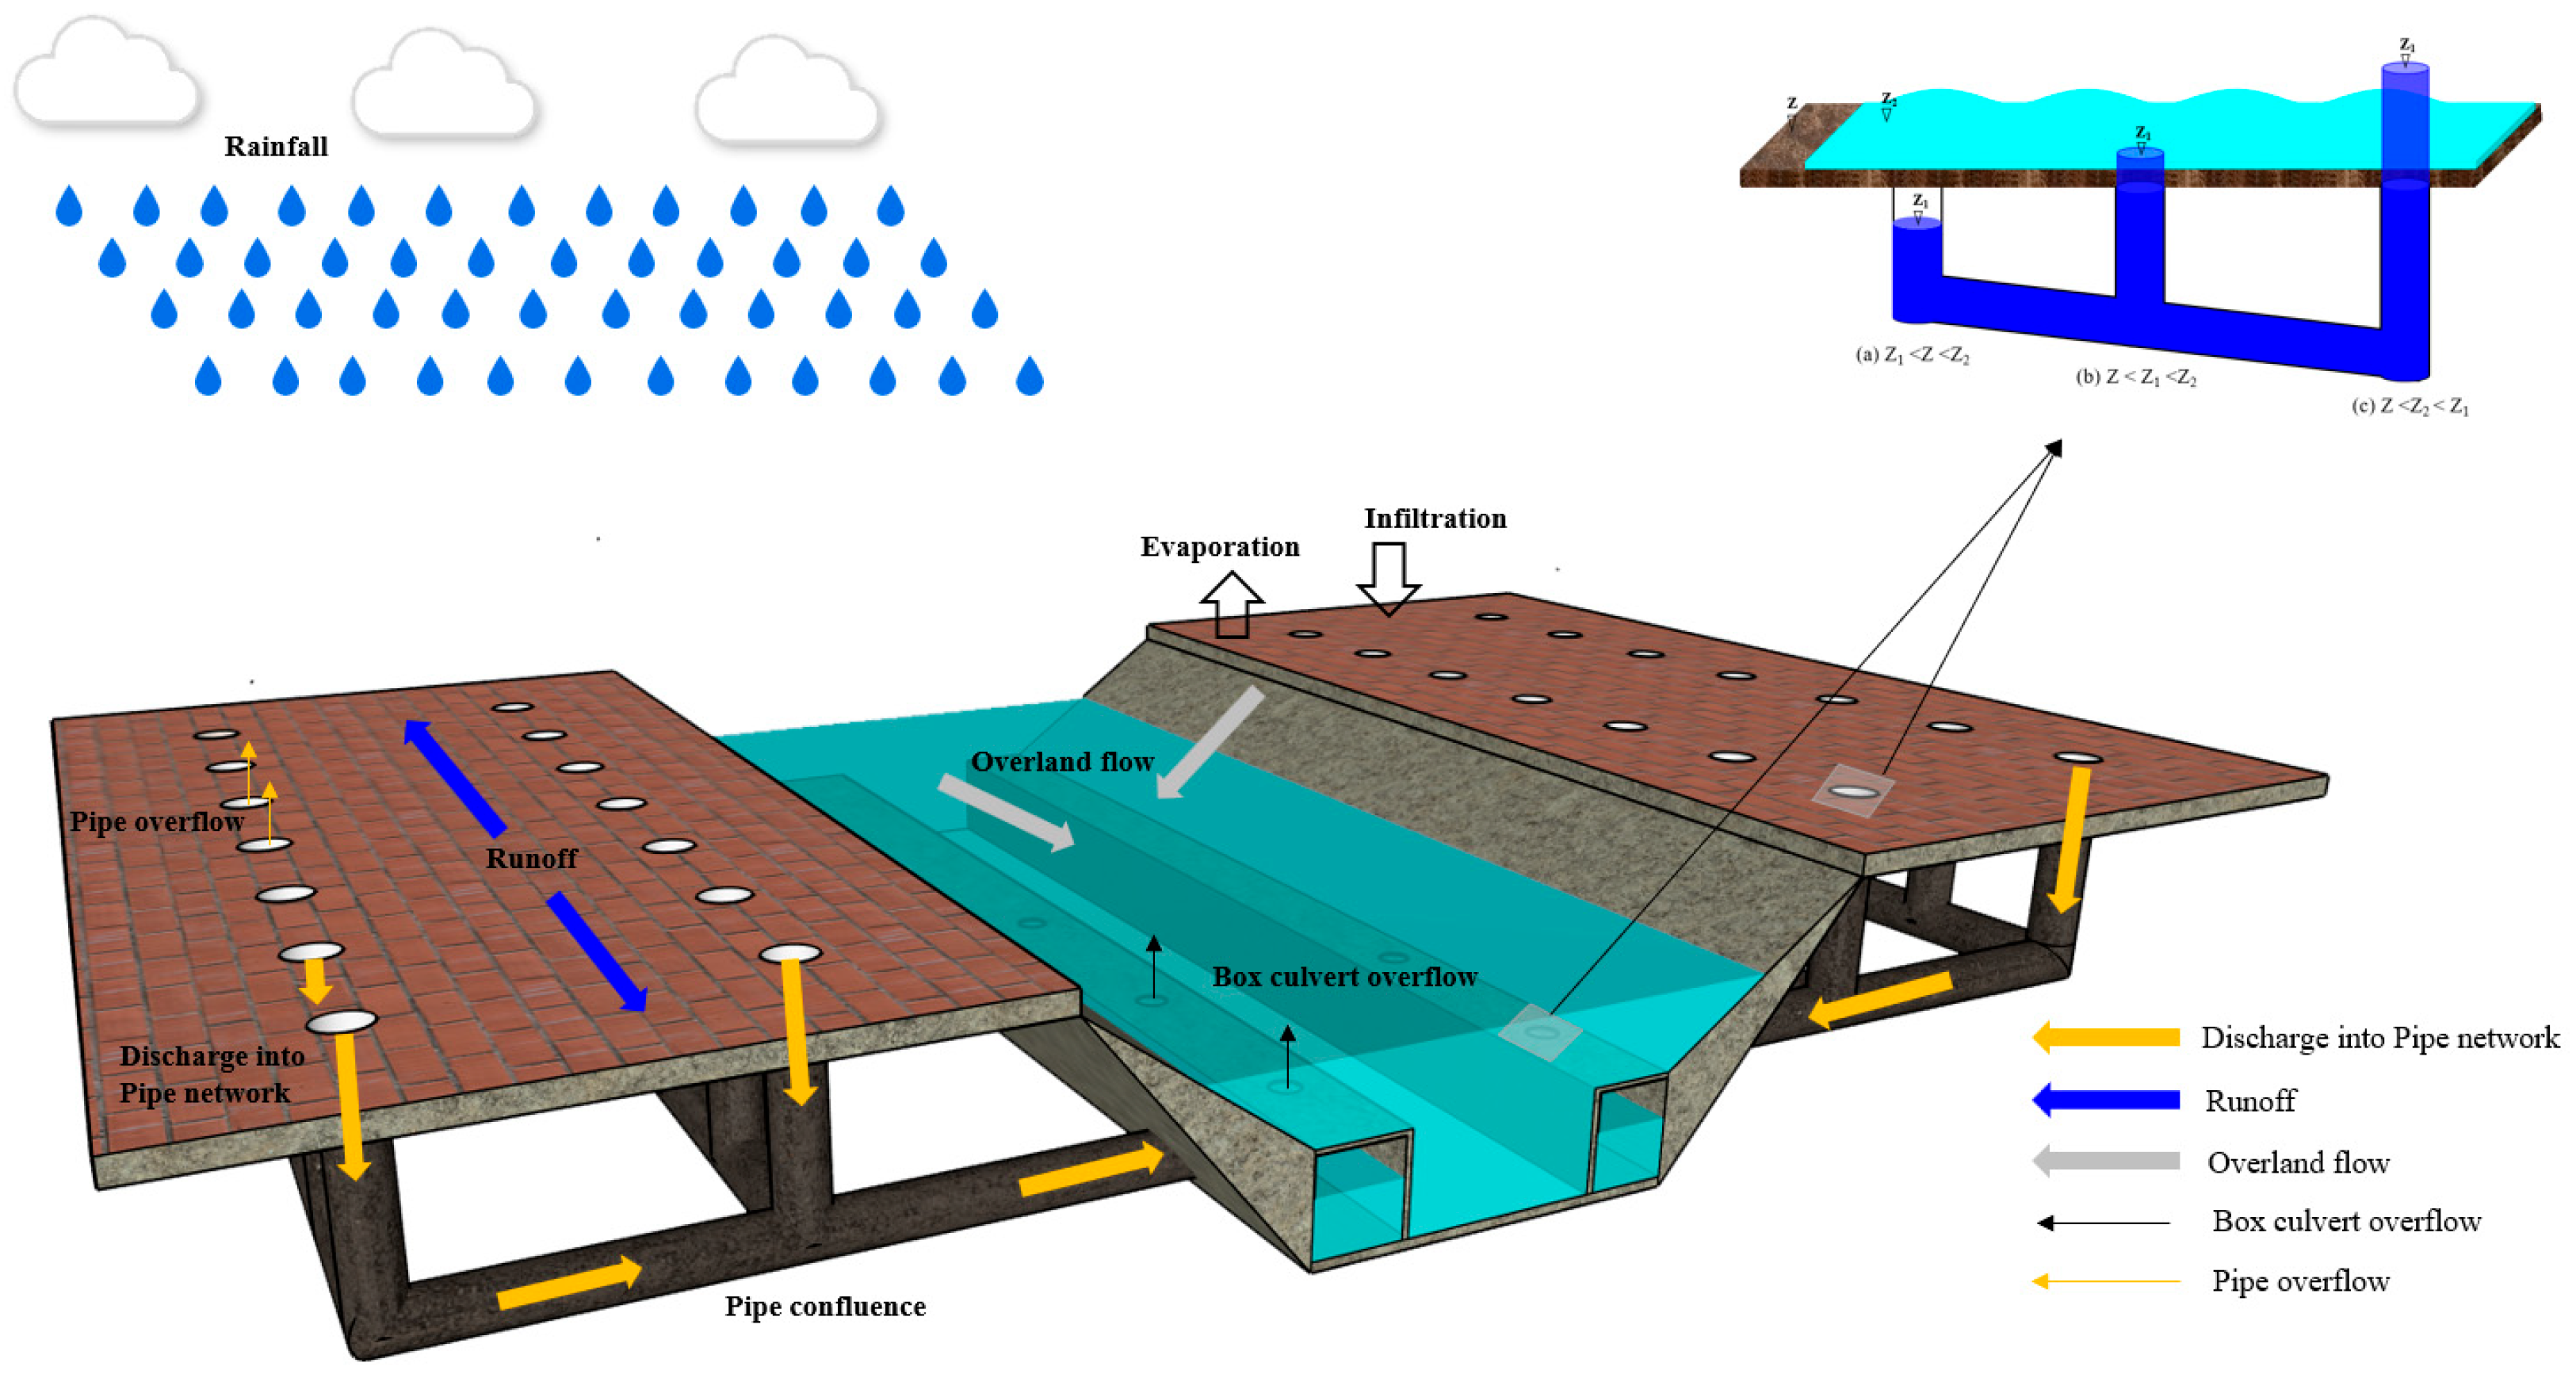
When the node water level Z1 is lower than the surface grid water level Z2, which in turn is below the surface elevation Z (Figure 1a), the inflow is calculated using the weir flow equation, as follows:
Q R = m 1 b 2 g Z 2 Z 3 / 2
where QR is the inflow to the node, m3/s; C1 is the orifice coefficient, [0, 1]; b is the perimeter of the pipe network node, m; Z2 is the water level of the surface grid, m; Z is the surface elevation, m.
When the node water level Z1 is lower than the surface grid water level Z2, which exceeds the surface elevation Z (Figure 1b), the inflow is calculated using the orifice flow equation, as follows:
Q H = m 2 A 1 2 g Z 2 Z 1
where QH is the backflow into the node, m3/s; m2 is the orifice coefficient, [0, 1]; A1 is the node area, m2; and Z1 is the node water level, m.
When the node water level Z1 exceeds the surface grid water level Z2 (Figure 1c), the inflow is calculated based on the difference between Z2 and Z1, as follows:
Q Y = m 2 A 1 2 g Z 1 Z 2
where QY is the overflow from the node, m3/s, and C2 is the orifice coefficient, [0, 1].

3. Study Area and Model Construction

3.1. Study Area

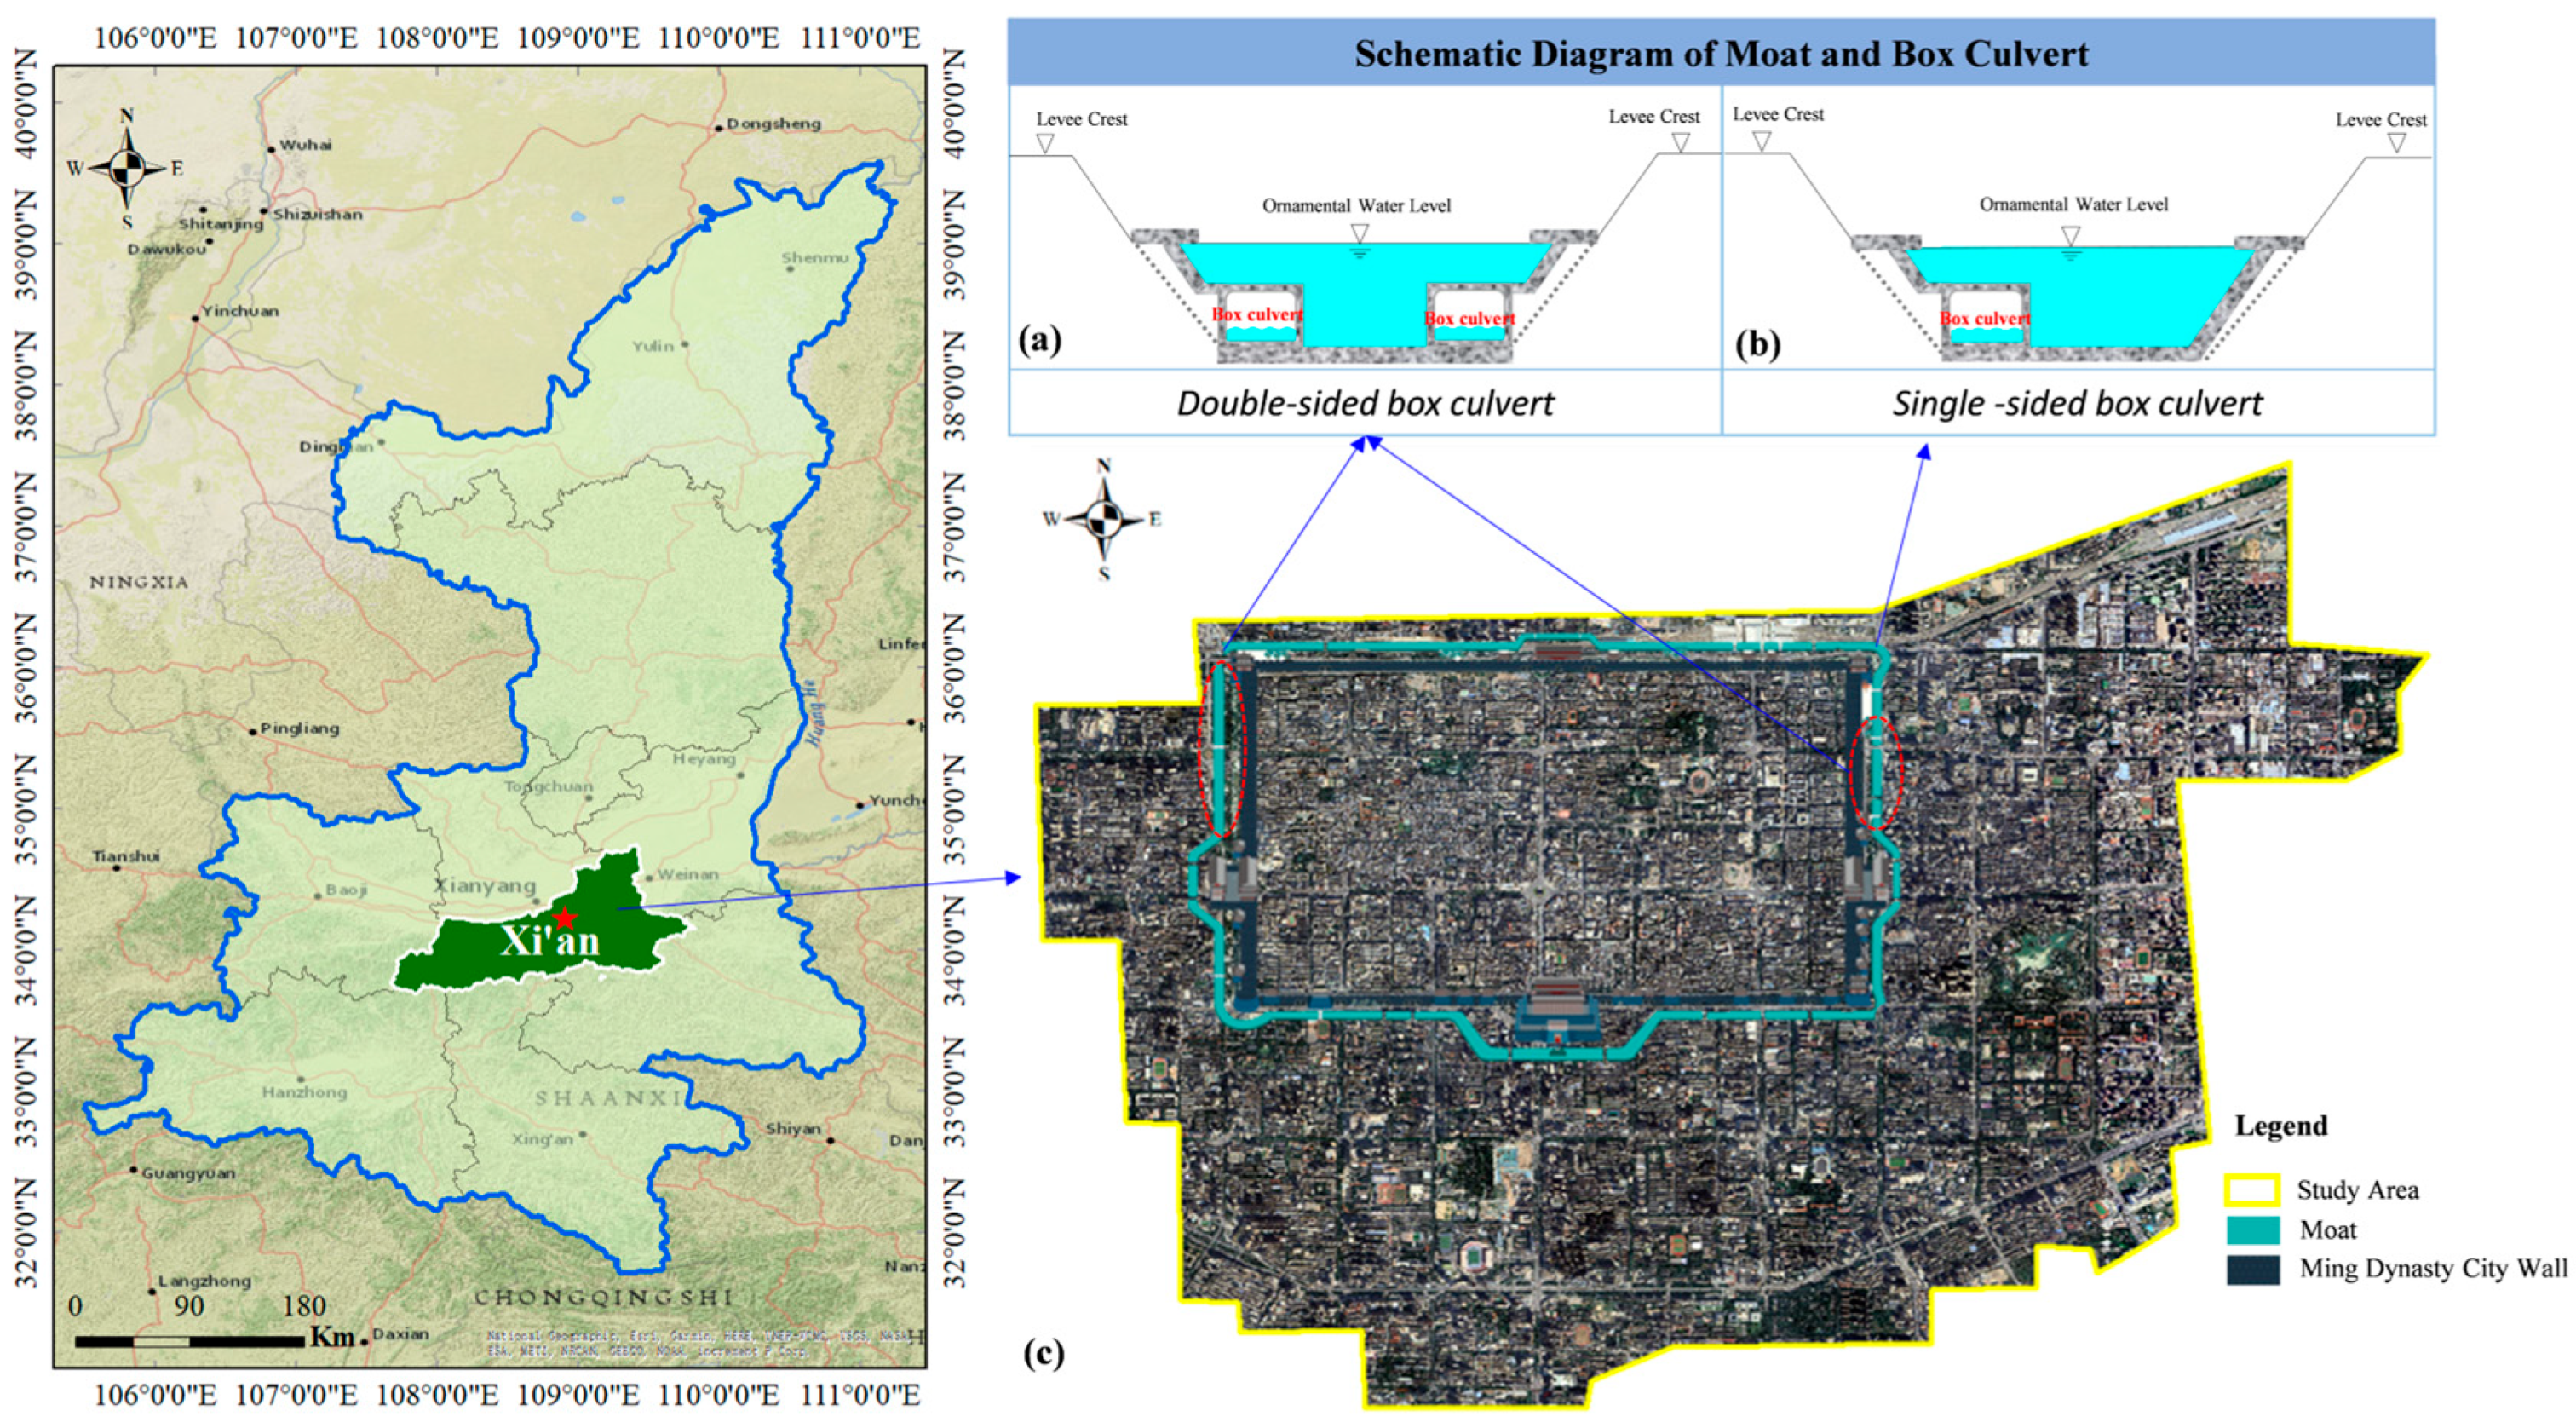
Xi’an, one of China’s first designated historical and cultural cities, is a key central city in the western region. It is situated in the Guanzhong Basin in the middle reaches of the Weihe River Basin, with an average annual precipitation of 621 mm and an average annual temperature of 13.4 °C, between 107.40°–109.49° E and 33.42°–34.45° N [37]. This study focuses on the drainage catchment of the Xi’an Moat, with a total catchment area of 34.27 km2. The urban drainage system was designed based on a 3-year return period storm. The location map is shown in Figure 2.
The moat, encircling the Ming Dynasty city wall, is an artificial channel constructed during the Ming Dynasty in 1370 AD. It has a total flood storage capacity of 14.47 × 10⁴ m3 and a landscape water storage capacity of approximately 12.75 × 10⁴ m3. The channel has a perimeter of 14.6 km and a trapezoidal cross-section, with a top width ranging from 14.5 m to 54.0 m, a bottom width from 7.0 m to 24.6 m, and a depth from 4.0 m to 15.5 m. The channel slopes from higher elevations in the southeast to lower elevations in the northwest, with a bottom elevation difference of 11.3 m. The outer bank exhibits significant topographic variation, with a height difference of up to 21.6 m. As a regulating reservoir, the moat receives stormwater runoff from within the urban area and adjacent external areas. During flood seasons, it plays a critical role in stormwater drainage and temporary storage for an area of approximately 34.27 km2, significantly contributing to urban flood control in Xi’an.
Reinforced concrete box culverts are installed along one or both sides (inner and outer banks) of the moat bed (see Figure 2a,b). During non-flood seasons, stormwater is discharged directly through the box culverts into the outlet pipe downstream of the drainage outfall. During flood events, the limited drainage capacity of the box culverts and outlets causes stormwater to overflow into the moat through the culverts. The floodwater is temporarily stored in the moat and is then discharged through the sluice gate at the northwestern corner of the moat.

3.2. Model Construction

3.2.1. Surface Runoff Model Construction

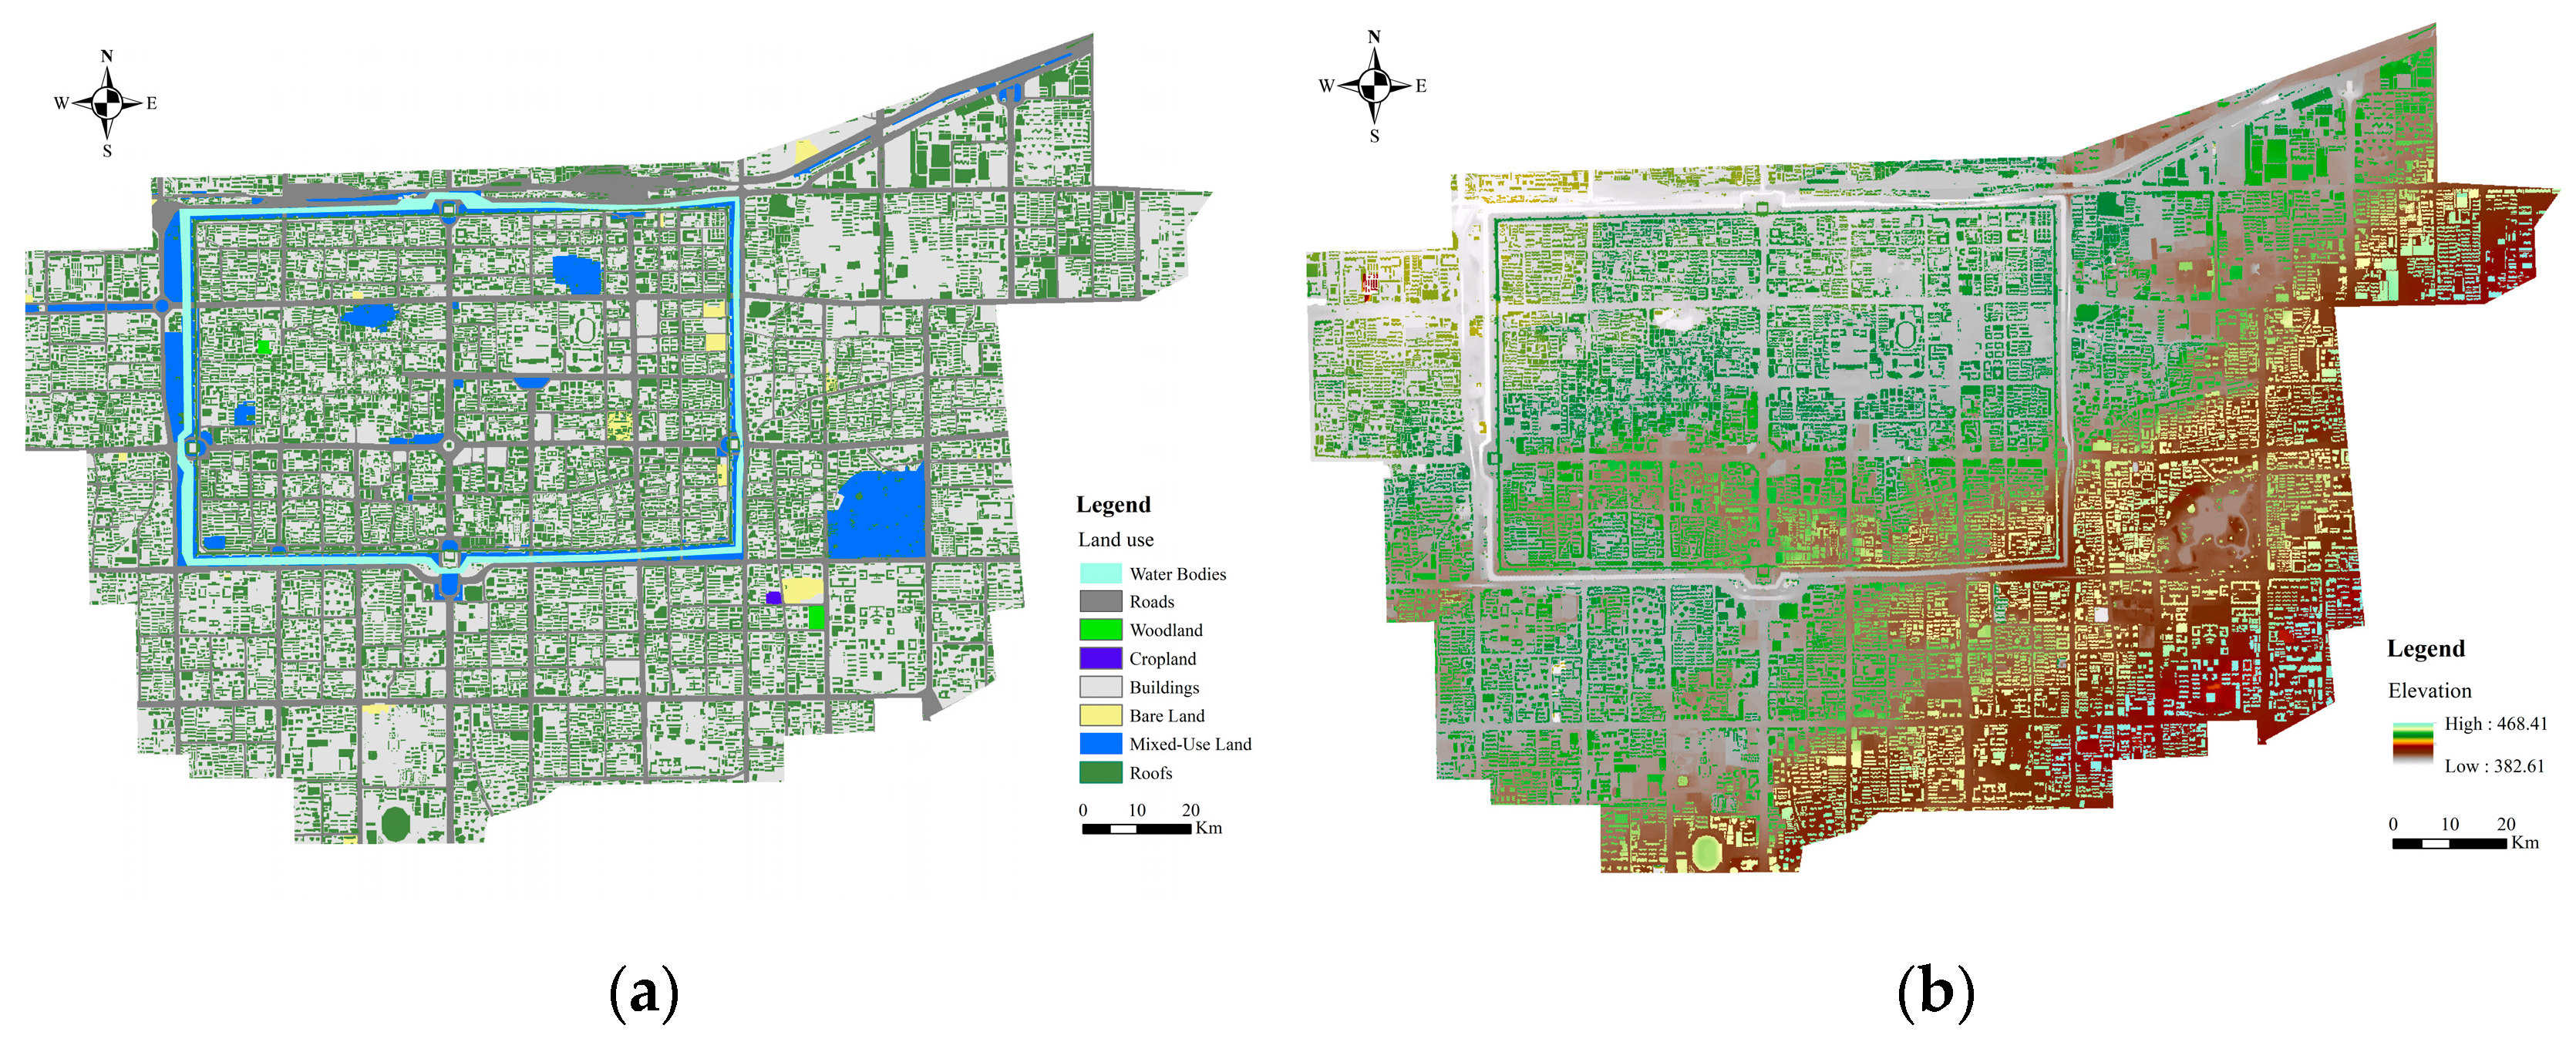
A surface runoff and river network routing model for the drainage sub-catchments of the Xi’an Moat was developed based on the GAST model. The underlying surface data, including land use and high-resolution digital elevation model (DEM) data, were provided by the Xi’an Municipal Institute of Surveying and Mapping. The DEM has a spatial resolution of 5 m (Figure 3a), and land use is classified into eight categories (Figure 3b): water bodies, roads, woodland, cropland, buildings, bare land, mixed-use land, and roofs. The study area covers 34.27 km2, and the model is discretized into 2.444 million grids with a resolution of 5 m.
Regarding model parameterization, we first conducted preliminary parameter selection. Infiltration rates were primarily referenced from studies in regions with similar conditions [38], while Manning’s coefficients were determined mainly based on urban drainage design standards and relevant literature [39,40]. Subsequently, a trial-and-error calibration approach was employed, adjusting key parameters according to the simulation outcomes and observed data to ensure that the model could reasonably reproduce surface runoff and sewer network hydraulic behavior. The final calibrated parameters are listed in Table 1.

3.2.2. Drainage Network Routing Model Construction

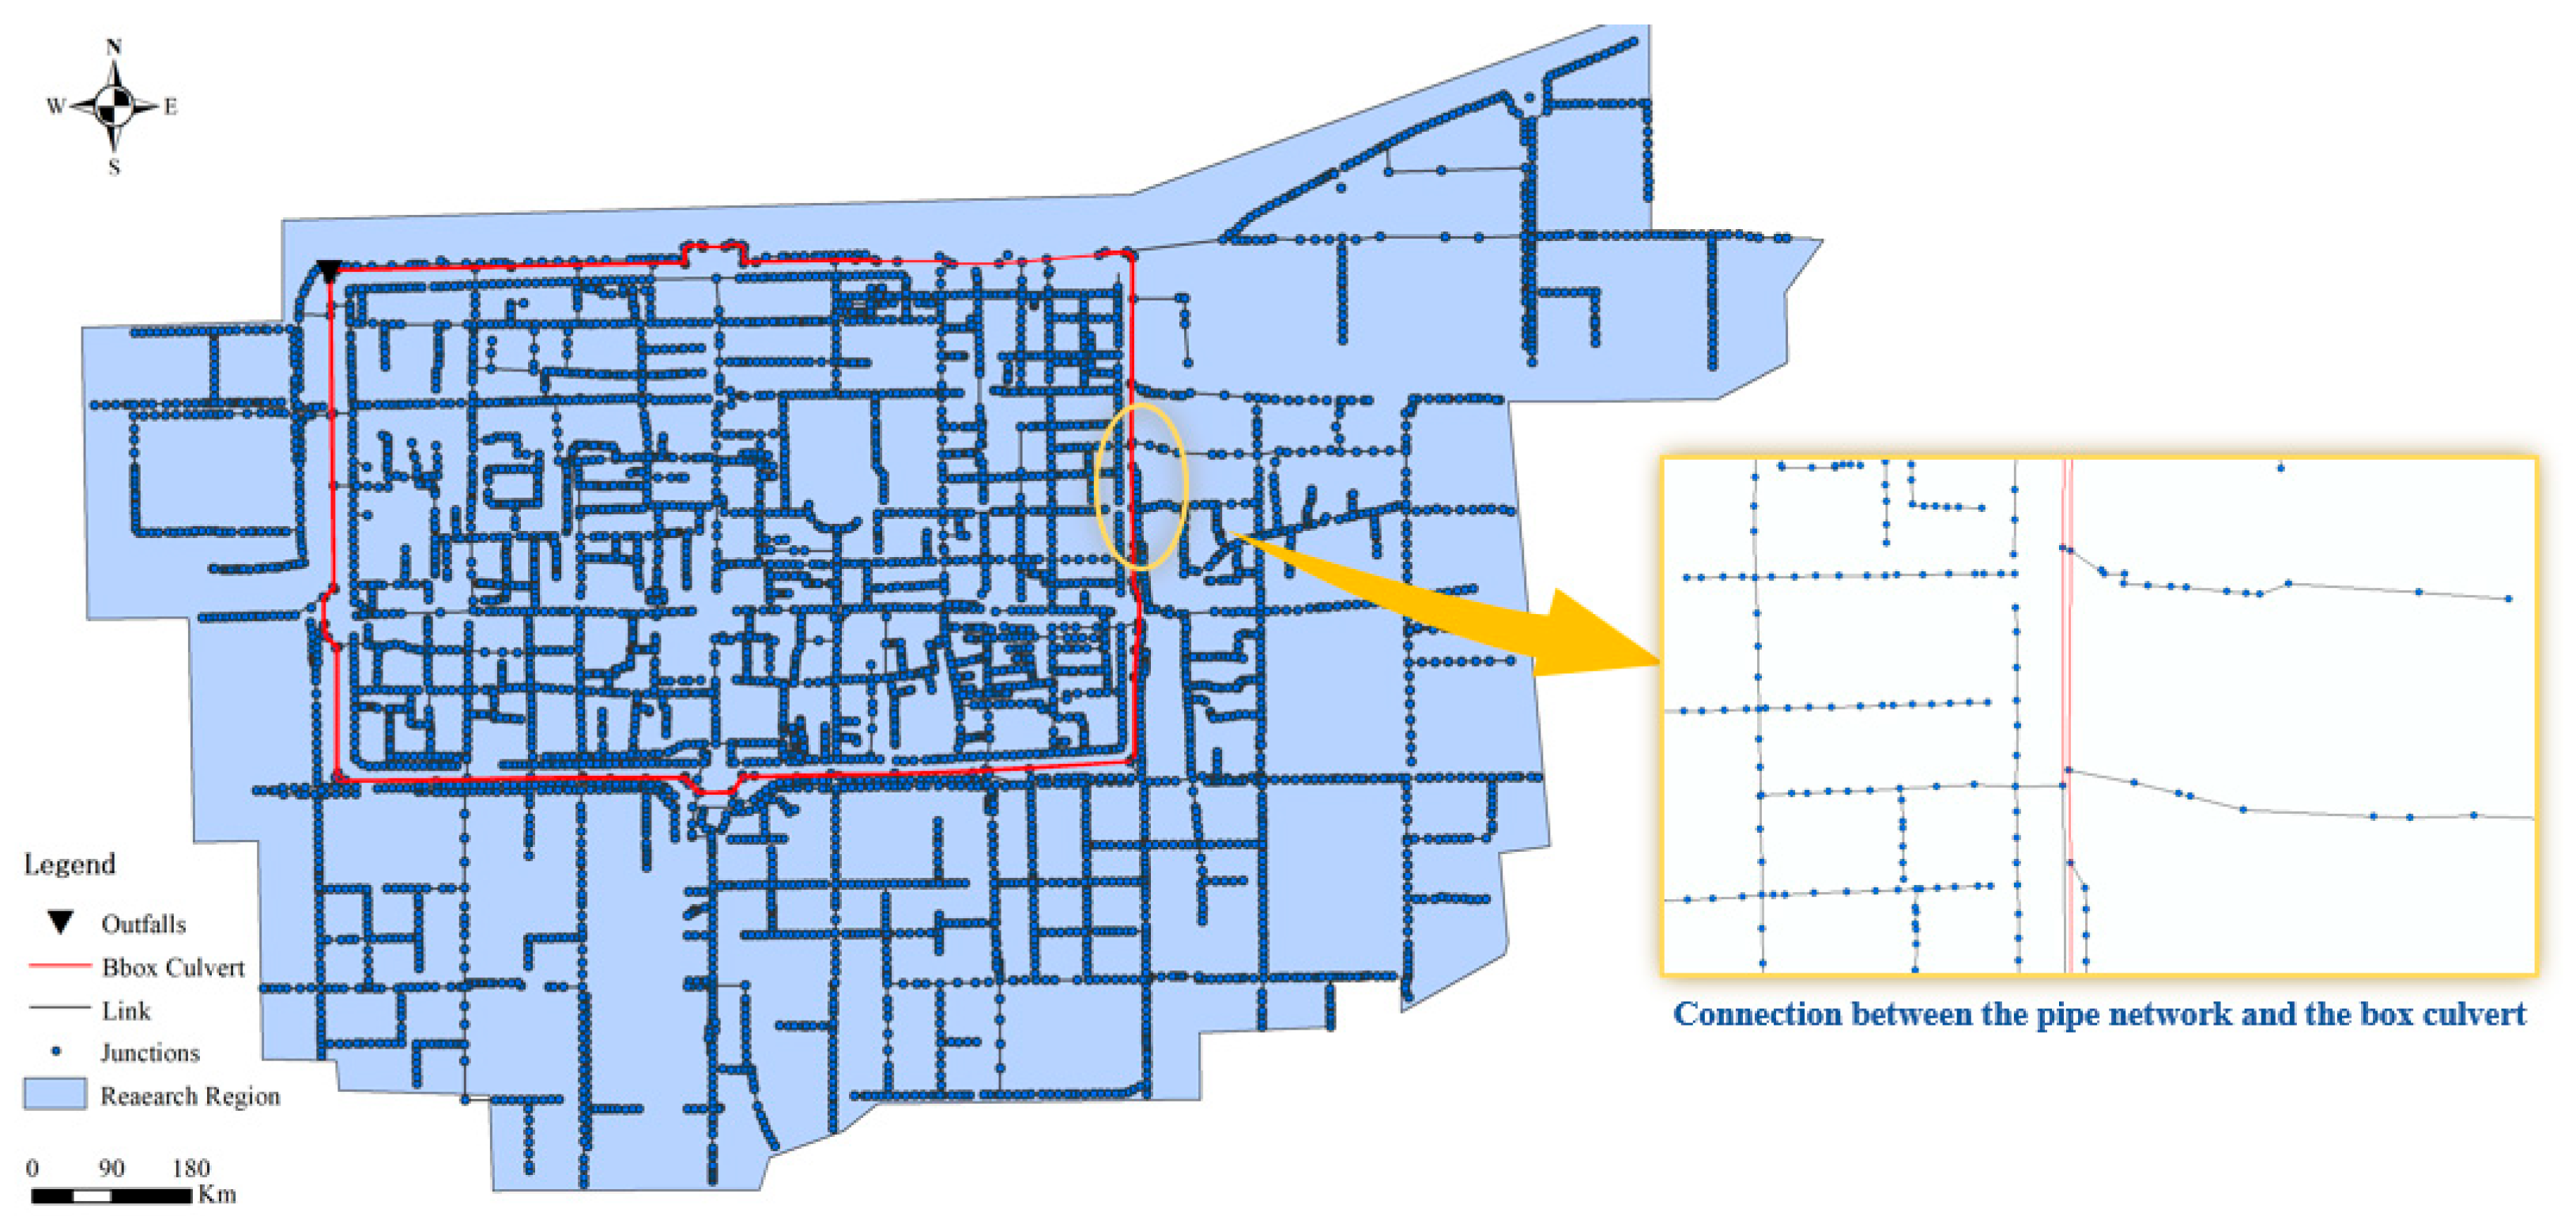
An urban underground drainage network model was constructed based on SWMM, with pipe network data provided by the Xi’an Municipal Institute of Surveying and Mapping. The model consists of 5569 nodes, one outlet, and 5570 conduits, including 5452 circular pipes and 118 rectangular box culverts. Stormwater outside the moat is conveyed through the drainage system into the outer box culverts at 27 junctions, while stormwater inside the moat is discharged into the inner box culverts at 18 junctions. The layout of the drainage network is shown in Figure 4. Both circular pipes and box culverts are made of reinforced concrete.
For the parameterization of the sewer pipes’ Manning’s coefficient, an initial value was first selected based on relevant literature [41]. Subsequently, a trial-and-error calibration was conducted, adjusting key parameters according to the simulation results and observed data to ensure that the model could reasonably reproduce the hydraulic behavior of the sewer network. The final calibrated Manning’s coefficient was set to 0.012, which not only falls within the recommended range in the literature but also achieves a good balance between physical realism and modeling accuracy.

3.2.3. 1D-2D Coupled Model Construction

The rainfall-runoff processes in the study area consist of four components: surface runoff, river network routing, drainage network routing, and box culvert routing. In the model construction, the river network and surface runoff processes are represented by a 2D model, whereas the drainage network and box culvert routing processes are represented by a 1D model. During model coupling, water exchange between the 1D and 2D domains is achieved through vertical coupling. Spatially, the drainage network is coupled with the surface, and the box culverts are coupled with the river network to enable water exchange, as illustrated in Figure 5. In the constructed coupled model, a total of 5555 coupling nodes were defined between the surface and the drainage network, and 115 coupling nodes were defined between the box culverts and the river network.

3.3. Model Validation

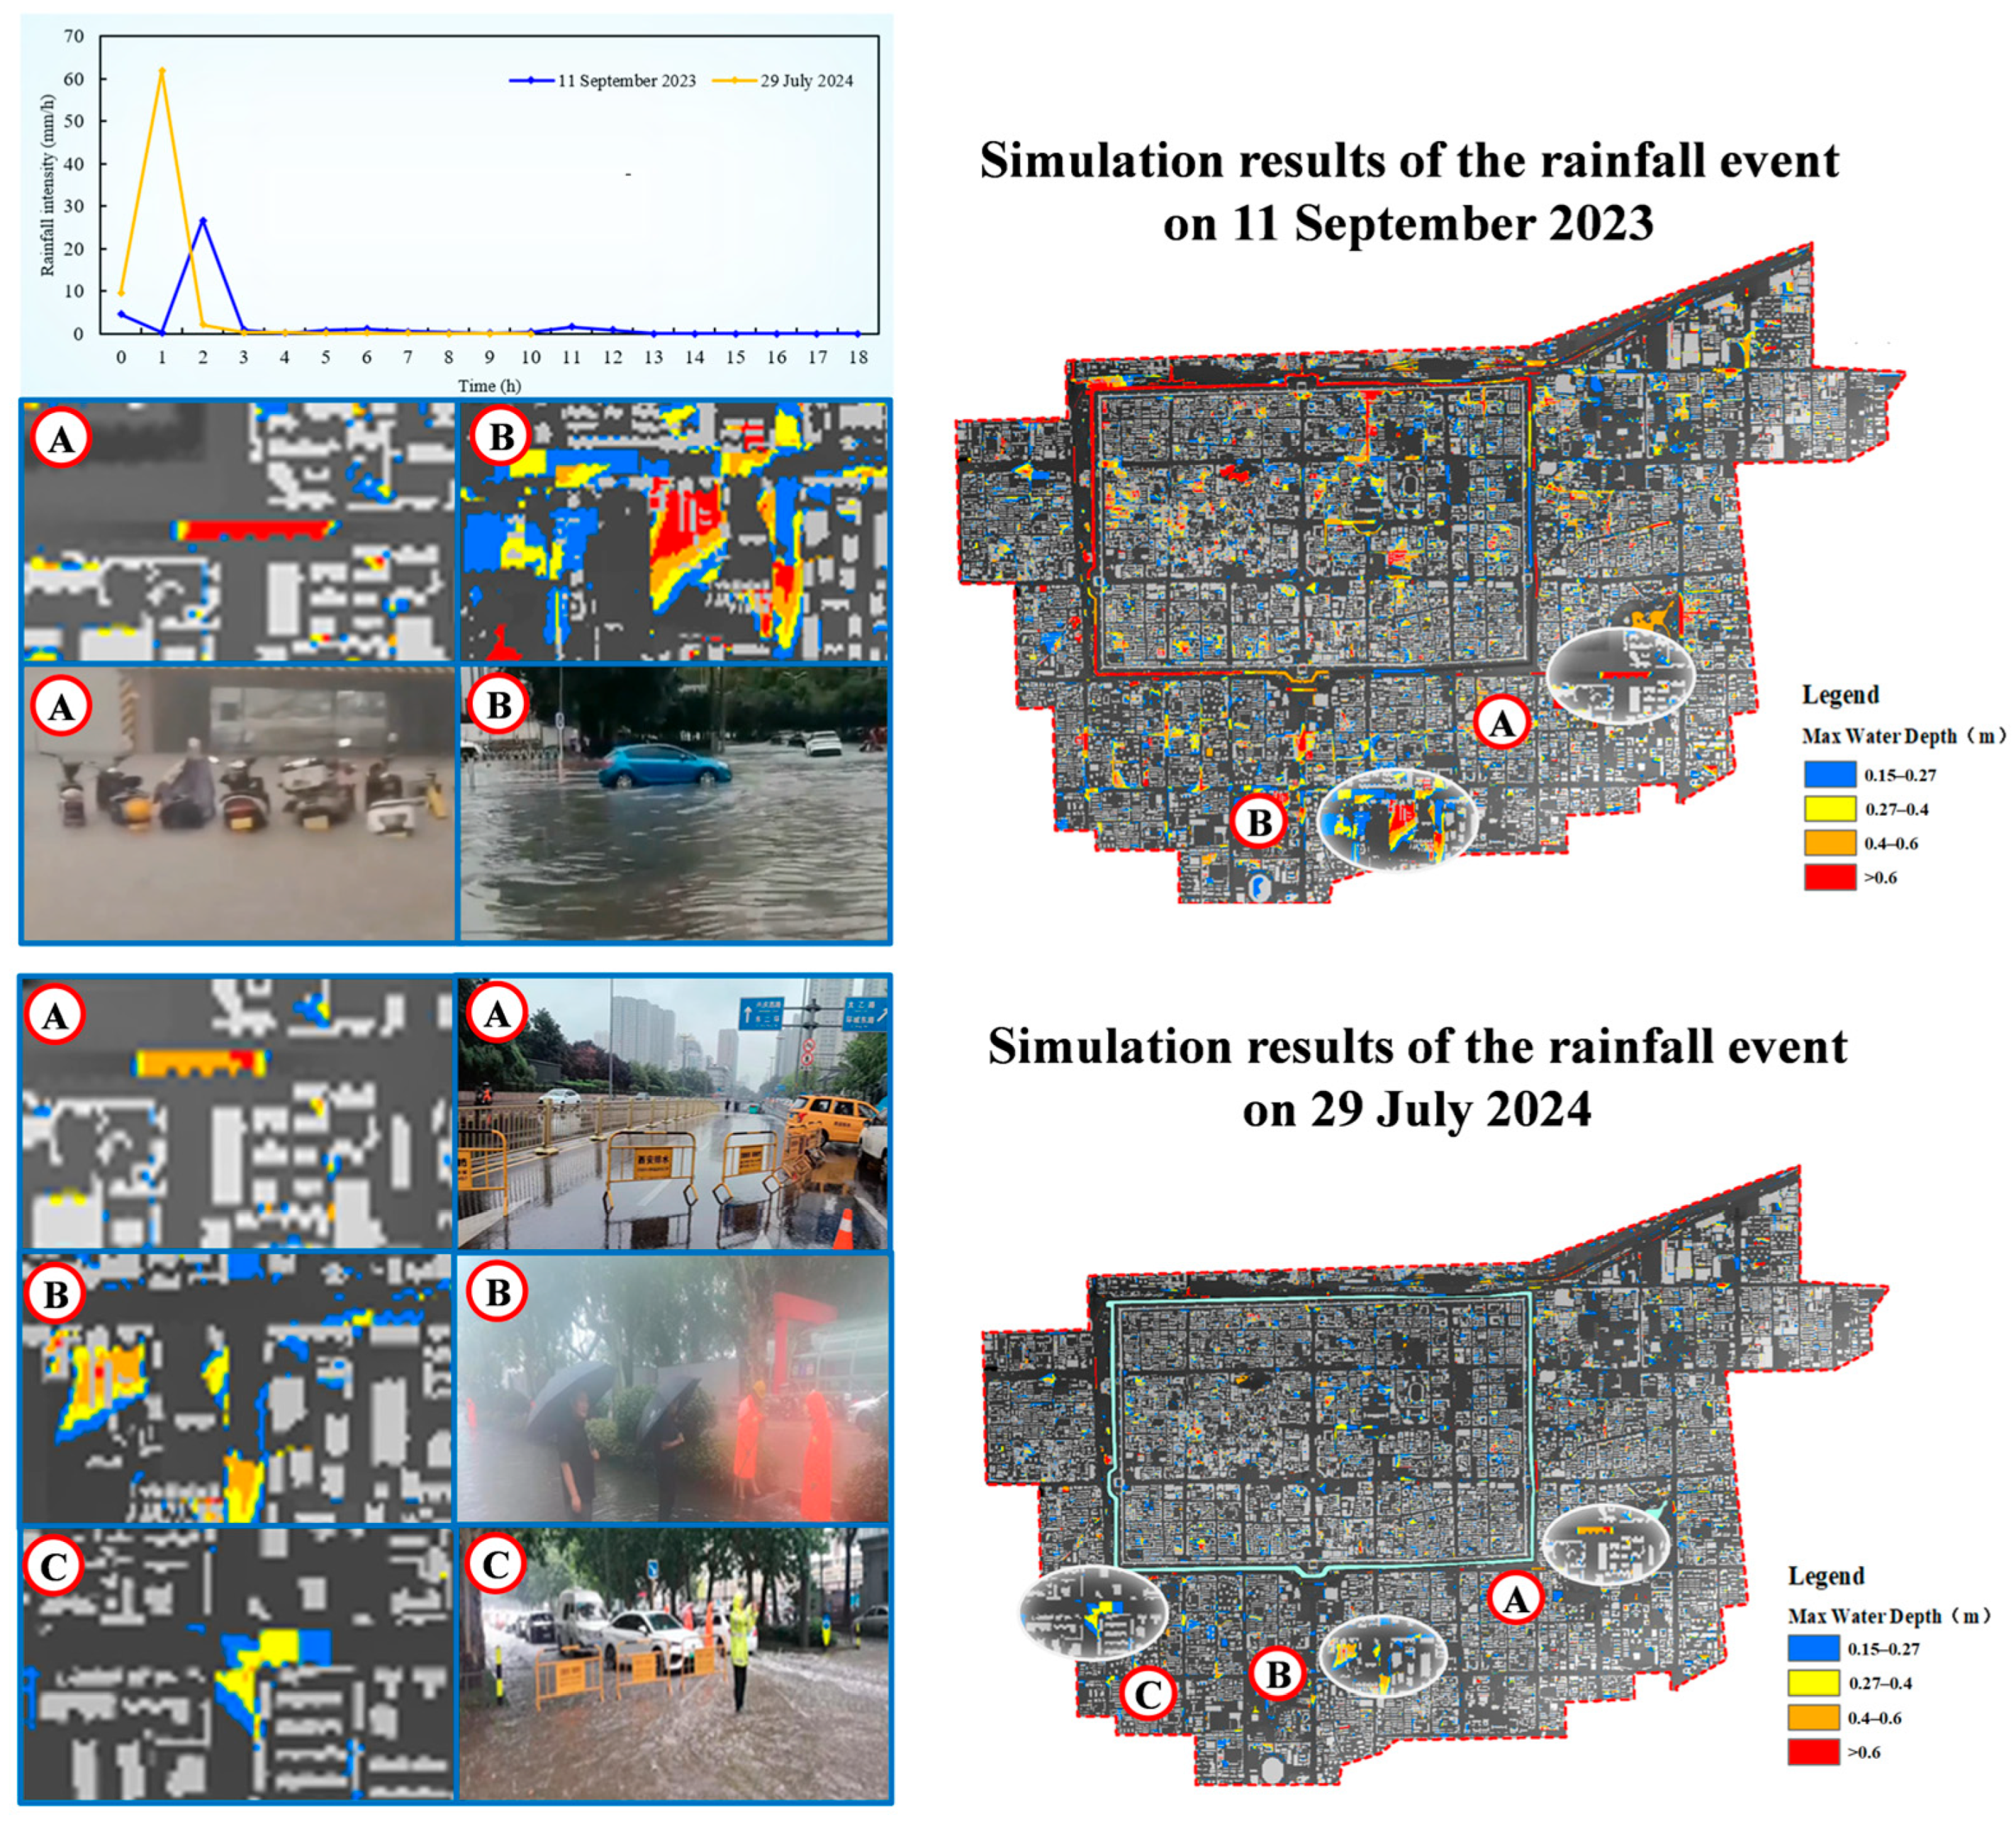
Rainfall events on 29 July 2024, and 11 September 2023, were selected to validate the coupled model by comparing simulated inundation locations with observed waterlogging points. On 29 July 2024, the total rainfall was 37.9 mm, with a duration of 19 h and a maximum rainfall intensity of 26.7 mm/h. On 11 September 2023, the total rainfall was 74.2 mm, with a duration of 10 h and a maximum rainfall intensity of 61.8 mm/h. The rainfall events and inundation locations are shown in Figure 6, and the simulated water depths compared with observations are summarized in Table 2. For the 11 September 2023 rainfall event, the average relative error between simulated and observed water depths was 4.7%, with a maximum relative error of 6.7%. For the 29 July 2024 event, the average relative error was 5.8%, with a maximum relative error of 10.0%. It can be observed that, for the rainfall events considered, the 1D–2D coupled model developed in this study can reliably simulate rainfall–runoff and inundation processes. The simulated inundation locations closely match the observed waterlogging points, and the relative errors in water depth are all within 10.0%, indicating that the model is capable of effectively reproducing urban rainfall and flood processes.

3.4. Rainfall Scenario Design

This research used a design rainstorm formula from the local rainfall intensity frequency (IDF) curve, and the Chicago rainfall model is used to generate the rainfall pattern.
q = 2210.84 × 1 + 2.915 × l g P t + 21.933 0.974
where q is the designed storm intensity, L/(s·hm2); P represents the designed return period, year; and t indicates the storm duration, minutes.
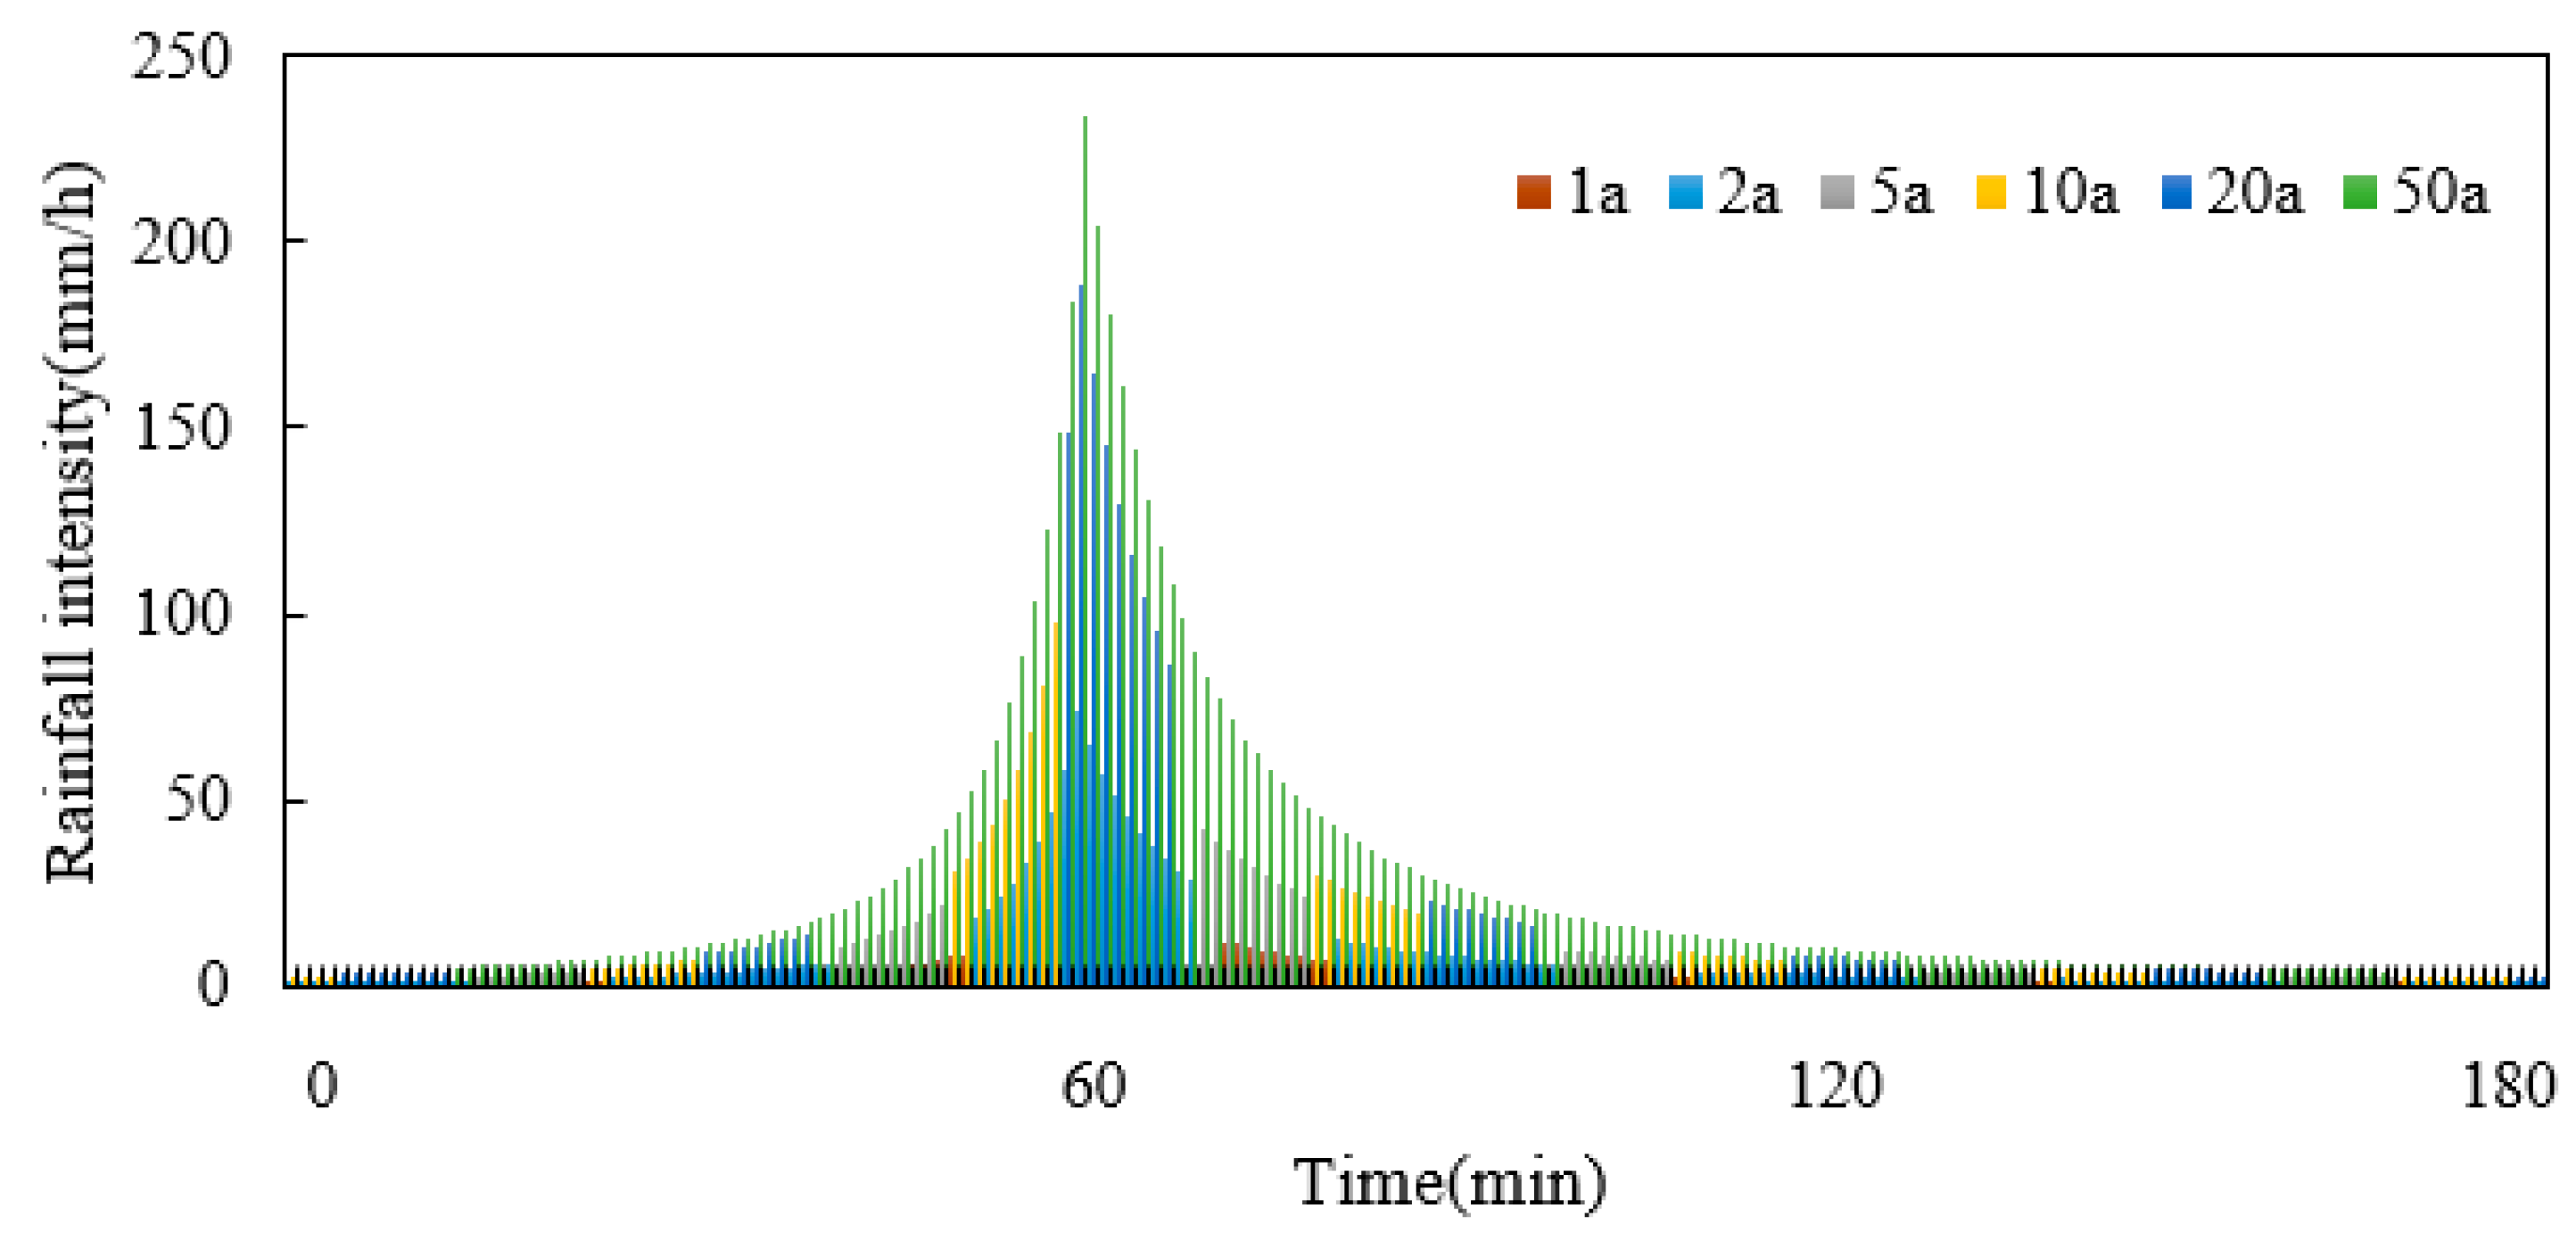
Rainfall events with 1-, 2-, 5-, 10-, 20-, and 50-year return periods and a duration of 3 h were designed, and the corresponding hyetographs are shown in Figure 7. The total rainfall depths corresponding to the 1-, 2-, 5-, 10-, 20-, and 50-year return periods (with a duration of 3 h) are 13.57, 25.49, 41.24, 53.16, 65.07, and 80.82 mm, respectively. The associated peak rainfall intensities are 39.24, 73.68, 119.20, 153.64, 188.07 and 233.59 mm/h, respectively.

4. Results and Discussion

4.1. Detailed Simulation of Complex Drainage System

For the detailed simulation of rainfall-induced flooding in the Moat area, design rainfall events with 1-, 2-, 5-, 10-, 20-, and 50-year return periods and a duration of 3 h were employed. The rainfall–runoff and surface flow processes under these scenarios were simulated to evaluate the drainage capacity of the pipe network, node overflow conditions, and the spatiotemporal evolution of surface waterlogging.
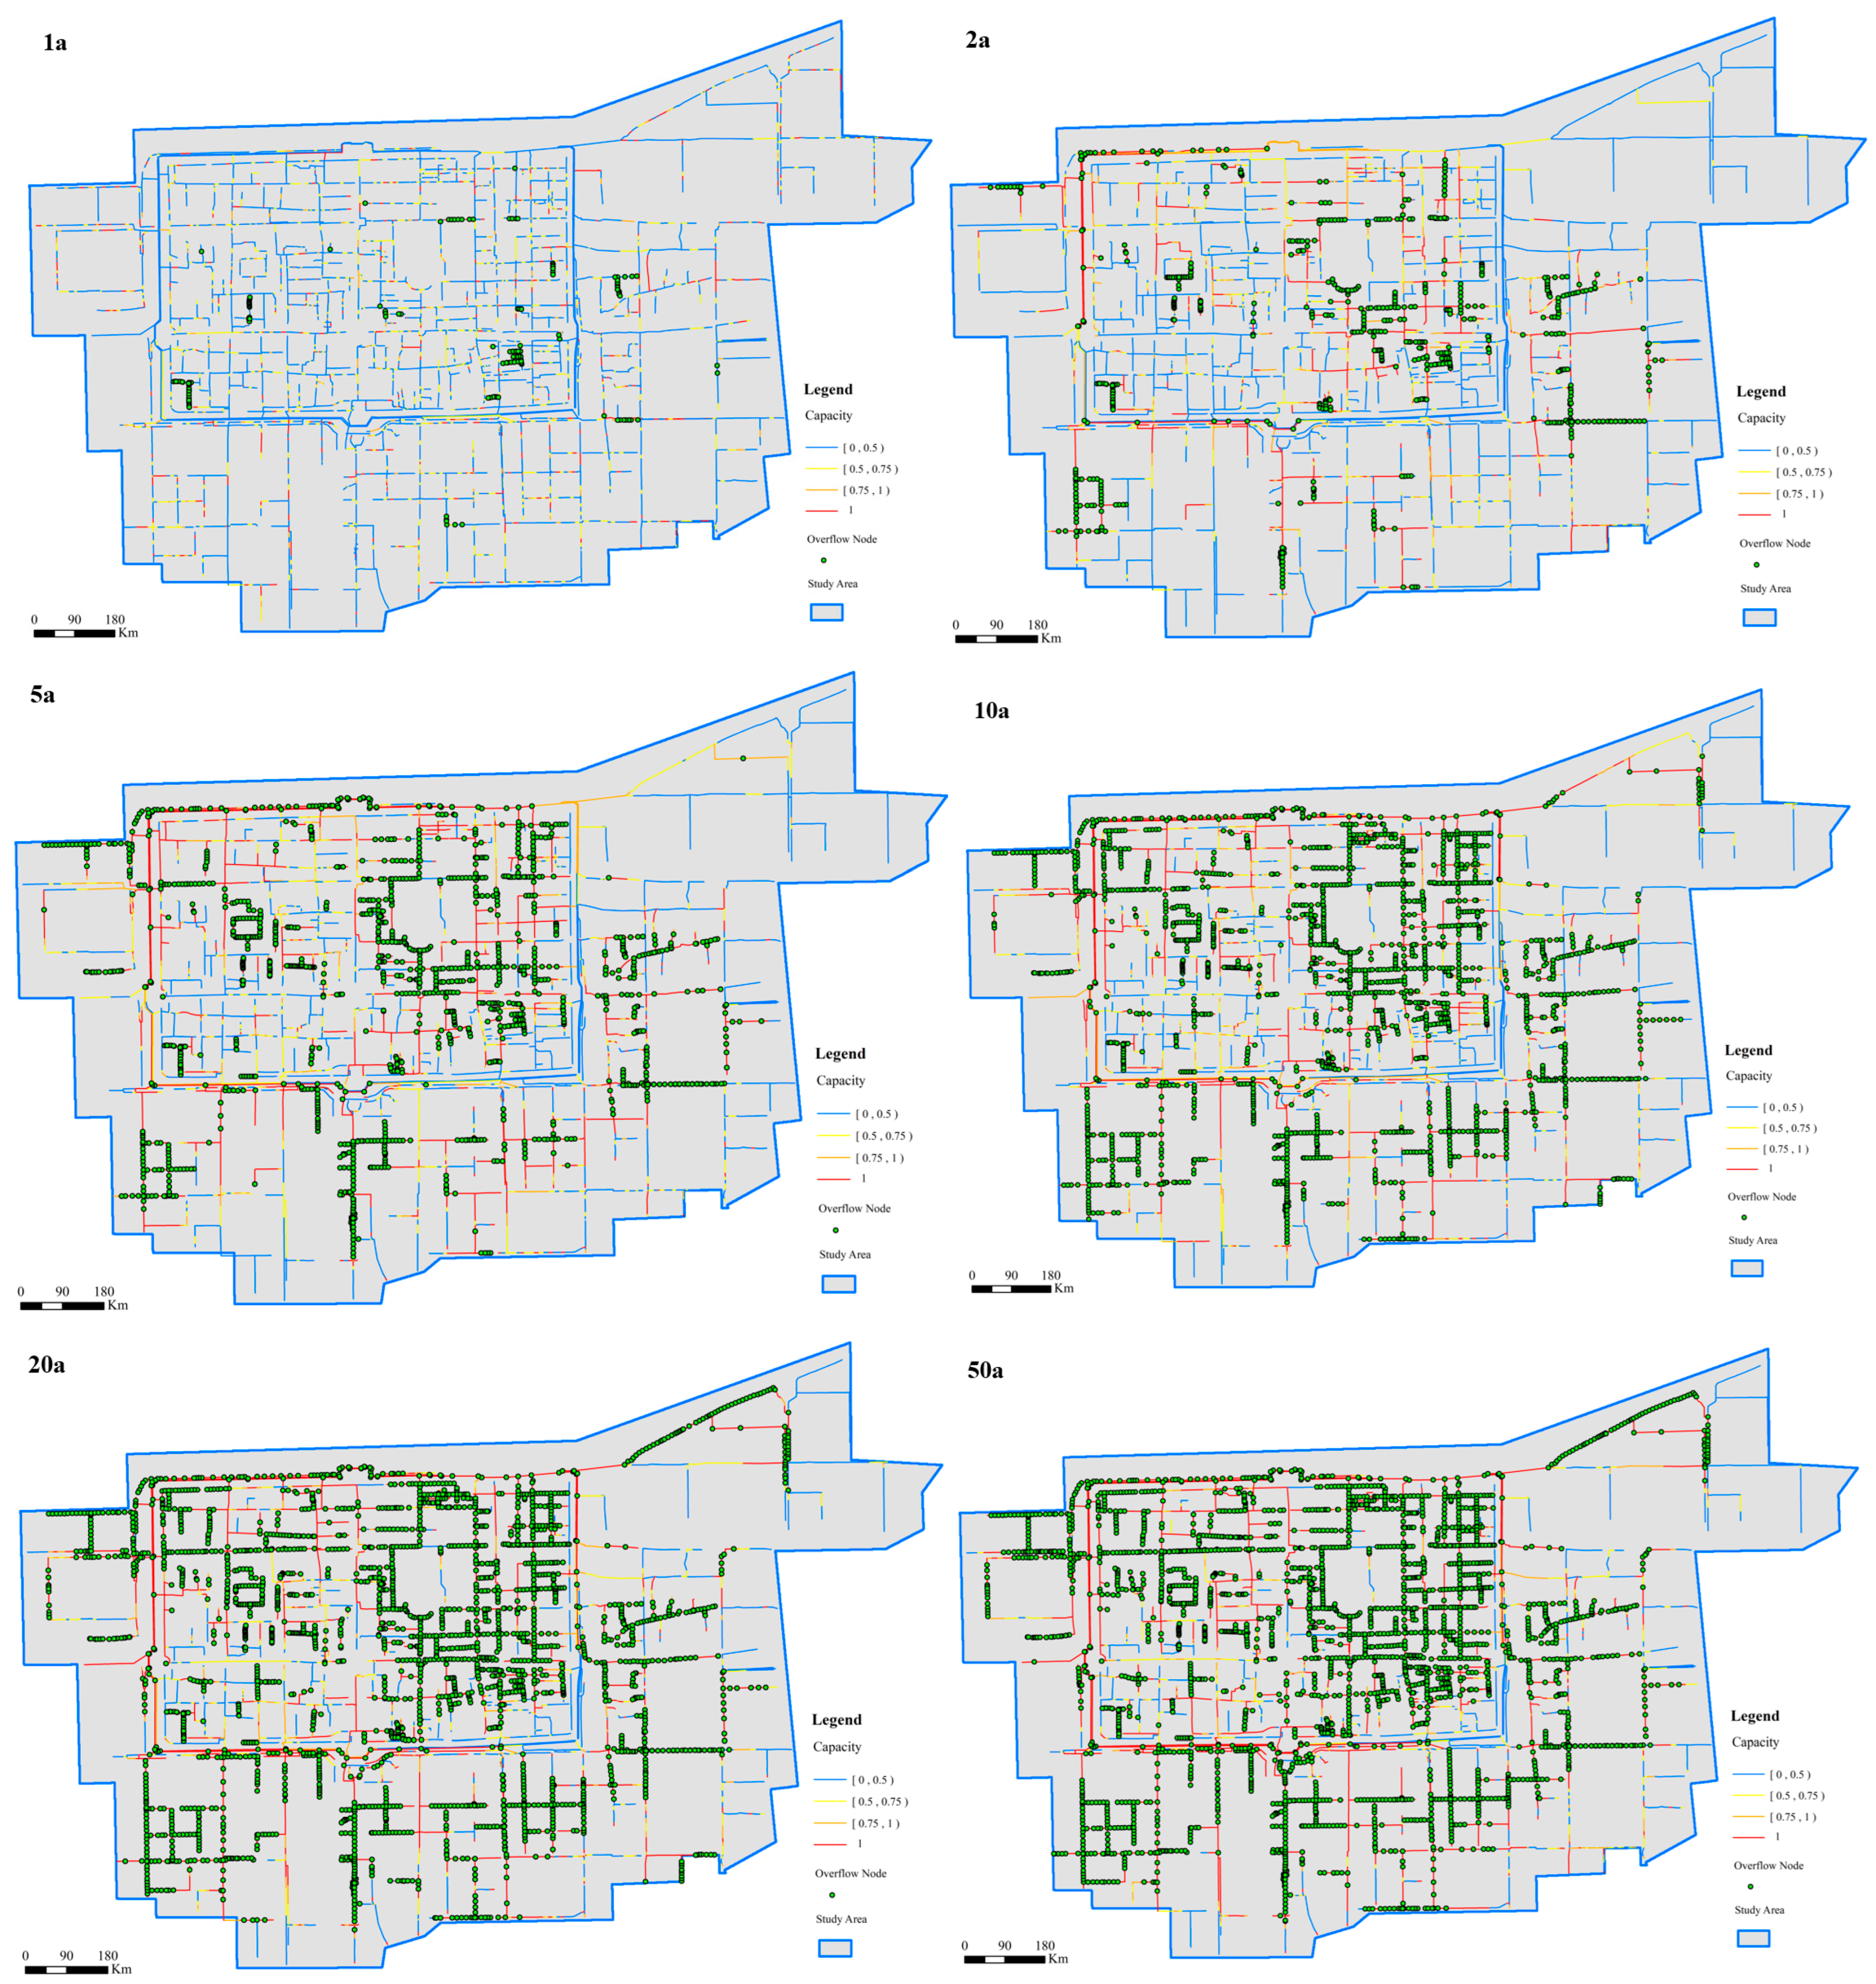
The drainage performance of the pipe network under different rainfall return periods is presented in Table 3. For the six design rainfall scenarios, the total drainage volumes in the study area were 14.99 × 10⁴, 24.69 × 10⁴, 28.41 × 10⁴, 30.47 × 10⁴, 31.72 × 10⁴, and 33.18 × 10⁴ m3, respectively. The proportions of pipes reaching full capacity (fill ratio = 1) increased with return period, being 8.85%, 27.49%, 47.48%, 57.25%, 65.31%, and 72.06%, respectively. Similarly, the percentages of nodes experiencing overflow were 4.38%, 19.11%, 38.46%, 51.39%, 60.12%, and 65.29%, with corresponding total overflow volumes of 0.57 × 10⁴, 9.95 × 10⁴, 28.16 × 10⁴, 58.66 × 10⁴, 86.35 × 10⁴, and 93.29 × 10⁴ m3. As shown in Figure 8, the spatial distribution of overflow nodes and fully loaded pipes varies significantly with rainfall return period. Under low return period events, most pipes have fill ratios below 0.5, and only a few nodes experience overflow, primarily concentrated in areas where the drainage system is heavily loaded, which reach the overflow threshold first. As the return period increases, the number of fully loaded pipes rises, overflow becomes more widespread, and total overflow volumes increase substantially.
The results indicate that both the number and proportion of overloaded pipes and overflow nodes increase continuously with the rainfall return period. Under the 1-year return period rainfall, the proportions of overloaded pipes and overflowing nodes are 8.8% and 4%, respectively, indicating that the system operates in a generally good condition. However, starting from the 2-year return period, the proportions of overloaded pipes and overflowing nodes increase significantly, reaching 27% and 19%, respectively. In this study, a 3 h design rainfall event was used for the simulations, whereas the drainage network is typically designed based on 24 h rainfall. Due to the shorter duration, the simulated rainfall has a relatively higher peak intensity, so even 1–2-year return period events may cause full-pipe flow or local overflows in the simulation. Therefore, for the same rainfall return period, different rainfall durations can result in substantially different hydraulic loads on the drainage network.
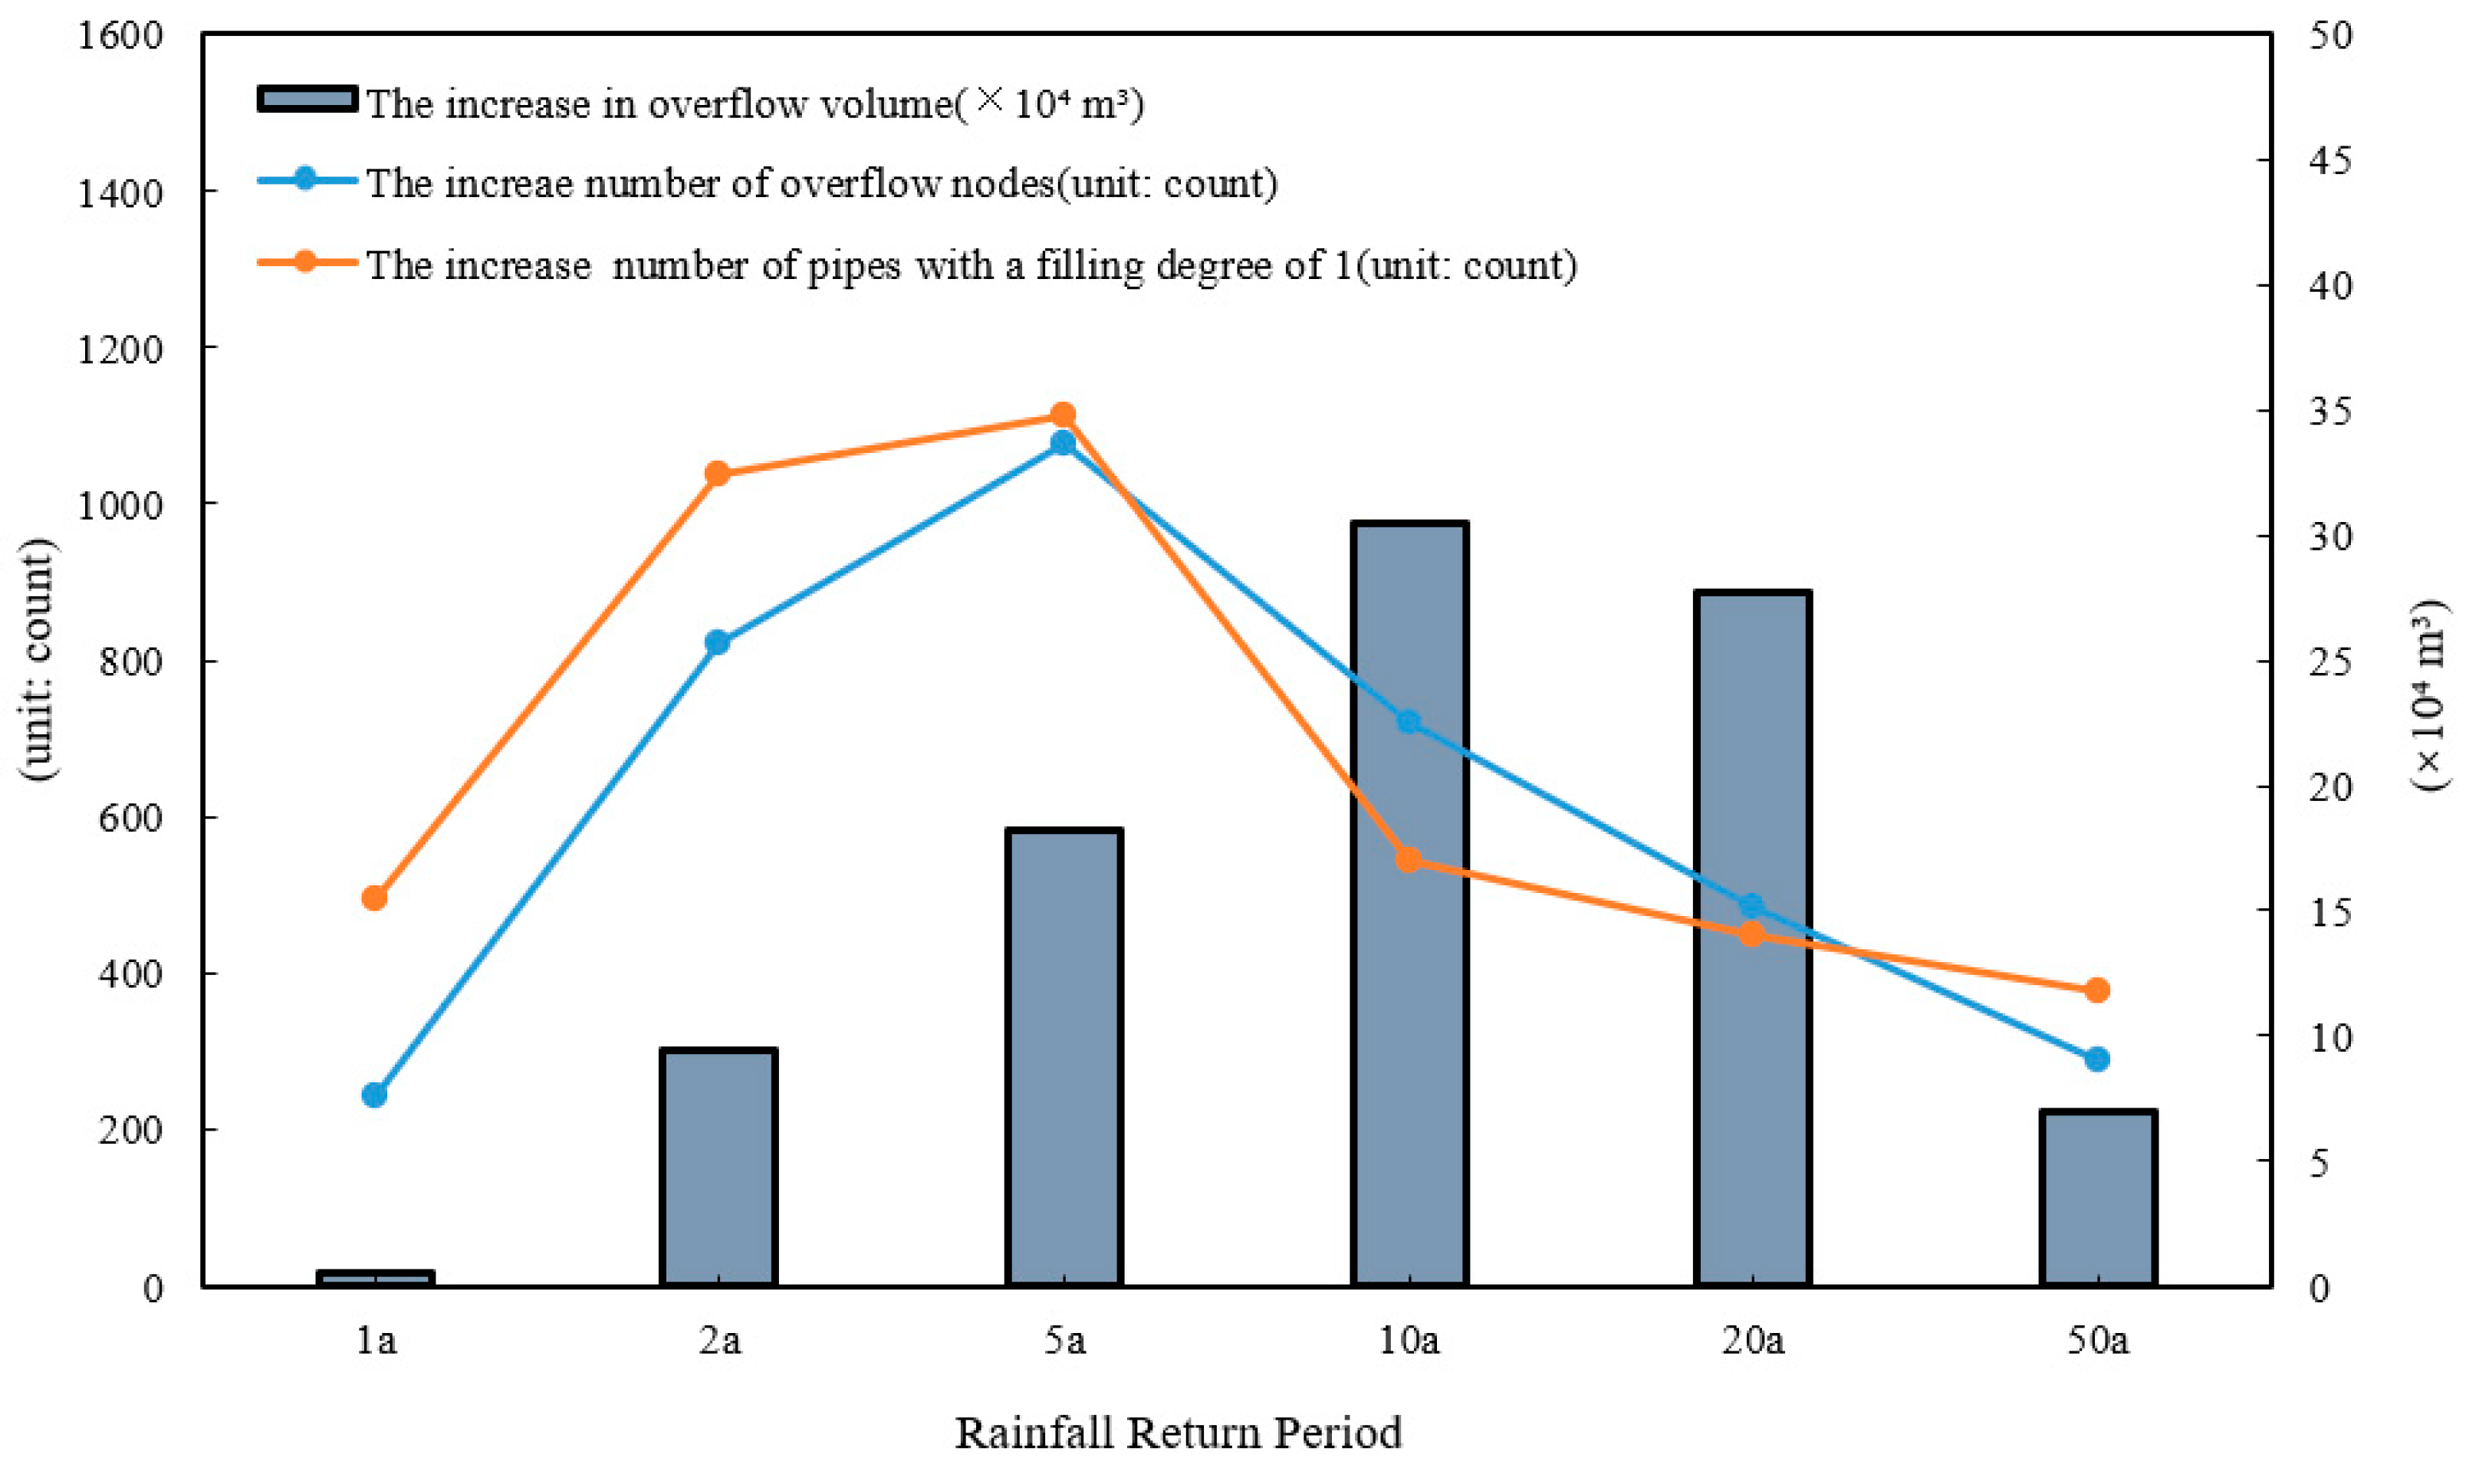
Under the 50-year return period, more than two-thirds of the pipes are at full capacity, and a similar proportion of nodes experience overflow. The trends of node overflow and pipe overloading under different return periods are illustrated in Figure 9. A noticeable inflection point is observed between the 2- and 50-year return periods, which can be considered as the critical resilience threshold of the drainage system. Rainfall events below this threshold can be effectively managed, and the risk of urban flooding remains controllable. Once the rainfall exceeds this threshold, the system quickly approaches saturation, the drainage capacity reaches its limit, and extensive severe flooding is likely to occur.
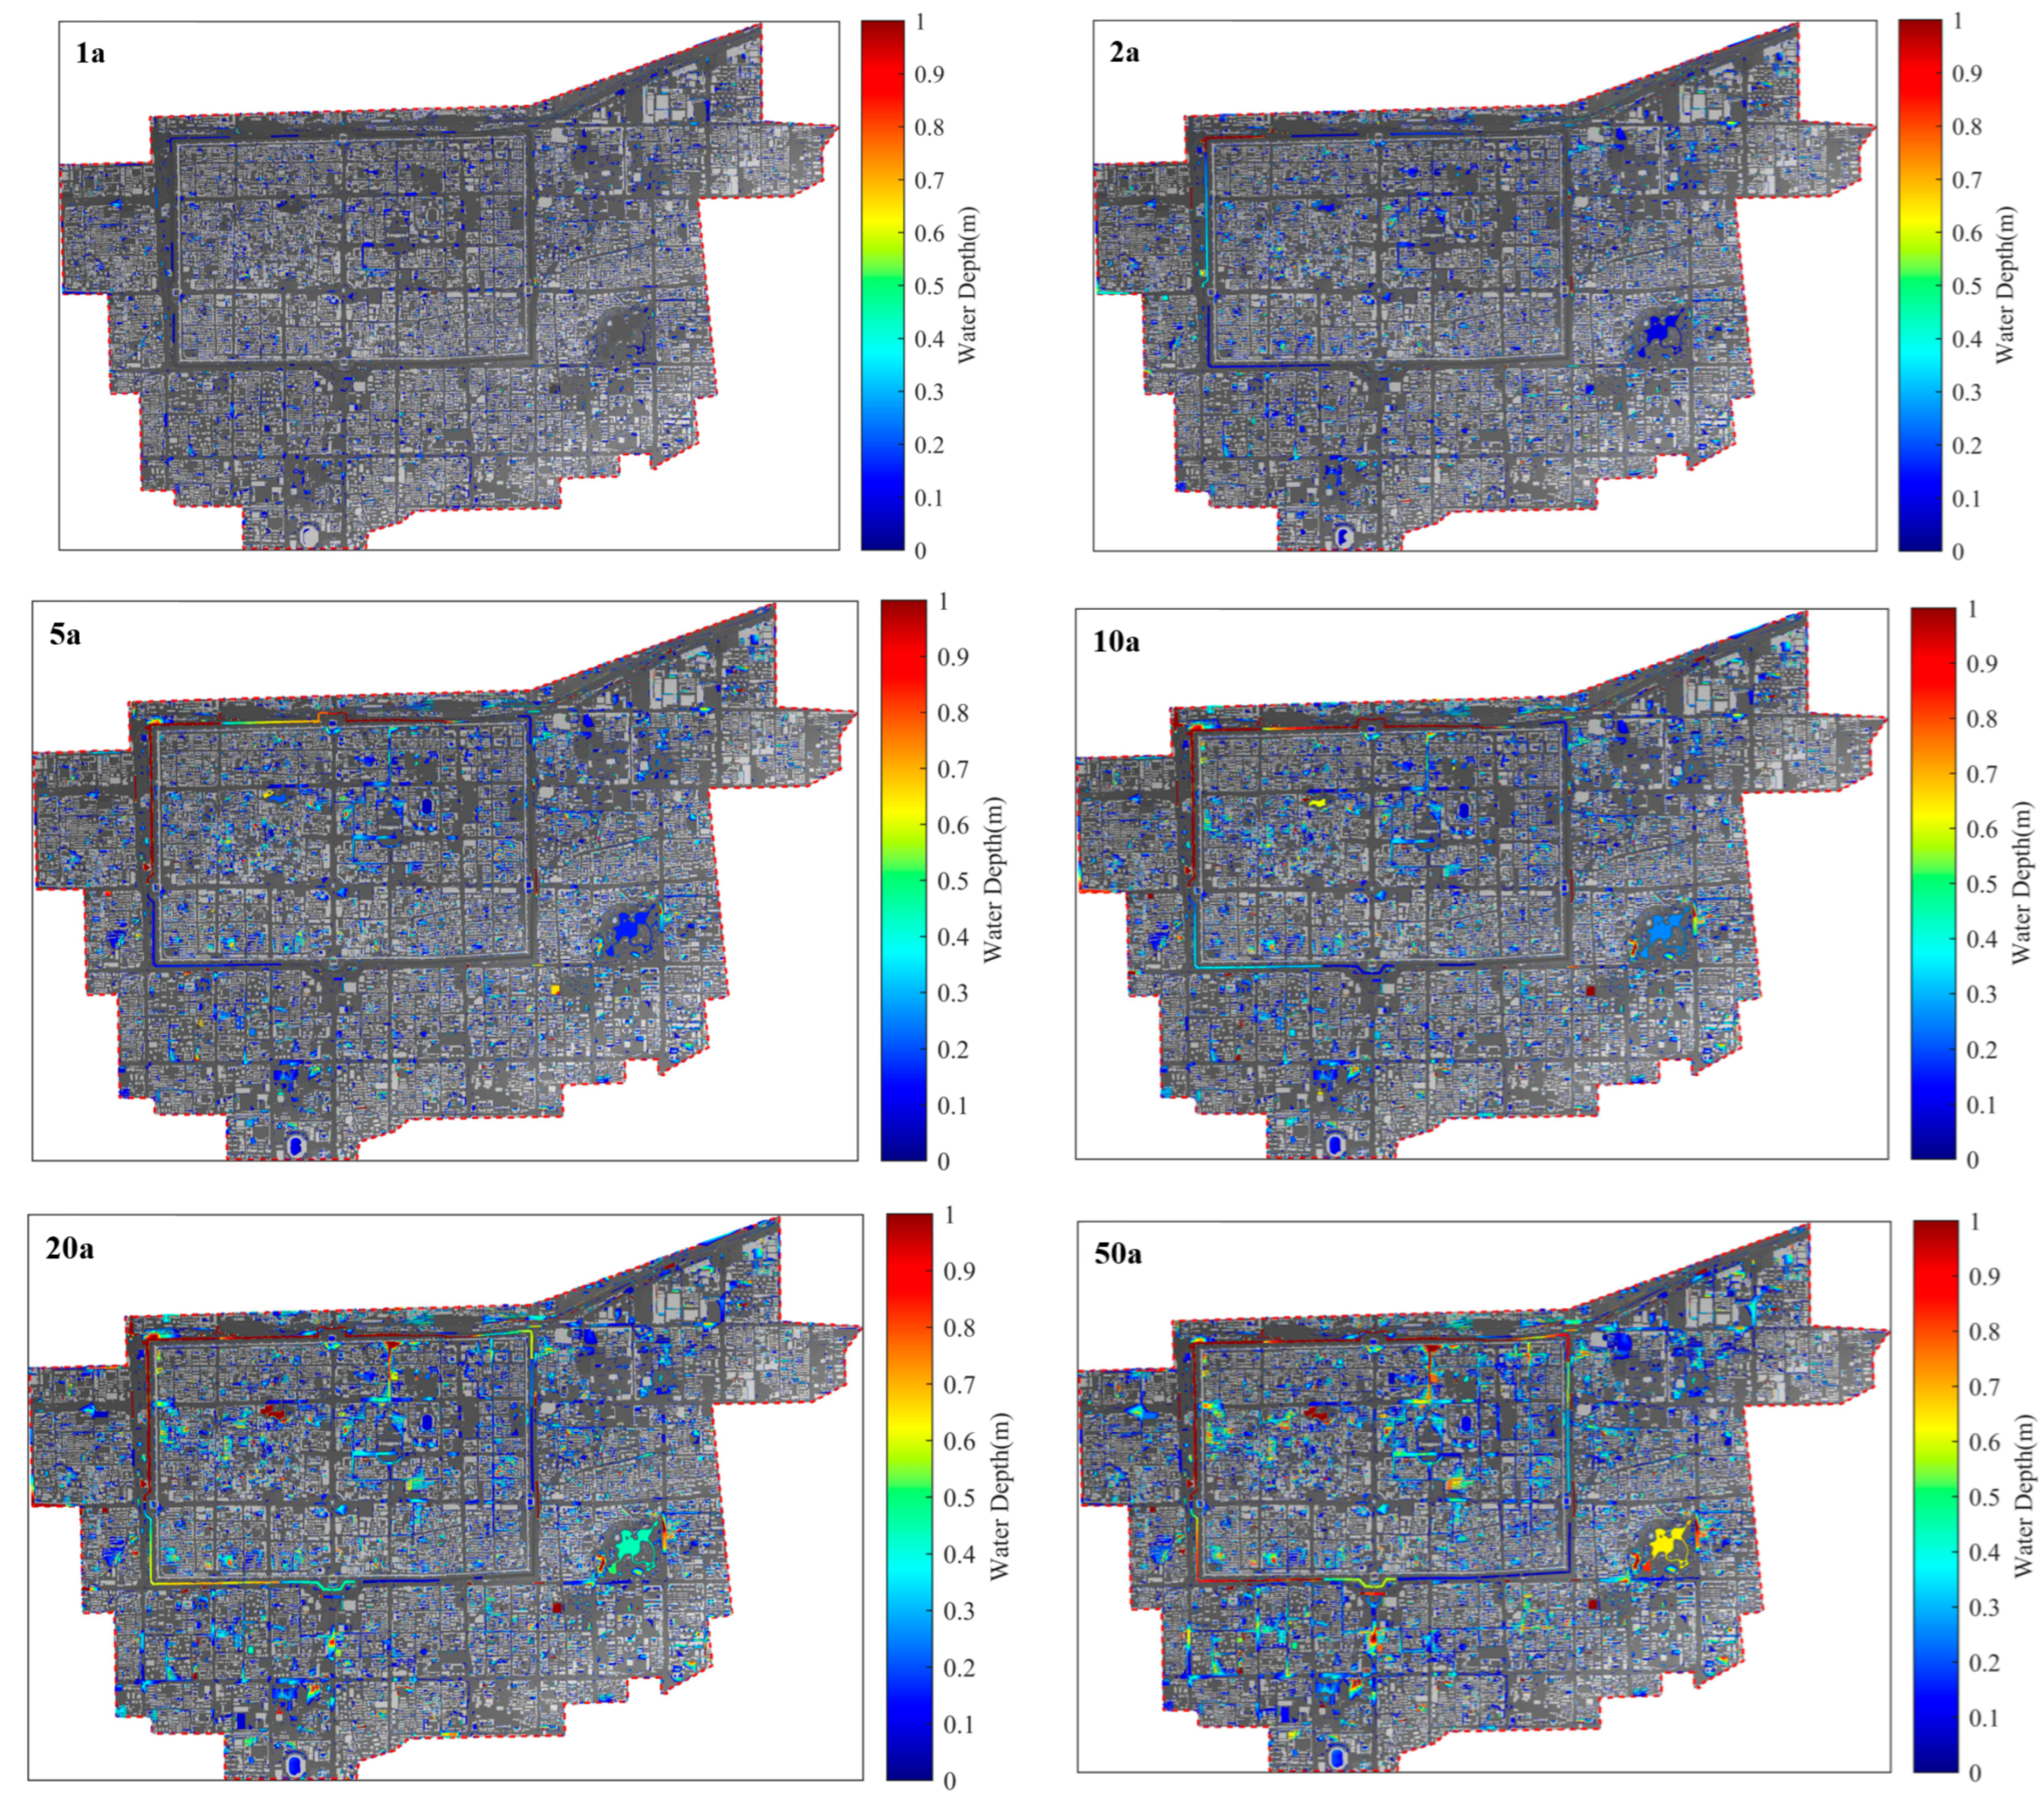
According to statistics, the maximum surface water ponding areas under different rainfall return periods are 1.23 × 10⁴, 7.50 × 10⁴, 26.54 × 10⁴, 33.29 × 10⁴, and 47.02 × 10⁴ m3, respectively. The surface flooding conditions are shown in Figure 10. Under the 1a return period, only slight ponding occurs in some areas. Starting from the 2-year return period, the flooded area increases significantly, which is consistent with the conclusions from the pipe network drainage capacity analysis.
Under different rainfall return periods, the spatial distribution of surface flooding points remains relatively consistent, mainly concentrated in low-lying urban areas, along roads, and around transportation hubs. A comparison between Figure 8 (pipe fill ratios) and Figure 10 (flood map) shows that the spatial extent of surface flooding closely corresponds to the locations of overflowing nodes in the pipe network, further confirming the close relationship between surface ponding and the performance of the drainage system.

4.2. Flood Storage Capacity Analysis of Box Culverts

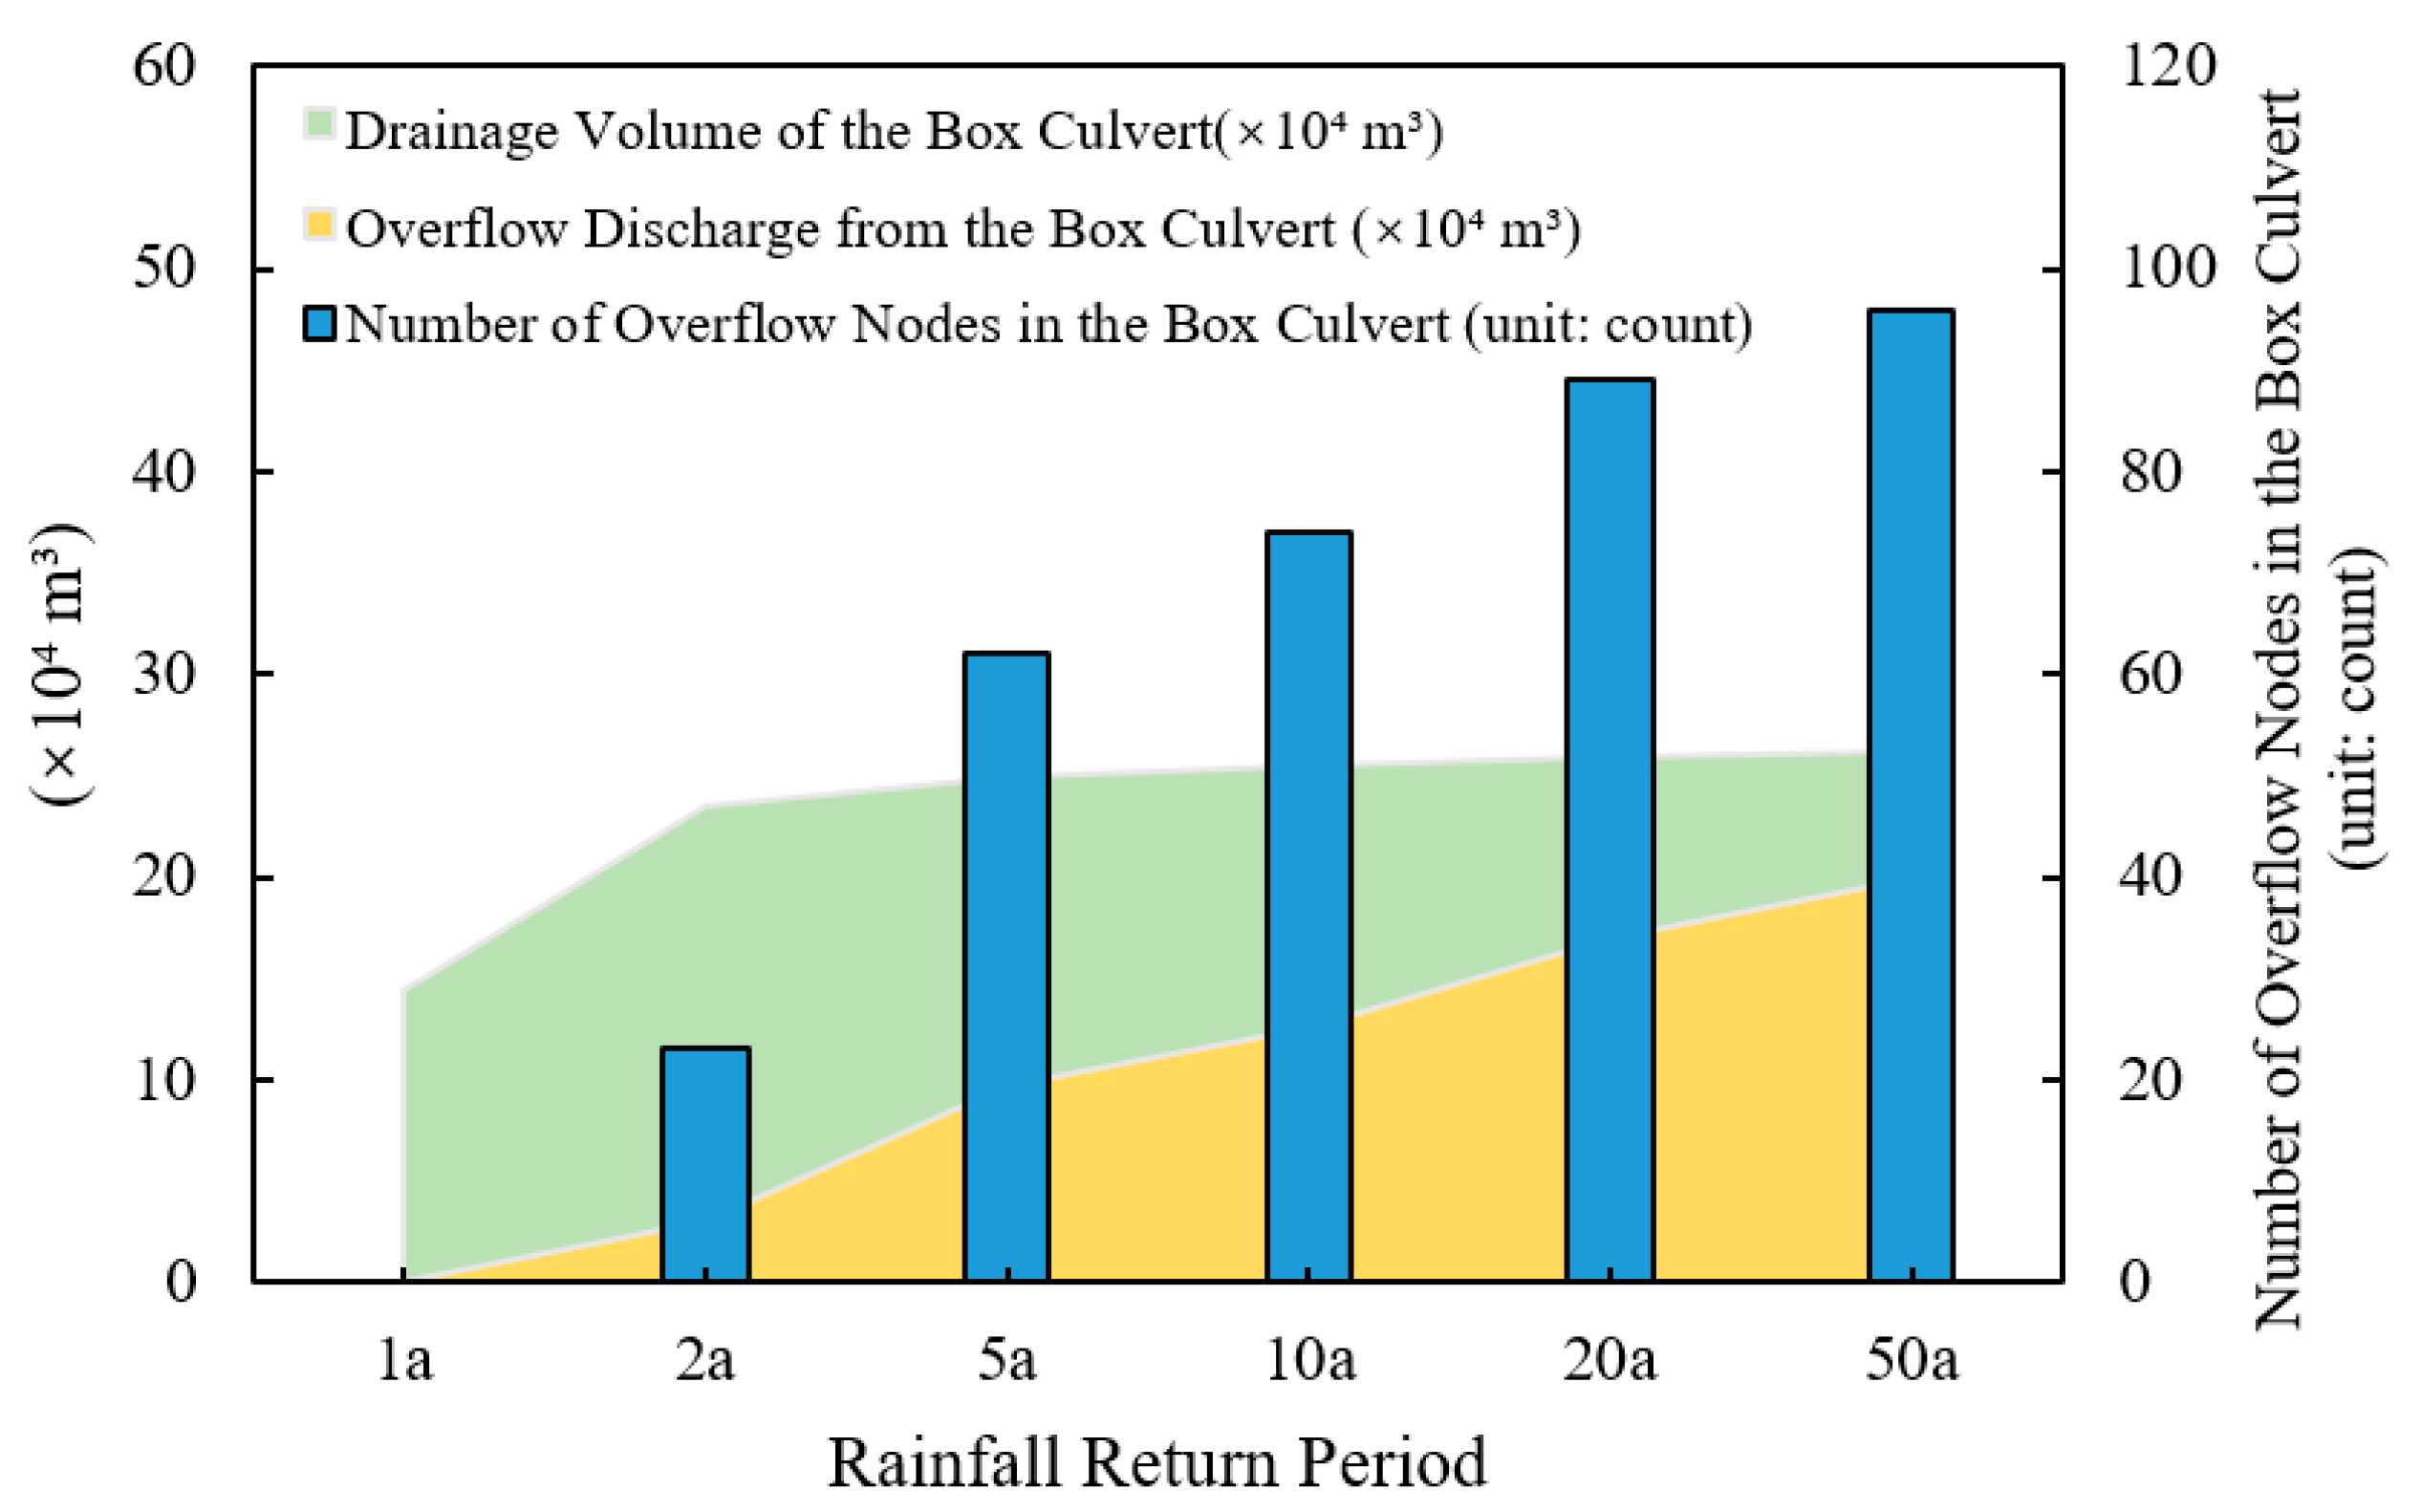
Rainfall events with 1-, 2-, 5-, 10-, 20-, and 50-year return periods, each with a duration of 3 h, were applied to evaluate box culvert discharge and overflow under different scenarios. The operational status of box culverts under different rainfall return periods is presented in Table 4. The simulation results indicate that under the six rainfall return periods, the box culvert discharge volumes are 14.38 × 10⁴, 23.52 × 10⁴, 24.89 × 10⁴, 25.47 × 10⁴ 25.85 × 10⁴, and 25.85 × 10⁴ m3, respectively; the overflow volumes are 0.00, 2.99 × 10⁴, 9.66 × 10⁴, 12.56 × 10⁴, 16.94 × 10⁴, and 19.91 × 10⁴ m3; and the proportions of overflowing nodes are 0.00%, 19.49%, 52.54%, 62.71%, 75.42%, and 81.36%, respectively.
As shown in Figure 11, under the 1a rainfall scenario, the box culverts operate normally with no overflow. Starting from the 2-year return period, overflow begins to occur, and the proportion of overflow nodes increases significantly to 19.49%. Regarding the culvert discharge, the increase from the 2- to 50-year scenarios is limited (from 23.52 × 10⁴ m3 to 25.85 × 10⁴ m3), indicating that the culvert capacity is nearly saturated. As rainfall intensity further increases, the excess water beyond the culvert’s capacity is discharged as overflow, resulting in a continuous rise in both the number of overflow nodes and the total overflow volume, reaching 81.36% and 19.91 × 10⁴ m3, respectively, under the 50-year return period.
These results indicate that the self-regulation capacity of the box culvert system begins to become insufficient under the 2-year return period, and the system is approaching a state of failure. When the rainfall return period exceeds 5-year, more than half of the nodes experience overflow, and the drainage performance of the system is severely compromised. Therefore, the culvert’s capacity to regulate urban flooding in the study area is effectively limited to rainfall intensities of approximately 1- to 2-year return periods; once this critical threshold is exceeded, its regulatory effectiveness rapidly deteriorates, significantly increasing regional overflow and flood risk.

4.3. Dynamic Flood Storage Analysis of the Xi’an City Moat

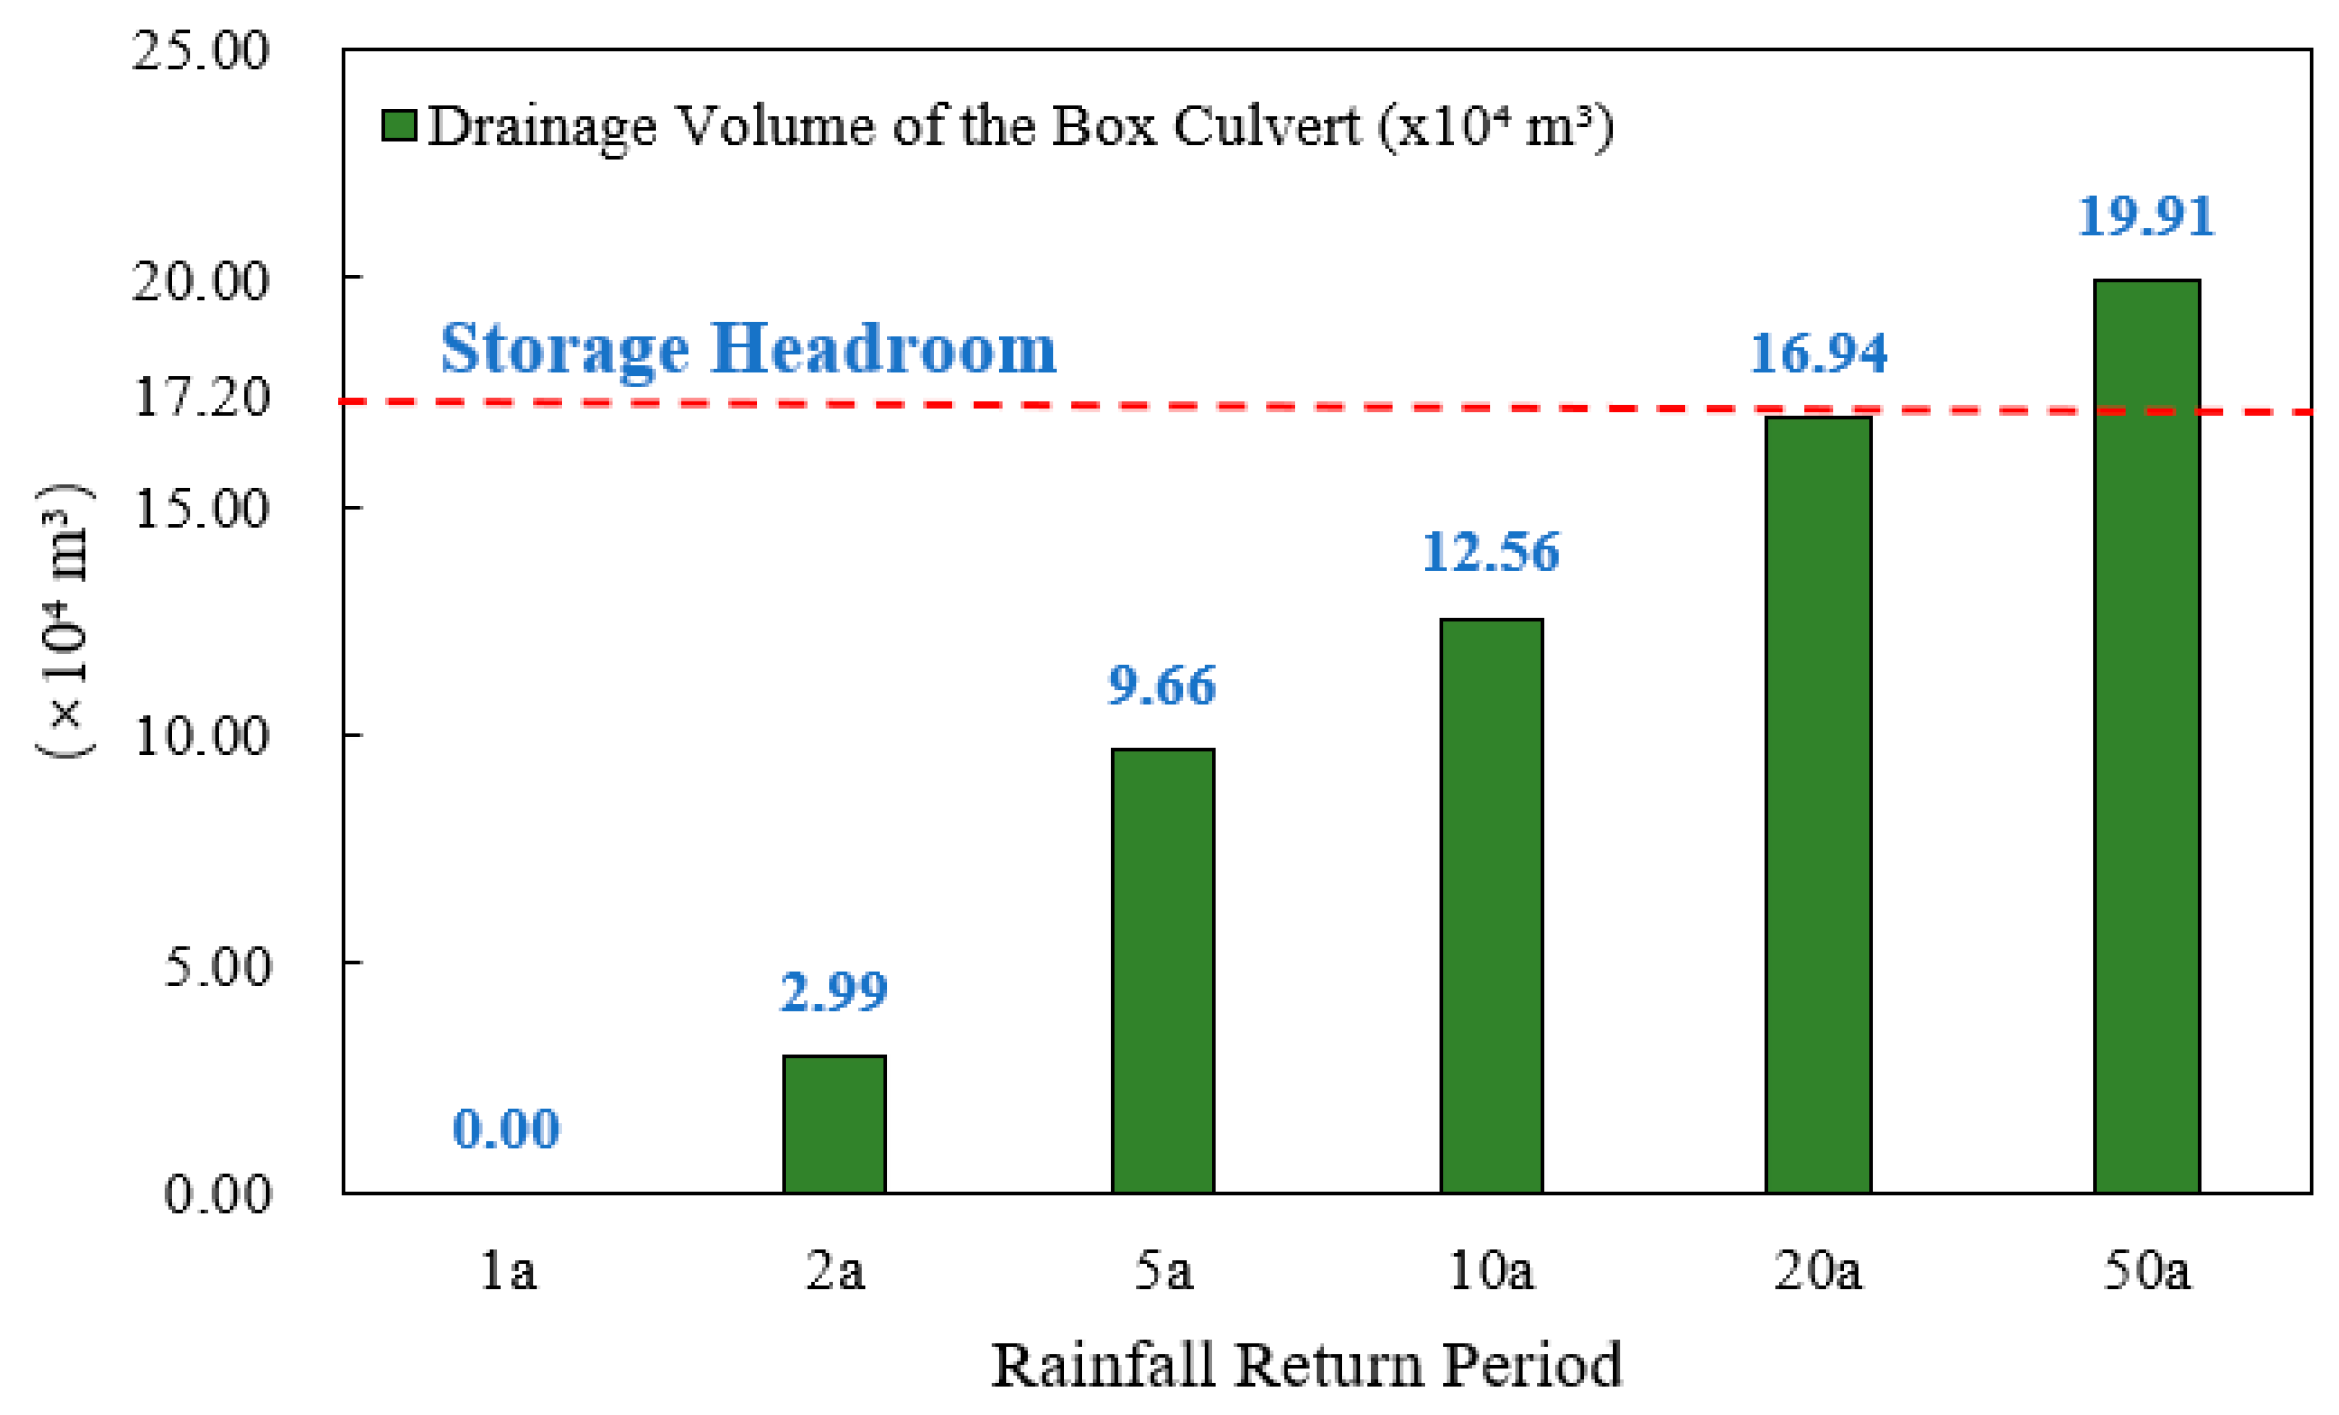
The moat in the study area, functioning as a dynamic flood-regulating facility, was evaluated under design rainfall events with 1-, 2-, 5-, 10-, 20-, and 50-year return periods and a duration of 3 h, in order to assess its flood storage and regulation performance across different scenarios. As shown in Figure 12, the volume of water overflowing from the box culverts into the Moat increases steadily with rainfall intensity, reaching 0.00, 2.99 × 10⁴, 9.66 × 10⁴, 12.56 × 10⁴, 16.94 × 10⁴, and 19.91 × 10⁴ m3, respectively. Under normal conditions, the Moat maintains a landscape water level corresponding to a storage volume of approximately 127.5 × 10⁴ m3, while its total designed flood storage capacity is 144.7 × 10⁴ m3, leaving an available flood storage space of 17.2 × 10⁴ m3. Based on the overflow data, under the 5-year return period, the box culvert overflow is 9.66 × 10⁴ m3, which is below the Moat’s available storage capacity. For the 10-year return period, the overflow increases to 12.56 × 10⁴ m3, approaching but not exceeding the storage limit. Under the 20-year return period, the overflow reaches 16.94 × 10⁴ m3, nearly fully occupying the available storage. In the 50-year return period, the overflow rises to 19.91 × 10⁴ m3, clearly exceeding the Moat’s flood-regulating capacity.
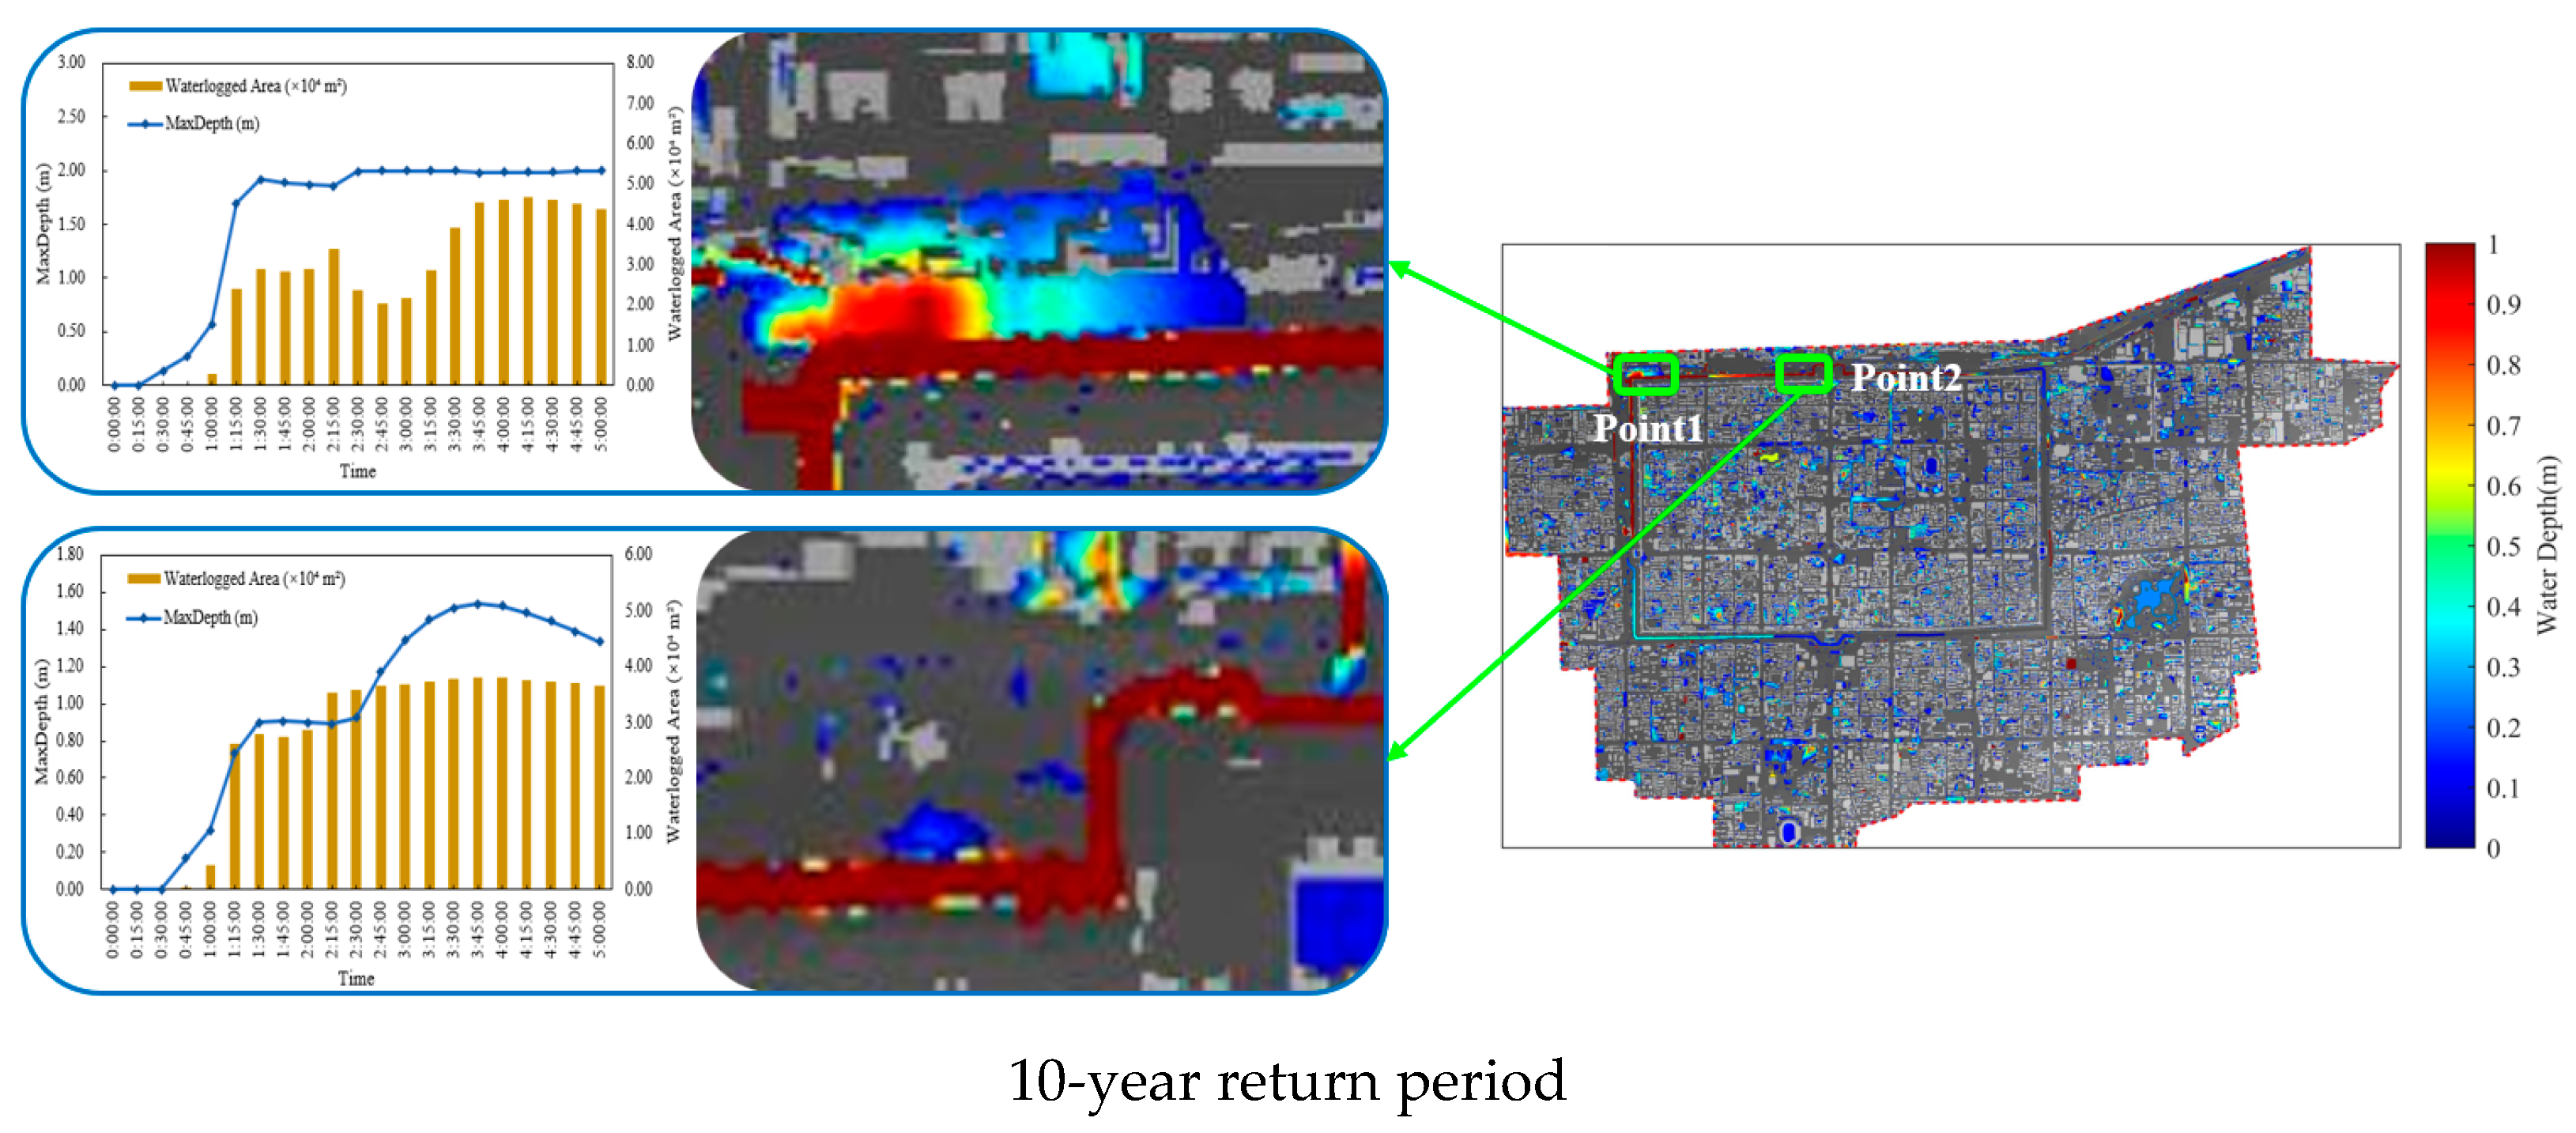
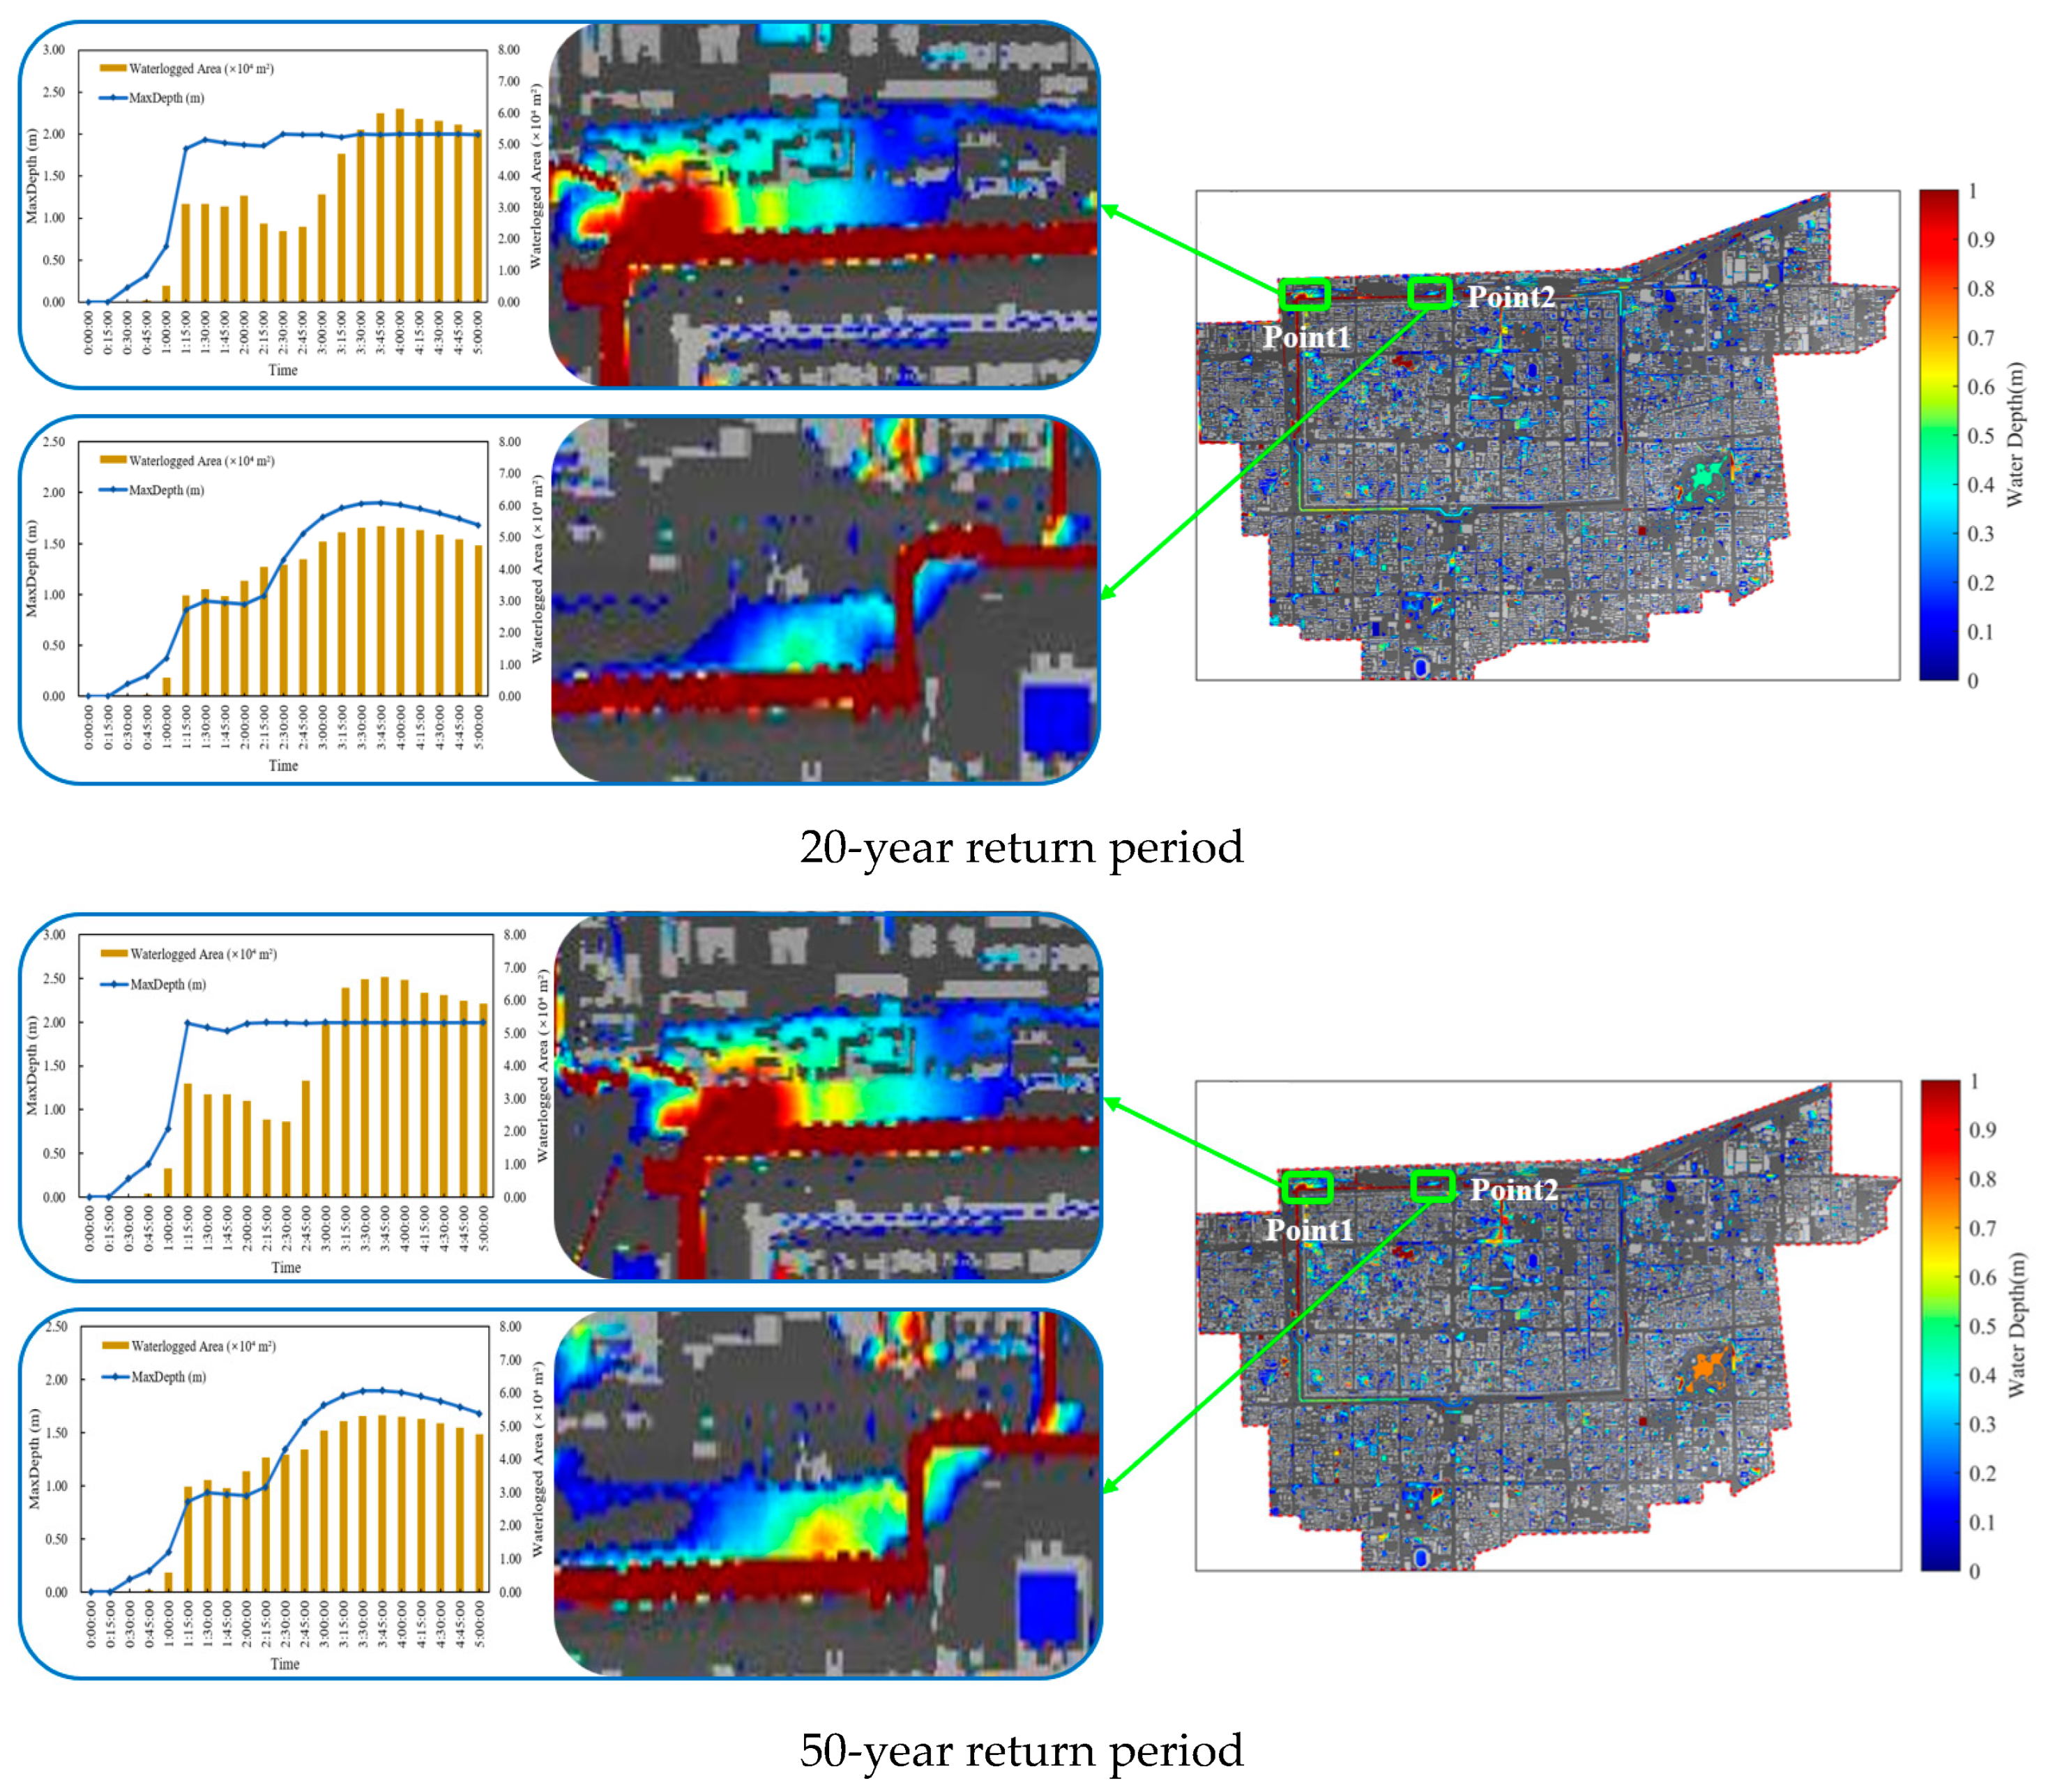
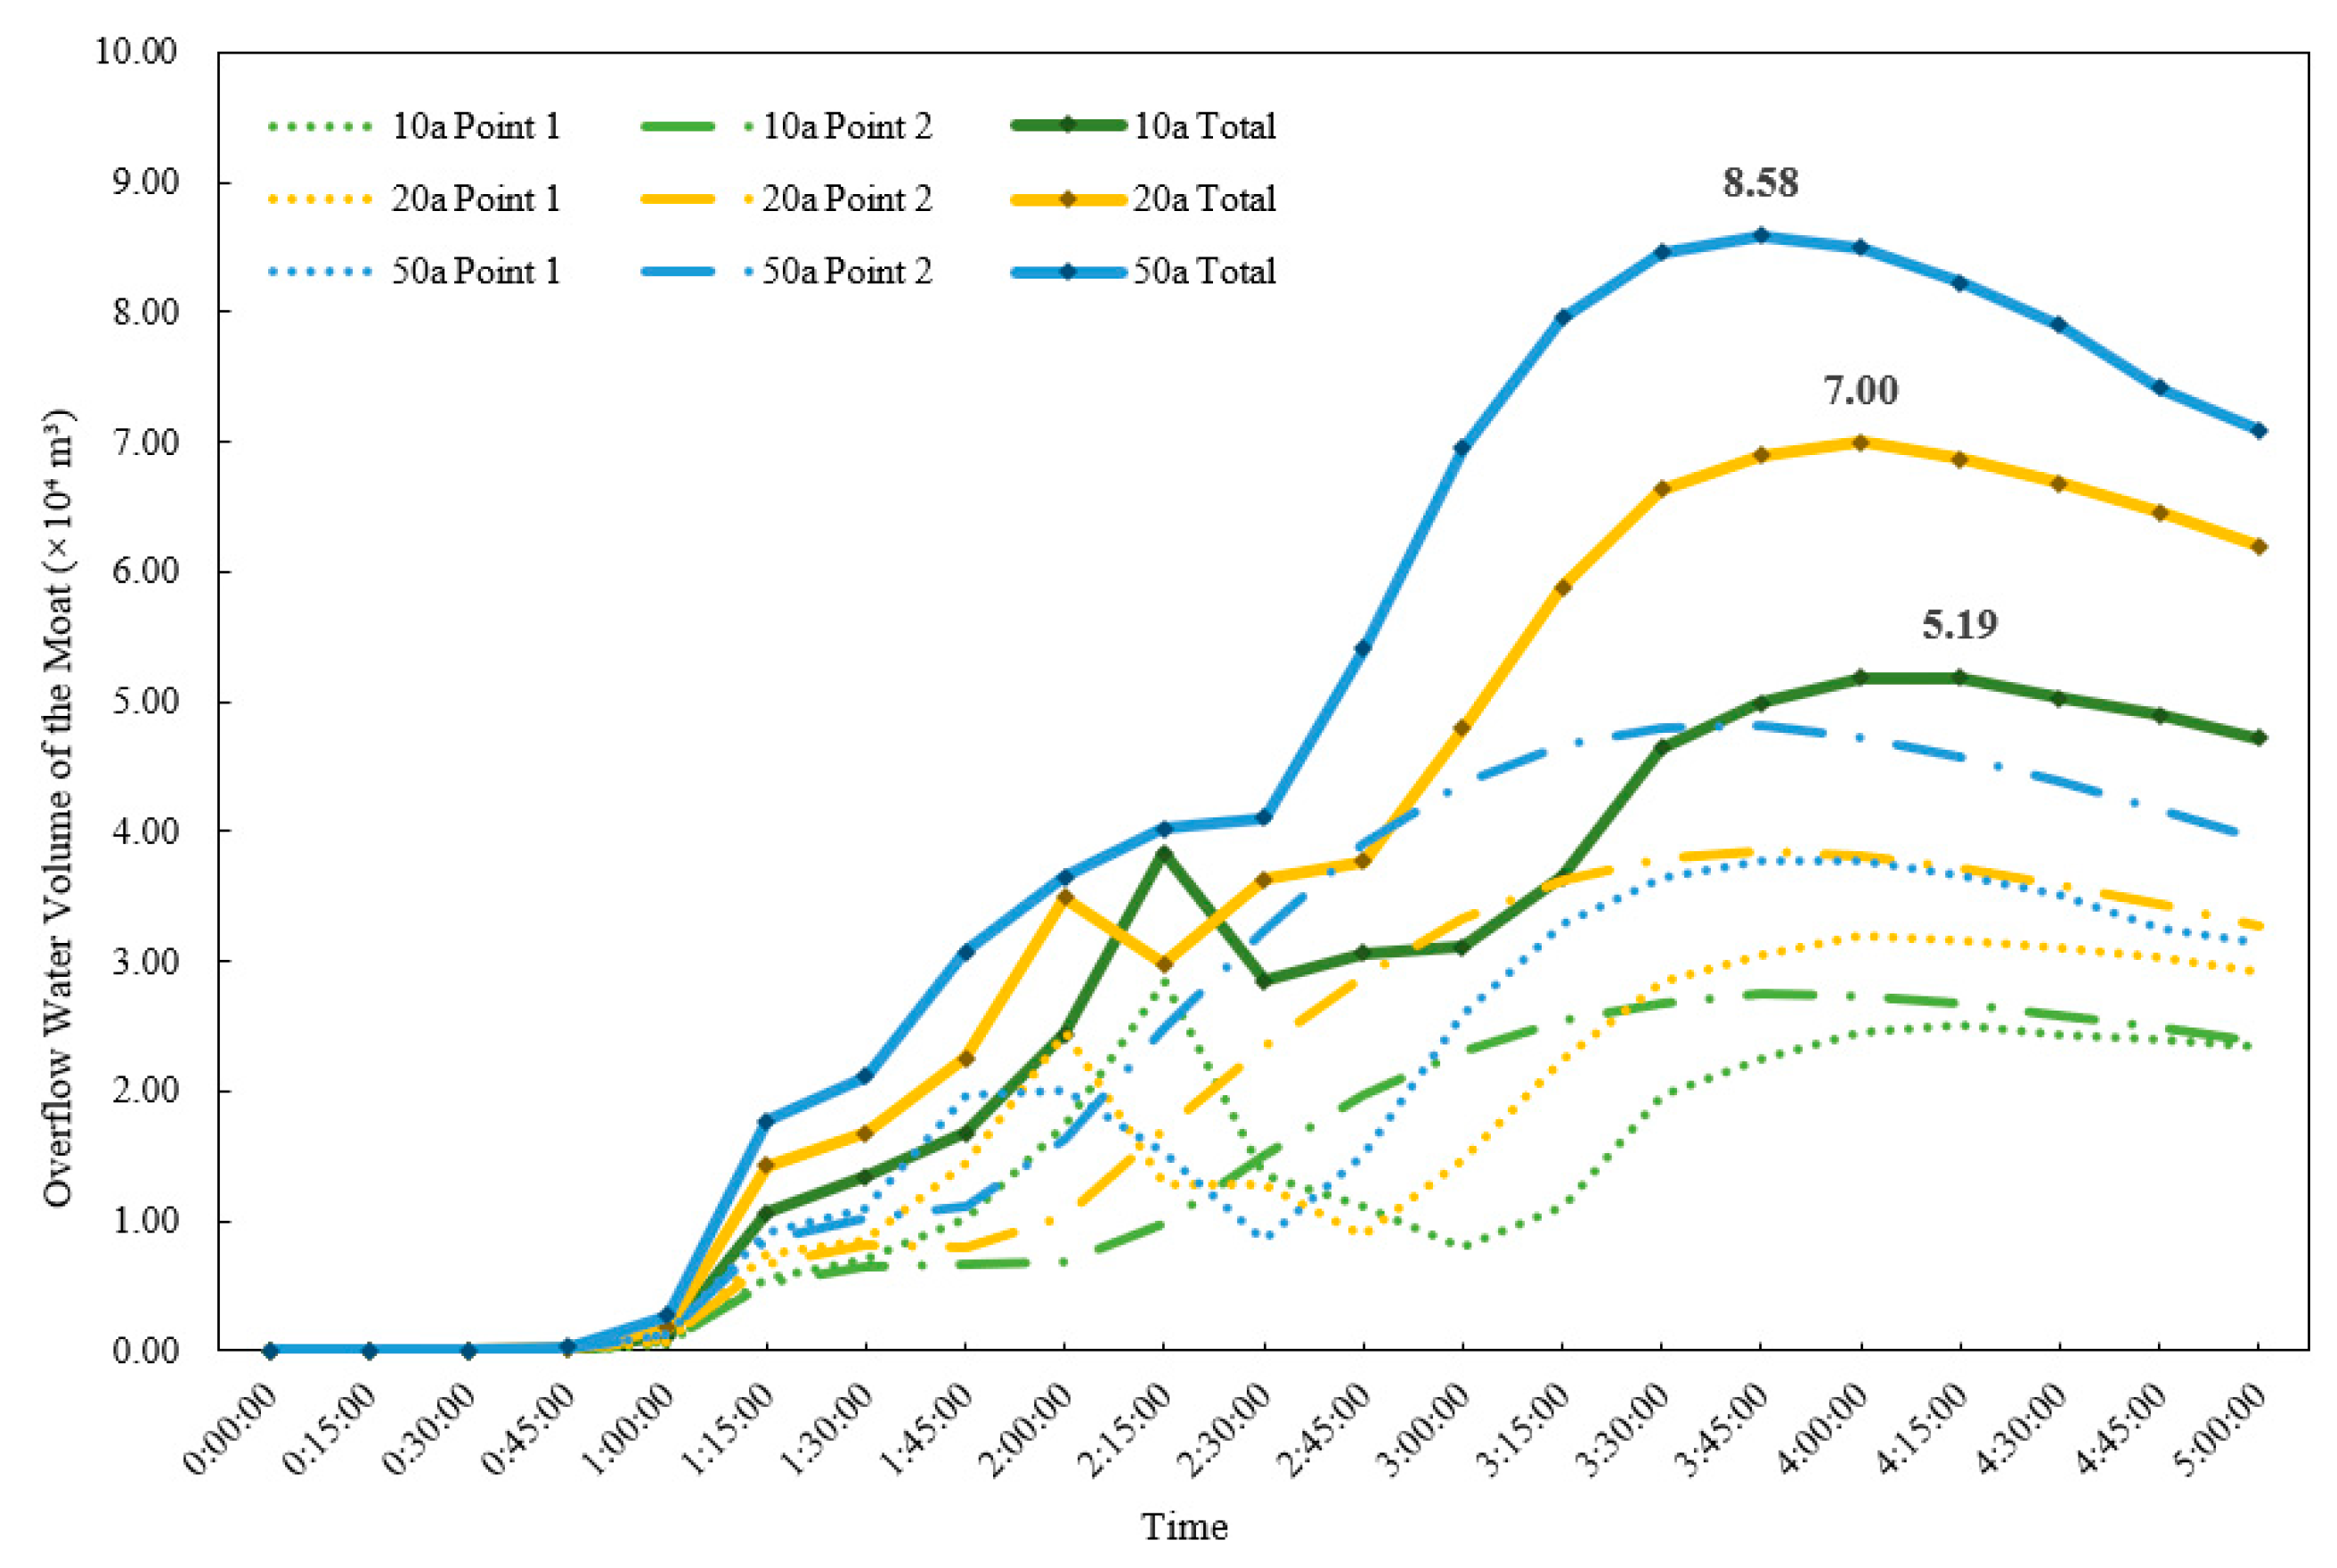
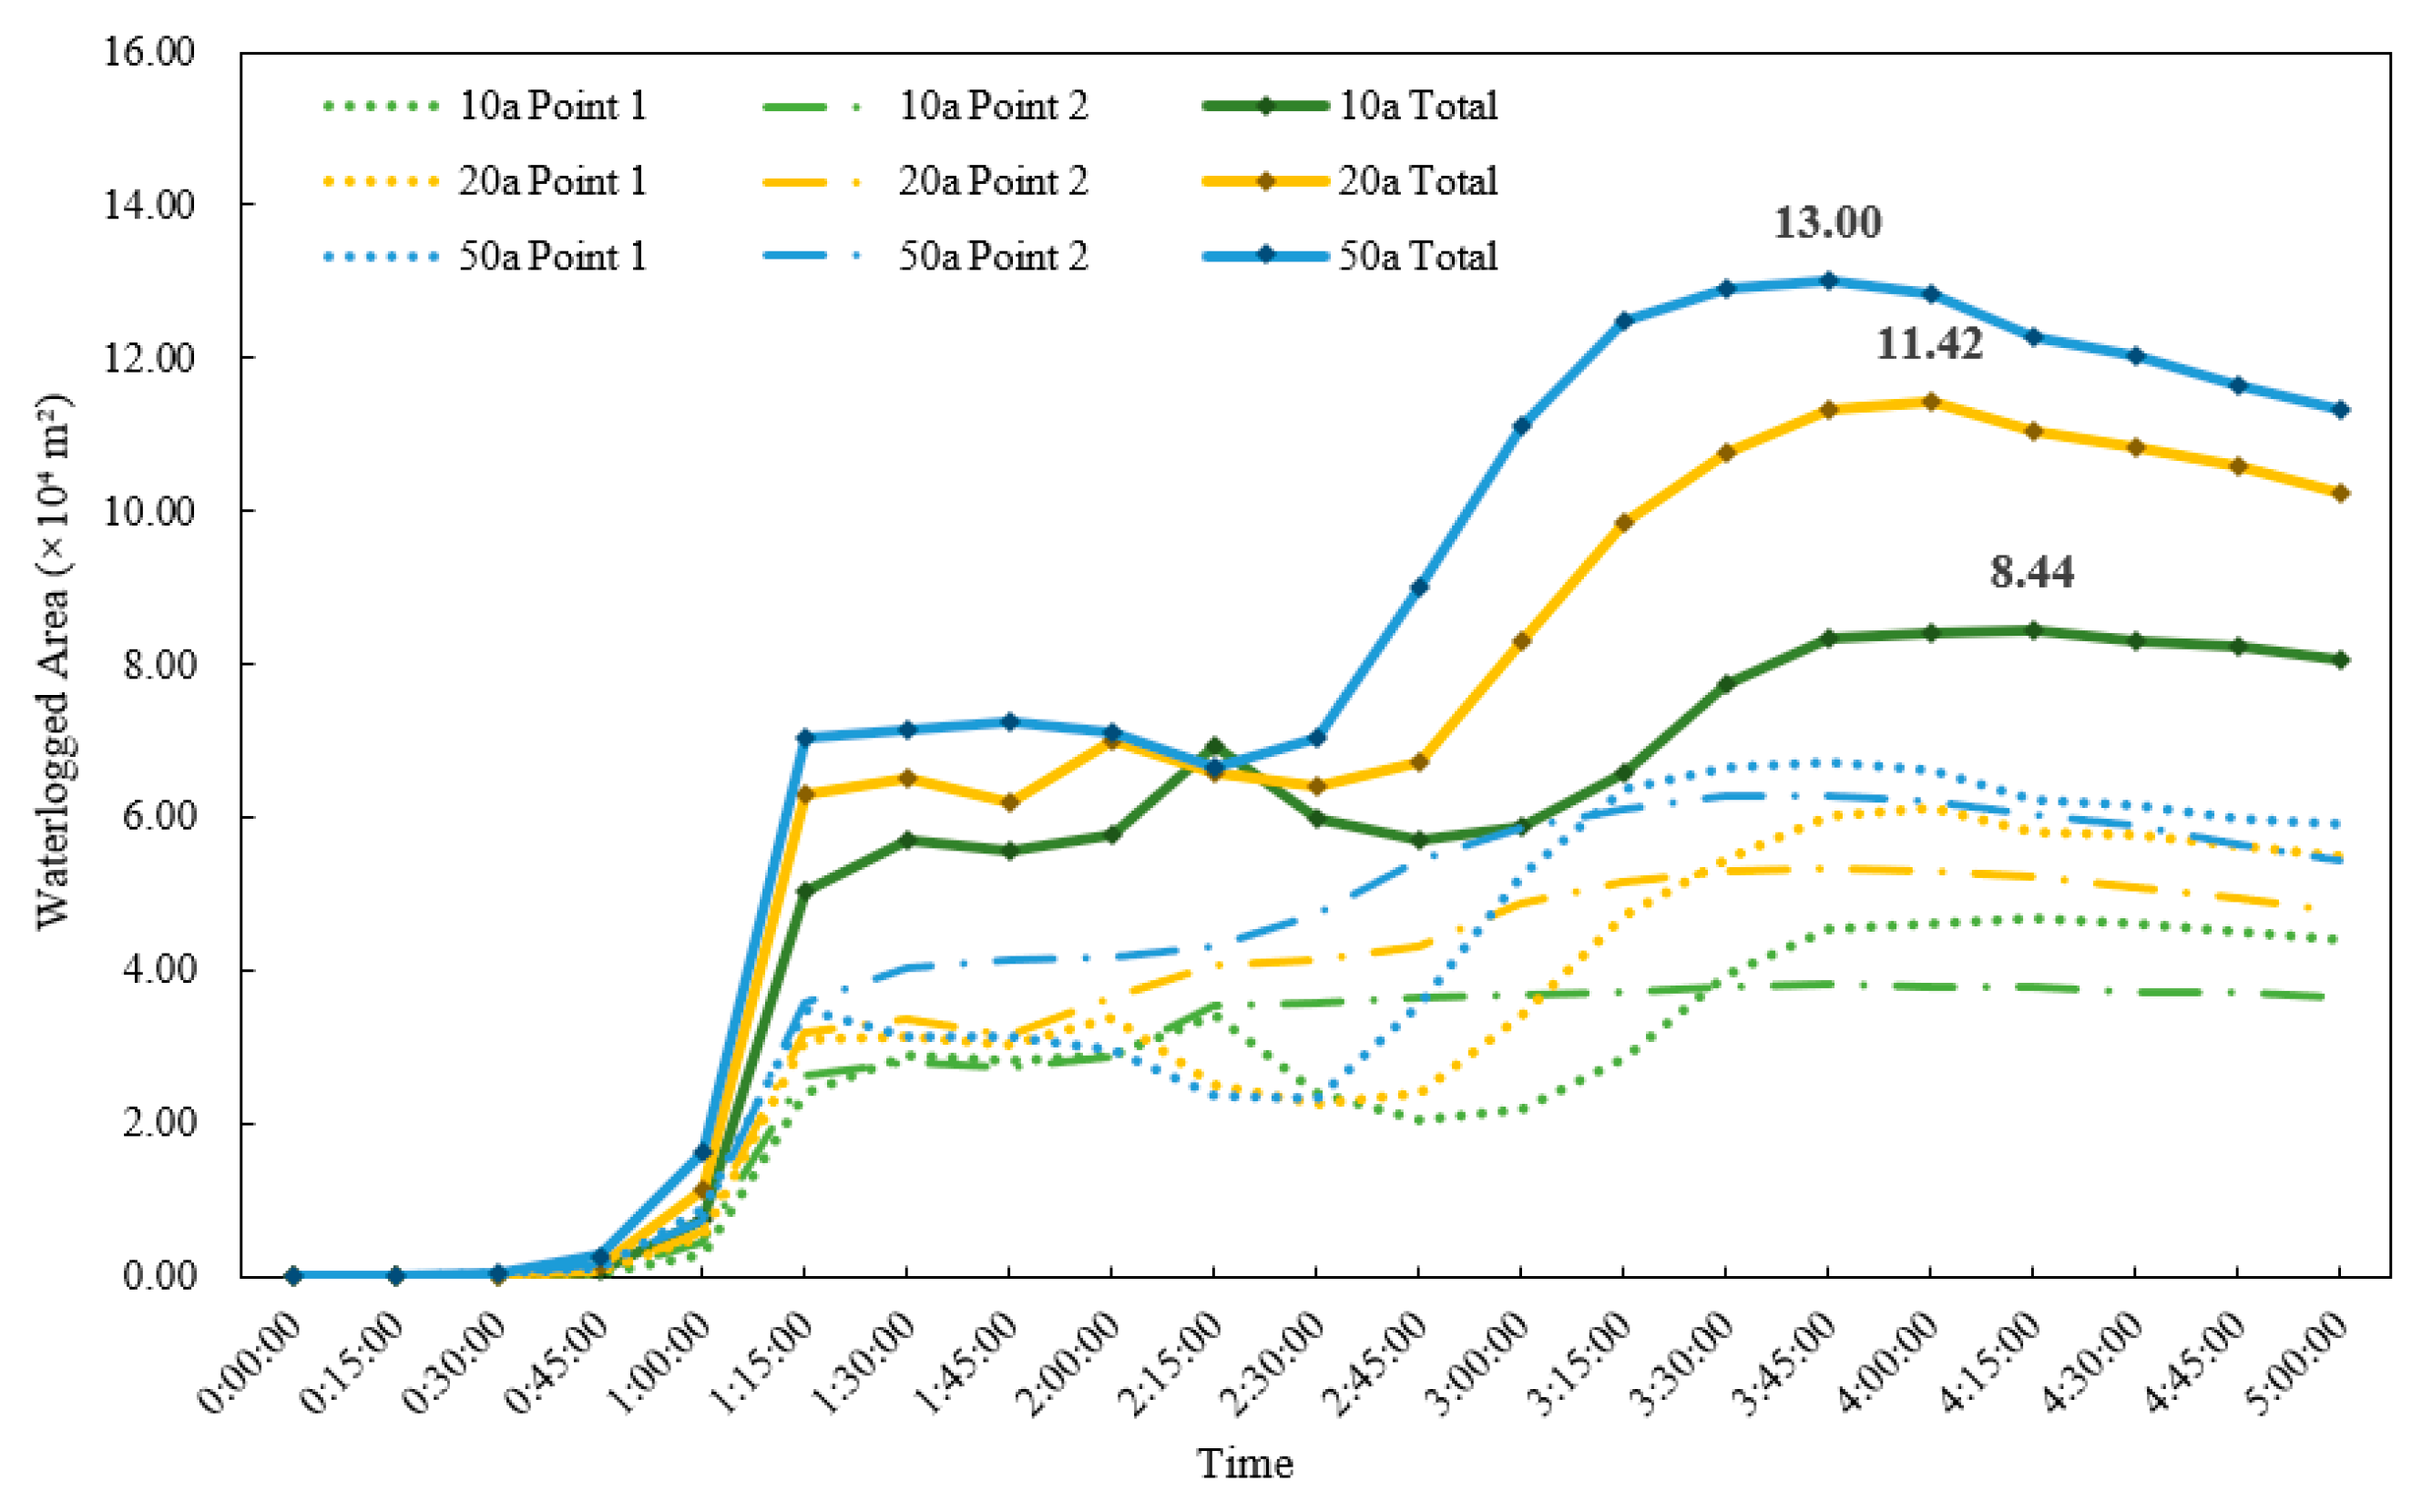
Based on the surface water inundation simulation results (Figure 10 and Figure 13), the moat begins to overflow under the 10-year return period rainfall. This indicates that although the box culvert overflow under the 10-year rainfall does not exceed the moat’s flood storage capacity, the total inflow into the moat—including direct surface runoff and box culvert overflow—already surpasses its storage limit, leading to overtopping. As the rainfall return period increases, both the overtopping volume (at Points 1 and 2) and the inundated area increase significantly (Figure 14 and Figure 15), reaching 5.19 × 10⁴ m3, 7.00 × 10⁴ m3, and 8.59 × 10⁴ m3 in volume, and 8.44 × 10⁴ m2, 11.4 × 10⁴ m2, and 13.00 × 10⁴ m2 in area, respectively.
In summary, the effective upper limit of the moat’s flood-regulation capacity corresponds to rainfall events with return periods of approximately 5–10 years. For events exceeding a 10-year return period, its storage and regulation capacity is markedly reduced, the system gradually fails, and the risk of surface water accumulation increases.

5. Conclusions

Based on high-resolution topography, land use, drainage system, and hydrological data of the Xi’an Moat catchment, a coupled GAST-SWMM model integrating surface, pipe network, box culverts, and river was developed. The model was designed to simulate surface rainfall–runoff generation and convergence, flow dynamics within the underground drainage system, and water exchanges between surface and subsurface domains. Furthermore, the model quantified the flood-retention capacities of the box culverts and the moat, as well as their critical thresholds. The main conclusions are as follows:
(1)
The GAST–SWMM coupled model, incorporating the Surface–Pipe Network–Box Culvert–River framework, effectively reproduced the complete process, including rainfall, surface runoff generation, pipe network transport, and river network flow and overflow. The model demonstrated high accuracy in simulating complex urban hydrological and hydraulic processes, providing a reliable technical tool for urban flood risk assessment and infrastructure performance evaluation.
(2)
The study performed a high-resolution simulation of the dynamic water exchange and hydrological–hydrodynamic response within the coupled “rainfall–surface–pipe–river network” system. The model captured the full hydrological and hydraulic processes under six design rainfall events with return periods from 1 to 50 years. Simulation results indicate that the total drainage volume in the study area increased from 14.99 × 10⁴ m3 (1 year) to 33.18 × 10⁴ m3 (50 years). The system load intensified continuously, with the proportion of fully filled pipes (fill ratio = 1) rising from 8.85% to 72.06%, and the percentage of overflow nodes increasing from 4.38% to 65.29%. The total overflow volume sharply increased from 0.57 × 10⁴ m3 to 93.29 × 10⁴ m3. The model accurately captured the spatiotemporal dynamics of surface runoff generation, convergence, infiltration, and surface–pipe water exchange, revealing the system’s dynamic response mechanisms under varying rainfall intensities.
(3)
The study revealed in detail the dynamic response and critical thresholds of the “rainfall–surface–pipe–river network” system. Simulation results indicate that the drainage capacity of the box culverts approaches saturation under the 2-year return period rainfall (23.52 × 10⁴ m3), with their effective regulatory capacity limited to approximately the 1- to 2-year return periods. Beyond this standard, the overflow volume increases sharply (reaching 19.91 × 10⁴ m3 under the 50-year return period), with the proportion of overflow nodes exceeding 80%. For the moat, when maintaining the landscape water level, the available storage capacity is 17.2 × 10⁴ m3, corresponding to an effective regulation capacity of roughly the 5- to 10-year return period. Under the 10-year return period, the culvert overflow (12.56 × 10⁴ m3) nearly reaches this regulation limit, and overtopping begins to occur.

6. Discussion and Outlook

This study developed and validated a high-performance, high-precision coupled model integrating surface flow, sewer networks, box culverts, and river networks, providing a powerful tool for understanding and simulating the dynamic response of complex drainage systems in old urban areas under extreme rainfall. However, the value of any model lies not only in its simulation capabilities but also in its contribution to scientific understanding and practical guidance for engineering applications. Accordingly, this section discusses the key findings of this study and outlines potential future applications and developments.

6.1. Discussion

(1)
Assessment and optimization of drainage system capacity
The model can accurately identify system bottlenecks, such as critical inundation areas and the corresponding rainfall thresholds. Based on these insights, engineers can use the model to test and compare various improvement measures (e.g., pipe diameter enlargement, construction of retention/detention basins, or distributed green infrastructure), enabling a fully quantitative design process from “problem diagnosis” to “solution optimization” and significantly improving investment efficiency.
(2)
Flood control scheduling and risk management for river channels
The model provides crucial technical support for optimizing real-time flood operations. Simulation results allow quantification of the flood mitigation effect of preemptive discharge from urban moats before heavy rainfall, effectively reducing the risk of overflow in critical sections. This analysis provides a quantitative basis for developing science-based, forecast-informed, dynamic river management strategies, shifting from passive emergency response toward proactive, adaptive risk management.
(3)
Enhancing overall system resilience
The true value of the model lies in its forward-looking capabilities. By inputting design storms under future climate scenarios, the model can “stress-test” existing infrastructure to assess its long-term reliability. This allows decision-makers to move from reactive responses to proactive planning, prioritizing reinforcement or redundancy for the most vulnerable components, thereby supporting climate-adaptive infrastructure development and long-term resilience strategies.

6.2. Outlook

The strengths of this study largely stem from the availability of refined datasets. However, its reliance on detailed underground drainage data-such as geometric configurations and topological connectivity-poses a major obstacle to its wider application in data-scarce areas. In addition, the model’s complexity and relatively high computational cost impose certain requirements on users’ expertise and computational resources. These are common challenges faced by physically based models in the pursuit of high fidelity. Recognizing such limitations is not an endpoint, but rather a new starting point toward broader applicability. The outcomes of this study have laid a crucial foundation for developing the next generation of versatile flood modeling toolkits. Future research can be deepened in the following directions:
(1)
Serving as a benchmark for simplified models
The validated high-precision model in this study can serve as a reliable “virtual reality.” The high-fidelity datasets it generates under various scenarios-such as surface water depth and sewer flow-can be used to calibrate, validate, and optimize key parameters of simplified or conceptual models designed for data-scarce regions, thereby substantially improving their physical soundness and predictive accuracy.
(2)
Developing a hierarchical and hybrid modeling strategy
For large cities or metropolitan regions, a flexible modeling paradigm can be established. In data-rich core or high-risk areas, the refined framework presented here can be used for detailed simulation and design evaluation, while in data-scarce peripheral or preliminary screening zones, the calibrated simplified models can be employed. The two components can be dynamically coupled with their boundaries, achieving an optimal balance between precision and efficiency.
In summary, this study not only provides specific technical solutions for flood mitigation in the case region but, more importantly, establishes a highly reliable benchmark that bridges the gap between “high-fidelity research” and “broad-scale application.”

Author Contributions

Conceptualization, N.L. and L.M.; methodology, N.L., X.L. and J.H.; software, J.W., D.L. and R.C.; validation, X.P. and Y.R.; data curation, J.W., X.P. and D.L.; writing—original draft preparation, N.L., L.M. and J.H.; writing—review and editing, X.L., D.L., X.P., R.C., J.W., Y.R. and Y.C. All authors have read and agreed to the published version of the manuscript.

Funding

This project was financially supported by the National Key R&D Program of China (2024YFC3012402); the National Natural Science Foundation of China (52409104); the Science and Technology Program of Xi’an (24SFSF0010); the China Postdoctoral Science Foundation (2024M762625); the Technology Innovation Leading Program of Shaanxi (2024QY-SZX-27); and the Natural Science Basic Research Plan in Shaanxi Province of China (2025JC-YBQN-955).

Data Availability Statement

The original data involved in this study have all been provided in the main text. For further information, please contact the corresponding author.

Conflicts of Interest

Authors Jun Wang and Xuan Li were employed by Xi’an Water Group Planning and Design Research Institute Co., Ltd. and PowerChina Northwest Engn Co., Ltd., respectively. The remaining authors declare that the research was conducted in the absence of any commercial or financial relationships that could be construed as a potential conflict of interest.

Abbreviations

The following abbreviations are used in this manuscript:
GSATGPU-accelerated Surface Water Flow and Associated Transport
SWMMStorm Water Management Model

References

  1. Ke, E.T.; Zhao, J.C.; Zhao, Y.L. Investigating the influence of nonlinear spatial heterogeneity in urban flooding factors using geographic explainable artificial intelligence. J. Hydrol. 2025, 648, 132398. [Google Scholar] [CrossRef]
  2. Song, J.Y.; Shao, Z.Y.; Zhan, Z.Y.; Chen, L. State-of-the-Art Techniques for Real-Time Monitoring of Urban Flooding: A Review. Water 2024, 16, 2476. [Google Scholar] [CrossRef]
  3. Wang, M.; Fu, X.P.; Zhang, D.Q.; Chen, F.R.; Liu, M.; Zhou, S.Q.; Su, J.; Tan, S.K. Assessing urban flooding risk in response to climate change and urbanization based on shared socio-economic pathways. Sci. Total Environ. 2023, 880, 163470. [Google Scholar] [CrossRef]
  4. Zhou, S.Q.; Zhang, D.Q.; Wang, M.; Liu, Z.Y.; Gan, W.; Zhao, Z.C.; Xue, S.S.; Müller, B.; Zhou, M.M.; Ni, X.Q.; et al. Risk-driven composition decoupling analysis for urban flooding prediction in high-density urban areas using Bayesian-Optimized LightGBM. J. Clean. Prod. 2024, 457, 142286. [Google Scholar] [CrossRef]
  5. Li, J.G.; Yuan, L.N.; Hu, Y.C.; Xu, A.; Cheng, Z.X.; Song, Z.J.; Zhang, X.W.; Zhu, W.T.; Shang, W.B.; Liu, J.Y.; et al. Flood simulation using LISFLOOD and inundation effects: A case study of Typhoon In-Fa in Shanghai. Sci. Total Environ. 2024, 954, 176372. [Google Scholar] [CrossRef] [PubMed]
  6. Zhang, J.P.; Li, X.C.; Zhang, H.R. Research on urban waterlogging risk prediction based on the coupling of the BP neural network and SWMM model. Water Clim. Change 2023, 14, 3417–3434. [Google Scholar] [CrossRef]
  7. Li, X.; Yu, Y.; Wang, C.; Zheng, S.; Li, L.; Chen, G. Monitoring and characterization of the entire urban flooding process in the typical southern plain river network area. J. Hydraul. Eng. 2022, 53, 845–853. [Google Scholar]
  8. Hou, J.M.; Wang, N.; Guo, K.H.; Li, D.L.; Jing, H.X.; Wang, T.; Hinkelmann, R. Effects of the temporal resolution of storm data on numerical simulations of urban flood inundation. J. Hydrol. 2020, 589, 125100. [Google Scholar] [CrossRef]
  9. Xing, Y.; Shao, D.; Liang, Q.H.; Chen, H.L.; Ma, X.Y.; Ullah, I. Investigation of the drainage loss effects with a street view based drainage calculation method in hydrodynamic modelling of pluvial floods in urbanized area. J. Hydrol. 2022, 605, 127365. [Google Scholar] [CrossRef]
  10. Lazzarin, T.; Costabile, P.; Viero, D.P. An efficient physics-based modeling strategy for pluvial floods in urban areas with a subgrid scheme for the stormwater drainage network. J. Hydrol. 2025, 661, 133617. [Google Scholar] [CrossRef]
  11. Oberauer, M.; Lehmann, B. Enhanced 2D-models as alternative to dual-drainage systems for urban flood simulation. J. Hydrol. 2024, 645, 132198. [Google Scholar]
  12. Barreiro, J.; Santos, F.; Ferreira, F.; Neves, R.; Matos, J.S. Development of a 1D/2D Urban Flood Model Using the Open-Source Models SWMM and MOHID Land. Sustainability 2023, 15, 707. [Google Scholar] [CrossRef]
  13. Susetyo, C.; Idajati, H.; Navastara, A.M. Transformation of urban flood modelling from hydrodynamic to system dynamics approach. IOP Conf. Ser. Earth Environ. Sci. 2019, 340, 012013. [Google Scholar] [CrossRef]
  14. Montalvo, C.; Reyes-Silva, J.D.; Sañudo, E.; Cea, L.; Puertas, J. Urban pluvial flood modelling in the absence of sewer drainage network data: A physics-based approach. J. Hydrol. 2024, 634, 131043. [Google Scholar] [CrossRef]
  15. Caradot, N.; Rouault, P.; Clemens, F.; Cherqui, F. Evaluation of uncertainties in sewer condition assessment. Struct. Infrastruct. Eng. 2018, 14, 264–273. [Google Scholar] [CrossRef]
  16. Khaleghian, H.; Shan, Y.W. Developing a Data Quality Evaluation Framework for Sewer Inspection Data. Water 2023, 15, 2043. [Google Scholar] [CrossRef]
  17. Li, D.L.; Hou, J.M.; Zhou, Q.S.; Lyu, J.; Pan, Z.P.; Wang, T.; Sun, X.L.; Yu, G.L.; Tang, J.Y. Urban rainfall-runoff flooding response for development activities in new urbanized areas based on a novel distributed coupled model. Urban. Clim. 2023, 51, 101628. [Google Scholar] [CrossRef]
  18. Mei, C.; Liu, J.; Wang, H.; Wang, J.; Luo, J.; Wang, Z. Comprehensive review on the impact of spatial features of urban underlying surface on runoff processes. Adv. Water Sci. 2021, 32, 791–800. [Google Scholar]
  19. Yang, W.C.; Zheng, C.X.; Jiang, X.L.; Wang, H.; Lian, J.J.; Hu, D.; Zheng, A.R. Study on urban flood simulation based on a novel model of SWTM coupling D8 flow direction and backflow effect. J. Hydrol. 2023, 621, 129608. [Google Scholar] [CrossRef]
  20. Min, A.K.; Tashiro, T. Assessment of pluvial flood events based on monitoring and modeling of an old urban storm drainage in the city center of Yangon, Myanmar. Nat. Hazard. 2024, 120, 8871–8892. [Google Scholar] [CrossRef]
  21. Simone, A.; Cesaro, A.; Del Giudice, G.; Di Cristo, C.; Fecarotta, O. Potentialities of Complex Network Theory Tools for Urban Drainage Networks Analysis. Water Resour. Res. 2022, 58, e2022WR032277. [Google Scholar] [CrossRef]
  22. Francipane, A.; Pumo, D.; Sinagra, M.; La Loggia, G.; Noto, L.V. A paradigm of extreme rainfall pluvial floods in complex urban areas: The flood event of 15 July 2020 in Palermo (Italy). Nat. Hazards Earth Syst. Sci. 2021, 21, 2563–2580. [Google Scholar] [CrossRef]
  23. Mutua, B.M.; Miyazaki, Y. Two-dimensional longitudinal dynamic response of two-units box culvert on a liquefiable ground. Nat. Hazards Earth Syst. Sci. 2024, 10, 1295–1300. [Google Scholar]
  24. Willis, T.D.M. Systematic Analysis of Uncertainty in Flood Inundation Modelling. Ph.D. Thesis, University of Leeds, Leeds, UK, 2014. [Google Scholar]
  25. Hou, J.; Li, G.; Li, G.; Liang, Q.; Zhi, Z. Application of efficient high-resolution hydrodynamic model to simulations of flood propagation. J. Hydroelectr. Eng. 2018, 37, 96–107. [Google Scholar]
  26. Hou, J.; Wang, R.; Li, G.; Li, G. High-performance numerical model for high-resolution urban rainfall-runoff process based on dynamic wave method. J. Hydroelectr. Eng. 2018, 37, 40–49. [Google Scholar]
  27. Hou, J.M.; Simons, F.; Mahgoub, M.; Hinkelmann, R. A robust well-balanced model on unstructured grids for shallow water flows with wetting and drying over complex topography. Comput. Meth. Appl. Mech. Eng. 2013, 257, 126–149. [Google Scholar] [CrossRef]
  28. Liao, K.H. A Theory on Urban Resilience to Floods-A Basis for Alternative Planning Practices. Ecol. Soc. 2012, 17, 48. [Google Scholar] [CrossRef]
  29. Hou, J.M.; Wang, T.; Li, P.; Li, Z.B.; Zhang, X.; Zhao, J.H.; Hinkelmann, R. An implicit friction source term treatment for overland flow simulation using shallow water flow model. J. Hydrol. 2018, 564, 357–366. [Google Scholar] [CrossRef]
  30. Chen, G.Z.; Hou, J.M.; Wang, T.; Gao, X.J.; Yang, D.F.; Li, T. Analysis of the effect of rainfall center location on the flash flood process at the smallbasin scale. Water Clim. Change 2024, 15, 652–668. [Google Scholar] [CrossRef]
  31. Ma, L.; Hou, J.; Zhang, D.; Xia, J.; Li, B.; Ning, L. Study on 2-D numerical simulation coupling with breach evolution in flood propagation. J. Hydraul. Eng. 2019, 50, 1253–1267. [Google Scholar]
  32. Zhao, L.D.; Zhang, T.; Fu, J.; Li, J.Z.; Cao, Z.X.; Feng, P. Risk Assessment of Urban Floods Based on a SWMM-MIKE21-Coupled Model Using GF-2 Data. Remote Sens. 2021, 13, 4381. [Google Scholar] [CrossRef]
  33. Zeng, Z.; Lai, C.; Wang, Z.; Wu, X.; Huang, G.; Hu, Q. Rapid simulation of urban rainstorm flood based on WCA2D and SWMM model. Adv. Water Sci. 2020, 31, 29–38. [Google Scholar]
  34. Li, X.; Hou, J.; Pan, Z.; Jing, J.; Fan, C.; Sun, X. Simulation study on dynamic response of rain and flood process in urban renewal: A case study of Yinchuan City. J. Hydraul. Eng. 2023, 54, 1347–1358. [Google Scholar]
  35. Zhang, H.P.; Wu, W.M.; Hu, C.H.; Hu, C.W.; Li, M.; Hao, X.L.; Liu, S. A distributed hydrodynamic model for urban storm flood risk assessment. J. Hydrol. 2021, 600, 126513. [Google Scholar] [CrossRef]
  36. Li, D.L.; Hou, J.M.; Zhang, Y.W.; Guo, M.P.; Zhang, D.W. Influence of Time Step Synchronization on Urban Rainfall-Runoff Simulation in a Hybrid CPU/GPU 1D-2D Coupled Model. Water Resour. Manag. 2022, 36, 3417–3433. [Google Scholar] [CrossRef]
  37. Pan, X.X.; Hou, J.M.; Chen, G.Z.; Li, D.L.; Zhou, N.; Imran, M.; Li, X.Y.; Qiao, J.; Gao, X.J. Rapid urban inundation prediction method based on numerical simulation and AI algorithm. J. Hydrol. 2025, 647, 132334. [Google Scholar] [CrossRef]
  38. Chen, G.Z.; Hou, J.M.; Zhou, N.E.; Yang, S.X.; Tong, Y.; Su, F.; Huang, L.; Bi, X. High-Resolution Urban Flood Forecasting by Using a Coupled Atmospheric and Hydrodynamic Flood Models. Front. Earth Sci. 2020, 8, 545612. [Google Scholar] [CrossRef]
  39. Hou, J.; Wang, Z.; Li, D.; Bu, L.; Chen, G.; Yang, Y.; Fang, Y. Simulation of the response of drainage capacity of pipe network to street inlet clogging and pipeline silting. Adv. Water Sci. 2025, 36, 122–131. [Google Scholar]
  40. Li, D.; Xu, Y.; Hou, J.; Liang, X.; Wang, Y.; Yang, Y.; Wu, F. Approximate simulation method for stormwater process in urban areas with missing data of fine pipe network. Adv. Water Sci. 2024, 35, 960–971. [Google Scholar]
  41. Yuan, J.; Chen, W.; Zhao, T.; Zhang, D.; Li, L. Dimension reduction simulation technology of pipeline network in rainstorm floods of high-density city for computational timeliness. Water Resour. Prot. 2024, 40, 69–77. [Google Scholar]
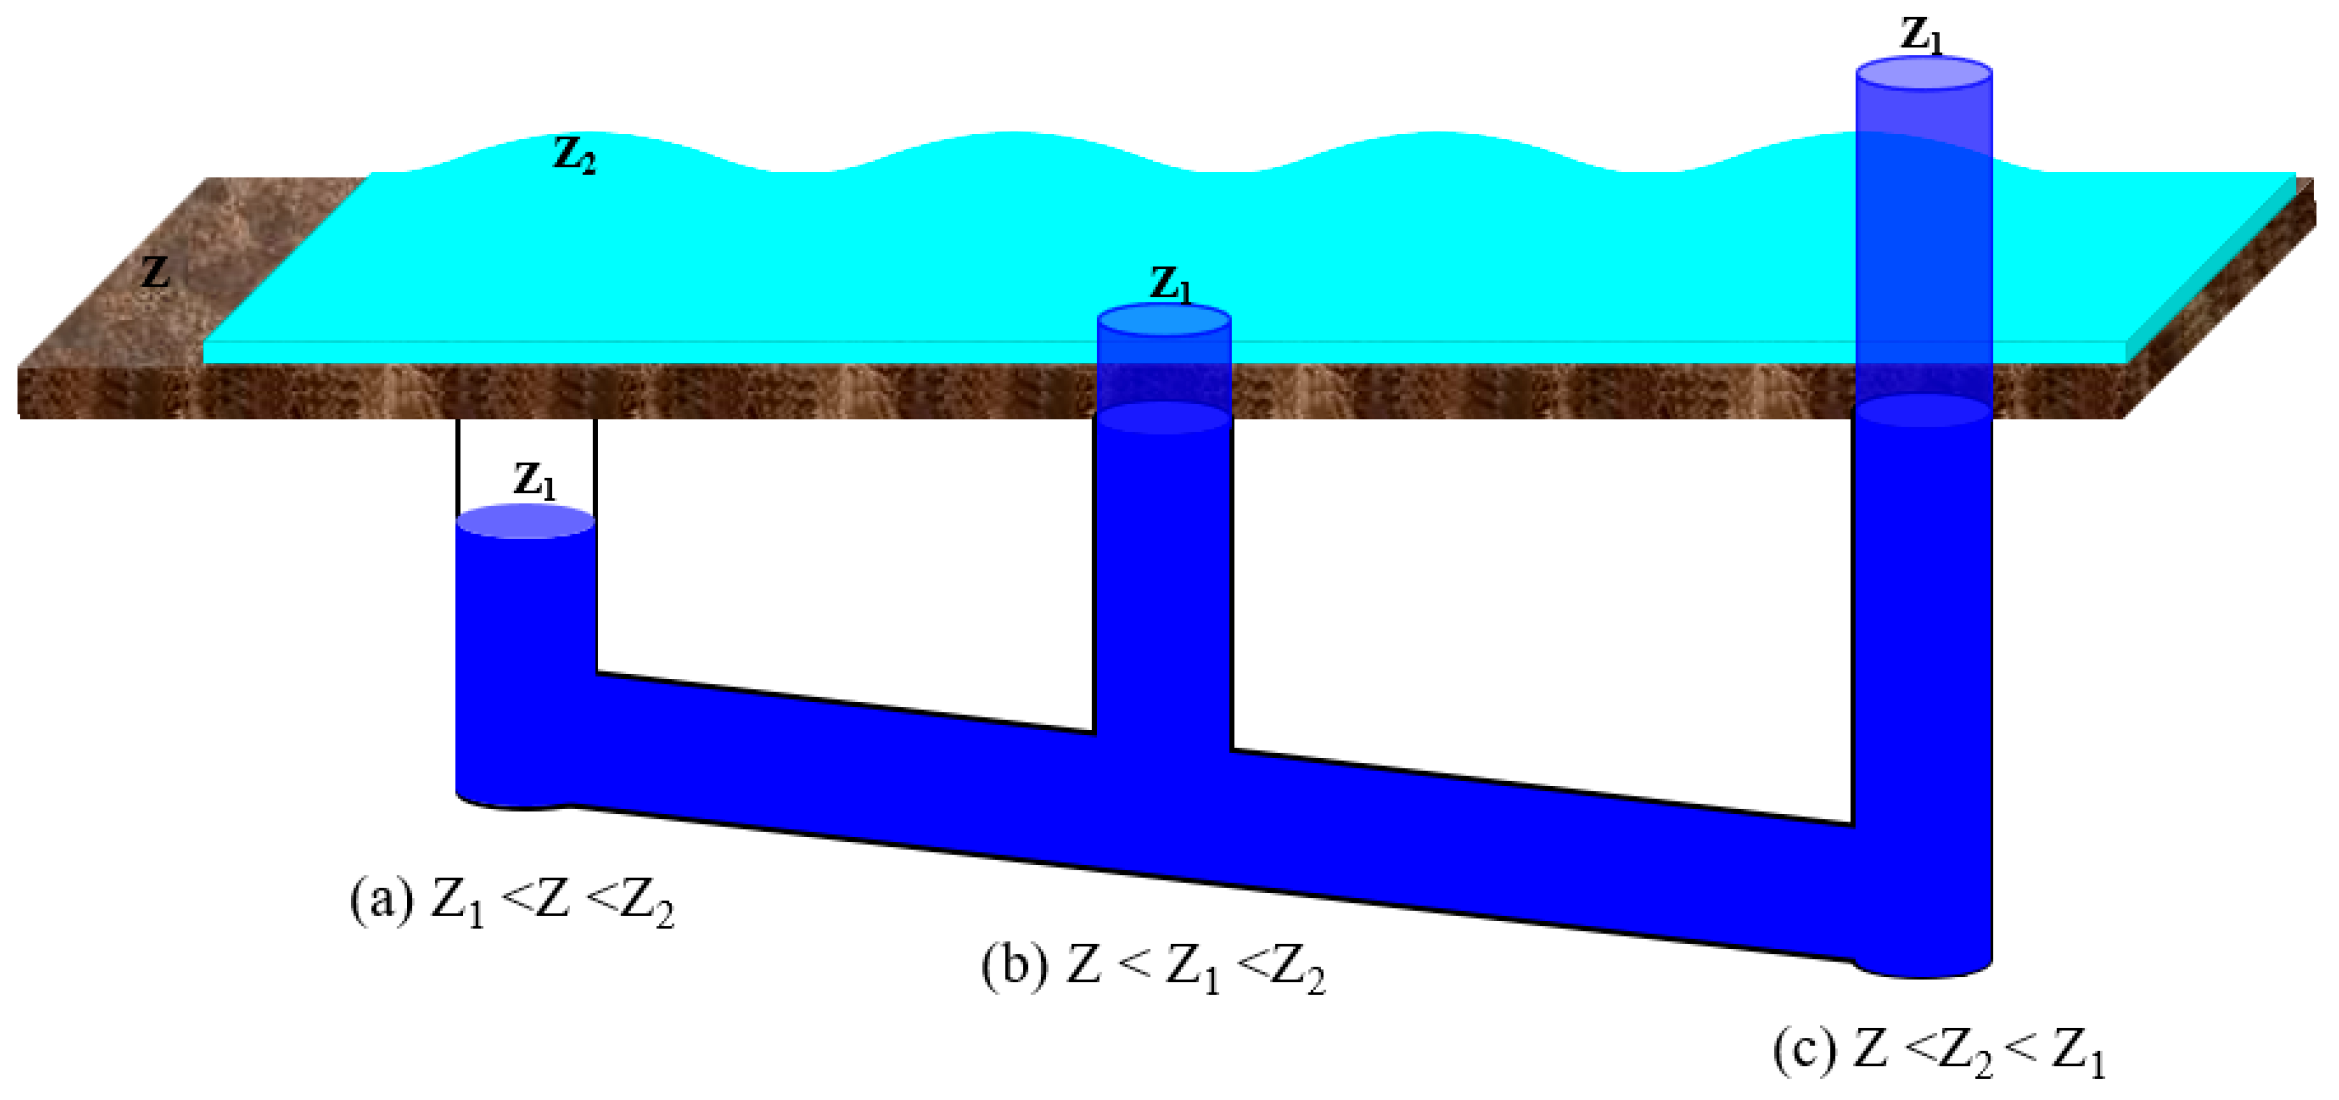
Figure 1. Exchange state of vertical flow in 1D-2D coupled mode.
Hydrology 12 00280 g001
Figure 2. (a) Location; (b) location distribution of box culverts and the moat; (c) study area.
Hydrology 12 00280 g002
Figure 3. (a) Land use classification of the study area; (b) digital elevation model of the study area.
Hydrology 12 00280 g003
Figure 4. Spatial distribution of the urban pipe network.
Hydrology 12 00280 g004
Figure 5. Conceptual illustration of the coupling process in the 1D–2D coupled model.
Hydrology 12 00280 g005
Figure 6. Comparison between simulated and observed results for the rainfall events on 29 July 2024, and 11 September 2023.
Hydrology 12 00280 g006
Figure 7. Hyetography of the design storms with different return periods.
Hydrology 12 00280 g007
Figure 8. Spatial distribution of overflow nodes and pipe fill ratios under different rainfall return periods.
Hydrology 12 00280 g008
Figure 9. Increases in overloaded pipes, overflow nodes, and total overflow volume under different rainfall return periods.
Hydrology 12 00280 g009
Figure 10. Maximum surface water depth under different rainfall return periods.
Hydrology 12 00280 g010
Figure 11. Statistics of Box Culvert Discharge and Overflow under Different Rainfall Return Periods.
Hydrology 12 00280 g011
Figure 12. Relationship between box culvert overflow and available flood storage under different rainfall return periods.
Hydrology 12 00280 g012
Figure 13. Overflow and water accumulation in the moat for 10- to 50-year return periods.
Hydrology 12 00280 g013aHydrology 12 00280 g013b
Figure 14. Overflow volume at flooding points for 10- to 50-year return periods.
Hydrology 12 00280 g014
Figure 15. Area of water accumulation at flooding points for 10- to 50-year return periods.
Hydrology 12 00280 g015
Table 1. Manning’s Roughness Coefficients and Steady Infiltration Rates for Different Land Use Types.
Land Use TypeManning ValueSteady Infiltration Rate (mm/h)
Water Bodies0.0100
Roads0.0140
Woodland0.20037.55
Cropland0.04520
Buildings0.0140
Bare Land0.03019.43
Mixed-Use Land0.0255
Roofs0.0140
Table 2. Comparison of simulated and observed water depths for the rainfall events on 29 July 2024, and 11 September 2023.
Rainfall EventLocationNameObserved Water Depth (m)Simulated Water Depth (m)Relative ErrorAverage Relative Error
11 September 2023ATaiyi Road Interchange0.780.762.7%4.7%
BNanshaomen0.600.566.7%
29 July 2024ATaiyi Road Interchange0.700.6310.0%5.8%
BNanshaomen0.450.434.4%
CYouyi Road0.100.1033.0%
Table 3. Statistics of Pipe Network Performance under Different Rainfall Return Periods.
Return PeriodRainfall Volume
(×104 m3)
Total Drainage
(×104 m3)
Number of Pipes at Full CapacityProportion of Pipes at Full CapacityTotal Overflow NodesProportion of Overflow NodesTotal Overflow Volume (×104 m3)
1-year46.514.994938.85%2444.38%0.57
2-year87.3524.69153127.49%106419.11%9.95
5-year141.3328.41264447.48%214238.46%28.16
10-year182.1830.47318857.25%286251.39%58.66
20-year222.9931.72363765.31%334860.12%86.35
50-year276.9733.18401372.06%363665.29%93.29
Table 4. Operational Status of Box Culverts under Different Rainfall Return Periods.
Return PeriodBox Culvert Discharge (104 m3)Box Culvert Overflow (104 m3)Number of Overflow NodesProportion of Overflow Nodes
1-year14.380.0000.00%
2-year23.522.992319.49%
5-year24.899.666252.54%
10-year25.4712.567462.71%
20-year25.8516.948975.42%
50-year26.2119.919681.36%
Disclaimer/Publisher’s Note: The statements, opinions and data contained in all publications are solely those of the individual author(s) and contributor(s) and not of MDPI and/or the editor(s). MDPI and/or the editor(s) disclaim responsibility for any injury to people or property resulting from any ideas, methods, instructions or products referred to in the content.