Article

Current Trends and Future Scenarios: Modeling Maximum River Discharge in the Zhaiyk–Caspian Basin (Kazakhstan) Under a Changing Climate

1
Institute of Geography and Water Security, Seifullin Av. 458/1, Almaty 050004, Kazakhstan
2
Department of Meteorology and Hydrology, Faculty of Geography and Environmental Sciences, Al-Farabi Kazakh National University, Al-Farabi Av. 71, Almaty 050040, Kazakhstan
3
Institute of Agriculture and Natural Resources, University of Nebraska-Lincoln, 3550 E. Campus Loop, AGH 300, Lincoln, NE 68583-0708, USA
4
Bishkek State University Named After Academician Kusein Karasaev, Chyngyz Aitmatov Av. 27, Bishkek 720044, Kyrgyzstan
*
Authors to whom correspondence should be addressed.
Hydrology 2025, 12(11), 278; https://doi.org/10.3390/hydrology12110278
Submission received: 19 August 2025 / Revised: 17 October 2025 / Accepted: 22 October 2025 / Published: 24 October 2025
(This article belongs to the Section Water Resources and Risk Management)

Abstract

In the context of intensifying climate change, it is particularly important to assess the transformation of spring floods as a key phase of the hydrological regime of rivers. This study provides a comprehensive analysis of the characteristics of maximum runoff in the Zhaiyk–Caspian basin for the modern period and projected changes for 2030, 2040, and 2050 based on CMIP6 climate scenarios (SSP3-7.0 and SSP5-8.5). Analysis of observations at 34 hydrological stations showed a reduction in spring runoff by up to 35%, a decrease in the duration of high water and a reduction in maximum water discharge on some rivers by up to 45%. It has been established that those rising temperatures, more frequent thaws, and reduced autumn moisture lead to lower maximum water discharge and a redistribution of the seasonal flow regime. Scenario projections revealed significant spatial heterogeneity: some rivers are expected to experience an increase in maximum discharge of up to 72%, while others will see a steady decline in maximum discharge of up to 35%. The results obtained indicate the need to transition to an adaptive water management system focused on the regional characteristics of river basins and the sensitivity of small- and medium-sized watercourses to climate change.

1. Introduction

Assessing current changes in maximum river discharge and forecasting them under conditions of climate uncertainty is one of the key tasks of modern hydrology. In semi-arid regions such as the Zhaiyk–Caspian basin, maximum discharge accounts for the bulk (up to 80–90%) of annual discharge and occurs during the relatively short spring period [1,2,3,4]. Seasonal unevenness of runoff increases the region’s vulnerability to climate change and must be taken into account in water resource management and flood risk management.
Research on the impact of climate change on the hydrological regime of rivers, especially on changes in maximum runoff, is being conducted by scientists around the world [5,6,7,8,9,10]. Studies conducted in North America confirm that anthropogenic climate change contributes to increased precipitation intensity, which increases the likelihood of flooding [11]. Another study published in the journal Hydrology and Earth System Sciences analyzes the impact of climate change on 100-year floods in Bavaria, Germany. The results show an increase in the frequency and intensity of extreme floods, which is associated with rising temperatures and changes in precipitation patterns [12]. A global analysis conducted as part of the RheinBlick2050 project [13] assesses the impact of climate change on the flow of the Rhein River and its main tributaries. The results indicate an increase in winter water consumption and a decrease in summer consumption, which could affect water management and flood protection in the region.
Studies of river flow fluctuations caused by climate change in Russia [14,15,16,17] did not reveal any significant long-term trends in annual runoff, but the distribution of runoff within the year by season has changed significantly over the past decades. In particular, runoff during the winter low-water period has increased significantly. This increase was associated with a rise in the frequency of thaws, which led to frequent flooding during the winter low-water period, while spring runoff and floods from snowmelt decreased due to the depletion of water reserves in the snow before the spring season. According to scientific research [18], in recent decades, an increase in river runoff during the winter months has been observed in most catchment areas in the Baltic Sea basin, while pronounced negative trends have been identified in the spring and summer months. Similar seasonal changes in runoff are also observed in the Ural River basin in Russia. The results of an analysis of long-term variability confirm the trends toward a decrease in spring floods and a simultaneous increase in winter runoff, which is associated with an increase in the frequency of thaws and changes in precipitation patterns [19,20]. Scientific studies [21] emphasize that a modern trend of transformation of the intra-annual distribution of runoff is observed in the Ural River basin: the share of low-flow (especially winter) runoff is increasing, and the contribution of spring floods is decreasing [22]. This leads to a levelling of the annual hydrograph and a change in the water regime of Kazakh-type Rivers. These seasonal changes exacerbate hydrological instability and increase the likelihood of extreme floods. A particularly striking example was the flood situation in the spring of 2024 in the Zhaiyk River basin [23,24,25]. Early snowmelt combined with heavy precipitation led to large-scale flooding that affected the border areas of Russia and the western regions of Kazakhstan. According to ReliefWeb and ACAPS, tens of thousands of people were evacuated in Kazakhstan and Russia during the spring floods of 2024, hundreds of settlements were flooded, and a state of emergency was declared in 10 regions of Kazakhstan [26,27]. Scientific studies [28,29] confirm that extreme runoff values are intensifying due to changes in climatic conditions, including early snowmelt, increased winter precipitation, and rising air temperatures. These processes exacerbate the risks of both floods and droughts, making it necessary to transition to more accurate scenario-based water resource forecasting using new-generation climate models such as CMIP6.
Scenario-based forecasting of maximum runoff using CMIP6 ensembles allows for consideration not only of climate trends, but also of a wide range of uncertainties associated with socio-economic trajectories and greenhouse gas emissions [30,31,32]. CMIP6 provides extensive opportunities for analyzing climate parameters in various socio-economic development scenarios, ranging from moderate (SSP1) to high emissions (SSP5). However, GCM results need to be adapted to the regional scale through correction methods, as the models have relatively low spatial resolution and do not always reproduce local features of runoff formation [33]. To obtain high-resolution source data, statistical and dynamic downscaling methods or a hybrid of both are used [34,35].
In this regard, dynamic downscaling of global GCMs is a critically important tool for improving the accuracy of regional climate projections in conditions of complex orography and high spatial heterogeneity of climate processes characteristic of the region. This is especially true for the reproduction of extreme convective precipitation, which is sensitive to detailed orographic and thermodynamic contexts. Despite certain systematic errors in dynamic downscaling, it provides physically consistent regional estimates, enabling high-quality climate data describing the entire range of climate variables with a high degree of reliability. Among all these international climate databases, only the Inter-Sectoral Impact Model Intercomparison Project (ISIMIP) (https://www.isimip.org/) currently provides modeling results that have undergone dynamic downscaling based on CMIP6 scenarios for the Central Asian region [36]. As part of this initiative, CMIP6 climate models were further calibrated to account for regional orography and climate conditions, providing more reliable and applicable assessments for our region. This approach improves the accuracy of climate risk assessments, facilitates the development of adaptation measures, and provides a reliable basis for climate-informed decision-making at the regional level. These advantages are confirmed by the results of the analysis presented in the study [36], which shows that the application of dynamic resolution downscaling to ISIMIP data significantly improved the accuracy of precipitation reproduction compared to the original CMIP6 models. In addition, the study demonstrates that the adjusted data more accurately reflect key climate trends, such as temperature increases and changes in precipitation patterns in Kazakhstan and thus provide a reliable basis for climate projections in regions with complex orography.
To assess future climate change in the Kazakh part of the Zhaiyk–Caspian basin, high-resolution climate data with a spatial resolution of 0.25° × 0.25° and dynamically downscaled CMIP6 models from the third phase of ISIMIP were used within two socio-economic pathways (SSP3-7.0 and SSP5-8.5) [37].
In scenario-based forecasting of maximum runoff, changes in seasonal precipitation and temperature patterns play a key role, as climatic conditions in autumn, winter, and spring largely determine future runoff formation. The controlling factors can be grouped into two categories: relatively constant physiographic factors (basin size, relief, geological structure, soil composition, vegetation, and anthropogenic influences) and hydrometeorological factors (snow water reserves, snowmelt intensity, autumn soil moisture, soil freezing, evaporation, and precipitation). These variables determine the volume, timing, and peak discharge of spring floods, as well as the shape of the hydrograph [38,39,40].
The objective of this study is to analyze the current trends in maximum spring flood discharge across the rivers of the Zhaiyk–Caspian basin and to develop scenario-based forecasts of its potential changes under future climate change conditions. The research aims to improve the understanding of hydrological responses to climatic variability and to support the adaptation of water management practices in the region. The scenario forecast is carried out for three-time horizons: 2030 (2026–2035), 2040 (2036–2045), and 2050 (2046–2055). The period 1991–2020 was selected as the base period. The scientific novelty of this study lies in the comprehensive assessment of climatic factors influencing the formation of spring runoff using a scenario-based approach. The practical significance of the results is determined by their applicability for long-term water management planning, adaptation to climate risks, and the sustainable management of water resources in the studied region.

2. Materials and Methods

2.1. Study Area

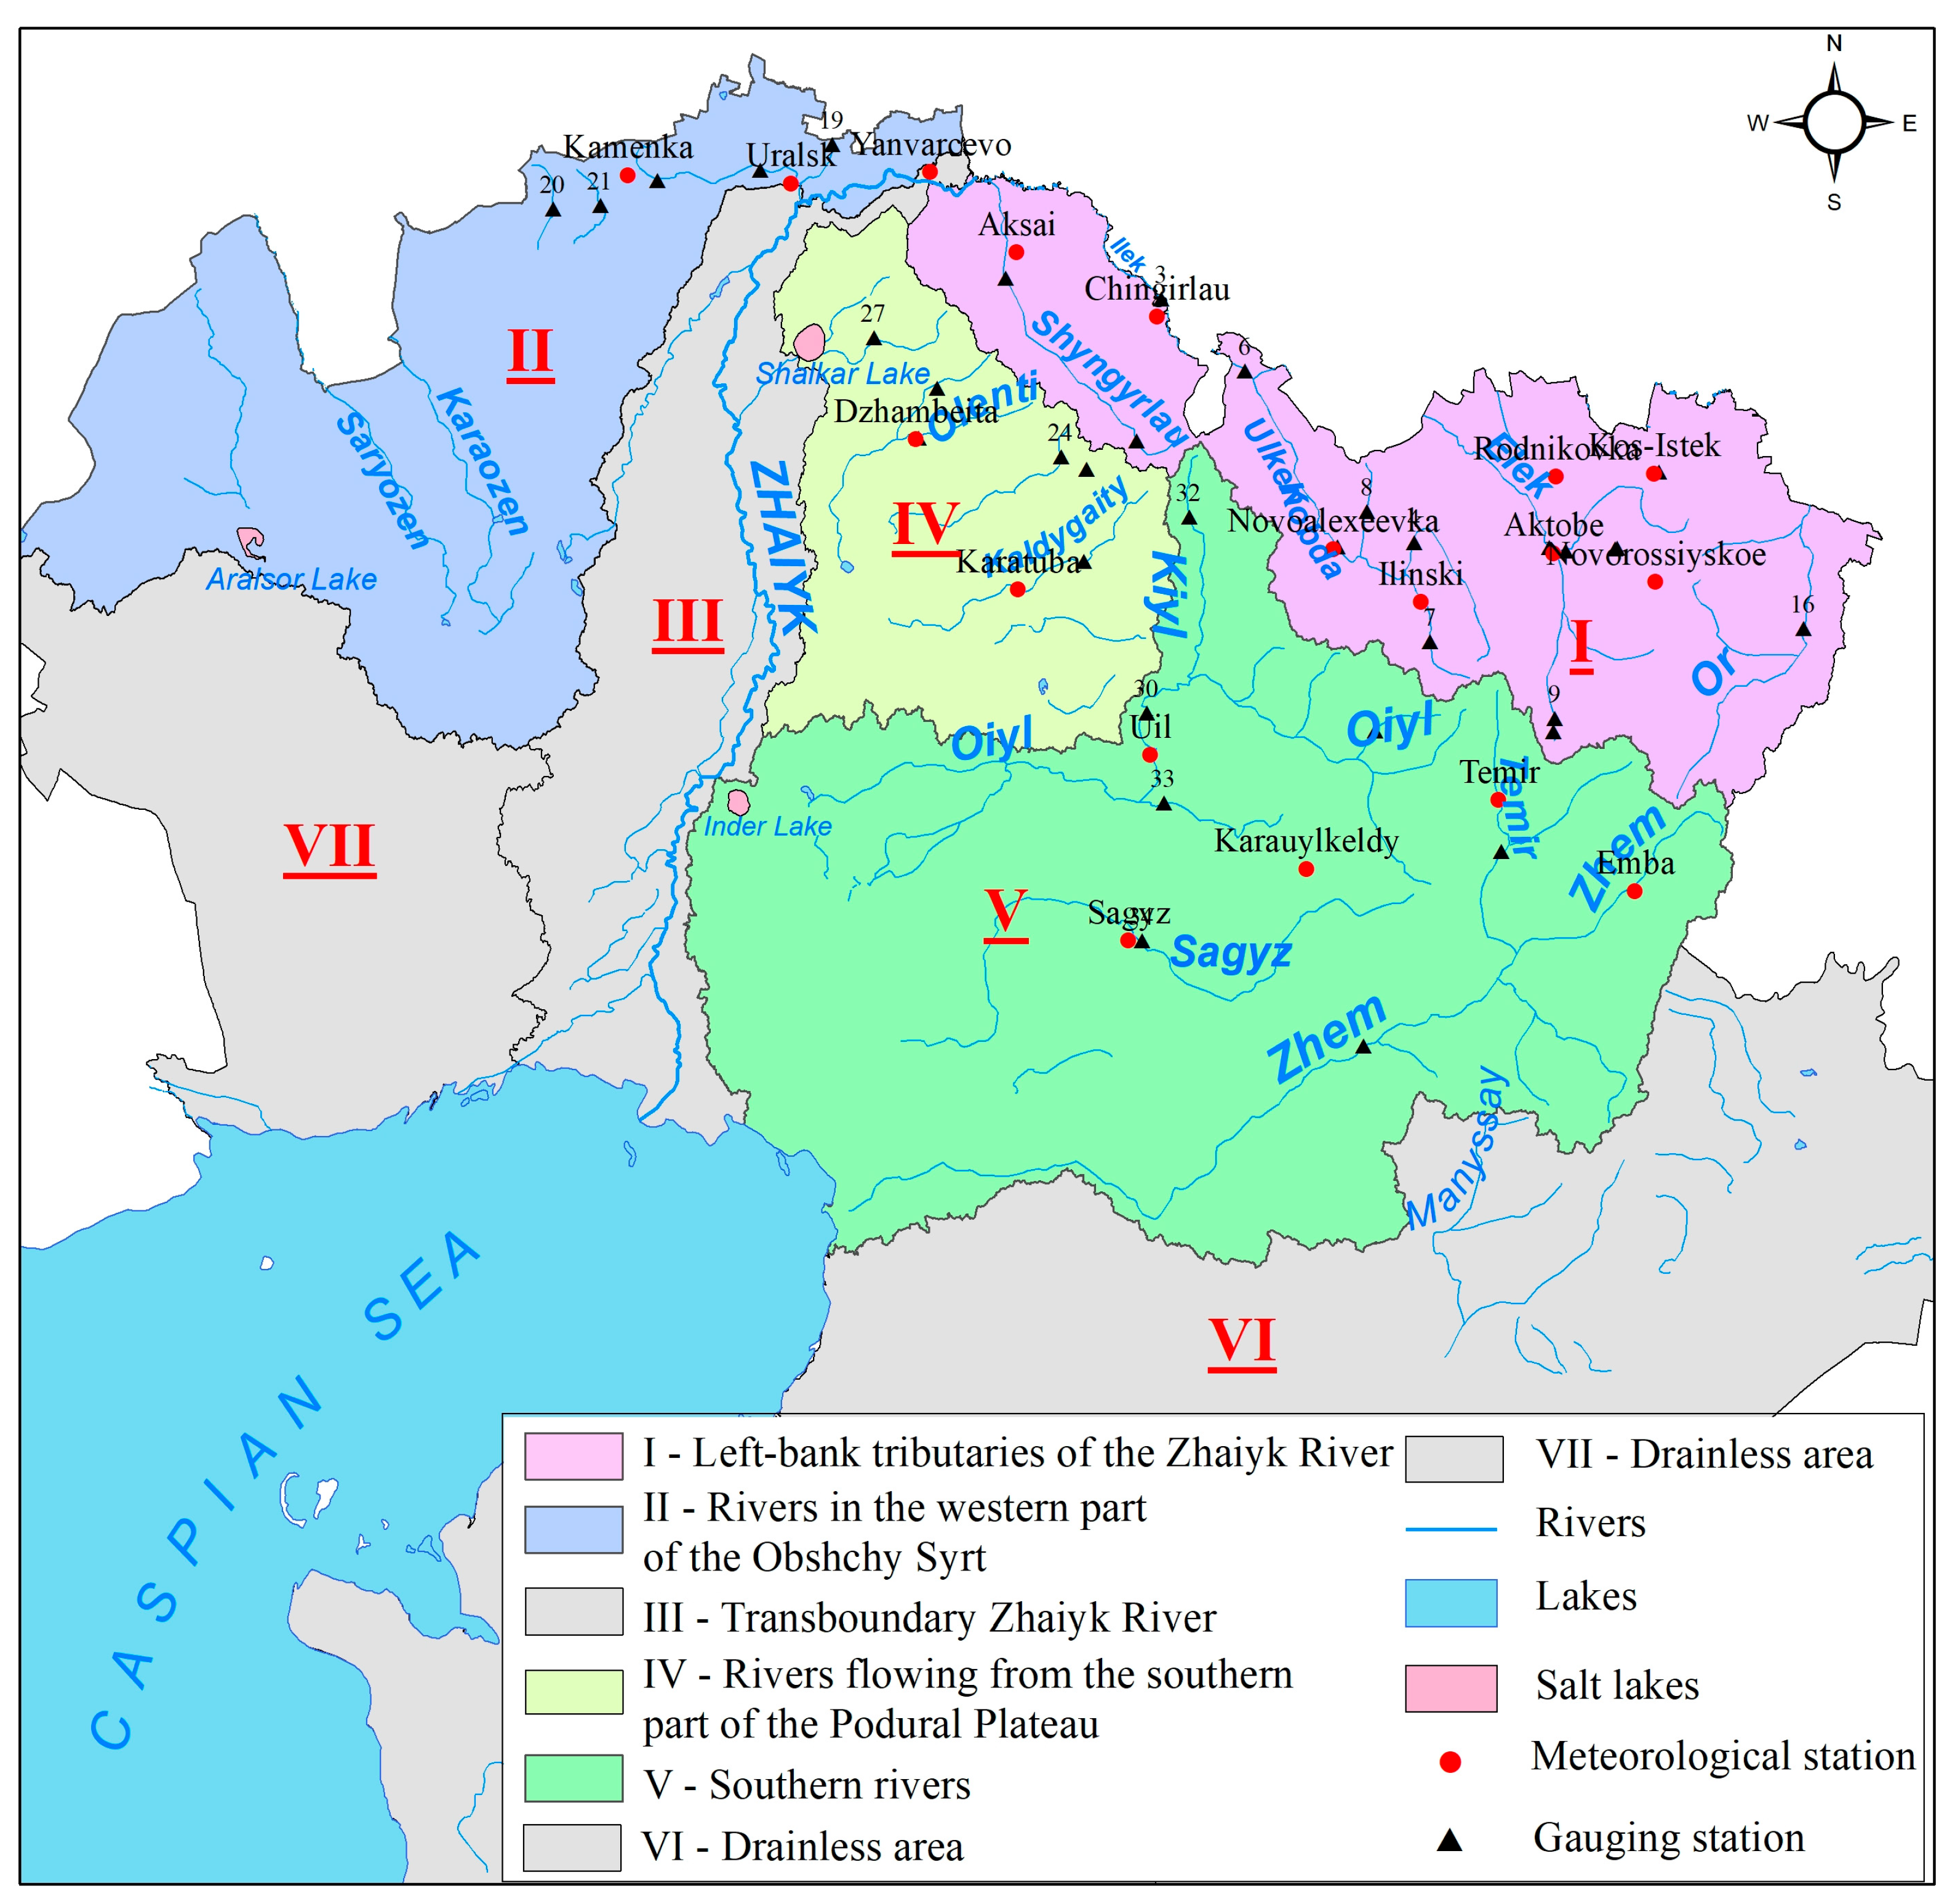
The distribution of the river network in the Zhaiyk–Caspian basin is determined by the presence of the Caspian Sea in the southwest and the mountainous formations of the Southern Urals in the northeast, which is why the rivers flow in a general direction from northeast to southwest. There are more than a hundred rivers (temporary watercourses) in the basin under consideration, including 12 rivers with a length of more than 200 km. The main river is the Ural (Zhaiyk), with a total length of 2534 km. The river is formed in the Russian Federation, originates in the Southern Urals, and flows into the Caspian Sea. The length of the river within the Republic of Kazakhstan is 1084 km (Figure 1) [2].
The main focus of this study is on the assessment of changes in the spring flood and its hydrological characteristics. The spring flood represents the dominant phase and a distinctive feature of the river flow regime within the Zhaiyk–Caspian basin, accounting for 70–90% of the total annual runoff. According to the classification proposed by B.D. Zaikov [41], the rivers of the basin mainly belong to the Kazakhstan type of hydrological regime, which is characterized by a single, sharp, and short flood wave caused by the melting of the seasonal snow cover. After the flood peak, during the summer–autumn period, the river discharge significantly decreases, and in some cases, smaller rivers may temporarily dry up. The peak of the spring flood generally occurs in April–May, consistent with the natural and climatic conditions of the region.
The location of the Zhaiyk–Caspian basin inland, far from oceans and high mountain systems, causes a continental, arid climate on its territory, characterized by a high amplitude of diurnal and seasonal temperatures, a small amount of unevenly distributed precipitation, high solar radiation, and relatively low humidity. The climatic conditions of the basin largely determine the features of river flow formation, including the dominance of snowmelt-fed spring floods typical of rivers of the Kazakhstan type. The distribution of air temperature over the territory of the Zhaiyk–Caspian basin as a whole has a zonal character and changes from north to south. The average annual air temperature varies from 2.8 °C in the north-east to 12 °C in the south of the territory under consideration. The intra-annual course of air temperature is characterized by stable frosts in winter, intense heat build-up in short periods and hot summers. The diversity of landforms and atmospheric processes occurring over the territory under consideration cause significant variability in precipitation. The average annual precipitation varies from 150 to over 400 mm, with the least precipitation falling on the Ustirt Plateau and the southern edges of the Mangystau Peninsula [3].

2.2. Input Data

In this study, official hydrological data from 34 hydrological observation posts and meteorological data on air temperature and atmospheric precipitation from 17 meteorological stations were used to analyze contemporary changes in the maximum flow of rivers in the Zhaiyk–Caspian basin (Figure 2, Table 1 and Table 2). The source data covers the entire period of instrumental measurements up to and including 2022. All data were obtained from open sources of the Kazhydromet State Agency, available on its official website: https://www.kazhydromet.kz/ru/gidrologiya (accessed on 5 May 2025).
To analyze the dynamics of spring floods, annual data on the following key parameters were used: spring runoff volume, maximum water discharge, start and end dates of the flood, and its duration. The data was processed for two time periods: from the beginning of instrumental observations until 1973 and the modern period from 1974 to 2022. This division is based on the fact that the 1970s are recognized as the onset of the modern stage of climate change, accompanied by pronounced warming trends and a transformation of the hydrological regime in the region [2].
To ensure comparability between these periods and to reveal patterns of long-term variability, data from key hydrological gauging stations with long observation series (starting from the 1940s) were used. These stations, located across different hydrological regions, are representative of the general trends in spring flood formation. In cases where observation series contained gaps or interruptions, missing peak discharge values were reconstructed using the hydrological analogy method. Gauging stations with shorter observation periods were mainly used for scenario-based forecasting, which allowed for a wider spatial coverage and consideration of the recent dynamics of river discharge under changing climatic conditions.
The study used data from natural or semi-natural regimes in the following hydrologically homogeneous areas:
I—left-bank tributaries of the Zhaiyk River (Or, Elek, Ulken Kobda, Shyngyrlau, Kargaly, Kosestek, Aktasty, etc.);
II—rivers in the western part of the Obshchy Syrt (Shagan, Derkul, Shyzhyn 1, Shyzhyn 2);
IV—rivers flowing from the southern part of the Podural Plateau (Olenty, Kupirankaty, Buldurty, Shiderty);
V—southern rivers (Oyil, Sagyz, Zhem).
The area of the transboundary Zhaiyk River (III), as well as Areas VI and VII classified as drainless territories, were not included in the analysis.
CMIP6 climate models were used in the study of long-term scenario projections of maximum runoff. The ISIMIP projection uses datasets based on five models from the Climate Model Intercomparison Project Phase 6 (CMIP6), identified as “priority” within the Inter-Sectoral Project on Climate Impacts [42] to cover the diversity of climate sensitivity and provide a diverse set of projections for impact modeling:
GFDL-ESM4 (NOAA Geophysical Hydrodynamics Laboratory, USA);
IPSL-CM6A-LR (Pierre-Simon Laplace Institute, France);
MPI-ESM1-2-HR (Max Planck Institute for Meteorology, Germany);
MRI-ESM2-0 (Meteorological Research Institute, Japan);
UKESM1-0-LL (Hadley Centre for Meteorological Forecasting, United Kingdom).
This limited number of models was selected to take into account the diversity of climate scenarios and uncertainties on the one hand, and to meet the limitations of computing resources and the volume of data to be processed on the other. The five selected models reliably reproduce the average climate response of the entire CMIP6 ensemble, making them a sufficient basis for assessing climate impacts without the need to use all models.
Three models (GFDL-ESM4, IPSL-CM6A-LR, and MPI-ESM1-2-LR) have low climate sensitivity, while two (UKESM1-0-LL and MRI-ESM2-0) have high climate sensitivity, providing a balanced representation of the CMIP6 ensemble. In addition, these models were selected for their structural independence in ocean and atmospheric components. Their representations of processes have been recognized as reliable by climate impact modeling experts. Furthermore, their selection is consistent with previous ISIMIP phases, ensuring consistency and comparability with previous studies.

2.3. Research Methods

Hydrometeorological calculations and statistical analyses were performed using the standard software packages MS Excel 2021 and Statistica 12.0. Observation series containing missing data were reconstructed using the hydrological analogy method, which is a widely accepted and established approach in hydrological research [43,44,45]. In cases of short observation periods or unrepresentative data, the time series were adjusted relative to a representative reference period.
Reconstruction of Maximum Discharge Series. The main focus of the study was on the analysis of changes in spring floods and their characteristics. To assess current changes in maximum spring discharge, quasi-natural series of maximum runoff were reconstructed for representative gauging stations, taking into account climatic factors. When filling data gaps, analogous rivers and nearby meteorological stations located within the flow formation zone were selected [43,44]. In cases where river basins were influenced by human activity, the river flow corresponding to the natural regime was restored in order to separately identify the contribution of climatic and anthropogenic factors.
Time series analysis. When studying the internal dynamics of time series, it is necessary to identify trends in changes in the maximum flow time series in the form of a linear or parabolic trend. Based on the type of trend with a certain degree of reliability, it is possible to forecast the time series for the long term [46]. To estimate a linear trend, it is proposed to use the least squares method for independent observations [47,48,49]. The regression equation in the case of linear dependence is
y i = a × x i + b
where a is the linear trend coefficient characterizing the rate of change in the studied variable; x i is time, year; b is the level of the series at the initial moment of time.
The essence of the least squares method is to determine the calculated parameters and at which the sum of the squares of the deviations of the observed values from the calculated value using the formula will be minimal.
Methods for assessing scenario-based forecasting of maximum runoff based on statistical analysis. A statistical model—multiple linear regression—was used for scenario forecasting of maximum runoff volume. Statistical analysis methods allow us to investigate the relationships between climate variables (temperature, precipitation) and maximum runoff, as well as to predict possible changes in runoff in the future. Meteorological parameters selected on the basis of both physical and geographical representations of flood formation processes and the results of correlation analysis were used as predictors. Significant predictors were selected based on their degree of correlation with spring runoff volumes. The following meteorological factors were found to be the most significant:
total precipitation during the cold period (September–March), reflecting the degree of autumn soil moisture and snow accumulation ( P I X I I I );
average air temperature in the period from June to October, determining the water absorption capacity and evaporation losses of the soil layer ( T V I X );
average winter temperature, affecting the frequency of thaws and the intensity of early snowmelt ( T X I I I I ).
The calculation scheme for maximum runoff is shown in Table 3.

3. Results

3.1. Contemporary Changes in the Characteristics of Spring Floods

Spring flood volume. Spring flood volume is the main indicator characterizing the total water discharge in a river during the flood period. Long-term changes in the spring flood discharge of rivers in the studied basin are characterized by certain spatial differences. During the modern period (1974–2022), a reduction in the volume of spring floods has been observed across virtually the entire territory. On average, the volume of floods in the basin’s rivers has decreased by 5% to 35%.
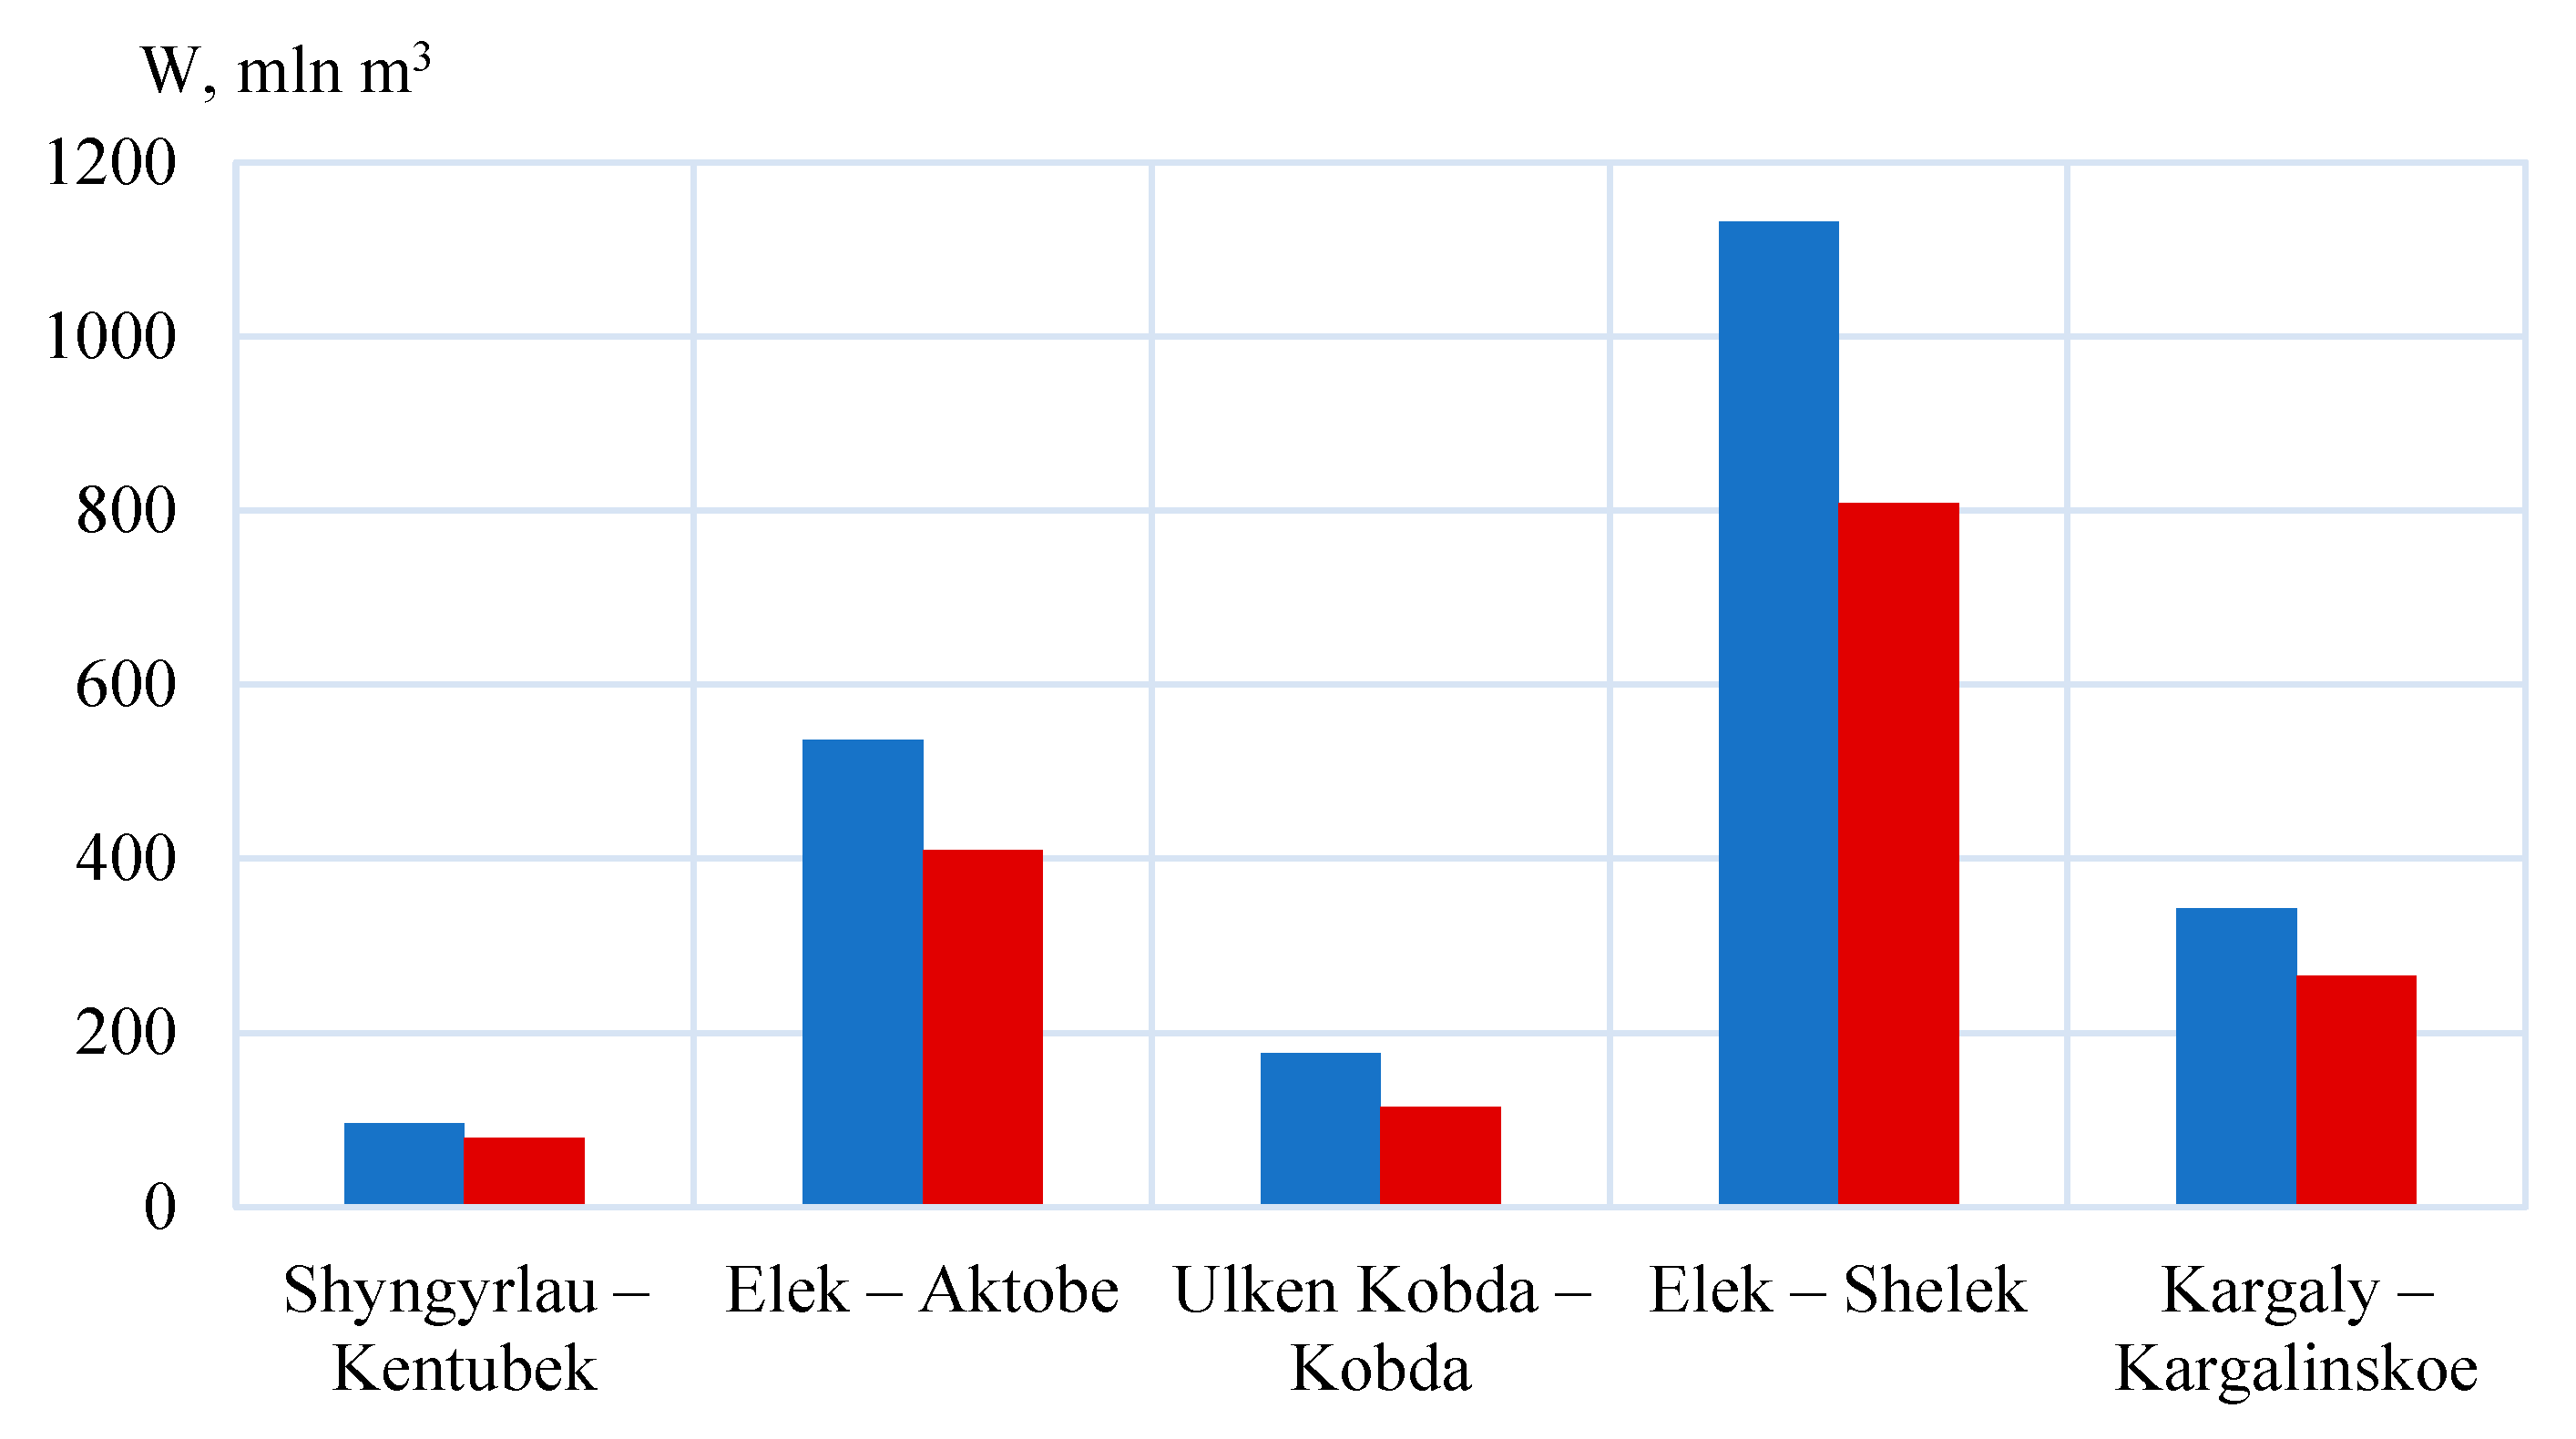
The left-bank tributaries of the Zhaiyk River (Or, Elek, Ulken Kobda, Shyngyrlau). Rivers in this hydrological region are characterized by the greatest reduction in runoff during the modern period (1974–2022) compared to the period before 1973, with an average reduction of 20–30%. The most obvious change in flood discharge is observed for the Ulken Kobda River (a decrease of 35%) and the Elek River (25–30%) (Figure 3).
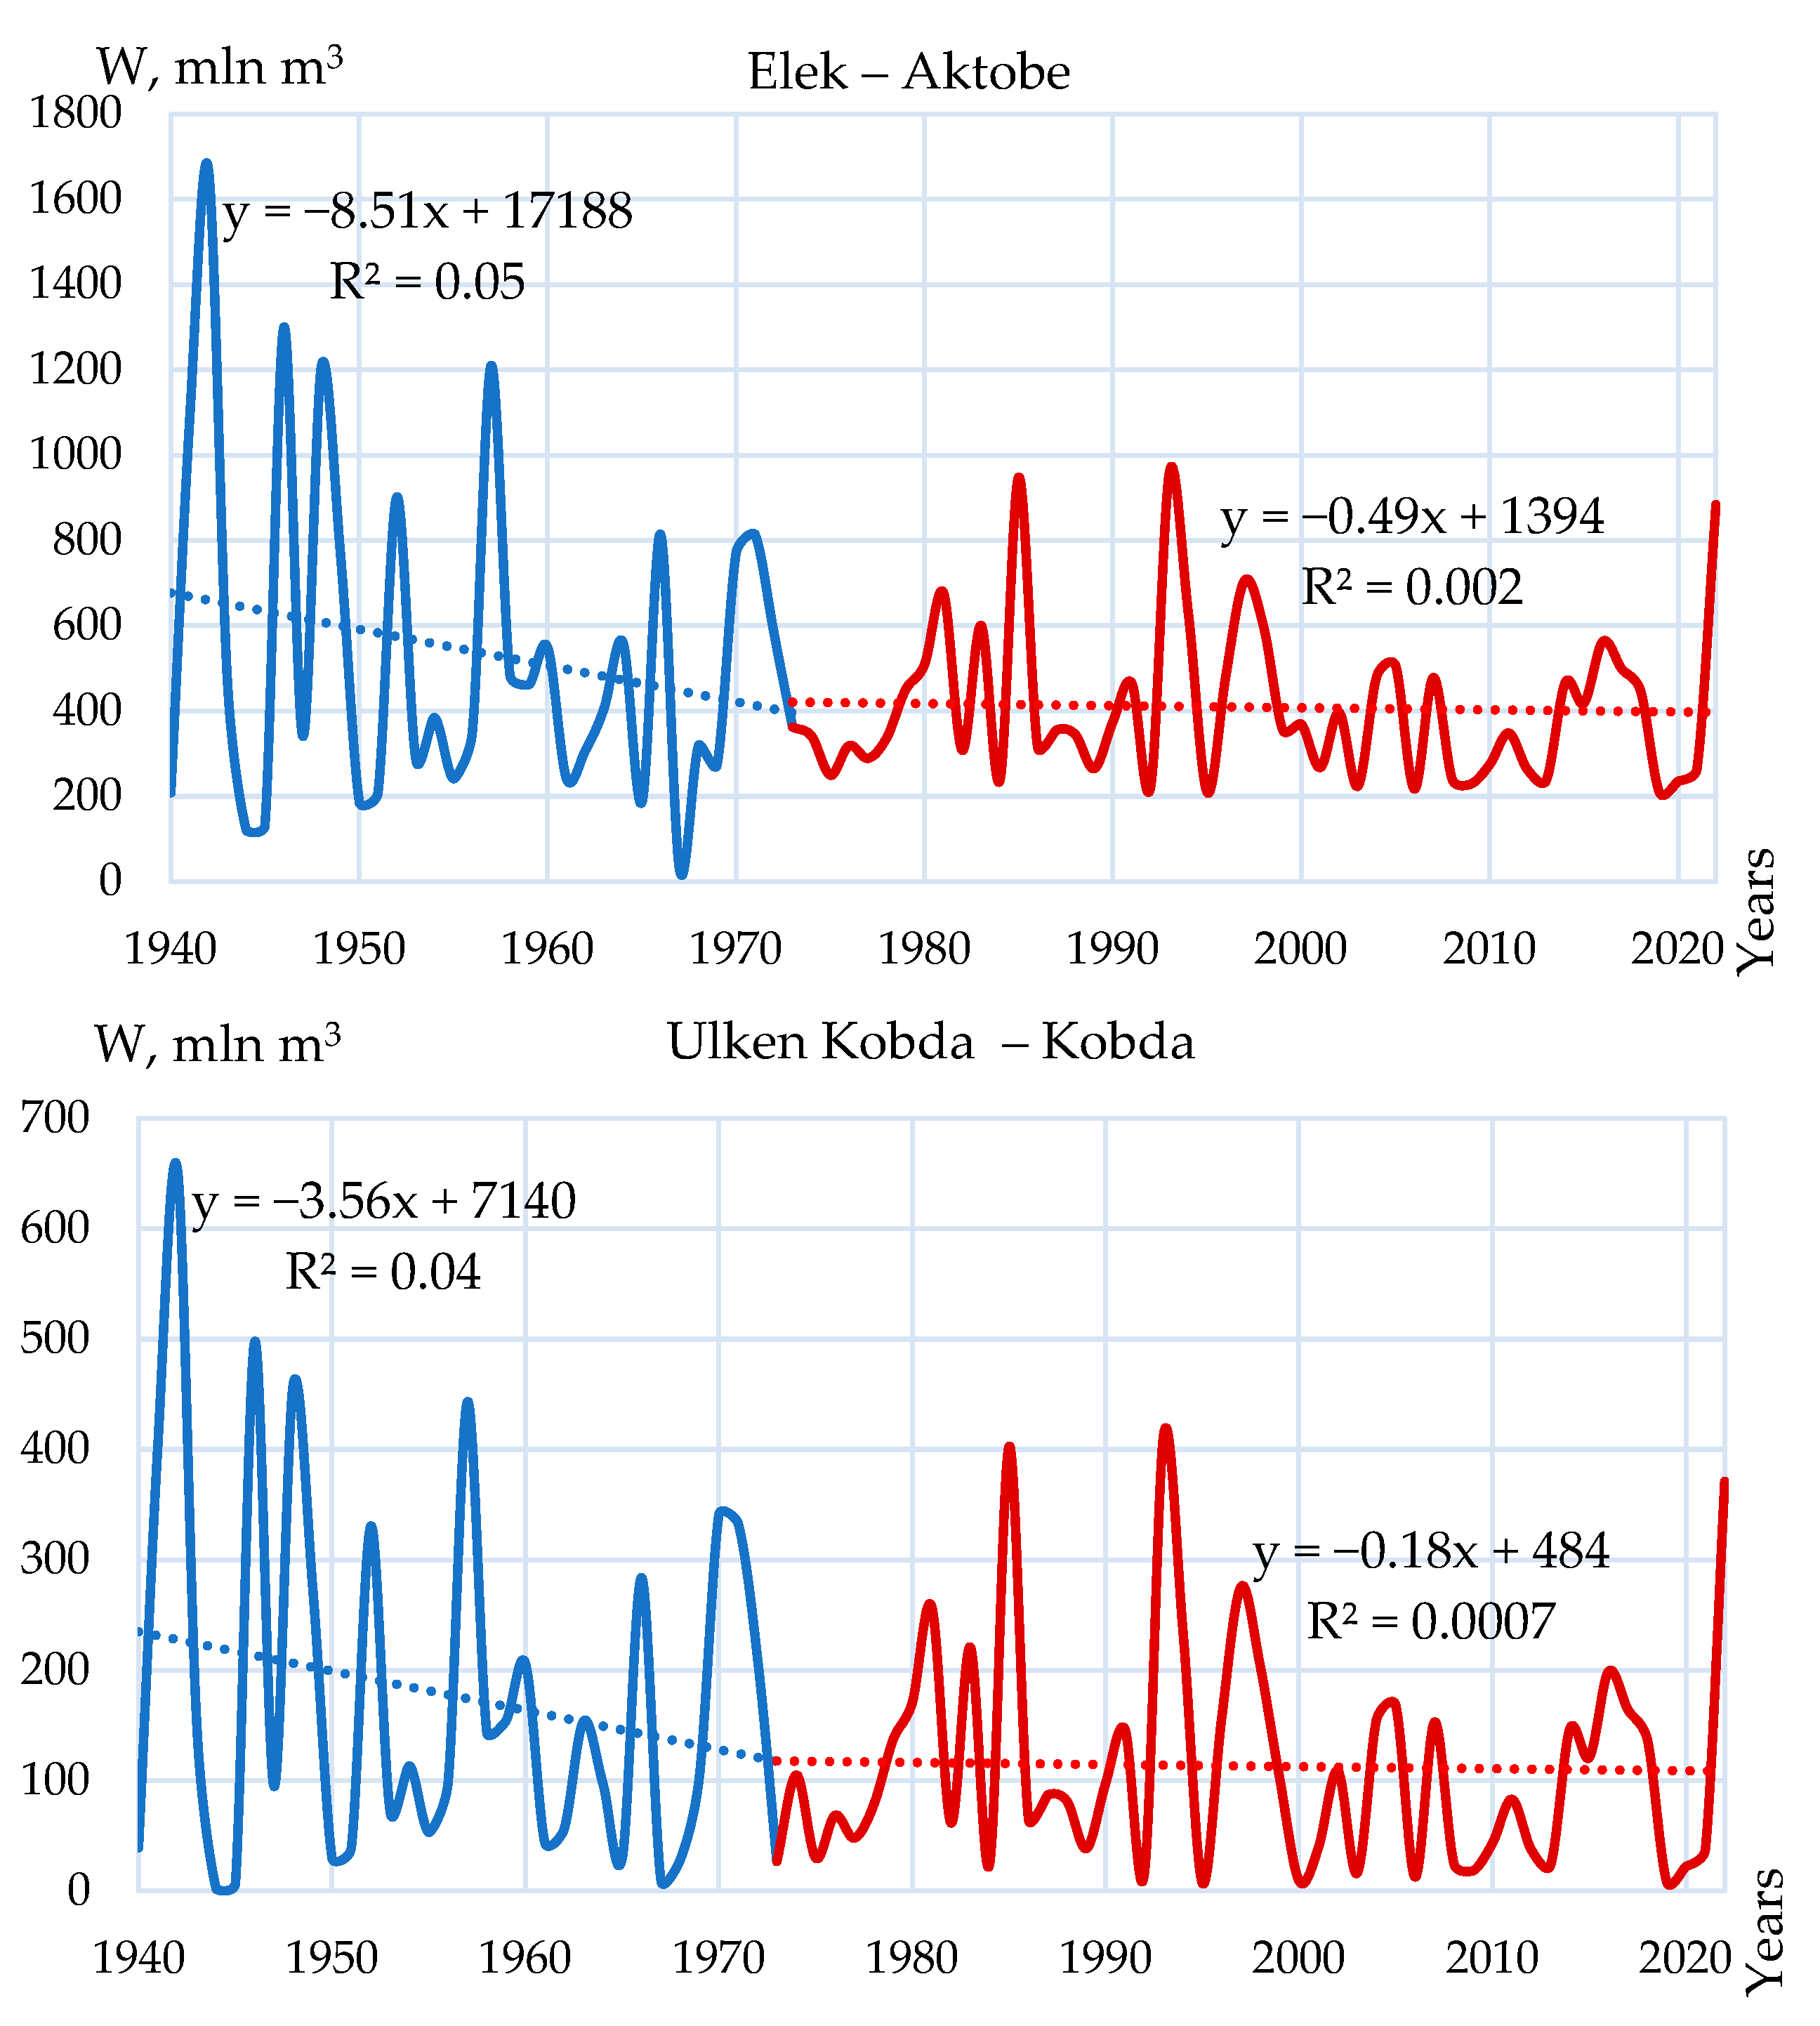
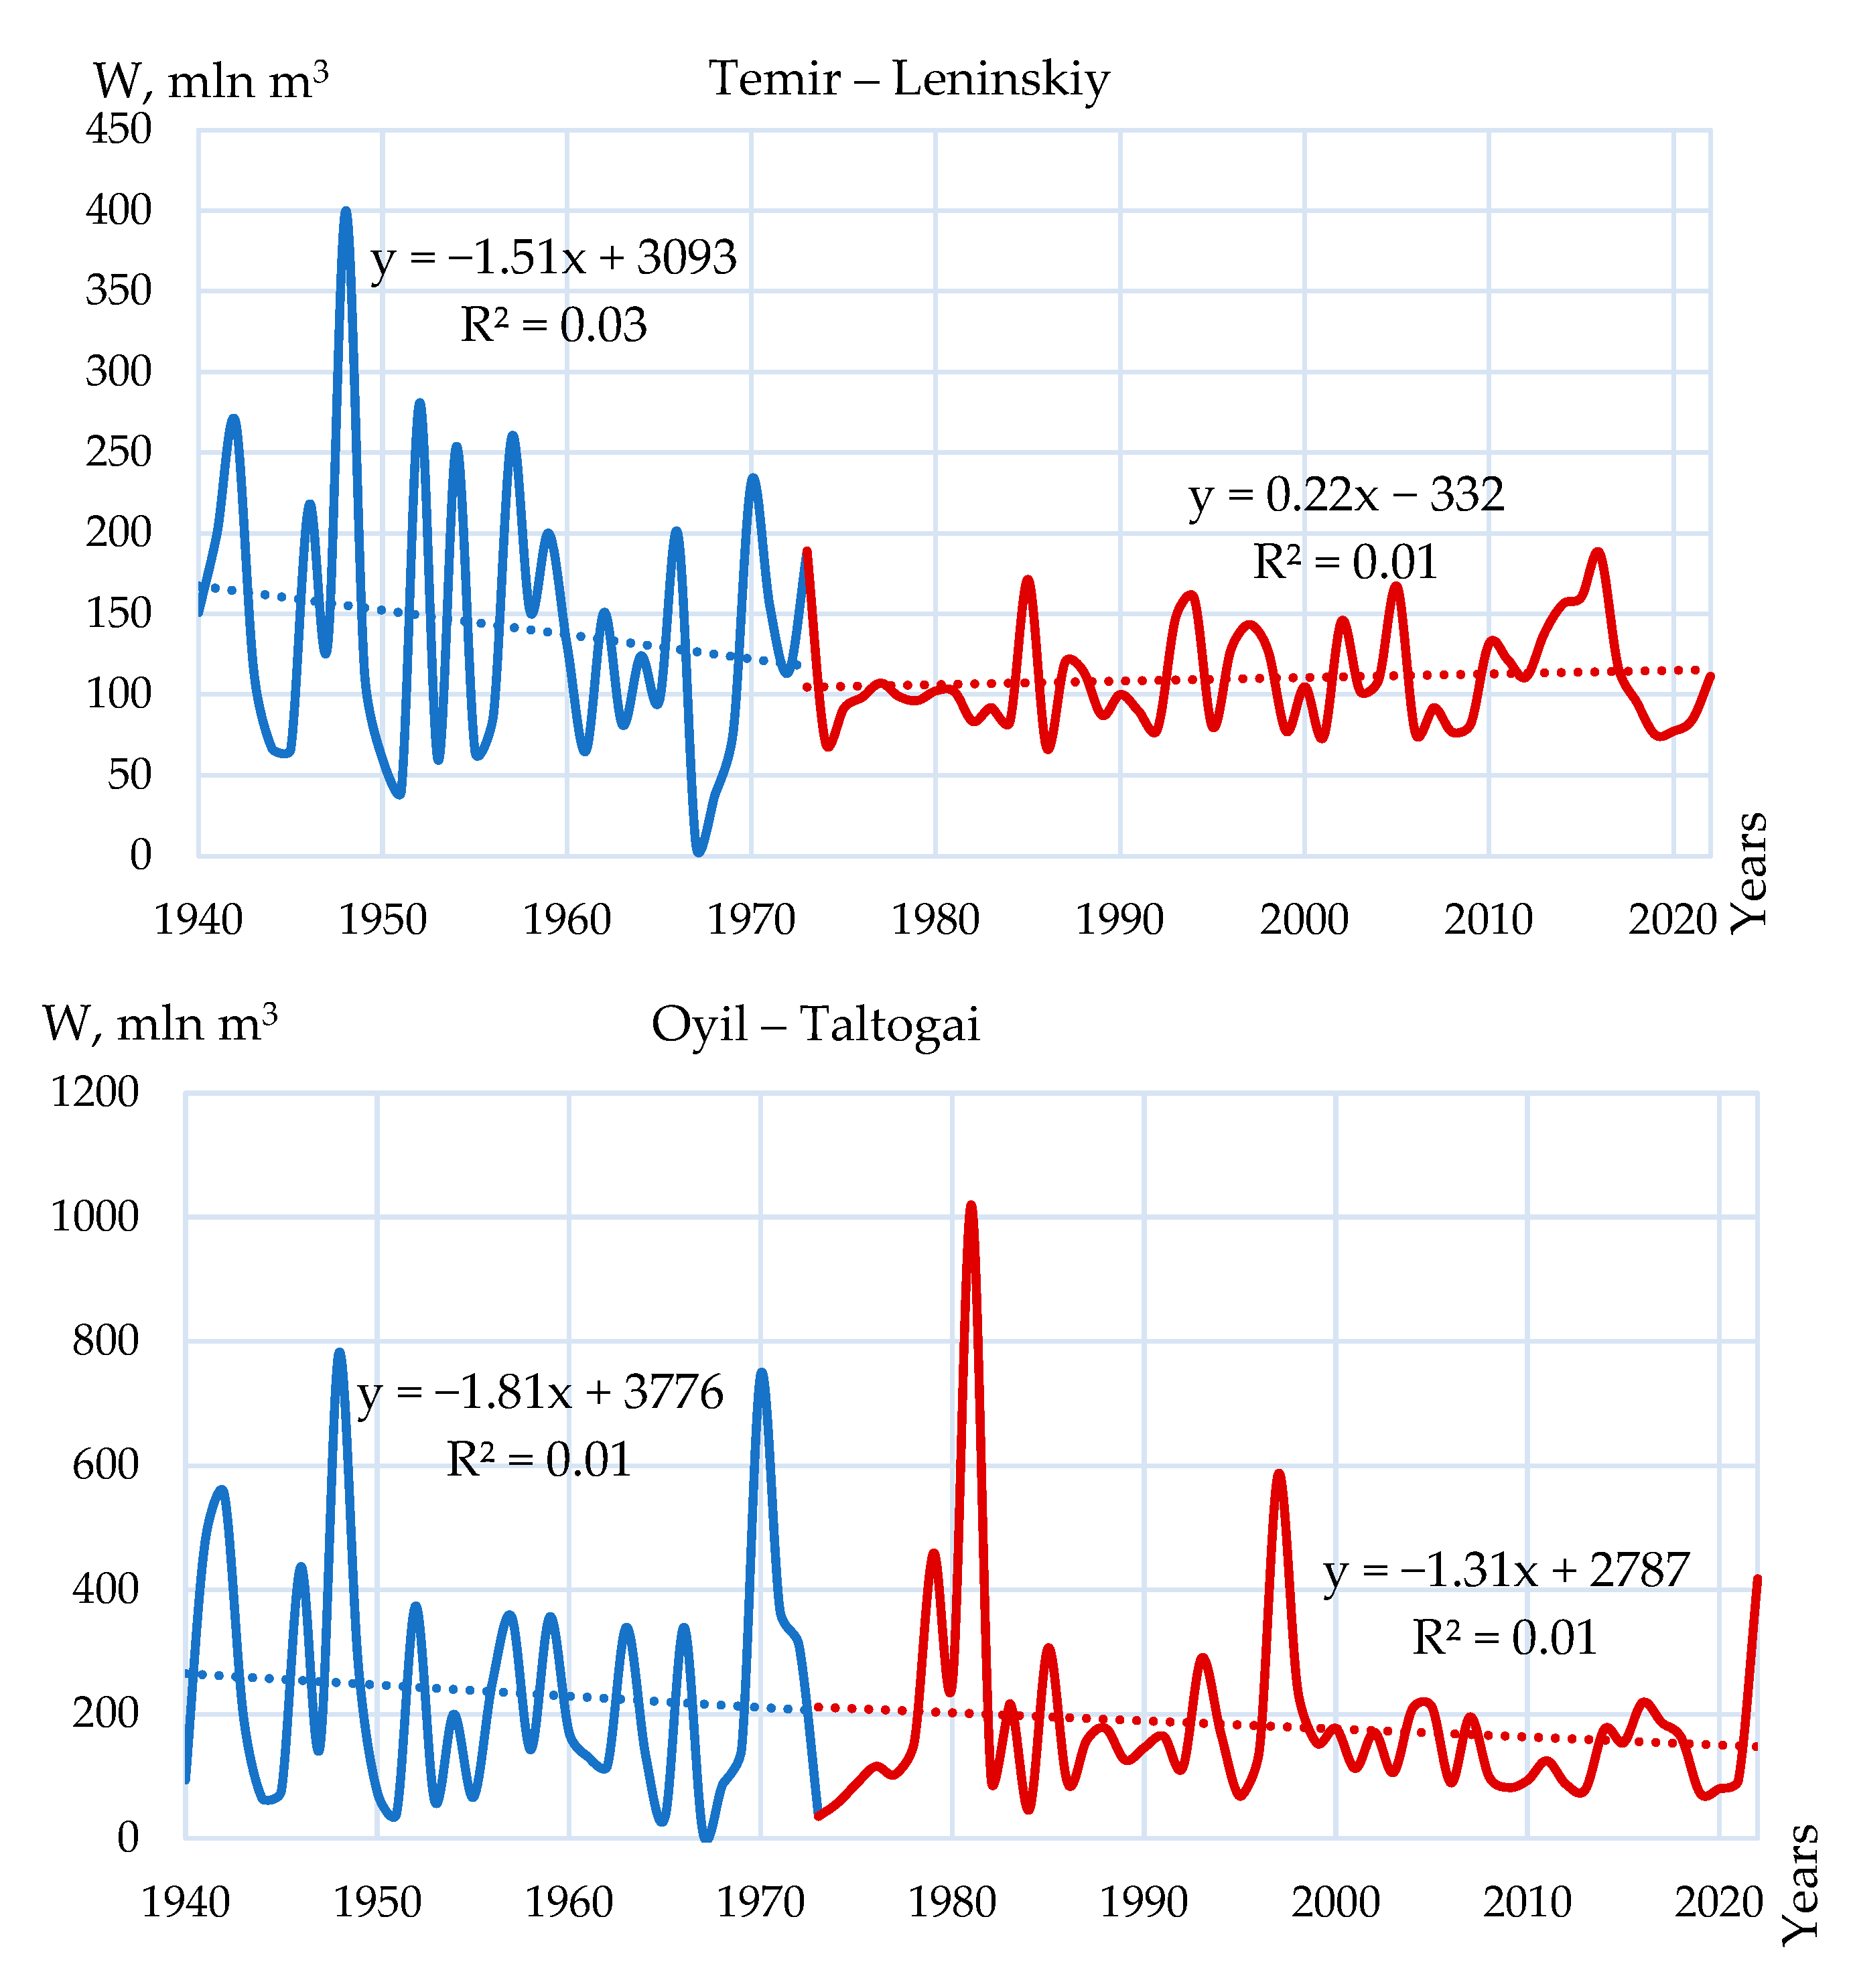
A study of the long-term dynamics of changes in the volume of spring floods has shown that before 1973, the decrease in spring runoff was more intense, while in the period of 1974–2022, along with a sharp decrease in the volume of spring runoff, the rate of decrease and the amplitude also decreased. For example, for the Elek River in Aktobe, the rate of decrease was 85.1 million m3/10 years until 1973, and 4.9 million m3/10 years during the period 1974–2022—4.9 million m3/10 years, for the Ulken Kobda River—Kobda village, before 1973—35.6 million m3/10 years, for the period 1974–2022—1.8 million m3/10 years (Figure 4).
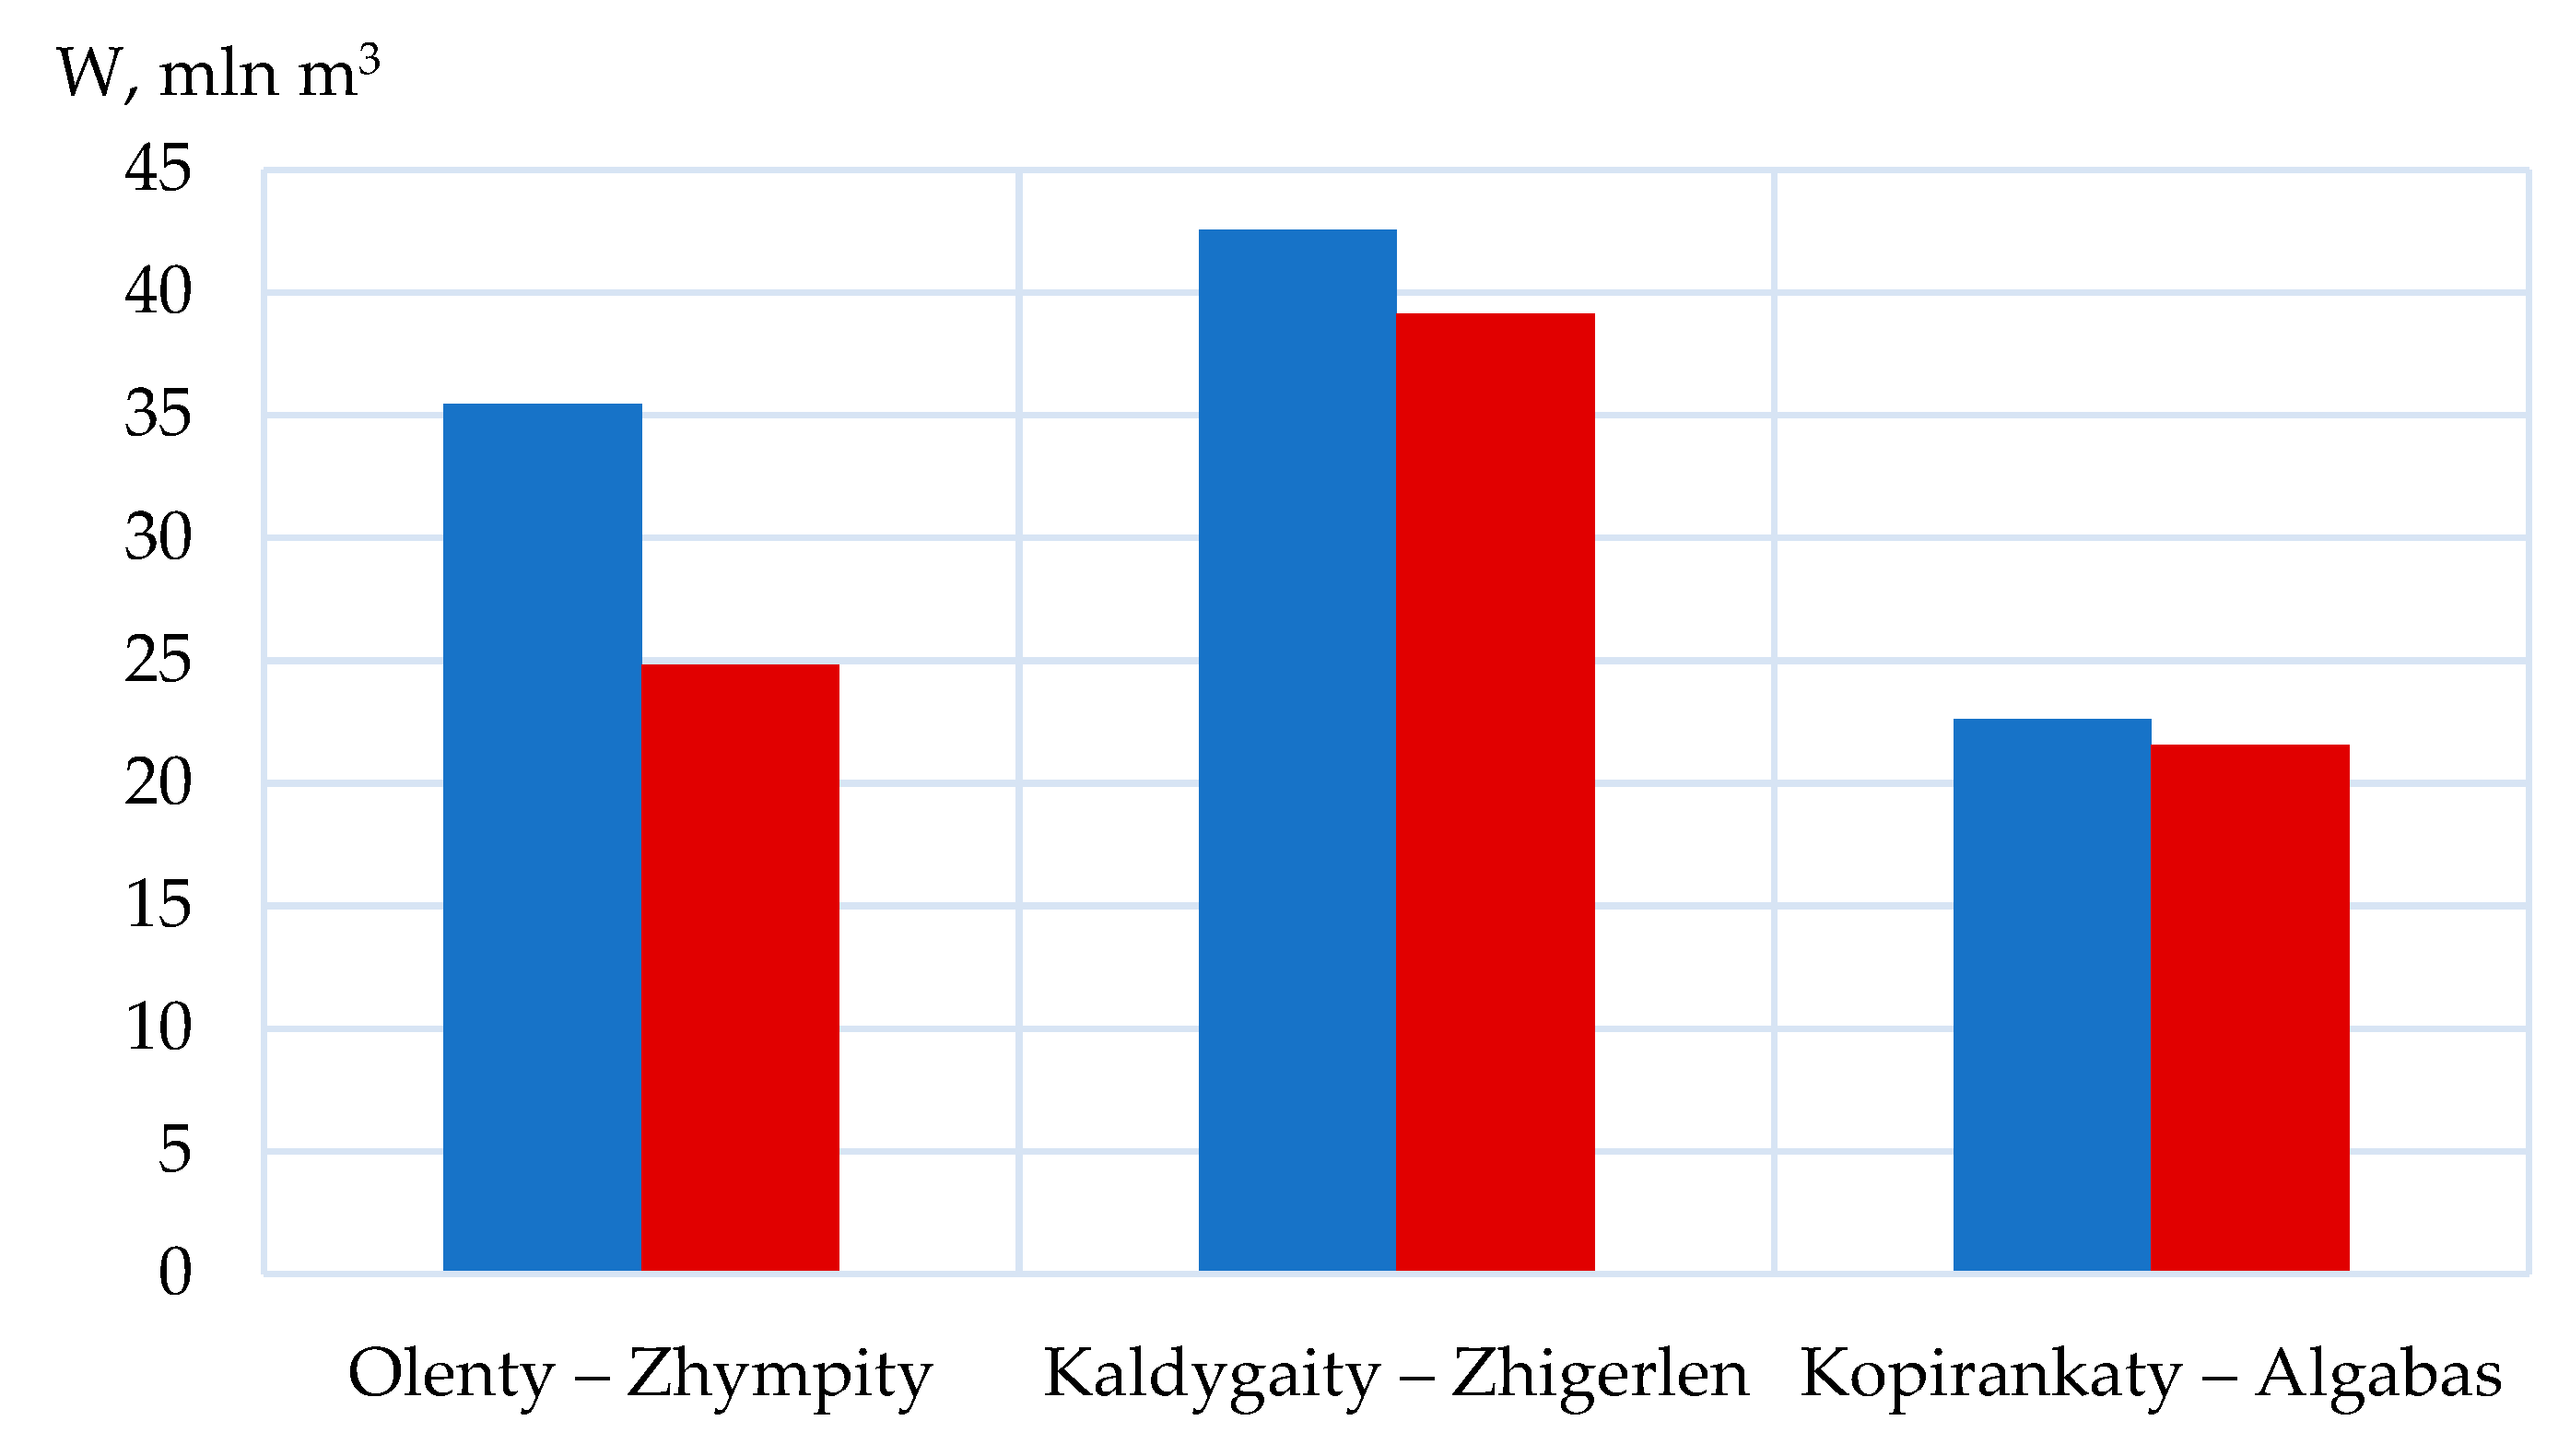
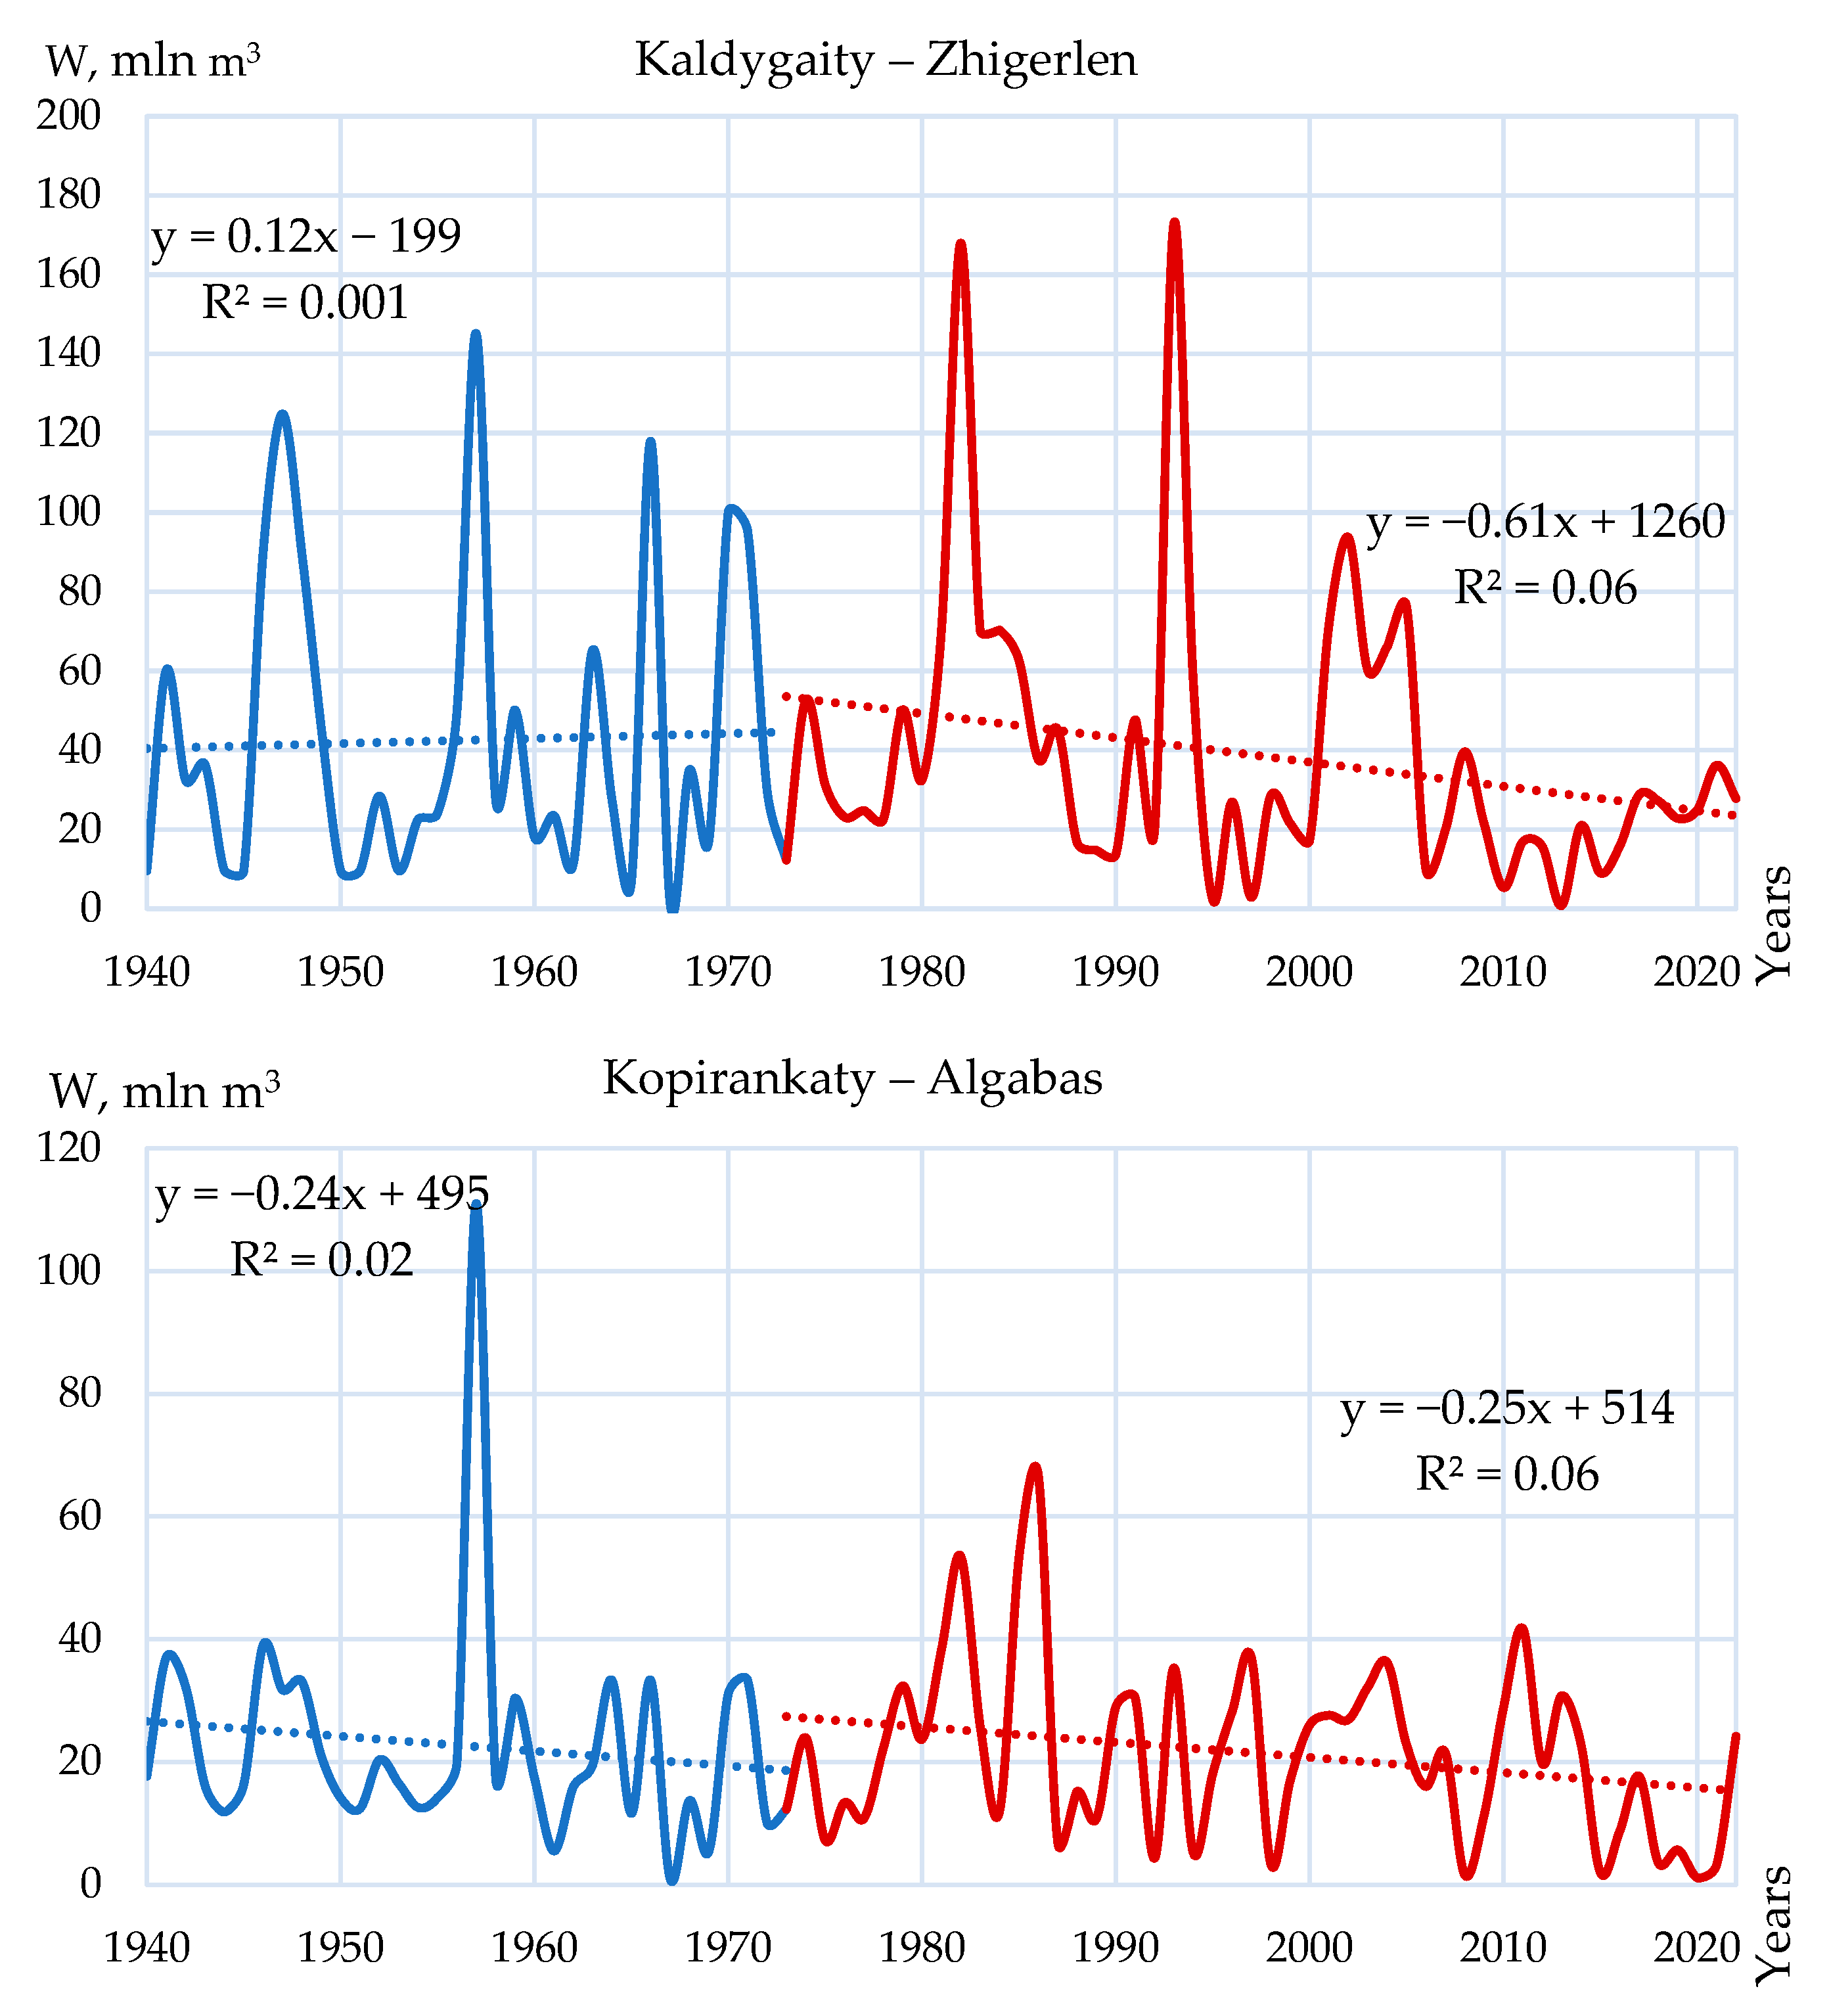
Rivers in the eastern part of the Caspian Depression that do not flow into the Zhaiyk River (Olenty, Kopirankaty, Buldurty, Shiderty). This hydrologically homogeneous region is also characterized by a significant decrease in the volume of spring floods during the period 1974–2022 compared to the period before 1973. The greatest reduction is observed on the Olenty River, amounting to 30%, which indicates a significant decrease in water inflow in the spring period. A reduction in the volume of spring floods has been recorded on the Kopirankaty and Kaldygaity rivers, but it is less pronounced (Figure 5).
The long-term dynamics of changes in the flood volume of rivers flowing from the eastern part of the Caspian Depression show a mixed trend for the periods under review for the Kaldygaity River—Zhigerlen village, and a slight negative trend for the Kopirankaty River—Algabas village (Figure 6).
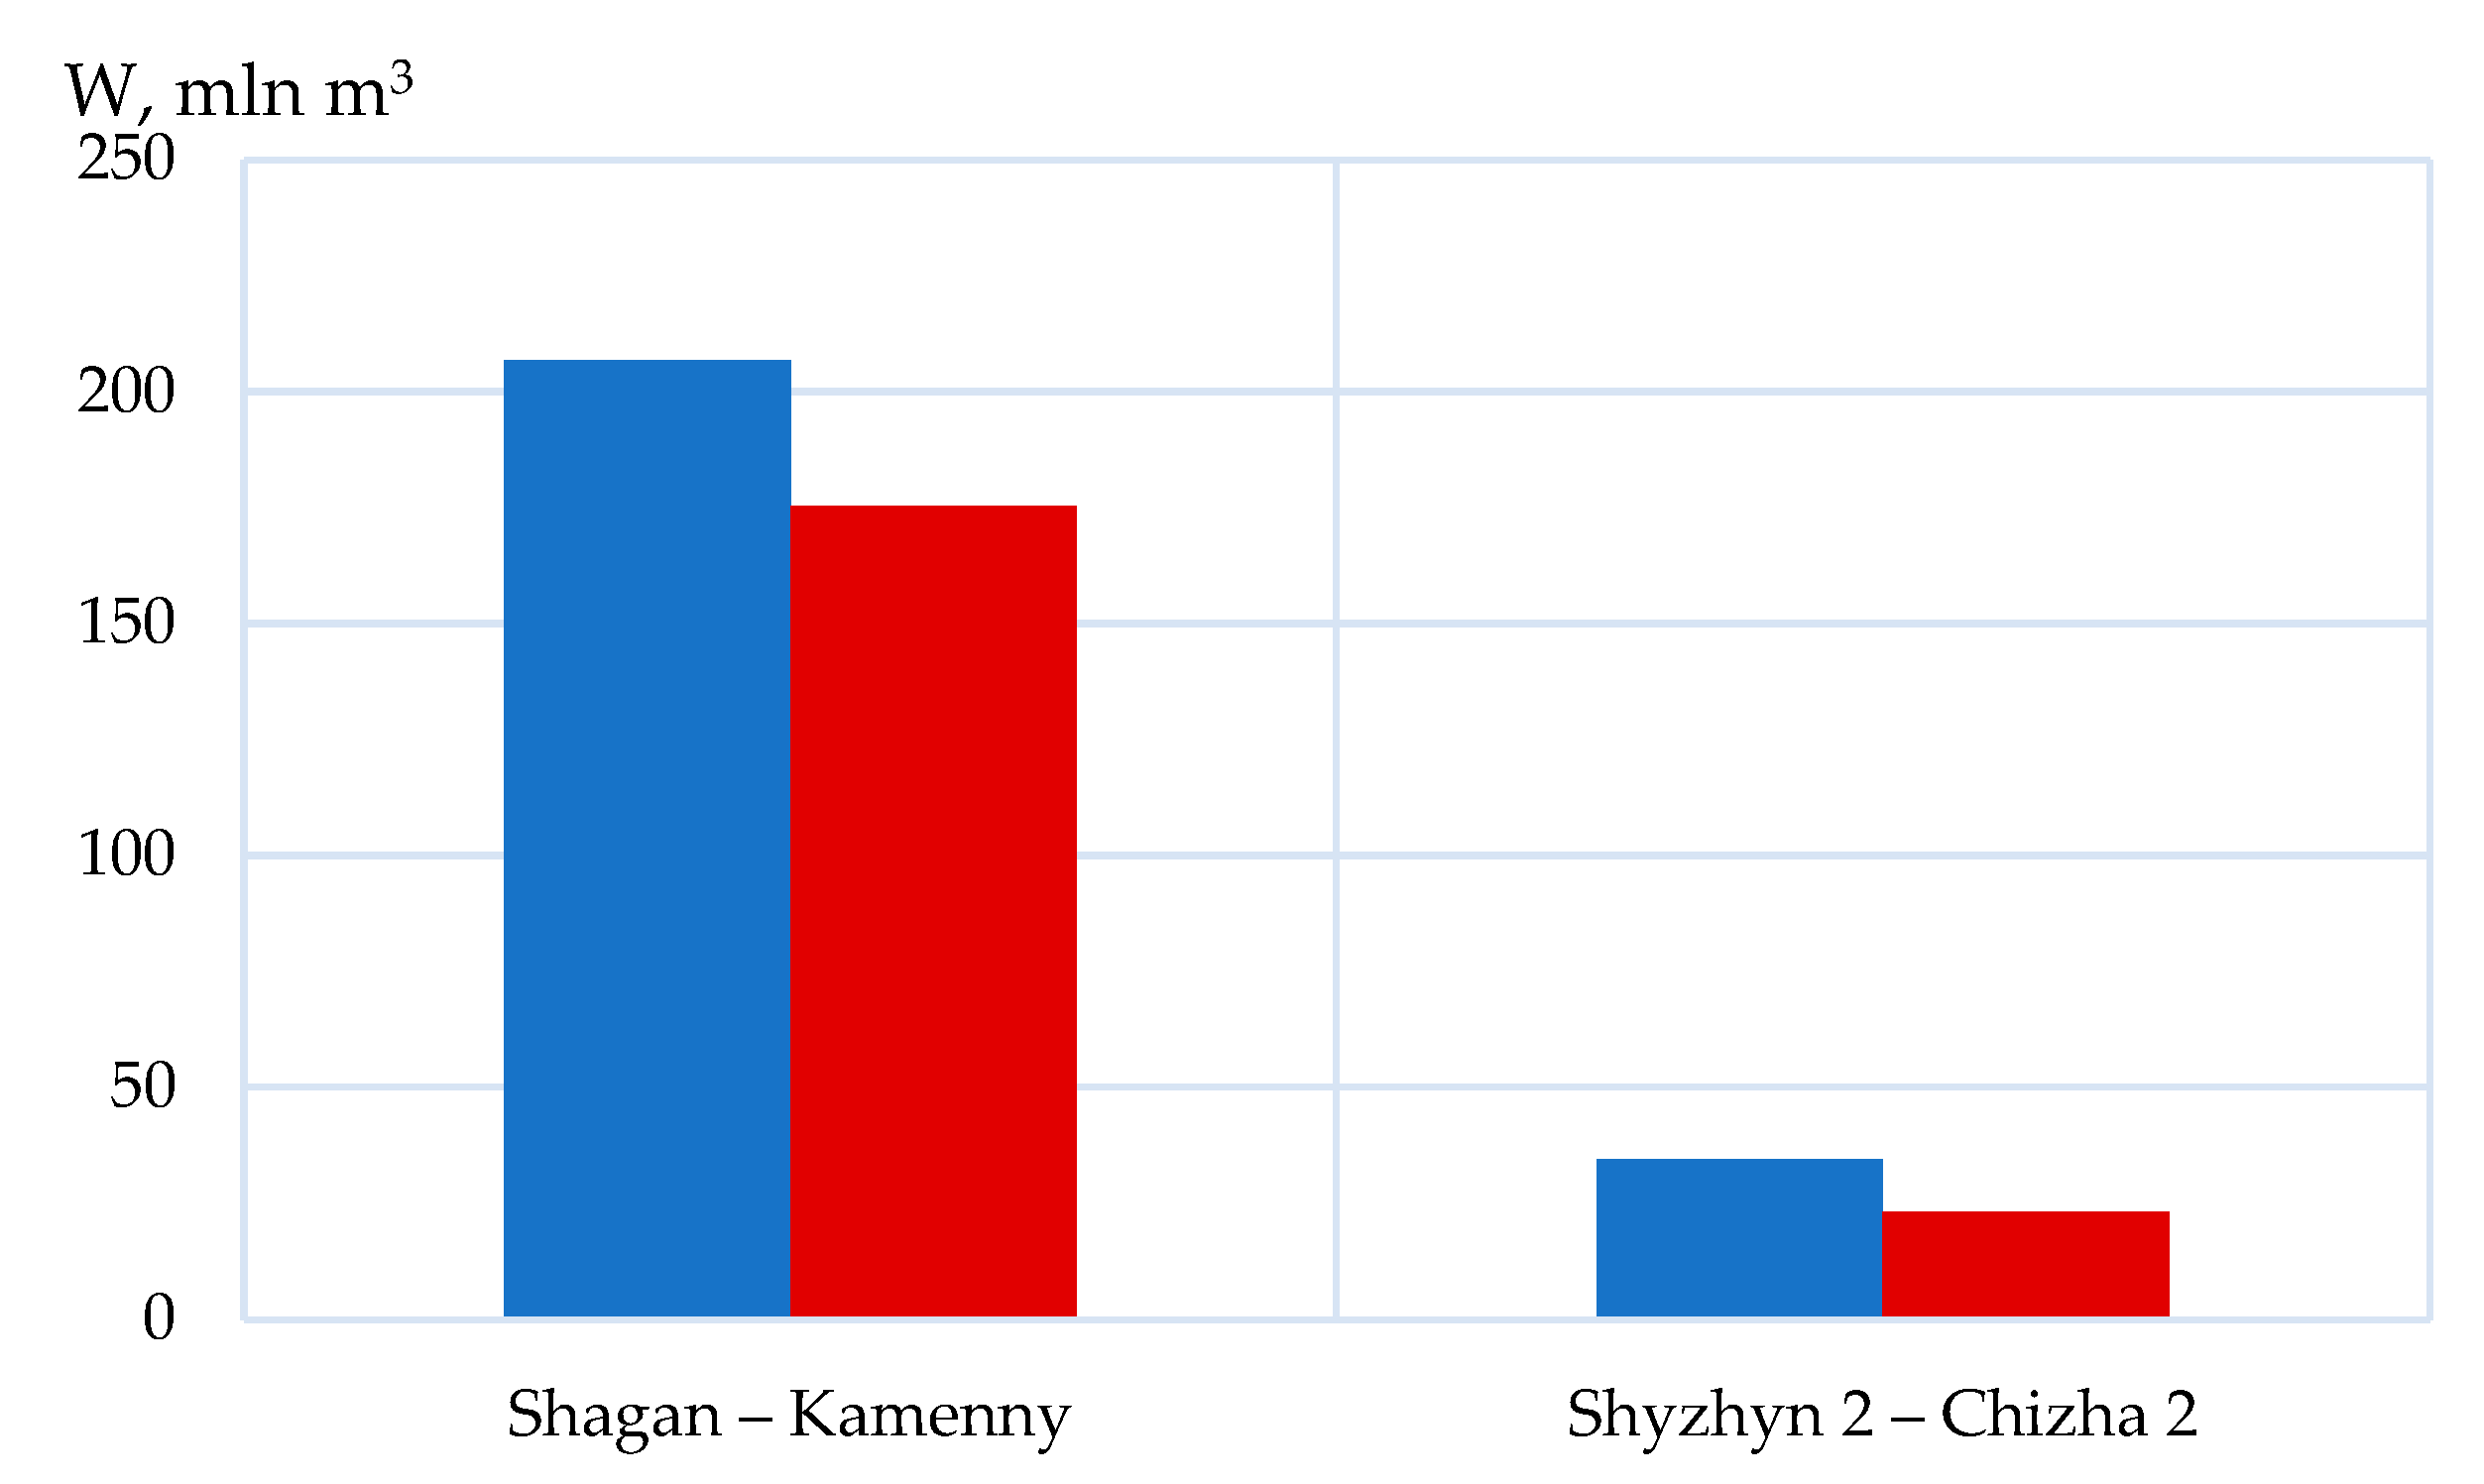
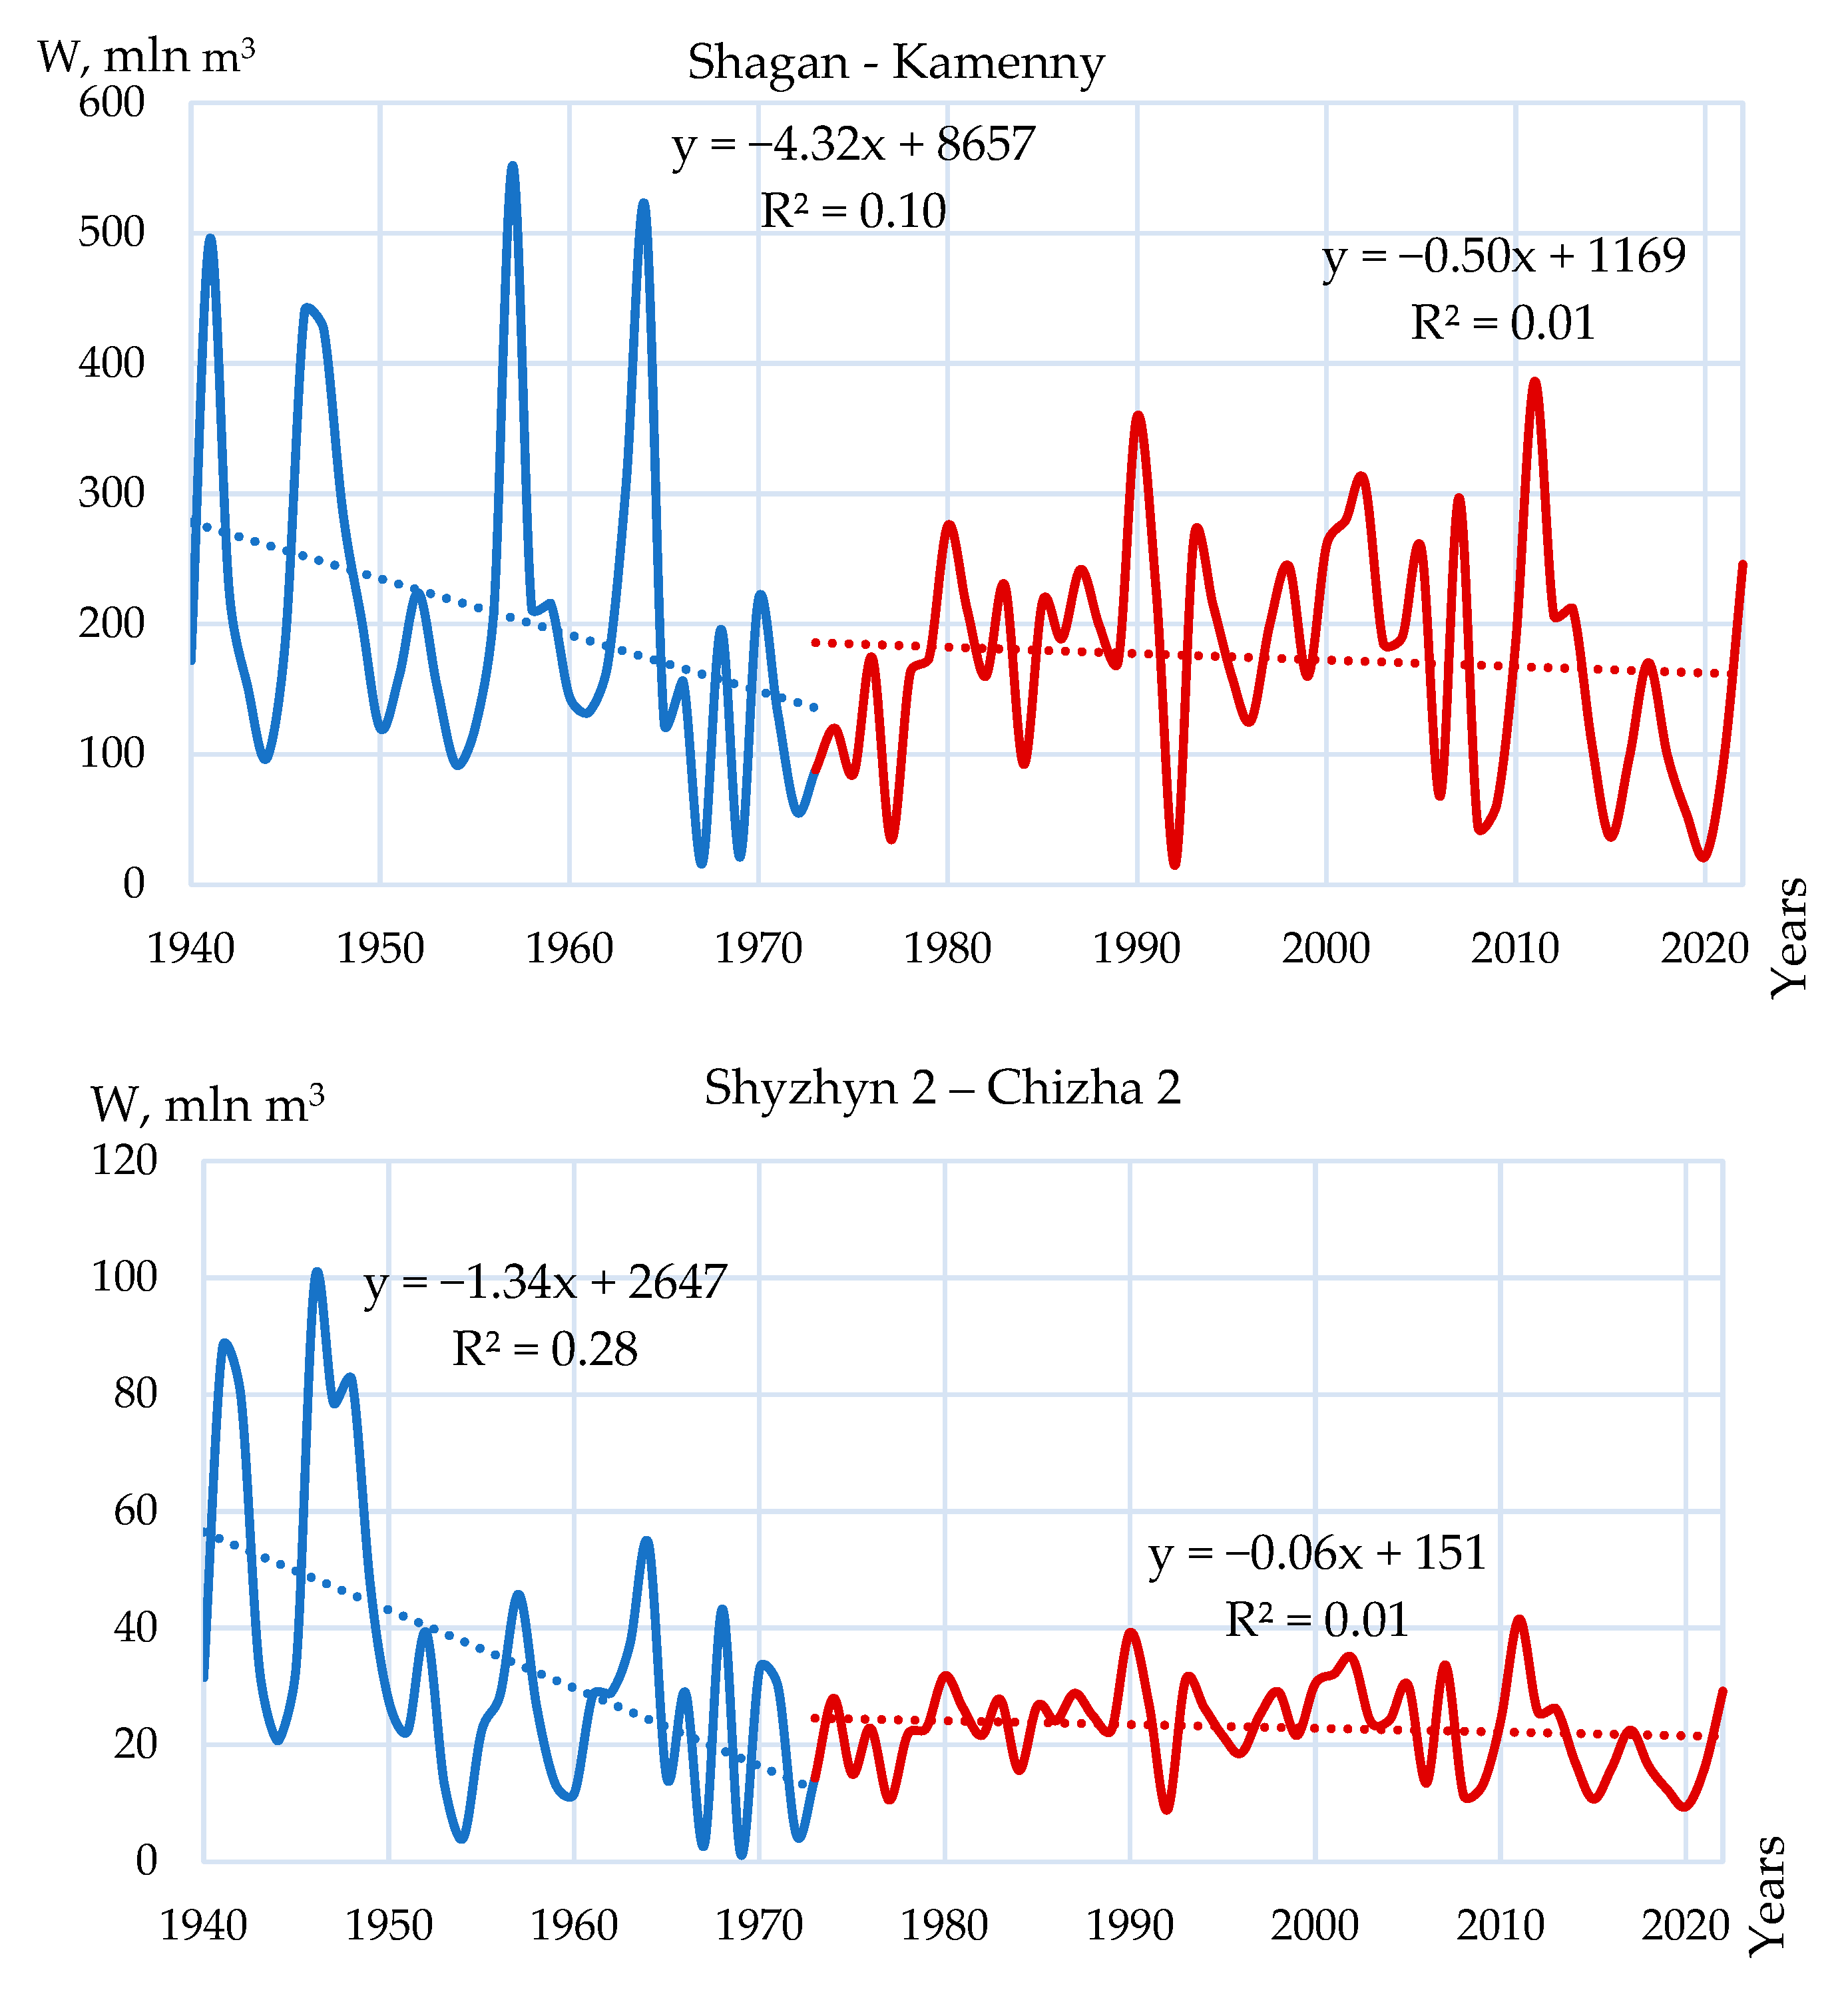
Right-bank tributaries of the Zhaiyk River, rivers in the western part of the Obshchy Syrt that do not flow into the Zhaiyk River (Shagan, Derkul, Shyzhyn I, Shyzhyn II). In the basin of the rivers in the western part of the Obshchy Syrt, which form on the territory of the Republic of Kazakhstan, the volume of spring runoff for the period 1974–2022 decreased significantly compared to data before 1973, from 15% to 33% (Figure 7). The long-term dynamics of flood volume changes also confirm a decrease in spring flood volume. The decrease in flood volume on the Shagan River—Kamenny village occurs at a rate of 43.1 million m3/10 years until 1973, 4.9 million m3/10 years for the current period.
For the Shyzhyn 2–Chizha 2 village, a negative trend is observed, 13.3 million m3/10 years until 1973 and a slight decrease of 0.6 million m3/10 years in the modern period, indicating a less pronounced trend of reduction in the volume of spring floods on the right-bank tributaries of the Zhaiyk River (Figure 8).
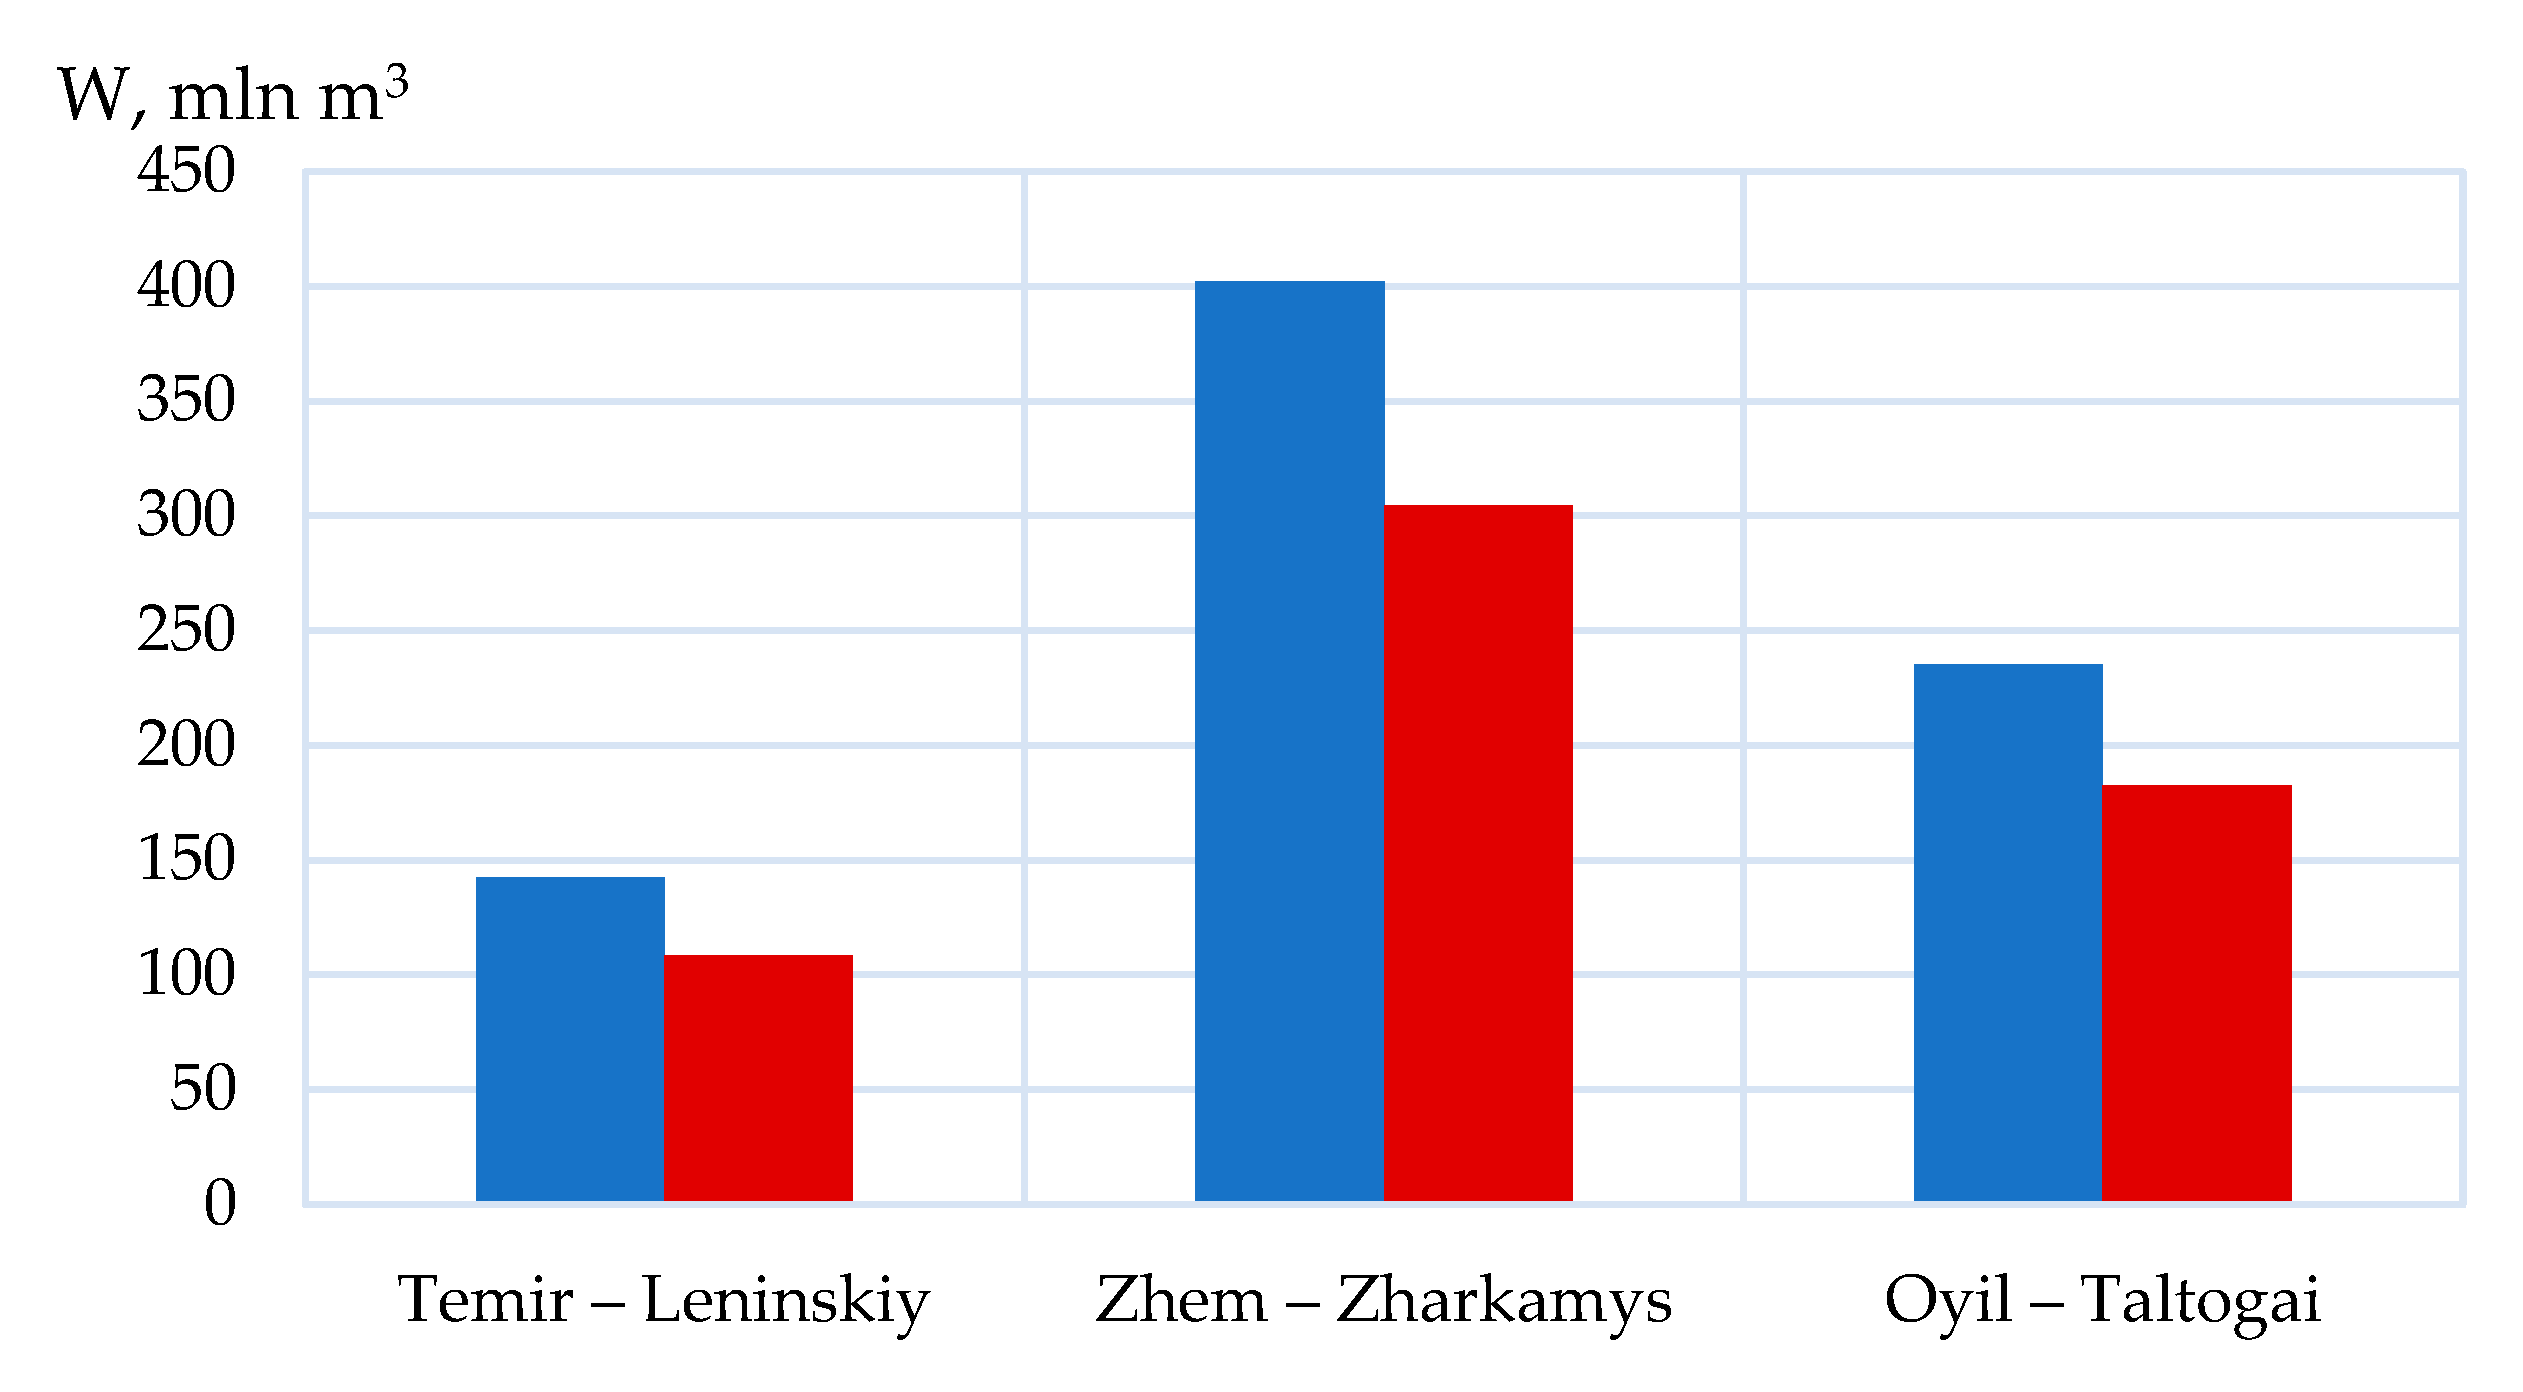
Southern rivers (Temir, Oyil, Sagyz, Zhem). The following picture can be observed in the southern rivers: the Temir River in the village of Leninskiy and the Zhem River in the village of Zharkamys, where the flood volume decreased by 24%; the Oyil River in the village of Taltogai, where the flood volume decreased by 22% (Figure 9). The long-term dynamics of changes in the flood volume of southern rivers are shown in Figure 10.
An analysis of Figure 10 demonstrates the trends in changes in the flood volumes of southern rivers. Over the long term, the flow volume of the Temir River in the village of Leninskiy until 1973 showed a negative trend of −15.1 million m3/10 years, while in the modern period from 1974 to 2022, a positive trend of 2.2 million m3/10 years was observed. For the Oyil River in the village of Taltogai, a slight negative trend was observed in both periods.
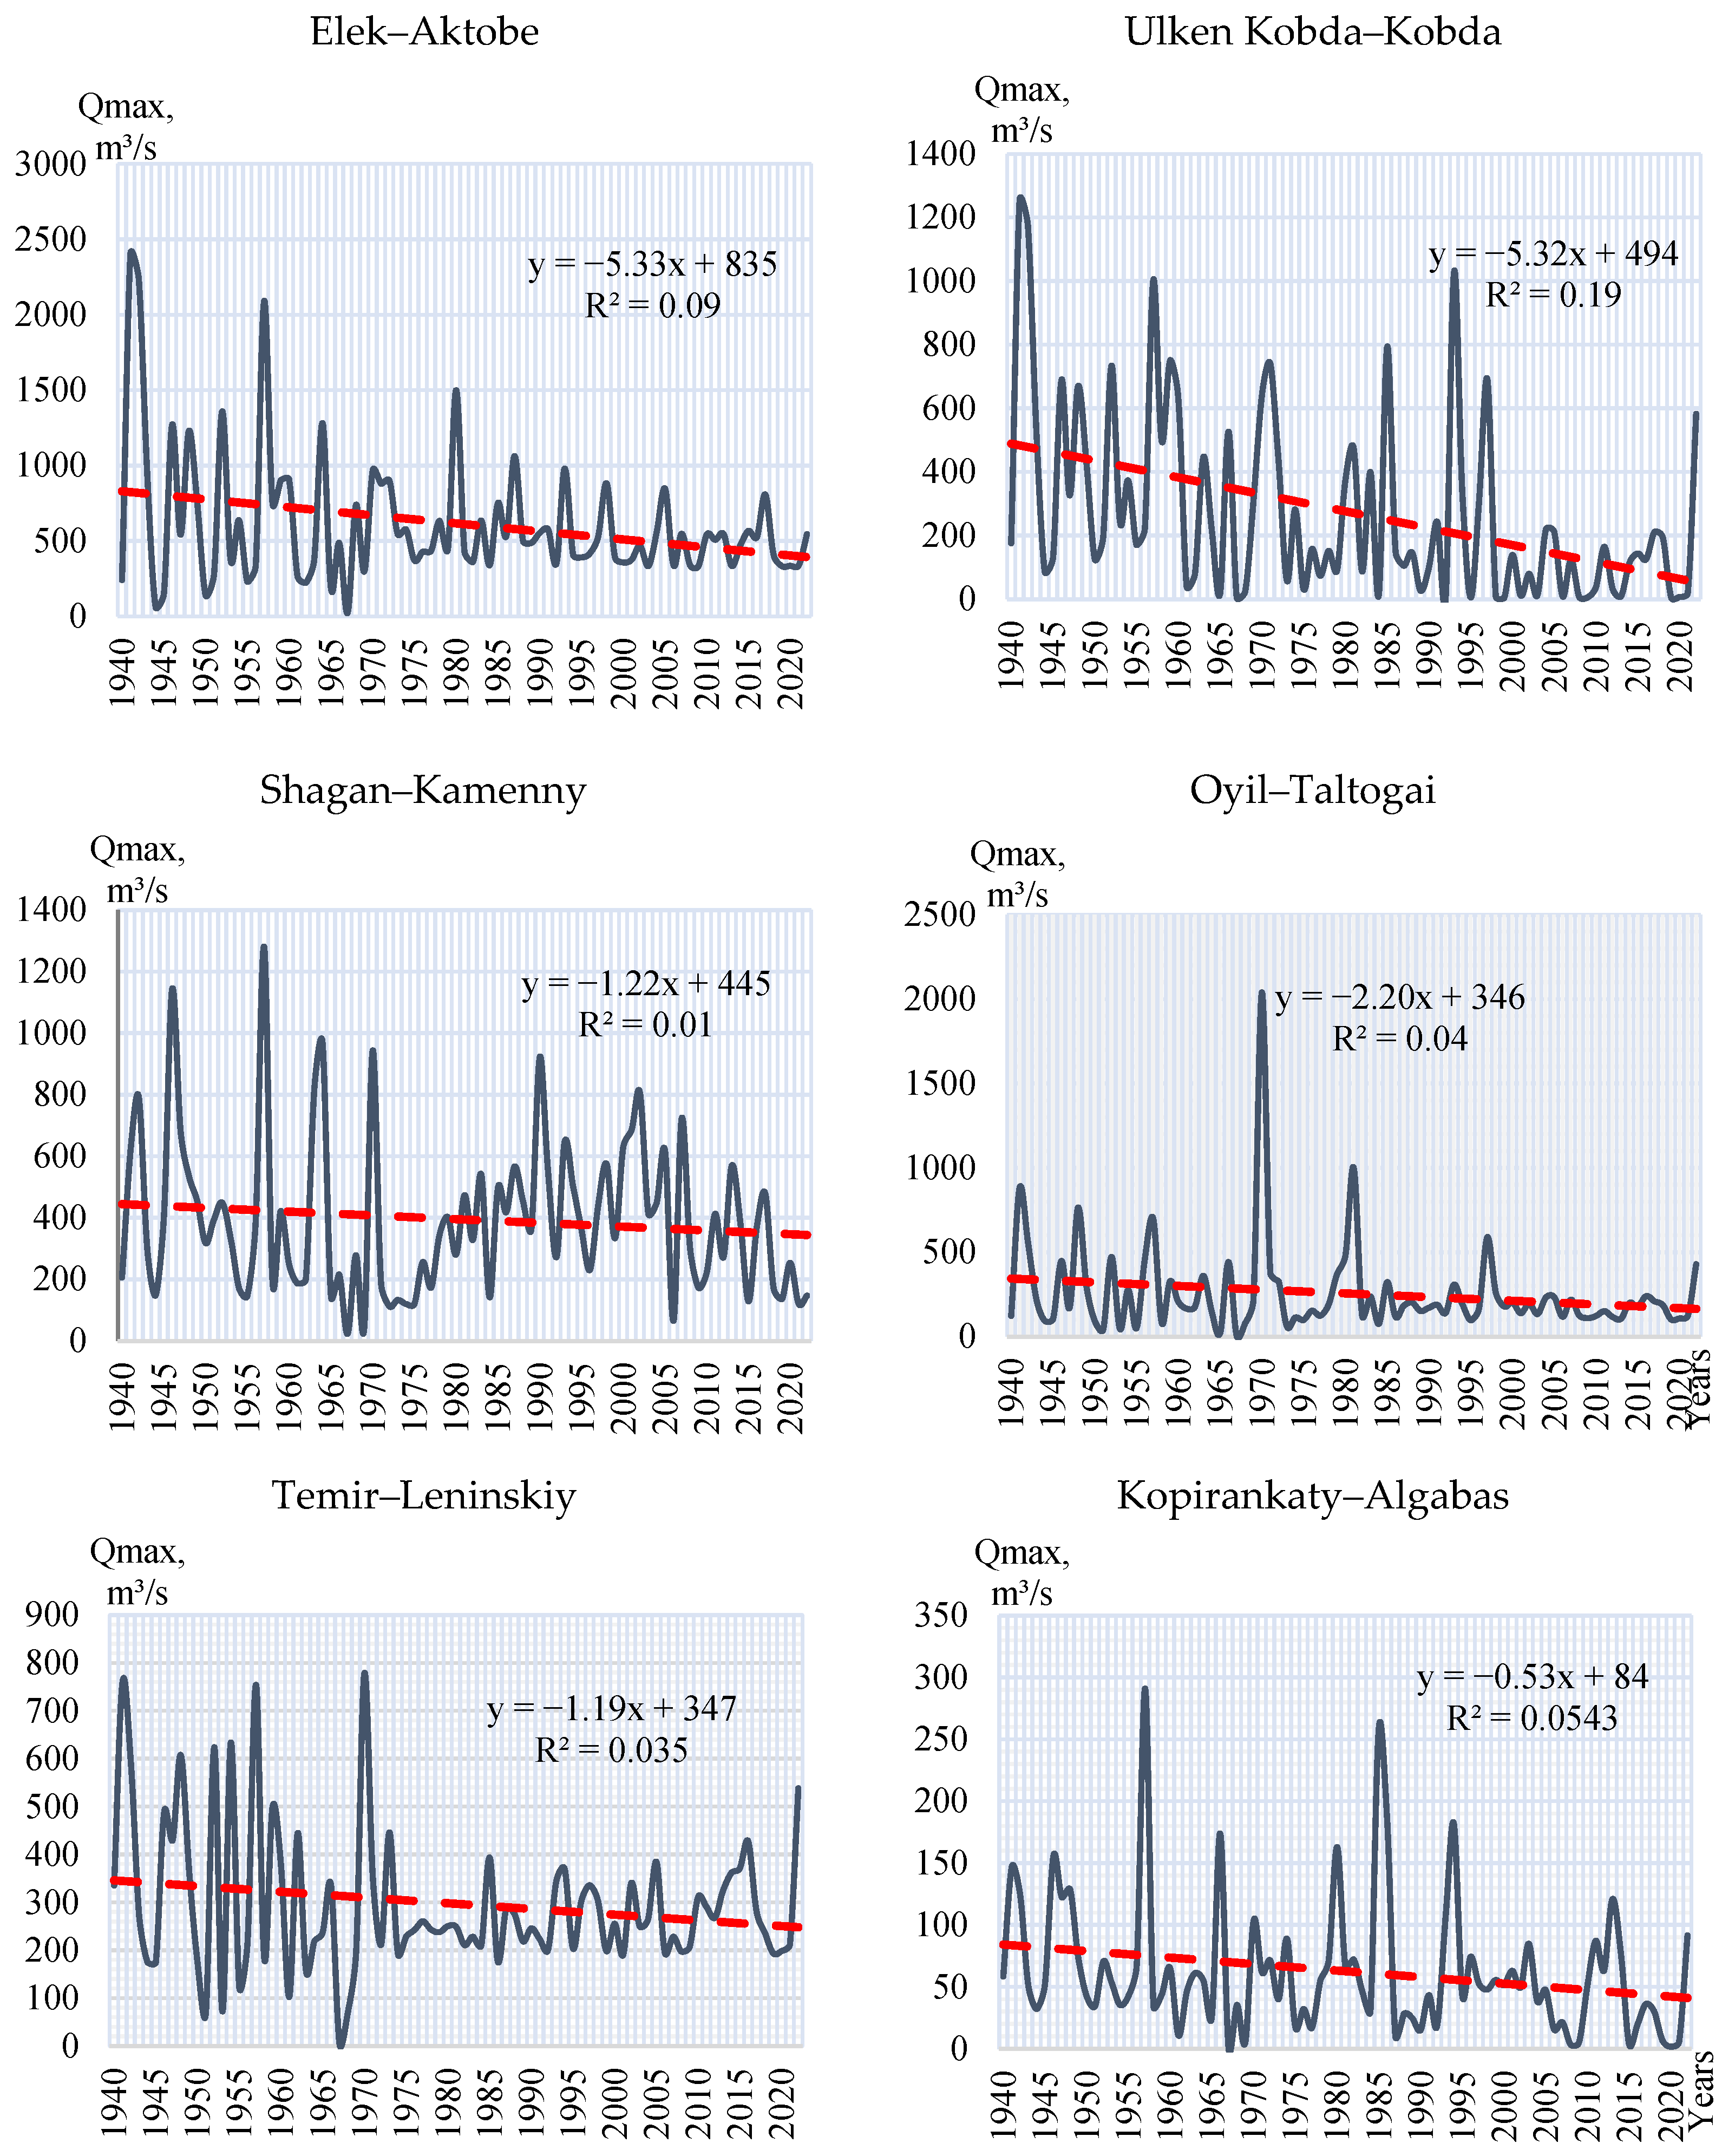
Maximum water discharge. In addition to changes in the volume of runoff during the spring flood, the maximum discharge also decreased in the region under consideration. Maximum water discharge in the rivers of the study area reached significant values in the period before 1973, on the Elek River—about 2500 m3/s, on the Ulken Kobda River—1300 m3/s, and on the Temir River—about 800 m3/s. However, after 1974, a significant decrease in this hydrological characteristic was observed. On the Elek River, the maximum water discharge decreased to 1500 m3/s, on the Ulken Kobda River—to 1000 m3/s, and on the Temir River, the maximum water discharge decreased to 500 m3/s (Figure 11).
An analysis of trends in maximum water discharge shows that a decrease is observed on all rivers in the basin under study. However, the significance of these trends varies depending on the river. The most pronounced trends are observed on the Elek and Ulken Kobda rivers, where the decrease reaches about 5.3 m3/s per year. Less pronounced but still significant trends are observed on the Shagan and Oyil rivers, where the rates of decline are 1.22 m3/s and 2.20 m3/s per year, respectively. The least significant trends are observed on the Temir and Kopirankaty rivers.
Start and end dates of the flood season and duration of the flood. The main elements of the spring flood are the start and end dates of the flood and its duration. The start and end dates of the flood were determined based on hydrographs of the runoff. The beginning of the flood is taken as the first day with a noticeable increase in water discharge, usually preceding a sharp rise in level and discharge, and the end of the flood is taken as the day at the end of the decline curve, when the intensity of the decline has already sharply decreased as a result of the end of the discharge of the main volume of meltwater. Table 3 shows data for the main rivers of the Zhaiyk–Caspian basin on the dates of the beginning and end of the spring flood, its duration for two time periods—from the beginning of instrumental observations to 1973 and for the period 1974–2022.
The results in Table 4 show that most rivers in the Zhaiyk–Caspian basin tend to experience an earlier start and earlier end to spring floods, corresponding to a reduction in the duration of spring floods. On average, the flood season in modern conditions begins 2–7 days earlier and ends 5–16 days earlier than in the period before 1973. The most significant shift in the start dates of the spring flood season is observed on the Ulken Kobda, Kargaly, and Kaldygaity rivers. On most rivers in the study region, the flood ends 5–16 days earlier (the Elek, Kargala, Shyzhyn 2 and Zhem rivers), so the duration of the flood has decreased.
The downward trend in maximum runoff remains stable in all hydrologically homogeneous areas, reflecting current climate change. These changes in spring flood characteristics are due to a number of factors, including higher air temperatures in winter and spring, more frequent thaws, and shallower soil freezing. Together, these processes lead to a reduction in moisture reserves by the start of the flood season. Rapid snowmelt during sharp increases in air temperature often prevents meltwater from reaching the main river channels, while reduced soil freezing depth contributes to additional water losses due to seepage into underground horizons. Such complex and ambiguous variability in runoff is probably explained by the high degree of diversity and multidirectional influence of factors that shape spring floods.

3.2. Contemporary Changes in Climatic Factors Affecting Maximum Runoff

Naturally, the main factors shaping flood levels are a group of climatic factors, among which precipitation plays a leading role, both in solid and liquid form. An increase in solid precipitation contributes to the accumulation of maximum snow reserves, which, in turn, leads to an increase in the volume of spring runoff. Preparation of the catchment area for the formation of spring floods begins in the fall, when the river basin is moistened (the sum of precipitation for the period September–October). During this period, an important factor is the average soil moisture content before the onset of the winter season. If the autumn was dry and the soil moisture content was low, water losses due to infiltration increase in the spring when the snow melts, leading to a decrease in runoff. Conversely, if soil moisture is high in autumn, infiltration losses of surface runoff in spring will be minimal, which contributes to an increase in the runoff coefficient and the formation of higher flood levels.
Another important climatic factor is air temperature. While snow reserves determine the total volume of high water and its peak values, the temperature regime affects the rate of snowmelt. The higher the sum of positive temperatures during the snowmelt period, the more intense the melting process, which leads to a faster rise in water levels and a shorter duration of high water. Table 5 presents the main climatic factors that shape spring floods, as well as their linear trend coefficients for three time periods: before 1973, 1974–2022, and for the entire observation period. For meteorological stations with less than 20 years of data available before 1973 (Sagyz, Karatobe, Ilinski, Kos-Istek, Kamenka, and Novorossiyskoe), the changes in meteorological parameters were calculated for the entire available observation period.
Precipitation. An analysis of linear trends in total precipitation during the winter period (November–March) showed predominantly positive changes at most meteorological stations in the Zhayik–Caspian basin. The first period (1940–1973) saw the most pronounced increase in winter precipitation, reaching 40.5 mm/10 years at the Rodnikovka MS, 24.2 mm/10 years at the Uil MS, 24.0 mm/10 years at the Emba MS and 20.5 mm/10 years at the Uralsk MS. These values reflect the relatively wet climate phase of the mid-20th century and the increase in moisture accumulation during the cold season.
In the second period (1974–2022), the positive trend continues but becomes less pronounced. The highest values of winter precipitation increase were recorded at the Karaulkeldy MS (10.4 mm/10 years), Aksai MS (9.3 mm/10 years) and Aktobe MS (5.1 mm/10 years). This indicates a continuing but more moderate increase in winter moisture under current climatic conditions. At the same time, some stations recorded a slight decrease in winter precipitation: the Dzhambeita MS (3.9 mm/10 years), Rodnikovka MS (4.3 mm/10 years), Emba MS (2.4 mm/10 years). These differences reflect local climatic features and the influence of orographic factors that determine the uneven distribution of precipitation across the basin.
With regard to precipitation during the autumn months (IX-X), a significant decrease has been recorded since 1974. For example, at the Rodnikovka MS (−4.6 mm/10 years) and at the Temir MS (−3.2 mm/10 years). The decrease in autumn precipitation reduces soil moisture before the onset of winter, which negatively affects the formation of a stable snow cover. In spring, during snowmelt, this leads to increased water losses due to infiltration into the soil layer, resulting in a reduction in spring runoff in almost all rivers in the region.
Air temperature. The analysis showed that the temperature regime of the study area has also undergone tremendous changes—the average air temperature during the winter period (November–March) has increased significantly in the modern period after 1974. For example, before 1973, the air temperature at the Novoalexeevka MS was 0.1 °C/10 years, and after 1974, it rose to 0.6 °C/10 years. At the Uil MS, a similar increase was observed, from 0.2 °C in the period before 1973 to 0.5 °C/10 years after 1974, confirming the general warming trend across the entire study region.
Similarly to the winter season, the average air temperature during June–October (VI–X), which reflects the soil water absorption capacity and evaporation losses, also exhibits a steady upward trend. For 1974–2022, a positive trend was observed at all stations in the Zhaiyk–Caspian basin: from +0.2 to +0.5 °C/10 years. The most intense warming was observed at the Uralsk and Chingirlau meteorological stations, +0.5 °C/10 years. In other cases, the values fluctuate between +0.2 and +0.4 °C/10 years. Higher temperatures during the warm season increase evaporation losses, reduce soil moisture, and limit the moisture reserves that form before winter. This, in turn, can reduce the water content of spring floods.
Since 1974, there has been a steady increase in average winter air temperatures, leading to an increase in the sum of positive temperatures, indicating more frequent winter thaws and more intense snowmelt. The number of thaws (total number of days with a positive mean daily air temperature during the period of stable frost conditions) lasting 16–20 and 20–30 days in the modern period has almost doubled compared to the period before 1973 (Table 6). For example, at the Uralsk MS, the number of thaws lasting 16–20 and 20–30 days in the period 1940–1973 were observed four times, while in the modern period their number increased to 11 cases; at the Chapaevo meteorological station, the number of thaws lasting 16–20 days during the period 1940–1973 was observed four times, while during the period 1974–2021—increased to 7 cases, thaws lasting 20–30 days during the period 1940–1973 were recorded 7 times, during the period 1974–2021 their number increased to 13 cases.
The sum of negative temperatures during the winter period (December–March) has decreased significantly in recent years, indicating a general warming of the winter season and a decrease in frostiness. Until 1973, the sum of negative temperatures in most regions was high, indicating stable cold winters with a prolonged period of low temperatures. A decrease in negative temperatures leads to a reduction in the depth of soil freezing, which in turn increases the infiltration of meltwater into the soil horizons. Most of the meltwater flowed into river beds, forming floods (period before 1973), while in the modern period after 1974, a significant part of the water goes into the soil, reducing the volume of surface runoff.
Analysis of the data obtained shows that until 1973, weather conditions remained relatively stable: precipitation and air temperature did not change significantly. However, in the modern period, there has been a decrease in precipitation in the autumn-winter period and an accelerated rise in temperature, which has led to a decrease in snow reserves, an earlier start to spring flooding, and a reduction in its duration. All this together confirms the increase in climate risks for the region’s water resources and highlights the need to adapt water management to new climatic conditions.

3.3. Scenario-Based Forecasting of Maximum River Discharge

In this study, scenario-based forecasting was performed exclusively for maximum discharge, as this value demonstrates the strongest correlation with seasonal meteorological predictors. Forecasting other flood parameters, such as maximum water discharge, flood onset and end dates, and flood duration, requires the use of daily meteorological data. Despite the availability of daily meteorological data for CMIP6, their use in this study proved difficult. This is because working with such data requires prior reduction in spatial resolution and correction of daily data, without which the original values can significantly distort the amplitude, frequency, and temporal characteristics of precipitation and temperature. In this regard, the scenario forecast was limited to seasonal characteristics, where modeling errors are significantly lower.
The multiple correlation coefficients between maximum runoff volumes and the above predictors vary between R = 0.65 and 0.87. Table 7, Table 8 and Table 9 show scenario-based changes in key meteorological parameters used as predictors in forecasting spring runoff volumes.
Table 7 shows a steady increase in average air temperature during the warm period (June–October) in all hydrological regions. According to scenarios SSP3-7.0 and SSP5-8.5, by 2050, the temperature increase could reach +4.4 °C compared to the baseline period of 1991–2020. The most intense warming is expected in the northeastern part of the basin (Kos-Istek, Karatobe MS), while in the southern regions the temperature increase is less pronounced.
Under both climate scenarios (Table 8), most areas of the Zhaiyk–Caspian basin are expected to experience an increase in precipitation during the cold season (September-March), with the exception of the Kamenka MS, where a slight decrease of up to 10% is forecast compared to the baseline period. A particularly significant increase is expected in the southern part of the basin, at weather stations such as Emba, Temir, Karauylkeldy, and Sagyz, with an increase of up to 60% by 2050 compared to the baseline period of 1991–2020.
The results obtained (Table 9) indicate that during the cold period (November–March), when air temperature strongly influences the frequency of thaws and snowmelt intensity, a steady increase in average air temperature is projected throughout the Zhaiyk–Caspian basin. By 2050, winter temperatures are expected to rise by +1.5 to +3.7 °C relative to the baseline period of 1991–2020.
The most intense warming is predicted in the northwestern and central parts of the basin—at the meteorological stations of Kamenka, Karauylkeldy, Kos-Istek, Chingirlau, and Dzhambeita. In the southern regions (Emba, Sagyz, Temir, Uil MS), the warming rates are more moderate, ranging from +1.5 to +2.9 °C.
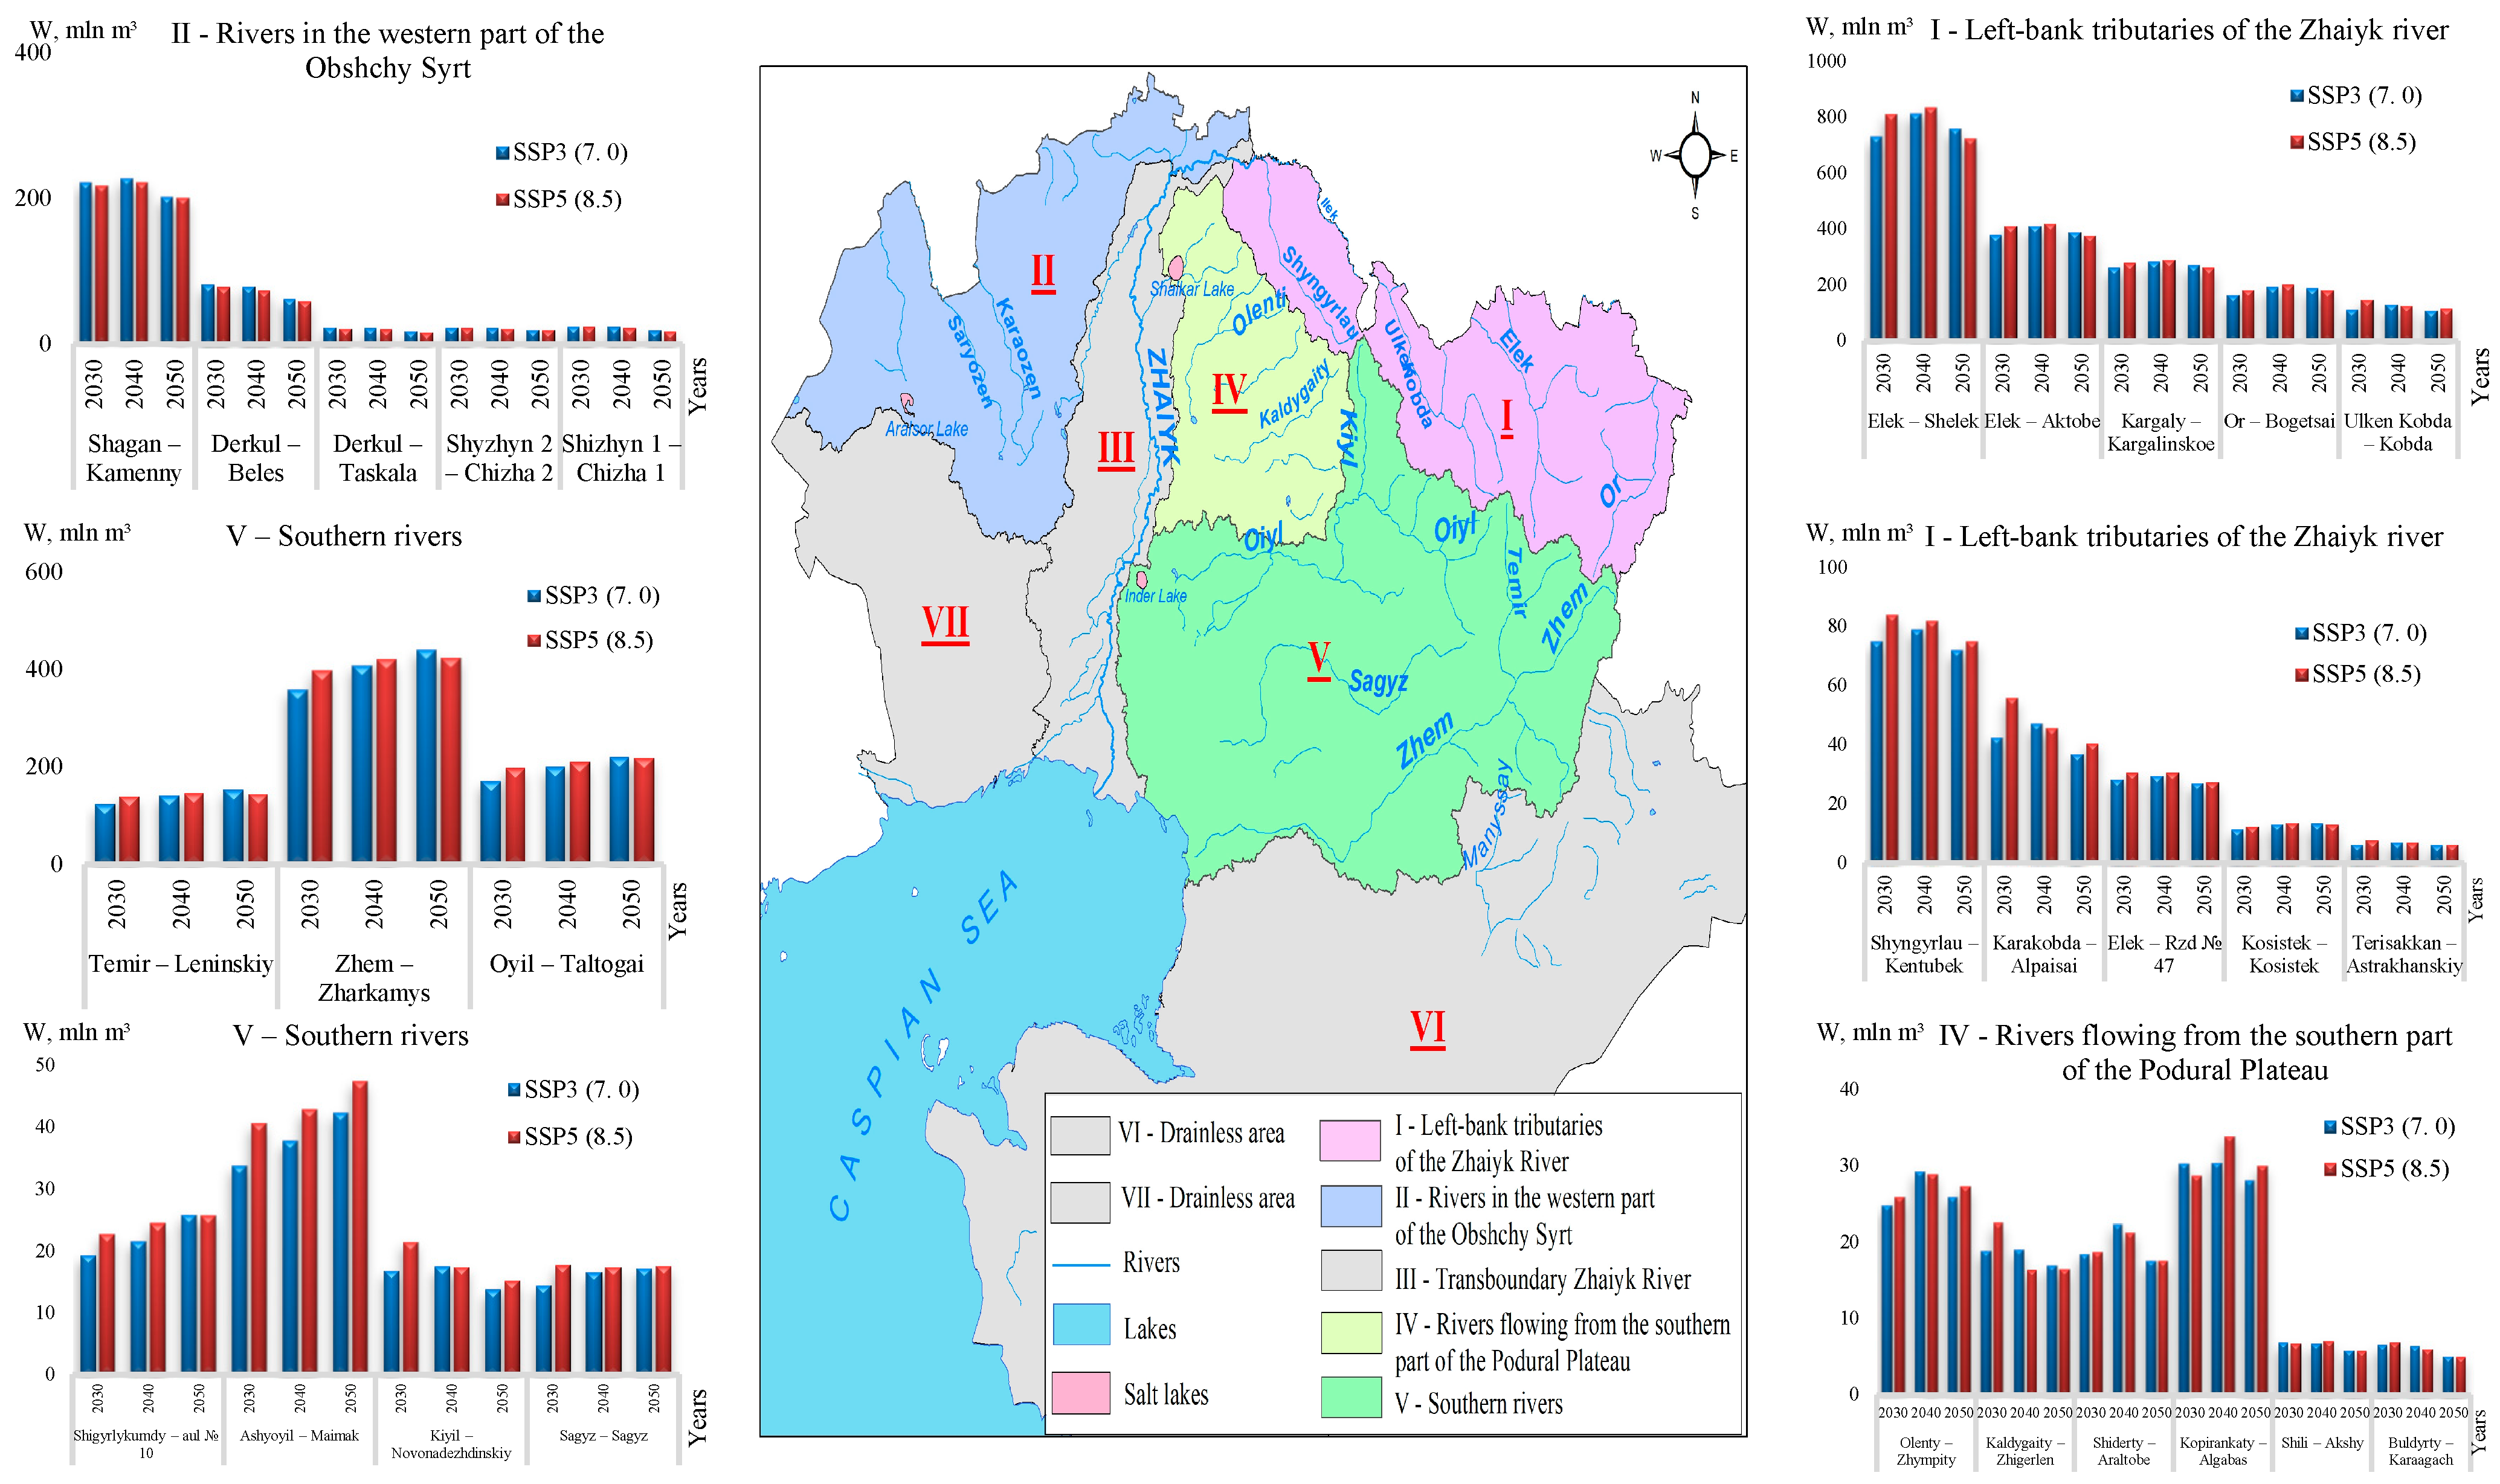
Analysis of the projected maximum runoff for the 2030, 2040 and 2050 under climate scenarios SSP3-7.0 and SSP5-8.5 in the Zhaiyk–Caspian basin revealed pronounced spatial heterogeneity (Figure 12, Figure 13 and Figure 14).
In the area of the left-bank tributaries of the Zhaiyk River, changes in maximum runoff under scenarios SSP3-7.0 and SSP5-8.5 are ambiguous. Under the SSP5-8.5 scenario, most major rivers, such as the Sarykobda, Or, Ulken Kobda, and Terisbutak, are projected to experience an increase in maximum flow ranging from 6% to 48% compared to the baseline period of 1991–2020. At the same time, a number of rivers, including Kos-Istek, Karakobda, Terisakkan, and Elek, are expected to experience a steady decline in runoff of up to 35%.
In the western part of the Obshchy Syrt, a steady decrease in maximum runoff is predicted under both climate scenarios. On most rivers, such as Shyzhyn 1 and Derkul, runoff volumes will decrease by up to 35%. The exception is the Shagan River, which will see a steady increase in maximum runoff of up to 33%, regardless of the scenario selected.
The rivers in the southern part of the Podural Plateau show mixed changes in maximum flow. Under the SSP5-8.5 scenario, most watercourses show a steady increase in volume, which is particularly pronounced in rivers such as the Kopirankaty and Shiderty, where the increase reaches up to 72%. Southern rivers show the most stable positive dynamics under both scenarios. On average, under SSP3-7.0, maximum flow increases by up to 20%, and under SSP5-8.5, by up to 30%. The exception is the Kiyil River, which shows a steady decline in maximum flow to 34% of the baseline period.
An analysis of scenario projections of maximum runoff for rivers in the Zhaiyk–Caspian basin shows that small and medium-sized rivers in the region are highly sensitive to expected climate change. This is particularly evident in steppe and arid areas, where runoff fluctuations vary widely. Comparison of the projected changes in meteorological parameters with the results of peak flow modeling confirms the key role of air temperature and cold-season precipitation in shaping the spring flood regime. The increase in winter temperatures, observed throughout the Zhaiyk–Caspian Basin and particularly pronounced at the Kamenka, Kosestek, and Chingirlau meteorological stations, may lead to earlier and more intensive snowmelt, which in turn alters the temporal distribution of runoff and reduces peak flows in several northern catchments, including the Elek, Terisakkan, and Kosestek river basins. Conversely, the increase in total cold-season precipitation, most notable in the southern areas (Emba, Sagyz, Temir, and Karauylkeldy meteorological stations), creates conditions for the accumulation of larger snow reserves and, consequently, higher spring runoff.
In the western part of the Obshchy Syrt (Shyzyn and Derkul river basins), a substantial rise in winter temperatures is projected, while the increase in total cold-season precipitation is relatively small; at certain meteorological stations (e.g., Kamenka), a decline is even expected. This combination of factors-sharp warming accompanied by weak or negative precipitation trends-shortens the snow accumulation period, increases winter runoff, and ultimately reduces spring peak flows.
Thus, the scenario-based projections indicate that the combined effect of rising winter and autumn temperatures and changes in precipitation determines the spatially heterogeneous response of river systems: a substantial increase in snow reserves coupled with moderate warming leads to higher peak flows, whereas sharp warming with insufficient precipitation growth results in a consistent decline in their magnitude.

4. Discussion

The study of spring floods is a key area of river hydrology, with both scientific and practical significance. From a scientific point of view, spring flood parameters are an indicator of the stable characteristics of the seasonal regime of river flow, which is formed under the influence of climatic conditions and the natural and geographical characteristics of the catchment area. From a practical point of view, these data are crucial for hydraulic engineering design: knowledge of the timing of the onset of floods and the maximum discharge is necessary for calculating the strength of bridge crossings and determining the parameters of spillways, canals, and other elements of water management infrastructure [50,51,52,53].
The results obtained indicate significant changes in spring floods in the Zhaiyk–Caspian basin in the modern period: spring runoff volumes have decreased, the timing of its onset and end has shifted, and the duration of floods has decreased. These changes are consistent with trends observed in other regions of the world, where changes in precipitation and air temperature lead to a reduction in spring runoff and a redistribution of the seasonal structure of the river regime [18,54,55,56].
Similar processes of spring runoff transformation have been recorded in a number of domestic studies covering both the Kazakh and Russian parts of the Ural River basin. Such processes are explained by common climatic causes and confirm the existence of regional consistency in the response of hydrological systems to climate warming [57,58,59,60].
Climatic factors have had a significant impact on changes in maximum runoff. Analysis of data from 17 weather stations shows a steady increase in air temperature in both winter and summer-autumn periods, an increase in the number of thaws, and a decrease in the number of days with negative temperatures. Elevated temperatures in the winter-spring season contribute to earlier snowmelt, increase infiltration losses and, as a result, lead to a decrease in spring runoff. These results are consistent with the conclusions presented in the works of [40,61].
Intra-annual precipitation dynamics show mixed changes. In winter (December–March), most stations show a slight positive trend (up to +9.8 mm/10 years), similar to the trends recorded in the Volga and Ural basins [51,62,63]. At the same time, autumn precipitation (September-October), which plays an important role in soil moistening before freezing, shows a downward trend, averaging 5 mm/10 years. The lack of autumn moisture increases the filtration losses of meltwater in spring, which is also confirmed by the results of a number of studies on the peculiarities of runoff formation under climate change [50,64,65].
In conditions of climate instability and increasing interannual variability of meteorological factors, there is a growing need for a scenario-based approach to forecasting extreme runoff characteristics using global climate models such as CMIP6 [66]. This study used CMIP6 data for two scenarios—SSP3-7.0 and SSP5-8.5—covering the future horizons of the 2030s, 2040s, and 2050s. The forecast models indicate a possible increase in extreme floods in some regions under high emission scenarios. For example, calculations using the EC-Earth3 model show a significant increase in 100-year water discharge in European regions under the SSP5-8.5 scenario [67]. In the Nam Ou River basin (a tributary of the Mekong), calculations based on CMIP6 model data using the MIKE-NAM hydrological model show an increase in maximum discharge of 23–49% by 2080 [68]. These results are consistent with the findings of this study on the Zhaiyk–Caspian basin, where models also predict an increase in maximum flow of up to 48% under the SSP5-8.5 scenario, despite the presence of isolated areas with negative dynamics (up to −35% under SSP3-7.0).
With regard to annual runoff, global studies show that trends in annual runoff vary depending on the region—in some parts of Europe and Asia, both increases and decreases in annual runoff are predicted, depending on the ratio of precipitation to evaporation [69,70] found that 72% of the world’s land area could experience an increase in annual runoff of up to +16.1% by the end of the 21st century under the SSP5-8.5 scenario.
Regional scenario assessments for the Zhaiyk–Caspian basin are consistent with global trends: extreme floods are intensifying, the seasonal structure of runoff is being redistributed, and uncertainty is increasing due to the variability of climate models. This highlights the need to use model ensembles and adaptive approaches in water resource planning and management.

5. Conclusions

The analysis of data on spring floods in the Zhayik-Caspian basin (1974–2022) showed a steady trend of decreasing spring runoff volumes in all hydrologically homogeneous areas. The largest decrease (up to 35%) was observed in the left-bank tributaries of the Zhayik–Ulken Kobda and Elek, as well as in the rivers of the Caspian lowland (Olenty, Kopirankaty) and southern watercourses (Temir, Oiyl, Zhem).
Maximum water discharge decreased by 30–40%: on the Elek—from 2500 to 1500 m3/s, on the Ulken Kobda—from 1300 to 1000 m3/s, and on the Temir—from 800 to 500 m3/s. The flood season begins on average 2–7 days earlier and ends 5–16 days earlier than before 1973, which leads to a reduction in its duration.
The main reason for the transformation of the flow is climate warming: the average winter temperature increases by +0.5, …, +0.6 °C per decade, the frequency of thaws increases, the depth of soil freezing decreases, and filtration losses of meltwater increase. Despite the increase in winter precipitation, the decrease in autumn precipitation reduces the water-holding capacity of the soil.
Scenario modelling (CMIP6, SSP3-7.0 and SSP5-8.5) until 2050 shows a further increase in winter temperatures of 1.5–4.4 °C and an increase in precipitation of 30–60%. At the same time, the spatial response of runoff is heterogeneous: on the left-bank tributaries of the Zhaiyk, both an increase (up to +48%) and a decrease (up to –35%) in flood levels are possible; in southern rivers, an increase of up to +72% is expected.
Small- and medium-sized rivers are most sensitive to climate change. The transformation of flood levels requires the introduction of adaptive approaches to water resource management, including scenario planning, climate modelling and a consideration of local basin characteristics. The results obtained are consistent with global trends, confirming their significance for regional hydrological policy.

Author Contributions

Conceptualization, S.A. and L.M.; methodology, S.A., L.M. and S.D.; validation, E.T., A.S. and Z.S.; formal analysis, L.B. and E.T.; investigation, M.D., L.M. and E.T.; resources, Z.S.; data curation, A.S.; writing—original draft preparation, E.T.; writing—review and editing, L.M. and S.D.; visualization, A.S., L.B. and D.S.; supervision, S.A. and L.M.; project administration, L.M. All authors have read and agreed to the published version of the manuscript.

Funding

This research was funded by the Science Committee of the Ministry of Science and Higher Education of the Republic of Kazakhstan, Grant No. BR28713279 “Scientific and Applied Foundations for Flood Risk Management in the Flat and Low-Hilly Territories of Kazakhstan under Modern Climate Change Conditions”.

Data Availability Statement

Please contact corresponding author for data.

Conflicts of Interest

The authors declare no conflicts of interest.

References

  1. Makhmudova, L.; Moldakhmetov, M.; Mussina, A.; Kurmangazy, E.; Kambarbekov, G.; Zharylkassyn, A.; Zhulkainarova, M. Study of water stress in plains rivers: Climate and human influence. Evergreen 2024, 11, 1530–1543. [Google Scholar] [CrossRef]
  2. Smagulov, Z.; Makhmudova, L.; Alimkulov, S.; Talipova, E.; Zagidullina, A.; Birimbayeva, L.; Sailaubek, A. Transformation of seasonal distribution of river flow in the Zhaiyk-Caspian water basin under changing climate conditions. J. Water Clim. Change 2025, 16, 400–429. [Google Scholar] [CrossRef]
  3. Overview of the Climate Features on the Territory of Kazakhstan. Available online: https://www.kazhydromet.kz/ru/klimat/obzor-ob-osobennostyah-klimata-na-territorii-kazahstana (accessed on 13 October 2025).
  4. Tursunova, A.; Nurbatsina, A.; Salavatova, Z.; Huthoff, F. Sustainability challenges in Kazakhstan’s river systems: Assessing climate-induced hydrological changes. Sustainability 2025, 17, 3405. [Google Scholar] [CrossRef]
  5. Jiang, T.; Su, B.; Hartmann, H. Temporal and spatial trends of precipitation and river flow in the Yangtze River Basin, 1961–2000. Geomorphology 2007, 85, 143–154. [Google Scholar] [CrossRef]
  6. Shiklomanov, A.I.; Lammers, R.B.; Rawlins, M.A.; Smith, L.C.; Pavelsky, T.M. Temporal and spatial variations in maximum river discharge from a new Russian data set. J. Geophys. Res. 2007, 112, G04S53. [Google Scholar] [CrossRef]
  7. Dankers, R.; Feyen, L. Climate change impact on flood hazard in Europe: An assessment based on high-resolution climate simulations. J. Geophys. Res. 2008, 113, D19105. [Google Scholar] [CrossRef]
  8. Ye, X.; Xu, Y.-P.; Booij, M.J. Impact assessment of multiple uncertainty sources on high flows under climate change. Hydrol. Res. 2015, 47, 61–74. [Google Scholar] [CrossRef]
  9. Meresa, H.; Murphy, C.; Fealy, R.; Golian, S. Uncertainties and their interaction in flood hazard assessment with climate change. Hydrol. Earth Syst. Sci. 2021, 25, 5237–5257. [Google Scholar] [CrossRef]
  10. Gao, C.; Booij, M.J.; Xu, Y.-P. Assessment of extreme flows and uncertainty under climate change: Disentangling the uncertainty contribution of representative concentration pathways, global climate models and internal climate variability. Hydrol. Earth Syst. Sci. 2020, 24, 3251–3269. [Google Scholar] [CrossRef]
  11. Alexandre, D.A.; Chaudhuri, C.; Gill Fortin, J. Novel extensions to the Fisher copula to model flood spatial dependence over North America. Hydrol. Earth Syst. Sci. 2024, 28, 5069–5089. [Google Scholar] [CrossRef]
  12. Willkofer, F.; Wood, R.R.; Ludwig, R. Assessing the impact of climate change on high return levels of peak flows in Bavaria applying the CRCM5 large ensemble. Hydrol. Earth Syst. Sci. 2024, 28, 2969–2989. [Google Scholar] [CrossRef]
  13. Görgen, K.; Beersma, J.; Brahmer, G.; Buiteveld, H.; Carambia, M.; de Keizer, O.; Krahe, P.; Nilson, E.; Lammersen, R.; te Linde, A.; et al. Assessment of Climate Change Impacts on Discharge in the Rhine River Basin: Results of the RheinBlick2050 Project; International Commission for the Hydrology of the Rhine Basin (CHR): Lelystad, The Netherlands, 2010. [Google Scholar]
  14. Frolova, N.L.; Agafonova, S.A.; Kireeva, M.B.; Povalishnikova, E.S.; Pakhomova, O.M. Recent changes of annual flow distribution of the Volga Basin rivers. Geogr. Environ. Sustain. 2017, 10, 28–39. [Google Scholar] [CrossRef]
  15. Wang, P.; Shpakova, R.N. Complex streamflow responses to climate warming in five river basins in South Yakutia, Russia. Front. Environ. Sci. 2022, 10, 1033943. [Google Scholar] [CrossRef]
  16. Medvedev, A.I. Bayesian Estimates of Changes in the Runoff of Russian Rivers in the XXI Century Based on CMIP6. Izv. Atmos. Ocean. Phys. 2024, 60, 135–156. (In Russian) [Google Scholar] [CrossRef]
  17. Sapozhnikova, A.A.; Gorelits, O.V. Characteristics of Long-Term and Seasonal Runoff Variability at the Head of the Mouth Area of the Onega River. Water Resour. 2025, 52, 18–32. (In Russian) [Google Scholar] [CrossRef]
  18. Stahl, K.; Hisdal, H.; Hannaford, J.; Tallaksen, L.M.; Van Lanen, H.A.J.; Sauquet, E.; Demuth, S.; Fendekova, M.; Jódar, J. Streamflow Trends in Europe: Evidence from a Dataset of Near-Natural Catchments. Hydrol. Earth Syst. Sci. 2010, 14, 2367–2382. [Google Scholar] [CrossRef]
  19. Magritsky, D.V.; Evstigneev, V.M.; Yumina, N.M.; Toropov, P.A.; Kenzhebaeva, A.; Ermakova, G.S. Changes of Runoff in the Ural River Basin. Mosc. Univ. Bulletin. Ser. 5 Geogr. 2018, 1, 90–101. Available online: https://vestnik5.geogr.msu.ru/jour/article/view/389/370?locale=ru_RU (accessed on 5 May 2025). (In Russian).
  20. Yumina, N.M.; Kozlov, M.O. Analysis of Long-Term Variability of River Runoff in the Ural River Basin. Eurasian Union Sci. 2021, 5, 8–11. (In Russian) [Google Scholar] [CrossRef]
  21. Sivokhip, Z.T.; Pavleychik, V.M. Current Trends in the Intra-Annual Distribution of River Runoff in the Ural River Basin. Bull. Irkutsk State Univ. Ser. Earth Sci. 2020, 33, 112–123. (In Russian) [Google Scholar] [CrossRef]
  22. Sivokhip, Z.T.; Pavleychik, V.M.; Padalko, Y.A. Changes in Low Flow in the Ural River Basin. Bull. Russ. Acad. Sci. Geogr. Ser. 2021, 85, 900–913. (In Russian) [Google Scholar] [CrossRef]
  23. Medeu, A.R.; Makhmudova, L.K.; Myrzakhmetov, A.B.; Zagidullina, A.R.; Kanai, M.A. Flood Situation on the Zhaiyk (Ural) River in 2024. Geogr. Water Resour. 2024, 4, 14–23. (In Russian) [Google Scholar] [CrossRef]
  24. Tursunova, A.A.; Myrzakhmetov, A.B.; Baspakova, G.R.; Sailaubek, A.M.; Salavatova, Z.T. Historical Overview of Hydrological Characteristics of Floods on the Zhaiyk River. Geogr. Water Resour. 2024, 2, 40–51. (In Russian) [Google Scholar] [CrossRef]
  25. Terekhov, A.G.; Sairov, S.B.; Abaev, N.N.; Sagatdinova, G.N.; Amirgaliev, E.N. On Possible Causes of Exceptionally Large Spring Floods in Kazakhstan in 2024. Curr. Probl. Remote Sens. Earth Space 2024, 21, 331–338. (In Russian) [Google Scholar] [CrossRef]
  26. ReliefWeb. Devastating Floods in Kazakhstan: A National Emergency. ReliefWeb, 12 June 2024. Available online: https://reliefweb.int/report/kazakhstan/devastating-floods-kazakhstan-national-emergency (accessed on 18 August 2025).
  27. ACAPS. Kazakhstan: Floods Briefing Note. ACAPS, 23 April 2024. Available online: https://www.acaps.org/fileadmin/Data_Product/Main_media/20240423_ACAPS_briefing_note_Kazakhstan_floods.pdf (accessed on 18 August 2025).
  28. Danilovich, I.S.; Loginov, V.F.; Groisman, P.Y. Changes of Hydrological Extremes in the Center of Eastern Europe and Their Plausible Causes. Water 2023, 15, 2992. [Google Scholar] [CrossRef]
  29. Laiskhanov, S.; Sharapkhanova, Z.; Myrzakhmetov, A.; Levin, E.; Taukebayev, O.; Nurmagambetuly, Z.; Kaster, S. Geo-Ecological Analysis of the Causes and Consequences of Flooding in the Western Region of Kazakhstan. Urban Sci. 2025, 9, 20. [Google Scholar] [CrossRef]
  30. Dottori, F.; Szewczyk, W.; Ciscar, J.-C.; Zhao, F.; Alfieri, L.; Hirabayashi, Y.; Bianchi, A.; Mongelli, I.; Frieler, K.; Betts, R.A.; et al. Increased Human and Economic Losses from River Flooding with Anthropogenic Warming. Nat. Clim. Change 2018, 8, 781–786. [Google Scholar] [CrossRef]
  31. Michalek, A.T.; Villarini, G.; Kim, T.; Quintero, F.; Krajewski, W.F.; Scoccimarro, E. Evaluation of CMIP6 HighResMIP for Hydrologic Modeling of Annual Maximum Discharge in Iowa. Water Resour. Res. 2023, 59, e2022WR034166. [Google Scholar] [CrossRef]
  32. Suram, A.; Anand, R.P.; Vema, V.K. Catchment Response to Climate Change under CMIP6 Scenarios: A Case Study of the Krishna River Basin. J. Water Clim. Change 2024, 15, 476–498. [Google Scholar] [CrossRef]
  33. Wu, Y.; Miao, C.; Fan, X.; Gou, J.; Zhang, Q.; Zheng, H. Quantifying the Uncertainty Sources of Future Climate Projections and Narrowing Uncertainties with Bias Correction Techniques. Earth’s Future 2022, 10, e2022EF002963. [Google Scholar] [CrossRef]
  34. Shukla, R.; Khare, D.; Kumar Dwivedi, A.; Rudra, R.P.; Palmate, S.S.; Ojha, C.S.P.; Singh, V.P. Evaluation of Statistical Downscaling Model’s Performance in Projecting Future Climate Change Scenarios. J. Water Clim. Change 2023, 14, 3559–3595. [Google Scholar] [CrossRef]
  35. Long, T.-T.; Ngo-Duc, T.; Phan-Van, T.; Tran, H.; Trinh, T.; Pham-Quang, N.; Nguyen-Xuan, T.; Tran-Anh, Q.; Do, N.; Nguyen, T. Future Rainfall Projections for the Lower Mekong Basin Using CMIP6 Dynamical Downscaling. J. Water Clim. Change 2025, 16, 1863–1876. [Google Scholar] [CrossRef]
  36. Fallah, B.; Rostami, M.; Russo, E.; Harder, P.; Menz, C.; Hoffmann, P.; Didovets, I.; Hattermann, F.F. Climate Model Downscaling in Central Asia: A Dynamical and a Neural Network Approach. Geosci. Model Dev. 2025, 18, 161–180. [Google Scholar] [CrossRef]
  37. Riahi, K.; Van Vuuren, D.P.; Kriegler, E.; Edmonds, J.; O’Neill, B.C.; Fujimori, S.; Bauer, N.; Calvin, K.; Dellink, R.; Fricko, O.; et al. The Shared Socioeconomic Pathways and Their Energy, Land Use, and Greenhouse Gas Emissions Implications: An Overview. Glob. Environ. Change 2017, 42, 153–168. [Google Scholar] [CrossRef]
  38. Davletgaliev, S.K.; Alimkulov, S.K.; Talipova, E.K. The possibility to applying simulated series for compile scenario forecasting river runoff. Environ. Earth Sci. 2020, 79, 397. [Google Scholar] [CrossRef]
  39. Lavrov, S.A.; Kalyuzhnyi, I.L. Influence of Climate Change on Spring Flood Runoff and Its Formation Factors in the Volga River Basin. Water Manag. Russ. 2016, 6, 42–60. (In Russian) [Google Scholar] [CrossRef]
  40. Gelfan, A.N.; Frolova, N.L.; Magritskii, D.V.; Kireeva, M.B.; Grigor’ev, V.Y.; Motovilov, Y.G.; Gusev, E.M. Influence of Climate on Annual and Maximum River Runoff in Russia: Assessment and Forecast. Fundam. Appl. Climatol. 2021, 7, 36–77. Available online: http://downloads.igce.ru/journals/FAC/FAC_2021/FAC_2021_1/Gelfan_A_et_al_FAC_2021_1.pdf (accessed on 24 May 2025). (In Russian). [CrossRef]
  41. Zaikov, B.D.; Belinkov, S.Y.; Sokolovskiy, D.L.; Karpov, B.G. Average Long-Term River Runoff of the USSR; Hydrometeoizdat: Moscow, Russia, 1937; 77p. (In Russian) [Google Scholar]
  42. Frieler, K.; Lange, S.; Piontek, F.; Reyer, C.P.O.; Schewe, J.; Warszawski, L.; Zhao, F.; Chini, L.; Denvil, S.; Emanuel, K.; et al. Assessing the Impacts of 1.5 °C Global Warming—Simulation Protocol of the Inter-Sectoral Impact Model Intercomparison Project (ISIMIP2b). Geosci. Model Dev. 2017, 10, 4321–4345. [Google Scholar] [CrossRef]
  43. Davletgaliev, S.K.; Dostaeva, A.D. Restoration of spring runoff series of the rivers of the Zhaiyk–Caspian basin. Hydrometeorol. Ecol. 2014, 1, 88–95. (In Russian) [Google Scholar]
  44. Kuzmin, V.A.; Gavrilov, I.S. Assessment of anthropogenic and climatic impacts on river runoff formation. Proc. Russ. State Hydrometeorol. Univ. 2012, 29, 36–42. (In Russian) [Google Scholar]
  45. UNESCO. Hydrological Analogy: Methodological Approaches to River Flow Reconstruction; UNESCO: Paris, France, 1999; 54p. [Google Scholar]
  46. Perevedentsev, Y.P.; Tudrii, V.D.; Vereshchagin, M.A. Practical Guide to the Production of Primary Statistical Processing and Analysis of Meteorological Series; Kazan State University: Kazan, Russia, 2009; 34p. (In Russian) [Google Scholar]
  47. Polyak, I.I. Numerical Methods for Observation Analysis; Hydrometeoizdat: Leningrad, Russia, 1975; 211p. (In Russian) [Google Scholar]
  48. Sikan, A.V. Methods of Statistical Processing of Hydrometeorological Information; Russian State Hydrometeorological University (RSHU): St. Petersburg, Russia, 2007; 279p. (In Russian) [Google Scholar]
  49. Helsel, D.R.; Hirsch, R.M. Statistical Methods in Water Resources; U.S. Geological Survey Techniques and Methods, Book 4, Chap. A3; USGS: Reston, VA, USA, 2020. [Google Scholar] [CrossRef]
  50. Lavrov, S.A.; Kalyuzhnyi, I.L. Physical Processes and Patterns of Winter and Spring Runoff Formation in the Volga River Basin under Climate Change Conditions. Water Manag. Russ. 2012, 4, 74–84. Available online: https://waterjournal.ru/files/wj/1619070965.pdf (accessed on 24 June 2025). (In Russian).
  51. Georgievskii, V.Y.; Grek, E.A.; Grek, E.N.; Lobanova, A.G.; Molchanova, T.G. Assessment of current changes in maximum river runoff in Russia. Meteorol. Hydrol. 2019, 11, 46–55. Available online: https://elibrary.ru/item.asp?id=41550783 (accessed on 10 August 2025). (In Russian).
  52. Vladimirov, A.M. Factors determining occurrence of the high flow and highest water level during a flood. Sch. Notes Russ. State Univ. Humanit. 2009, 9, 22–39. Available online: http://elib.rshu.ru/files_books/pdf/9-3.pdf (accessed on 18 August 2025). (In Russian).
  53. Dmitrieva, V.A.; Nefedova, E.G. Hydrological response to changing climatic conditions and human activities in the Upper Don River basin. Probl. Geogr. Hydrol. Changes 2018, 145, 285–297. (In Russian) [Google Scholar]
  54. Barnett, T.P.; Adam, J.C.; Lettenmaier, D.P. Potential impacts of a warming climate on water availability in snow-dominated regions. Nature 2005, 438, 303–309. [Google Scholar] [CrossRef] [PubMed]
  55. Stewart, I.T.; Cayan, D.R.; Dettinger, M.D. Changes toward earlier streamflow timing across western North America. J. Clim. 2005, 18, 1136–1155. [Google Scholar] [CrossRef]
  56. Do, H.X.; Leonard, M.; Westra, S. A global-scale investigation of trends in annual maximum streamflow. J. Hydrol. 2017, 552, 28–43. [Google Scholar] [CrossRef]
  57. Gal’perin, R.I.; Kolcha, T.V.; Avezova, A. The Ural River: The risk of floods in the lower reaches under current conditions. Hydrometeorol. Ecol. 2008, 4, 155–165. (In Russian) [Google Scholar]
  58. Davletgaliev, S.; Baimakhan, Z. Calculation of spring runoff characteristics of rivers in the eastern part of the Caspian region. Hydrometeorol. Ecol. 2019, 3, 105–113. (In Russian) [Google Scholar]
  59. Sivokhip, Z.T.; Pavleychik, V.M.; Chibilev, A.A. Change in the river water regime of the Ural River Basin. Dokl. Earth Sci. 2019, 488, 1217–1221. [Google Scholar] [CrossRef]
  60. Moldakhmetov, M.M.; Makhmudova, L.K.; Kurmangazy, E. Statistical parameters of spring flood runoff time series of the Yesil River basin. Bull. KazNU. Geogr. Ser. 2020, 56, 39–49. Available online: https://bulletin-geography.kaznu.kz/index.php/1-geo/article/view/889 (accessed on 18 August 2025). (In Russian).
  61. Kalyuzhnyi, I.L.; Lavrov, S.A. Variability of frost depth in the Volga River basin and its impact on runoff formation in winter and spring under climate change. Russ. Meteorol. Hydrol. 2016, 41, 487–496. [Google Scholar] [CrossRef]
  62. Georgiadi, A.G.; Koronkevich, N.I.; Kashutina, E.A.; Barabanova, E.A. Natural-climatic and anthropogenic changes in the runoff of the Volga and Don rivers. Fundam. Appl. Climatol. 2016, 2, 55–78. (In Russian) [Google Scholar] [CrossRef]
  63. Gorbatenko, A.V.; Varentsova, N.A.; Kireeva, M.B. Transformation of spring flood and freshet runoff in the Upper Volga River basin under the influence of climate change. Water Sect. Russ. Probl. Technol. Manag. 2021, 4, 6–28. (In Russian) [Google Scholar] [CrossRef]
  64. Magritskii, D.V.; Kenzhebaeva, A. Patterns, features, and causes of variability of annual and seasonal river runoff in the Ural River basin. Sci. Technol. 2017, 3, 39–61. (In Russian) [Google Scholar]
  65. Birimbayeva, L.; Makhmudova, L.; Alimkulov, S.; Tursunova, A.; Tigkas, D.; Abayev, N.; Dostayeva, A.; Birimbayev, Z.; Alzhanov, O.; Rodrigo-Clavero, M.-E.; et al. Reaction of minimal streamflow to natural factors in the context of climate uncertainty. Water Resour. Manag. 2025, 39, 6009–6025. [Google Scholar] [CrossRef]
  66. Eyring, V.; Bony, S.; Meehl, G.A.; Senior, C.A.; Stevens, B.; Stouffer, R.J.; Taylor, K.E. Overview of the Coupled Model Intercomparison Project Phase 6 (CMIP6) experimental design and organization. Geosci. Model Dev. 2016, 9, 1937–1958. [Google Scholar] [CrossRef]
  67. Döscher, R.; Ramos, A.; Reerink, T.; Rousset, C.; Ruprich-Robert, Y.; Le Sager, P.; Wyser, K.; Boussetta, S.; Caron, L.-P.; Carver, G.; et al. The EC-Earth3 Earth system model for the Coupled Model Intercomparison Project 6. Geosci. Model Dev. 2022, 15, 2973–3020. [Google Scholar] [CrossRef]
  68. Nguyen, N.Y.; Kha, D.D.; Hat, D.T.T. Climate change impact on the streamflow for the Nam Ou catchment in the Mekong River Basin using CMIP6 GCMs. J. Ecol. Eng. 2023, 24, 209–217. [Google Scholar] [CrossRef]
  69. Döll, P.; Trautmann, T.; Gerten, D.; Müller Schmied, H.; Ostberg, S.; Saaed, F. Risks for the global freshwater system at 1.5 °C and 2 °C global warming. Environ. Res. Lett. 2018, 13, 044038. [Google Scholar] [CrossRef]
  70. Miao, C.; Wu, Y.; Fan, X.; Su, J. Projections of global land runoff changes and their uncertainty characteristics during the 21st century. Earth’s Future 2023, 11, e2022EF003286. [Google Scholar] [CrossRef]
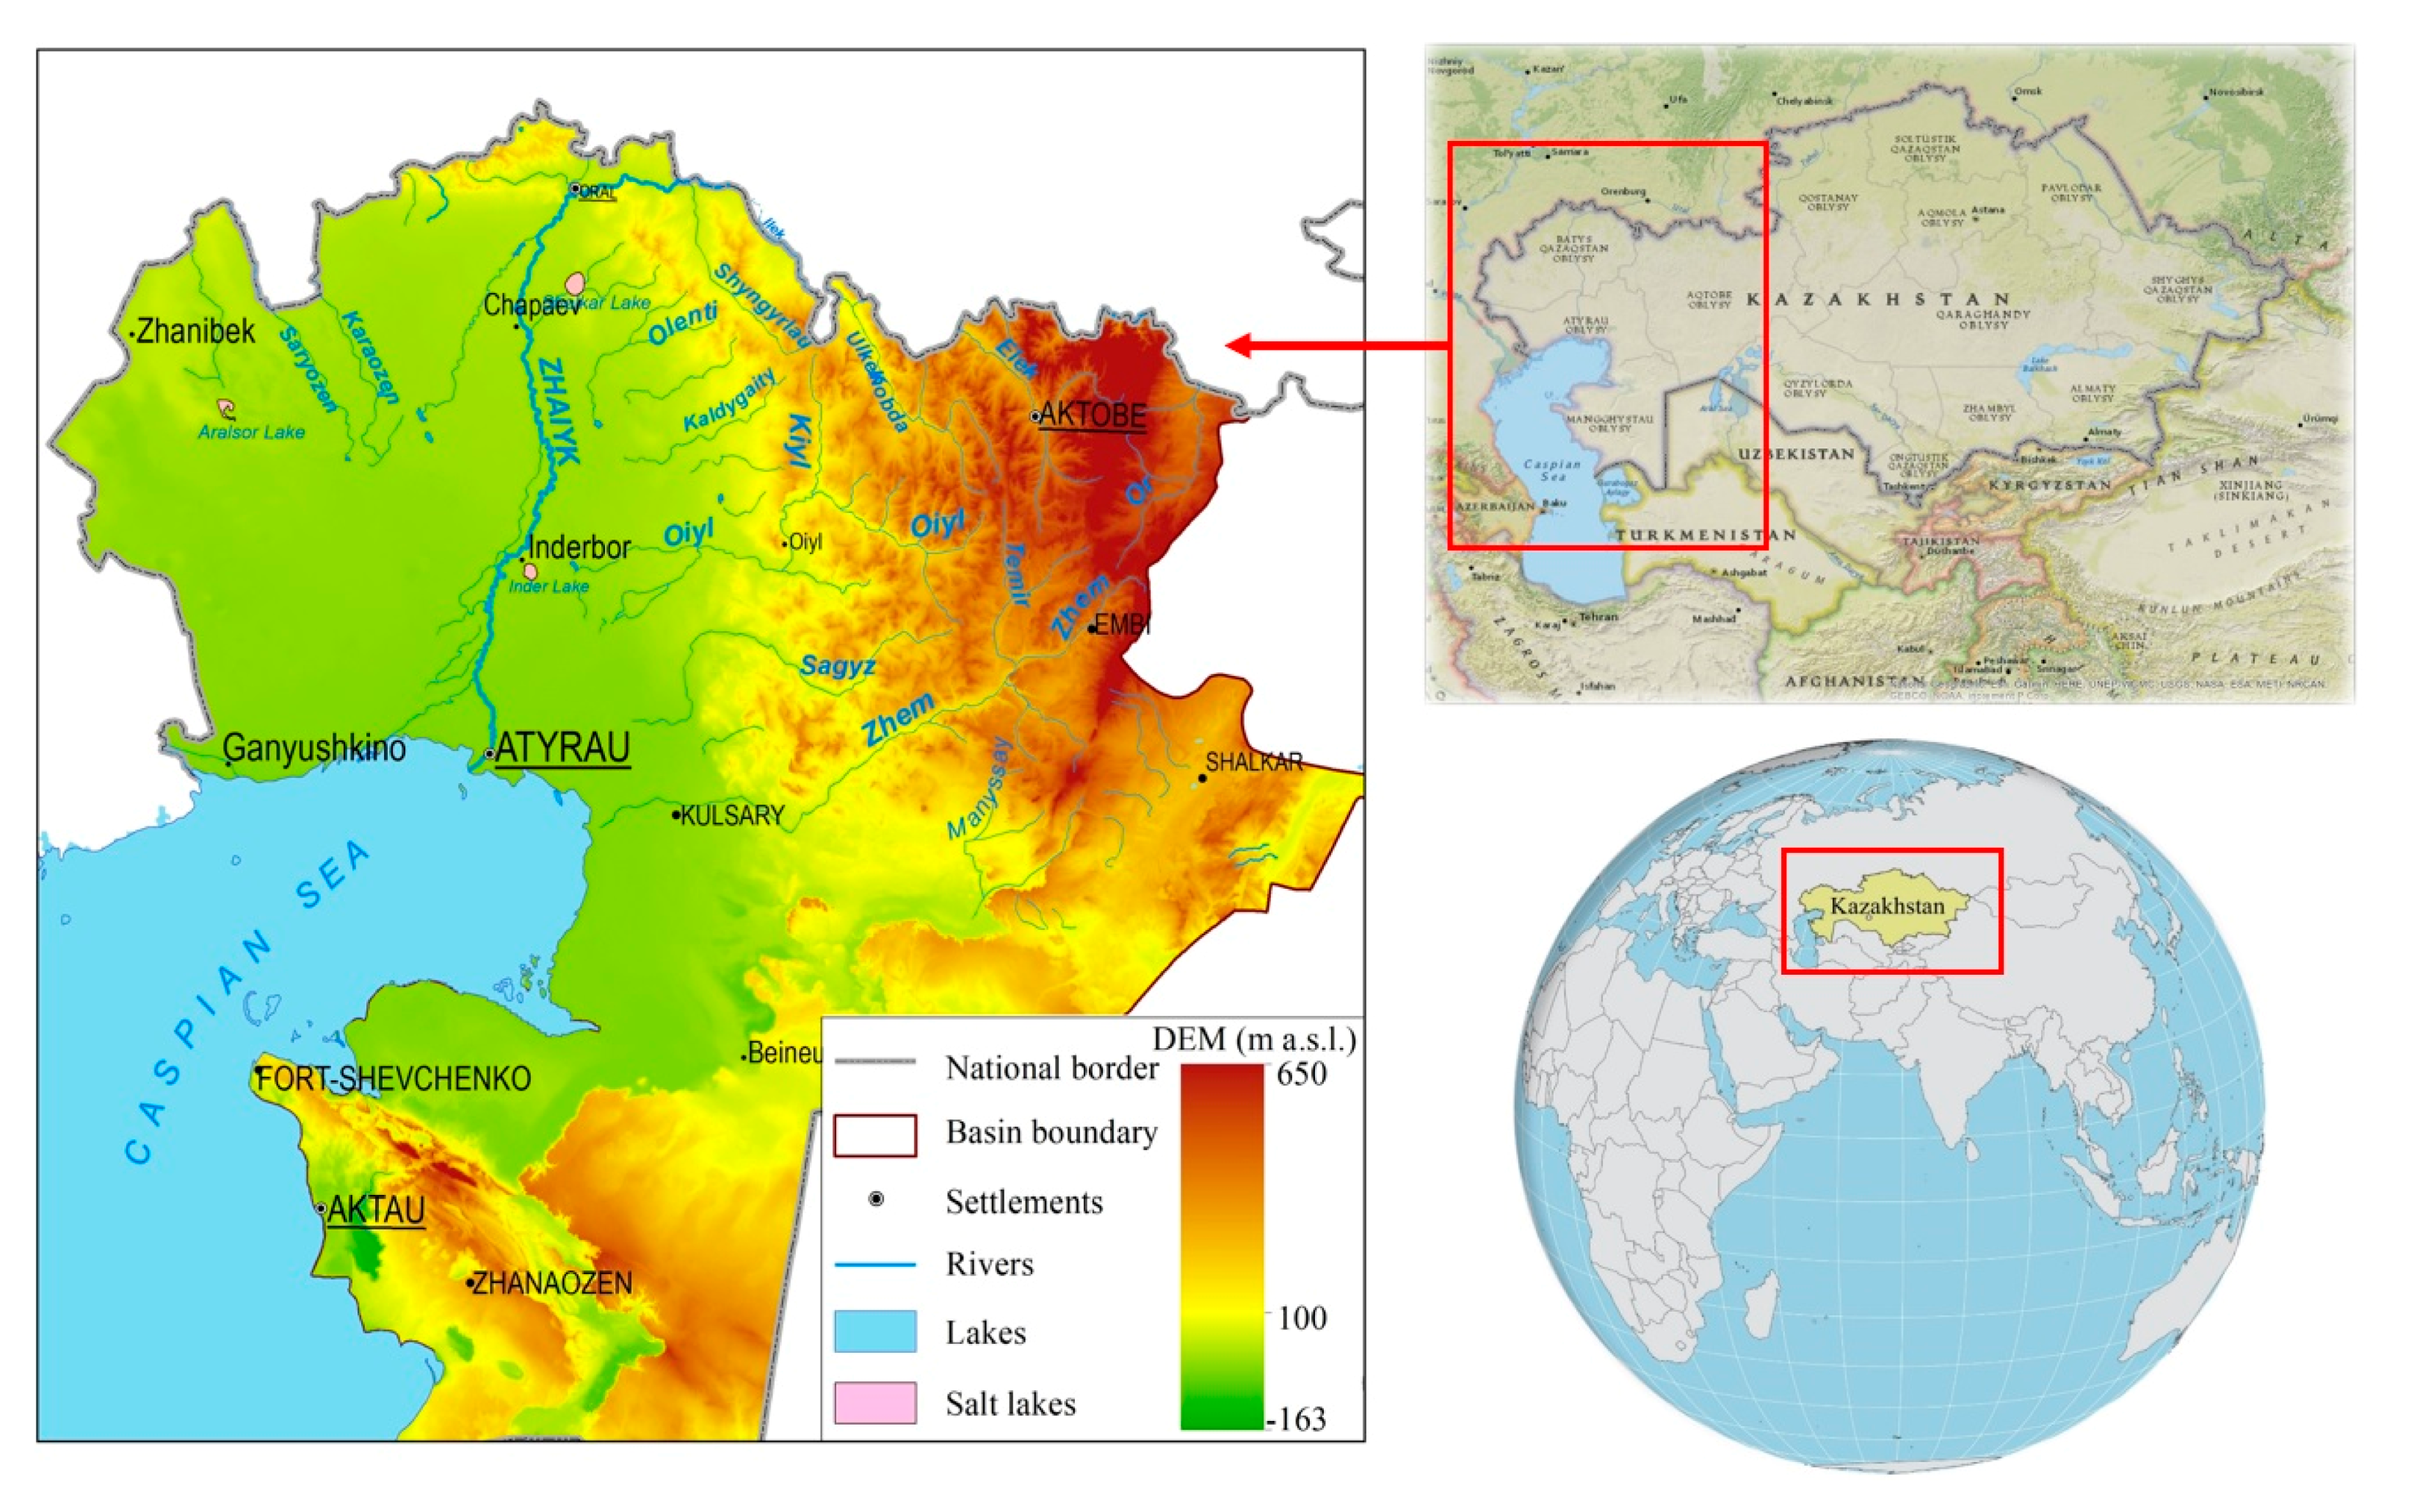
Figure 1. Overview map of the Zhaiyk–Caspian basin.
Hydrology 12 00278 g001
Figure 2. Location of hydrological posts (HP) and meteorological stations (MSs) in relation to hydrologically homogeneous areas.
Hydrology 12 00278 g002
Figure 3. Changes in the volume of spring runoff of the left-bank tributaries of the Zhaiyk River (blue columns—before 1973, red columns—after 1974).
Hydrology 12 00278 g003
Figure 4. Multiyear dynamics of changes in flood volume of left-bank tributaries of the Zhaiyk River.
Hydrology 12 00278 g004
Figure 5. Changes in the volume of spring runoff of rivers flowing from the eastern part of the Caspian lowland (blue columns—before 1973, red columns—after 1974).
Hydrology 12 00278 g005
Figure 6. Multiyear dynamics of changes in flood volume of rivers flowing from the eastern part of the Caspian lowlands.
Hydrology 12 00278 g006
Figure 7. Changes in the volume of spring runoff of right-bank tributaries of the Zhaiyk River (blue columns—before 1973, red columns—after 1974).
Hydrology 12 00278 g007
Figure 8. Multiyear dynamics of changes in flood volume of right-bank tributaries of the Zhaiyk River.
Hydrology 12 00278 g008
Figure 9. Changes in the volume of spring runoff of southern rivers (blue columns—before 1973, red columns—after 1974).
Hydrology 12 00278 g009
Figure 10. Multiyear dynamics of changes in flood volume in southern rivers.
Hydrology 12 00278 g010
Figure 11. Multiyear dynamics of maximum water discharges.
Hydrology 12 00278 g011
Figure 12. Scenario forecast of maximum runoff volume for the years 2030, 2040 and 2050 according to scenarios SSP3-7.0 and SSP5-8.5.
Hydrology 12 00278 g012
Figure 13. Scenario projection of maximum runoff volume change (%) compared to the base period 1991–2020 under the SSP3-7.0 scenario.
Hydrology 12 00278 g013
Figure 14. Scenario projection of maximum runoff volume change (%) compared to the base period 1991–2020 under the SSP5-8.5 scenario.
Hydrology 12 00278 g014
Table 1. List of hydrological posts (HP) of the Zhaiyk–Caspian basin.
Gauging StationObservation PeriodWatershed Area, km2Multi-Year Average Discharge, m3/s
I district—left-bank tributaries of the Zhaiyk River
1Shyngyrlau–Lubenka1963–present time6410.40
2Shyngyrlau–Kentubek1940–present time46603.42
3Elek–Shelek1940–present time37,30032.6
4Karakobda–Alpaisai1962–present time22402.32
5Ulken Kobda–Kobda1940–present time81104.84
6Ulken Kobda–Kogaly1980–present time14,2007.84
7Sarykobda–Bessarabsky1956–19956750.45
8Terisakkan–Astrakhanskiy1956–19954460.38
9Elek–Rzd № 471950–199010901.12
10Karagandy–Kandagach1948–19892220.26
11Kosestek–Kosestek1956–present time2810.77
12Aktasty–Belogorskiy1946–present time450.17
13Terisbutak–Belogorskiy1946–199019.80.09
14Elek–Aktobe1938–present time11,00014.8
15Kargaly–Kargalinskoe1940–present time50009.54
16Or–Bogetsai1956–present time74805.43
II district—rivers of the western part of the Common Szyrt
17Derkul–Taskala1963–present time3920.76
18Derkul–Beles1962–present time18204.38
19Shagan–Kamenny1931–201040008.80
20Shyzhyn 2–Chizha 21940–present time5091.61
21Shizhyn 1–Chizha 11957–present time4561.43
IV district—rivers flowing from the southern part of the Pre-Urals plateau
22Olenty–Zhympity1940–present time12901.25
23Shiderty–Araltobe1963–present time7500.81
24Buldurty–Karaagach1963–19904570.43
25Kaldygaity–Zhigerlen1940–present time25101.72
26Shili–Akshy1956–19923180.32
27Kopirankaty–Algabas1940–present time7230.76
V district—southern rivers
28Temir–Leninskiy1932–present time53103.84
29Zhem–Zharkamys1941–199126,00010.8
30Oyil–Taltogai1936–198217,0007.21
31Shigyrlykumdy–aul № 10 1956–199211100.64
32Kiyil–Novonadezhdinskiy1956–19987200.79
33Ashyoyil–Maimak1956–199249000.94
34Sagyz–Sagyz1949–199899301.00
Table 2. List of meteorological stations (MSs) of the Zhaiyk–Caspian basin.
Meteorological StationObservation PeriodAltitude Above Sea Level, m
I district—left-bank tributaries of the Zhaiyk River
1Chingirlau1928–present time103
2Aksai1937–present time63
3Novoalexeevka1937–present time143
4Novorossiyskoe1925–present time415
5Ilinski1958–present time191
6Kos-Istek1956–present time338
7Rodnikovka1930–present time372
8Aktobe1898–present time219
II district—rivers of the western part of the Common Szyrt
9Kamenka1954–present time72
10Uralsk1888–present time35
IV district—rivers flowing from the southern part of the Pre-Urals plateau
11Dzhambeita1897–present time31
12Karatobe1958–present time44
V district—southern rivers
13Temir1894–present time234
14Emba1904–present time252
15Uil1886–present time95
16Karauylkeldy1937–present time200
17Sagyz1954–present time55
Table 3. Calculation scheme of the maximum runoff of the rivers of the Zhaiyk–Caspian basin.
River–PointMeteorological StationCalculation Dependencies
I—left-bank tributaries of the Zhaiyk River
1ShyngyrlauNovoalexeevka Q m a x = f ( T V I X ; P I X I I I ;   T X I I I I )
2Elek, OrAktobe, Kos-Istek, Rodnikovka
3Kargaly, Kosestek, TerisbutakKos-Istek, Rodnikovka
4Ulken Kobda, Karakobda, Sarykobda, TerisakkanNovoalexeevka, Ilinski Q m a x = f ( P I X I I I ;   T X I I I I )
II—rivers of the western part of the Obshchy Syrt
1Derkul, Shyzhyn 2, Shizhyn 1Uralsk, Kamenka Q m a x = f ( T V I X ; P I X I I I ;   T X I I I I )
2ShaganUralsk, Yanvartsevo
IV—rivers flowing from the southern part of the Podural Plateau
1OlentyDzhambeita, Karatobe Q m a x = f ( T V I X ; P I X I I I ;   T X I I I I )
2KopirankatyDzhambeita, Aksai
3Buldurty, KaldygaityKaratobe
4ShidertyDzhambeita, Karatobe, Aksai Q m a x = f ( T V I X ; P I X X ; P X I I I I I ; T X I I I I )
V—southern rivers
1Temir, ZhemEmba, Temir Q m a x = f ( T V I X ; P I X I I I ;   T X I I I I )
2SagyzSagyz, Karauylkeldy
3OyilKarauylkeldy, Uil, Temir
4AshyoyilKarauylkeldy, Uil
5ShigyrlykumdyKarauylkeldy, Temir
Table 4. Characteristics of spring flooding of the rivers of the Zhaiyk–Caspian basin.
River–PointPeriodFlood Start Date, dayFlood End Date, daysDuration of Flood, dayQmax, m3/sVolume of Runoff During the Flood, mln. m3
I district—left-bank tributaries of the Zhaiyk River
Ulken Kobda–KobdaBefore 197305/IV08/V34411176
1974–202228/III03/V37175115
Δ−7−5+3−57%−35%
Elek–AktobeBefore 197301/IV18/V49736537
1974–202231/III02/V33525410
Δ−1−16−16−29%−24%
Aktasty–BelogorskiyBefore 197302/IV29/IV28155.8
1974–202230/III23/IV25103.9
Δ−3−6−3−35%−32%
Kargaly–KargalinskoeBefore 197306/IV14/V39505343
1974–202230/III29/IV32386266
Δ−7−15−7−24%−23%
II district—rivers of the western part of the Obshchy Syrt
Shagan–KamennyBefore 197302/IV06/V35408207
1974–202228/III01/V35385175
Δ−5−50−6%−15%
Shyzhyn 2–Chizha 2Before 197330/III01/V337934
1974–202226/III15/IV205823
Δ−4−15−12−26%−33%
IV district—rivers flowing from the southern part of the Podural Plateau
Kaldygaity–ZhigerlenBefore 197301/IV03/V3312343
1974–202225/III18/IV258539
Δ−7−14−8−31%−8%
Kopirankaty–AlgabasBefore 197331/III30/IV317123
1974–202226/III18/IV245722
Δ−5−12−7−20%−5%
V district—southern rivers
Temir–LeninskiyBefore 197301/IV04/V34338142
1974–202229/III28/IV32269109
Δ−3−6−2−21%−24%
Oyil–TaltogaiBefore 197301/IV12/V42320235
1974–202201/IV08/V38209182
Δ0−4−5−35%−23%
Zhem–ZharkamysBefore 197327/III14/V49454402
1974–202225/III02/V38335305
Δ−2−13−10−26%−24%
Note: Δ—indicates the difference between the two periods (shown in bold).
Table 5. Coefficients of linear trend of climatic characteristics.
Meteorological StationPeriodΣP for Months IX–X,
mm/10 years
ΣP for Months XI–III,
mm/10 years
T av for Months VI–X °C/10 yearsT av for Months XI–III °C/10 years ΣT—(Negative Temperatures) for Months XII–III
1Sagyz1961–2022−2.51.40.40.348.5
2Karatobe1959–2022−1.53.20.30.561.6
3Ilinski1960–2022−0.2−0.90.30.450.8
4Kos-Istek1958–2022−3.17.40.20.332.9
5Kamenka1956–2022−0.3−3.80.30.451.0
6Novorossiyskoe1961–2022−4.1−1.40.30.332.9
7Karauylkeldy1940–19732.619.00.20.2−8.3
1974–2022−0.110.40.40.453.5
1940–2022−1.16.70.30.447.1
8Emba1940–19734.224.00.00.2−7.3
1974–2022−1.7−2.40.20.337.9
1940–2022−1.63.80.20.337.6
9Uil1940–19732.224.20.00.23.1
1974–20220.55.20.40.565.7
1940–2022−1.43.90.20.449.5
10Temir1951–1973−0.516.9−0.20.5−5.9
1974–2022−3.2−1.50.30.455.2
1951–2022−2.93.90.20.557.1
11Novoalexeevka1940–1973−0.512.80.10.1−24.8
1974–2022−2.5−2.20.40.651.2
1940–2022−1.77.20.20.443.7
12Dzhambeita1940–1973−5.719.70.20.2−21.7
1974–20221.2−3.90.40.558.9
1940–2022−2.31.20.20.556.4
13Aktobe1940–1973−0.519.70.20.529.1
1974–2022−1.65.10.40.553.1
1940–2022−1.211.80.20.557.6
14Rodnikovka1940–19738.040.50.00.33.8
1974–2022−4.6−4.30.40.448.6
1940–2022−4.35.50.30.444.3
15Aksai1940–1973−2.713.60.20.532.5
1974–2022−0.049.30.40.562.0
1940–2022−1.57.80.20.560.4
16Uralsk1940–1973−2.920.50.20.4−2.1
1974–2022−0.72.10.50.552.1
1940–20220.055.60.20.555.6
17Chingirlau1940–1973−3.615.90.20.311.3
1974–2022−0.9−1.90.50.447.0
1940–2022−2.44.30.20.450.2
Note: Statistically significant trends are shown in blue (precipitation) and orange (air temperature).
Table 6. Number of thaw events with different durations.
Meteorological StationPeriodsNumber of Thaw Events with Duration
0–5 Days6–10 Days11–15 Days16–20 Days20–30 Days
Aksai1940–1973159740
1974–20228161381
Uralsk1940–1973118744
1974–20228791111
Chingirlau1940–1973137714
1974–20221017738
Chapaevo1940–1973115747
1974–20226714713
Aktobe1940–1973157542
1974–202211151183
Martuk1940–1973157912
1974–202213141064
Novoalexeevka1940–1973119535
1974–20221281188
Uil1936–1973169930
1974–202216141133
Karauylkeldy1940–1973189530
1974–202212191240
Table 7. Forecast of air temperature changes for the period June–October (TVI-X) according to climate scenarios SSP3-7.0 and SSP5-8.5.
Hydrological DistrictsMeteorological StationSSP
Scenarios
PeriodsChange in °C from the 1991–2020 Baseline Period
1991–20202030 (2026–2035)2040 (2036–2045)2050 (2046–2055)
I districtNovorossiyskoe3–7.015.717.618.318.71.92.63.1
5–8.517.818.618.82.12.93.1
Aktobe3–7.017.118.719.319.91.62.22.8
5–8.518.819.520.01.72.42.9
Kos-Istek3–7.014.918.118.819.33.23.84.4
5–8.518.218.919.43.34.04.4
Rodnikovka3–7.015.518.018.719.22.53.23.6
5–8.518.218.919.42.63.33.8
Novoalexeevka3–7.017.619.420.120.61.82.43.0
5–8.519.620.320.82.02.63.1
Aksai3–7.017.319.319.920.42.02.73.1
5–8.519.520.120.62.22.93.4
Chingirlau3–7.017.519.119.820.21.62.32.7
5–8.519.319.920.41.82.53.0
II district Kamenka3–7.016.919.219.920.42.33.03.5
5–8.519.420.120.62.53.23.7
Yanvartsevo3–7.017.219.320.020.52.22.93.4
5–8.519.620.220.62.43.13.4
Uralsk3–7.017.419.219.920.41.82.53.0
5–8.519.520.120.62.12.73.2
IV district Dzhambeita3–7.018.320.220.921.41.92.63.1
5–8.520.421.121.62.12.73.3
Karatobe3–7.018.420.921.622.12.53.13.7
5–8.521.121.722.32.73.33.9
V districtEmba3–7.018.218.819.520.00.71.31.9
5–8.519.019.620.10.81.51.9
Temir3–7.017.919.219.920.51.42.02.6
5–8.519.420.020.51.52.22.6
Karauylkeldy3–7.019.920.421.021.60.61.21.8
5–8.520.621.221.80.71.41.9
Sagyz3–7.020.220.821.422.00.61.21.8
5–8.521.021.622.20.71.41.9
Uil3–7.019.220.521.121.71.42.02.5
5–8.520.721.321.91.62.22.7
Note: Air temperature values are given in °C, and bold text indicates the most significant changes at particular meteorological stations.
Table 8. Forecast of changes in total precipitation for the period September–March (XIX-III) according to climate scenarios SSP3-7.0 and SSP5-8.5.
Hydrological DistrictsMeteorological StationSSP
Scenarios
PeriodsChange in mm from the 1991–2020 Baseline Period
1991–20202030 (2026–2035)2040 (2036–2045)2050 (2046–2055)
I district Novorossiyskoe3–7.0195256279283314345
5–8.5264285288354647
Aktobe3–7.0180198226234102630
5–8.5215232230202928
Kos-Istek3–7.0213237275284112933
5–8.5254279266193125
Rodnikovka3–7.0198268288282364643
5–8.5275296288395046
Novoalexeevka3–7.0165199222222213534
5–8.5224226222363735
Aksai3–7.0159188191182182014
5–8.5179206193133021
Chingirlau3–7.0156190204200223128
5–8.5196215212263836
II district Kamenka3–7.0170162163157−5−4−7
5–8.5161161155−5−5−9
Yanvartsevo3–7.0200233246249172325
5–8.5250254245252723
Uralsk3–7.0189234241227242720
5–8.5230237226212520
IV district Dzhambeita3–7.0135178194179324433
5–8.5180193186334338
Karatobe3–7.0137159172170162624
5–8.5166172173212626
V district Emba3–7.0118140170190194461
5–8.5160175172364946
Temir3–7.0163179212233103043
5–8.5207223229273740
Karauylkeldy3–7.0123144169182173848
5–8.5174179188424653
Sagyz3–7.092122138145324957
5–8.5140143147525559
Uil3–7.0145173185201192839
5–8.5191191195323234
Note: Precipitation values are given in millimeters (mm).
Table 9. Forecast of air temperature changes for the period November–March (TXI–III) according to climate scenarios SSP3-7.0 and SSP5-8.5.
Hydrological
Districts
Meteorological StationSSP ScenariosPeriodsChange in °C from the 1991–2020 Baseline Period
1991–20202030 (2026–2035)2040 (2036–2045)2050 (2046–2055)
I district Novorossiyskoe3–7.0−9.8−8.1−7.4−6.61.82.53.3
5–8.5−8.1−7.3−7.01.82.52.8
Aktobe3–7.0−8.3−6.8−5.9−5.31.52.32.9
5–8.5−6.8−5.9−5.41.42.42.8
Kos-Istek3–7.0−9.8−7.7−6.9−6.32.02.83.4
5–8.5−7.8−6.9−6.41.92.93.4
Rodnikovka3–7.0−9.2−7.2−6.4−5.82.02.83.4
5–8.5−7.3−6.3−5.91.92.83.2
Novoalexeevka3–7.0−7.7−5.8−5.0−4.41.92.73.4
5–8.5−5.9−5.0−4.51.82.73.3
Aksai3–7.0−7.1−5.4−4.7−4.01.72.43.2
5–8.5−5.6−4.6−4.11.52.53.0
Chingirlau3–7.0−7.5−5.7−5.0−4.31.82.53.2
5–8.5−5.9−4.9−4.41.62.53.1
II district Kamenka3–7.0−7.0−4.7−4.1−3.42.33.03.6
5–8.5−5.0−3.9−3.42.03.13.7
Yanvartsevo3–7.0−7.0−6.0−5.2−4.51.01.82.5
5–8.5−6.0−5.2−4.81.01.82.2
Uralsk3–7.0−6.7−5.0−4.4−3.61.62.33.0
5–8.5−5.3−4.3−3.71.42.42.9
IV district Dzhambeita3–7.0−6.5−4.5−3.8−3.12.02.73.4
5–8.5−4.7−3.8−3.11.82.83.4
Karatobe3–7.0−6.3−4.2−3.4−2.92.12.93.4
5–8.5−4.3−3.3−2.92.03.03.4
V district Emba3–7.0−8.1−7.0−6.1−5.61.22.02.6
5–8.5−7.0−6.1−5.71.12.12.5
Temir3–7.0−7.9−6.3−5.5−5.01.52.42.9
5–8.5−6.3−5.4−5.01.52.52.8
Karauylkeldy3–7.0−6.8−4.7−3.8−3.32.13.03.5
5–8.5−4.6−3.7−3.32.23.13.5
Sagyz3–7.0−5.7−4.3−3.3−2.91.42.42.8
5–8.5−4.2−3.3−2.91.52.42.8
Uil3–7.0−6.3−4.7−3.9−3.41.62.32.9
5–8.5−4.8−3.8−3.41.52.42.9
Note: Air temperature values are given in °C, and bold text indicates the most significant changes at particular meteorological stations.
Disclaimer/Publisher’s Note: The statements, opinions and data contained in all publications are solely those of the individual author(s) and contributor(s) and not of MDPI and/or the editor(s). MDPI and/or the editor(s) disclaim responsibility for any injury to people or property resulting from any ideas, methods, instructions or products referred to in the content.