Article

A Geospatial Assessment Toolbox for Spatial Allocation of Large-Scale Nature-Based Solutions for Hydrometeorological Risk Reduction

by
Adam Mubeen
1,2,*,
Vishal Balaji Devanand
2,
Laddaporn Ruangpan
3,
Zoran Vojinovic
2,4,
Arlex Sanchez Torres
2,
Jasna Plavšić
5,
Natasa Manojlovic
6,
Guido Paliaga
7,
Ahmad Fikri Abdullah
8,
João P. Leitão
9,
Agnieszka Wojcieszak
10,
Marzena Rutkowska-Filipczak
10,
Katarzyna Izydorczyk
11,
Tamara Sudar
12,
Božidar Deduš
13,
Draženka Kvesić
13,
Lyudmil Ikonomov
14 and
Valery Penchev
15
1
Department of Biotechnology, Faculty of Applied Sciences, Delft University of Technology, 2629 HZ Delft, The Netherlands
2
Water Supply Sanitation Environmental Engineering, IHE Delft Institute for Water Education, 2611 AX Delft, The Netherlands
3
Deltares, P.O. Box 177, 2600 MH Delft, The Netherlands
4
Centre for Water Systems, College of Engineering, University of Exeter, Exeter EX4 4QF, UK
5
Faculty of Civil Engineering, University of Belgrade, 11000 Belgrade, Serbia
6
Institute of River and Coastal Engineering, Hamburg University of Technology (TUHH), 21073 Hamburg, Germany
7
Geographical Information Systems International Group, GISIG, 16138 Genova, Italy
8
International Institute of Aquaculture and Aquatic Sciences (I-AQUAS), Universiti Putra Malaysia, Port Dickson 70150, Malaysia
9
Swiss Federal Institute of Aquatic Science and Technology (Eawag), CH-8600 Dübendorf, Switzerland
10
Regionalny Zarzad Gospodarki Wodnej w Warszawie, 03-194 Warszawa, Poland
11
European Regional Centre for Ecohydrology of the Polish Academy of Sciences, 90-364 Lodz, Poland
12
Institute for Water Management, 76300 Bijeljina, Bosnia and Herzegovina
13
PRONING DHI Ltd., 10000 Zagreb, Croatia
14
Consulting Centre for Sustainable Development Geopont-Intercom Ltd., 9000 Varna, Bulgaria
15
Black Sea–Danube Association for Research and Development (BDCA), 9003 Varna, Bulgaria
*
Author to whom correspondence should be addressed.
Hydrology 2025, 12(10), 272; https://doi.org/10.3390/hydrology12100272
Submission received: 30 August 2025 / Revised: 3 October 2025 / Accepted: 9 October 2025 / Published: 17 October 2025

Abstract

The compounding effects of hydrometeorological hazards are being driven by climate change. As urban areas expand, this leads to degradation of the surrounding environment and exposes more people to hazards. Growing losses show that conventional approaches to addressing these issues can compound these problems. Over the last few decades, nature-based solutions (NBSs) have become an increasingly popular alternative. These measures, inspired by natural processes, have shown potential for reducing hazards by complementing traditional approaches and providing co-benefits in the form of eco-system services. With the adoption of NBSs becoming a more mainstream approach, there is a need for tools that support the planning and implementation of interventions. Geospatial suitability assessment is a part of this planning process. Existing tools are limited in their application for large-scale measures. This paper intends to improve this by building upon a multi-criteria analysis (MCA)-based approach that incorporates biophysical and land use criteria and conditions for mapping the suitability of large-scale NBSs. The methodology was developed and tested on six sites to assess the suitability of floodplain restoration, retention or detention, afforestation, and forest buffer strips. The resulting suitability maps also show potential for combining two or more measures for greater risk reduction.

1. Introduction

Climate change causes significant challenges in this century, evident in the increasing frequency and magnitude of hydrometeorological extreme events such as floods, landslides, windstorms, and droughts [1]. This trend is concerning as it exposes more people to these risks each year [2]. Over the last two decades, hydrological disasters have affected over 2.8 billion people and killed more than 200,000 [3]. Unfortunately, these numbers are expected to increase in the near future, emphasizing the urgent need for mitigation and adaptation strategies to address the adverse impacts of climate change on hydrometeorological risks.
Historically, grey infrastructure such as concrete dams, dikes, and drainage systems has been used to protect communities from extreme hydrometeorological events. However, in the last few decades, there has been a paradigm shift, leaning towards approaches like ecosystem-based adaptation (EbA), blue–green infrastructure, and nature-based solutions (NBSs) to mitigate the impacts against these extreme events. NBSs are inspired by or supported by nature [4]. The size of these measures can vary considerably. Small scale measures such as green roofs, rain gardens, and bioswales are typically seen in urban settings [5].
Large-scale, catchment-level interventions integrate different measures within a system to achieve long-term strategies [6]. Examples include retention ponds and detention basins for storing water, regulating water flow to effectively manage floodwater by increasing room for water bodies by restoring floodplains, widening, and deepening rivers [7,8]. Measures such as forest conservation, reforestation, and afforestation can lessen the risk by reducing peak flow [9]. Increasing vegetation cover can also reduce urban heat [10]. These measures not only reduce risk, but they have the potential to provide additional benefits in the form of ecosystem services and opportunities for social benefits. They offer opportunities to enhance biodiversity [11,12] and contribute to mitigating climate change by absorbing more CO2 through biotic carbon assimilation processes [13]. Access to green areas provides opportunities for recreation and can have benefits for human well-being [14].
As the adoption of NBSs increases, it becomes more important to ensure they are designed and implemented based on current knowledge and best practices [15]. In this regard, selecting an NBS and determining locations suitable for intervention is a significant part of the planning process. As such, there is a great need for tools to support these activities. Fontana et al. [16] proposed methods for the selection of an NBS, based on risk reduction as the main objective. Ruangpan et al. [17] developed a multi-criteria (MCA) framework that integrates stakeholder preferences in choosing the right NBSs for local needs. Similarly, several tools for assessing the geospatial suitability of NBSs exist [18,19,20]. However, they were found to be restricted to small-scale or urban interventions, applicable to a specific location, or limited by software compatibility or data needs [21].
To address this issue, Mubeen et al. [21] developed a GIS-based toolbox for mapping the suitability of four large-scale measures: floodplain restoration, a detention basin, a retention pond, and river widening. One major limitation of the toolbox developed by Mubeen et al. [21] is that it can only analyse spatial suitability for these four types of NBSs. Additionally, the suitability maps produced did not consider smaller settlements in the analysis. Finally, the version of ESRI ArcMap that the toolbox was developed for has been discontinued and is no longer supported.
This study aims to update and expand the methodology from Mubeen et al. [21] by developing models for geospatial assessment and allocation of two additional large-scale NBSs. The improved method will be applied on the six European collaborator sites of the RECONECT project [22]. The objectives include the identification of hazards and risk, the selection of NBSs, the determination of suitability criteria and conditions, the development of a suitable toolbox, and the application of the methodology on the case studies detailed below.

2. Materials and Methods

2.1. Case Studies

The six European collaborator sites that are studied are the Bregana River Basin, Jadar River Basin, Kamchia River Basin, Pilica River Basin, Tamnava River Basin, and the Vrbanja River Basin. They are distributed along central and eastern Europe (Figure 1), including the Balkans.

2.1.1. The Bregana River Basin, Croatia

The dense hydrographic network that makes up the Bregana River is a 92 km2 basin with steep slopes. It is a 26 km long transboundary river flowing along the border between Croatia and Slovenia, and is a tributary of the Sava River, joining it in its middle course. It is prone to flash floods and erosion triggered by heavy rainfall combined with typically saturated soil in spring and late autumn. Recent major events include floods in the year 2005, 2014, and 2015. Houses were flooded, while the concrete cascades, bridges, and culverts as well as asphalt and macadam roads were damaged. Apart from partial bank stabilisation along the main river course, other flood mitigation measures do not exist in the basin.

2.1.2. The Jadar River Basin, Serbia

The 81.7 km long Jadar River, located in western Serbia, flows into the Drina River, the longest tributary of the Sava River. The drainage area covers 990 km2 of a mostly flat and wide valley that receives several torrential tributaries and is therefore prone to frequent torrential floods. The Jadar River Valley is well known for its floods, which occur virtually every year. In May 2014, devastating flash floods particularly affected the municipality of Krupanj, causing significant material damage and fatalities. Current flood mitigation measures in the basin are not sufficient because they are limited to the dikes along the Jadar River near its mouth and within few population centres.

2.1.3. The Kamchia River Basin, Bulgaria

The Kamchia River in eastern Bulgaria is the longest river in the Balkan peninsula flowing into the Black Sea. The basin covers 5358 km2 and 5% of the area of Bulgaria. The basin consists of mostly rural regions with advanced agricultural practices, mainly crop-based. The river supplies drinking water to the cities of Varna (population 420,000) and Burgas (280,000) from the Ticha and Tsonevo reservoirs. About 30% of the area is also designated as Natura 2000 protected areas. Several locations within the basin are prone to frequent fluvial or pluvial flooding. Two significant floods in the Kamchia River’s middle course in 2015 and 2018 forced the evacuation of residents from one town and one village but did not result in any fatalities or significant material damage. The floods followed days of intense rain after which stormwater cascaded down the slopes. Existing flood mitigating facilities in the basin include reservoirs, dikes, floodgates, drainage canals, and others, but there is potential for introducing NBSs as additional measures.

2.1.4. The Pilica River Basin, Poland

Located in central Poland, the Pilica River is the Vistula River’s longest left tributary. The Pilica River is 319 km long, with a basin size of 9252 km2. The catchment is mainly covered by arable land and forests which make up 39.6% and 38.6% of the area, respectively. The watershed of the Pilica River is known for its rapid runoff, but both floods and droughts are identified as the main hazards in the basin. Floods in the main Pilica course are controlled by four major reservoirs, while the upper parts of the basin are more prone to floods and erosion, requiring measures to improve flood and erosion control, water quality, and water balance during drought conditions.

2.1.5. The Tamnava River Basin, Serbia

The 87 km long Tamnava River, a tributary of the Kolubara River, which itself is a tributary of the Sava River, flows across western Serbia. The Tamnava River and its principal tributary Ub are found in the 726 km2 Tamnava basin. While the upper watershed is mountainous, making the region vulnerable to flash floods, the middle and lower sections are distinguished by flat river valleys experiencing regular fluvial floods. Devastating floods struck the basin in 1999, 2006, 2009, and 2014. A three-month rainfall record caused widespread flooding in both urban and rural regions in May 2014 [23]. Houses, portions of highways, and bridges were destroyed by high-intensity flash floods, and there were also reported fatalities. Flooding in this region still poses a threat to infrastructure, residential and commercial properties, crops, and human life despite existing mitigation efforts [24] consisting of dikes within urban centres in the most downstream sections.

2.1.6. The Vrbanja River Basin, Bosnia and Herzegovina

One of Bosnia and Herzegovina’s most significant integrated water management systems, the Vrbas River basin, includes the Vrbanja River basin. It occupies an area of 804 km2 and is situated in the Republic of Srpska’s central region. The Vrbanja River’s top course is mountainous with steep hills, the middle course is somewhat hilly, and the lower course is a lowland. Sixty-one percent of the land is covered by forests. Intense deforestation resulted in the acquisition of farmed land throughout the basin. Given the increasing tendency of flood flows over the past ten to fifteen years, the Vrbanja River watershed is particularly vulnerable to flash floods. The flat, densely populated downstream areas are likewise at risk of flooding. Most of the mitigation measures implemented are in the basin’s urban areas. They primarily involve grey structural solutions such as embankments, regulating river channels, and clearing bottlenecks such as bridge structures.

2.2. Identification of Hazards and Needs

It has been reported that the most common causes of disasters in Europe are hazards related to water [25]. This is observed across the areas in this study, with flooding being the most common hazard across all the study areas. The Kamchia River Basin experienced both fluvial and pluvial floods. The Bregana, Jadar, Tamnava, and Vrbanja River Basins recorded mostly fluvial floods, including flash floods. The Pilica River Basin flood was driven by snowmelt and rainfall, largely in summer.
In addition to flooding, the Tamnava and Pilica River Basins experienced droughts [26]. The increasing prevalence of geophysical hazards such as landslides and earthquakes is of concern as well. Erosion was prevalent in the Jadar River Basin. Both study areas in Serbia (Jadar and Tamnava River Basins) also reported landslides [27].
The potential impacts of these hazards on infrastructure and economic activities must not be understated. The study areas are rural or peri-urban areas with agriculture as the most common activity. Therefore, damage to this sector is considered a serious risk. Roads and highways passing through these regions have been identified as vulnerable infrastructure. Similarly, the need to protect local ecosystems and enhance biodiversity is just as important.

2.3. Selection of NBSs for Hydrometeorological Risk Reduction

Liera et al. [27] carried out preliminary selection of NBSs using the RECONECT measure selection tool. Measures that were either unsuitable or not relevant to a specific site were removed. The measures were then ranked using a multi-criteria analysis (MCA) framework, developed by Ruangpan et al. [17], that selected measures based on the stakeholder preferences for that area. The stakeholders that participated in the process include local, regional, and national authorities, civil society and NGOs, political representatives, commercial/private sector, academia, and international organizations. A total of 110 stakeholders across 6 cases provided input via an online questionnaire [17,27]. Stakeholders ranked measures based on their preferences for achieving the goal of risk reduction and subgoals related to water quality, biodiversity, habitat structure, human well-being, and socio-economic benefits.
The large-scale NBSs that ranked highest for the hazard combinations of flooding, landslide, and drought, and the subgoals based on Liera et al. [27] include the following: (1) reforestation and forest conservation, (2) afforestation, forests, and naturally vegetated lands, (3) floodplain excavation, enlargement, or restoration, (3) upper watershed restoration, (4) bypass or diversion channels, (5) retention ponds, (6) detention basins, (7) buffer strips, (8) natural bank stabilisation, (9) wetland restoration and enhancement, and (10) widening water bodies. These NBSs may be divided into three categories based on the mechanism by which they reduce hazards: source control (forest conservation, reforestation, afforestation, upper watershed restoration, buffer strips, and natural bank stabilisation), water storage (wetland restoration, retention ponds, and detention basins), and making room for water bodies (floodplain restoration and widening rivers) [7,28,29].

2.4. Mapping Suitability of NBSs

The next step in the process is to assess the spatial suitability of the measures. Mubeen et al. [21] applied GIS-based MCA to develop an ArcGIS toolbox with models for mapping suitability for floodplain restoration (FP), as well as retention ponds and detention basins (RDs). In previous work, we reviewed existing tools for spatial allocation of NBSs at the time to identify criteria and conditions that can be used to determine the suitability of large-scale NBSs. Slope, land use/landcover, buffer zones from roads, distance from streams, and soil class were used as general criteria for assessing the suitability of NBSs based on their applicability in the spatial allocation of diverse NBS types over varying scales. Additional criteria that were specific to each NBS were included in the models as well.
The toolbox was set up to derive Boolean maps that show regions that match the conditions set for each criterion. The suitability of NBSs was elucidated by combining these maps through intersection to delineate zones where all the relevant criteria are met.
In this study, we improve existing models and expand the toolbox by adding models for assessing the suitability of source control measures, namely afforestation (AF) and forest buffer strips (FB), to the toolbox. These two measures were chosen as they ranked high in the selection process, and the toolbox currently does not include any NBS that works through source control. The NBSs included in the toolbox are described in Appendix A: Description of Nature-based solutions.

2.4.1. Refining the Existing Model for Mapping Suitability

The previous study [21] used slope, distance from rivers, distance from roads, and land use/land cover (LULC) as general criteria for spatial allocation of large-scale NBSs. In addition to the general criteria, NBS-specific criteria, which in this case include delineation of upstream, midstream, and downstream areas, and connectivity to existing streams, were used to map suitability for floodplain restoration, retention, or detention ponds in the Tamnava River Basin.
However, the resulting suitability maps did not account for rural development, particularly for small towns and villages. This was attributed to the use of the Corine Land Cover (CLC) 2018 [30] as LULC. CLC 2018 provided maps with extensive classification with 44 land cover types. The lower resolution (100 m) of the product means that finer details in a built-up area are missing from the analysis.
A more recent LULC product, WorldCover 2021 [31] released by European space agency (ESA), provides 10 m resolution maps. While WorldCover is limited to 11 land use classes, the high-resolution representation of built-up areas can be used to address the limitations in our previous study. Thus, in addition to CLC 2018, ESA WorldCover has been added to the model as an additional input to improve the assessment of LULC within the suitability mapping toolbox. Additionally, the toolbox and existing models have been updated to be compatible with ArcGIS pro version 3.
Along with this improved toolbox for mapping the suitability of measures that provide storage and room for the rivers, a similar approach is used to produce models that map areas with potential for using vegetative measures, including afforestation and riparian forest buffers.

2.4.2. Criteria and Conditions for Mapping Suitability of Vegetative Measures

The conceptual model and criteria from Mubeen et al. [21] are applicable in the assessment of the geospatial suitability of afforestation and forest buffers. The general criteria (slope, distance from stream, road buffer, LULC, and soil class) and respective conditions used in the model can be kept unchanged or may be adjusted based on the needs of the user and the availability of data. For example, the condition used for road buffers is 50 m from the centre line of roads to account for roads and roadside infrastructure. This has been left unchanged as detailed data on roads, for example width, layout, and pavement extent, were not available for the study areas. However, the conditions related to slope, distance from streams, LULC, and soil have been adjusted to suit vegetative measures.
Kokutse et al. [32] determined that the threshold at which plant roots could significantly improve the stability of a slope is between 30° and 40° (57.7 to 83.9% slope) depending on the type of soil. It can also be difficult for plants to establish and grow on slopes steeper than 60° (173%) [33]. Based on these findings and the design principles and considerations in soil bioengineering techniques provided by the Natural Resources Conservation Agency of the United States Department of Agriculture [34], a threshold of 60% was used as a condition for slopes.
For reclassifying land use, any areas that contain forests, natural areas, wetlands, and waterbodies were classified as currently existing vegetated or natural sites and considered unsuitable. Similarly, urban fabric, built-up zones, and industrial areas, including mining, were presumed to be less likely to change and were also removed in the assessment.
The width of riparian vegetation can vary significantly along the length of a river. Mac Nelly et al. [35] found that the width of these zones varied between 5 and 55 m, within steam orders 1 to 4. However, groundwater levels which are dependent on slope and soil type may be a more reliable indicator of the width of the riparian zone [36]. While groundwater data are available for set observation points or wells, there is not enough information to estimate groundwater levels across the catchment. A conservative distance of 100 m from the banks or centre line of streams was treated as suitable for riparian forest buffers. This criterion was not used to assess the suitability of afforestation as it is not necessary for vegetation to be in proximity to streams or rivers as long as plants have access to water from other sources.
In lieu of soil type, hydrogeology was used as an NBS-specific criterion for afforestation and forest buffers. For this criterion, aquifer type was sourced from the International Hydrogeological Map of Europe (IHME1500) produced by Bundesanstalt für Geowissenschaften und Rohstoffe (BGR; Federal Institute of Geo-sciences and Natural Resources), Hanover, Germany [37]. The aquifer type is used as a representation of the availability of ground water for plants. Areas with highly or locally productive aquifers were selected as appropriate areas for vegetative measures.

2.4.3. Setting up the Toolbox for Mapping Suitability

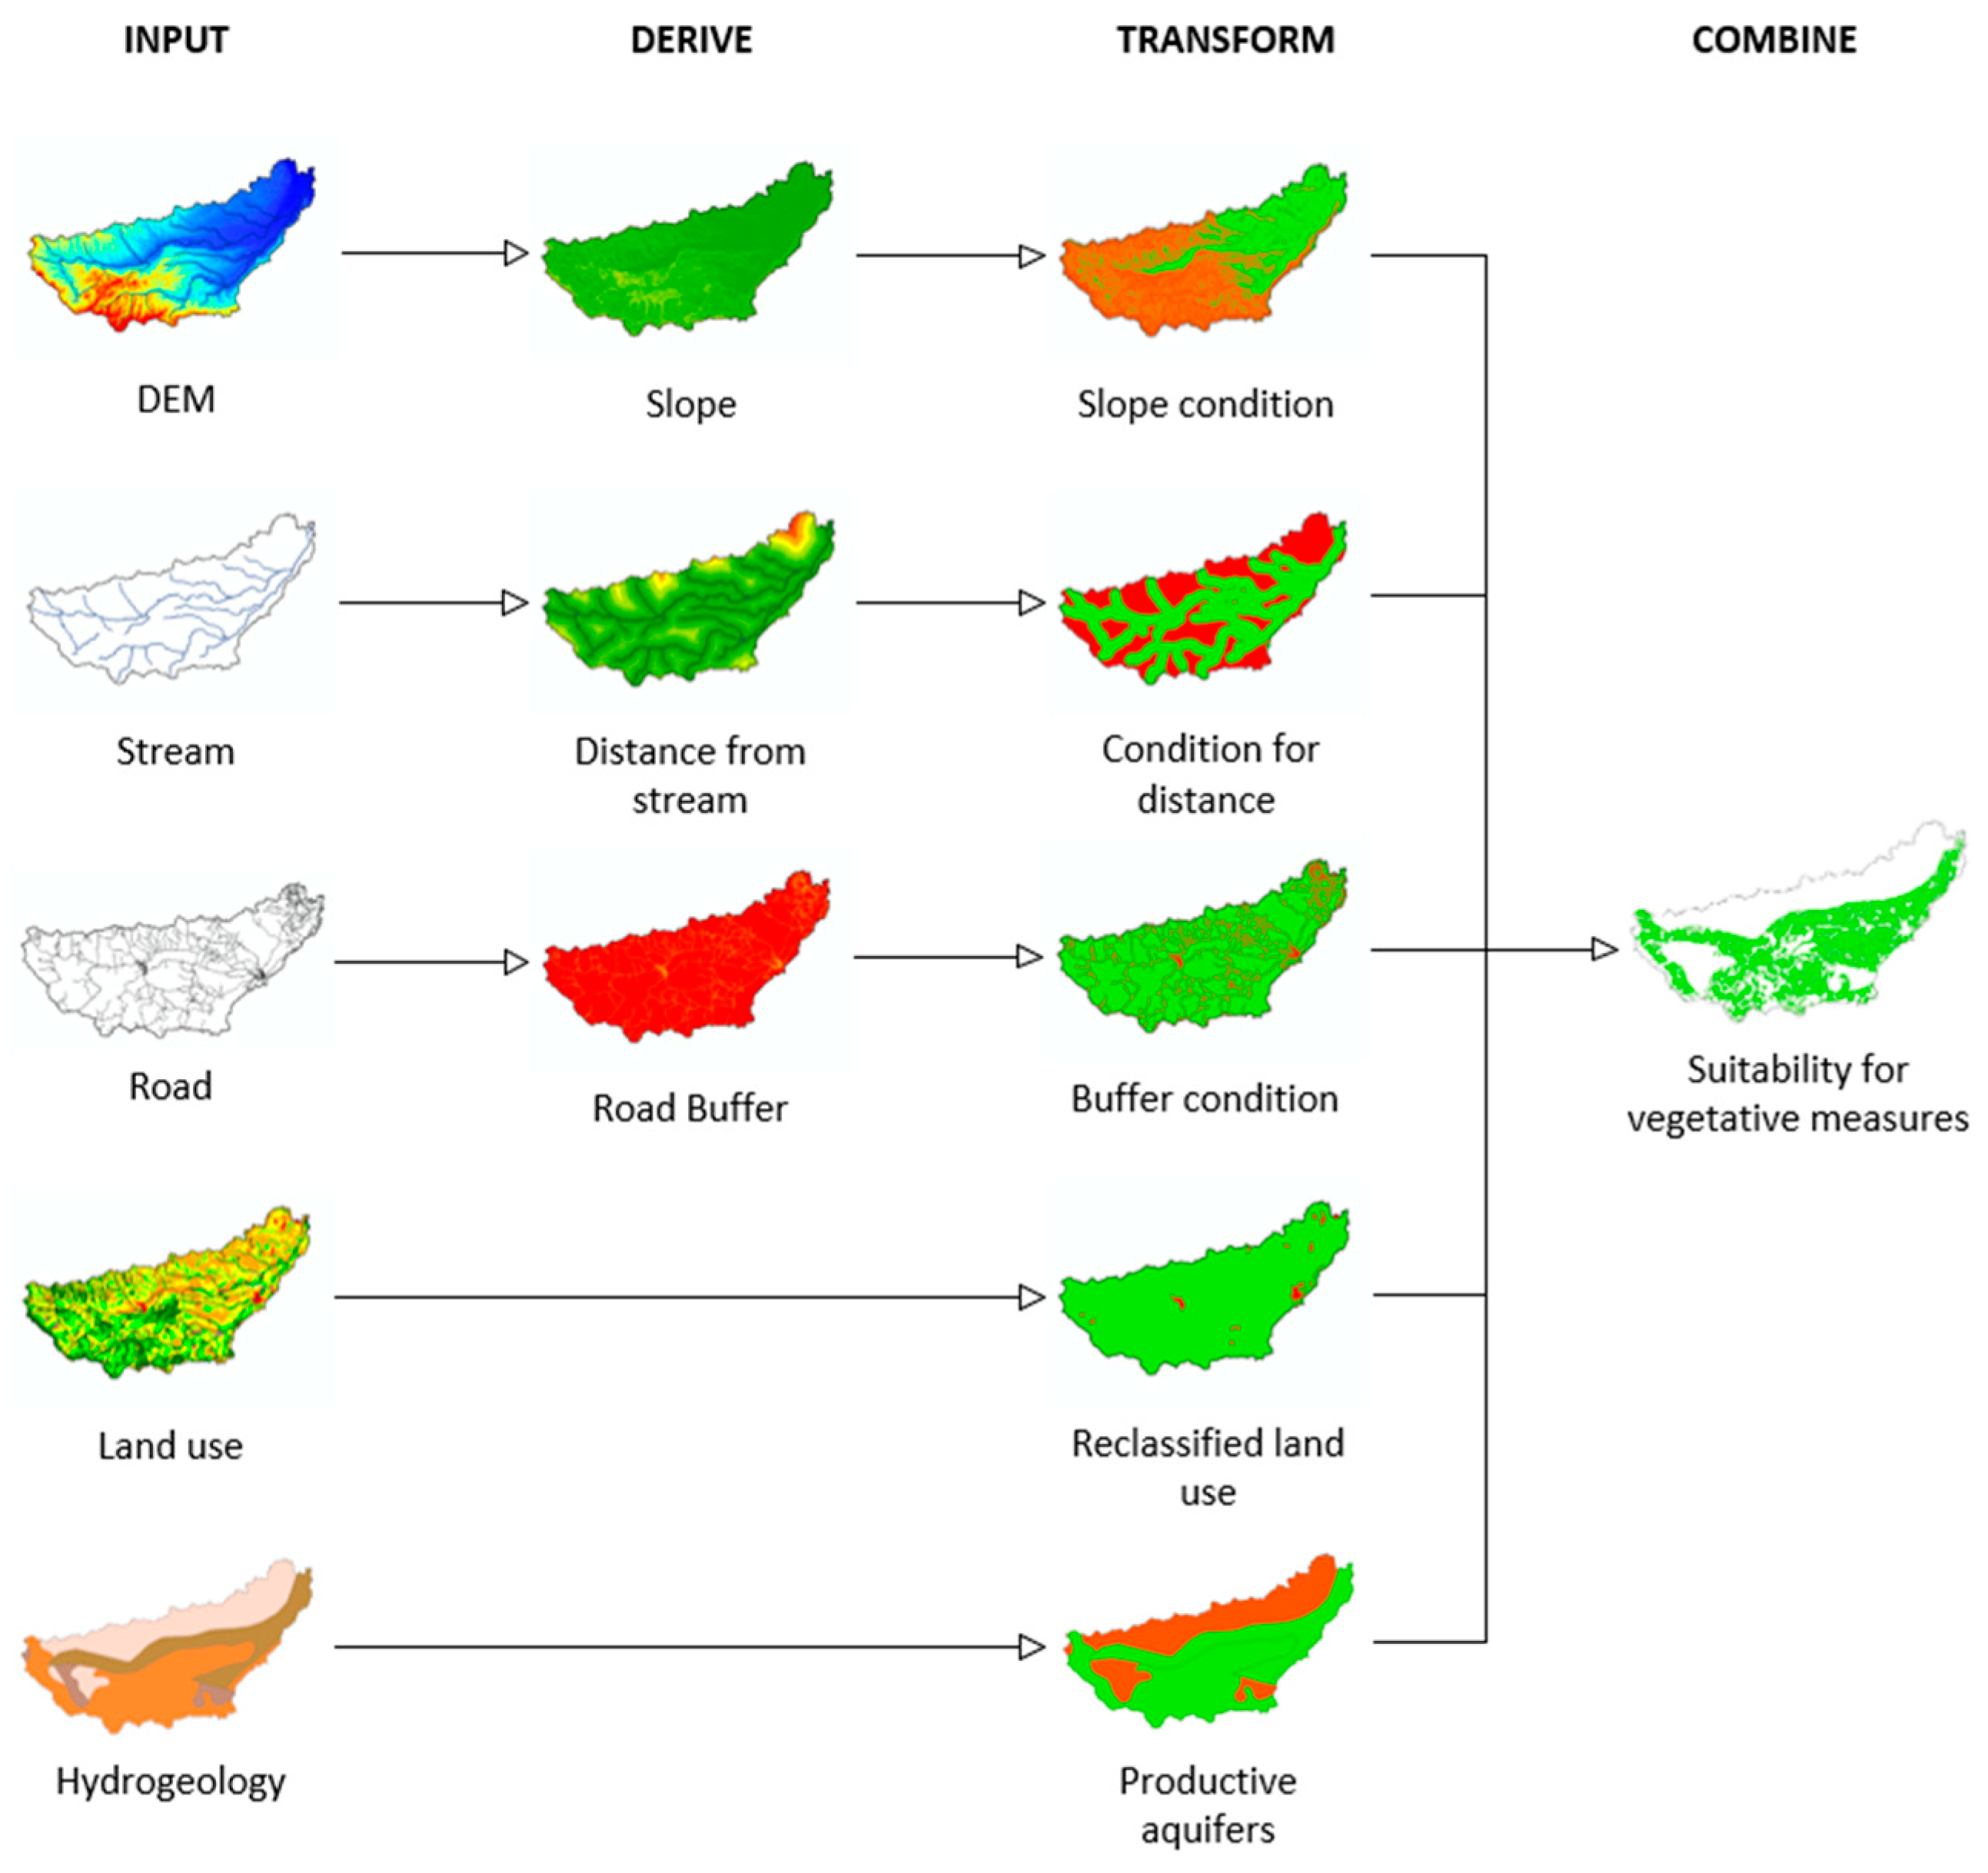
The criteria and conditions described in the preceding sections were used to modify the models produced by Mubeen et al. [21] and to build an updated toolbox in the model builder environment of ArcGIS Pro 3.3, using geoprocessing tools for spatial analysis. Two new models were added to the suitability toolbox, for afforestation and forest buffer strips. As before, the conceptual model from Mubeen et al. [21] was used as a basis to define the input and the processes needed to assess the geospatial suitability of these NBSs. The workflow for mapping the suitability of vegetative measures is illustrated in Figure 2. The base maps used as the input are described in Table 1.
The slope was derived using digital elevation models (DEMs) from EU-DEM version 1.1 [38]. The spatial analysis tool “Distance accumulation” was used to calculate the distance from stream and roads. It replaced “Euclidean distance” in the updated toolbox. Intermediate results were derived through raster calculation for the criteria slope, distance from streams, and road buffer. LULC was reclassified to show areas that are suitable and have the potential for respective measures. The resolution of all maps, derived in intermediate processes, was set as the highest resolution within the input data, i.e., 10 m. The criteria and conditions used in the suitability mapping process are provided in Appendix B: Criteria and conditions for suitability of NBS in Table A1, Table A2, Table A3 and Table A4.
For simplification, all intermediate results were transformed to Boolean scale, 1 for suitable and 0 for not suitable. This ensures that all of the maps are on the same scale before starting the final processes. The areas that are suitable, i.e., the areas with pixel values equal to 1, were extracted using conditional raster calculations. These maps individually show suitability for each criterion. They were transformed into vectors to produce polygons. Since the aquifer type dataset is already available as shapefiles from IHME 1500, it was used after removing unsuitable areas. They can easily be removed by selecting those features from the attribute table and deleting them. An intersection process was carried out to produce suitability maps that show regions where all the relevant criteria are met. Any polygons that of less than 1 hectare (rounded up) are removed in post-processing as they consist of mostly disjointed or disconnected zones. A snapshot of the workflow in ArcGIS Pro’s ModelBuilder environment is provided in Appendix B: Figure A1.

3. Results

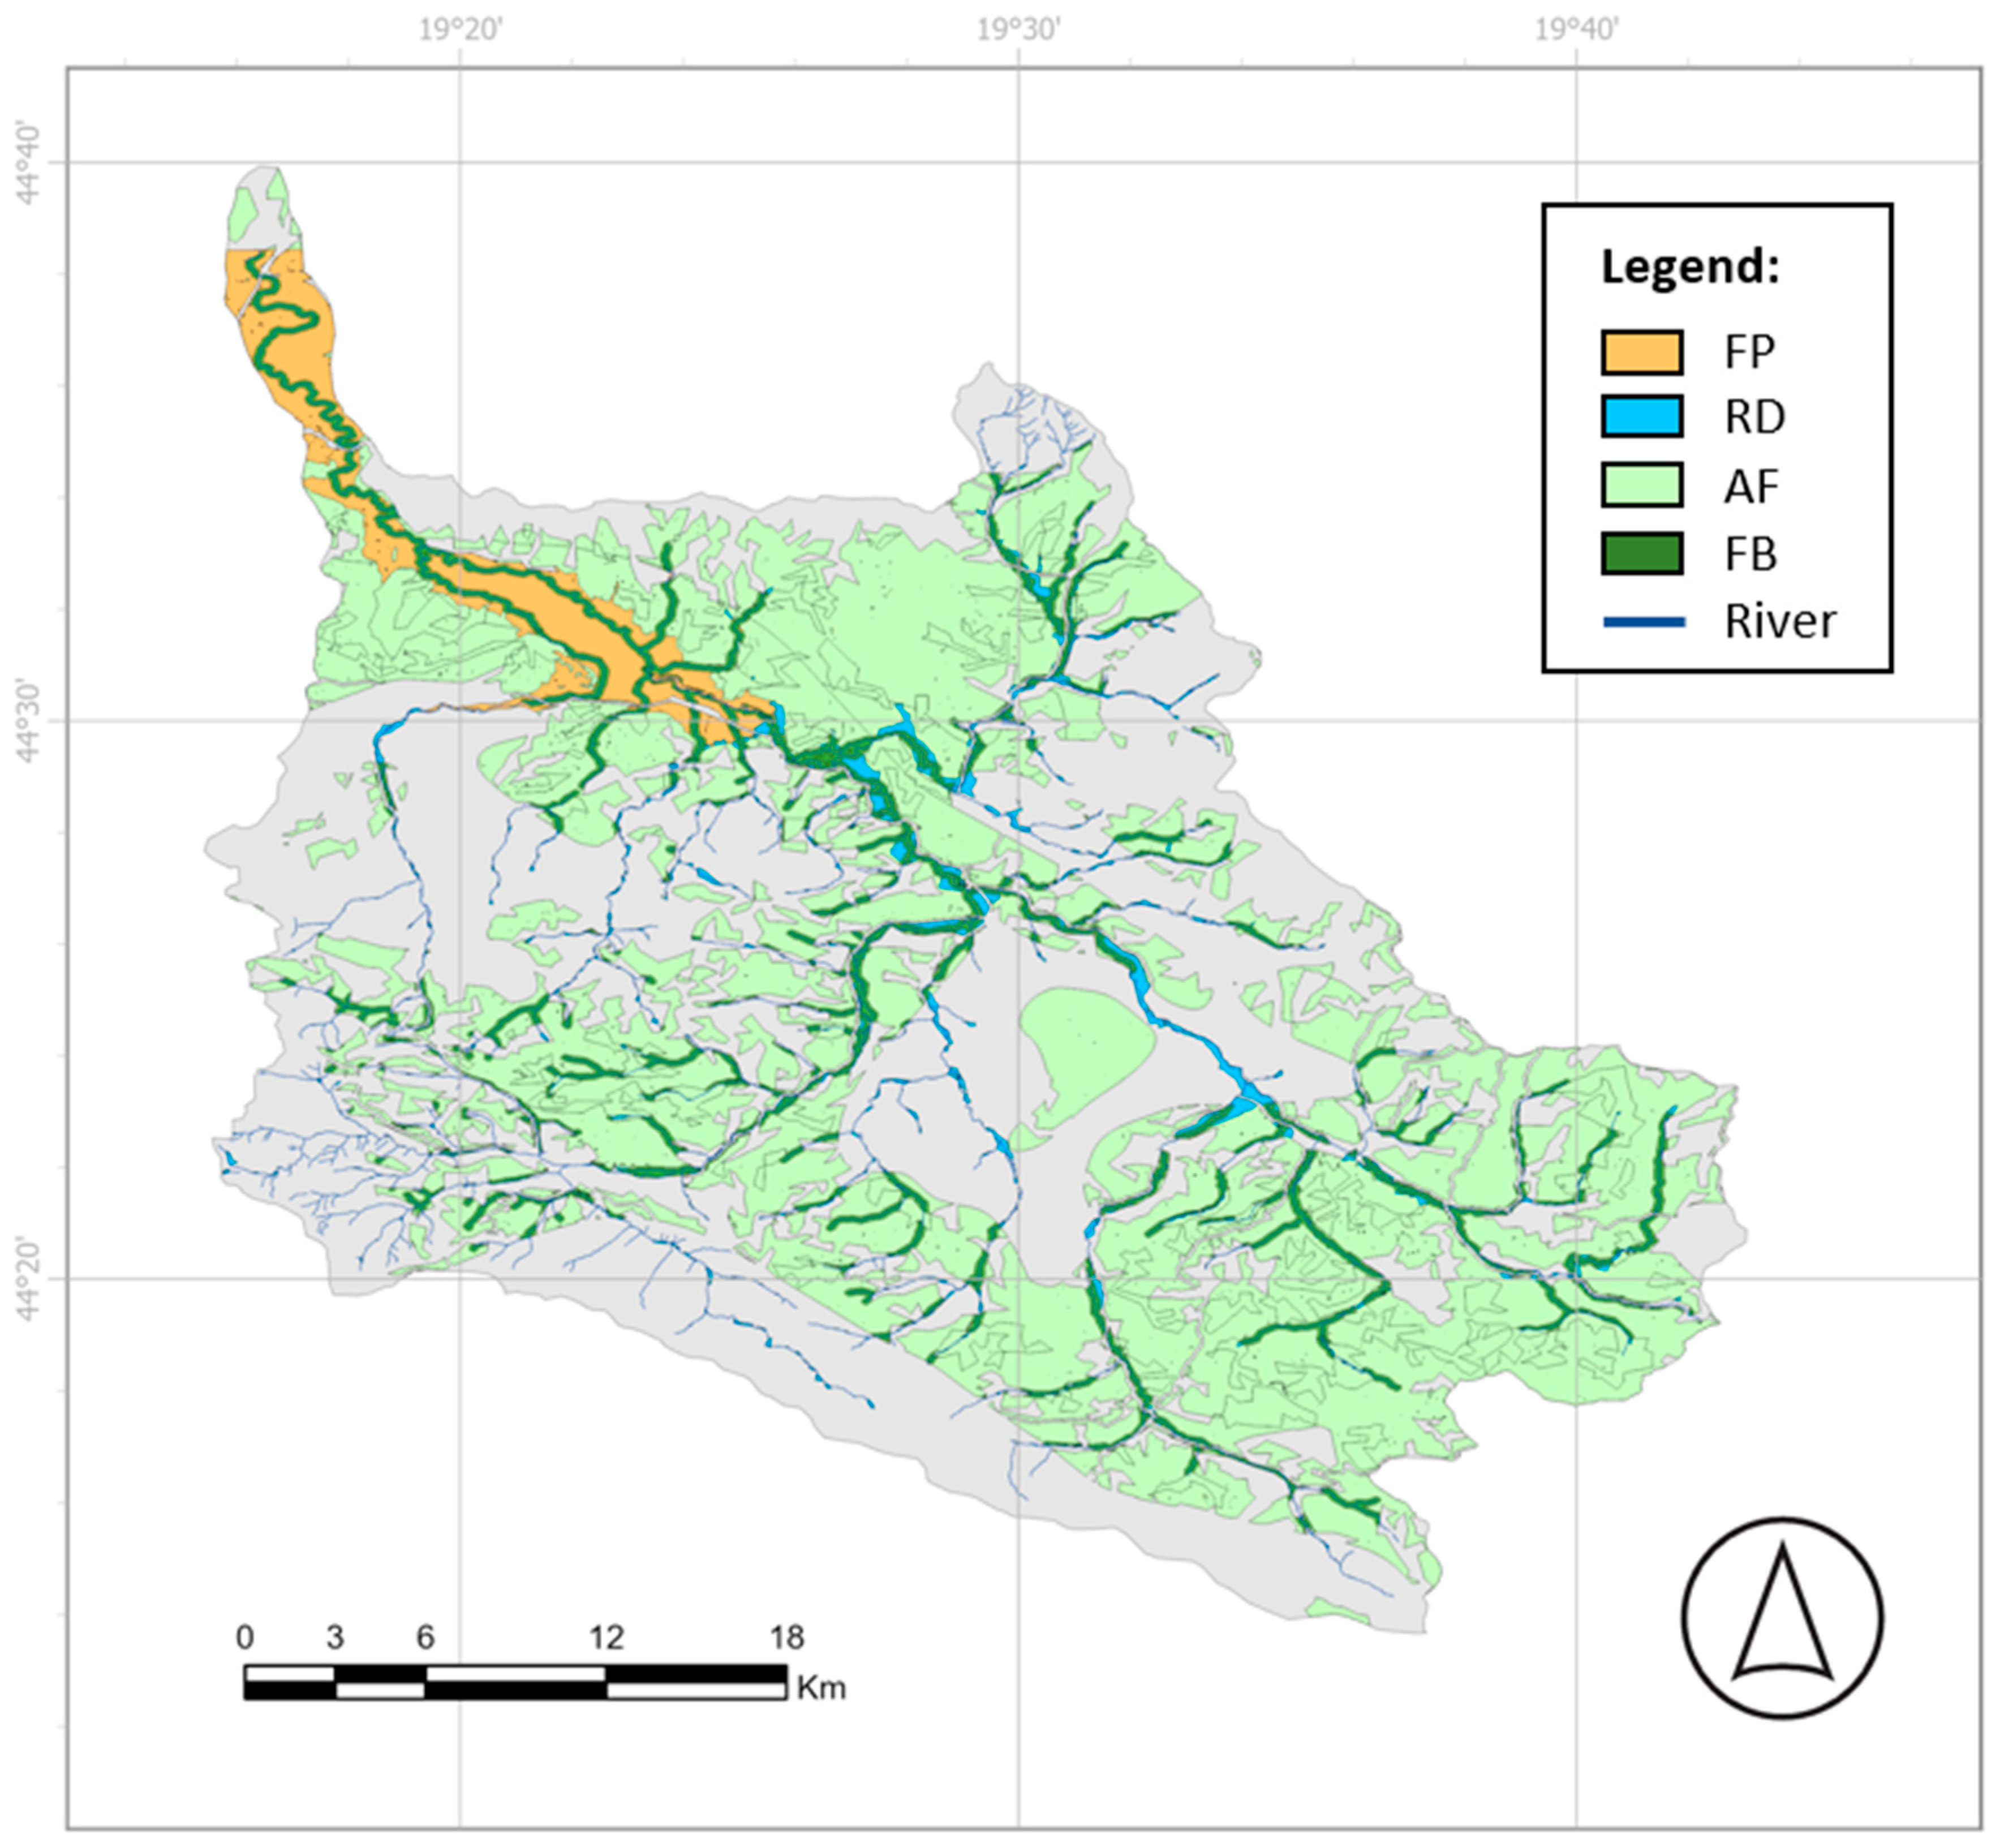
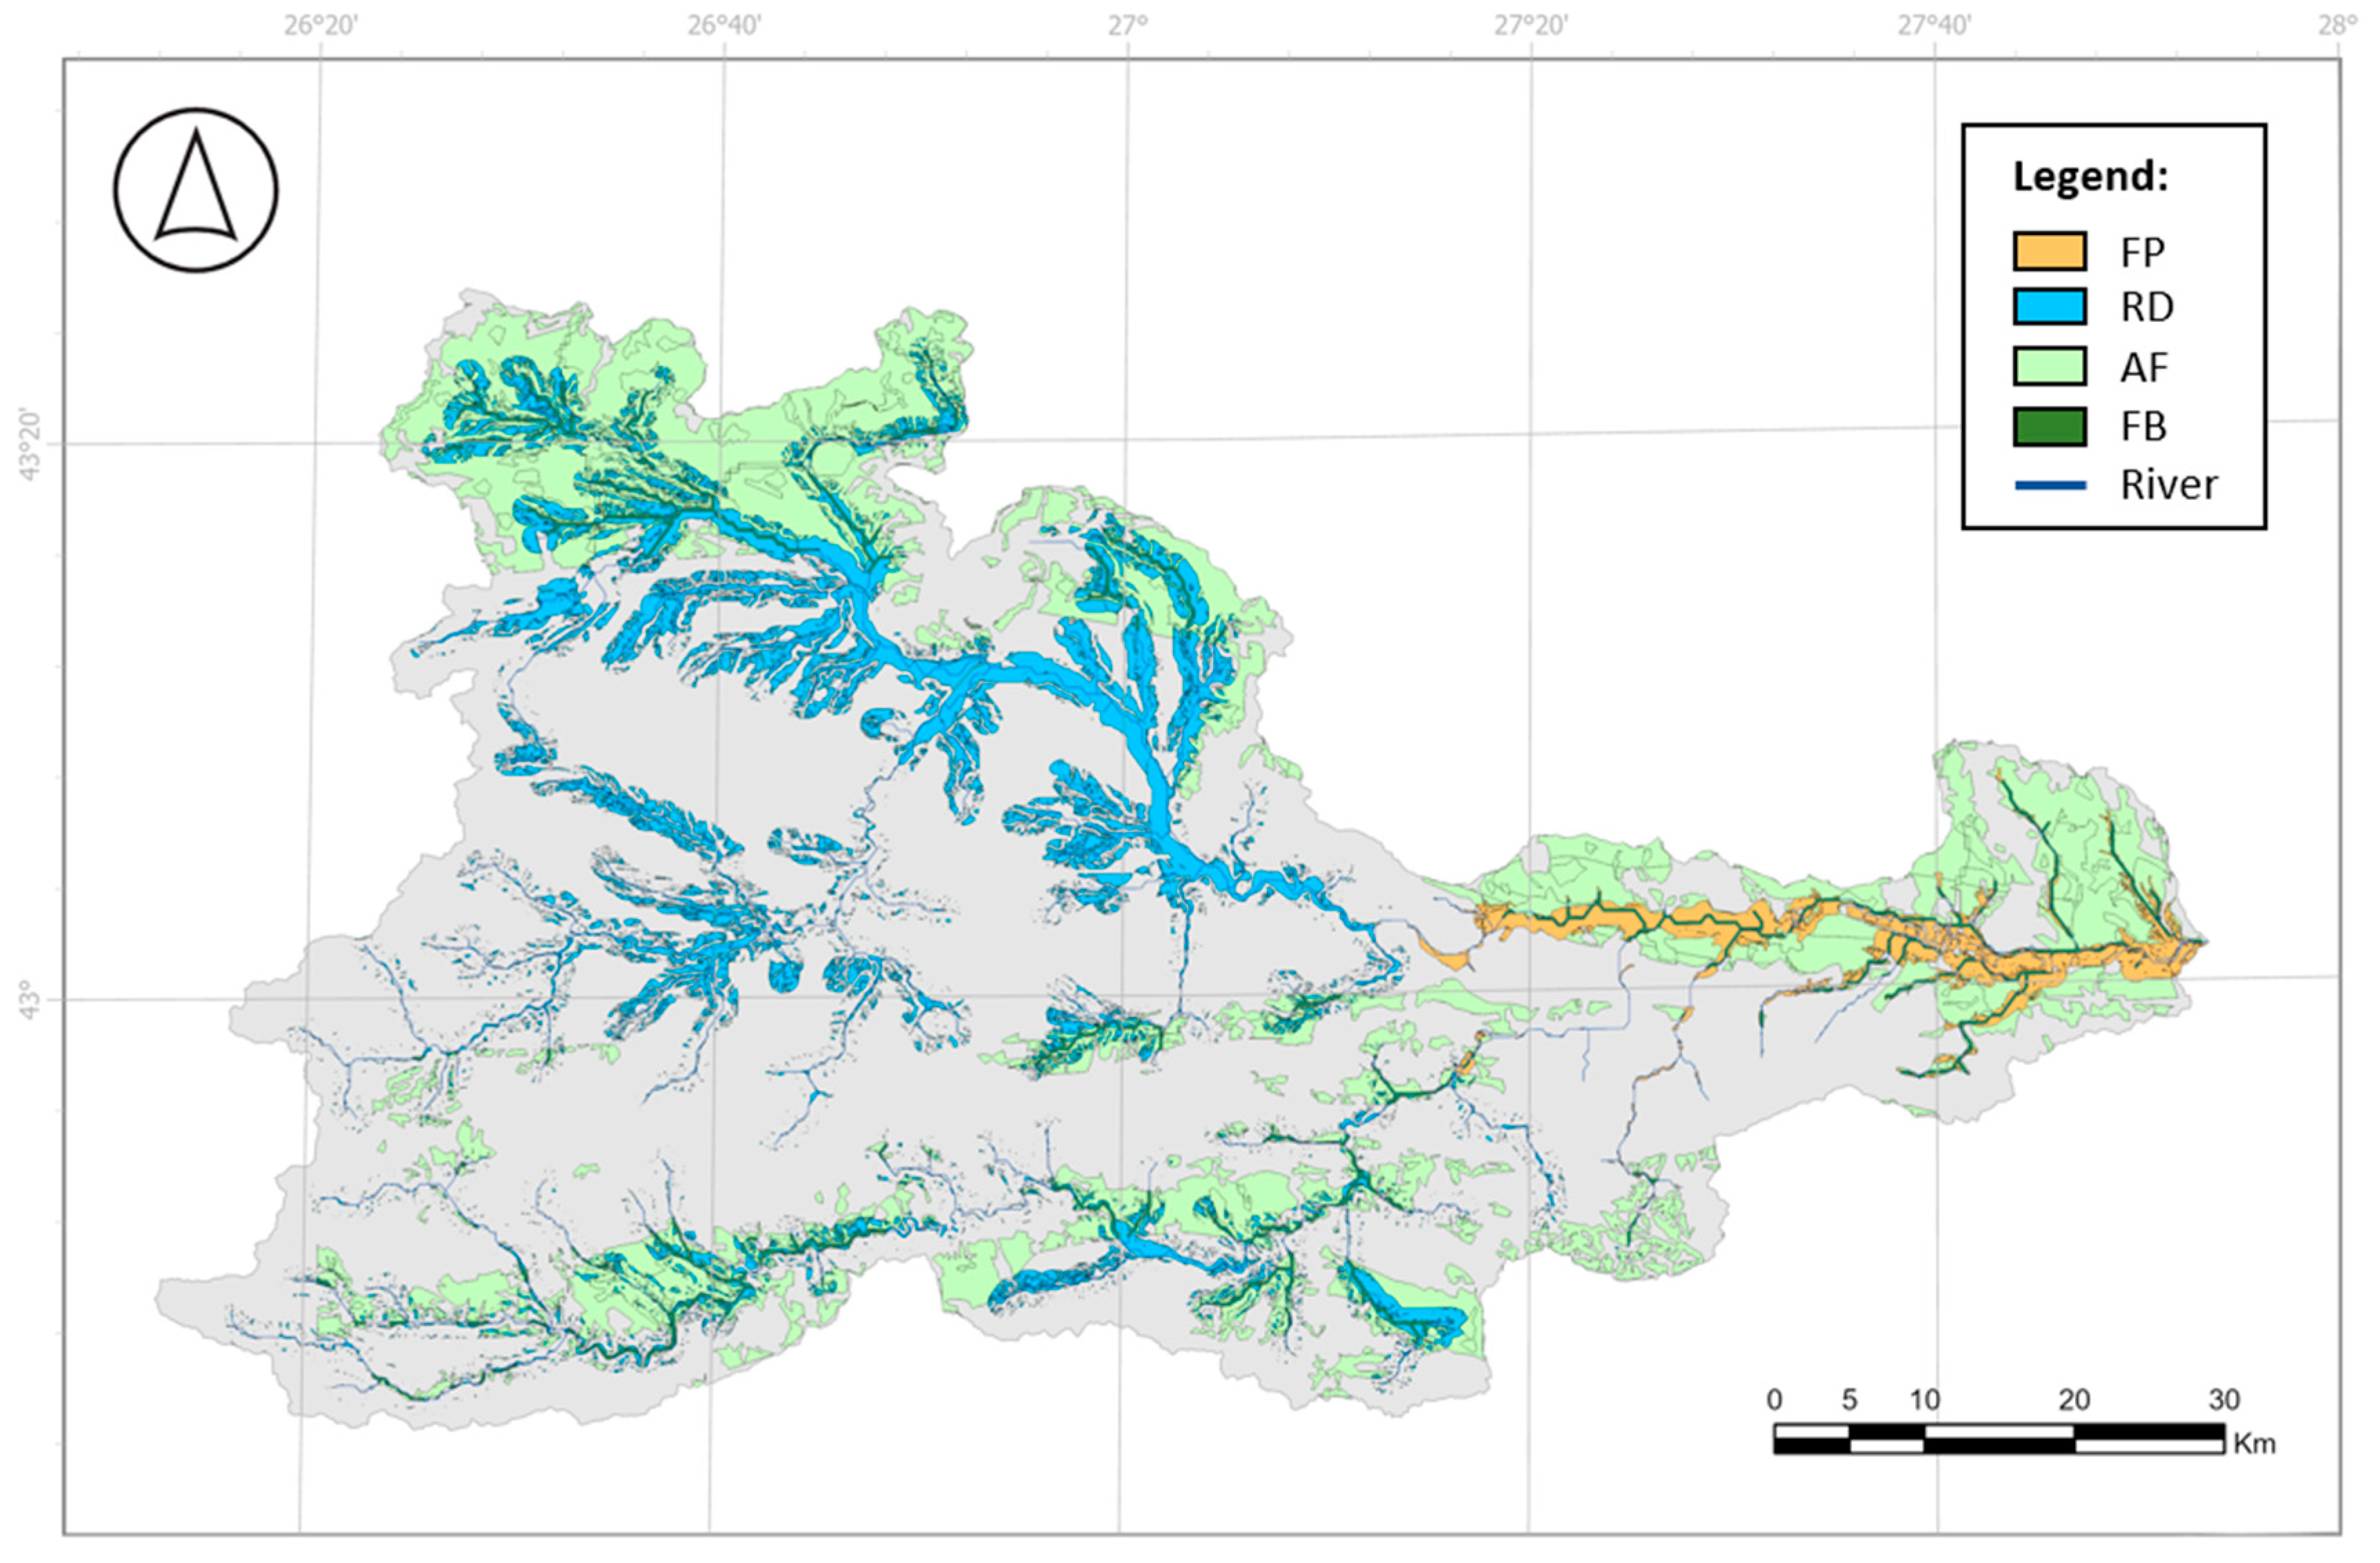
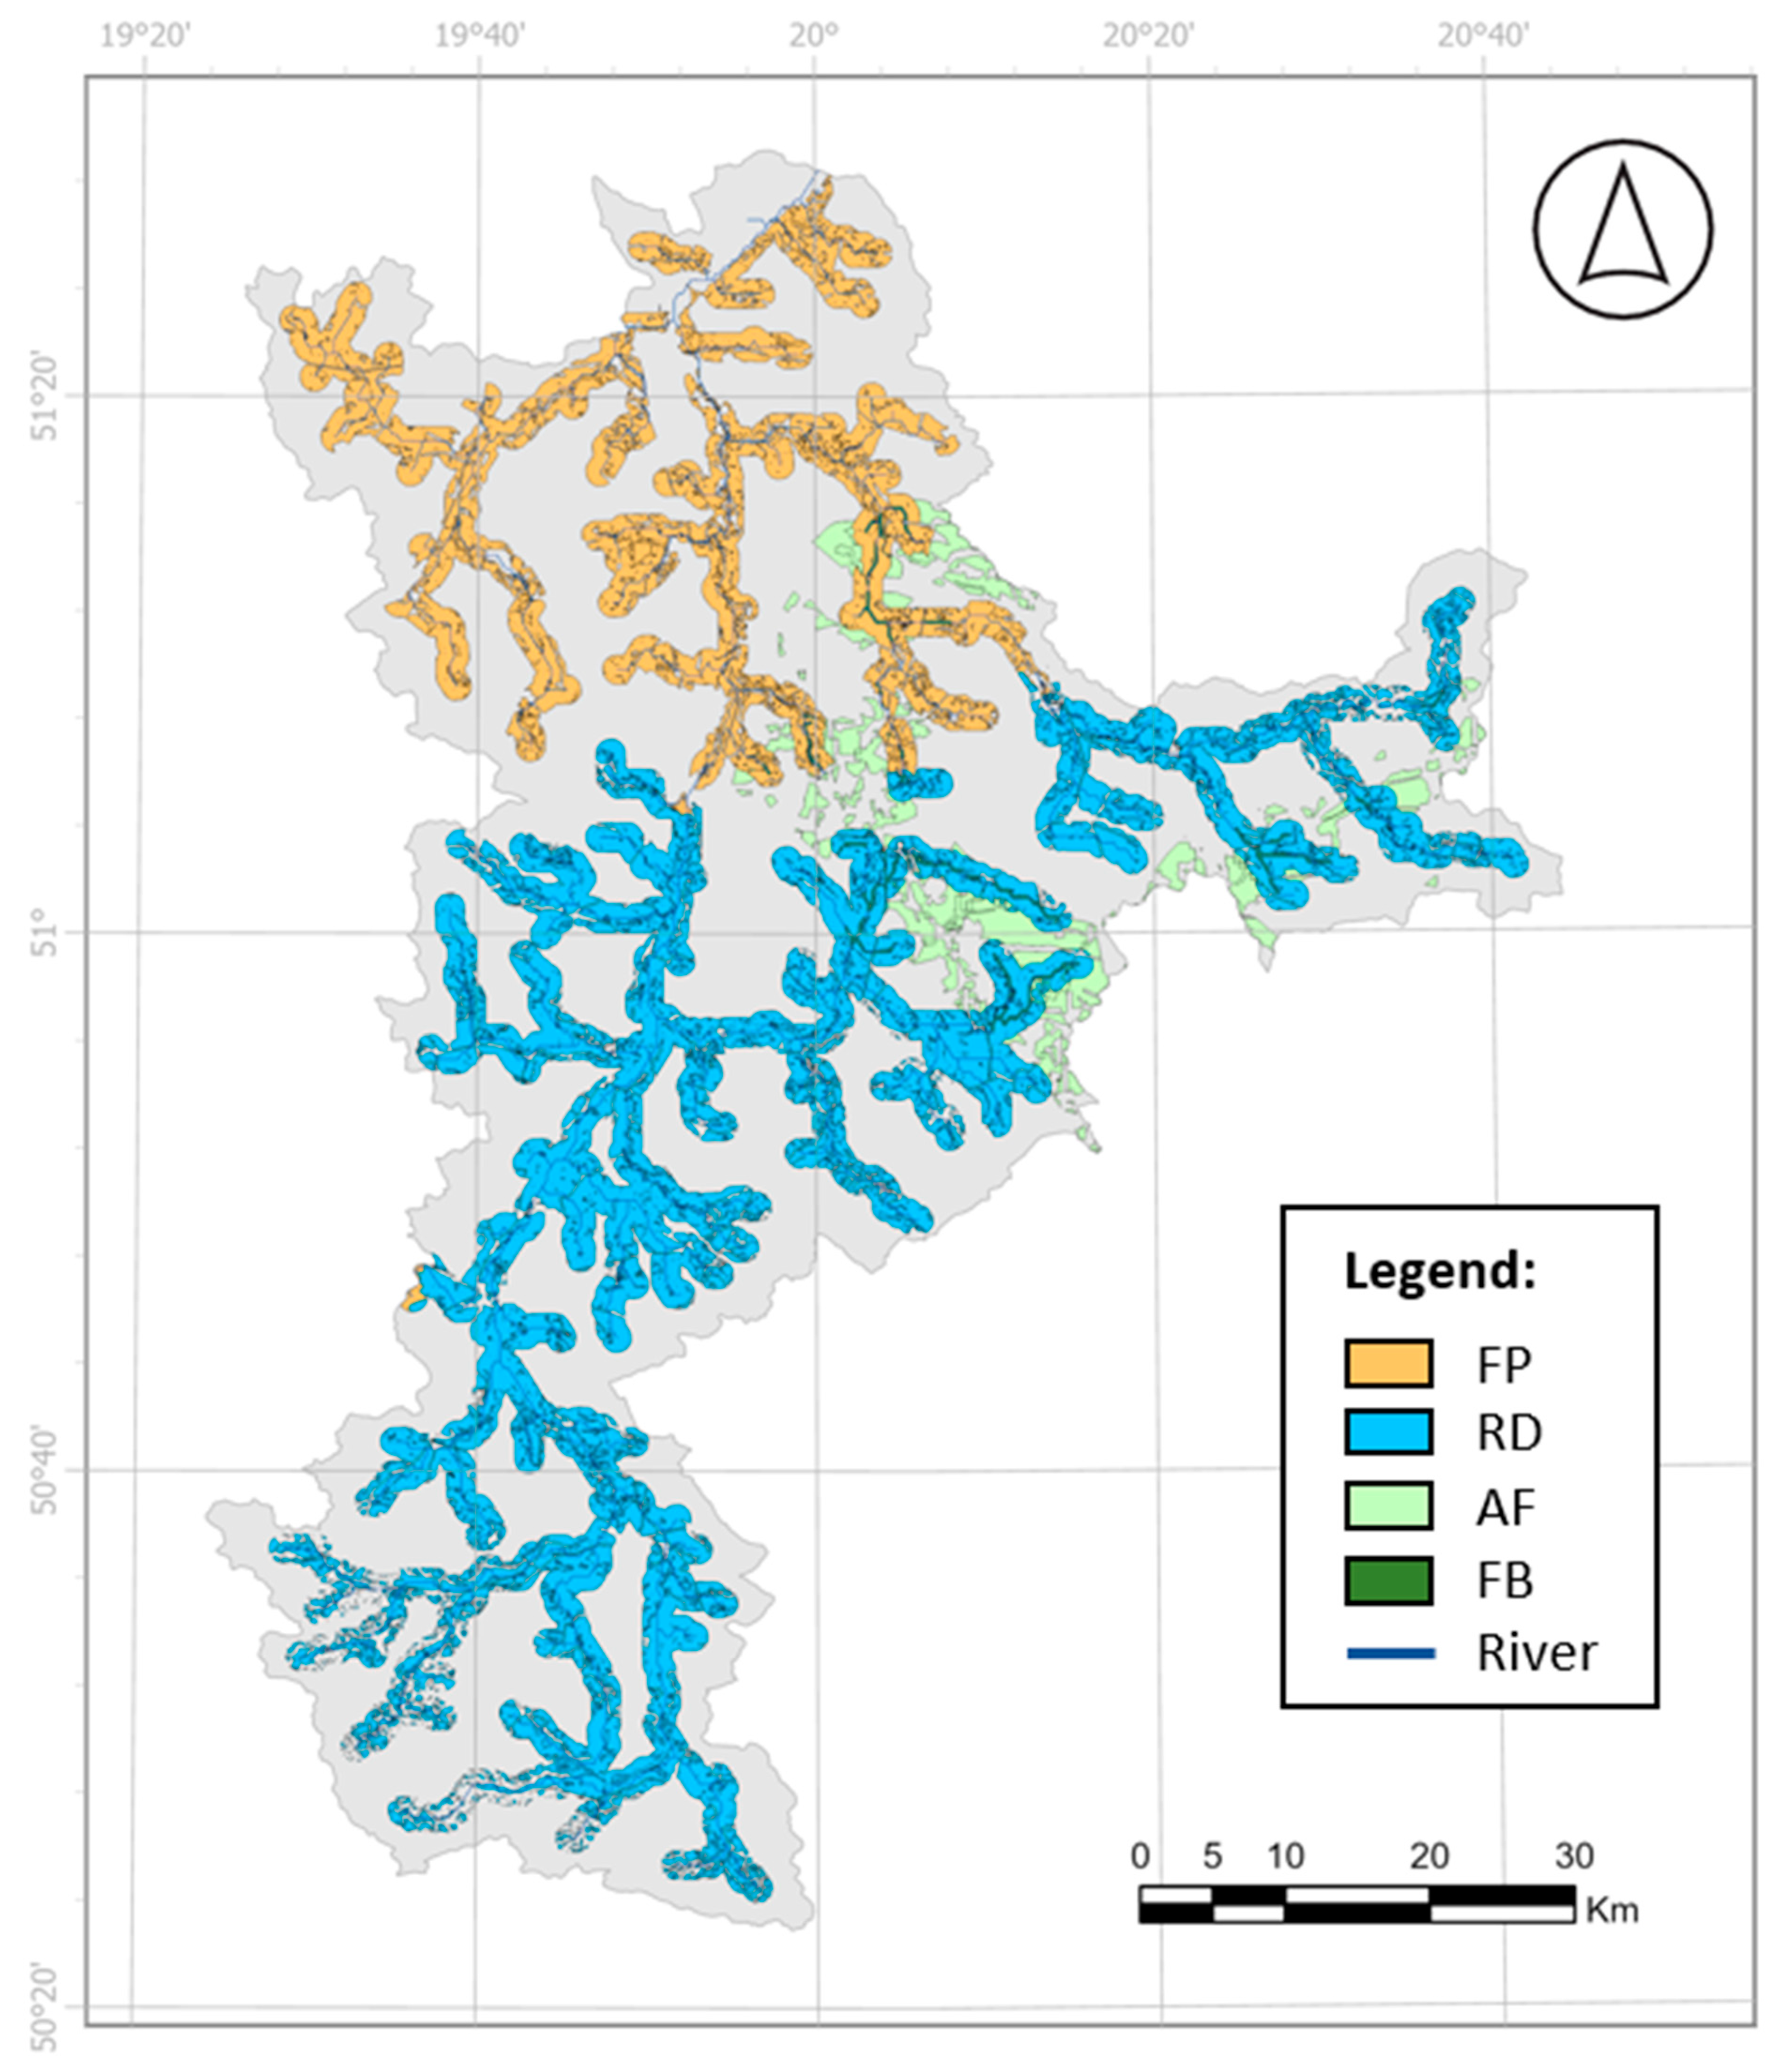
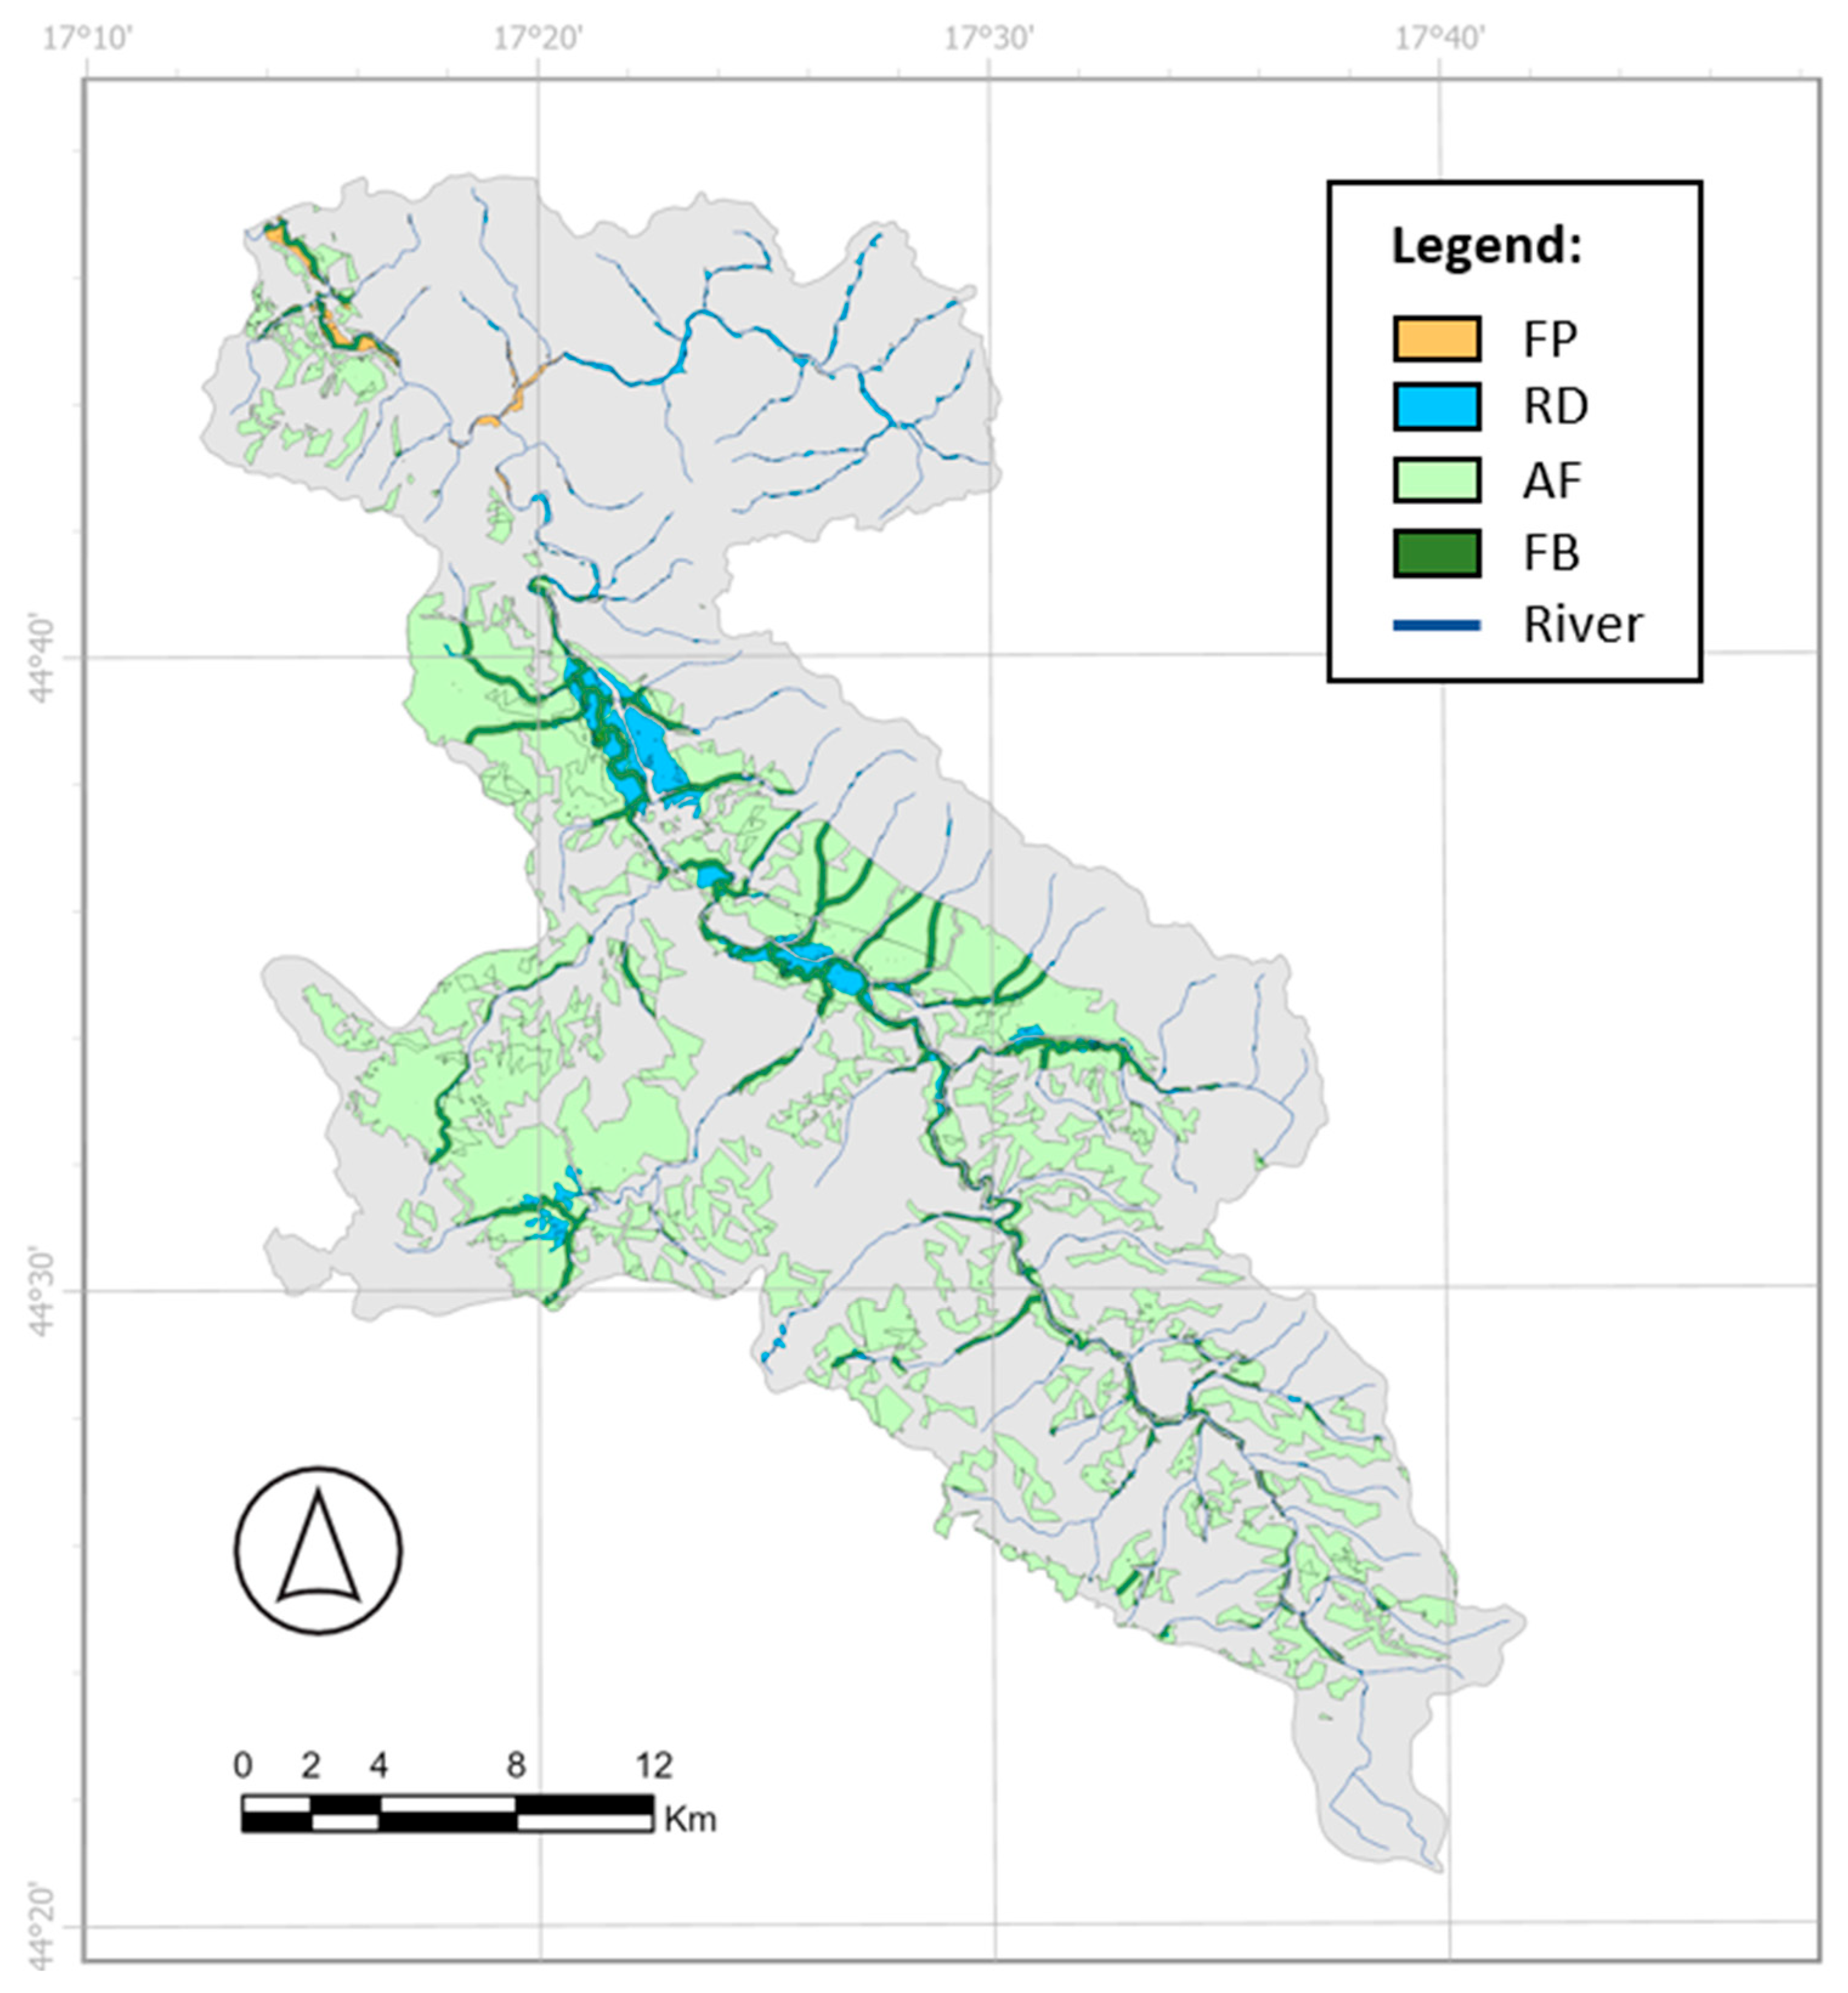
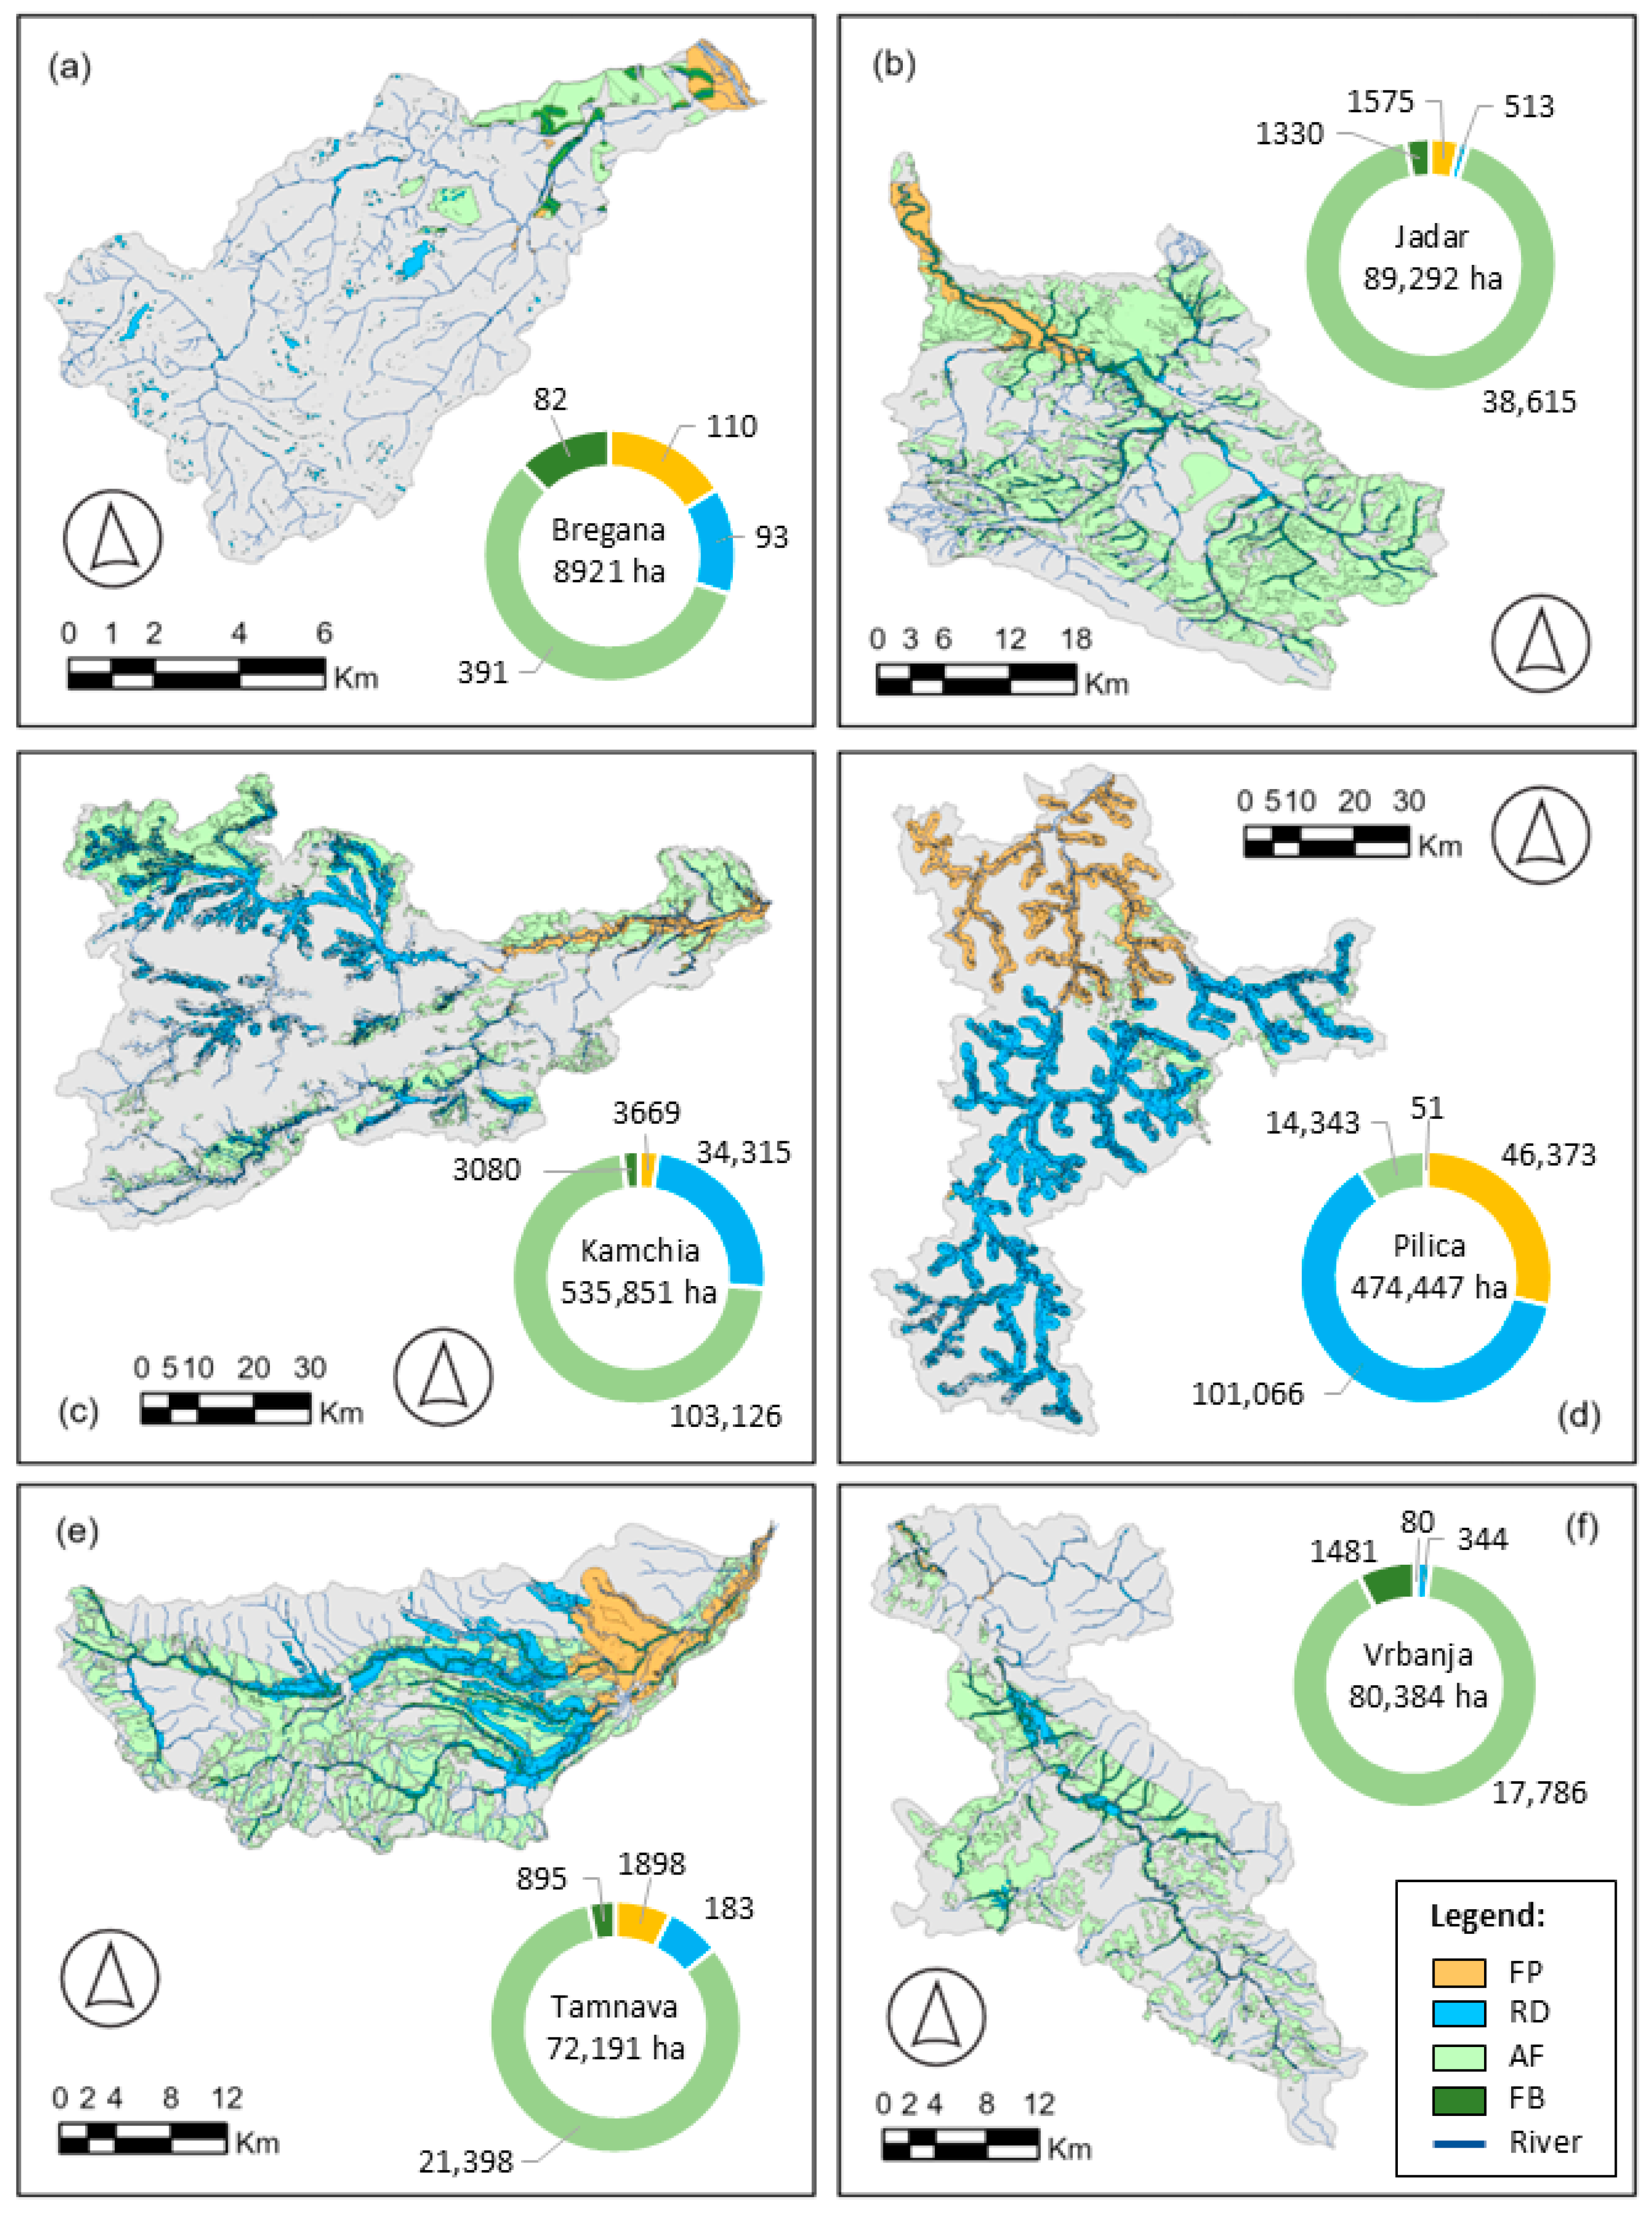
The updated toolbox was used to assess the geospatial suitability of four NBSs, floodplain restoration (FP), retention/detention (RD), afforestation (AF), and forest buffer strips (FB), in the six RECONECT case studies described in Section 2.1. The suitability maps produced are illustrated in Figure 3a–f. High-resolution maps for each study area and additional details are tabulated in Appendix C: Results.
The Bregana River Basin, with 7.58% (676 ha) of the catchment, shows the smallest extent of suitable area for NBSs among all the study areas. The steeper slopes of the Bregana River Basin closer to the stream restrict the suitability for FP and RD, with 2.05 and 1.08% (183 and 97 ha), respectively. This is the study area showing the lowest suitability for RD. The catchment largely consists of natural forests, which means that there is also little potential for AF, except at the downstream end of the catchment with 6.18% (551 ha).
The Jadar River Basin shows the largest amount of space, 47.07% (42,033 ha) of the basin area, suitable for at least one of the considered NBSs. A total of 50.42% (45,023 ha) is taken up by AF. FP and RD make up 5.59 and 2.43% (4993 and 2174 ha), respectively.
The second largest study area, the Kamchia River Basin, has an area of 144,190 ha (26.91%) that is suitable for NBSs. Here, the area suitable for AF, 131,294 ha (24.50%), is mostly distributed along the northern, southern, and downstream areas of the catchment. An area of 11,596 and 51,477 ha (2.16 and 9.61%) in the basin is suitable for FP and RD. The catchment also has a considerable area covered by natural forests.
The largest catchment in this study, the Pilica River Basin, has a suitable area of 161,833 ha, accounting for 34.11% of the basin. This is the study area showing the least suitability for AF, only 5.13% (24,353 ha). This is attributed to the limited extent of productive aquifers within the catchment. Its suitability for FP and RD constitutes 10.41 and 22.76% (49,397 and 108,002 ha), the highest for both NBSs within the six study areas.
The Tamnava River Basin showed that 36.05% (26,024 ha) of the catchment is suitable for NBSs. This catchment comprised the second largest area, 44.68% (32,258 ha) of the basin, suitable for AF. This region also showed the second largest suitable extent for FP and RD, with 7.52 and 11.45% (5431 and 8266 ha) of the catchment showing suitability for these NBSs.
Like the Bregana River Basin, the steeper slopes of the Vrbanja River Basin restrict its suitability for FP and RD, being only 0.32 and 2.47% (255 and 1989 ha). This is the study area showing the lowest suitability for FP. A total of 26.23% (21,087 ha) of the basin is suitable for AF. Combined, 24.50% (19,692 ha) of the catchment shows suitability for NBSs.
Overall, the NBS with the highest suitability among all the study areas is seen for AF, except for the Pilica River Basin. RD showed the next highest level of suitability. FP, being restricted to only the downstream areas of the catchments, showed the lowest amount of suitability. These results are summarised in Table 2 and Table 3.
Since the area allocated for the riparian buffer zones are within 100 m of the stream centre lines within the suitability models, the extent of the area suitable for riparian buffer strips is limited. The suitable length of a stream relative to the total stream length used in this study is a better indicator of suitability for forest buffer strips. The suitability for riparian forest buffer strips (Table 4) ranged from 4.21% of the length of streams in the Bregana River Basin up to 39.63% in Jadar.
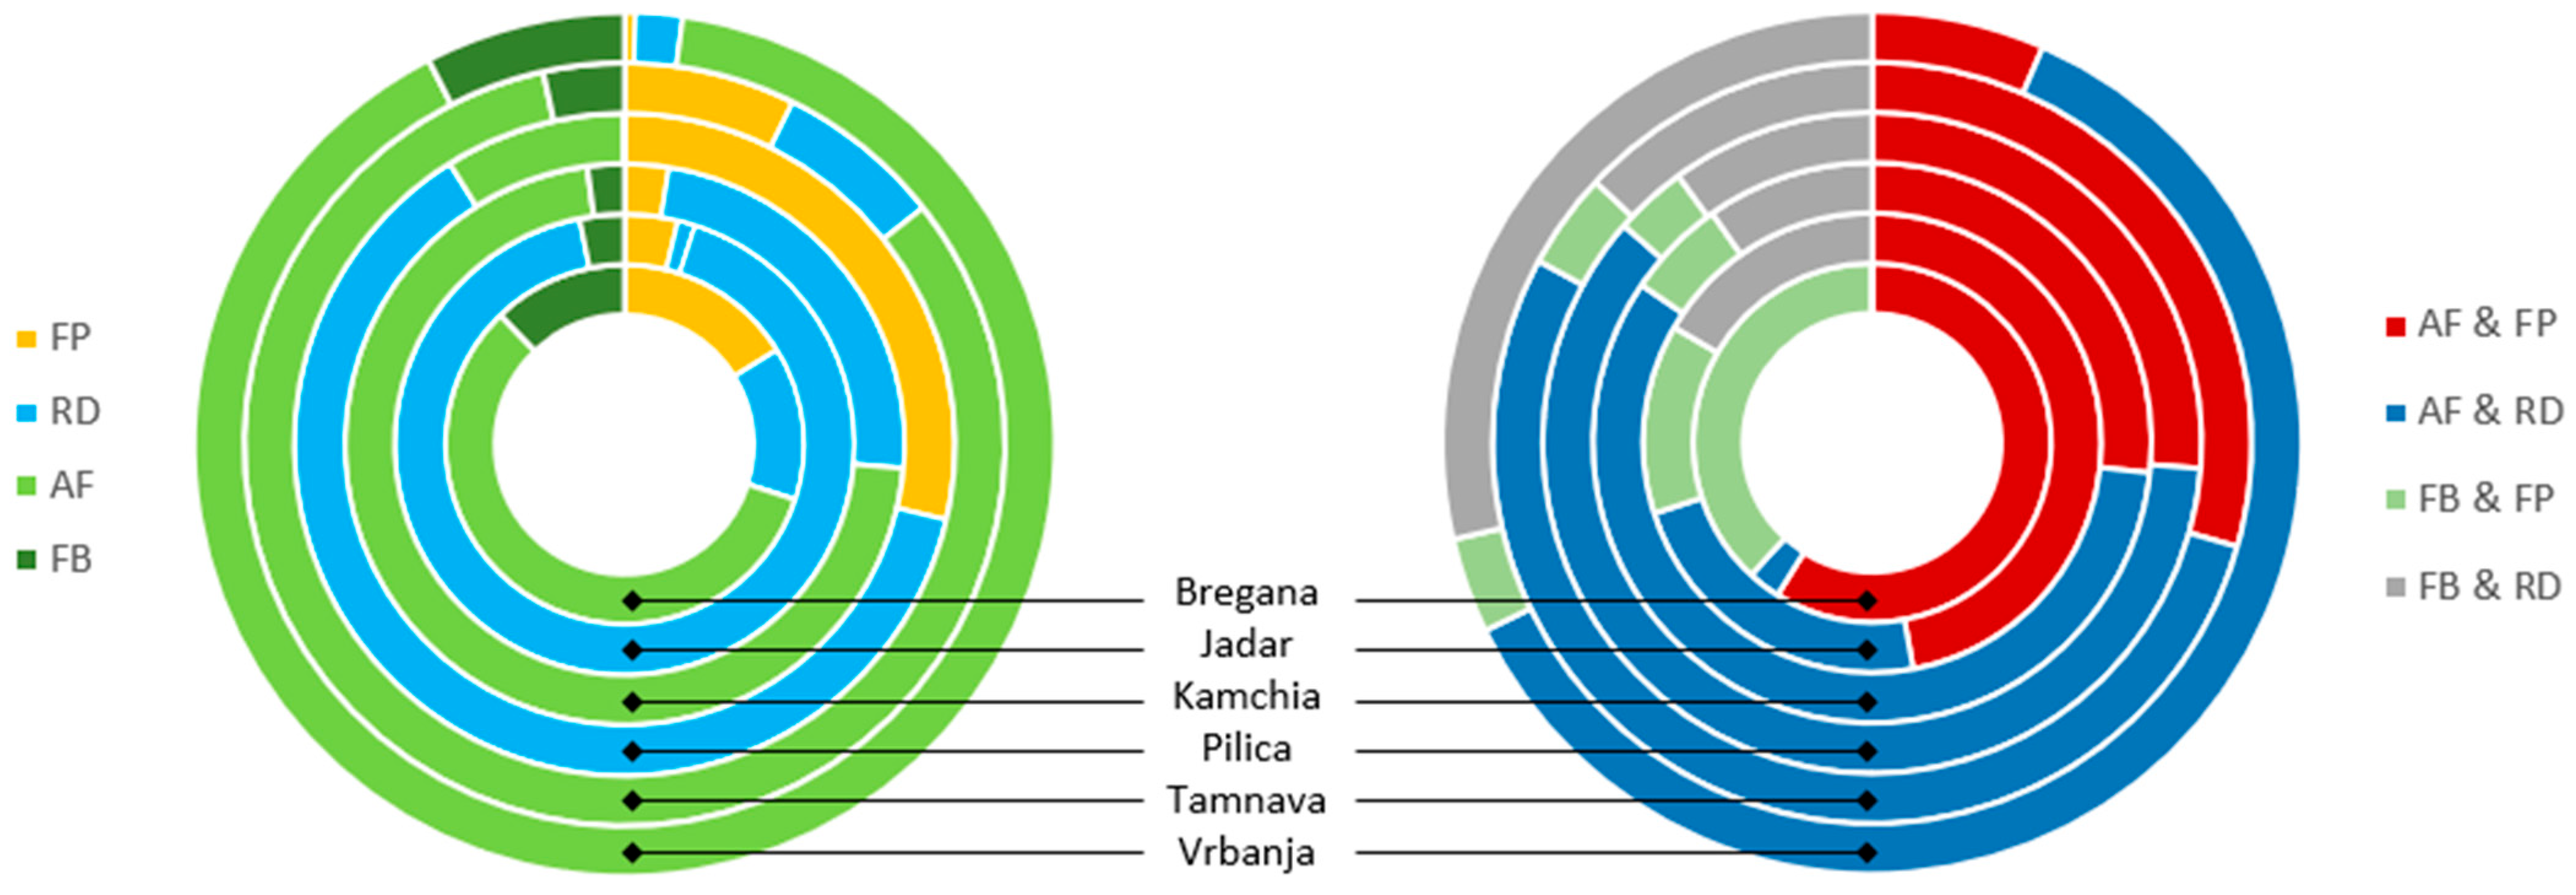
We can also see that there is a considerable amount of overlap or intersection between areas that are suitable for each of the four NBSs in Figure 3a–f and in the maps for each study area in Appendix C: Results (Figure A2, Figure A3, Figure A4, Figure A5, Figure A6 and Figure A7). These zones with common, intersecting, or shared suitability between NBSs indicate areas in which there is opportunity to establish more than one type of NBS. This is further illustrated in Figure 4. It shows the extent of areas where the suitability of different NBSs intersect (Appendix C: Table A7, Table A9 and Table A10) in each of the study areas.
This is observed between AF and RD in nearly all of the study areas. The lowest number of intersecting zones is observed for FP and FB. Areas that are suitable for FB always fall within zones where afforestation is appropriate but are limited by the conditions related to their proximity to water bodies, i.e., 100 m from stream, as described earlier in Section 2.4.2.
We selected additional measures to include in the toolbox (2.3) based on their mechanism of action. A summary of the geospatial suitability of NBSs based on the mechanism by which the measures work to reduce risk is provided in Table 5. This information combined with the information on intersecting areas (Figure 4) can be valuable for delineating areas where a combination of measures could be used. Applying a combination of different approaches for reducing hydrometeorological risk in the same areas could prove to be more effective than using a single technique. It may also provide additional co-benefits.
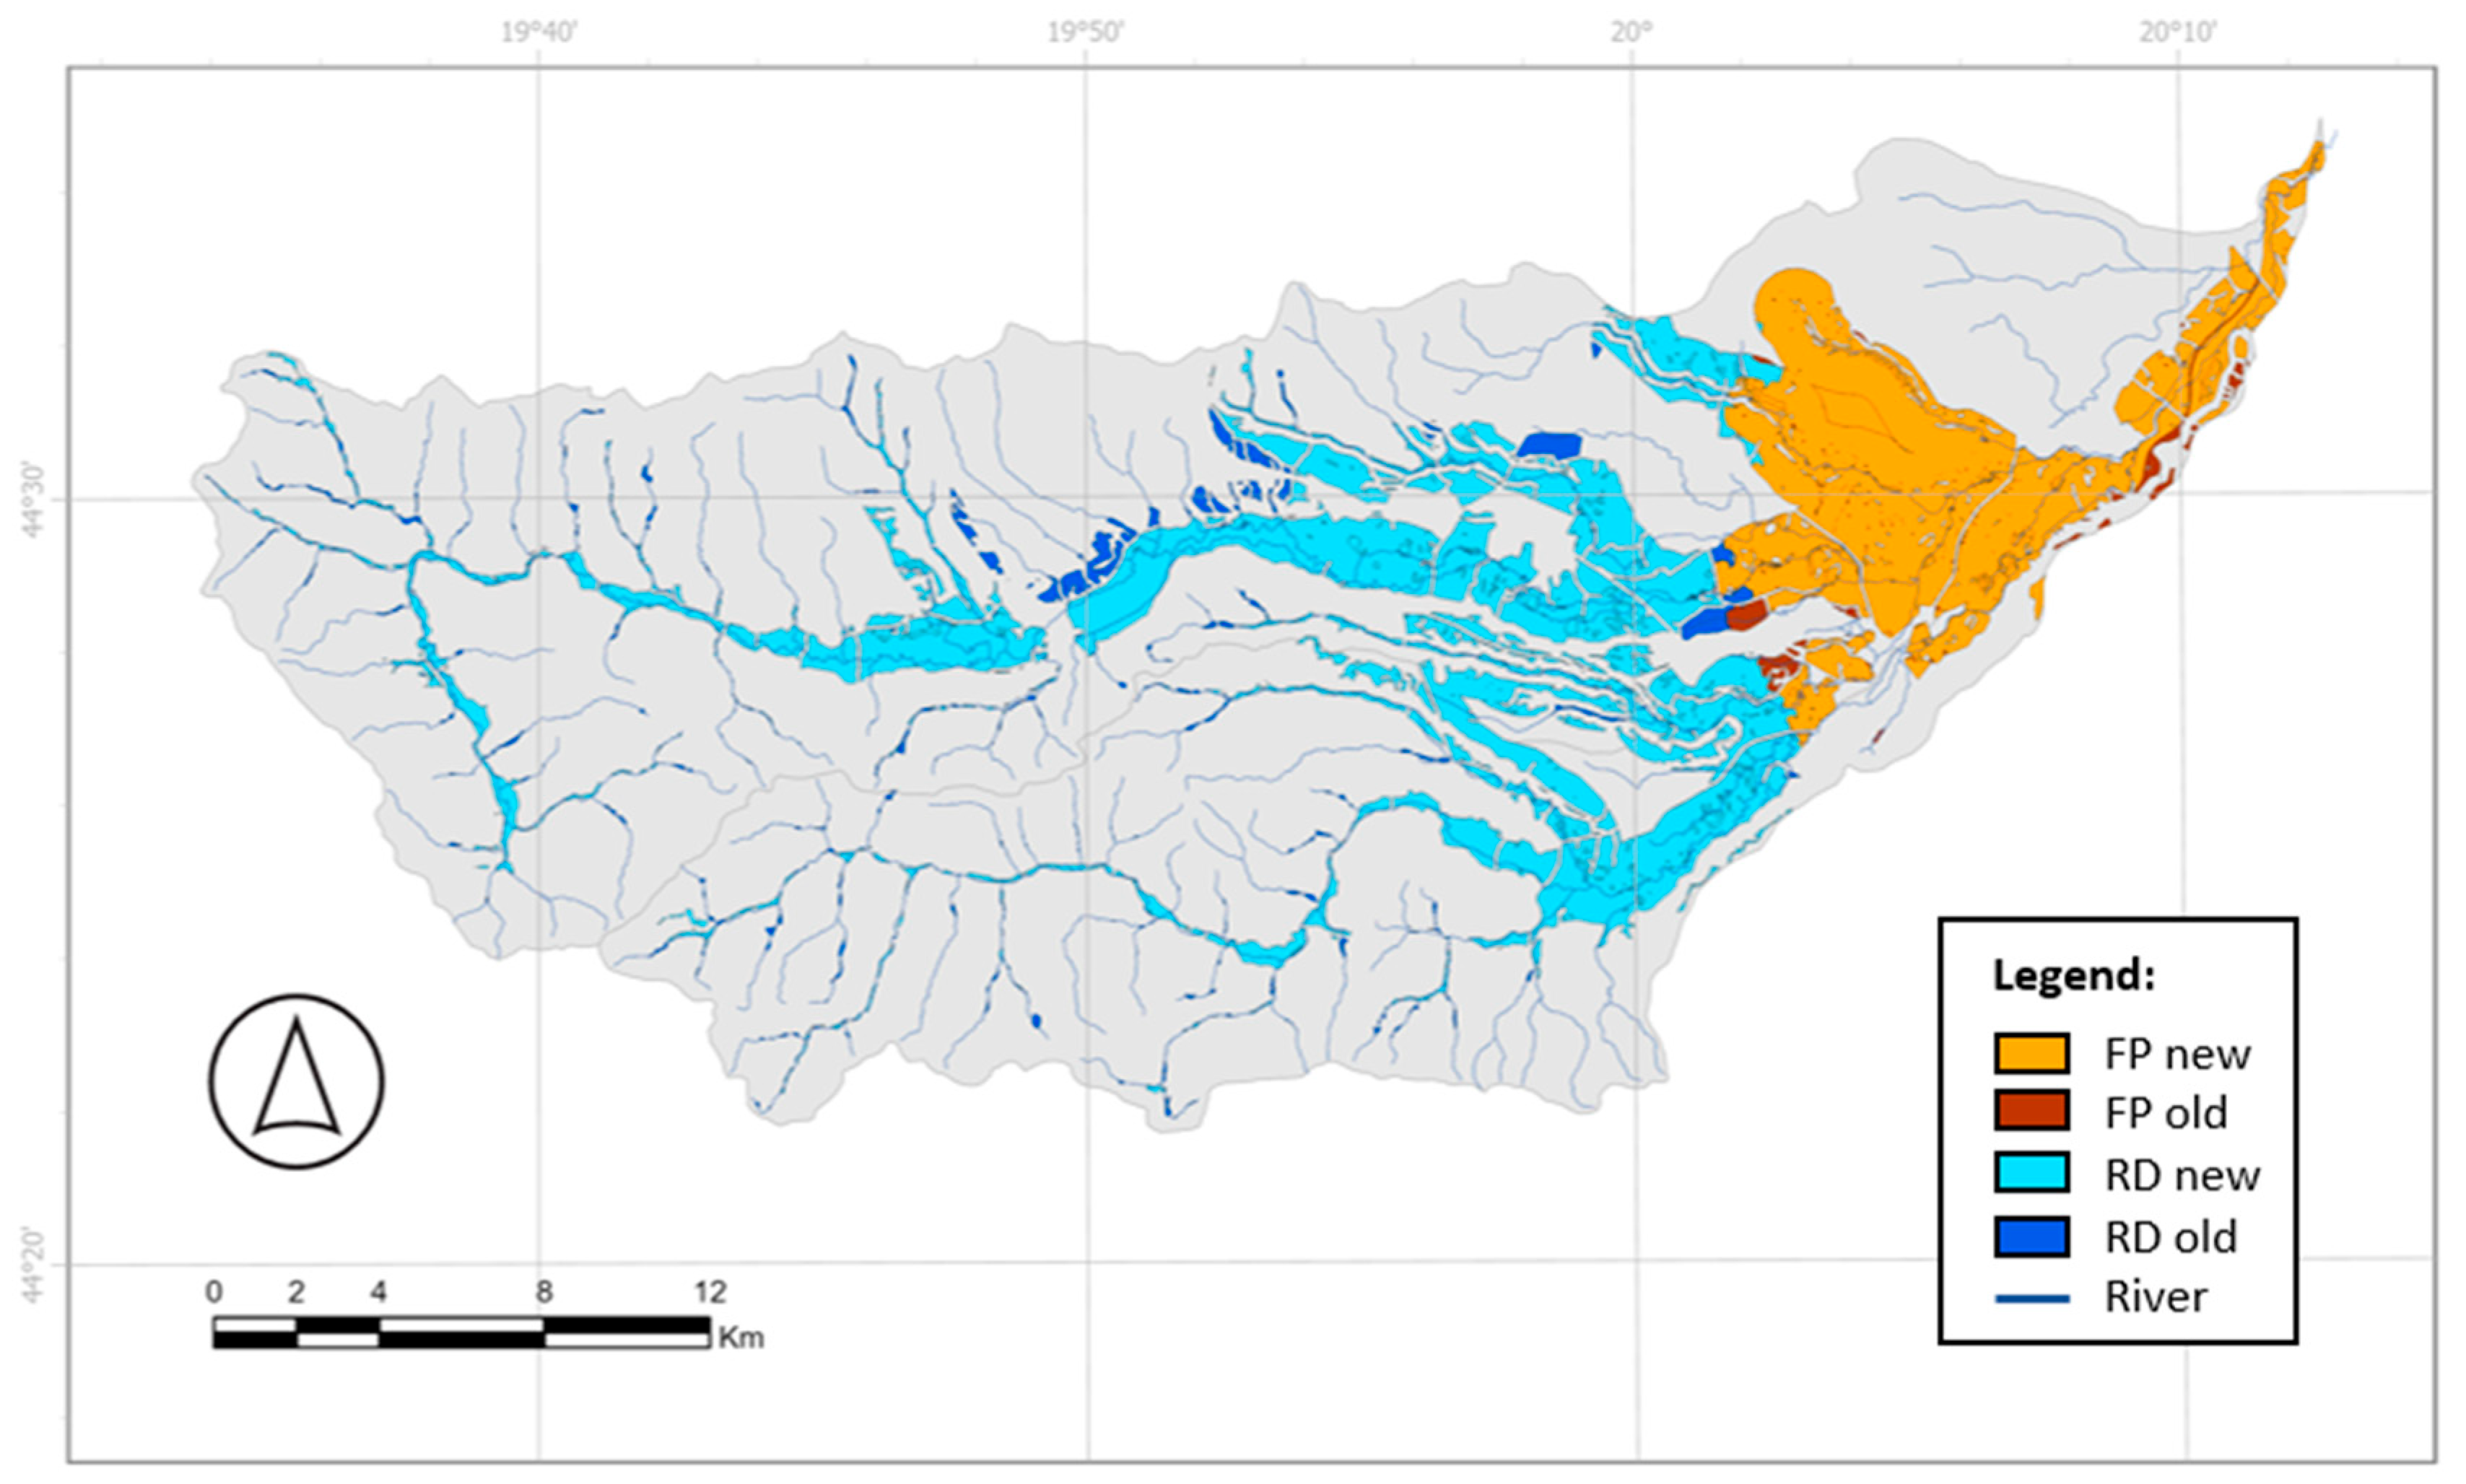
To compare the improved model with those in the previous toolbox by Mubeen et al. [21], the same input dataset was used to generate suitability maps using the criteria and conditions from both the old toolbox and the new toolbox. This was carried out for the Tamnava River Basin (Figure 5), which was in the initial study.
The area suitable for floodplain restoration decreased from 5963 ha to 5431 ha (8.92%). Zones suitable for retention or detention also decreased from 8753 ha to 8266 ha (5.57%). Overall, there was a 6.93% (1019 ha) decrease in suitable area in maps generated using the improved models. These changes can be attributed to two things: the use of ESA WorldCover to remove built-up areas, and changes to criteria and conditions that have been updated. Overall, the new suitability models can be considered an improvement.

4. Discussion

This study demonstrates that GIS tools can be effectively utilised for mapping the geospatial suitability of large-scale NBSs. It improves upon previous research [21] by fixing some limitations as well as adding two additional measures, afforestation and forest buffer strips, to the suitability modelling toolbox. The ESRI ArcMap version 10.7 on which the toolbox was initially created has been discontinued. Therefore, the toolbox and models have been updated to be compatible with ArcGIS Pro 3.4. The improved models were applied not only in the Tamnava River Basin but five more regions: the Bregana, Jadar, Kamchia, Pilica, and Vrbanja River Basins.
The toolbox and method used for mapping suitability in this study are solely reliant on GIS and remote sensing data. This information may not always be available for data-scarce regions, and the available data may not be in a resolution or form that can be used in the same model. The datasets used for this study are global or regional datasets that are openly available to enable wider use of the method. While using these products alleviates the data availability problem in general, it can introduce some uncertainty at a local scale. Where local data are available, global data in the spatial analysis can easily be replaced for higher precision and accuracy.
ArcGIS Pro is proprietary software and may not be available or affordable for everyone who may benefit from such a tool. The same method, including the criteria and conditions which have been detailed in this study, may be applied using open-source GIS platforms. Kpadé et al. [39] carried out a systematic review of multi-criteria decision making (MCDM) methods used in the management of forest ecosystems. They found that these methods are not as commonly used in developing countries. While the current study is based in Europe, the toolbox method may be applied in any river basin across the world where the base data used as input are available. However, in larger catchments such as the Pilica River Basin, the model may provide less detail, particularly around smaller streams. The suitability maps show much more detail when used at subcatchment or major tributary levels, similar to the Jadar, Tamnava, and Vrbanja River Basins.
The use of hydrogeology, in this case aquifer type from IHME 1500, somewhat limits assessing the suitability of vegetative measures. This is particularly apparent in Pilica where hydrogeological suitability in terms of productive aquifers is limited to a very small part of the catchment. While it is used to represent the availability of groundwater in this study, more information such as the local groundwater conditions and quality of soil can be added for a more detailed analysis provided the data are available.
A simplistic verification of the results was carried out by overlaying the results with digital images of the study areas from Google Earth Pro, showing that the areas do not intersect urban and rural settlements. This was not possible earlier due to the low resolution (100 m) of the LULC data used. The inclusion of ESA WorldCover to delineate these areas has therefore improved the performance of the model. However, isolated buildings are not considered even in the new iteration of the toolbox.
Valente et al. [40] developed an MCA-based approach for prioritising forest restoration taking ecosystem services into account. They also utilised slope, soil conditions, proximity to water, and LULC in their analysis. The ranking was carried out using expert participants. The selection of NBSs used a similar approach to that used in this study. Suitability mapping could benefit from additional stakeholder participation to rank potential areas based on local contexts. The methodology can also be further enhanced based on specific conservation needs for an area. For example, soil erosion may be addressed by including addition criteria and methods employed by Campos et al. [41] and Bozali [42].
The geospatial suitability can only serve as a preliminary step in planning for NBSs. Validation or statistical verification may not add much value in initial planning stages. Absolute areas are indirectly informative about the potential benefits and costs of planned measures. For example, larger areas dedicated to afforestation can reduce runoffs but incur greater costs. On the other hand, retention ponds may contribute to a smaller percentage of the area, but the storage capacity is not apparent at this stage of the planning process. So, their area gives little information on potential benefits. It may be necessary to assess local conditions physically.
The selection of sites for implementation must consider the local context in addition to suitability and must therefore include local stakeholders in the decision making process. Local managers can use the maps not only to decide on the feasibility and the extent of the planned measures but also to integrate the measures in spatial plans to preserve the space and protect it from other uses. Hydrological and hydrodynamic models can benefit from direct input from the tool, with delineated areas under measures qne all attributes necessary for the modelling process, especially those related to setting model parameters. For example, hydrological models can integrate information on areas planned for afforestation along with the attributes related to land use to adjust model parameters related to interception, evapotranspiration, and infiltration.
Planning, design, and implementation must reflect larger regional goals [43]. For example, the Bregana, Kamchia, and Pilica River Basins host conservation areas under Natura 2000. Areas suitable for proposed NBSs intersect some of these areas [44]. The conservation status of these regions indicates that the interventions that can be carried out in those zones are limited or even prohibited. On the other hand, incorporating these zones into the implementation of proposed NBSs could also contribute to significant benefits for biodiversity.
Although the planning process is often focused on the benefits related to NBSs, it is just as important to consider the tradeoffs. The use of measures that include vegetation can offer benefits for improving habitats for target species, increasing infiltration [45], and reducing heat. On the other hand, changes to the ecosystem that are beneficial to one species may be harmful for others. Increasing the amount of vegetation in an area can also affect groundwater quality and exacerbate droughts [46,47]. Restoration strategies may need to be adjusted to attain various co-benefits, such as the recreation or production of timber [48]. Changes to land use can also affect access to resources. It is imperative that we ensure balance between benefits and tradeoffs when implementing NBSs for risk reduction, and therefore, the NBS planning process must be conducted very carefully.

5. Conclusions

The adverse effects of climate change and rapid urbanization are exposing communities and the environment to significant damage. More innovative planning and management approaches are needed to cope with these problems. The adoption of NBSs has the potential to support risk reduction and help restore ecosystems. More informed planning processes are needed for these measures to be effective. In that regard, assessing the geospatial suitability of large-scale NBSs proves to be a useful part of the planning process. The work presented aims to improve and expand the methodology developed by Mubeen et al. [21] in assessing the geospatial suitability of large-scale NBSs. The improved toolbox produced during this study incorporates additional criteria and conditions for suitability.
The methodology was developed and tested on six European collaborator sites of the RECONECT project: the Bregana, Jadar, Kamchia, Pilica, Tamnava, and Vrbanja River Basins. The main hydrometeorological hazards within the areas were determined to be fluvial, flash, and pluvial floods and drought. The most appropriate large-scale NBSs were selected and ranked based on hazards and stakeholder consultations. The NBSs that ranked high on this list for all sites include floodplain restoration, retention or detention, afforestation, and forest buffer strips. The toolbox produced by Mubeen et al. [21] included models for mapping the suitability of floodplain restoration and retention or detention. These measures work by increasing room for water bodies and providing storage areas for flood water. The new suitability models added to the model are vegetative measures, afforestation, and riparian forest buffer strips. These vegetative measures are NBSs that work via source control as their mechanism.
All of the suitability models were improved by adding ESA WorldCover 2021 to delineate built-up areas. Hydrogeology was included as an additional criterion to assess aquifer productivity and identify suitable locations for the new measures; riparian buffer strips and afforestation. The enhanced methodology was used to update and test the toolbox within the model builder environment in ArcGIS Pro 3.3, and we tested for compatibility in version 3.4 and 3.5.
The suitability maps produced by using the toolbox demonstrated the geospatial suitability of the four large-scale NBSs in the study areas. The suitability for large-scale NBSs ranged from 7.58% of the catchment area in the Bregana River Basin to 47.07% in the Jadar River Basin. The measure with the greatest suitable extent was afforestation and the lowest was forest buffer strips. Slope and aquifer productivity were found to be the limiting criteria in most cases. The resulting suitability maps also showed potential for implementing two or more measures in combination for greater risk reduction. Overlaying the suitable areas with digital images from the study areas showed that the improved models now account for small settlements as well.
The planning, design, and implementation of large-scale NBSs consist of several interlinked steps. The determination of geospatial suitability must be considered an initial part of the planning process. The process can be extended through hydrological and hydrodynamic modelling of suitable areas. Assessment of risk and vulnerabilities is an important step that follows. Further research can contribute to developing and standardizing methods for performing these steps in the planning, design, and implementation of large-scale NBSs. The participation of all relevant stakeholders and inclusive approaches is of utmost importance in every step, particularly when considering co-benefits and balancing tradeoffs. Understanding barriers and enablers within the local context can further inform the decision making process.

Supplementary Materials

The following supporting material can be downloaded at https://doi.org/10.4121/daa5dfc9-338c-45d6-b36c-f71f869780e2. They include the ArcGIS toolbox: NBSToolbox_2025_v1.0; data files supporting results: suitability_shapefiles.zip.

Author Contributions

Conceptualization, A.M., V.B.D., Z.V. and N.M.; methodology, V.B.D., A.M., A.S.T., G.P., J.P.L. and N.M.; formal analysis, V.B.D., A.M., L.R. and A.S.T.; validation, A.S.T., J.P., G.P., A.F.A., J.P.L., A.W., M.R.-F., K.I., T.S., B.D., D.K., L.I. and V.P.; resources, J.P., A.W., M.R.-F., K.I., T.S., B.D., D.K., L.I. and V.P.; data curation, A.M., V.B.D., L.R., J.P., A.W., M.R.-F., K.I., T.S., B.D., D.K., L.I. and V.P.; writing—original draft preparation, A.M. and V.B.D.; writing—review and editing, A.M., L.R., A.S.T., J.P. and Z.V.; visualization, A.M., supervision, Z.V., A.S.T., J.P., G.P., J.P.L. and A.F.A.; project administration, Z.V., N.M. and J.P. All authors have read and agreed to the published version of the manuscript.

Funding

The production of this article received funding from the European Union’s Horizon 2020 Research and Innovation programme under grant agreement no. 776866 for the research project RECONECT (Regenerating ECOsystems with Nature-based solutions for hydro-meteorological risk rEduCTion).

Data Availability Statement

The original data presented in the study are openly available in 4TU.ResearchData at https://doi.org/10.4121/daa5dfc9-338c-45d6-b36c-f71f869780e2 (Supplementary Material).

Acknowledgments

The article is based on work carried out under (1) the thesis titled “Supporting Decision Making in the Allocation of Nature-based Solutions for Flood Risk Reduction” produced for the partial fulfilment of requirements for the Master of Science degree by Vishal Balaji Devanand at IHE Delft Institute for Water Education, Delft, the Netherlands; (2) deliverables produced by the project RECONECT: 4.2—Baseline assessment and potential for NBS in collaborators, 4.4—Demand analysis with focus on Collaborators, 4.8—Prefeasibility studies for implementation of NBS in Collaborators, and 5.5—Report describing the potential for implementation of large-scale NBS in Europe. We would also like to express our gratitude to H. N. Verhoef for their assistance in editing this work.

Conflicts of Interest

Authors Božidar Deduš, Draženka Kvesić, and Lyudmil Ikonomov were employed by the company PRONING DHI Ltd. and Consulting Centre for Sustainable Development Geopont-Intercom Ltd. The remaining authors declare that the research was conducted in the absence of any commercial or financial relationship that could be construed as a potential conflict of interest.

Abbreviations

The following abbreviations are used in this manuscript:
CLCCorine land cover
DEMDigital elevation model
EbAEcosystem-based approach
ESAEuropean space agency
IHMEInternational 283 Hydrogeological Map of Europe
LULCLand use land cover
NBSNature-based solution
MCAMulti-criteria analysis
MCDMMulti-criteria decision making

Appendix A. Description of Nature-Based Solutions

Appendix A.1. Afforestation

Afforestation is a process of planting trees or sowing seeds that would grow into trees and form forests. Forests are believed to mitigate flooding by serving as sponges, trapping water after heavy rainfall and eventually releasing it into waterways, reducing flood incidence and maintaining stream flow during dry periods. Developing forests comprising native species could provide a greater range of co-benefits.

Appendix A.2. Riparian Forest Buffer Strips

Riparian forest buffers are patches of vegetation that are planted adjacent to streams and other water bodies. They have a greater water-holding capacity than cutover or non-forest covered areas. Because of their rougher ground surface, they can slow runoff more effectively than bare ground. However, riparian forest buffers have a limited ability to store and slow terrestrial runoff due to their relatively small breadth.
Buffer strips provide multiple benefits like reducing and decelerating runoff, removing nutrients like nitrogen from the runoff, maintaining biodiversity and ecosystems within the riparian zone, increasing bank stability, etc. Because of its multi-functional nature, it is considered one of the Best Management Practices (BMPs).

Appendix A.3. Detention Basins

A detention basin is free space from water in dry weather. It is designed to store runoff for a temporary period during high flow, then releasing it slowly downstream or to a nearby watercourse, using an outlet control structure to control the flow rate. Detention basins can also be vegetated depressions designed to hold runoff from impermeable surfaces and allow for the settling of sediments and associated pollutants. The storage capacity is dependent on the design of the basin, which can be sized to accommodate any size of rainfall event. Detention basins can reduce the risk of surface flooding in conjunction with other NBS features, and in doing so contribute to climate change adaptation.

Appendix A.4. Retention Ponds

Retention ponds are ponds designed with additional storage capacity to attenuate surface runoff during rainfall events. Ponds are created by using an existing natural depression, by excavating a new depression, or by constructing embankments. Increasing storage can be applied on different scales. Retention ponds reduce peak runoff through storage and controlled outflow and reduce the risk of surface flooding. Reductions in discharge cause lower water levels downstream of the site of the measures.

Appendix B. Criteria and Conditions for Suitability of NBSs

Table A1. Criteria and conditions for mapping suitability.
CriteriaConditions
FPRDAFFB
Slope (%)≤5≤5≤60≤60
Distance from streams (m)≤1000≤1000Not applicable≤100
Distance from roads (m)≥50≥50≥50≥50
Table A2. Reclassification conditions of IHME 1500 aquifer type.
CodeAquifer NameValue
1Highly productive fissured aquifers (including karstified rocks)1
2Highly productive porous aquifers1
3Inland water0
4Locally aquiferous rock, fissured or porous1
5Low and moderately productive fissured aquifers (including karstified rocks)0
6Low and moderately productive porous aquifers0
7Practically non aquiferous rocks, porous or fissured0
8Snowfield/ice field0
Table A3. Reclassification conditions of ESA WorldCover.
CodeLandcoverValue
10Tree cover1
20Shrubland1
30Grassland1
40Cropland1
50Built-up0
60Bare/sparse vegetation1
70Snow and ice0
80Permanent water bodies0
90Herbacious wetland0
95Mangroves0
100Moss and lichen1
Table A4. Reclassification conditions of CLC 2018.
CodeLandcoverFPRDAF/FB
111Continuous urban fabric000
112Discontinuous urban fabric000
121Industrial or commercial units000
122Road and rail networks and associated land000
123Port areas000
124Airports000
131Mineral extraction sites000
132Dump sites000
133Construction sites000
141Green urban areas111
142Sport and leisure facilities111
211Non-irrigated arable land111
212Permanently irrigated land111
213Rice fields111
221Vineyards111
222Fruit trees and berry plantations111
223Olive groves111
231Pastures111
241Annual crops associated with permanent crops111
242Complex cultivation patterns111
243Land principally occupied by agriculture, w. significant areas of natural vegetation111
244Agro-forestry areas111
311Broad-leaved forest110
312Coniferous forest110
313Mixed forest110
321Natural grasslands110
322Moors and heathland110
323Sclerophyllous vegetation110
324Transitional woodland-shrub110
331Beaches, dunes, sands110
332Bare rocks110
333Sparsely vegetated areas111
334Burnt areas111
335Glaciers and perpetual snow000
411Inland marshes110
412Peat bogs110
421Salt marshes110
422Salines110
423Intertidal flats110
511Water courses110
512Water bodies110
521Coastal lagoons000
522Estuaries000
523Sea and ocean000
Figure A1. Workflow in ArcGIS Pro ModelBuilder environment.
Hydrology 12 00272 g0a1

Appendix C. Results

Appendix C.1. High-Resolution Maps of Results from Each Study Area
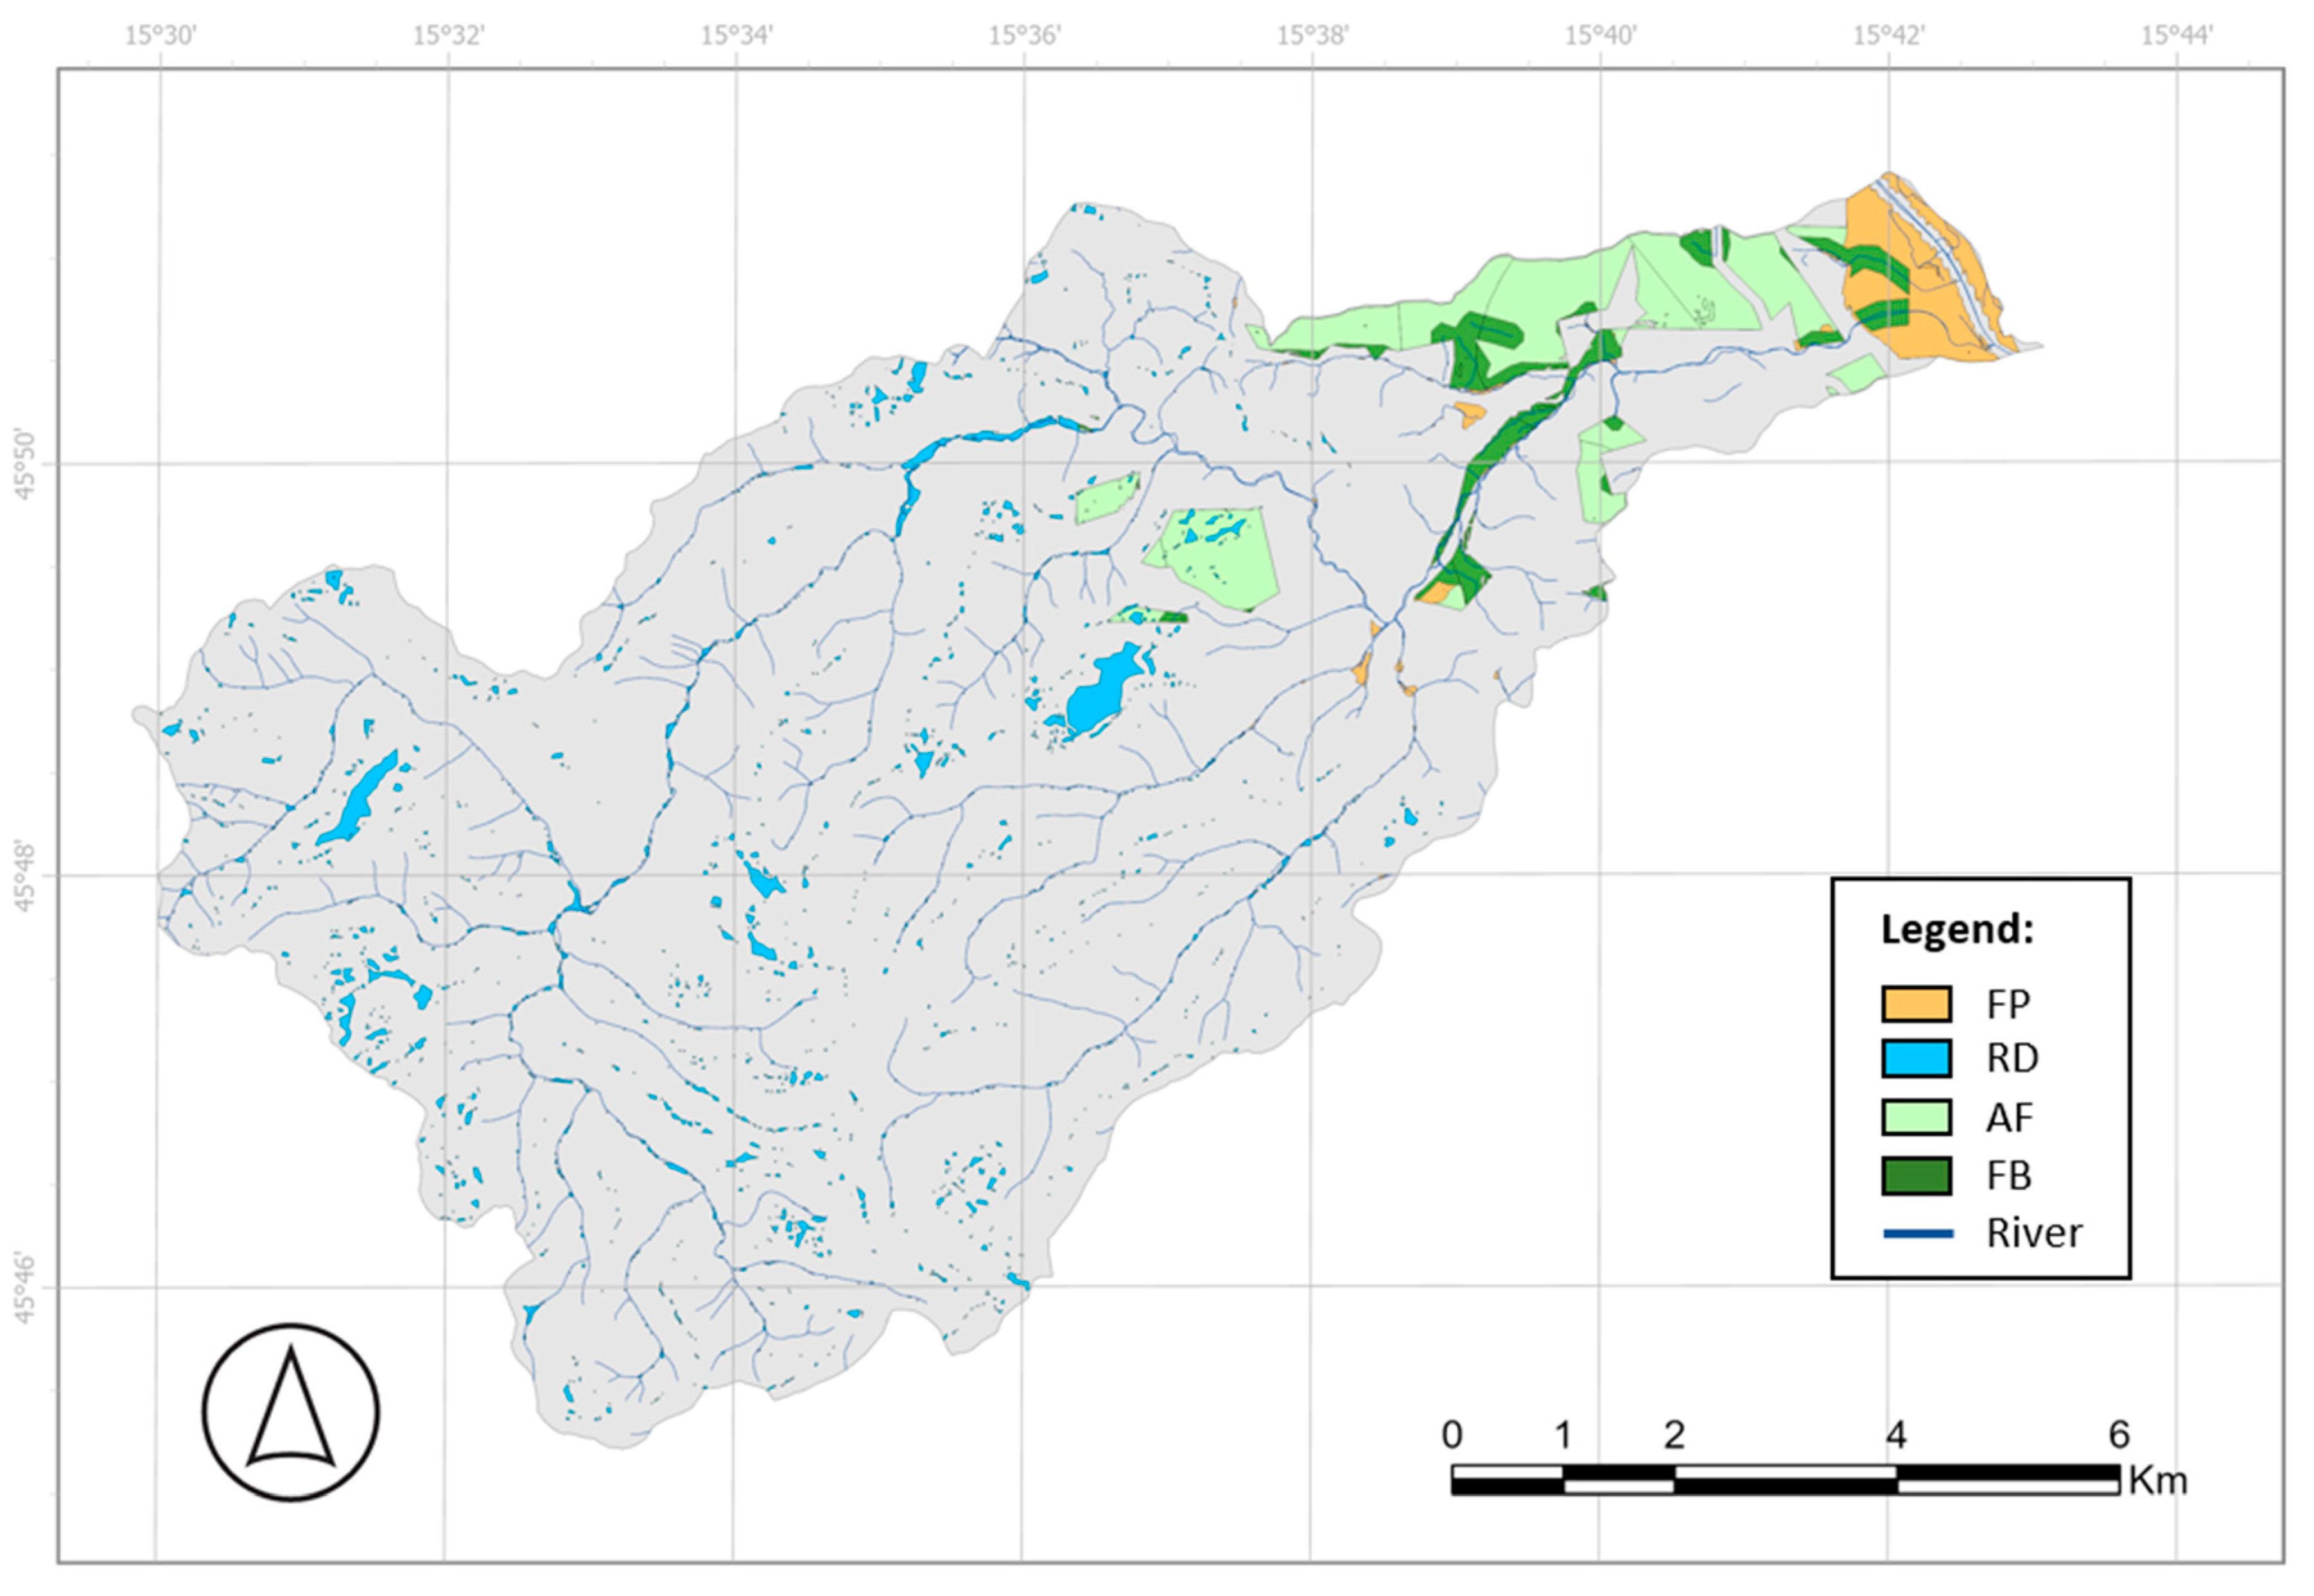
Figure A2. Geospatial suitability of NBSs in the Bregana River Basin.
Hydrology 12 00272 g0a2
Figure A3. Geospatial suitability of NBSs in the Jadar River Basin.
Hydrology 12 00272 g0a3
Figure A4. Geospatial suitability of NBSs in the Kamchia River Basin.
Hydrology 12 00272 g0a4
Figure A5. Geospatial suitability of NBSs in the Pilica River Basin.
Hydrology 12 00272 g0a5
Figure A6. Geospatial suitability of NBSs in the Tamnava River Basin.
Hydrology 12 00272 g0a6
Figure A7. Geospatial suitability of NBSs in the Vrbanja River Basin.
Hydrology 12 00272 g0a7

Appendix C.2. Data Tables with Additional Details

Table A5. Area suitable for NBS, including areas of common or intersecting suitability.
Study
Area
Suitable Area (ha)
BasinFPRDAFFB
Bregana892118397551130
Jadar89,2924992217445,0233502
Kamchia535,85111,59651,477131,2947671
Pilica474,44749,397108,00224,3531615
Tamnava72,1915431826632,2582946
Vrbanja80,384255198921,0872344
Table A6. Percentage of basin area suitable for NBSs, including areas of common or intersecting suitability.
Study
Area
Percentage of Basin Area Suitable (%)
FPRDAFFB
Bregana2.051.086.181.46
Jadar5.592.4350.423.92
Kamchia2.169.6124.501.43
Pilica10.4122.765.130.34
Tamnava7.5211.4544.684.08
Vrbanja0.322.4726.232.92
Table A7. Area only suitable for each NBS, not including areas of common or intersecting suitability.
Study
Area
Suitable Area (ha)
BasinFPRDAFFBTotal
Bregana89211109339182676
Jadar89,292157551338,615133042,033
Kamchia535,851366934,315103,1263080144,190
Pilica474,44746,373101,06614,34351161,833
Tamnava72,1911898183321,39889526,024
Vrbanja80,3848034417,786148119,692
Table A8. Percentage of basin area only suitable for each NBS, not including areas of common or intersecting suitability.
Study
Area
Percentage of Basin Area Suitable (%)
FPRDAFFBTotal
Bregana1.231.044.390.927.58
Jadar1.760.5743.251.4947.07
Kamchia0.686.4019.250.5726.91
Pilica9.7721.303.020.0134.11
Tamnava2.632.5429.641.2436.05
Vrbanja0.100.4322.131.8424.50
Table A9. Areas of common, intersecting, or shared suitability between NBSs.
Study
Area
Suitable Area (ha)
AF & FPAF & RDFB & FPFB & RD
Bregana744480
Jadar341716619681205
Kamchia792617,16217102881
Pilica302469364101154
Tamnava353364334911561
Vrbanja174164596767
Table A10. Percentage of basin area common, intersecting, or shared suitability between NBSs.
Study
Area
Percentage of Basin Area Suitable (%)
AF & FPAF & RDFB & FPFB & RD
Bregana744480
Jadar341716619681205
Kamchia792617,16217102881
Pilica302469364101154
Tamnava353364334911561
Vrbanja174164596767

References

  1. Kikstra, J.S.; Nicholls, Z.R.J.; Smith, C.J.; Lewis, J.; Lamboll, R.D.; Byers, E.; Sandstad, M.; Meinshausen, M.; Gidden, M.J.; Rogelj, J.; et al. The IPCC Sixth Assessment Report WGIII climate assessment of mitigation pathways: From emissions to global temperatures. Geosci. Model Dev. 2022, 15, 9075–9109. [Google Scholar] [CrossRef]
  2. Fujihira, K. Systematic method for identifying unsuitable land for development: Biodiversity, disaster risk, and topography. Acad. Environ. Sci. 2025, 2. [Google Scholar] [CrossRef]
  3. UNSD—Environment Statistics, United Nations. Available online: https://unstats.un.org/unsd/envstats/qindicators.cshtml (accessed on 15 May 2025).
  4. Seddon, N.; Smith, A.; Smith, P.; Key, I.; Chausson, A.; Girardin, C.; House, J.; Srivastava, S.; Turner, B. Getting the message right on nature-based solutions to climate change. Glob. Change Biol. 2021, 27, 1518–1546. [Google Scholar] [CrossRef]
  5. World Bank. A Catalogue of Nature-Based Solutions for Urban Resilience; World Bank Group: Washington, DC, USA, 2021; Available online: https://hdl.handle.net/10986/36507 (accessed on 17 January 2024).
  6. Ruangpan, L.; Vojinovic, Z.; Di Sabatino, S.; Leo, L.S.; Capobianco, V.; Oen, A.M.P.; McClain, M.E.; Lopez-Gunn, E. Nature-based solutions for hydro-meteorological risk reduction: A state-of-the-art review of the research area. Nat. Hazards Earth Syst. Sci. 2020, 20, 243–270. [Google Scholar] [CrossRef]
  7. Fokkens, B. The Dutch strategy for safety and river flood prevention. In Extreme Hydrological Events: New Concepts for Security; Vasiliev, O., van Gelder, P., Plate, E., Bolgov, M., Eds.; NATO Science Series; Springer: Dordrecht, The Netherlands, 2006; Volume 78, pp. 337–352. [Google Scholar] [CrossRef]
  8. Lockwood, T.; Freer, J.; Michaelides, K.; Brazier, R.E.; Coxon, G. Assessing the efficacy of offline water storage ponds for natural flood management. J. Hydrol. Process. 2022, 36, e14618. [Google Scholar] [CrossRef]
  9. Duraisekaran, E.; Mohanraj, T.; Samuel, J.S.K.; Rajagopalan, S.; Govindasamy, R. Investigation of multiple flood mitigation strategies for an urban catchment using semi-distributed hydrological modelling. Arab J. Geosci. 2021, 14, 1423. [Google Scholar] [CrossRef]
  10. Giraldo-Charria, D.L.; Escobedo, F.J.; Clerici, N.; Quesada, B. Urban forests mitigate extreme heat exposure in a vulnerable tropical city. Urban Clim. 2025, 59, 102311. [Google Scholar] [CrossRef]
  11. Faivre, N.; Fritz, M.; Freitas, T.; de Boissezon, B.; Vandewoestijne, S. Nature-Based Solutions in the EU: Innovating with nature to address social, economic and environmental challenges. Environ. Res. 2017, 159, 509–518. [Google Scholar] [CrossRef] [PubMed]
  12. Deane, A.; Norrey, J.; Coulthard, E.; McKendry, D.C.; Dean, A.P. Riverine large woody debris introduced for natural flood management leads to rapid improvement in aquatic macroinvertebrate diversity. Ecol. Eng. 2021, 163, 106197. [Google Scholar] [CrossRef]
  13. Lai, S.; Isola, F.; Leone, F.; Zoppi, C. Assessing the potential of green infrastructure to mitigate hydrogeological hazard. Evidence-based policy suggestions from a Sardinian study area. TEMA 2021, 2021, 109–133. [Google Scholar] [CrossRef]
  14. Chia, B.; Wang, Y.; Chen, Y. Flood resilience of urban river restoration projects: Case studies in Hong Kong. J. Manag. Eng. 2020, 36, 5020009. [Google Scholar] [CrossRef]
  15. Global Standard for Nature-Based Solutions: A User-Friendly Framework for the Verification, Design and Scaling Up of NbS, 1st ed.; IUCN: Gland, Switzerland, 2020. [CrossRef]
  16. Fontana, V.; Radtke, A.; Fedrigotti, V.B.; Tappeiner, U.; Tasser, E.; Zerbe, S.; Buchholz, T. Comparing land-use alternatives: Using the ecosystem services concept to define a multi-criteria decision analysis. Ecol. Econ. 2013, 93, 128–136. [Google Scholar] [CrossRef]
  17. Ruangpan, L.; Vojinovic, Z.; Plavšić, J.; Doong, D.-J.; Bahlmann, T.; Alves, A.; Tseng, L.-H.; Randelović, A.; Todorović, A.; Kocic, Z.; et al. Incorporating stakeholders’ preferences into a multi-criteria framework for planning large-scale Nature-Based Solutions. Ambio 2021, 50, 1514–1531. [Google Scholar] [CrossRef] [PubMed]
  18. Kuller, M.; Bach, P.M.; Roberts, S.; Browne, D.; Deletic, A. A planning-support tool for spatial suitability assessment of green urban stormwater infrastructure. Sci. Total Environ. 2019, 686, 856–868. [Google Scholar] [CrossRef]
  19. Voskamp, I.M.; Van de Ven, F.H. Planning support system for climate adaptation: Composing effective sets of blue-green measures to reduce urban vulnerability to extreme weather events. Build. Environ. 2015, 83, 159–167. [Google Scholar] [CrossRef]
  20. Meerow, S.; Newell, J.P. Spatial planning for multifunctional green infrastructure: Growing resilience in Detroit. Landsc. Urban Plan. 2017, 159, 62–75. [Google Scholar] [CrossRef]
  21. Mubeen, A.; Ruangpan, L.; Vojinovic, Z.; Sanchez Torres, A.; Plavšić, J. Planning and Suitability Assessment of Large-scale Nature-based Solutions for Flood-risk Reduction. Water Resour. Manag. 2021, 35, 3063–3081. [Google Scholar] [CrossRef]
  22. CORDIS. RECONECT Project. Brussels: Publications Office of the European Union. 2018. Available online: https://cordis.europa.eu/project/id/776866 (accessed on 15 May 2025).
  23. Plavšić, J.; Vladiković, D.; Despotović, J. Floods in the Sava River Basin in May 2014. In Proceedings of the Mediterranean Meeting on Monitoring, Modelling, Early Warning of Extreme Events Triggered by Heavy Rainfall, Cosenza, Italy, 26–28 June 2014; Available online: https://www.researchgate.net/publication/377463869 (accessed on 29 August 2025).
  24. Babić-Mladenović, M.; Kolarov, V. River Basin Studies as a Basis for Flood Risk Management Planning: The Kolubara River Basin Case Study. Water Res. Manag. 2016, 6, 3–9. [Google Scholar]
  25. European Commission. Overview of Natural and Man-Made Disaster Risks the European Union May Face: 2020 Edition; Directorate-General for European Civil Protection and Humanitarian Aid Operations (ECHO) Publications Office: Brussels, Belgium, 2021; Available online: https://data.europa.eu/doi/10.2795/1521 (accessed on 15 May 2025).
  26. Plavšić, J.; Ruangpan, L.; Vojinovic, Z.; Kuhlicke, C.; Han, S. D4.8: Prefeasibility Studies for Implementation of NBS in Collaborators. 2024. Available online: https://ec.europa.eu/research/participants/documents/downloadPublic?documentIds=080166e514113ec6&appId=PPGMS (accessed on 15 May 2025).
  27. Liera, C.; Esquivel, N.; Barquet, K.; Ruangpan, L.; Plavšić, J. D4.2: Baseline Assessment and Potential for NBS in Collaborators. 2022. Available online: https://ec.europa.eu/research/participants/documents/downloadPublic?documentIds=080166e5050f417c&appId=PPGMS (accessed on 22 April 2025).
  28. Vinet, F. From hazard reduction to integrated risk management: Toward adaptive flood prevention in Europe. Flood hazards, vulnerability and risk reduction. In Flood Hazards and Health; Taylor Francis Group: Abingdon, UK, 2013; Volume 118, pp. 113–122. [Google Scholar] [CrossRef]
  29. Serra-Llobet, A.; Jähnig, S.C.; Geist, J.; Kondolf, G.M.; Damm, C.; Scholz, M.; Lund, J.; Opperman, J.J.; Yarnell, S.M.; Pawley, A.; et al. Restoring rivers and floodplains for habitat and flood risk reduction: Experiences in multi-benefit floodplain management from California and Germany. Front. Environ. Sci. 2022, 9, 778568. [Google Scholar] [CrossRef]
  30. Corine Land Cover 2018 (Raster 100 m). European Union’s Copernicus Land Monitoring Service. 2019. Available online: https://doi.org/10.2909/960998c1-1870-4e82-8051-6485205ebbac (accessed on 21 June 2022).
  31. Zanaga, D.; Van De Kerchove, R.; Daems, D.; De Keersmaecker, W.; Brockmann, C.; Kirches, G.; Wevers, J.; Cartus, O.; Santoro, M.; Fritz, S.; et al. ESA WorldCover 10 m 2021 v200; The European Space Agency (ESA): Paris, France, 2022. [Google Scholar] [CrossRef]
  32. Kokutse, N.K.; Temgoua, A.G.T.; Kavazović, Z. Slope stability and vegetation: Conceptual and numerical investigation of mechanical effects. Ecol. Eng. 2016, 86, 146–153. [Google Scholar] [CrossRef]
  33. MacNeil, D.J.; Steele, D.P.; McMahon, W.; Carder, D.R. Vegetation for Slope Stability; TRL Report, 515; Transport Research Foundation: Berkshire, UK, 2001. [Google Scholar]
  34. Sotir, R.B.; Gray, D.H. Chapter 18: Soil Bioengineering for Upland Slope Protection and Erosion Reduction. In Engineering Field Handbook; Soil Conservation Service USDA: Washington, DC, USA, 1992. [Google Scholar]
  35. Mac Nally, R.; Molyneux, G.; Thomson, J.R.; Lake, P.S.; Read, J. Variation in widths of riparian-zone vegetation of higher-elevation streams and implications for conservation management. Plant Ecol. 2008, 198, 89–100. [Google Scholar] [CrossRef]
  36. Vidon, P.G.; Hill, A.R. Landscape controls on the hydrology of stream riparian zones. J. Hydrol. 2004, 292, 210–228. [Google Scholar] [CrossRef]
  37. BGR; UNESCO (Eds.) International Hydrogeological Map of Europe 1:1,500,000 (IHME1500). Digital Map Data v1.2. Hannover/Paris. 2019. Available online: https://services.bgr.de/grundwasser/ihme1500 (accessed on 21 June 2022).
  38. EU-DEM v 1.1 (Raster). European Union’s Copernicus Land Monitoring Service. 2016. Available online: https://sdi.eea.europa.eu/catalogue/srv/api/records/3473589f-0854-4601-919e-2e7dd172ff50 (accessed on 21 June 2022).
  39. Kpadé, C.P.; Tamini, L.D.; Pepin, S.; Khasa, D.P.; Abbas, Y.; Lamhamedi, M.S. Evaluating Multi-Criteria Decision-Making Methods for Sustainable Management of Forest Ecosystems: A Systematic Review. Forests 2024, 15, 1728. [Google Scholar] [CrossRef]
  40. Valente, R.A.; de Mello, K.; Metedieri, J.F.; Americo, C. A multicriteria evaluation approach to set forest restoration priorities based on water ecosystem services. J. Environ. Manag. 2021, 285, 112049. [Google Scholar] [CrossRef]
  41. Campos, V.S.; Lopes, T.R.; de Oliveira Macedo, M.; Santos, F.S.; Silva, J.A.; Francisco, J.P.; Leite, F. Multicriteria geospatial analysis for prioritizing soil erosion risk areas in a reservoir-contributing watershed. J. S. Am. Earth Sci. 2025, 165, 105714. [Google Scholar] [CrossRef]
  42. Bozali, N. Assessment of the soil protection function of forest ecosystems using GIS-based Multi-Criteria Decision Analysis: A case study in Adıyaman, Turkey. Glob. Ecol. Conserv. 2020, 24, e01271. [Google Scholar] [CrossRef]
  43. Assumma, V.; Quagliolo, C.; Comino, E.; Mondini, G. Definition of an Integrated Theoretical Framework to Assess the NBS Suitability in Flood Risk Areas. In Proceedings of the Computational Science and Its Applications—ICCSA 2022 Workshops, Malaga, Spain, 4–7 July 2022; Gervasi, O., Murgante, B., Misra, S., Rocha, A.M.A.C., Garau, C., Eds.; ICCSA 2022, Lecture Notes in Computer Science. Springer: Cham, Switzerland, 2022; p. 13380. [Google Scholar] [CrossRef]
  44. RECONECT. D5.5: Report Describing the Potential for Implementation of Large-scale NbS in Europe. 2025. Available online: https://ec.europa.eu/research/participants/documents/downloadPublic?documentIds=080166e5f66fb570&appId=PPGMS (accessed on 13 June 2025).
  45. Gadi, V.K.; Tang, Y.R.; Das, A.; Monga, C.; Garg, A.; Berretta, C.; Sahoo, L. Spatial and temporal variation of hydraulic conductivity and vegetation growth in green infrastructures using infiltrometer and visual technique. Catena 2017, 155, 20–29. [Google Scholar] [CrossRef]
  46. Liu, Y.; Chai, Y.; Yue, Y.; Huang, Y.; Yang, Y.; Zhu, B.; Lou, D.; Li, Y.; Shi, D.; Ullah, W. Effects of global greening phenomenon on water sustainability. Catena 2022, 208, 105732. [Google Scholar] [CrossRef]
  47. Sungmin, O.; Bastos, A.; Reichstein, M.; Li, W.; Denissen, J.; Graefen, H.; and Orth, R. The role of climate and vegetation in regulating drought–heat extremes. J. Clim. 2022, 35, 5677–5685. [Google Scholar] [CrossRef]
  48. Paletto, A.; Pieratti, E.; De Meo, I.; Agnelli, A.E.; Cantiani, P.; Chiavetta, U.; Mazza, G.; Lagomarsino, A. A multi-criteria analysis of forest restoration strategies to improve the ecosystem services supply: An application in Central Italy. Ann. For. Sci. 2021, 78, 7. [Google Scholar] [CrossRef]
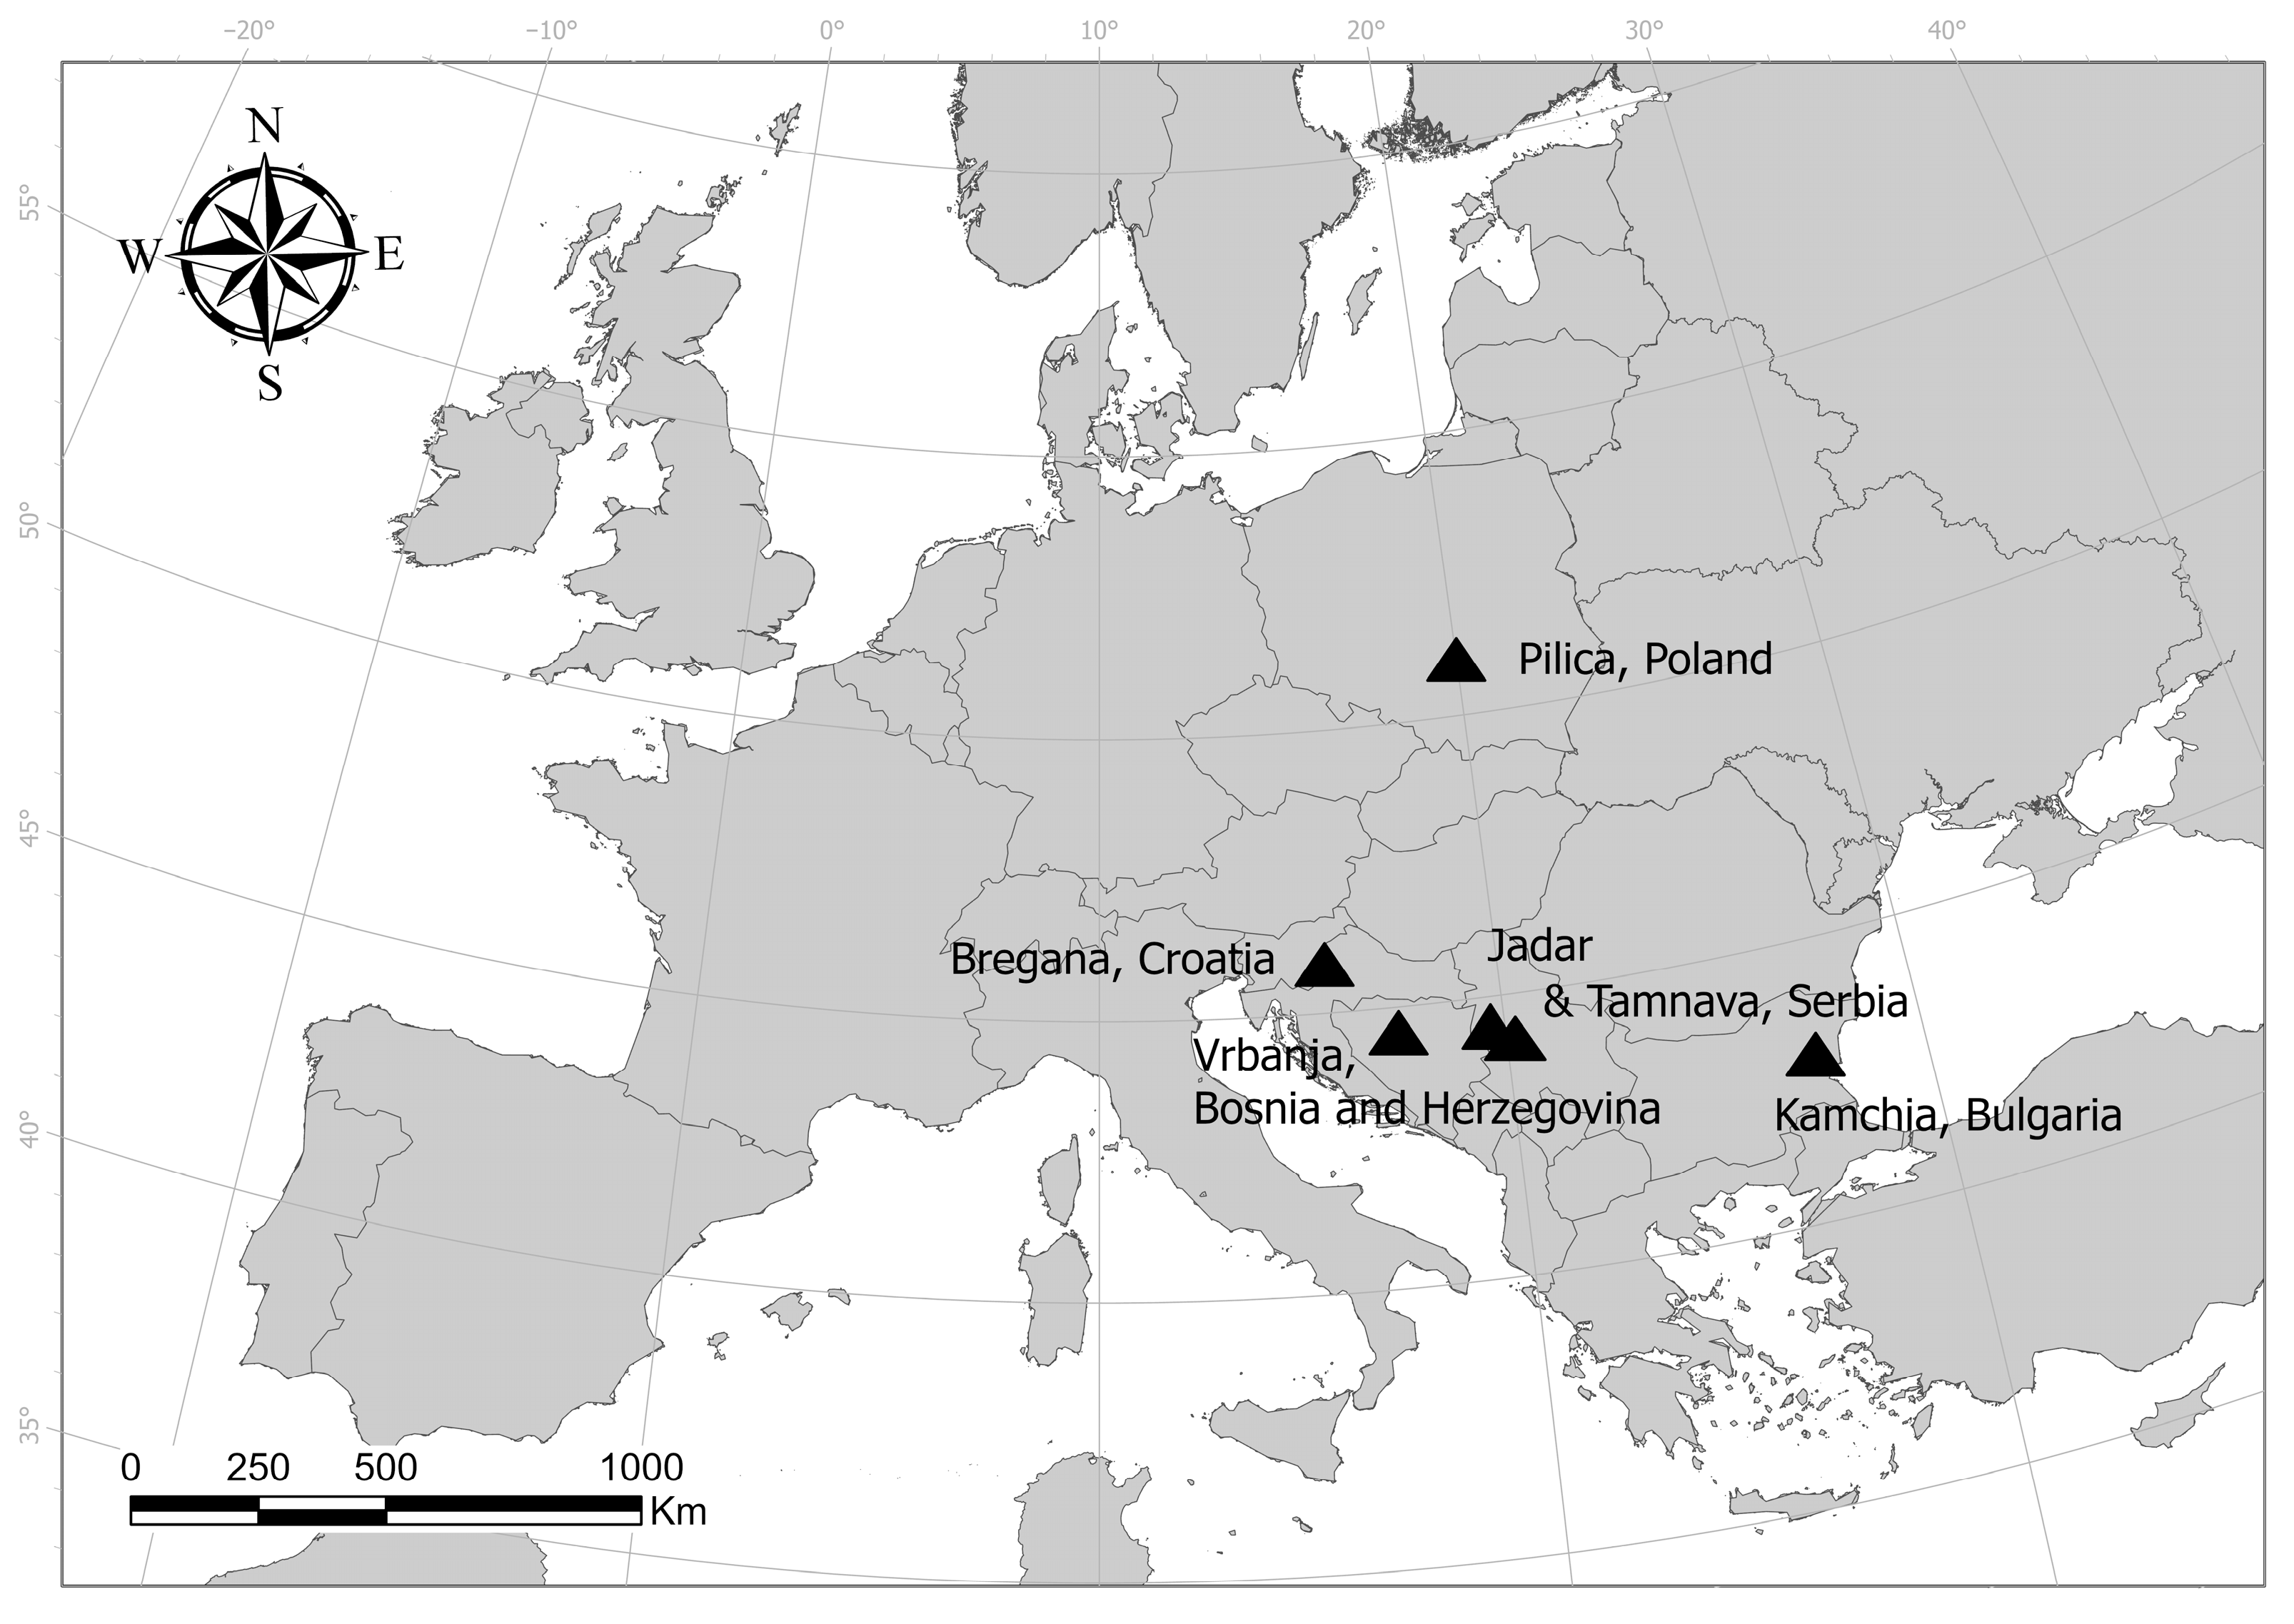
Figure 1. RECONECT European collaborator sites.
Hydrology 12 00272 g001
Figure 2. Workflow for mapping suitability of vegetative measures.
Hydrology 12 00272 g002
Figure 3. Geospatial suitability of NBSs (area in ha) in the (a) Bregana, (b) Jadar, (c) Kamchia, (d) Pilica, (e) Tamnava, and (f) Vrbanja River Basins.
Hydrology 12 00272 g003
Figure 4. Percentage of area for NBS over suitability of all NBSs.
Hydrology 12 00272 g004
Figure 5. A comparison of suitability between the improved models and the older model.
Hydrology 12 00272 g005
Table 1. Input data and sources.
Input DataType and ResolutionSource
DEM (EU-DEM)Raster (30 m)https://ec.europa.eu/eurostat/web/gisco (accessed on 21 June 2022)
River NetworkVector (500 m)https://www.hydrosheds.org (accessed on 20 June 2022)
Road NetworkVector (500 m)https://mapcruzin.com (accessed on 20 June 2022)
LULC (CLC 2018)Raster (100 m)https://land.copernicus.eu (accessed on 21 June 2022)
LULC (WorldCover 2021)Raster (10 m)https://esa-worldcover.org (accessed on 21 June 2022)
Hydrogeology (IHME 1500)Vector (1500 m)https://www.bgr.bund.de (accessed on 21 June 2022)
Table 2. Area suitable for each large-scale NBS, not including areas of common or intersecting suitability.
Study
Area
Area (ha)Basin Area Suitable for NBS (%)
BasinFPRDAFFBTotal
Bregana892111093391826767.58
Jadar89,292157551338,615133042,03347.07
Kamchia535,851366934,315103,1263080144,19026.91
Pilica474,44746,373101,06614,34351161,83334.11
Tamnava72,1911898183321,39889526,02436.05
Vrbanja80,3848034417,786148119,69224.50
Table 3. Area suitable for NBS, including areas of common or intersecting suitability.
Study
Area
Suitable Area (ha)
BasinFPRDAFFB
Bregana892118397551130
Jadar89,2924992217445,0233502
Kamchia535,85111,59651,477131,2947671
Pilica474,44749,397108,00224,3531615
Tamnava72,1915431826632,2582946
Vrbanja80,384255198921,0872344
Table 4. Length of stream suitable for riparian forest buffer (FB).
Study AreaLength (km)Stream Length Suitable for FB (%)
Streams Suitable for FB
Bregana1887.914.21
Jadar643254.8339.63
Kamchia1230367.2429.87
Pilica106578.387.36
Tamnava720159.5322.15
Vrbanja466114.1824.50
Table 5. Areas determined to be suitable for NBS based on mechanism of action.
Study
Area
Area (ha)
Conveyance
(FP)
Storage
(RD)
Source Control
(AF + FB)
Bregana11093474
Jadar157551339,945
Kamchia366934,315106,206
Pilica46,373101,06614,393
Tamnava1898183322,293
Vrbanja8034419,267
Disclaimer/Publisher’s Note: The statements, opinions and data contained in all publications are solely those of the individual author(s) and contributor(s) and not of MDPI and/or the editor(s). MDPI and/or the editor(s) disclaim responsibility for any injury to people or property resulting from any ideas, methods, instructions or products referred to in the content.