Article

Stable Water Isotopes and Machine Learning Approaches to Investigate Seawater Intrusion in the Magra River Estuary (Italy)

1
Department of Chemical and Geological Science, University of Modena and Reggio Emilia, via Campi 103, 41125 Modena, Italy
2
ACAM Acque S.p.A.—IREN Group, via Redipuglia 1, 19124 La Spezia, Italy
*
Author to whom correspondence should be addressed.
Hydrology 2025, 12(10), 262; https://doi.org/10.3390/hydrology12100262
Submission received: 21 August 2025 / Revised: 25 September 2025 / Accepted: 27 September 2025 / Published: 3 October 2025

Abstract

Seawater intrusion into coastal river systems poses increasing challenges for freshwater availability and estuarine ecosystem integrity, especially under evolving climatic and anthropogenic pressures. This study presents a multidisciplinary investigation of marine intrusion dynamics within the Magra River estuary (Northwest Italy), integrating field monitoring, isotopic tracing (δ18O; δD), and multivariate statistical modeling. Over an 18-month period, 11 fixed stations were monitored across six seasonal campaigns, yielding a comprehensive dataset of water electrical conductivity (EC) and stable isotope measurements from fresh water to salty water. EC and oxygen isotopic ratios displayed strong spatial and temporal coherence (R2 = 0.99), confirming their combined effectiveness in identifying intrusion patterns. The mass-balance model based on δ18O revealed that marine water fractions exceeded 50% in the lower estuary for up to eight months annually, reaching as far as 8.5 km inland during dry periods. Complementary δD measurements provided additional insight into water origin and fractionation processes, revealing a slight excess relative to the local meteoric water line (LMWL), indicative of evaporative enrichment during anomalously warm periods. Multivariate regression models (PLS, Ridge, LASSO, and Elastic Net) identified river discharge as the primary limiting factor of intrusion, while wind intensity emerged as a key promoting variable, particularly when aligned with the valley axis. Tidal effects were marginal under standard conditions, except during anomalous events such as tidal surges. The results demonstrate that marine intrusion is governed by complex and interacting environmental drivers. Combined isotopic and machine learning approaches can offer high-resolution insights for environmental monitoring, early-warning systems, and adaptive resource management under climate-change scenarios.

1. Introduction

Climate change and anthropogenic pressures are profoundly reshaping coastal dynamics in the Mediterranean region, globally recognized as a climate change hotspot, giving rise to complex hydrological, geochemical, and ecological processes [1,2,3,4,5,6,7,8]. These transformations directly affect water quality, local biodiversity, and the functional integrity of coastal ecosystems. Among these, seawater intrusion stands out as one of the most critical phenomena, as it can disrupt the hydrological balance and threaten water resource availability for domestic, agricultural, and industrial uses [9].
Numerous studies underscore the structural role of rivers in facilitating marine intrusion [5,10,11], serving as preferential pathways for marine water encroachment into continental domains. Their elongated morphology and the hydraulic connectivity between river basins and the sea promote the upstream migration of the saline wedge over several kilometers, particularly under low-flow conditions [12,13]. Furthermore, lateral infiltration of saline water through riverbanks can trigger riparian intrusion events, impairing the quality of coastal aquifers [14]. This latter mechanism is often underestimated compared to direct coastal intrusion, yet it can hasten aquifer salinization and degrade freshwater quality far from the shoreline.
This phenomenon is not limited to estuarine-type rivers; transient episodes of marine ingress are increasingly observed in deltaic systems as well [5,15,16]. In Italy, similar phenomena have been documented in large delta rivers such as the Po, where recent droughts have resulted in saline wedge advancement over 30 km inland from the river mouth [5,17]. Recent studies also highlight the current vulnerability of deltaic systems to climate change and anthropogenic impacts. In particular, 66% of Italy’s 40 major river deltas are affected by coastal erosion [18,19].
This study investigates the Magra River, a representative Mediterranean estuarine system undergoing significant morphological and hydrodynamic transformation over the past century. Historically, the upstream limit of seawater intrusion has been marked by a natural weir located between the hamlets of Romito and Battifollo, formed following the collapse of a bridge. This structure has consistently acted as a hydraulic barrier and still defines the current boundary of marine encroachment [20,21]. Over the past fifty years, however, the freshwater–saltwater transition zone has progressively shifted inland, retreating from Ameglia to Romito. This inland migration reflects an intensification of seawater intrusion, driven by climate change and a documented reduction in sediment transport. The latter is primarily due to prolonged in-channel aggregate extraction (until the 1970s), which led to the disappearance of a submerged deltaic formation once visible in nautical charts from the 1950s [22]. This substantial morphological alteration of the river mouth has disrupted estuarine circulation patterns, thereby facilitating the upstream advancement of saline waters [9,11,23,24].
The aim of this research is to analyze the mechanisms of seawater intrusion penetration in the Magra estuary through an integrated approach combining direct observations, isotopic analysis, and statistical modeling. The results will provide a dynamic, quantitative characterization of the phenomenon to support environmental understanding and territorial management under climate change scenarios.
Building upon previous studies conducted along the terminal reach of the Magra River system [22,25], this research introduces new surface water monitoring methodologies, including the use of isotopic tracers to detect marine intrusion in the river [26,27]. Notably, this study applies an advanced analytical approach to seawater intrusion measurements, implementing multiple machine learning models to identify the most impactful drivers influencing saline balance in the estuary.
A comprehensive understanding of seawater intrusion dynamics in this system requires a multidisciplinary framework that integrates environmental monitoring using natural tracers, such as electrical conductivity (EC) and stable isotopes of oxygen and hydrogen (δ18O; δD), with isotopic analysis to define the local meteoric water line and identify mixing processes between freshwater and marine sources [28]. This framework is further strengthened by multivariate statistical modeling, which enables the assessment of environmental drivers and the simulation of intrusion patterns under varying hydrological and climatic conditions [29,30].
The combined use of physicochemical and isotopic tracers enables high-resolution mapping of spatial and temporal salinity distributions, providing a robust foundation for modeling mixing processes and promoting sustainable water resource management. Moreover, statistical modeling allows for the estimation of the relative weight of environmental drivers and the simulation of future scenarios under extreme events or altered river flow regimes [29,30].

2. Research Area

2.1. Geographic and Geological Framework

The Magra–Vara watershed spans 1698.5 km2, covering a predominantly mountainous and hilly region across Tuscany (58%) and Liguria (42%) (Figure 1) [22,31,32].
The basin includes mountainous sectors of the Apennine reliefs, characterized by relatively high elevations (>1500 m a.s.l.), as well as portions of the Ligurian coastal ridge, which present more modest altitudes (600–700 m a.s.l.). The investigated area, commonly referred to by various authors as the lower Magra Valley, corresponds to a broad coastal valley that hosts the main alluvial plain of the basin (~50 km2). This plain was formed within a tectonic depression attributable to the terminal segment of the Versilia graben, where the lower courses of both rivers (Magra and Vara) converge [31].
Geologically, the basin presents a complex structure stemming from the tectonic evolution of the Northern Apennines [21,22]. In the Lower Magra Valley, the bedrock includes calcareous, marly, and arenaceous formations from the Lower Eocene, overlain by Pliocene and Quaternary fluviolacustrine deposits [20,33]. These sediments host the main aquifer, crucial for water supply in La Spezia and increasingly vulnerable to seawater intrusion [20,21,25,34].

2.2. Hydrography

The Magra River originates at 1200 m a.s.l. in Tuscany, flowing for about 70 km before discharging into the Ligurian Sea, with a mean annual discharge of 57 m3/s at its mouth [16]. Its main tributary, the Vara River, flows entirely within Liguria for 58 km, with an average discharge of 16 m3/s [22].
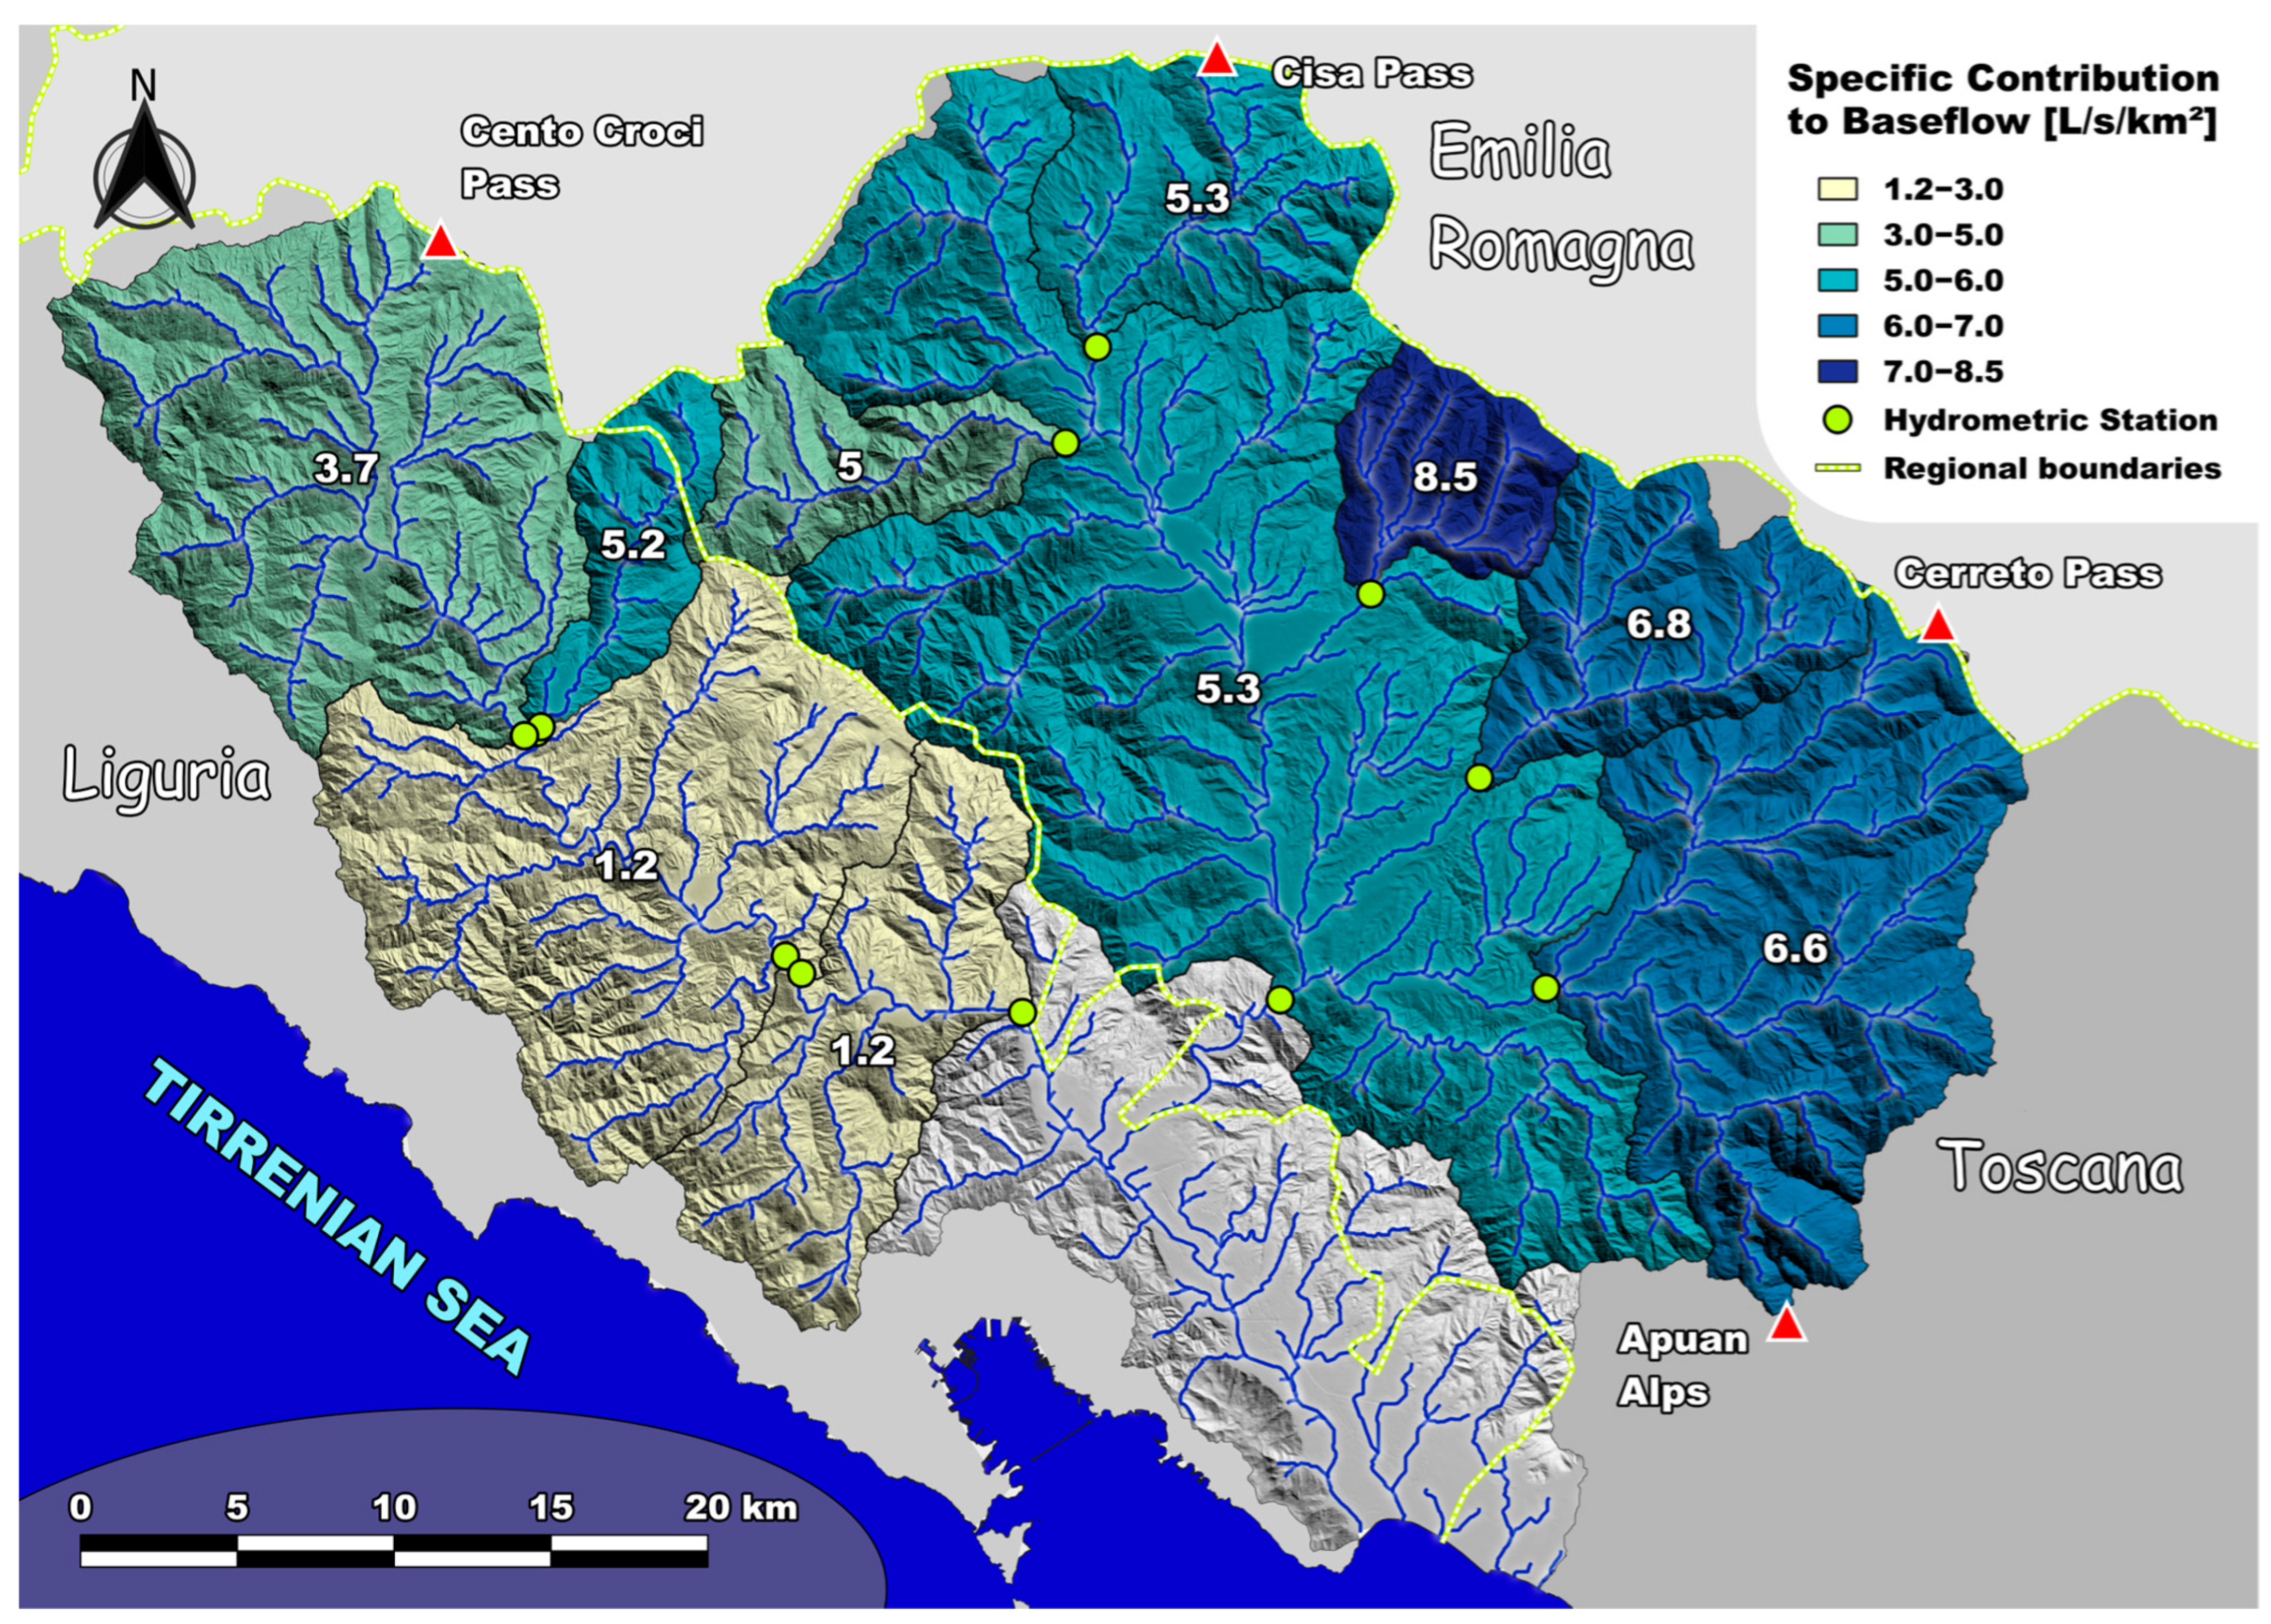
The Magra basin exhibits greater hydrological productivity (>5 L/s/km2) compared to that of the Vara (≈3 L/s/km2), largely due to more favorable precipitation and geological conditions (Figure 2). The highest values occur in the eastern mountainous zones (Magra river basin), especially the Apuan Alps and Cerreto area (>6 L/s/km2).
The geomorphology and rainfall regime impart a torrential hydrological character, with pronounced summer low flows and rapid floods during autumn and spring [31,32].
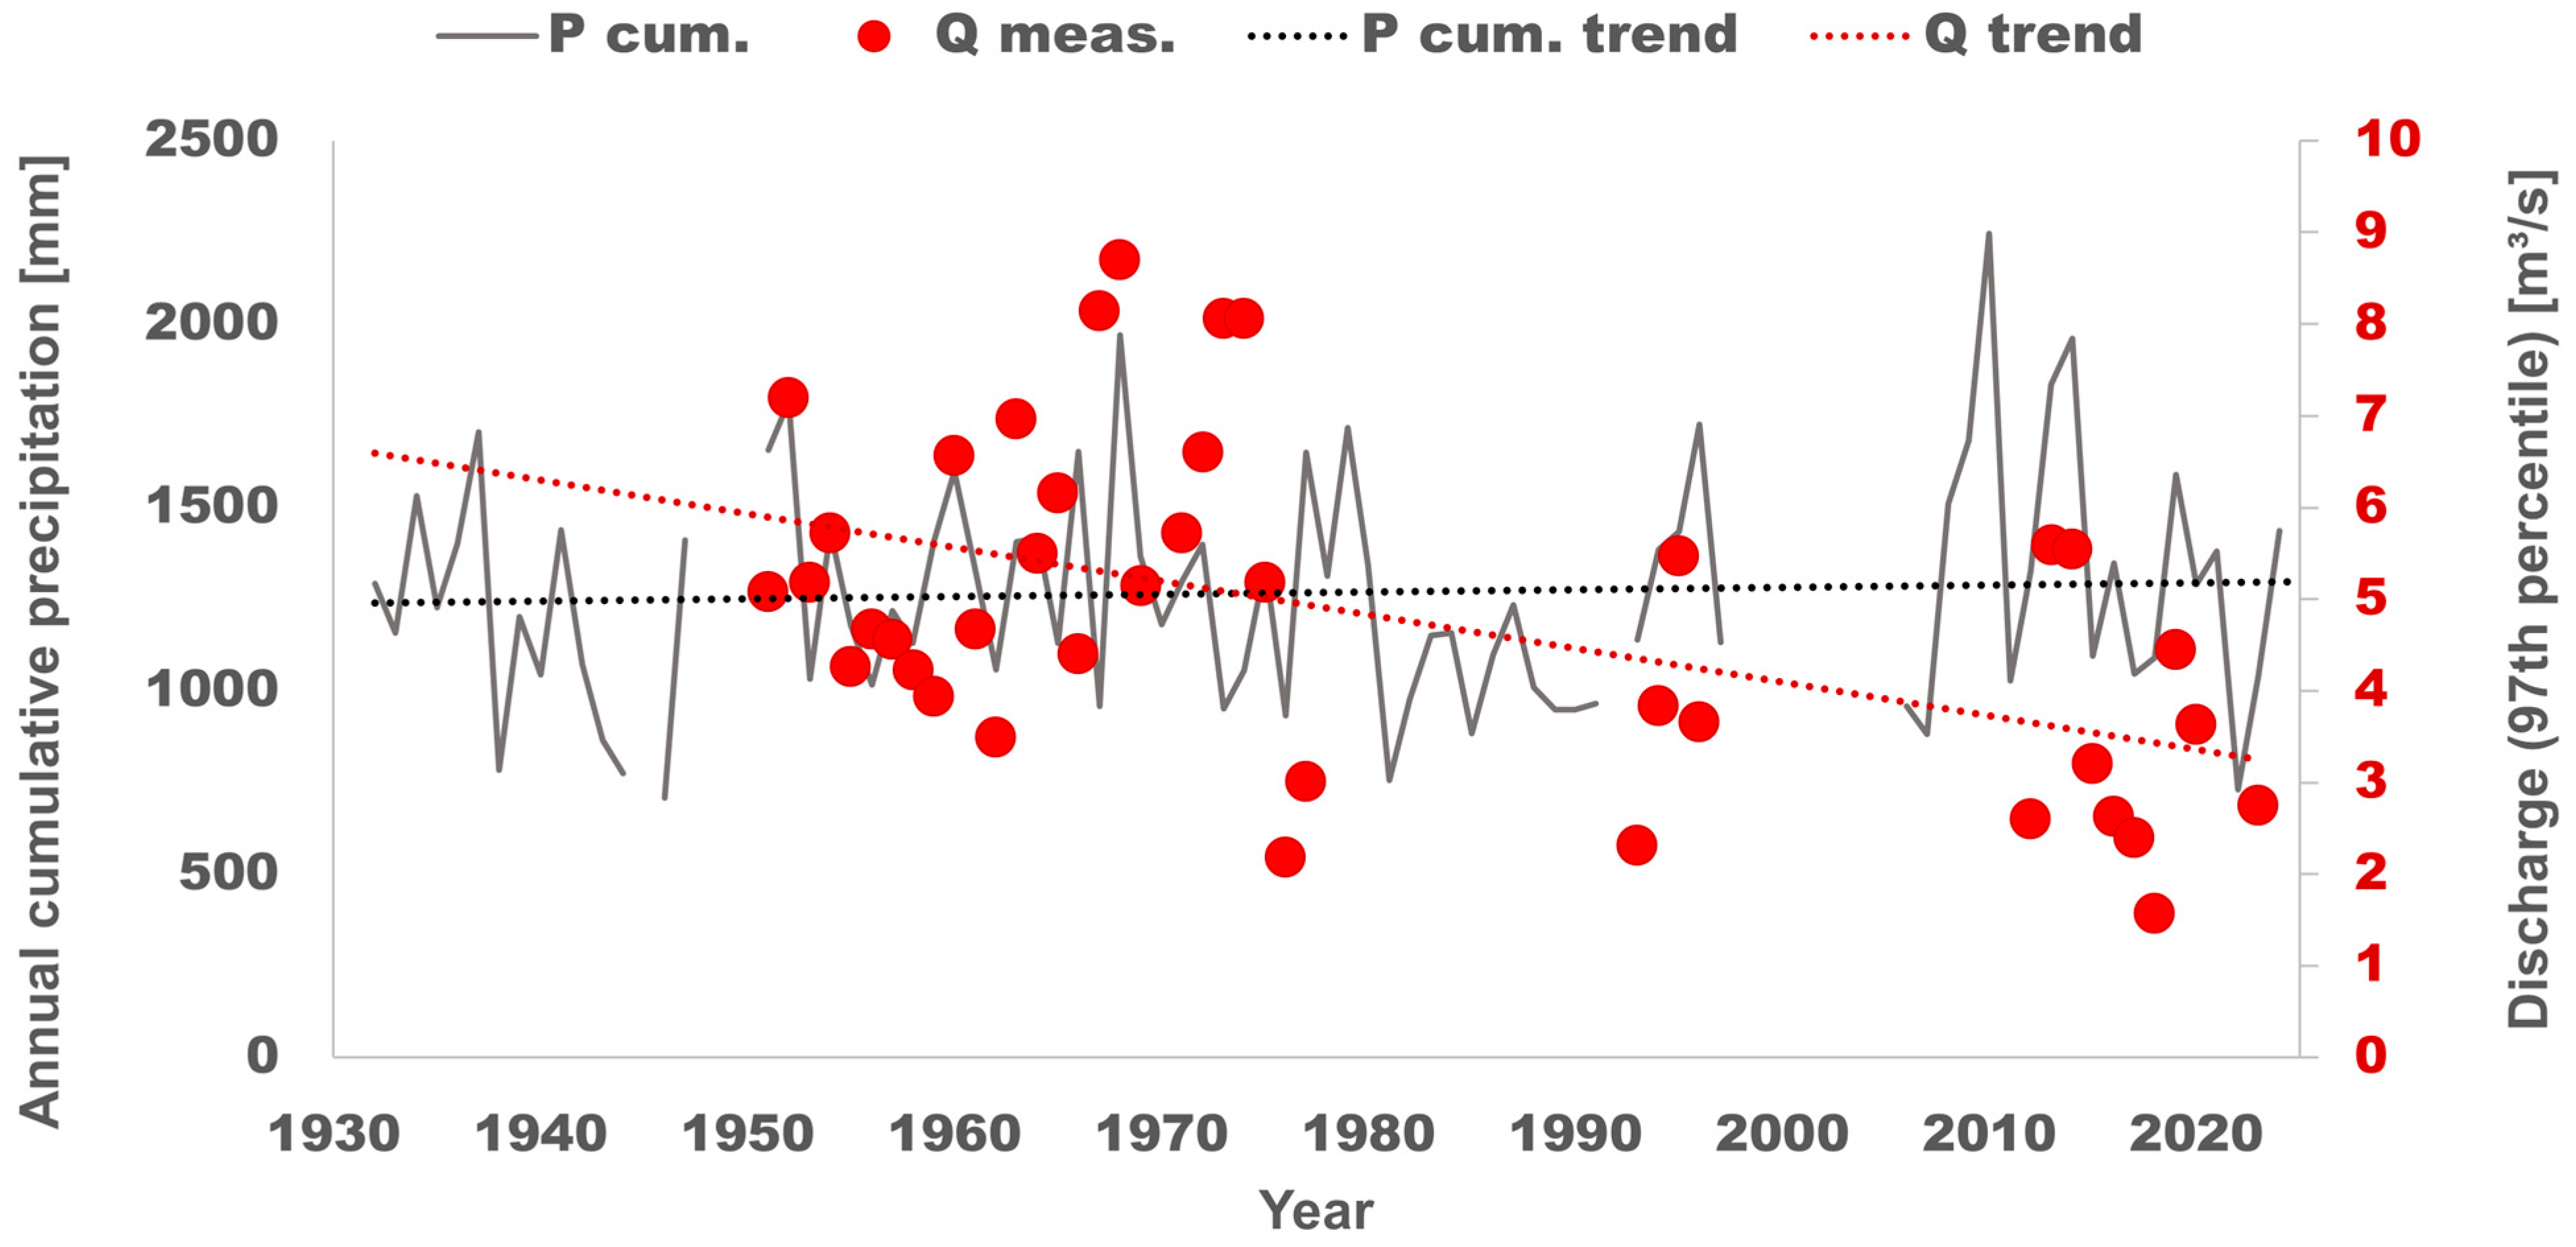
Since 1950, the baseflow discharge recorded at Calamazza Station, located at the entrance to the alluvial plain, has decreased by 50%, falling from 6 m3/s to 3 m3/s (ARPAL, https://ambientepub.regione.liguria.it/SiraQualMeteo/script/PubAccessoDatiMeteo.asp (accessed on 26 September 2025); ISPRA, http://www.bio.isprambiente.it/annalipdf/ (accessed on 26 September 2025)). This decline is mainly attributed to alterations in precipitation patterns (rainfall; snowfall) caused by climate change, despite overall annual precipitation amounts remaining relatively stable (Figure 3). At the Fornola river gauge station, the post-confluence discharge of the Magra with the Vara, recorded between 2022 and 2024, is presented in Figure 4.
Downstream of the Magra–Vara confluence, the river receives few significant natural tributaries. In this section, the hydrographic network has been extensively reshaped by human activity, particularly through historic coastal wetland reclamation and canalization for agricultural purposes [21,33,34]. Several minor watercourses descending from the eastern slopes have undergone artificial modification upon reaching the plain. One of the most notable infrastructures is the Lunense Canal, which diverts approximately 5 m3/s of flow from the Magra River upstream of Albiano (Consorzio Canale Lunense).

2.3. Climatic Framework

The discharge regime of both the Magra and, to a lesser extent, the Vara is strongly influenced by rainfall dynamics, snowfall events, and aquifer recharge rates [25].
The climatic conditions within the basin are influenced by the proximity to the Ligurian Sea, the orientation of valleys and mountain ridges, and the presence of prominent reliefs such as the Apuan Alps and the Apennine crest.
In the Upper–Middle Magra, the interaction between rugged orography and Atlantic air masses results in very high precipitation. Between 1920 and 1970, annual rainfall reached up to 3000 mm/year on elevated northern slopes of the Apuan Alps. The precipitation regime is characteristically Apenninic, with summer minima and autumn maxima [25].
In the Lower Magra Valley, especially along the coast, the climate adopts temperate–maritime characteristics, with lower annual rainfall in the range of 1000–1200 mm [25].
A key climatological station for this region is Sarzana (ARPAL network, https://ambientepub.regione.liguria.it/SiraQualMeteo/script_annali/StazioneCMIRL.asp?stazione=ME00005 (accessed on 26 September 2025)), operating since 1932. Its central location and extensive historical dataset make it one of Liguria’s most reliable data sources.
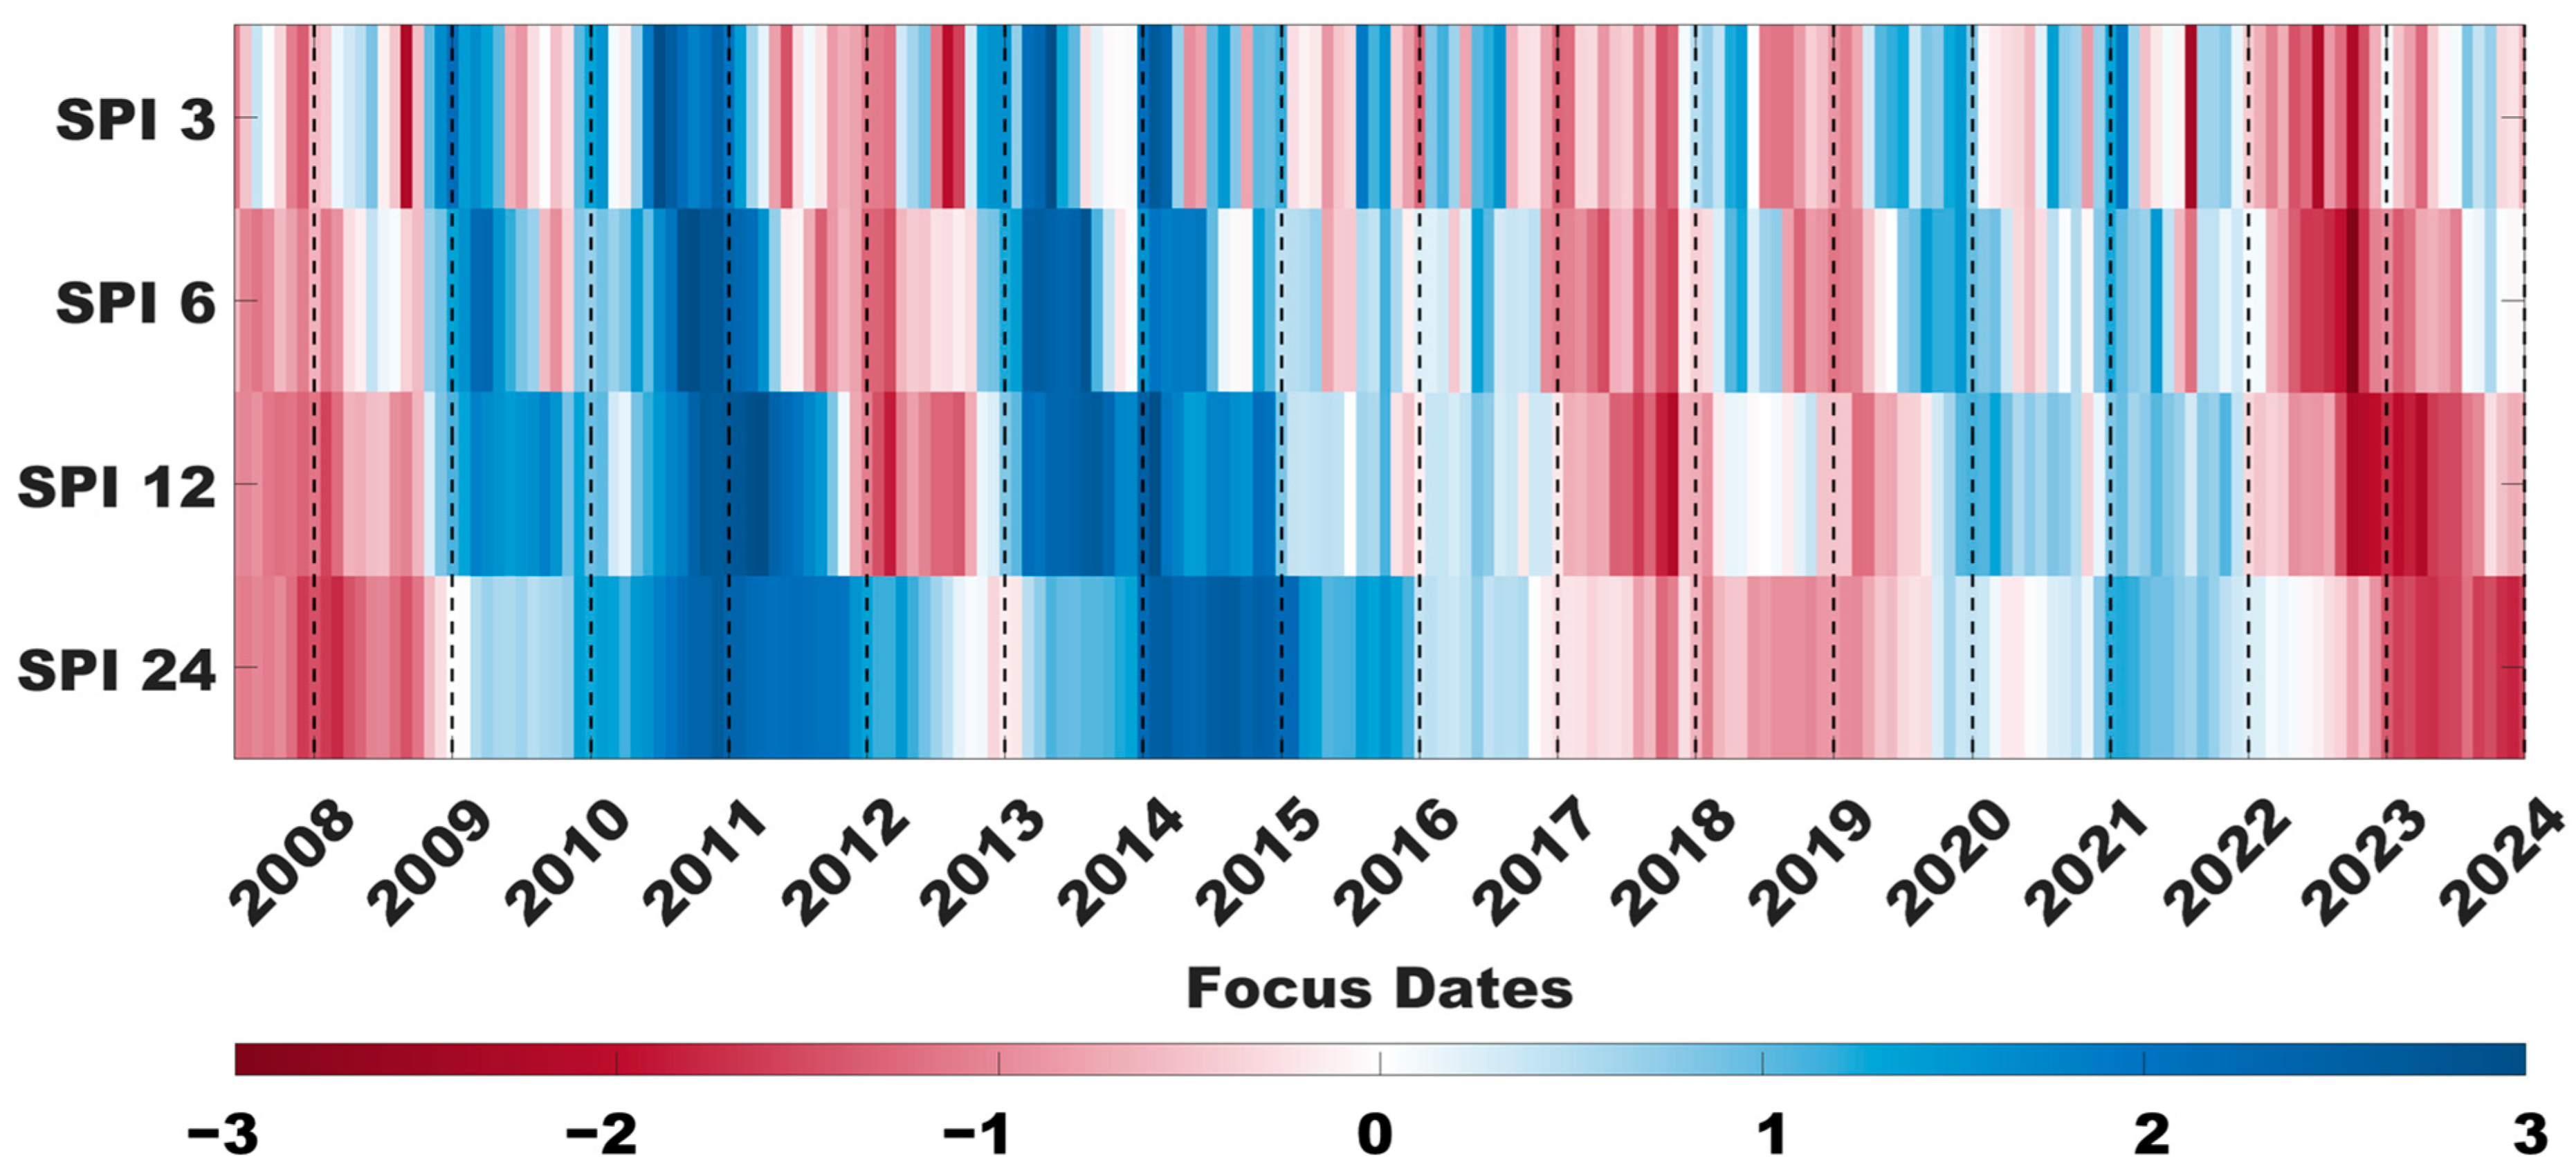
Analysis of the Standard Precipitation Index (SPI) from Sarzana indicates values below 1.5 during the water monitoring period (2022–2024), signifying severe or extreme drought conditions (Figure 5) [35,36,37,38,39,40].
Data on wind direction (140–170° N) and intensity (min: 0.3 m/s; mean: 2.9 m/s; max: 14.3 m/s) were obtained from the same ARPAL monitoring station. Tidal levels (min: −0.4 m; mean: 0.1 m; max: 0.7 m a.s.l.) were sourced from the La Spezia tide gauge, part of the ISPRA monitoring network (https://www.mareografico.it/it/stazioni.html (accessed on 26 September 2025)) (Figure 6).

3. Methods

3.1. Monitoring Strategies for Marine Intrusion

Marine intrusion was monitored using two naturally occurring tracers in water. The simultaneous use of both was chosen to ensure robust results through the cross-validation of replicated measurements.
The first tracer consisted of dissolved salts, quantified through measurements of EC, a parameter directly correlated to ionic content. The use of EC as an indicator of seawater intrusion is widely recognized and firmly established in the scientific literature.
The second tracer employed was the oxygen isotopic ratio (δ18O). Although methods based on this tracer are relatively recent, they are increasingly applied in environmental studies. In such contexts, δ18O is often measured alongside hydrogen isotopic ratio (δD) and used as a tracer for subsurface water flows. Its application to seawater intrusion studies remains less common.
This approach was effectively applied by comparing δ18O values with parameters such as chloride (Cl) and EC to identify varying degrees of mixing with seawater in both a coastal aquifer (groundwater) and a river estuary (surface water). The method yielded particularly robust results in the latter case [15,41,42].
The use of δ18O to monitor marine intrusion relies on the low reactivity of the isotope with geological bedrock and deposits, and on distinct isotopic ratio values between continental and marine water masses, resulting from fractionation processes within the hydrological cycle [43].
For surface water monitoring, 11 fixed stations were established along the riverbanks (Figure 7). Site selection was based on accessibility and strategic position, allowing the detection of both freshwater reference conditions and mixed water zones, as follows:
  • Two stations were positioned upstream of the Magra–Vara confluence (one on each river) and were used to characterize their individual water EC and isotopic signatures.
  • Two stations were placed immediately downstream of the confluence (in Fornola) and upstream of the natural weir at Romito–Battifollo, near the collapsed road bridge, historically recognized as the upper limit of marine intrusion in the Magra estuary [21,34].
  • The remaining seven stations were distributed along the estuarine reach of the Magra River, from the Romito weir to Bocca di Magra, spaced at regular distance intervals.
Monitoring was conducted over 18 months, between 2022 and 2024, involving six complete campaigns conducted every 2 months. Additional occasional measurements were taken and subsequently integrated into the dataset. The extended monitoring duration enabled the collection of seasonal data, crucial for assessing substantial temporal variations in water composition and climatic conditions [21].
Each station was surveyed using in situ EC (25 °C) measurements performed with a Crison MM40+ portable multimeter, along with sample collection for laboratory isotopic analysis.
Isotopic analyses were performed via Isotope Ratio Mass Spectrometry (IRMS), using a PrecisION mass spectrometer (Elementar) equipped with an IsoFLOW peripheral analysis unit. The system is optimized for light elements, including hydrogen and deuterium.
Isotopic abundances were expressed relative to the VSMOW scale, calibrated against certified IAEA primary standards and secondary standards validated according to IAEA protocols. The standard values used for calibration are reported in Table 1.

3.2. Estimating the Marine Water Fraction via Mass-Balance Modeling

The relative fraction of marine water and its seasonal variation across stations C01 to C07 (estuarine area subject to seasonal intrusion) were quantified through a mass-balance approach commonly applied for two-endmember mixing in aqueous systems [44,45,46].
This method enabled the estimation of contributions from marine saltwater and continental freshwater in each sample along the estuarine gradient.
For calculation, δ18O was chosen as a tracer due to its high analytical accuracy, provided by laboratory IRMS procedures. Preliminary tests confirmed that in conditions of low EC contrast, δ18O offers greater sensitivity and stability, making it effective for detecting even marginal intrusion events.
The mass-balance model was formulated as
C 1 × Q 1 + C 2 × Q 2 = C 3 × Q 1 + Q 2
where
C 1 = δ18O value of marine water (assumed as 0‰ VSMOW);
C 2 = δ18O value of freshwater, measured at station C10;
C 3 = δ18O value of the estuarine sample;
Q 1 = marine fraction;
Q 2 = freshwater fraction.
Assuming a unit total mass ( Q 1 + Q 2 = 1 ), Equation (1) simplifies to
C 1 × Q 1 + C 2 × 1 Q 1 = C 3
Solving for Q 1 yields
Q 1 = C 3 C 2 C 1 C 2
This procedure was applied systematically to all δ18O measurements collected during the six campaigns, enabling construction of a quantitative picture of the seasonal migration of marine intrusion within the estuary. To assess the uncertainty associated with the estimated marine water fraction ( Q 1 ), the error was calculated by applying the classical theory of error propagation [47] to Equation (3), considering the analytical uncertainties of δ18O measurements for each endmember and sample. This approach ensures that the derived values of Q 1 are not only quantitatively robust but also statistically constrained, allowing for a more reliable interpretation of spatial and temporal patterns.

3.3. Multivariate Regression Models for the Analysis of Environmental Variables

After identifying the monitoring stations and quantifying the intensity of marine intrusion, a set of statistical models was developed to analyze the environmental dynamics influencing the migration of saline water within the Magra River estuary. The adopted approach was based on multivariate linear regression, a technique used to estimate the relationship between a dependent variable (target) and a set of independent predictor variables.
The target variable selected was the δ18O, chosen for its ability to quantitatively represent the fraction of seawater in collected samples. This choice was justified by the higher analytical precision of isotopic measurements performed via laboratory mass spectrometry, and by their enhanced stability under weak mixing conditions compared to that of other tracers such as electrical conductivity.
Independent variables included in the models were selected based on a review of the scientific literature concerning seawater intrusion in estuarine environments [14,15,48]. Specifically, the following variables were considered:
  • River discharge (m3/s), as an indicator of freshwater pressure;
  • Wind speed (m/s), which can influence surface circulation;
  • Wind direction (azimuth degrees), to assess orientation-related effects on saltwater propagation;
  • Tidal oscillations (m), which modulate marine pressure on the estuary.
To ensure the robustness and comparability of the results, four multivariate regression models were applied, each with distinct characteristics.
Partial Least Squares (PLS): Suitable in the presence of multicollinearity among predictors; projects variables onto latent components that maximize covariance between predictors and the target; particularly useful when the number of predictors exceeds the number of observations [49].
Ridge Regression: Applies L2 regularization (sum of squared coefficients); reduces coefficient magnitude to mitigate instability from correlated variables; retains all variables in the model without performing selection [50].
LASSO (Least Absolute Shrinkage and Selection Operator): Applies L1 regularization (sum of absolute values of coefficients); can completely zero out non-significant variables; performs automatic variable selection, enhancing model interpretability [51].
Elastic Net: Combines L1 and L2 regularization, balancing interpretability and collinearity handling; especially effective when predictors are highly correlated; tends to select groups of related variables rather than individual examples [52].
Within each model, the value of the coefficient assigned to each environmental variable reflects its relative importance in the intrusion process, while the sign of the coefficient provides insight into the nature of its effect. A positive coefficient suggests that the variable promotes the advancement of saline water, whereas a negative coefficient indicates a mitigating or counteracting influence.
Regression models were calculated independently for each estuarine station (C01–C07) to simplify model structure and reduce uncertainty related to “distance”, a variable challenging to define precisely due to the absence of fixed spatial references along the river channel. Station C10, located upstream of the natural weir between Romito and Battifollo, was used as a reference point for freshwater δ18O values in each sampling campaign.
The selection of regression techniques was guided by the need to balance statistical robustness, interpretability, and adaptability to the environmental context. The chosen models form a complementary set of linear approaches capable of addressing major challenges in environmental data analysis, including the following:
  • Multicollinearity among predictors;
  • Limited number of observations compared to the number of variables;
  • Need for transparent and interpretable results.
Though based on linear assumptions, these models provide a sound framework for exploratory analysis of the environmental dynamics governing seawater intrusion. Their application yields interpretable outcomes that are comparable across monitoring stations, offering valuable insights for future studies and for the environmental management of the estuarine area.

4. Results

4.1. Hydrological Monitoring Outcomes

The monitoring campaign carried out across nine river stations produced a comprehensive dataset representative of the hydrological conditions within the Magra River estuarine system. Over the course of 18 months, organized into six sampling campaigns, the following data were collected: 82 measurements of EC; 93 δ18O isotopic determinations; 28 δD isotopic analyses.
Measurements spanned the entire seasonal cycle, allowing the temporal variability of natural tracers to be assessed for characterizing surface waters.
Results revealed a clear variability in the values (seasonal effect), with higher values of both EC and δ18O during summer months, corresponding to periods of increased marine intrusion (Table 2). Stations located closest to the river mouth displayed the steepest gradients, while upstream stations retained stable values consistent with freshwater composition.

4.2. Spatial Distribution of Water Electrical Conductivity

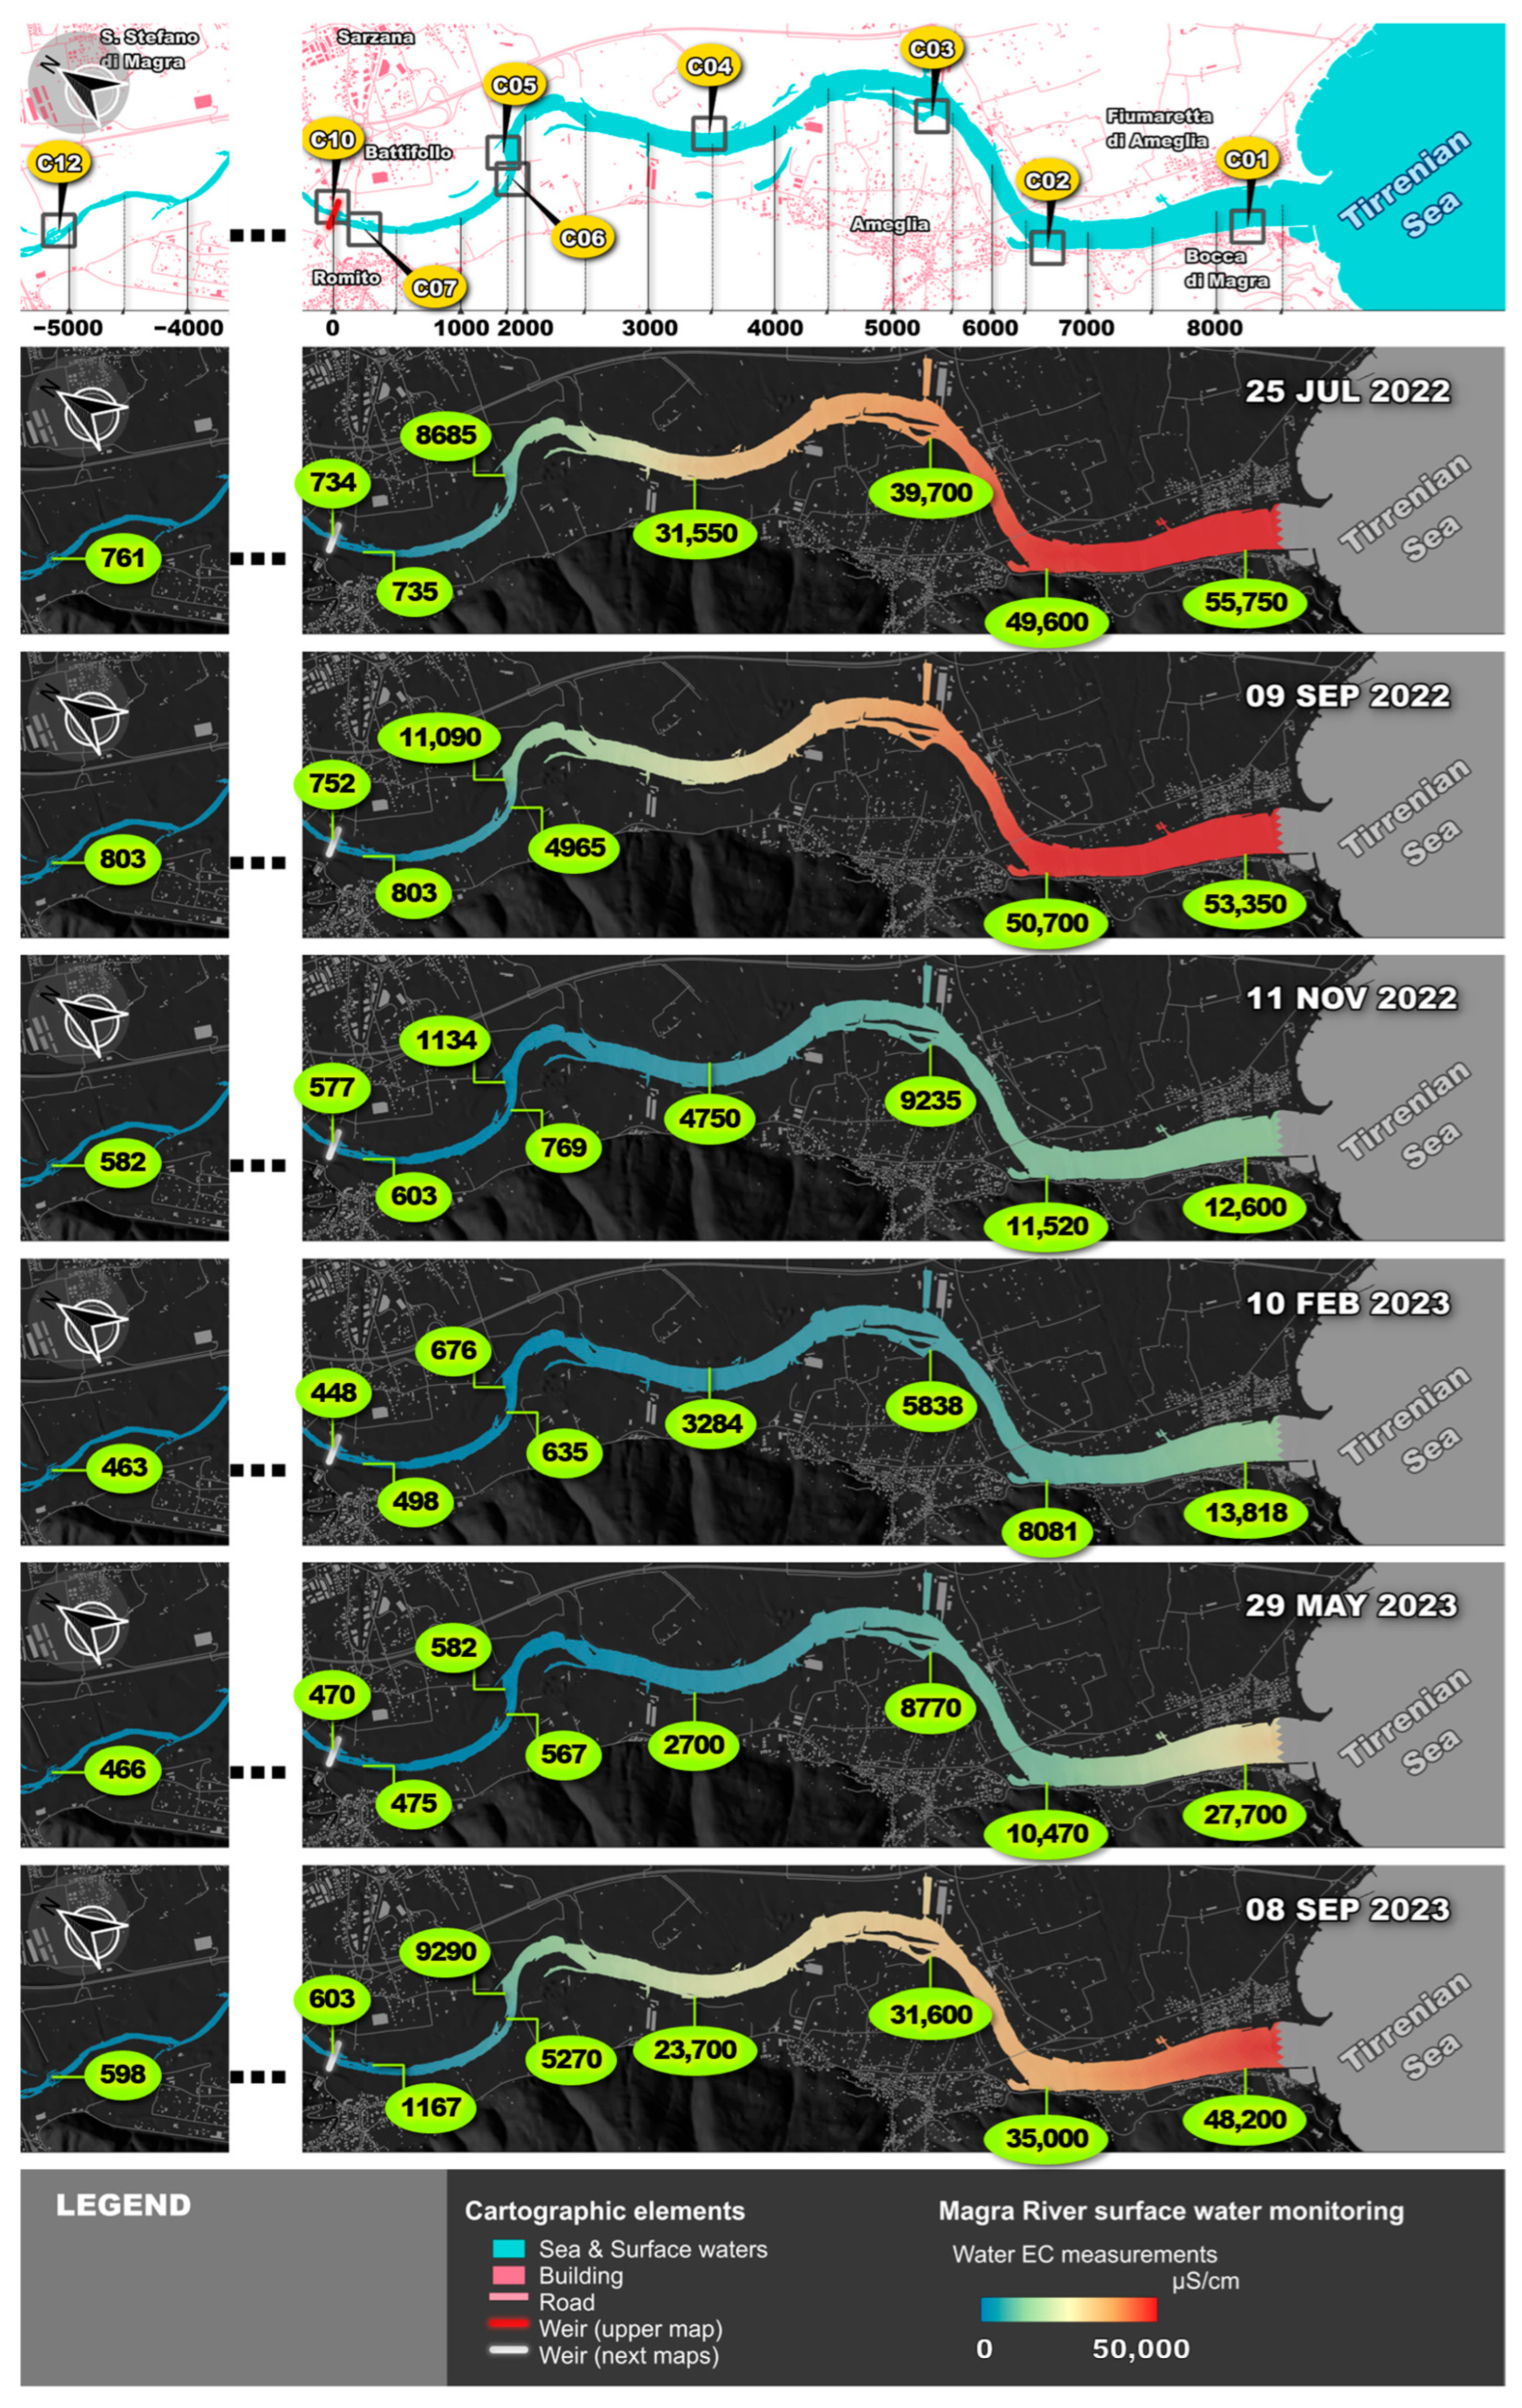
The thematic maps of EC, derived from point measurements collected during the six campaigns (Figure 8), illustrate the spatial distribution of salinity along the estuarine reach of the Magra River. Data interpolation was based on values recorded at stations C01 through C07, located within the estuary and affected by seawater intrusion. These were complemented by control stations C10 and C12, located upstream of a natural elevation barrier (weir) and representative of continental freshwater inputs.
Measured values highlighted a stark contrast between control and estuarine stations. Stations C10 and C12 consistently exhibited low and stable EC values, ranging annually between 450 and 800 µS/cm, which are consistent with typical freshwater parameters for the Magra River [21]. In contrast, stations C01 through C07 showed pronounced spatial and temporal variability, with EC values generally increasing toward the river mouth, reflecting the progressive influence of marine intrusion and mixing with seawater.
The maps clearly illustrate the upstream progression of marine water into the estuary, highlighting the seasonal nature of the phenomenon. Campaigns conducted in July and September recorded the highest electrical conductivity (EC) values, coinciding with dry hydrological conditions marked by low river discharge and intensified seawater intrusion. In particular, peak intrusion was documented in September 2022, with EC values exceeding 55,000 µS/cm at station C01 and surpassing 11,000 µS/cm at station C05. The greatest spatial extent of intrusion was observed in September 2023, when EC values above 1000 µS/cm were obtained at station C07, confirming a significant upstream movement of saline marine water.
The progressive increase in EC values from C01 to C07, observed consistently across all six campaigns, affirms the gradual intrusion pattern in the estuary. These trends align with recorded hydrometeorological conditions and are coherent with the outcomes of both isotopic analysis and the mass-balance modeling framework.

4.3. Spatial and Temporal Variation of Marine Water Fraction

The relative fraction of marine water in surface flows of the Magra estuary was estimated using the isotopic mass-balance model applied to δ18O values, as outlined in the Section 3. The analysis included all estuarine stations (C01–C07) and aimed to quantify both penetration extent and seasonal variation of marine intrusion.
The distribution of estimated marine water fractions (%) at each station, across the monitoring campaigns, is illustrated through a boxplot visualization in Figure 9. The uncertainty associated with the estimated marine water fraction was evaluated through error propagation analysis, and in all cases, the resulting error did not exceed 1%.
The data reveal a detectable marine fraction, ranging from 0% to approximately 10%, extending upstream to station C07 (Romito), which marks the furthest inland reach of seawater intrusion. A pronounced increase in variability is observed at stations closest to the river mouth (C01–C04), where marine fractions exceeded 50% during several periods throughout the year. Notably, stations C01 to C03 exhibited a predominance of marine water for durations spanning three to eight months annually, corresponding to low-flow seasons and intensified marine influence.
These findings corroborate the salinity gradient previously identified via EC measurements and isotopic characterization. The percentage fraction of marine water offers a clear, quantitative, and comparative metric that facilitates effective interpretation of the intrusion dynamics. Compared to raw isotopic values or EC data, it functions as a synthetic indicator readily applicable for estuarine system assessment.

5. Discussion

5.1. Cross-Validation of Water Tracers: Comparison Between EC and δ18O

A key aspect in assessing seawater intrusion is the cross-validation of the tracers employed. In this study, EC and δ18O were jointly used to monitor seawater intrusion in the Magra River estuary. A similar approach has been adopted in recent studies by other authors, particularly in groundwater investigations, successfully identifying clear signatures of marine intrusion and evaporation effects [15,26,27,53]. Notably, Conroy et al. (2023) emphasize the importance and rarity of continuous isotopic datasets for this type of analysis [53]. In the present study, this limitation was addressed through multiple measurement campaigns conducted within the same hydrological year.
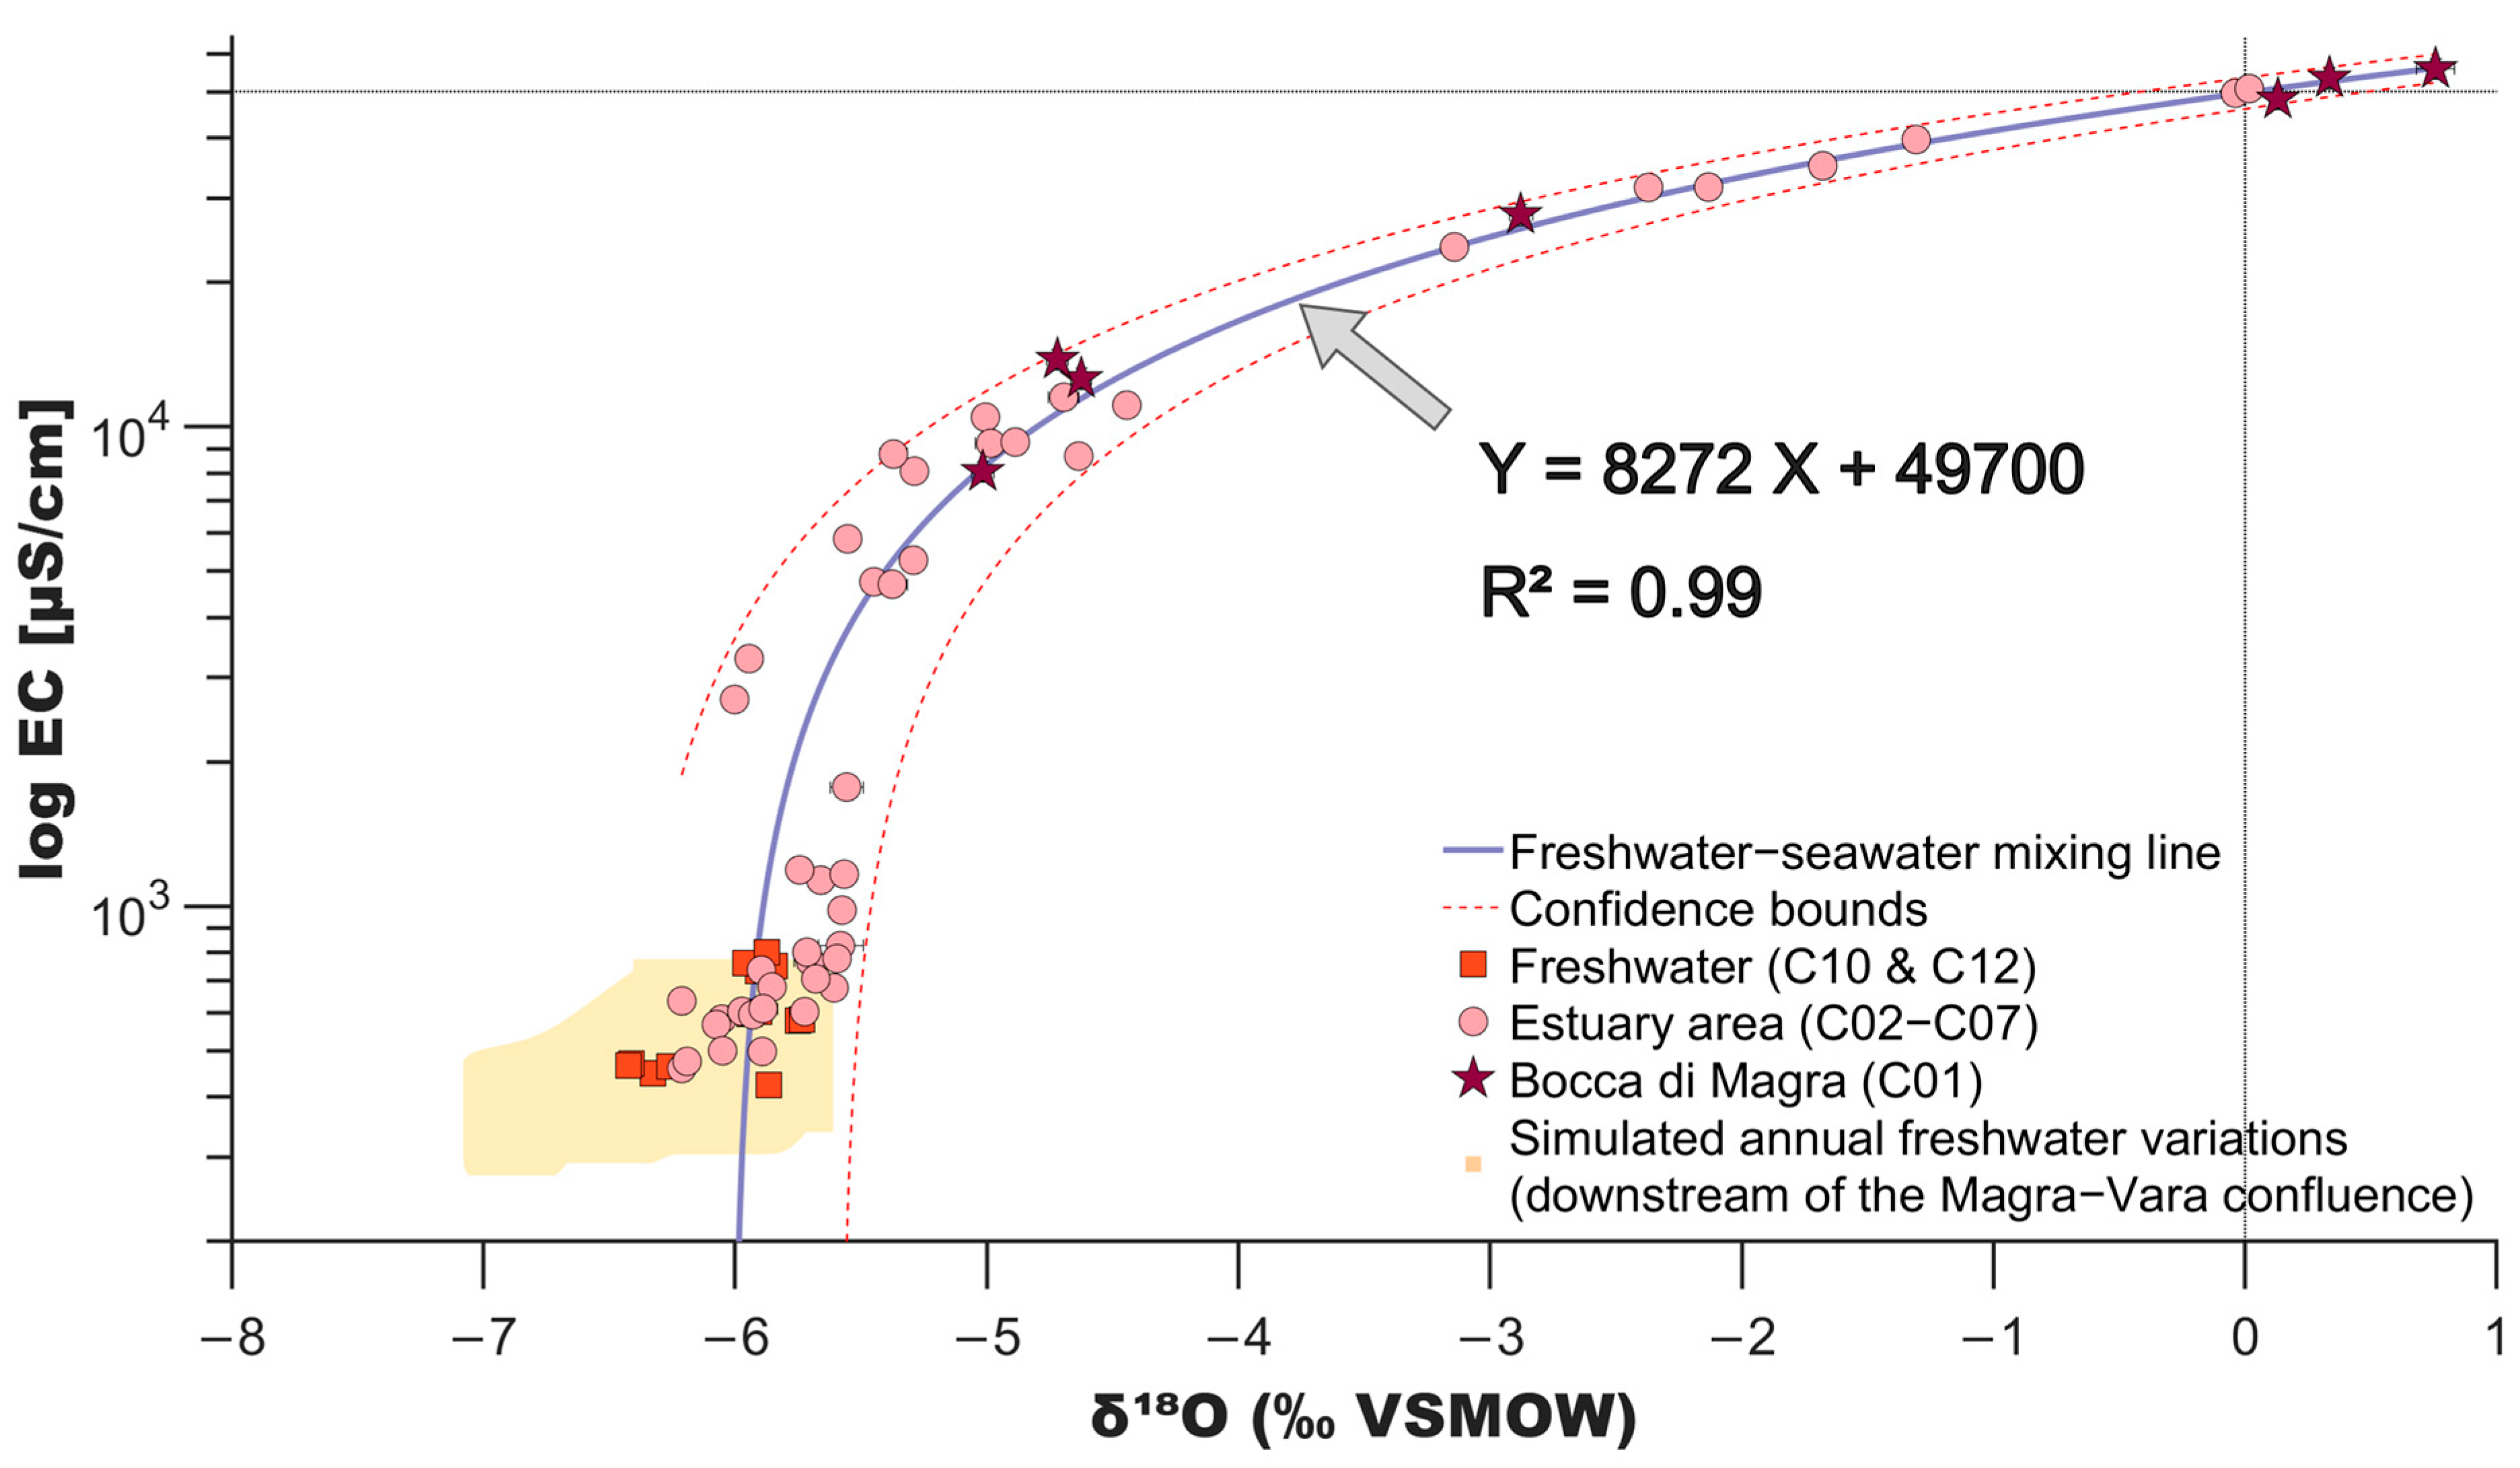
A comparative analysis involving 90 matched measurements acquired during the monitoring campaigns enabled verification of the consistency and effectiveness of both tracers in describing the mixing process.
A strong linear correlation between EC and δ18O is depicted in Figure 10 for stations C01 to C07, situated within the estuarine intrusion zone. In contrast, no such relationship was observed at upstream stations C10 and C12, where values remained stable and indicative of freshwater conditions.
As shown in Figure 10, the resulting regression line yielded a coefficient of determination of R2 = 0.99, reflecting a high degree of consistency between the tracers. The theoretical intercept (0 ‰; 50 mS/cm) corresponds to the expected values for pure seawater. Specifically, the δ18O value of 0 ‰ is based on the international VSMOW isotopic standard, while the EC value of 50 mS/cm aligns with a total dissolved solids (TDS) concentration of approximately 32 g/L, assuming an average conversion factor of 0.64 [54,55].
This correlation outlines the freshwater–seawater mixing line characteristic of the Magra estuary. The agreement between the two tracers affirms the value of their combined use in representing marine intrusion dynamics. This dual-tracer approach aligns with established studies recommending combined chemical and isotopic methods for increased interpretive resolution in complex estuarine systems [15,26,56,57].
Station C01 (Bocca di Magra), located at the marine end of the monitoring network, exhibited pronounced seasonal variability. During summer, when marine intrusion peaked, EC values reached approximately 55.0 mS/cm, and δ18O values were around 0.76 ‰ VSMOW. In contrast, during winter and spring (periods dominated by river flow), EC dropped below 13.0 mS/cm, and δ18O values decreased to approximately −4.62 ‰ VSMOW. These fluctuations underscore the sensitivity of both tracers to hydrological and climatic conditions, reinforcing their effectiveness for long-term monitoring.
Notably, the complementarity between EC and δ18O helps mitigate the limitations of each parameter. EC is highly responsive to salinity changes and particularly suitable for continuous monitoring due to the low cost and stability of sensor-based measurements, although it can be influenced by external factors such as anthropogenic contamination. In contrast, δ18O provides greater analytical stability and specificity in tracing water origin, but requires more complex and time-consuming laboratory procedures.
Consistent with findings reported in the literature, this combined strategy represents a robust method for tracing the mixing processes between continental and marine waters in fluvial systems within estuarine environments [15,26,27,41,42]. In the case of the Magra River, it effectively delineates the salinity gradient and captures its spatial and temporal variability with clarity and precision. These findings not only confirm the applicability of the approach in estuarine contexts, but also highlight its potential for informing environmental monitoring and management strategies in transitional water bodies.

5.2. Interpretation of Isotopic Analyses: Local Meteoric Water Line and Estuarine Mixing

A joint examination of the δ18O and δD stable isotopes provided critical insights into the hydrological processes governing the Magra River system.
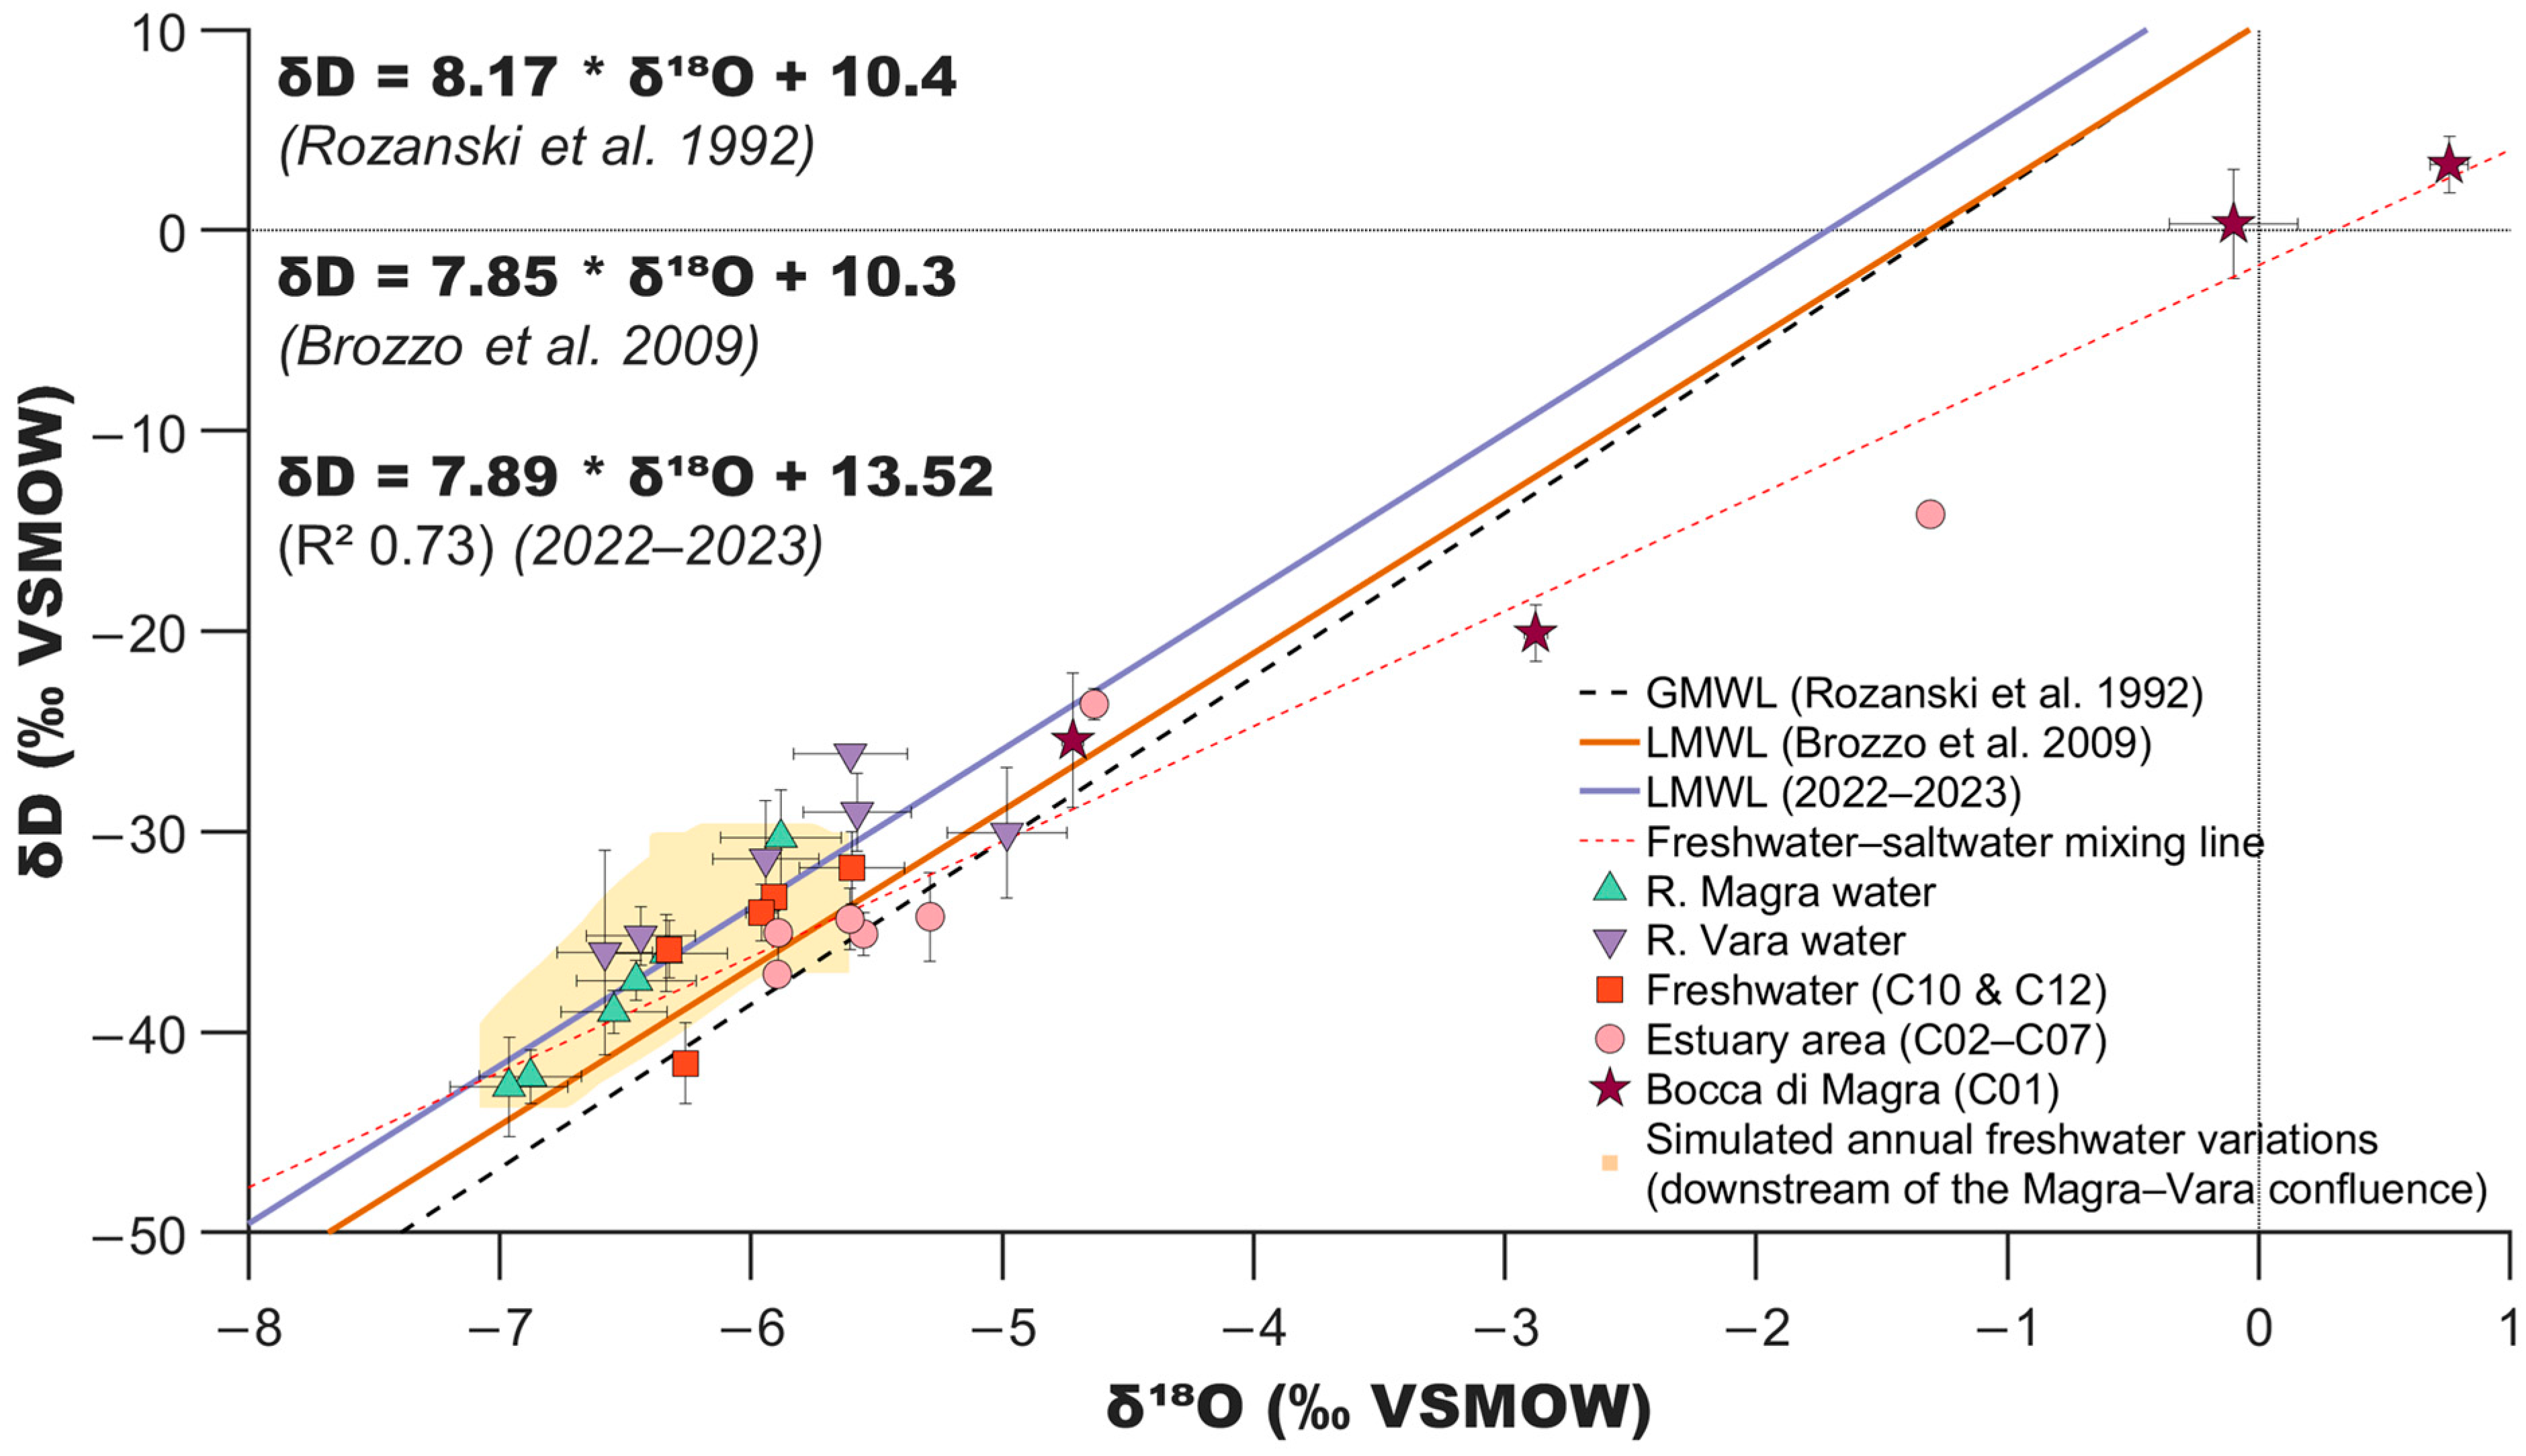
Using 26 isotopically analyzed samples, the local meteoric water line (LMWL) was computed from continental freshwater-only samples, following the classical approach by Craig (1961) [58]. The regression equation derived was
δD = 7.89 × δ18O + 13.52
The local meteoric water line (LMWL) reflects the isotopic behavior of local precipitation and surface waters. Several LMWLs have been reported in the literature for areas surrounding the Magra–Vara basin, including the Apuan Alps and northern Italy [21,59,60,61]. Comparison with previous data provided by Brozzo et al. [21] and with the global meteoric water line (GMWL) [62] reveals a noticeable deuterium excess. This condition is potentially attributable to intense and anomalous evaporation processes, consistent with the above-average regional temperatures observed during the study period [21,62,63].
The δD–δ18O distribution, illustrated in Figure 11 alongside the LMWL, GMWL, and the calculated mixing line, confirms a dual-source water origin (continental and marine) in the transitional zones of the Magra River. Samples from the estuarine zone follow a distinct trajectory relative to the LMWL, indicative of freshwater–seawater mixing. The deviation of the mixing line from the meteoric reference suggests that these isotopic tracers effectively identify samples and monitoring stations affected by seawater intrusion, in agreement with other hydrochemical parameters. This pattern reflects similar isotopic signatures observed in other marine-influenced estuaries [15,26,64].

5.3. Statistical Modeling and Interpretation of Environmental Variables Driving Intrusion Dynamics

Advanced multivariate regression modeling was employed to interpret environmental drivers of saline intrusion in the Magra estuary. The selected models—Elastic Net, LASSO, Partial Least Squares (PLS), and Ridge Regression—offer resilience against multicollinearity and allow variable selection and weighting in complex systems.
Using δ18O as the target variable (a proxy for seawater intrusion), the regression models demonstrated a high degree of consistency. The mean square error (MSE) values obtained indicate that the Elastic Net model outperforms the others, exhibiting both the lowest MSE and associated standard deviation, thereby confirming its strong explanatory capability (Table 3).
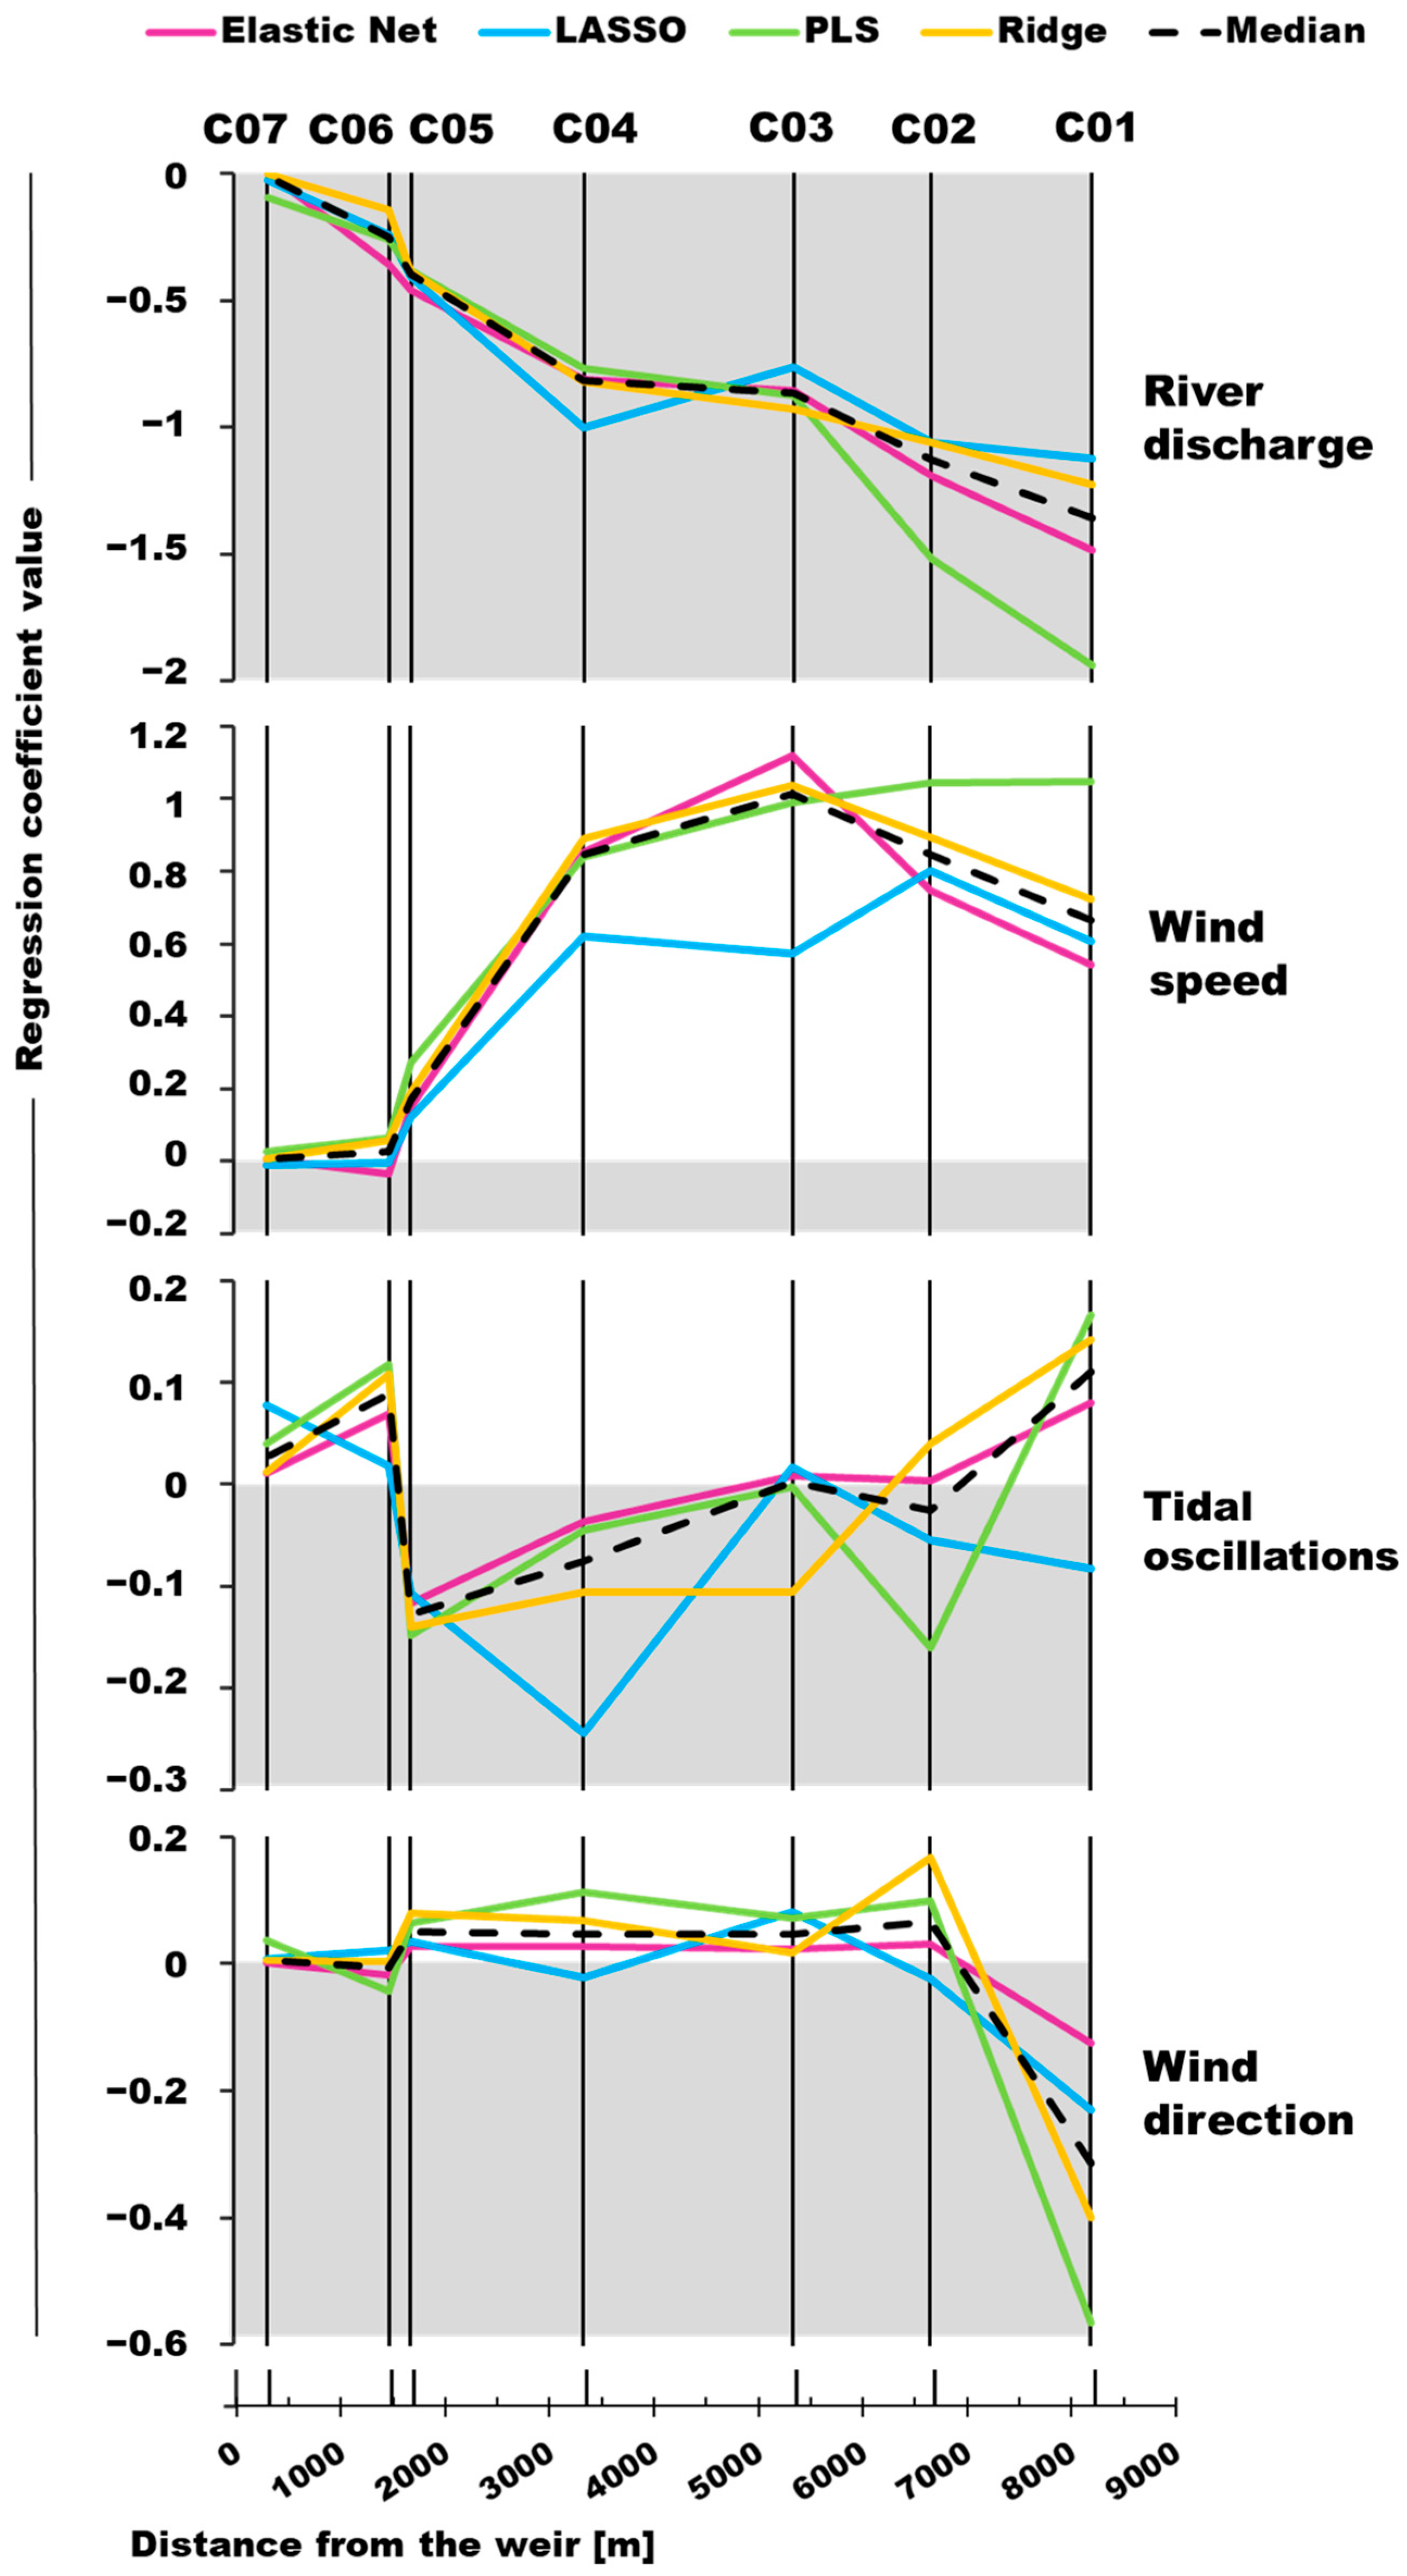
The spatial variation of regression coefficients and model outputs across the estuary is illustrated in Figure 12. Two key influencing variables emerged:
  • River Discharge: Strongly negatively correlated with marine fraction. Higher discharge pushes freshwater downstream, limiting saline intrusion. Its influence increases with distance from the Romito weir, peaking near the mouth at C01;
  • Wind Intensity: Shows positive correlation with marine fraction. Stronger winds facilitate upstream movement of saltwater, particularly impacting intermediate stations (C02–C04).
Tidal oscillations, traditionally considered influential, appeared to play a limited role. Coefficient variability was weak and inconsistent. This might reflect the modest tidal range (20–40 cm) recorded at the La Spezia tide gauge and the lack of transient storm events in the standard tidal dataset.
An outlier occurred in May 2023, when a storm surge, combined with high river discharge, produced an anomalous dynamic: marine water intrusion surged between C01 and C02, as river outflow was hindered by elevated sea levels and wave activity (Figure 8).
Additionally, wind direction, consistently aligned parallel to the river valley (Figure 6), likely amplified the horizontal transport of marine water, reinforcing intrusion during peak wind events.
The results are broadly consistent with findings from other estuarine systems worldwide. Studies in the Scheldt estuary [30], Weser estuary [11], and Iberian estuaries [13] confirm the dominant role of river discharge in limiting saline intrusion, while also highlighting the influence of sea level rise and reduced tidal amplitudes. Global studies indicate that reduced river discharge can contribute up to 30–40% to the intensification of saltwater intrusion [10]. In microtidal estuaries such as the Magra, the limited tidal range reduces the system’s flushing capacity, favoring salt accumulation during low-flow conditions [65,66].
Recent modeling efforts in the Weser and Minho estuaries further demonstrate that sea level rise can significantly extend the saline front inland (potentially doubling the effect of reduced river discharge [10]), especially when combined with reduced fluvial input and anthropogenic modifications to estuarine morphology, as observed in the present case study [9,67]. However, the effects of sea level rise are not detectable within the temporal scale of this investigation, which would require a long-term, multi-year dataset not available for the Magra River.
The positive correlation between wind intensity and marine fraction observed in the Magra estuary aligns with results from the Columbia River [68] and the Pearl River [69], where wind-driven transport enhances upstream saltwater movement. Similar dynamics have been reported in the Changjiang estuary, where storm surges and wind alignment with the river axis intensified saline intrusion even under high discharge conditions, mirroring the situation observed during the May 2023 monitoring campaign in the Magra estuary [70]. However, other authors note that wind effects can vary depending on estuarine morphology and stratification, occasionally dampening intrusion [71,72]. Compared to traditional regression or harmonic models [73], the multivariate approach adopted here offers greater flexibility in capturing spatially complex interactions. These comparisons, spanning regions from Europe to Asia and North America, underscore the global relevance of the environmental drivers identified in the Magra estuary [9,13,30,68,69,71,72,73,74].
These findings emphasize that marine intrusion stems from multiple, spatially intricate interactions, warranting adaptive and flexible modeling frameworks incorporating climatic and geophysical anomalies. Considering ongoing climate change, future scenarios are expected to exacerbate saline intrusion due to rising sea levels, altered precipitation patterns, and increased frequency of extreme weather events. Recent studies project significant amplification of saltwater intrusion in estuarine systems globally, particularly under high-emission scenarios, with implications for freshwater availability, ecosystem resilience, and infrastructure planning [10,67,75]. This elaboration can support the delineation of future scenarios, offering a predictive tool for assessing vulnerability and guiding mitigation strategies in coastal river systems.

6. Conclusions

This study provided a comprehensive characterization of seawater intrusion dynamics in the Magra River estuary through the integration of hydrological monitoring, isotopic analysis, and statistical modeling. The combined use of electrical conductivity (EC) and stable isotopes (δ18O; δD) enabled the identification of seasonal patterns and spatial gradients of salinity, confirming the effectiveness of this dual-tracer approach. Multivariate modeling clarified the role of key environmental drivers, highlighting river discharge as the main mitigating factor and wind intensity, consistently aligned with the river valley, as the principal promoter of upstream saline transport. Tidal oscillations showed limited influence, except during exceptional events such as the May 2023 storm surge, which produced a combined anomalous effect with elevated river flow.
These findings directly address the study’s objectives by demonstrating the value of integrated monitoring and analytical frameworks in capturing the complexity of estuarine mixing processes. The results also underscore the vulnerability of the Magra estuary to climate-induced stressors, such as reduced freshwater input and rising sea levels, trends already reflected in the isotopic signals observed during the study period.
However, some limitations remain. The temporal resolution, while sufficient for seasonal analysis, does not capture short-term variability linked to episodic events. Moreover, the absence of long-term historical data prevents direct quantification of trends over decadal scales. Future research should aim to extend the monitoring period, incorporate real-time data acquisition, and explore predictive modeling under different climate scenarios.
In this context, the methodological framework developed here offers a valuable reference for other Mediterranean estuaries facing similar pressures. By integrating climate projections and adaptive management strategies, it is possible to anticipate future changes and support the resilience of coastal freshwater systems under increasing environmental stress.

Policy Recommendations

Building on these findings, the following recommendations aim to support climate-resilient estuarine management:
  • Implement continuous and seasonal monitoring of salinity and isotopic parameters, with particular attention to low-flow periods and extreme meteorological events.
  • Integrate predictive modeling into water management plans to anticipate the extent of seawater intrusion as a function of river discharge and atmospheric conditions.
  • Develop adaptive planning strategies based on regional climate scenarios, accounting for projected increases in temperature, reductions in precipitation, and sea level rise.
These measures can enhance the responsiveness and resilience of estuarine systems, complementing the analytical framework presented in this study and supporting informed decision making under evolving climate pressures.

Author Contributions

All authors contributed substantially to the conception and design of the study. Material preparation, data collection, and analysis were carried out by M.S. and F.R. The initial draft of the manuscript was prepared by M.S. and all authors provided critical feedback and revisions. All authors have read and approved the final published version of the manuscript.

Funding

This research received no external funding.

Data Availability Statement

The data presented in this study are available upon request from the corresponding author.

Conflicts of Interest

The authors declare no conflict of interest.

References

  1. Bonacci, O.; Bonacci, D.; Patekar, M.; Pola, M. Increasing Trends in Air and Sea Surface Temperature in the Central Adriatic Sea (Croatia). J. Mar. Sci. Eng. 2021, 9, 358. [Google Scholar] [CrossRef]
  2. Borović, S.; Terzić, J.; Pola, M. Groundwater Quality on the Adriatic Karst Island of Mljet (Croatia) and Its Implications on Water Supply. Geofluids 2019, 2019, 5142712. [Google Scholar] [CrossRef]
  3. Passarella, G.; Masciale, R.; Menichini, M.; Doveri, M.; Portoghese, I. Decoding Salinization Dynamics in Mediterranean Coastal Aquifers: A Case Study from a Wetland in Southern Italy. Environments 2025, 12, 227. [Google Scholar] [CrossRef]
  4. Nisi, B.; Vaselli, O.; Taussi, M.; Doveri, M.; Menichini, M.; Cabassi, J.; Raco, B.; Botteghi, S.; Mussi, M.; Masetti, G. Hy-drogeochemical Surveys of Shallow Coastal Aquifers: A Conceptual Model to Set-up a Monitoring Network and Increase the Resilience of a Strategic Groundwater System to Climate Change and Anthropogenic Pressure. Appl. Geochem. 2022, 142, 105350. [Google Scholar] [CrossRef]
  5. Bellafiore, D.; Ferrarin, C.; Maicu, F.; Manfè, G.; Lorenzetti, G.; Umgiesser, G.; Zaggia, L.; Valle-Levinson, A. Saltwater Intrusion in a Mediterranean Delta Under a Changing Climate. J. Geophys. Res. Ocean. 2021, 126, e2020JC016437. [Google Scholar] [CrossRef]
  6. Sannino, G.; Anav, A.; Catalano, F.; Napolitano, E.; di Sarra, A.; Sferlazzo, D. Clima mediterraneo: Cambiamento in atto e scenari futuri. Energ. Ambiente e Innov. 2024, 2, 51–53. [Google Scholar] [CrossRef]
  7. Cos, J.; Doblas-Reyes, F.; Jury, M.; Marcos, R.; Bretonnière, P.-A.; Samsó, M. The Mediterranean Climate Change Hotspot in the CMIP5 and CMIP6 Projections. Earth Syst. Dyn. 2022, 13, 321–340. [Google Scholar] [CrossRef]
  8. del R Almazan-Benitéz, B.; Esteller-Alberich, M.V.; Renau-Pruñonosa, A.; Expósito-Castillo, J.L. Simulation of Seawater Intrusion and Upconing Processes in Mediterranean Aquifer in Response to Climate Change (Plana de Castellón, Spain). Hydrology 2024, 11, 205. [Google Scholar] [CrossRef]
  9. Siemes, R.W.A.; Duong, T.M.; Borsje, B.W.; Hulscher, S.J.M.H. Salt Intrusion Affected by Large-Scale Human Interven-tions and Sea Level Rise: A 3D Modeling Study of an Engineered Estuary. J. Geophys. Res. Ocean. 2025, 130, e2025JC022504. [Google Scholar] [CrossRef]
  10. Lee, J.; Biemond, B.; van Keulen, D.; Huismans, Y.; van Westen, R.M.; de Swart, H.E.; Dijkstra, H.A.; Kranenburg, W.M. Global Increases of Salt Intrusion in Estuaries under Future Environmental Conditions. Nat. Commun. 2025, 16, 3444. [Google Scholar] [CrossRef]
  11. Kolb, P.; Zorndt, A.; Burchard, H.; Gräwe, U.; Kösters, F. Modelling the Impact of Anthropogenic Measures on Saltwater Intrusion in the Weser Estuary. Ocean Sci. 2022, 18, 1725–1739. [Google Scholar] [CrossRef]
  12. Kasai, A.; Kurikawa, Y.; Ueno, M.; Robert, D.; Yamashita, Y. Salt-Wedge Intrusion of Seawater and Its Implication for Phytoplankton Dynamics in the Yura Estuary, Japan. Estuar. Coast. Shelf Sci. 2010, 86, 408–414. [Google Scholar] [CrossRef]
  13. Serrano, M.A.; Cobos, M.; Magaña, P.J.; Díez-Minguito, M. Sensitivity of Iberian Estuaries to Changes in Sea Water Temperature, Salinity, River Flow, Mean Sea Level, and Tidal Amplitudes. Estuar. Coast. Shelf Sci. 2020, 236, 106624. [Google Scholar] [CrossRef]
  14. Setiawan, I.; Morgan, L.K.; Doscher, C. Saltwater Intrusion from an Estuarine River: A Field Investigation. J. Hydrol. 2023, 617, 128955. [Google Scholar] [CrossRef]
  15. Wang, Y.; Jiao, J.J. Origin of Groundwater Salinity and Hydrogeochemical Processes in the Confined Quaternary Aquifer of the Pearl River Delta, China. J. Hydrol. 2012, 438–439, 112–124. [Google Scholar] [CrossRef]
  16. Kranenburg, W.; Kaaij, T.; Tiessen, M.; Friocourt, Y.; Blaas, M. Salt Intrusion in the Rhine Meuse Delta: Estuarine Circulation, Tidal Dispersion or Surge Effect. In Proceedings of the 39th IAHR World Congress From Snow to Sea, Granada, Spain, 19–24 June 2022; pp. 5601–5608. [Google Scholar]
  17. Turolla, S.; Pigozzi, S. Il Monitoraggio Della Risalita del Cuneo Salino. Ecoscienza 2023, 6, 20–21. [Google Scholar]
  18. Anthony, E.; Syvitski, J.; Zăinescu, F.; Nicholls, R.J.; Cohen, K.M.; Marriner, N.; Saito, Y.; Day, J.; Minderhoud, P.S.J.; Amorosi, A.; et al. Delta Sustainability from the Holocene to the Anthropocene and Envisioning the Future. Nat. Sustain 2024, 7, 1235–1246. [Google Scholar] [CrossRef]
  19. Luppichini, M.; Bini, M. 40-Year Shoreline Evolution in Italy: Critical Challenges in River Delta Regions. Estuar. Coast. Shelf Sci. 2025, 315, 109166. [Google Scholar] [CrossRef]
  20. Raggi, G. Neotettonica Ed Evoluzione Paleogeografica Plio-Pleistocenica Del Bacino Del Fiume Magra. Mem. Della Soc. Geol. Ital. 1985, 30, 35–62. [Google Scholar]
  21. Brozzo, G.; Marini, L.; Prochilo, F.; Zuccolini, M.V. Atlante Degli Acquiferi Della Liguria—Volume IV: L’acquifero Alluvionale Della Bassa Valle Del Fiume Magra; Pacini Editore: Pisa, Italy, 2009. [Google Scholar]
  22. Autorità di Bacino interregionale del Fiume Magra. PIANO STRALCIO “ASSETTO IDROGEOLOGICO” Del Bacino Del Fiume Magra e Del Torrente Parmignola; Autorità di Bacino Interregionale del Fiume Magra: Sarzana, Italy, 2016; pp. 1–57. [Google Scholar]
  23. Dai, Z. Estuarine Submerged Delta Modern Morphodynamics. In Changjiang Riverine and Estuarine Hydro-Morphodynamic Processes: In the Context of Anthropocene Era; Springer: Singapore, 2021; pp. 325–343. ISBN 978-981-16-3771-1. [Google Scholar]
  24. Cheng, H.Q.; Chen, W.; Li, J.F.; Jiang, Y.H.; Hu, X.; Zhang, X.L.; Zhou, F.N.; Hu, F.X.; Stive, M. Morphodynamic Changes in the Yangtze Estuary under the Impact of the Three Gorges Dam, Estuarine Engineering Interventions and Climate-Induced Sea Level Rise. Earth Planet. Sci. Lett. 2022, 580, 117385. [Google Scholar] [CrossRef]
  25. Martella, L. Monitoraggio Delle Acque Di Transizione Alla Foce Del Fiume Magra (SP)—2011/2013; ARPAL: Genoa, Italy, 2013. [Google Scholar]
  26. Porru, M.C.; Arras, C.; Biddau, R.; Cidu, R.; Lobina, F.; Podda, F.; Wanty, R.; Da Pelo, S. Assessing Recharge Sources and Seawater Intrusion in Coastal Groundwater: A Hydrogeological and Multi-Isotopic Approach. Water 2024, 16, 1106. [Google Scholar] [CrossRef]
  27. Bahir, M.; el Mountassir, O.; Ali, S. Understanding Seawater Intrusion by Hydrochemical Parameters and Stable Water Isotopes Along the Coastal Alluvial Aquifers of the Essaouira Basin, Morocco. In Groundwater Quality and Geochemistry in Arid and Semi-Arid Regions; Ali, S., Negm, A., Eds.; Springer Nature: Cham, Switzerland, 2024; pp. 267–293. ISBN 978-3-031-53777-6. [Google Scholar]
  28. Fry, B. Stable Isotope Ecology; Springer: Berlin/Heidelberg, Germany, 2006. [Google Scholar] [CrossRef]
  29. Durham, C.L.; Eggleston, D.B.; Nail, A.J.; Durham, C.L.; Eggleston, D.B.; Nail, A.J. Process-Based Statistical Models Predict Dynamic Estuarine Salinity. In Lagoon Environments Around the World—A Scientific Perspective; IntechOpen: London, UK, 2019. [Google Scholar] [CrossRef]
  30. Zhu, B.; Wang, T.; De Meester, J.; Willems, P. Comparative Analysis with Statistical and Machine Learning for Modeling Overall and High Salinity along the Scheldt Estuary. Water 2024, 16, 2150. [Google Scholar] [CrossRef]
  31. Rinaldi, M.; Simoncini, C.; Sogni, D. Variazioni morfologiche recenti di due alvei fluviali ghiaiosi appenninici: Il Fiume Trebbia ed il Fiume Vara. Geogr. Fis. Din. Quat. 2005, (Suppl. VII), 313–319. [Google Scholar]
  32. Rinaldi, M.; Simoncini, C. Studio Geomorfologico Del Fiume Magra e Del Fiume Vara Finalizzato Alla Gestione Dei Sedimenti e Della Fascia Di Mobilità. In Proceedings of the Nuovi Approcci per la Comprensione dei Processi Fluviali e la Gestione dei Sedimenti. Applicazioni nel Bacino del Ma-gra. Sarzana: Magra River Basin Authority, Liguria, Italy, 24–25 October 2006; pp. 93–109. [Google Scholar]
  33. Raggi, G. La Bassa Val Di Magra Ed Il Sottosuolo Della Piana Lunense, Da Capellini Ai Giorni d’oggi. Memorie della Accademia Luniganense di Scienze Giovanni Cappellini 2016, 86, 137–178. [Google Scholar]
  34. Raggi, D.; Raggi, G. Gli Acquiferi e Le Risorse Idriche Del Territorio Spezzino. Alcune Proposte per La Loro Razionale Utilizzazione e Tutela; Aracne Editrice: Ariccia, Italy, 2020. [Google Scholar]
  35. Mckee, T.B.; Doesken, N.J.; Kleist, J. The Relationship of Drought Frequency and Duration to Time Scales. In Proceedings of the Eighth Conference on Applied Climatology, Orange County, CA, USA, 17–22 January 1993; pp. 17–22. [Google Scholar]
  36. World Meteorological Organization (WMO). Drought Monitoring and Early Warning: Concepts, Progress and Future Challenges; WMO: Geneva, Switzerland, 2006; ISBN 978-92-63-11006-0. [Google Scholar]
  37. Kalnay, E.; Kanamitsu, M.; Kistler, R.; Collins, W.; Deaven, D.; Gandin, L.; Iredell, M.; Saha, S.; White, G.; Woollen, J.; et al. The NCEP/NCAR 40-Year Reanalysis Project. Bull. Am. Meteorol. Soc. 1996, 77, 437–472. [Google Scholar] [CrossRef]
  38. Mariani, S.; Braca, G.; Romano, E.; Lastoria, B.; Bussettini, M. Linee Guida Sugli Indicatori Di Siccità e Scarsità Idrica Da Utilizzare Nelle Attività Degli Osservatori Permanenti per Gli Utilizzi Idrici–Stato Attuale e Prospettive Future. CReIAMO PA 2018, 66, 1–56. [Google Scholar]
  39. Rossi, G.; Benedini, M.; Tsakiris, G.; Giakoumakis, S. On Regional Drought Estimation and Analysis. Water Resour. Manag. 1992, 6, 249–277. [Google Scholar] [CrossRef]
  40. Svoboda, M.; Hayes, M.; Wood, D. Standardized Precipitation Index: User Guide; Technical > Guides and other guidance; WMO: Geneva, Switzerland, 2012; ISBN 978-92-63-11091-6. [Google Scholar]
  41. Mohanty, A.K.; Rao, V.V.S.G. Hydrogeochemical, Seawater Intrusion and Oxygen Isotope Studies on a Coastal Region in the Puri District of Odisha, India. CATENA 2019, 172, 558–571. [Google Scholar] [CrossRef]
  42. Abou Zakhem, B.; Hafez, R. Environmental Isotope Study of Seawater Intrusion in the Coastal Aquifer (Syria). Environ. Geol. 2007, 51, 1329–1339. [Google Scholar] [CrossRef]
  43. Longinelli, A.; Selmo, E. Isotope Geochemistry and the Water Cycle: A Short Review with Special Emphasis on Italy. Mem. Descr. Carta Geol. d’It 2010, 90, 153–164. [Google Scholar]
  44. Ronchetti, F.; Deiana, M.; Lugli, S.; Sabattini, M.; Critelli, V.; Aguzzoli, A.; Mussi, M. Water Isotope Analyses and Flow Measure-ments for Understanding the Stream and Meteoric Recharge Contributions to the Poiano Evaporite Karst Spring in the North Apennines, Italy. Hydrogeol. J. 2023, 31, 601–619. [Google Scholar] [CrossRef]
  45. Luo, M.; Peng, X.; Zhao, Z.; Qin, D.; Pan, H. Saline Groundwater Formation in an Extremely Arid Inland Basin in Northwestern China. Hydrogeol. J. 2025, 33, 739–754. [Google Scholar] [CrossRef]
  46. Suzuki, T.; Tsujimura, M.; Sato, K.; Asakura, H.; Ueno, H.; Nagano, K. Evaluation of Groundwater–Surface Water Interaction Using End-Member Mixing Analysis (EMMA) in the Middle Reaches of the Tama River, Tokyo, Japan. Hydrogeol. J. 2025, 33, 825–839. [Google Scholar] [CrossRef]
  47. Taylor, J.R. An Introduction to Error Analysis: The Study of Uncertainties in Physical Measurements; MIT Press: Cambridge, MA, USA, 2022. [Google Scholar]
  48. Paiva da Silva, F.; Martins, J.R.; Nogueira, F. Impacts of Sea Level Rise on Seawater Intrusion in Cubatão River, Brazil. Environ. Model. Assess. 2020, 25, 831–841. [Google Scholar] [CrossRef]
  49. Wold, S.; Sjöström, M.; Eriksson, L. PLS-Regression: A Basic Tool of Chemometrics. Chemom. Intell. Lab. Syst. 2001, 58, 109–130. [Google Scholar] [CrossRef]
  50. Hoerl, A.E.; Kennard, R.W. Ridge Regression: Biased Estimation for Nonorthogonal Problems. Technometrics 1970, 12, 55–67. [Google Scholar] [CrossRef]
  51. Tibshirani, R. Regression Shrinkage and Selection Via the Lasso. J. R. Stat. Soc. Ser. B Stat. Methodol. 1996, 58, 267–288. [Google Scholar] [CrossRef]
  52. Zou, H.; Hastie, T. Regularization and Variable Selection Via the Elastic Net. J. R. Stat. Soc. Ser. B Stat. Methodol. 2005, 67, 301–320. [Google Scholar] [CrossRef]
  53. Conroy, J.L.; Murray, N.K.; Patterson, G.S.; Schore, A.I.G.; Ikuru, I.; Cole, J.E.; Chillagana, D.; Echeverria, F. Equatorial Undercur-rent Influence on Surface Seawater δ18O Values in the Galápagos. Geophys. Res. Lett. 2023, 50, e2022GL102074. [Google Scholar] [CrossRef]
  54. Howarth, R.; Marino, R.; Swaney, D.; Boyer, E. Wastewater and Watershed Influences on Primary Productivity and Oxygen Dynamics in the Lower Hudson River Estuary. In The Hudson River Estuary; Cambridge University Press: Cambridge, UK, 2006. [Google Scholar] [CrossRef]
  55. Hubert, E.; Wolkersdorfer, C. Establishing a Conversion Factor between Electrical Conductivity and Total Dissolved Solids in South African Mine Waters. Water SA 2015, 41, 490–500. [Google Scholar] [CrossRef]
  56. Gupta, P.K.; Goel, M. Environmental Tracers and Isotopic Techniques: Tools for Sustainable Water Management. In Geostatistics and Geospatial Technologies for Groundwater Resources in India; Adhikary, P.P., Shit, P.K., Santra, P., Bhunia, G.S., Tiwari, A.K., Chaudhary, B.S., Eds.; Springer International Publishing: Cham, Switzerland, 2021; pp. 513–529. ISBN 978-3-030-62397-5. [Google Scholar]
  57. Li, S.-L.; Liu, C.-Q.; Patra, S.; Wang, F.; Wang, B.; Yue, F.-J. Using a Dual Isotopic Approach to Trace Sources and Mixing of Sulphate in Changjiang Estuary, China. Appl. Geochem. 2011, 26, S210–S213. [Google Scholar] [CrossRef]
  58. Craig, H. Isotopic Variations in Meteoric Waters. Science 1961, 133, 1702–1703. [Google Scholar] [CrossRef]
  59. Tazioli, A.; Fronzi, D.; Palpacelli, S. Regional vs. Local Isotopic Gradient: Insights and Modeling from Mid-Mountain Areas in Central Italy. Ground Water 2024, 62, 714–734. [Google Scholar] [CrossRef]
  60. Cervi, F.; Tazioli, A. Inferring Hydrological Information at the Regional Scale by Means of δO–δH Relationships: Insights from the Northern Italian Apennines. Hydrology 2022, 9, 41. [Google Scholar] [CrossRef]
  61. Doveri, M.; Menichini, M.; Cerrina Feroni, A. Stable Water Isotopes as Fundamental Tool in Karst Aquifer Studies: Some Results from Isotopic Applications in the Apuan Alps Carbonatic Complexes (NW Tuscany, Italy). Ital. J. Eng. Geol. Environ. 2013, 1, 33–50. [Google Scholar] [CrossRef]
  62. Rozanski, K.; Araguás-Araguás, L.; Gonfiantini, R. Isotopic Patterns in Global Precipitation. J. Geophys. Res. 1992, 78, 1–36. [Google Scholar] [CrossRef]
  63. Natali, S.; Doveri, M.; Giannecchini, R.; Baneschi, I.; Zanchetta, G. Is the Deuterium Excess in Precipitation a Reliable Tracer of Moisture Sources and Water Resources Fate in the Western Mediterranean? New Insights from Apuan Alps (Italy). J. Hydrol. 2022, 614, 128497. [Google Scholar] [CrossRef]
  64. Kossova, S.A.; Dubinina, Y.e.O. Origin of the Freshwater Component in Estuaries of the Ob and Yenisey Rivers and Adjacent Waters of the Kara Sea Based on Isotopic (δD, δ18O) Data. Oceanology 2025, 65, 56–66. [Google Scholar] [CrossRef]
  65. Khalil, U.; Sajid, M.; Riaz, M.Z.B.; Yang, S.; Sivakumar, M. Estuarine Salinity Intrusion and Flushing Time Response to Freshwater Flows and Tidal Forcing Under the Constricted Entrance. Water 2025, 17, 693. [Google Scholar] [CrossRef]
  66. Li, M.; Najjar, R.G.; Kaushal, S.; Mejia, A.; Chant, R.J.; Ralston, D.K.; Burchard, H.; Hadjimichael, A.; Lassiter, A.; Wang, X. The Emerging Global Threat of Salt Contamination of Water Supplies in Tidal Rivers. Environ. Sci. Technol. Lett. 2025, 12, 881–892. [Google Scholar] [CrossRef]
  67. Menten, G.; Melo, W.; Pinho, J.; Iglesias, I.; Antunes do Carmo, J. Simulation of Saltwater Intrusion in the Minho River Estuary under Sea Level Rise Scenarios. Water 2023, 15, 2313. [Google Scholar] [CrossRef]
  68. Scroccaro, I.; Spitz, Y.H.; Seaton, C.M. Effect of Local Winds on Salinity Intrusion in the Columbia River Estuary. Water 2023, 15, 326. [Google Scholar] [CrossRef]
  69. Gong, W.; Lin, Z.; Chen, Y.; Chen, Z.; Zhang, H. Effect of Winds and Waves on Salt Intrusion in the Pearl River Estuary. Ocean Sci. 2018, 14, 139–159. [Google Scholar] [CrossRef]
  70. Ma, R.; Qiu, C.; Zhu, J.; Zhang, Z.; Zhu, Y.; Kong, L.; Ding, L.; Qiu, W.; Wu, H. Dynamic Cause of Saltwater Intrusion Extremes and Freshwater Challenges in the Changjiang Estuary in Flood Season of 2022. Front. Mar. Sci. 2025, 12, 1573883. [Google Scholar] [CrossRef]
  71. Uncles, R.J.; Stephens, J.A. The Effects of Wind, Runoff and Tides on Salinity in a Strongly Tidal Sub-Estuary. Estuaries Coasts 2011, 34, 758–774. [Google Scholar] [CrossRef]
  72. Jongbloed, H.; Schuttelaars, H.M.; Dijkstra, Y.M.; Donkers, P.B.; Hoitink, A.J.F. Influence of Wind on Subtidal Salt Intrusion and Stratification in Well-Mixed and Partially Stratified Estuaries. J. Phys. Oceanogr. 2022, 52, 3139–3158. [Google Scholar] [CrossRef]
  73. van Keulen, D.; Kranenburg, W.M.; Hoitink, A.J.F. A New Harmonic Regression Approach to Interpret and Predict Estuarine Salinity Variation. J. Geophys. Res. Ocean. 2025, 130, e2024JC022185. [Google Scholar] [CrossRef]
  74. Wegman, T.M.; Pietrzak, J.D.; Horner-Devine, A.R.; Dijkstra, H.A.; Ralston, D.K. Observations of Estuarine Salt Intrusion Dy-namics During a Prolonged Drought Event in the Rhine-Meuse Delta. J. Geophys. Res. Ocean. 2025, 130, e2024JC021655. [Google Scholar] [CrossRef]
  75. Costa, Y.; Martins, I.; Carvalho, G.; Barros, F. Trends of Sea-Level Rise Effects on Estuaries and Estimates of Future Saline Intru-sion. Ocean Coast. Manag. 2023, 236, 106490. [Google Scholar] [CrossRef]
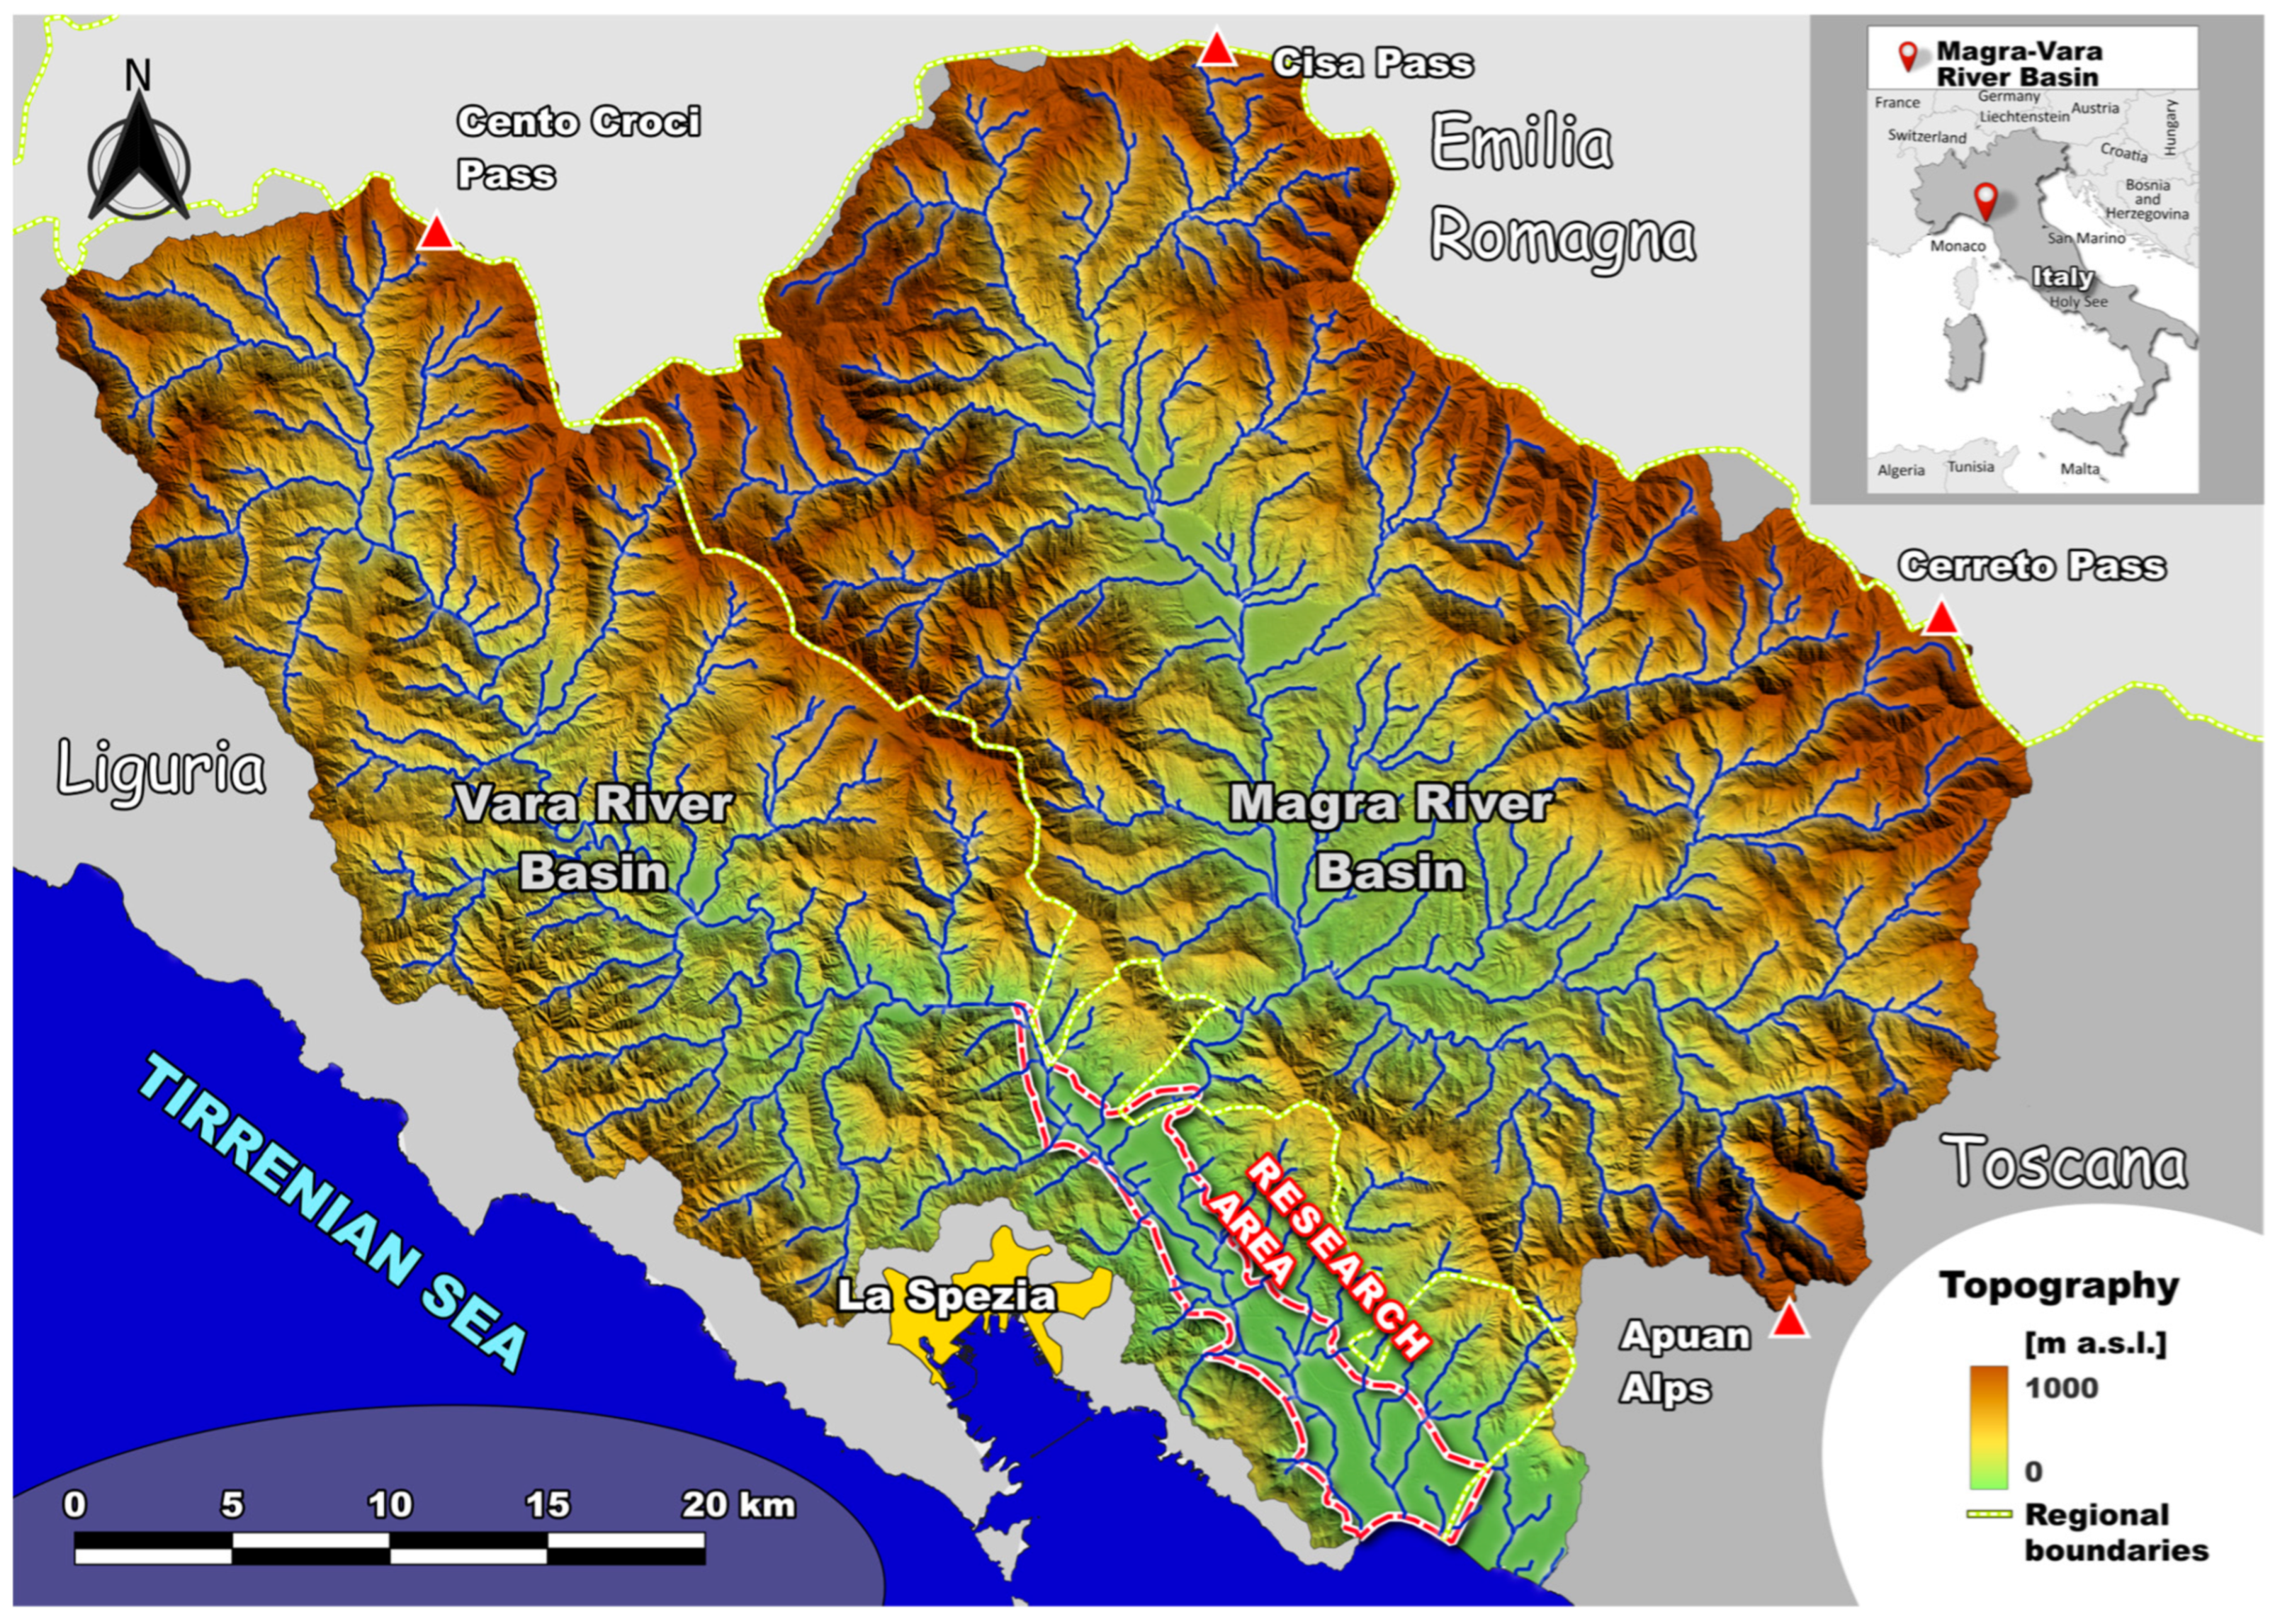
Figure 1. Topographical map of the Magra–Vara catchment and study area.
Hydrology 12 00262 g001
Figure 2. Hydrological productivity of the Magra and Vara sub-basins (ARPAL monitoring network and database).
Hydrology 12 00262 g002
Figure 3. Baseflow of the Magra River. Long-term baseflow discharge trends at Calamazza Station (1950–2024), compared with annual cumulative precipitation recorded at Sarzana Station. P cum. = cumulative precipitation; Q meas. = measured discharge; P cum. trend = trend in cumulative precipitation; Q trend = discharge trend (data sources: https://ambientepub.regione.liguria.it/SiraQualMeteo/script/PubAccessoDatiMeteo.asp (accessed on 26 September 2025); http://www.bio.isprambiente.it/annalipdf/ (accessed on 26 September 2025)).
Hydrology 12 00262 g003
Figure 4. Discharge of the Magra River (Fornola station). Measured river discharge at Fornola Station during the fieldwork period (2022–2024), illustrating hydrological variability across seasons and sampling campaigns.
Hydrology 12 00262 g004
Figure 5. Monthly SPI at Sarzana Station (1932–2024). Monthly variations of the SPI from 2007 to 2024, calculated using the historical precipitation series recorded at Sarzana Station between 1932 and 2024 (data sources: https://ambientepub.regione.liguria.it/SiraQualMeteo/script/PubAccessoDatiMeteo.asp (accessed on 26 September 2025); http://www.bio.isprambiente.it/annalipdf/ (accessed on 26 September 2025)).
Hydrology 12 00262 g005
Figure 6. Tidal and wind conditions recorded during field monitoring (2022–2023). (A) Daily average wind speed at Sarzana Station (ARPAL). (B) Daily mean sea level recorded at the La Spezia tide gauge (ISPRA). (C) Prevailing wind directions observed during the monitoring period.
Hydrology 12 00262 g006
Figure 7. Map of the 11 surface water monitoring stations in the Magra River estuary used in this study.
Hydrology 12 00262 g007
Figure 8. Map overview of monitoring station positions and thematic distribution of EC values along the Magra River, interpolated from six field campaigns.
Hydrology 12 00262 g008
Figure 9. Estimated fraction of seawater at the surface of the Magra River, calculated via mass-balance modeling. Boxplot of marine water fraction (%) observed in the estuarine transition stations (C01–C07) over six monitoring campaigns. For details and spatial distribution of the monitoring stations, refer to Figure 7.
Hydrology 12 00262 g009
Figure 10. Correlation between EC and δ18O in the Magra River estuary. Scatterplot illustrating the relationship between EC and δ18O values, used as complementary tracers of seawater intrusion. The freshwater–saltwater mixing line and associated confidence bands were computed for monitoring stations located in the transitional zone of the Magra River. For station details and spatial distribution, refer to Figure 8.
Hydrology 12 00262 g010
Figure 11. Correlation between δD and δ18O in the Magra River estuary. Plot of δD versus δ18O values from duplicate-analyzed samples collected during the study. The diagram includes GMWL [62], LMWL [21], and the regression line derived from newly acquired data. The freshwater–seawater mixing line is illustrated using samples from the estuarine reach. For station details and spatial distribution, refer to Figure 8.
Hydrology 12 00262 g011
Figure 12. Environmental factor modeling in the Magra River estuary. Spatial variation of regression coefficients associated with the four environmental variables analyzed and comparison of the results obtained from the four multivariate linear regression models applied along the river stretch between the Romito weir and the sea. For station details and spatial distribution, refer to Figure 8.
Hydrology 12 00262 g012
Table 1. Reference standards for stable isotope calibration. The symbol “-” is used to indicate missing values.
TypeStandardδ18O (‰ VSMOW)δD (‰ VSMOW)
PrimaryVSMOW0.00 ± 0.000.00 ± 0.00
SecondarySS2−0.10 ± 0.260.20 ± 0.90
SecondarySS5−3.95 ± 0.22−20.10 ± 1.40
SecondarySS3−5.60 ± 0.21−31.80 ± 1.80
SecondarySS6−7.70 ± 0.24-
SecondarySS4−8.61 ± 0.18−58.10 ± 1.90
SecondarySS7−12.93 ± 0.22-
SecondarySS1−15.90 ± 0.21−105.60 ± 1.70
PrimaryGRASP−33.40 ± 0.00−258.00 ± 0.00
PrimarySLAP−55.50 ± 0.00−472.50 ± 0.00
Table 2. Summary of stable water isotope composition and electrical conductivity measured at monitoring stations along the Magra–Vara river system. The symbol “-” is used to indicate missing values. For details and spatial distribution of the monitoring stations, refer to Figure 7.
Monitoring Stationδ18O (‰ VSMOW)n. obs.δD (‰ VSMOW)n. obs.EC (µS/cm)n. obs.
C01−2.23 ± 2.479−10.49 ± 14.41431,642 ± 19,2088
C02−2.78 ± 2.516−34.25127,562 ± 20,0276
C03−3.87 ± 1.995−24.64 ± 14.80219,029 ± 15,4965
C04−4.58 ± 1.705-013,197 ± 13,4815
C05−5.21 ± 0.656−29.00 ± 7.5825243 ± 49376
C06−5.73 ± 0.415-02387 ± 23795
C07−5.84 ± 0.2519−36.08 ± 1.472746 ± 31421
C10−6.00 ± 0.267−34.57 ± 1.822570 ± 1248
C12−5.97 ± 0.297−35.80 ± 5.113612 ± 1446
C13−6.41 ± 0.3112−37.96 ± 4.576923 ± 3176
C14−5.76 ± 0.4912−31.29 ± 3.776340 ± 476
Table 3. Mean and standard deviation of MSE values for PLS, Ridge, LASSO, and Elastic Net regression models across monitoring stations.
Monitoring StationPLS MSERidge MSELASSO MSEElastic Net MSE
MeanStd. Dev.MeanStd. Dev.MeanStd. Dev.MeanStd. Dev.
C013.951.032.940.8112.487.511.840.57
C021.910.231.490.263.341.001.100.23
C030.560.000.510.001.500.000.010.00
C040.310.000.080.001.420.000.010.00
C050.080.030.040.030.180.060.010.01
C060.090.000.050.000.050.000.000.00
C070.280.110.050.010.260.220.050.01
C100.050.020.020.010.090.030.030.01
Disclaimer/Publisher’s Note: The statements, opinions and data contained in all publications are solely those of the individual author(s) and contributor(s) and not of MDPI and/or the editor(s). MDPI and/or the editor(s) disclaim responsibility for any injury to people or property resulting from any ideas, methods, instructions or products referred to in the content.