Article

Effects of Climate Change and Changes in Land Use and Cover on Water Yield in an Equatorial Andean Basin

1
Carrera de Ingeniería Ambiental, Facultad de Ciencias Químicas, Universidad de Cuenca, Cuenca 010207, Ecuador
2
Grupo de Evaluación de Riesgos Ambientales en Sistemas de Producción y Servicios (RISKEN), Departamento de Química Aplicada y Sistemas de Producción, Universidad de Cuenca, Cuenca 010207, Ecuador
3
HYDROLAB, Centro de Investigación, Innovación y Transferencia de Tecnología (CIITT), Universidad Católica de Cuenca, Cuenca 010108, Ecuador
4
Grupo de Investigación, Ambiente Ciencia y Energía, Universidad Católica de Cuenca, Cuenca 010108, Ecuador
*
Author to whom correspondence should be addressed.
Hydrology 2024, 11(9), 157; https://doi.org/10.3390/hydrology11090157
Submission received: 31 August 2024 / Revised: 17 September 2024 / Accepted: 17 September 2024 / Published: 23 September 2024

Abstract

:
Ecosystem services contribute significantly to human development, with water production being a crucial component. Climate and land use changes can impact water availability within a basin. In this context, researching water-related areas is essential for formulating policies to protect and manage hydrological services. The objective of this study was to estimate water yield in the sub-basins of the Tabacay and Aguilán rivers under climate change scenarios in 2030, 2040, and 2050, combined with scenarios of changes in land cover and land use. The InVEST model was employed to analyze water yield. The results show that crop areas were identified as the lowest water yield in future scenarios, and forested areas, particularly the region where the Cubilán Protected Forest is located, contribute the most to water yield in the subbasin. Besides, water yield has increased in the historic period (2016–2018) due to the conservation and reforestation initiatives carried out by the Municipal Public Service Company for Drinking Water, Sewerage, and Environmental Sanitation of the city of Azogues in 2018, the so-called Reciprocal Agreements for Water. Additionally, an increase in water yield is projected for future scenarios. This study can serve as a basis for decision-makers to identify areas that should prioritize protection and conservation.

1. Introduction

Ecosystems are crucial in human development and provide various ecosystem services (ES) [1]. These services include, among others, some essential resources such as water, air, and wood, as well as processes such as water purification and quality, carbon sequestration, and nutrient recycling [2,3]. The provision of fresh water is one of the most essential global ecosystems. These are crucial in developing society, agriculture, industry, and other sectors [4,5,6]. However, ES can be affected by climate change and changes in land cover and land use.
Numerous studies worldwide have estimated the impacts of climate change and land use changes on water availability. Positive relationships between precipitation and water availability have been found in the literature [6,7,8]. Conversely, some research has shown negative impacts between water availability and changes in land use, such as changes in surface water balance, evapotranspiration rates, runoff dynamics, groundwater flow, and other factors [9,10,11,12]. For this reason, it is crucial to estimate its effects through hydrological modeling to understand the impacts of climate change and changes in land cover and use.
Modeling hydrological processes within river basins is fundamental to helping decision-makers and administrators improve water resource management [13]. Hydrological models can help estimate the amount of water under various conditions, and these estimates can be made at different spatial scales, from hillside areas to basins [14,15,16]. However, developing hydrological models can prove challenging in some areas of the world.
Although hydrological modeling often requires large amounts of data, its accessibility is challenging [17]. Over the last two decades, with the development of new technologies and geographic information systems (GIS), it has become possible to develop hydrological systems capable of incorporating complex parameters [18]. Within this category of models, we find the Soil and Water Assessment Tool (SWAT) [19], the Topography Based Hydrological Model (TOPMODEL) [20], Variable Infiltration Capacity (VIC) [21], Artificial Intelligence for Ecosystem Services (ARIES) [22], Integrated Valuation of Ecosystem Services and Tradeoffs (InVEST) [23], and various additional ones. Although developing these models has helped simplify data requirements, having the necessary data to implement a particular model is still challenging.
In this regard, the InVEST model (based on annual precipitation and landscape characteristics) can be run with a reduced data set compared with other hydrological models [24], achieving good results in different locations where it has been used. Applications of this model include the study by [18], which determined the water discharge in the Xitiaoxi River basin and found slight differences compared with the actual discharge of the basin. A study in the UK by [25] validated the model’s performance in water production and found differences of less than 10% between actual and modeled performance. On the other hand, the studies by [26,27], which were carried out in Altai Prefecture (China) and the alpine region of the Qinghai–Tibet Plateau (QTP), show a decreased water yield in the first study area and an increase in water production in the second study area due to changes in land use and climatic trends. The study by [28] found that the water retention in the forests of North Korea is lower than that in the forests of South Korea.
In North America, the study by [29] developed in 749 basins found a relatively poor performance compared with real-world conditions due to the study area’s cryospheric variables, which, when included, significantly improved predictions. In Latin America, the study developed by [30] evaluated the performance of water production in 224 basins in southern Chile, finding that the annual estimates showed good agreement between the observed and modeled values. Another study [31], developed in southern Ecuador, allowed a classification according to the importance of water production.
A notable advantage of the InVEST model is its minimal data requirements, which facilitates its use when extensive data are scarce. This adaptability is particularly advantageous for challenging terrain, such as the mountainous regions of the Andean páramos, where complex topography and difficult access present obstacles to establishing hydrometeorological stations to measure the numerous variables required for many hydrological models.
In the Andean region, the páramo provide water to large cities, such as Quito and Bogotá [32]. However, water availability is influenced by various factors such as precipitation, temperature, soil permeability, slopes, and vegetation, among others [18]. Although there is high water production in the Andean region due to the near-constant rainfall and low consumption by vegetation, urban growth and changing land use and land cover have contributed to changes in water production and availability in these regions [31].
The purpose of this study is to evaluate water production in the sub-basins of the Tabacay and Aguilán rivers (Cañar Province, Southern Ecuador) using the InVEST model, taking into account the land use change in the years 2014, 2016, 2018, 2030, 2040, and 2050 and climate change for two representative concentration pathways (RCP): 4.5 and 8.5 scenarios in 2030, 2040, and 2050. The results will significantly help decision-makers and strengthen policies to protect water sources in the study area.

2. Materials and Methods

2.1. Study Zone

The study zone includes the Tabacay and Aguilán river sub-basins, which are located in southern Ecuador in the Cañar Province (Figure 1). Its total area is 86.55 km2, and its altitude range is between 2480 and 3760 m above sea level. The climate in the study zone is characterized by relatively low temperatures (average temperature between 9–11 °C), which is typical in the Andean region. The average annual precipitation varies between 1115 mm in the upper part (Llaucay) and 876 mm in the lower part (Guapán). The sub-basins of the Tabacay and Aguilán rivers supply water to the city of Azogues, so slight changes in the sub-basins may result in a reduction in water supply. In addition, the study area is characterized by unsustainable land use (agriculture on steep slopes) [33], which disrupts the sector’s land and water resources.
For this reason, and to protect water and other natural resources, the “Municipal Rules on the Conservation, Restoration of Water Sources, Water Recharge Zones, Sensitive Ecosystems, and Other Priority Protected Areas of Biodiversity, Environmental Services and Natural Heritage of the Canton of Azogues” apply to the study area. In addition, the Municipal Public Service Company for Drinking Water, Sewerage and Environmental Sanitation (EMAPAL-EP) uses the Reciprocal Water Agreements (ARAs, its Spanish acronym) as a protection tool. ARAs aim to provide agricultural technical assistance and financial compensation to landowners in the watersheds’ upper areas, designated as water recharge areas. In exchange, the owners must allocate parts of their land as conservation areas. This initiative secures spaces dedicated to conservation and encourages good agricultural and livestock production practices in these areas, contributing to the region’s sustainable development.

2.2. InVEST Model

The InVEST model V3.14.0 is a tool that can be used to examine how changes in ecosystems can lead to changing benefits for people. The InVEST model included various modules to quantify, map, and evaluate the benefits of marine, freshwater, and terrestrial ecosystems. The different modules of the model can be divided into four main categories: support services, final ecosystem services, tools to facilitate the analysis of ecosystem services, and support tools [24]. This study used the “water yield production” module, which is located in the “ecosystem services” category.

InVEST—Water Yield Module

This module uses a grid map and the principle of water balance [annual precipitation (P) minus actual evapotranspiration (AET)] to determine the annual amount of water (Y) in each pixel (x). The model makes no distinction between surface and groundwater and assumes that at the end of the year, all water that falls into the basin, except what evaporates, leaves it (Equation (1)).
Y x = 1     A ET X P X P ( x )
The relationship between A ET X / P X (Equation (2)) is based on the methodology developed by [34] and later adapted by [35,36].
AET x P ( x ) = 1 + P ET X P X 1 + P ET X P X ω x 1 / ω x
where P ET X represents potential evapotranspiration and ω x is a nonphysical parameter that describes the inherent characteristics of both soil and climate.
The P ET X can be calculated using Equation (3).
P ET X   = Kc X · ETo X
where K c X represents the evapotranspiration coefficient for the vegetation linked to a particular land cover and land use (LULC).
The nonphysical parameter ω x is calculated with Equation (4).
ω x = Z PAWC ( X ) P ( X ) + 1.25
where P A W C ( X ) is the water capacity available to the plant at pixel x and Z is a seasonality parameter that represents the depth and distribution of seasonal rainfall.
For more details describing the water production module of the InVEST model, see [24].

2.3. Input Data for the Model

The data required by the InVEST model to run the water production module are the average yearly precipitation (P, mm), average yearly reference evapotranspiration (ETo, mm), land cover and land use, available water fraction for plants (PAWC) and root restriction layer depth (mm), watershed profiles (which is explained later—Figure 2), a table with biophysical attributes, and the Z-parameter.

2.3.1. Precipitation (Current Data)

The current rainfall data (2014, 2016, and 2018) were obtained from the meteorological gauges of the Catholic University of Cuenca and EMAPAL-EP. The Kriging interpolation [37] was carried out to obtain spatial rainfall throughout the study area.

2.3.2. Precipitation (Future Data)

The Ecuador Regional Climate Model (RCM-EC) evaluated the future precipitation data. This model was developed by the Ministry of Environment, Water, and Ecological Transition (MAATE, its Spanish acronym) as part of the Third National Communication on Climate Change (TCN) [38]. The model was developed by downscaling an ensemble of global climate models (GCMs) using the Weather Research and Forecasting (WRF) model at 10 km resolution for Ecuador [39]. The base period for its development was 1981–2005, and the future is 2011–2100 for two RCP 4.5 and 8.5 scenarios. This study used the two scenarios to represent climate conditions in 2030, 2040, and 2050. The RCP 4.5 scenario, which reflects a stabilization path where CO2 emissions peak around 2040 and then decline, suggests moderate mitigation efforts, while the RCP 8.5 scenario represents a high emissions scenario where no significant emissions reductions come [40]. Other studies at the national scale and in nearby catchments have also used the same scenarios to analyze the impacts of climate change [41,42,43]. This same approach has allowed for a shared analysis of the effects of climate change on water resources.
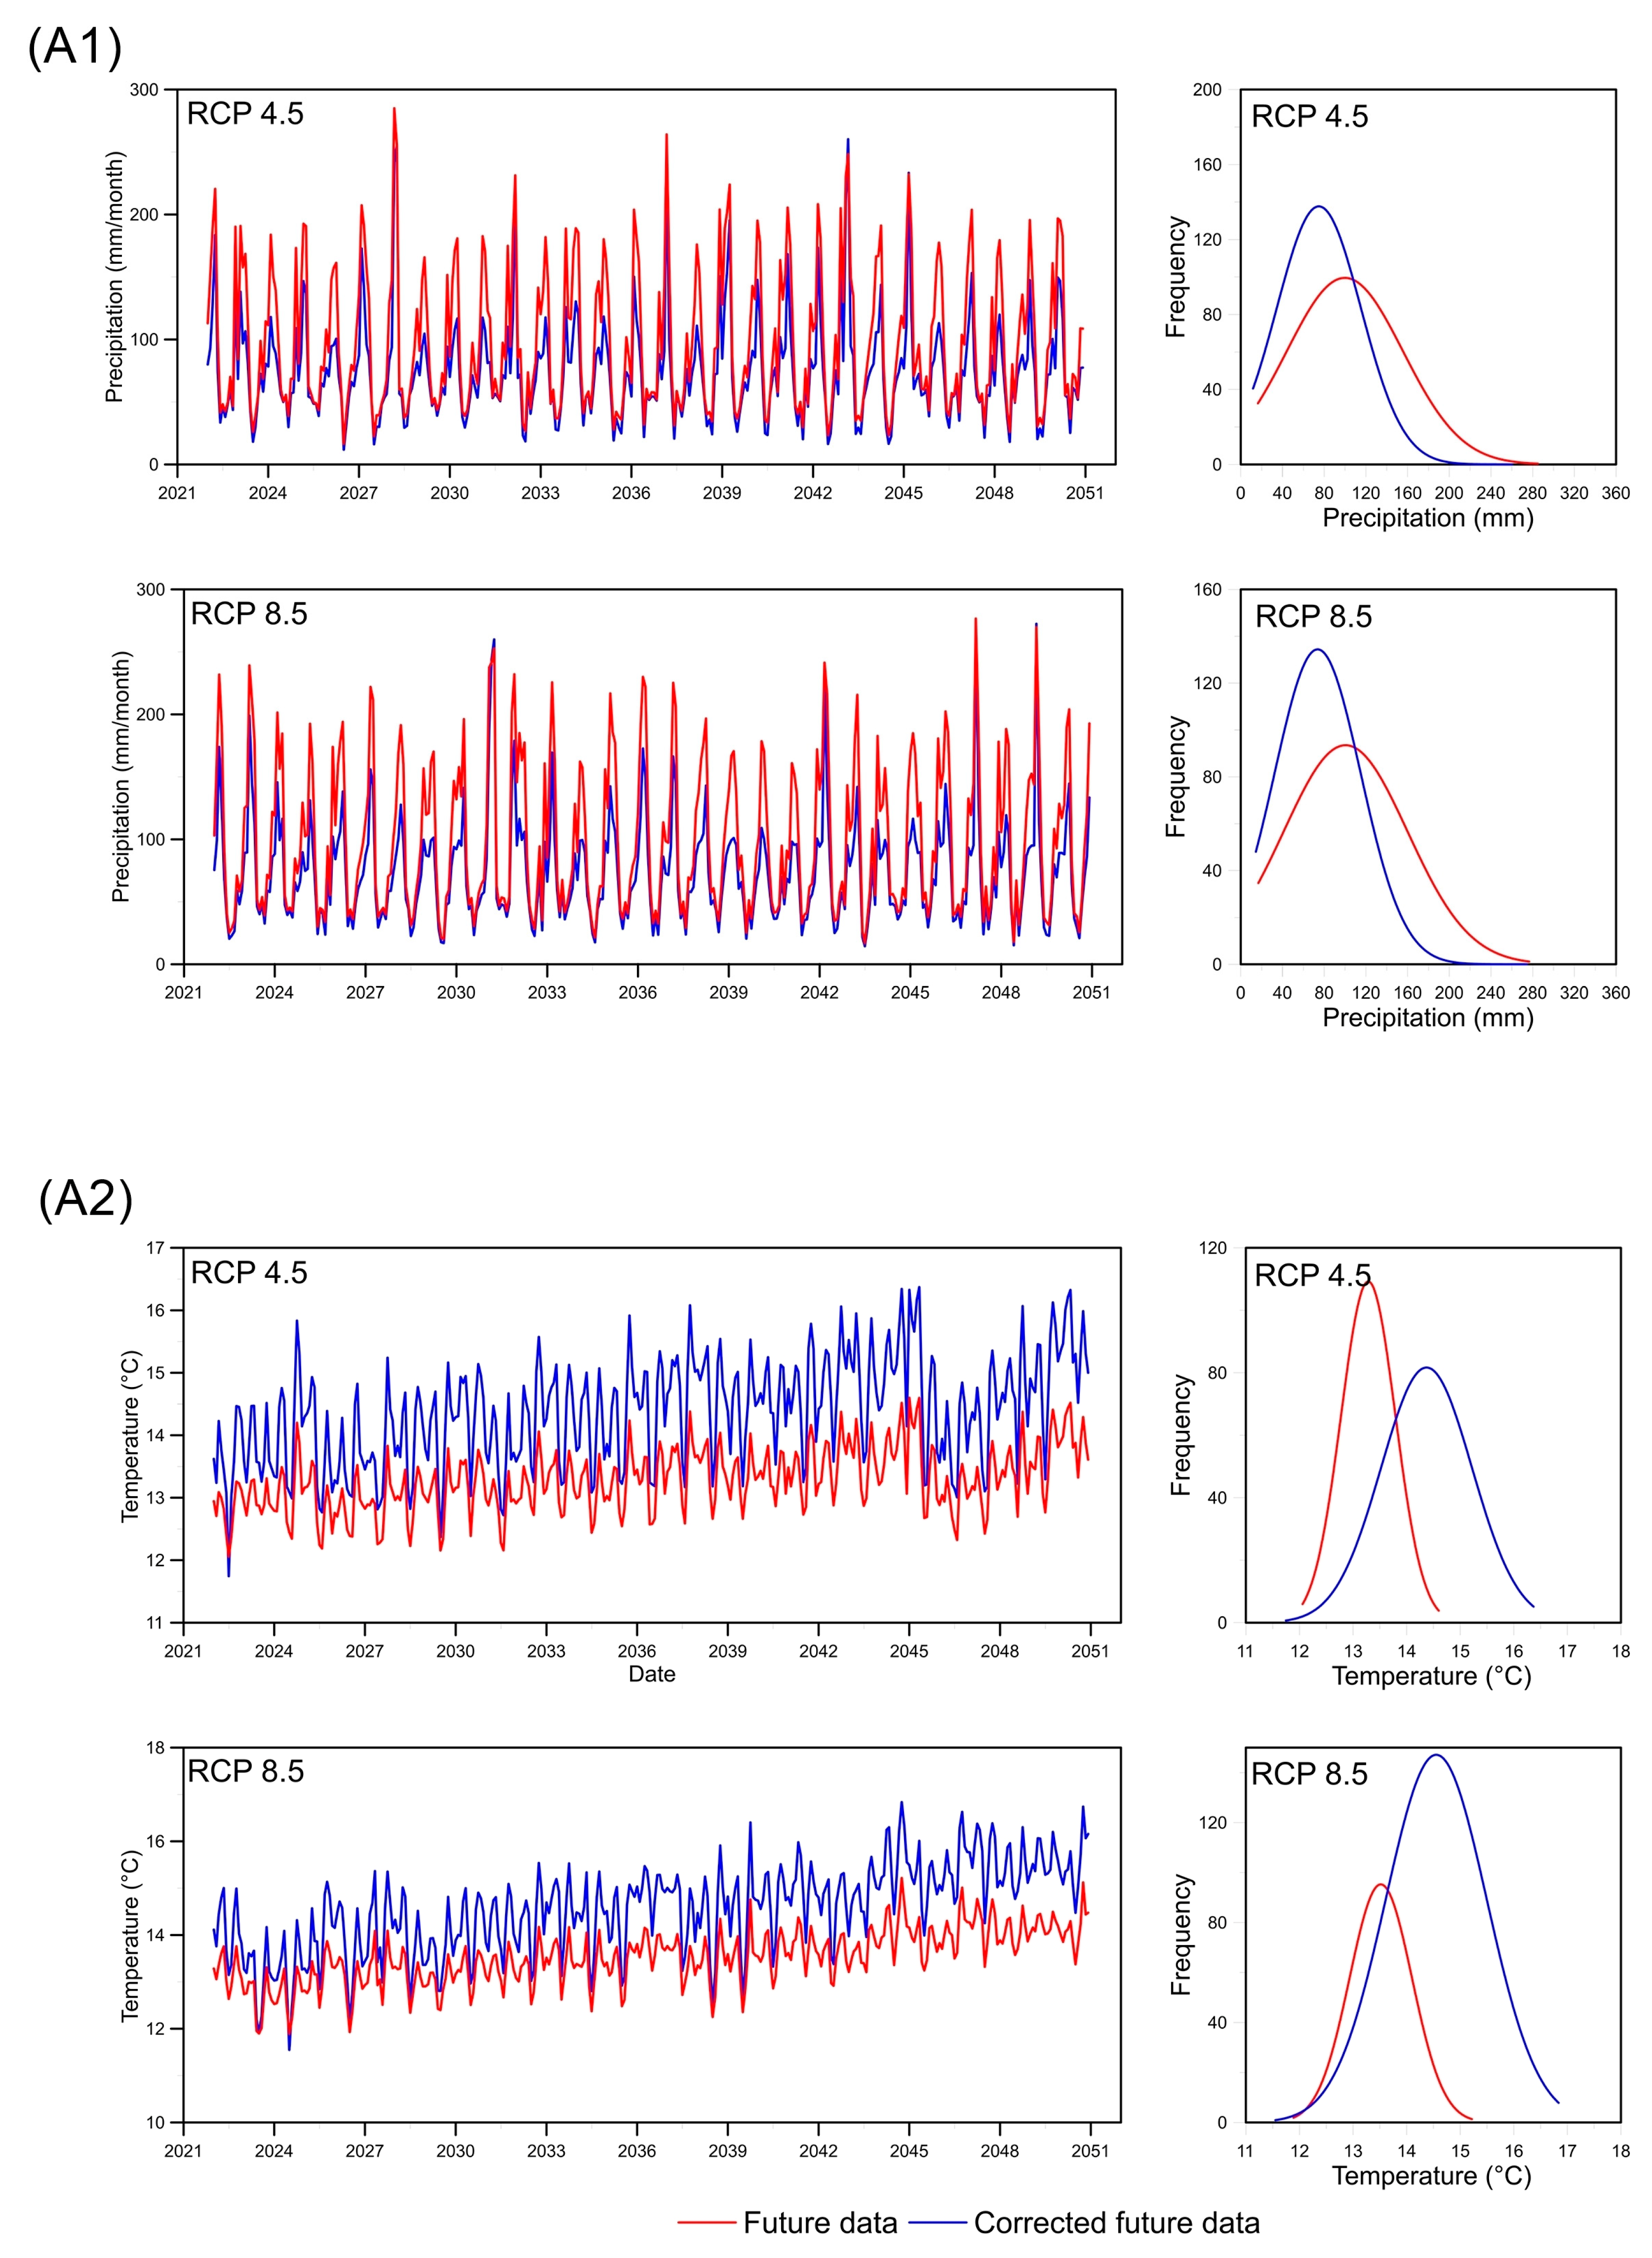
Since this data type may have significant systematic biases compared with the observed data, bias correction was performed using the Quantile Delta Mapping (QDM) method. This method preserves the relative changes in quantiles projected by the climate model and corrects for possible systematic biases in the quantiles of the modeled data concerning the observed values (Appendix A). According to the literature, the QDM correction is based on four steps [44]. Quantile Delta Mapping (QDM) is an advanced bias correction technique that adjusts the quantiles of modeled data based on the observed distribution over a historical period. The process consists of four steps: (i) The cumulative distribution function (CDF) is estimated for the modeled and observed data. (ii) The relative change in model quantiles between the historical and projected periods is calculated using the inverse of the CDF. (iii) This transformation is applied to the quantiles of the observed data in the historical period. (iv) The bias in the future projection is corrected at any time by applying the relative change multiplied by the observed data quantiles. As indicated by the literature [44], QDM is related to the equidistant CDF matching algorithm proposed by [45], and compared with Quantile Mapping (QM) algorithms, it is less prone to problems such as inflating trends relative to extreme data.
After the climate data were corrected, they were interpolated using the Kriging method [37] to obtain yearly spatial maps in different periods.

2.3.3. Evapotranspiration

Evapotranspiration was determined using the Holdridge method [46], in which a simple expression for its determination in tropical and subtropical regions was defined. This expression is based on the air temperature between 0 °C and 30 °C (biotemperature), which determines the rhythm and intensity of the physiological processes of plants (photosynthesis, respiration, and transpiration) as well as the rate of direct evaporation of water contained in the soil and vegetation. Holdridge’s original model is shown in Equation (5).
E T p = C HO · T
where ETp is the potential evapotranspiration (mm·year−1) and T is the air temperature (°C). The CHO coefficient is used for annual estimates with a value of 58.93.
The current temperature of the study area was obtained from the meteorological gauges of the Catholic University of Cuenca and EMAPAL-EP. Future temperature data (Appendix A) were derived from the QDM downscaling process performed on RCM-EC. These data (historical and future) were interpolated using the Kriging methodology [37] to obtain the spatial temperature of the entire study area.

2.3.4. Plant Available Water Capacity

Plant available water content (Figure 2j) is defined as the difference between the volumetric field capacity fraction and the permanent wilting point. The data on available water content for plants come from the ISRIC database [47]. Since the database reports moisture content in mm and at seven depths, it is necessary to convert these values into a fraction using Equation (6).
AWC = 1 b     a 1 2 k = 1 N 1 ( x k + 1   x k ) ( f x k + f x k + 1 )
where N is the number of depths, x k is the k-th depth, and f x k is the value of the water content at that depth. Since the result of the available water content is in a range of 0–100, which represents the percentage, it is necessary to divide by 100 to obtain the value in fraction and to be able to introduce these results into the InVEST model.

2.3.5. Root Restraint Layer Depth

It is the soil depth (mm) at which root penetration is inhibited due to chemical or physical characteristics of soil (Figure 2k). The data were obtained from Ecuador’s National Information System of Rural Lands and Technological Infrastructure (SIGTIERRAS—http://geoportal.agricultura.gob.ec/index.php/visor-geo, accessed on 10 February 2024).
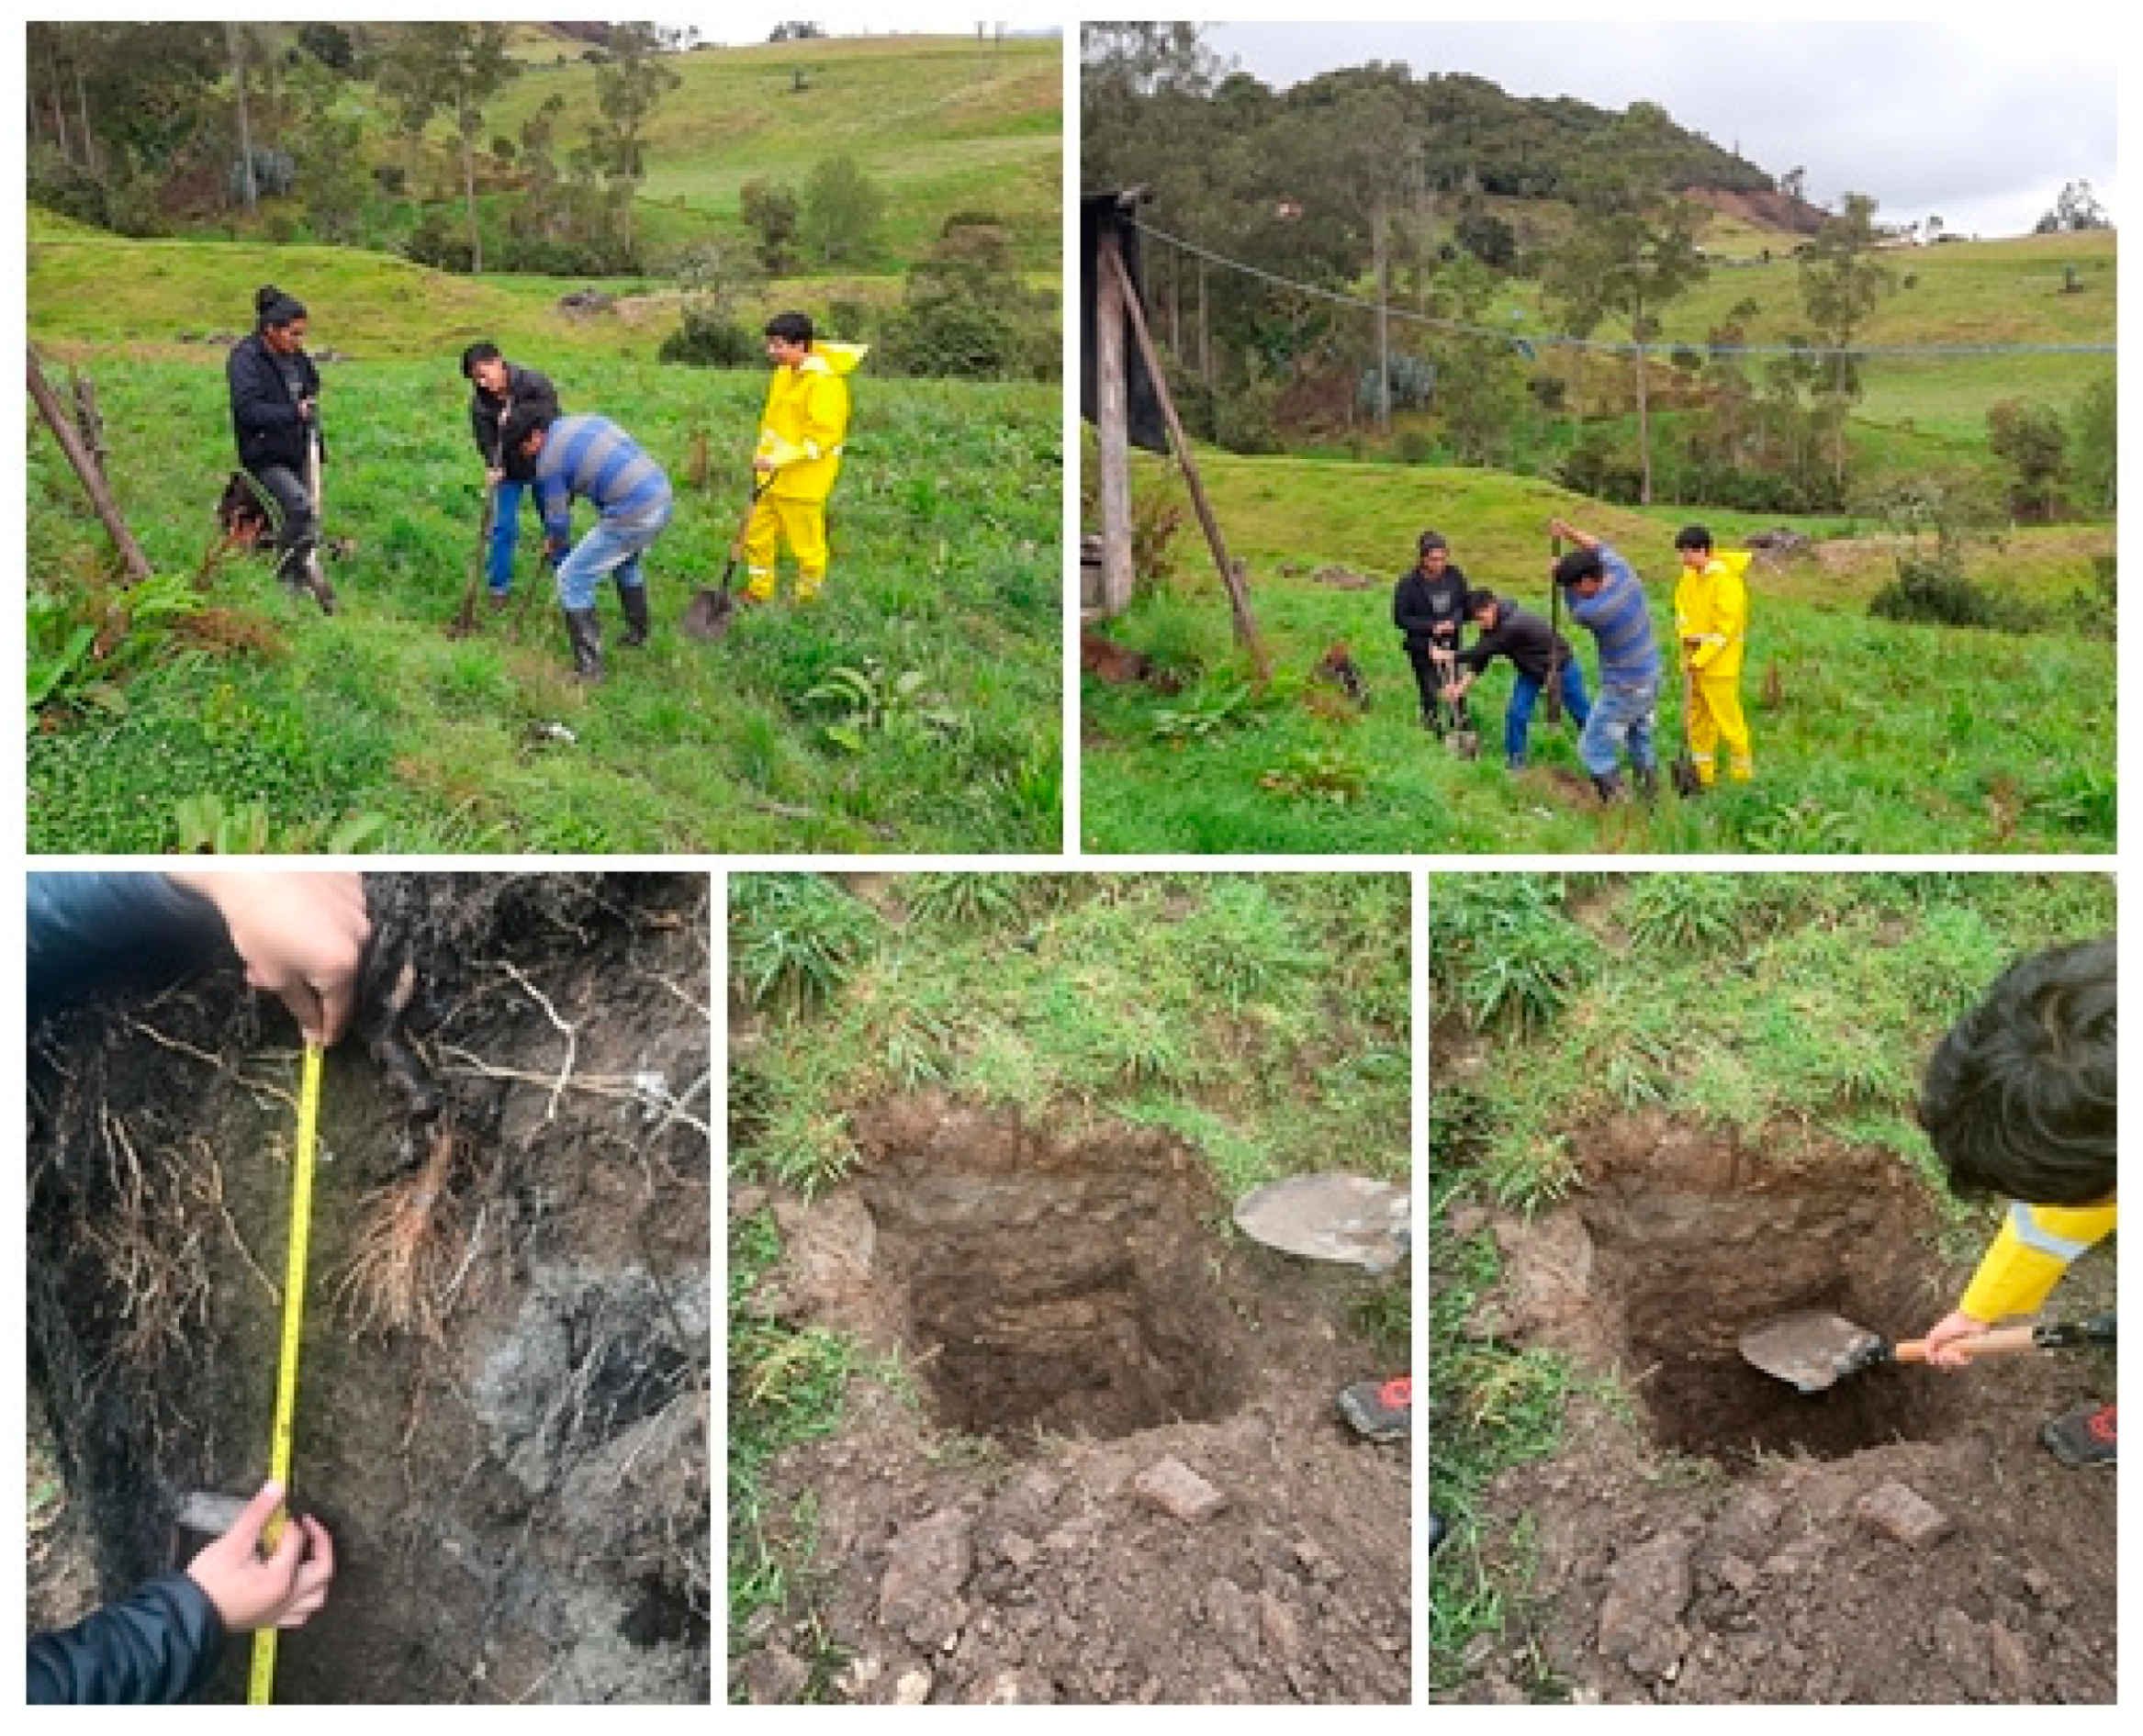
The available data had a qualitative classification and were transformed into quantitative data using the available scientific literature as a reference [48], achieving a more precise approximation to reality. Furthermore, to validate this new classification, field tests were carried out (Figure 3), providing an empirical validation of the categorization. The values obtained from these pits in the field for validation are presented in Table 1 for reference.

2.3.6. Land Use and Land Cover

The land use and land cover data used in the study were obtained from MAATE for 2014, 2016, and 2018 (Figure 2l–n). The methodology described for its classification can be found in [49].
In addition, land use change forecasts for two trending and other pessimistic scenarios were created for 2030, 2040, and 2050 (Figure 2o–t). The trend scenario assumes a population growth of 1.56% (population growth determined shortly before the analysis period), in addition to the temporary land use change trends observed between 2014 and 2018. On the other hand, the pessimistic scenario makes the following assumptions: with a population growth rate of 5.83% (corresponding to the highest growth rate in Ecuador during the study period), the Cubilán protective forest would no longer exist, and the existing paths in the study area become gravel roads.
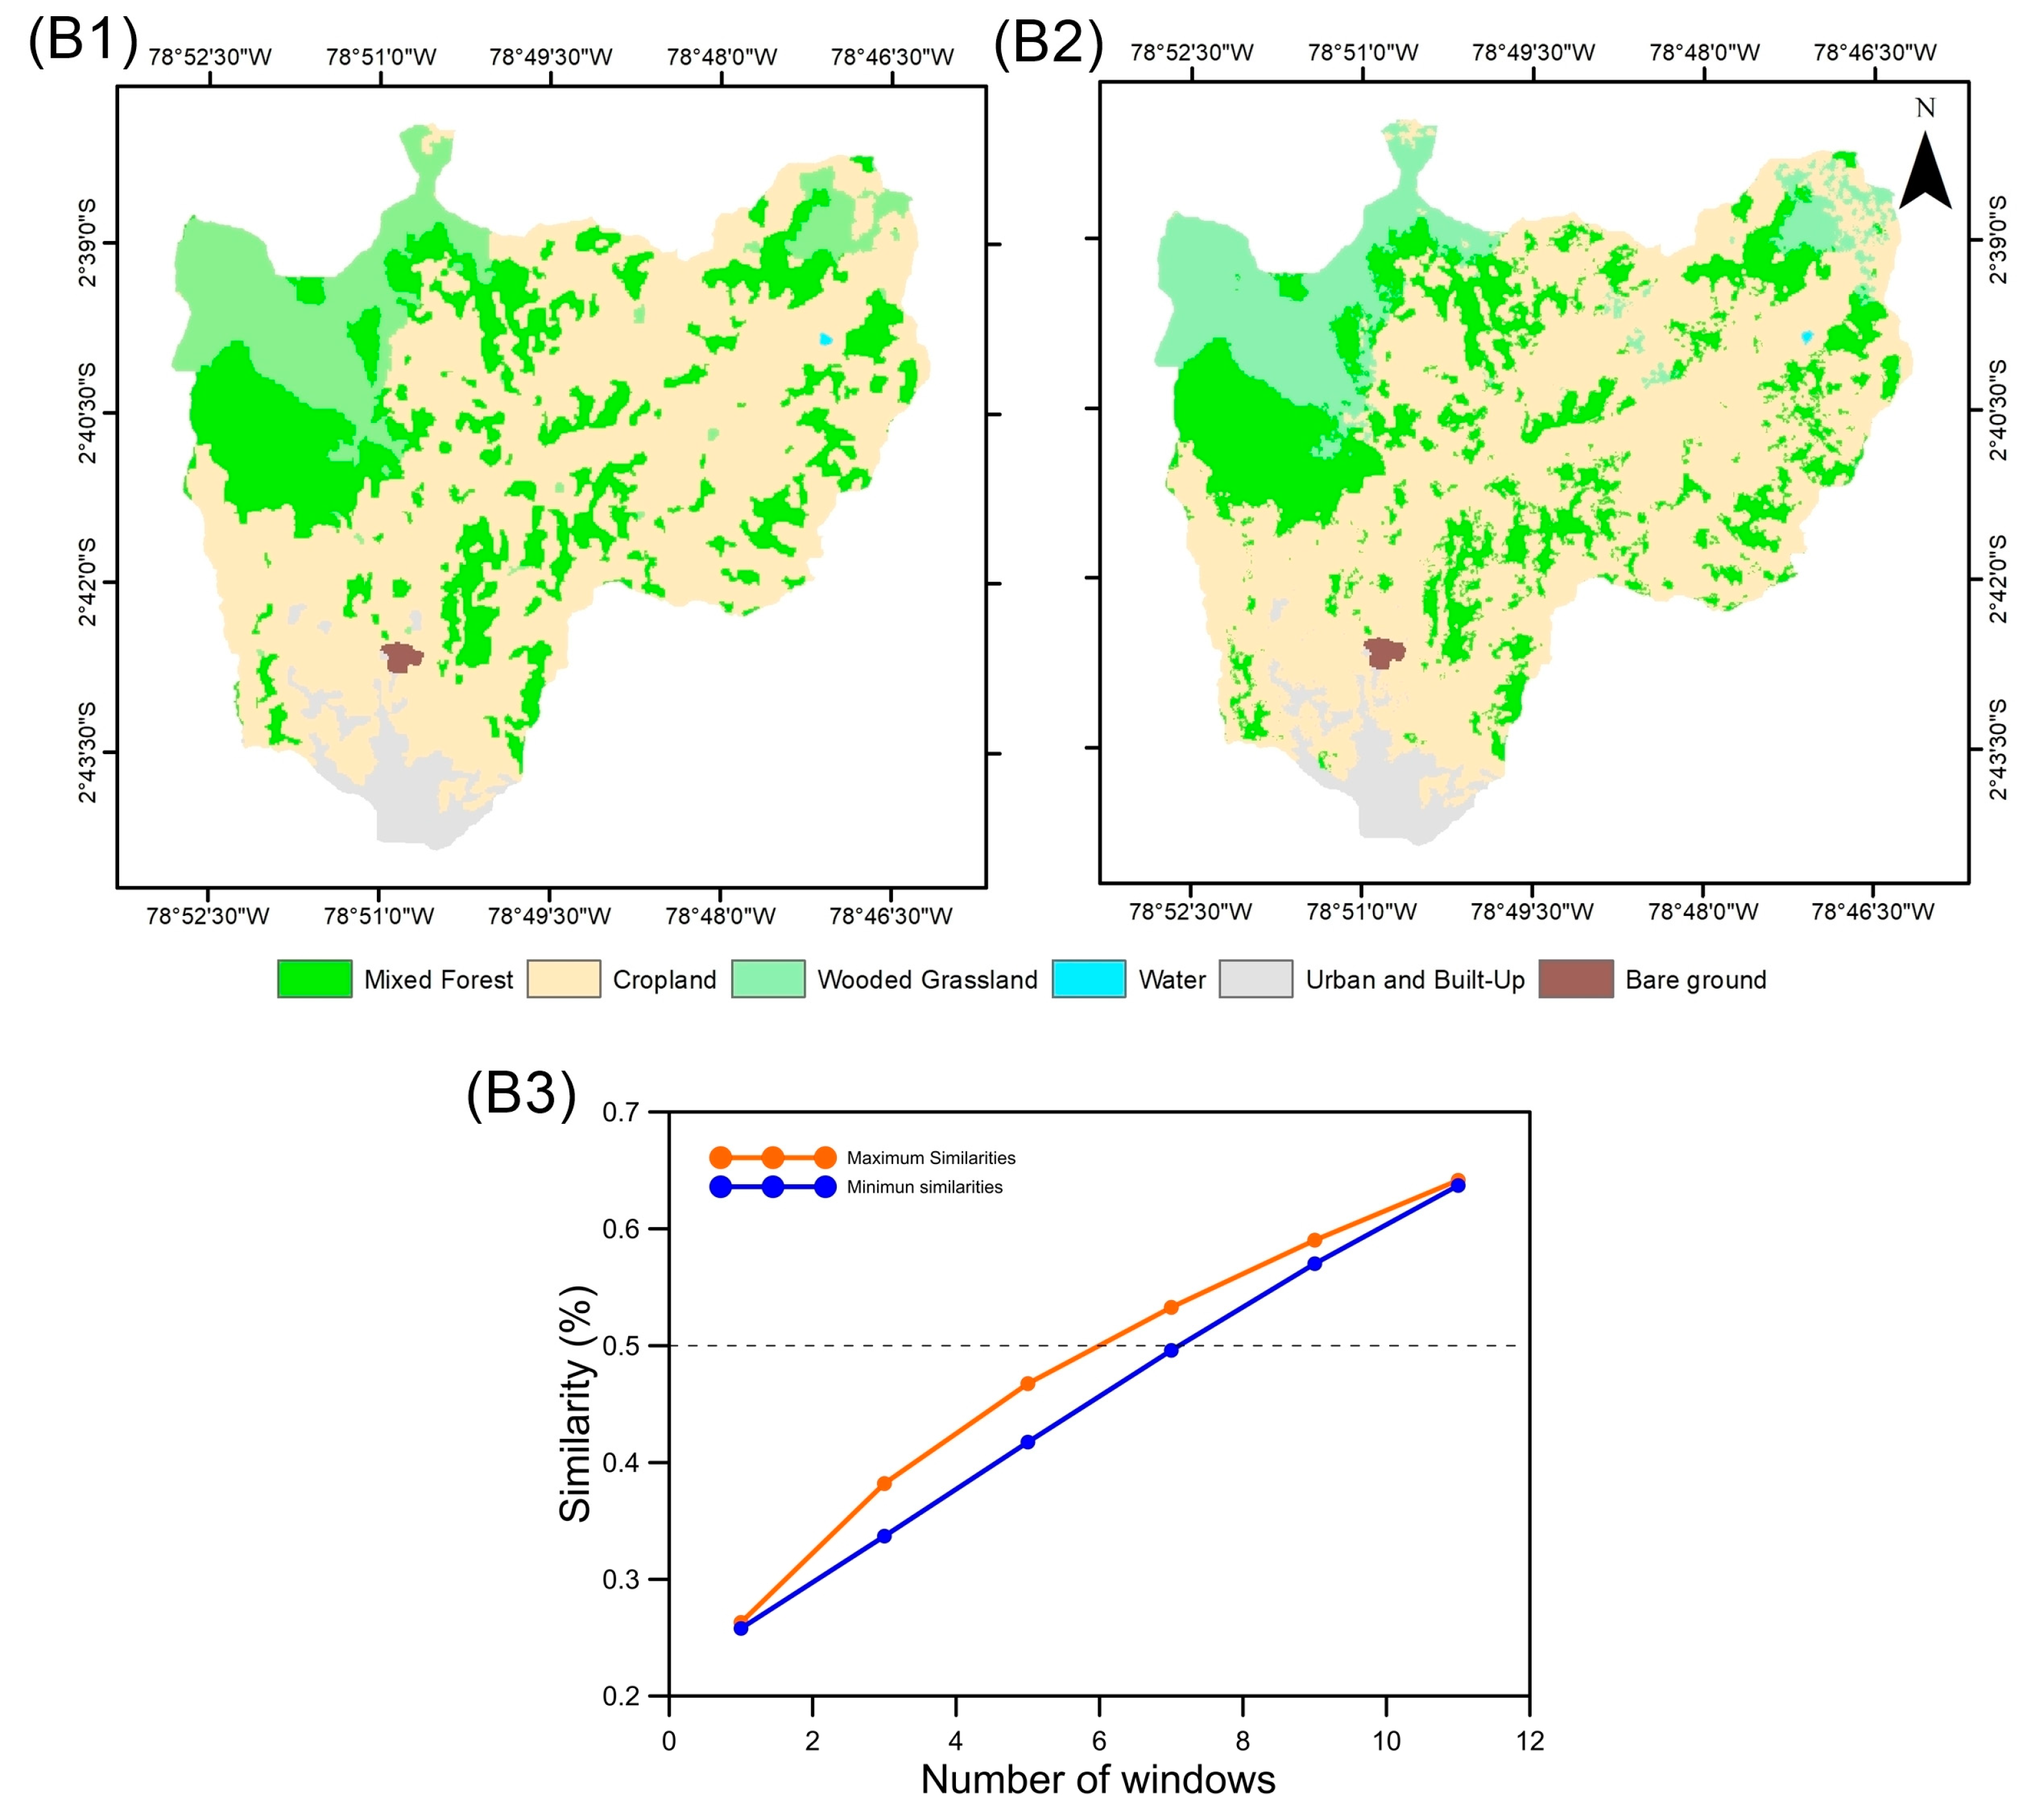
Land use forecasts were created using the land change modeling software Dinamica EGO version 7.1.1. [50]. The Dinamica EGO methodology uses cellular automata to model changes in land use based on biological, physical, and socioeconomic variables obtained from land cover and use maps (for this study between 2016 and 2018). In this model, space is divided into a grid of cells, where each cell represents a unit of land and can be in different states that change according to specific rules. The simulation is based on the local interaction of cells, which enables the modeling of transformations and new spatial scenarios. In the Dinamica EGO model, windows of different sizes, from 1 × 1 to 11 × 11 pixels, are used to assess the quality of spatial simulations. Each window allows one to compare spatial patterns in specific areas of the map, from fine details with small windows (1 × 1) to general trends with large windows (11 × 11). This approach helps to identify how the model reproduces spatial patterns at different scales and ensures accurate and valid fitting of the simulations by comparing the obtained patterns with the observed patterns. This process measures the percentage of similarity, which means how closely the simulated map matches the observed map. The minimum and maximum similarity percentages represent the lowest and highest possible degree of agreement between the two, providing a range for model validation. A similarity percentage of 50% or more between the simulated and actual patterns indicates a good model fit [51]. For a more detailed explanation of the methodology, see [50]. The validation model was performed in 2018, and its results are presented in Appendix B.
For InVEST modeling, the trend and pessimistic scenarios were combined with the climate scenarios. The trend scenario was combined with the RCP 4.5 scenario, and the pessimistic scenario was used in conjunction with the RCP 8.5 scenario.

2.3.7. Biophysical Table

A biophysical table (Table 2) was created in text format (.csv) presenting the following attributes: Id, LULC classes, presence of vegetation (1 corresponds to the presence of vegetation and 0 without vegetation), evapotranspiration coefficient (Kc) and root depth. The LULC classes were developed by [24], the evapotranspiration coefficient was determined by [47], and the depth of the roots was determined from the previously presented cover and land use data.

2.3.8. Z-Parameter

The Z-parameter, which captures the local precipitation pattern, whose values range between 1 and 30, was taken from the literature [52]. This value was 7.33. This value within the model is used in Equation (4), as described previously.

2.4. Sensitivity Analysis

The model’s sensitivity was assessed by varying different parameters according to the methods proposed in the literature [23,25,53], involving adjustments to various model parameters. For our study, each of the rasters used as inputs to the model was varied by ±10% and ±20%, allowing the comparison of five scenarios: scenario 1 (Variation −20%), scenario 2 (Variation −10%), scenario 3 (no variation), scenario 4 (variation +10%), and scenario 5 (variation +20%). The sensitivity analysis was carried out in 2018.

3. Results and Discussion

3.1. Variation in the Rainfall

As shown in Figure 2a–i, higher rainfall amounts are observed in the upper part of the study zone. In addition, in the base period, it is observed that the amount of rainfall is lower in 2016 compared with 2014 and then increases in 2018, which may be due to the large amounts of rainfall in these periods [54] and the humidity arises from transpiration the Amazon forests, which are transported by air masses from the Amazon basin and carried to the paramos in southern Ecuador [55]. Furthermore, it can be seen that in the two scenarios (RCP 4.5 and 8.5), the RCP 8.5 scenario is the one with the highest precipitation values.

3.2. Evolution of Land Use and Land Cover

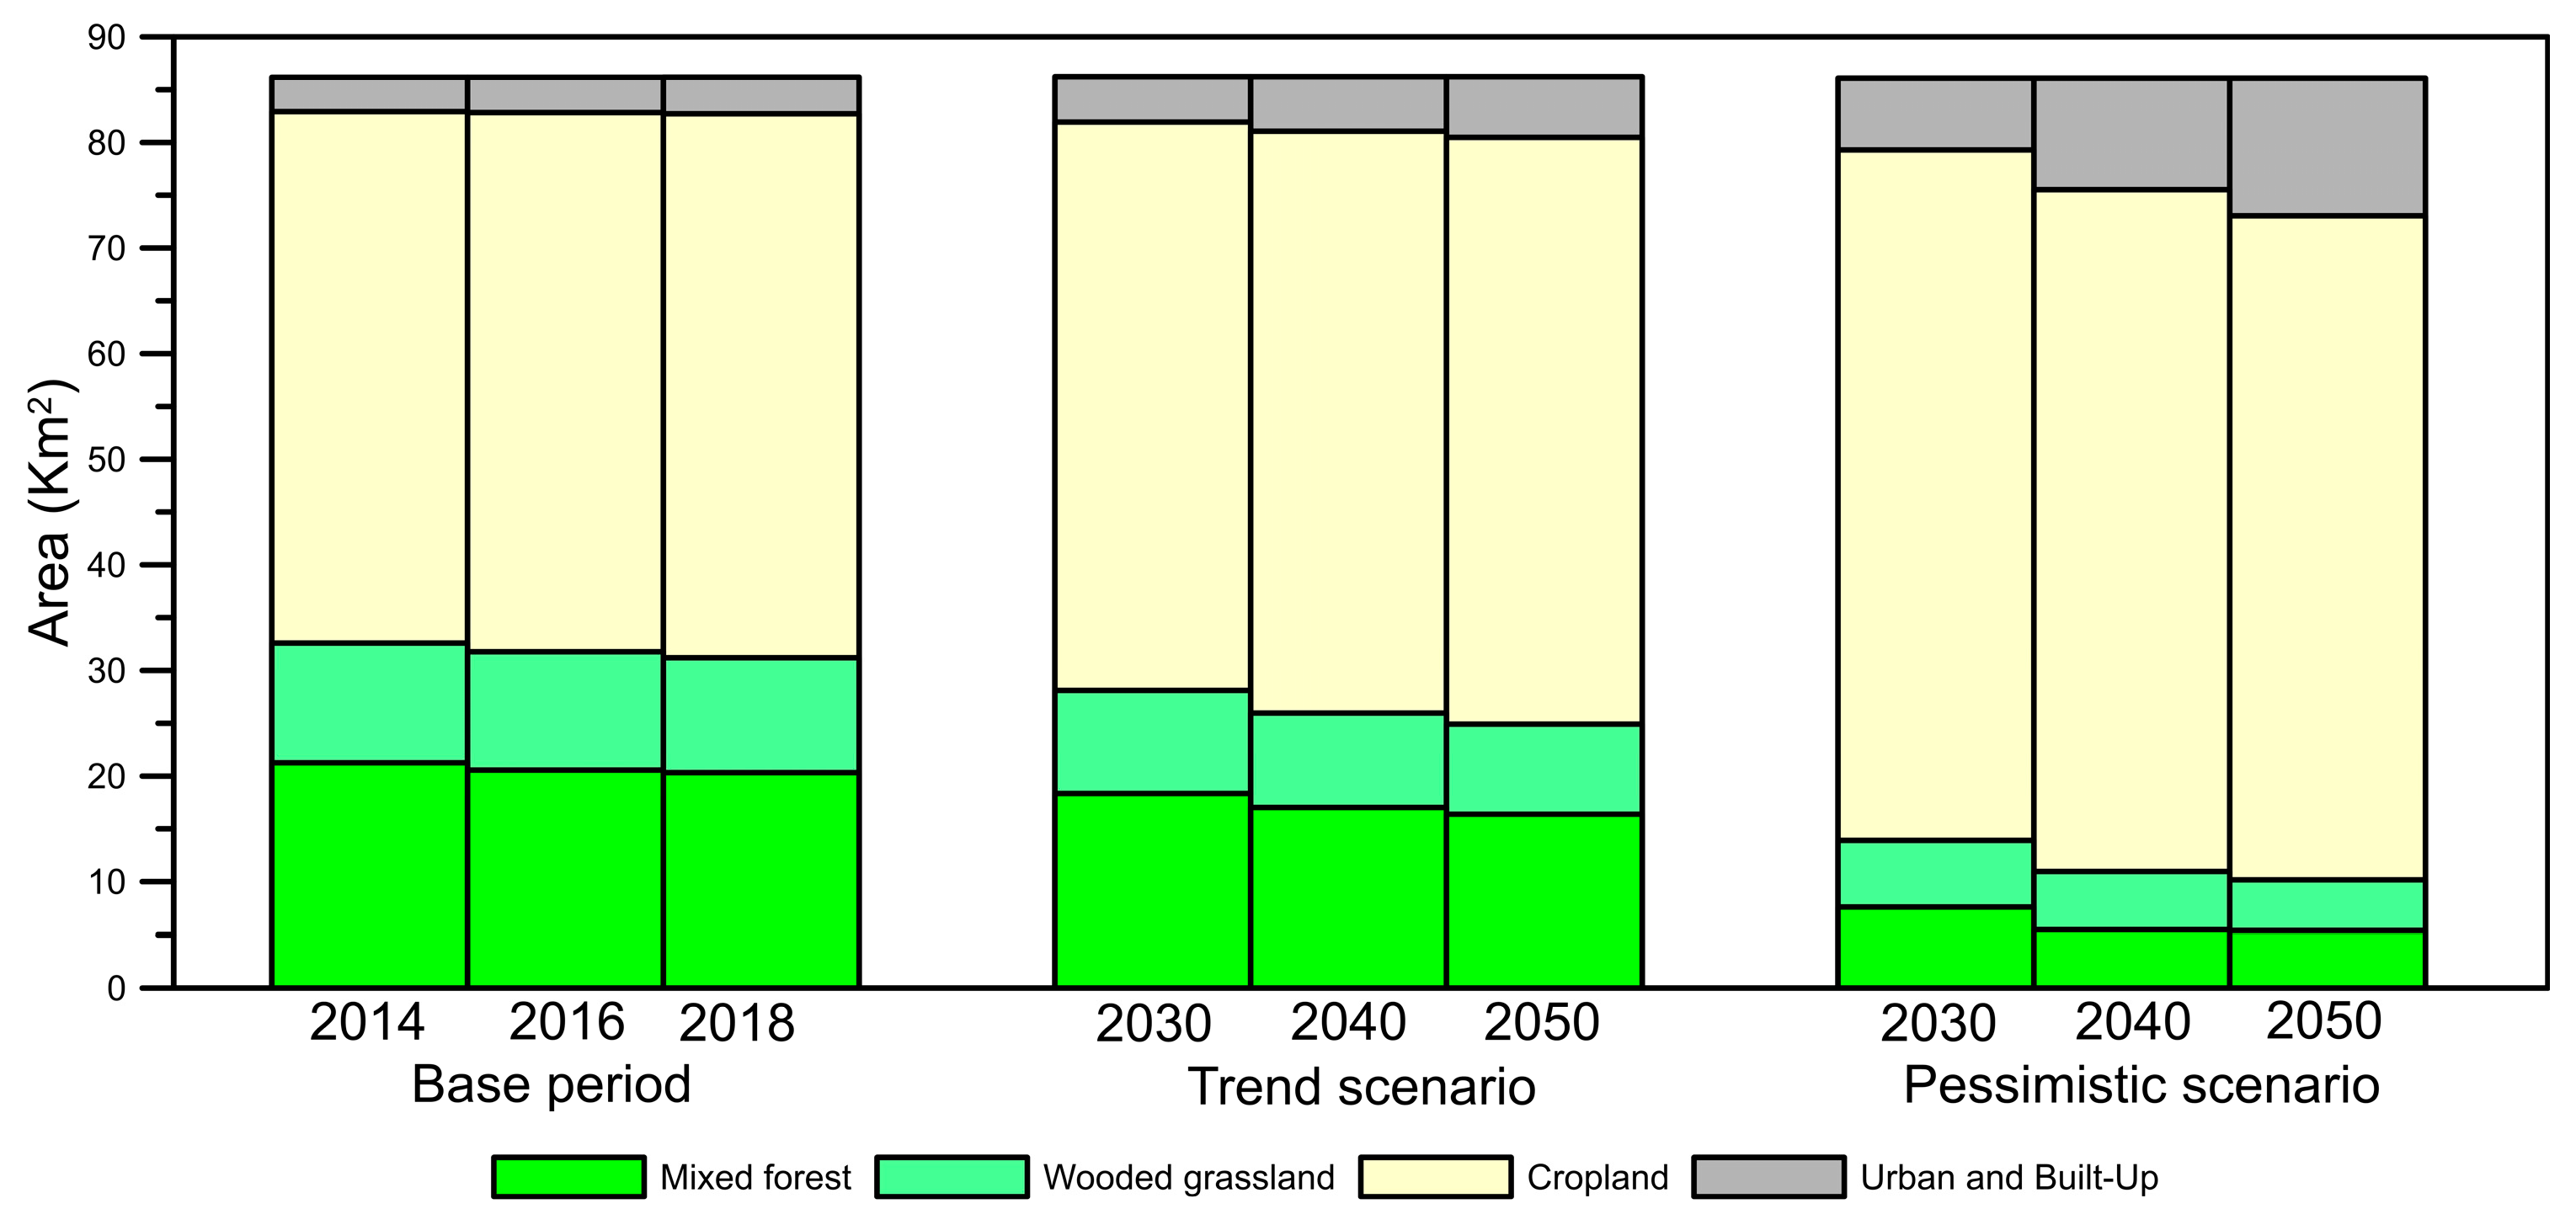
As shown in Table 3 and Table 4 and Figure 2 and Figure 4, land cover and land use in the study area changed from the base period (2014) to 2018. As for forests, the area they covered decreased by 4.4% from 2014 to 2018. Urban regions recorded an increase of 7% compared with the base period. The areas earmarked for cultivation recorded a rise of 2.3%. In contrast, the water area experienced a decline of 9.4% and 15.6% in 2016 and 2018, respectively.
Let us compare the trend and pessimistic scenarios. We can find that the pessimistic scenario has the most considerable changes in land cover and use, with the increase in area of urban areas being the highest. By 2030, the urban area will almost double compared with 2018, and by 2050, the area will nearly triple. For the years 2030, 2040, and 2050, there was a significant decrease in forested grassland areas of 42.1%, 49.6%, and 56.2%. The areas earmarked for cultivation have increased compared with 2018. However, since 2030 is the year with the highest growth rate (27%), the growth rate starts to decrease after this year. Finally, the forests are experiencing the most significant decline in their area, namely by 62.6% by 2030 and 73.4% by 2050 compared with 2018.
Although this increase in the area dedicated to cultivation suggests that it could help ensure the food sovereignty of the area’s residents in the future, several studies indicate that the conversion of forests to agricultural land will lead to modify their productivity [56,57] and changes in their physical and hydraulic properties that make them drier [32,58].

3.3. Annual Water Yield in the Study Zone

The InVEST model with the water yield module was used to determine water production in three current periods (2014, 2016, and 2018), future climate change scenarios (RCP 4.5 and 8.5), and future coverage and land use scenarios (trend and pessimistic). The model’s only limitation is that it is impossible to perform seasonal analysis because it uses annual values for estimation.
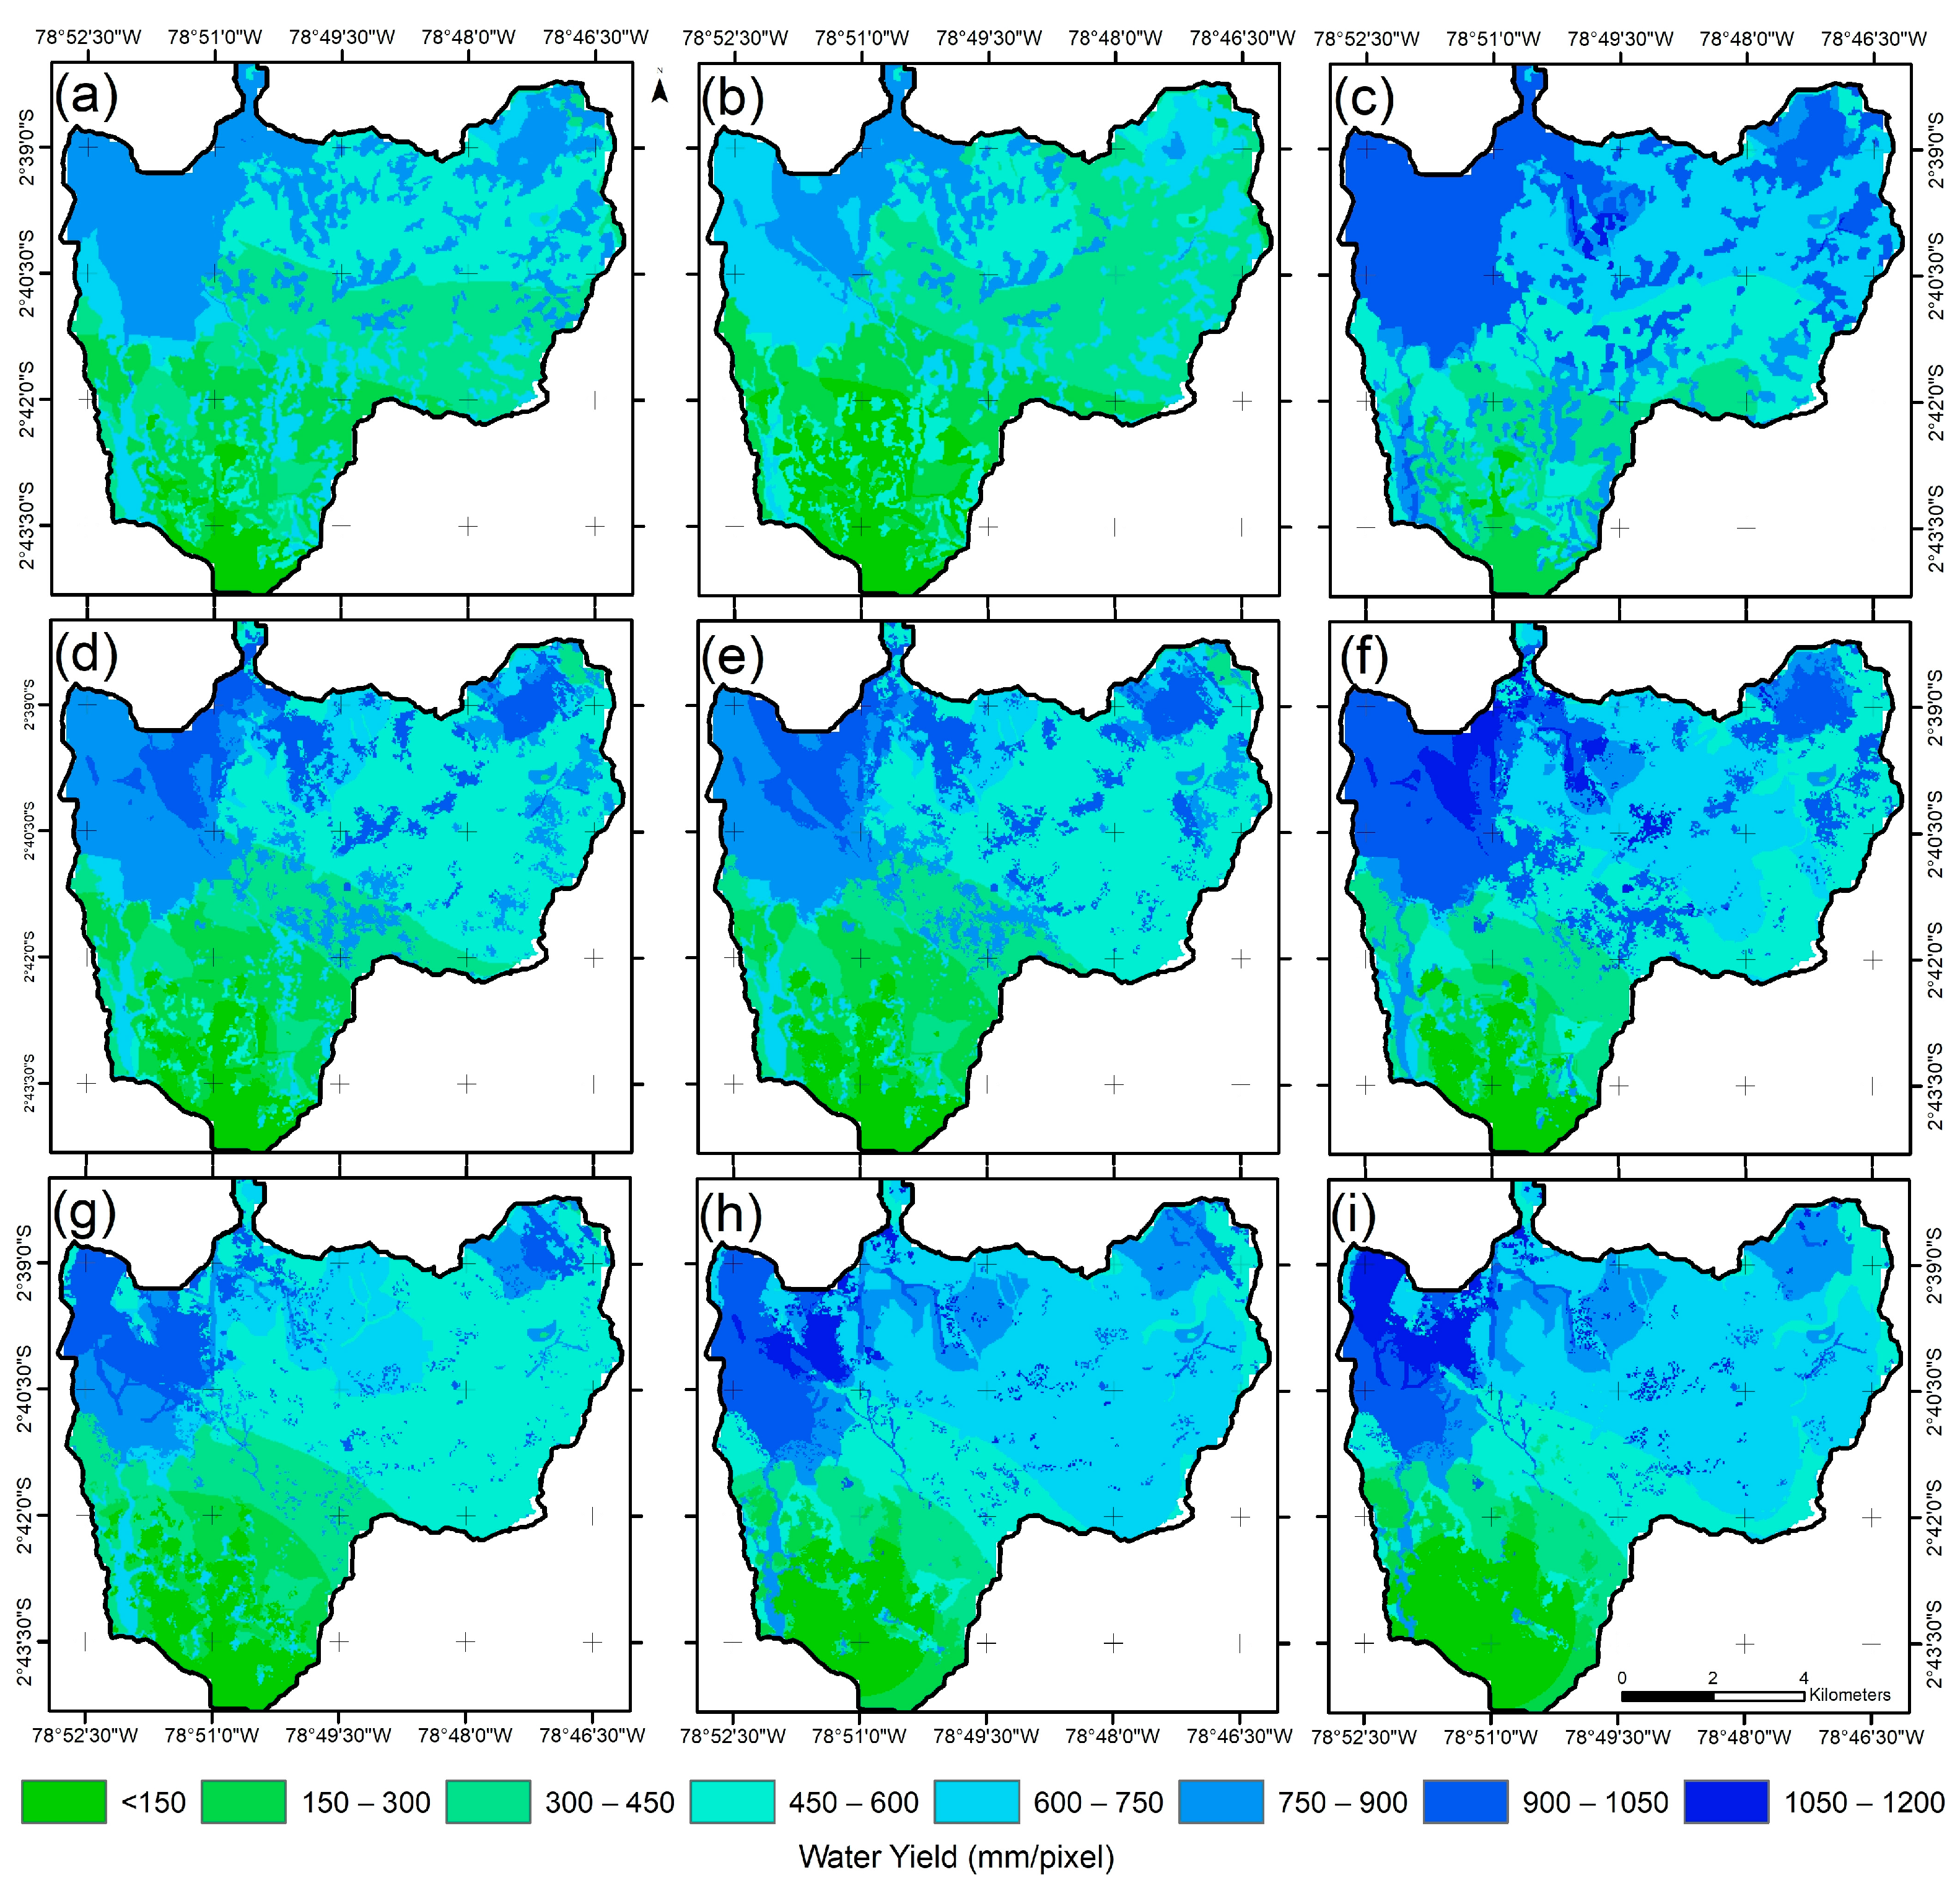
As shown in Figure 5, the study area exhibits fluctuations in water yield in different periods. Although the region’s rainfall determines the water available, the land’s use and coverage determine the water yield. Significant changes in land cover and land use can affect, among other things, the hydrological systems of evaporation, transpiration, and water retention [53,59] and thus affect the water yield of a catchment. For this reason, the water yield module of the InVEST model estimates its water availability in each pixel as precipitation − actual evapotranspiration, which depends on cover and land use.
In addition to water yield, maintaining or increasing forest areas will benefit other ecosystem services (including carbon sequestration and diversity maintenance). Within the areas covered with forests is the Cubilán Protective Forest, where, in addition to providing various ecosystem services [60], sites with more outstanding water production are emerging, which is why it is necessary to carry out efforts between residents and government bodies for the protection of this area, which is responsible, among other things, for the production of water that supplies the city of Azogues (lower part of the Aguilán and Tabacay sub-basins).
On the other hand, in the current period (2014–2018), the coverage and land use that produces a lower amount of water are those destined for agriculture (Figure 7a). The lowest values of water yield in this area are less than 300 mm per year. These results are consistent with studies conducted in China by [61,62], where changes in land use, particularly in agricultural land, impact water yield due to increased evapotranspiration. Similarly, the study by [63] developed in the USA indicates that agricultural lands have lower water yields than forests, such as in our study area.
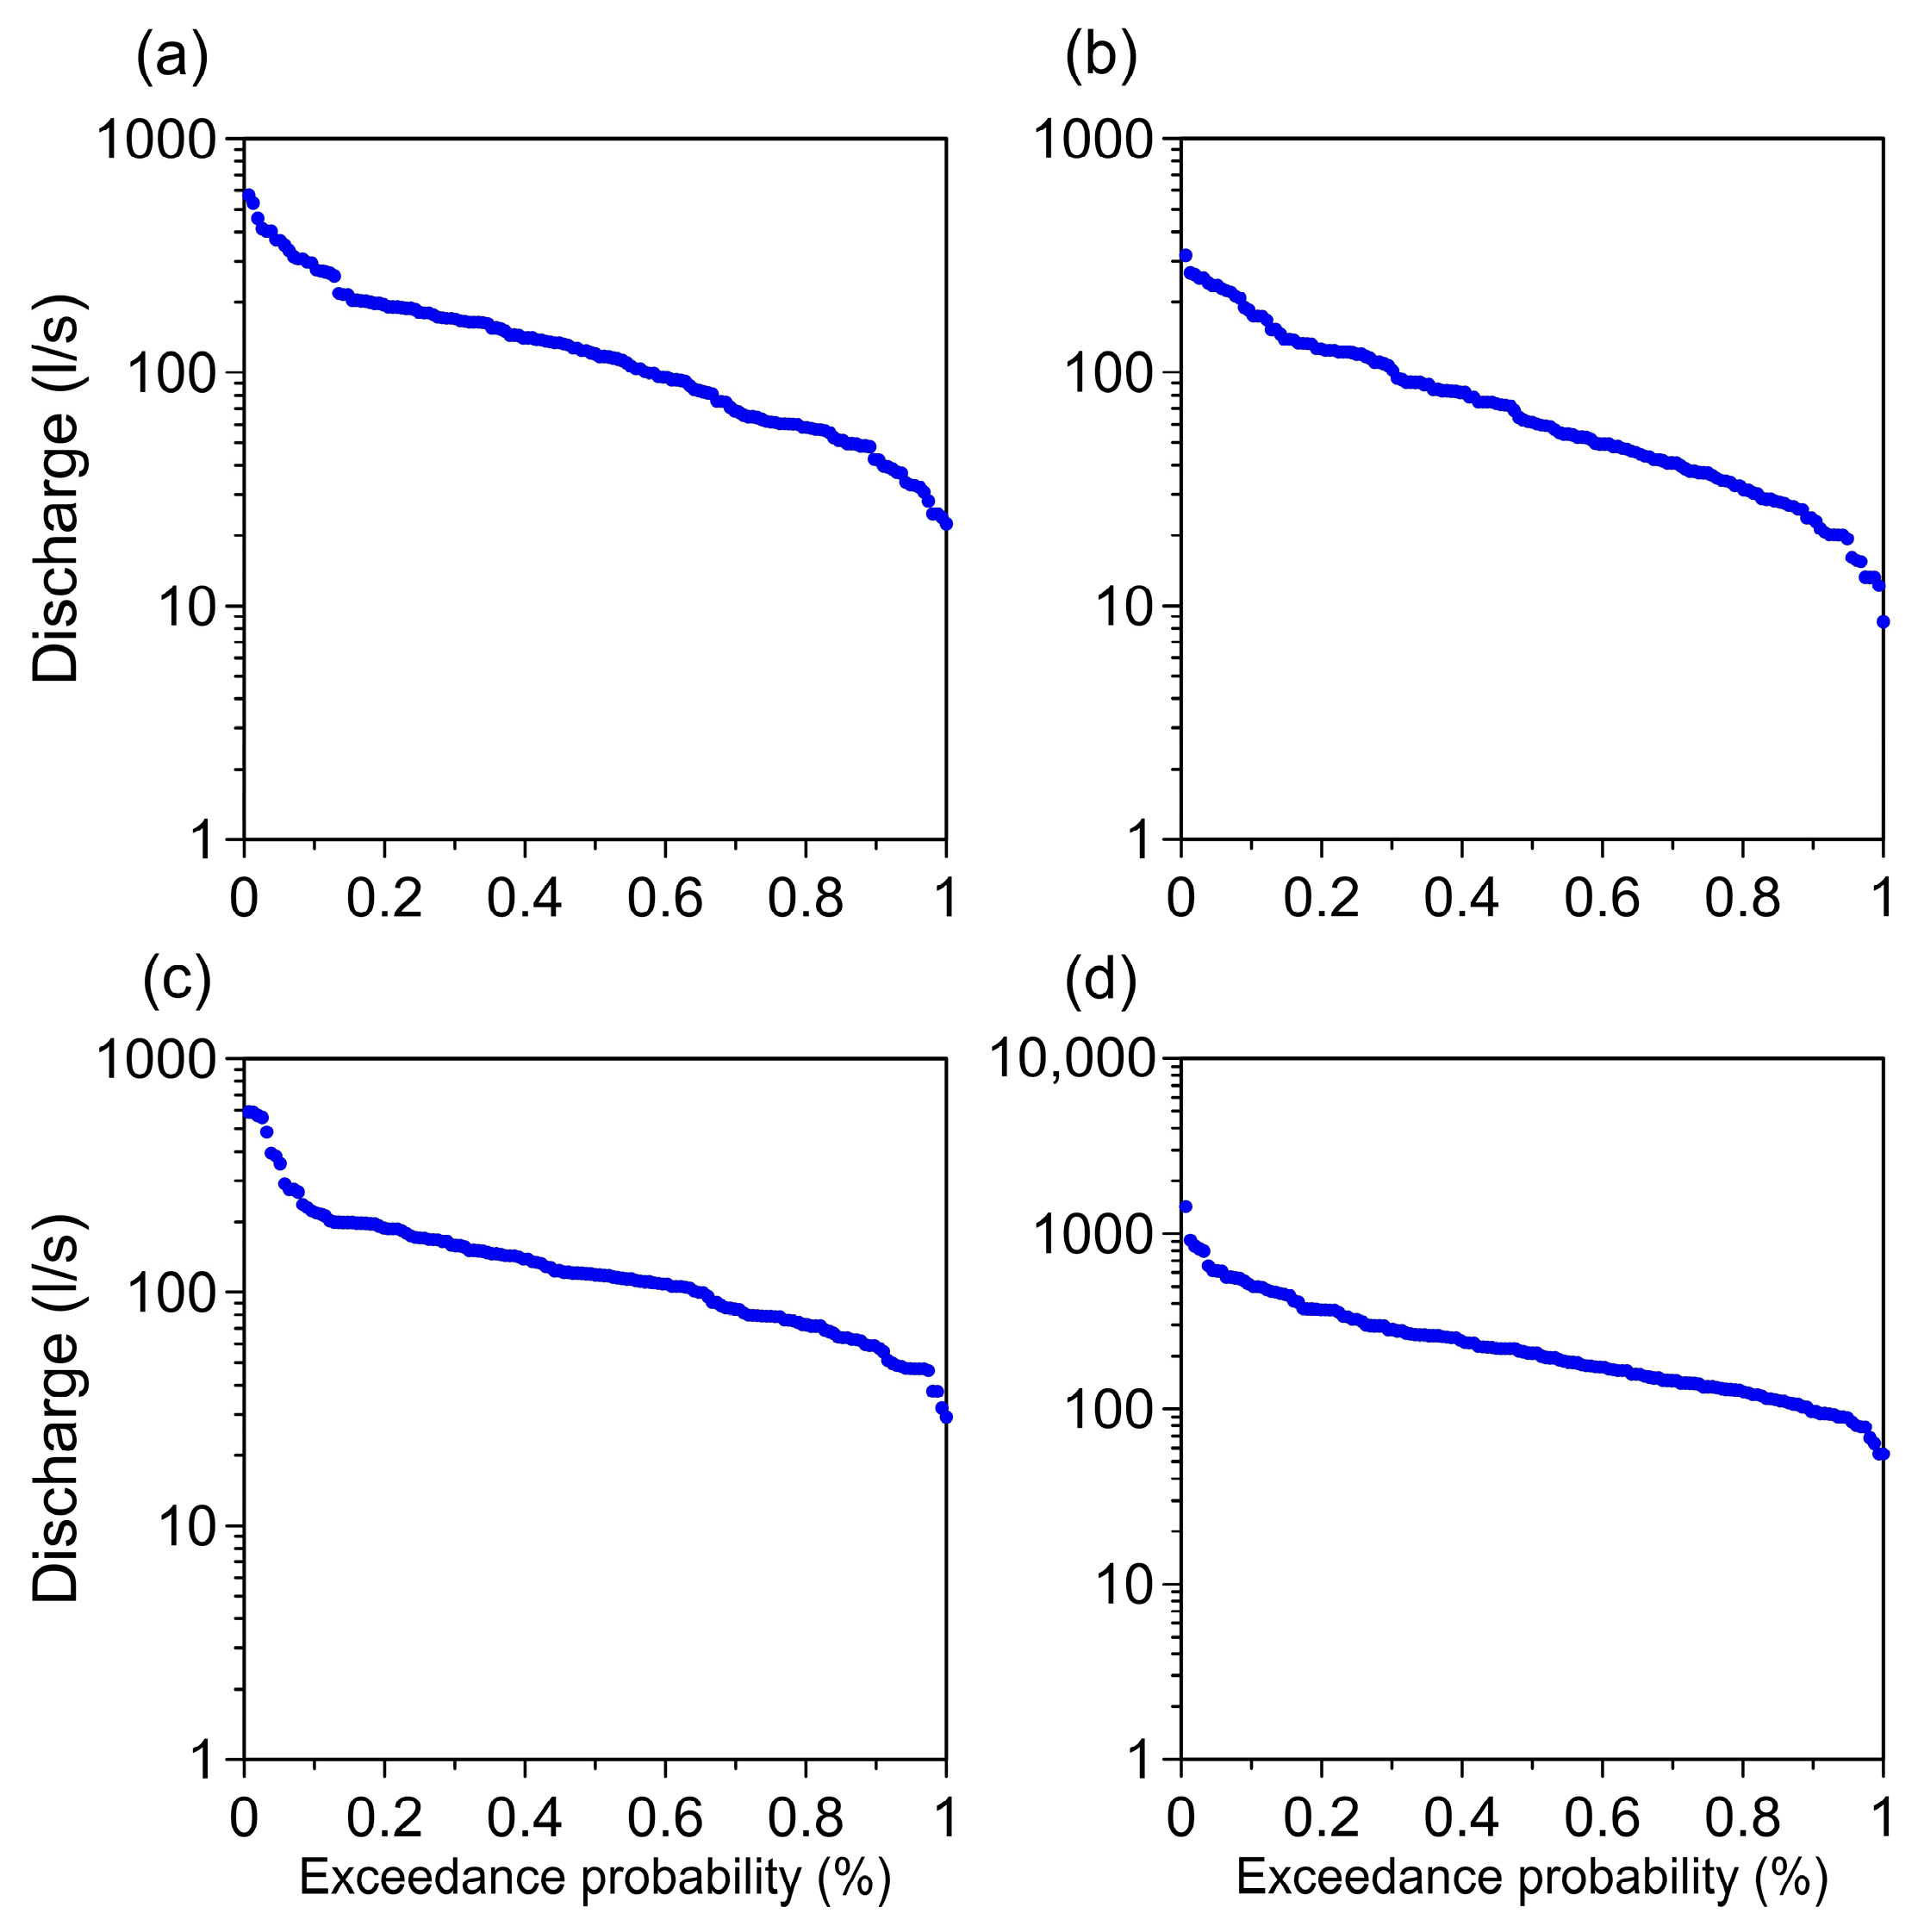
Changes or removal of vegetation cover to develop these activities can affect the water cycle by altering evapotranspiration and soil properties, resulting in drier soils [32]. Approximately 60% of the total area of the catchment is dedicated to agricultural and urban areas, which causes the catchments to lose their ability to regulate water, as stated in the literature [64]. In the same way, this can be demonstrated by analyzing the historical records of some streamflows in the area where the flow duration curve (FDC—Figure 6) is more pronounced, which is consistent with studies that analyzed the effects of land use changes [64,65]. These changes in land use and cover would impact water availability. However, they would also allow catchments to respond more quickly to rainfall events with higher and faster runoff, resulting in flooding in the lower-lying parts of the study area.
The areas with the highest water yield values were those covered with mixed forest and wooded grassland. Our results are consistent with the study by [66] which stated that forest cover is inextricably linked to rainfall, which increases the probability of rainfall events and increases water yield, and the study by [67] developed in New Zeeland, where tussock grasslands can maximize water yield compared with other vegetation cover types. Similarly, a study in the United States created by [63] found that forest covers also have higher water yields. When plotting these covers, the maximum values were 898 and 908 mm in specific locations for 2014, the maximum values were close to 891 and 857 mm for 2016, and there was more than 1000 mm of water yield in certain areas (Figure 7b,c) for 2018. During this period, there was a significant increase in water yield in various regions.
Although it can be seen that in 2018 (Figure 7a), water yield increased in some agricultural areas, this increase in water yield may lead to a deterioration in water quality [68]. This fact leads to more significant salt movement and leaching of fertilizers used in these areas. For this reason, future studies are necessary to analyze the water quantity and quality.
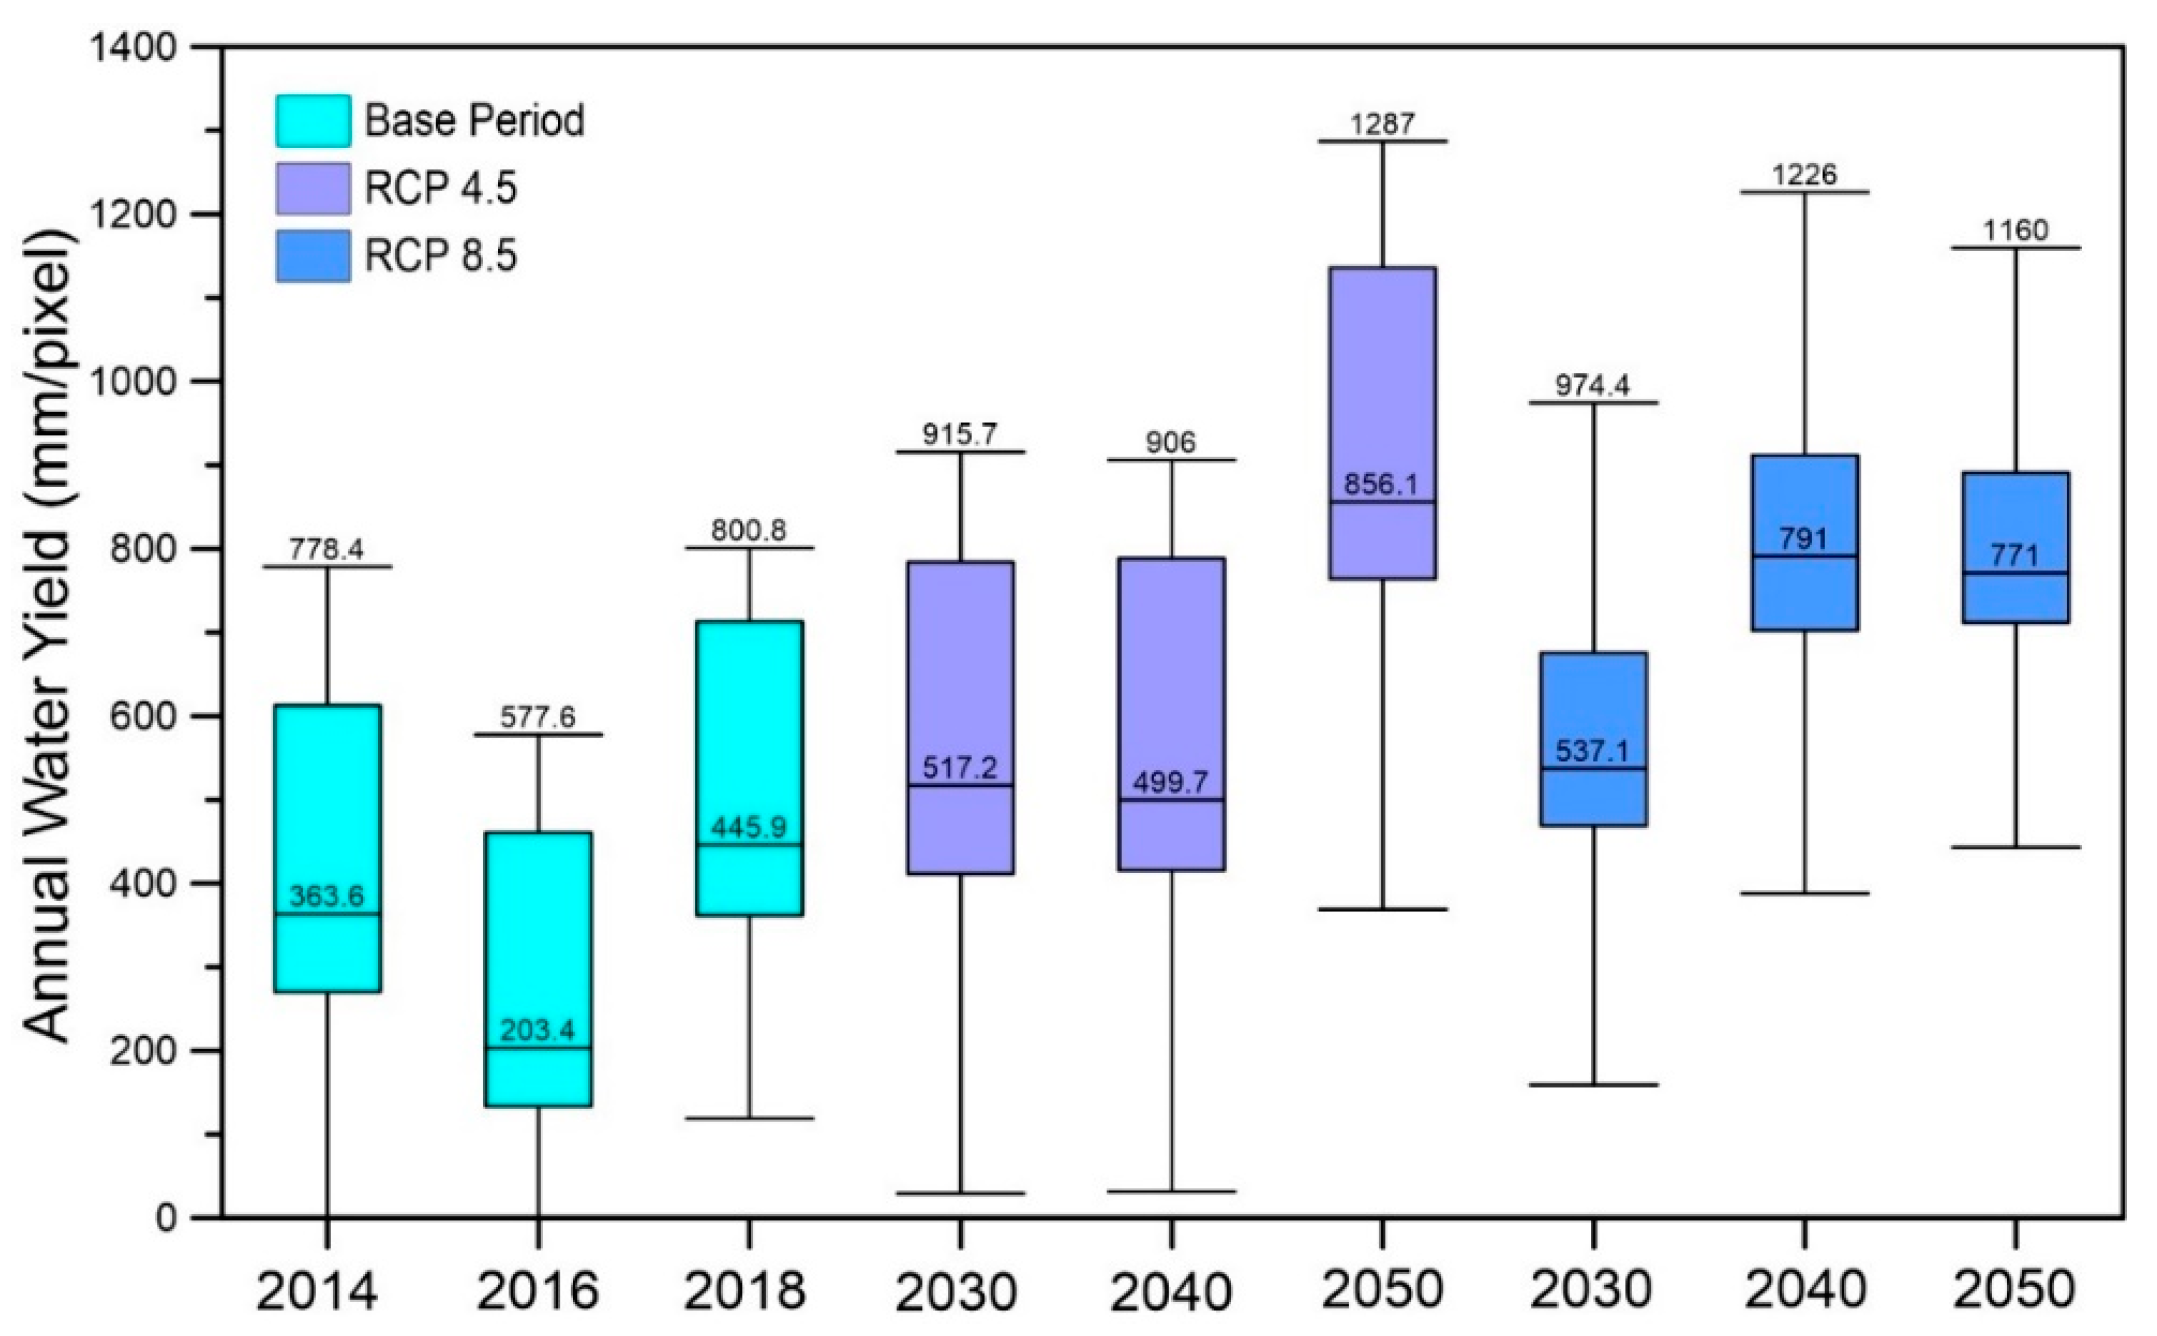
If we compare the current water yield with the future in the study area (Figure 8), it can be seen that water yield in the Tabacay and Aguilán sub-basins will increase in the future. This behavior may be because climate extremes will increase in the future, as indicated in the literature [69]. Still, it must be considered that an increase in the amount of water can lead to a deterioration in water quality [68]. The annual water yield in the RCP 4.5 and RCP 8.5 scenarios shows fluctuations compared with the base period. Both scenarios indicate an overall increase in water yield over time; however, the RCP 8.5 scenario generally results in a higher average water yield than the RCP 4.5 scenario. An exception occurs in 2050, where the RCP 4.5 scenario is higher.

3.4. Sensitivity Analysis

As shown in Figure 9, according to the sensitivity analysis, precipitation (Figure 9a) shows an apparent increase and decrease in the maximum and minimum water yield values with a variation of ±20%. In evapotranspiration (Figure 9b), there is no fluctuation in water yield maximum values, but there are fluctuations in water yield minimum values, which are not as noticeable as fluctuating precipitation. Since the evapotranspiration is obtained from temperature, it could indicate the model is not sensitive to temperature changes. Some studies have attempted to assess the response of water yield to precipitation and temperature, finding greater sensitivity to precipitation [6,70,71], consistent with that found in our study. No significant changes were observed in the other parameters (Figure 9c–e), which is consistent with previous findings in the literature [25,72].

3.5. Validation of the Obtained Annual Water Yield

The Catholic University of Cuenca and EMAPAL-EP carry out specific monthly flow measurements in different streams within the study area. These observations were used to compare the results of the modeling. However, as can generally be seen, using the InVEST software V3.14.0 (Table 5), the modeling tends to overestimate the observed discharge. There is only a slight coincidence in the Mapayacu discharge.
These differences can be attributed to the absence of some data in the modeling process that were not considered due to lack of access to them, such as water extractions and losses within the basin, as well as the presence of water-dependent activities such as fish farming and livestock watering, which influence the variation in river flow. These activities may impact water availability in the study area by diverting water flows for purposes not accounted for in the InVEST model. Something similar happened in the study by [29] in which, after evaluating 749 basins in five bioclimatic regions of North America, it was found that the correlation between the observed and modeled rivers was highly dispersed and relatively poor due to missing modeling considerations.
It is crucial to emphasize that the InVEST model plays a prominent role in environments with limitations in data availability [73], serving as a preliminary guiding tool. The initial use of the model allows for subsequent integration of more detailed data and additional considerations, essential for achieving a more accurate assessment of water flows in the catchment. Similar conclusions were reached in the studies by [74,75], where the InVEST model contributes to a general understanding of the hydrological patterns from the watershed due to the limited data availability and leaves the field of study open for complex modeling if more detailed data sets are available.

3.6. Public Policies and Decision Making

The water yield in 2018 increased compared with 2016 and 2018. This behavior may be due to the measures to protect water sources carried out by the EMAPAL-EP in conjunction with the Municipal Ordinance [76]. For instance, the Reciprocal Water Agreements (ARAs) serve as strategies to conserve and restore forests and provide technical and financial assistance to upland landowners. These initiatives have reduced agricultural land expansion, preserved natural areas, and improved productivity through targeted training.
The Tabacay and Aguilán sub-basin’s water yield estimations would serve so decision-makers can set guidelines for caring for water-relevant areas. However, this is a crucial and complex challenge [77]. Conservation measures and policies focusing on a particular environmental service may endanger and degrade other environmental services [78]. This fact represents a challenge to improve hydro-ecological measurement systems to improve the accuracy of the models and make better decisions. However, for places where data availability is limited, the InVEST model has proven to be sufficient [79].

4. Conclusions

Our study aimed to determine the changes in water yield of two Andean sub-basins in southern Ecuador under climate change scenarios (RCP 4.5 and 8.5) and consider two future scenarios of land use and land cover. The results show water yield fluctuations in various years. The year 2016 had the lowest water yield in the base period. This behavior may be due to changes in land use and land cover in the study area. The highest water yield occurs in the upper part of the basins and, to a greater extent, in the Cubilán Protected Forest, which, in addition to providing various ecosystem services, also produces large amounts of water. It was observed that, in terms of coverage, cropland presents the lowest water yield compared with mixed forest coverage in both the trend and pessimistic scenarios. However, there has been an increase in water yield from 2016 to 2018. This increment may be due to the protection and conservation measures carried out in the study area by the EMAPAL-EP with its ARAs initiative.
Given the effects of climate change, the study area will experience higher water yield rates. However, when comparing both climate scenarios, the RCP 8.5 scenario will have higher water yield rates. These results suggest that future adaptation measures will be required to protect critical areas, ensure water security, and improve the resilience of watersheds in climate-extreme scenarios.
Although not enough data are available to validate the model’s results, this study provides knowledge for delineating water-relevant areas and continuing or creating new research for their protection and conservation.

Author Contributions

Conceptualization, D.X.Z., A.A. (Alex Avilés), L.G. and A.A. (Ana Astudillo); methodology, D.X.Z.; software, D.X.Z. and L.G.; validation, D.X.Z., L.G., A.A. (Ana Astudillo) and J.A.; formal analysis, D.X.Z.; investigation, D.X.Z., A.A. (Alex Avilés), L.G., A.A. (Ana Astudillo), J.A. and C.M.; resources, D.X.Z., A.A. (Alex Avilés), L.G., A.A. (Ana Astudillo), J.A. and C.M.; data curation, D.X.Z. and L.G.; writing—original draft preparation, D.X.Z. and A.A. (Alex Avilés); writing—review and editing, D.X.Z., A.A. (Alex Avilés) and L.G.; visualization, D.X.Z. and A.A. (Alex Avilés); supervision, A.A. (Alex Avilés); project administration, A.A. (Alex Avilés), A.A. (Ana Astudillo) and J.A.; funding acquisition, A.A. (Alex Avilés). All authors have read and agreed to the published version of the manuscript.

Funding

This research received no external funding.

Data Availability Statement

The datasets used in the current study are not publicly available and must be requested from the Catholic University of Cuenca, EMAPAL-EP, and MAATE.

Acknowledgments

The authors thank the Dirección de Vinculación and Vicerrectorado de Investigación de la Universidad de Cuenca and the EMAPAL EP for the support provided to the project “Seguridad Hídrica de la subcuenca del río Tabacay en tiempos de cambios globales”. We thank the Catholic University of Cuenca, EMAPAL-EP, and MAATE for providing this work’s hydrometeorological and climate data.

Conflicts of Interest

The authors declare no conflicts of interest.

Appendix A

Data correction using the QDM method for precipitation (A1) and temperature (A2) for RCP 4.5 and 8.5 scenarios.
Hydrology 11 00157 g0a1

Appendix B

Validation of Dinamica Ego, (B1) land cover observed, (B2) land cover simulated, and (B3) similarity.
Hydrology 11 00157 g0a2

References

  1. Maes, J.; Crossman, N.D.; Burkhard, B. Mapping ecosystem services. In Routledge Handbook of Ecosystem Services; Routledge: London, UK, 2017; p. 23. ISBN 978-954-642-829-5. [Google Scholar] [CrossRef]
  2. Vaughn, C.C. Ecosystem services provided by freshwater mussels. Hydrobiologia 2017, 810, 15–27. [Google Scholar] [CrossRef]
  3. Daily, G.C. Introduction: What are ecosystem services? In Nature’s Services: Societal Dependence on Natural Ecosystems, 1st ed.; Island Press: Washington, DC, USA, 1997; pp. 1–10. ISBN 1-55963-475-8. Available online: https://islandpress.org/books/natures-services#desc (accessed on 31 August 2024).
  4. Cudennec, C.; Leduc, C.; Koutsoyiannis, D. Dryland hydrology in Mediterranean regions—A review. Hydrol. Sci. J. 2007, 52, 1077–1087. [Google Scholar] [CrossRef]
  5. Van Reeth, W. Ecosystem Service Indicators. In Ecosystem Services; Elsevier: Amsterdam, The Netherlands, 2013; pp. 41–61. [Google Scholar]
  6. Pessacg, N.; Flaherty, S.; Brandizi, L.; Solman, S.; Pascual, M. Getting water right: A case study in water yield modelling based on precipitation data. Sci. Total Environ. 2015, 537, 225–234. [Google Scholar] [CrossRef] [PubMed]
  7. Rohatyn, S. Differential Impacts of Land Use and Precipitation on “Ecosystem Water Yield”. Water Resour. Res. 2018, 54, 5457–5470. [Google Scholar] [CrossRef]
  8. Aber, J.D.; Ollinger, S.V.; Federer, C.A.; Reich, P.B.; Goulden, M.L.; Kicklighter, D.W.; Melillo, J.M.; Lathrop, R.G., Jr. Predicting the effects of climate change on water yield and forest production in the northeastern United States. Clim. Res. 1995, 5, 207–222. [Google Scholar] [CrossRef]
  9. Zhang, L.; Cheng, L.; Chiew, F.; Fu, B. ScienceDirect Understanding the impacts of climate and landuse change on water yield. Curr. Opin. Environ. Sustain. 2018, 33, 167–174. [Google Scholar] [CrossRef]
  10. Li, Y.; Piao, S.; Li, L.Z.X.; Chen, A.; Wang, X.; Ciais, P.; Huang, L.; Lian, X.; Peng, S.; Zeng, Z.; et al. Divergent hydrological response to large-scale afforestation and vegetation greening in China. Sci. Adv. 2018, 4, eaar4182. [Google Scholar] [CrossRef]
  11. Sahin, V.; Hall, M.J. The effects of afforestation and deforestation on water yields. J. Hydrol. 1996, 178, 293–309. [Google Scholar] [CrossRef]
  12. Foley, J.A.; DeFries, R.; Asner, G.P.; Barford, C.; Bonan, G.; Carpenter, S.R.; Chapin, F.S.; Coe, M.T.; Daily, G.C.; Gibbs, H.K.; et al. Global consequences of land use. Science 2005, 309, 570–574. [Google Scholar] [CrossRef]
  13. Schröeter, D.; Cramer, W.; Leemans, R.; Prentice, I.C.; Araújo, M.B.; Arnell, N.W.; Bondeau, A.; Bugmann, H.; Carter, T.R.; Gracia, C.A.; et al. Europe Ecosystem Service Supply and Vulnerability to Global Change in Europe. Science 2005, 310, 1333–1337. [Google Scholar] [CrossRef]
  14. Baker, T.J.; Miller, S.N. Using the Soil and Water Assessment Tool (SWAT) to assess land use impact on water resources in an East African watershed. J. Hydrol. 2013, 486, 100–111. [Google Scholar] [CrossRef]
  15. McFarlane, D.; Stone, R.; Martens, S.; Thomas, J.; Silberstein, R.; Ali, R.; Hodgson, G. Climate change impacts on water yields and demands in south-western Australia. J. Hydrol. 2012, 475, 488–498. [Google Scholar] [CrossRef]
  16. Blöschl, G.; Sivapalan, M. Scale issues in hydrological modelling: A review. Hydrol. Process. 1995, 9, 251–290. [Google Scholar] [CrossRef]
  17. Bergström, S. Principles and Confidence in Hydrological Modelling. Hydrol. Res. 1991, 22, 123–136. [Google Scholar] [CrossRef]
  18. Zhang, C.; Li, W.; Zhang, B.; Liu, M. Water Yield of Xitiaoxi River Basin Based on InVEST Modeling. J. Resour. Ecol. 2012, 3, 50–54. [Google Scholar]
  19. Arnold, J.G.; Moriasi, D.N.; Gassman, P.W.; White, M.J. SWAT: Model use, calibration, and validation. Trans. ASABE 2012, 55, 1491–1508. [Google Scholar] [CrossRef]
  20. Beven, K.J.; Kirkby, M.J.; Freer, J.E.; Lamb, R. A history of TOPMODEL. Hydrol. Earth Syst. Sci. 2021, 25, 527–549. [Google Scholar] [CrossRef]
  21. Hamman, J.J.; Nijssen, B.; Bohn, T.J.; Gergel, D.R.; Mao, Y. The Variable Infiltration Capacity model version 5 (VIC-5): Infrastructure improvements for new applications and reproducibility. Geosci. Model Dev. 2018, 11, 3481–3496. [Google Scholar] [CrossRef]
  22. Ceroni, M. ARIES (Artificial Intelligence for Ecosystem Services): A new tool for ecosystem services assessment, planning, and valuation. In Proceedings of the 11th Annual BIOECON Conference on Economic Instruments to Enhance the Conservation and Sustainable Use of Biodiversity, Venice, Italy, 21 September 2009. [Google Scholar]
  23. Hamel, P.; Guswa, A.J. Uncertainty analysis of a spatially explicit annual water-balance model: Case study of the Cape Fear basin, North Carolina. Hydrol. Earth Syst. Sci. 2015, 19, 839–853. [Google Scholar] [CrossRef]
  24. Sharp, J.; Tallis, R.; Ricketts, H.T.; Guerry, T.; Wood, A.D.; Chaplin Ennaanay, S.A.; Wolny, D.; Olwero, S.; Kramer, N.; Nelson, R.; et al. InVEST 3.2.0 User’s Guide; Stanford University: Stanford, CA, USA; University of Minnesota: Minneapolis, MN, USA; The Nature Conservancy: Arlington, VA, USA; World Wildlife Fund: Gland, Switzerland, 2018. [Google Scholar]
  25. Redhead, J.W.; Stratford, C.; Sharps, K.; Jones, L.; Ziv, G.; Clarke, D.; Oliver, T.; Bullock, J. Empirical validation of the InVEST water yield ecosystem service model at a national scale. Sci. Total Environ. 2016, 569–570, 1418–1426. [Google Scholar] [CrossRef]
  26. Fu, Q.; Li, B.; Hou, Y.; Bi, X.; Zhang, X. Effects of land use and climate change on ecosystem services in Central Asia’s arid regions: A case study in Altay Prefecture, China. Sci. Total Environ. 2017, 607–608, 633–646. [Google Scholar] [CrossRef] [PubMed]
  27. Wei, P.; Chen, S.; Wu, M.; Deng, Y.; Xu, H.; Jia, Y.; Liu, F. Using the invest model to assess the impacts of climate and land use changes on water yield in the upstream regions of the shule river basin. Water 2021, 13, 1250. [Google Scholar] [CrossRef]
  28. Kim, S.W.; Jung, Y.Y. Application of the InVEST model to quantify the water yield of North Korean forests. Forests 2020, 11, 804. [Google Scholar] [CrossRef]
  29. Scordo, F.; Lavender, T.M.; Seitz, C.; Perillo, V.L.; Rusak, J.A.; Piccolo, M.C.; Perillo, G.M.E. Modeling Water Yield: Assessing the role of site and region-specific attributes in determining model performance of the InVEST Seasonal Water Yield Model. Water 2018, 10, 1496. [Google Scholar] [CrossRef]
  30. Benra, F.; De Frutos, A.; Gaglio, M.; Álvarez-Garretón, C.; Felipe-Lucia, M.; Bonn, A. Mapping water ecosystem services: Evaluating InVEST model predictions in data scarce regions. Environ. Model. Softw. 2021, 138, 104982. [Google Scholar] [CrossRef]
  31. Minga-León, S.; Gómez-Albores, M.A.; Bâ, K.M.; Balcázar, L.; Manzano-Solís, L.R.; Cuervo-Robayo, A.P.; Mastachi-Loza, C.A. Estimation of water yield in the hydrographic basins of southern Ecuador. Hydrol. Earth Syst. Sci. 2018, 2018, 1–18. [Google Scholar]
  32. Buytaert, W.; Célleri, R.; De Bièvre, B.; Cisneros, F.; Wyseure, G.; Deckers, J.; Hofstede, R. Human impact on the hydrology of the Andean páramos. Earth-Sci. Rev. 2006, 79, 53–72. [Google Scholar] [CrossRef]
  33. Estrella, R.; Cattrysse, D.; Van Orshoven, J. Comparison of Three Ideal Point-Based Multi-Criteria Decision Methods for Afforestation Planning. Forests 2014, 5, 3222–3240. [Google Scholar] [CrossRef]
  34. Budyko, M.I. Climate and Life; Academic Press: Cambridge, MA, USA, 1974. [Google Scholar]
  35. Fu, B.P. On the calculation of the evaporation from land surface. Sci. Atmos. Sin. 1981, 5, 23–31. [Google Scholar]
  36. Zhang, L.; Dawes, W.R.; Walker, G.R. Response of mean annual evapotranspiration to vegetation changes at catchment scale. Water Resour. Res. 2001, 37, 701–708. [Google Scholar] [CrossRef]
  37. Childs, C. Interpolating surfaces in ArcGIS spatial analyst. ArcUser 2004, 3235, 32–35. [Google Scholar]
  38. MAE-PNUD. Tercera Comunicación Nacional del Ecuador a la Convención Marco de las Naciones Unidas sobre Cambio Climático; Ministerio de Ambiente y Agua: Quito, Ecuador, 2017. [Google Scholar]
  39. Armenta, G.; Villa, J.; Jácome, P.S. Proyecciones Climáticas de Precipitación y Temperatura para Ecuador, Bajo Distintos Escenarios de Cambio Climático; [Internet] Quito, Ecuador. 2016. Available online: https://info.undp.org/docs/pdc/Documents/ECU/14 Proyecciones de Clima Futuro para Ecuador en base a IPCC-AR5.pdf (accessed on 31 August 2024).
  40. van Vuuren, D.P.; Edmonds, J.; Kainuma, M.; Riahi, K.; Thomson, A.; Hibbard, K.; Hurtt, G.C.; Kram, T.; Krey, V.; Lamarque, J.-F.; et al. The representative concentration pathways: An overview. Clim. Change 2011, 109, 5. [Google Scholar] [CrossRef]
  41. Zhiña, D.; Avilés, A.; Pacheco, J.; Mendoza, D. Spatiotemporal Features Of Drought Conditions: A Case Study In An Equatorial Andean Basin Using The Spei Index (1982–2015). In Estudios Teórico-Metodológicos en Ciencias Exactas, Tecnológicas y de la Tierra 4; Atena Editora: Ponta Grossa, Brazil, 2024; pp. 50–63. [Google Scholar]
  42. Campozano, L.; Ballari, D.; Montenegro, M.; Avilés, A. Future Meteorological Droughts in Ecuador: Decreasing Trends and Associated Spatio-Temporal Features Derived From CMIP5 Models. Front. Earth Sci. 2020, 8, 17. [Google Scholar] [CrossRef]
  43. Senent-Aparicio, J.; Peñafiel, L.; Alcalá, F.J.; Jimeno-Sáez, P.; Pérez-Sánchez, J. Climate change impacts on renewable groundwater resources in the andosol-dominated Andean highlands, Ecuador. Catena 2024, 236, 107766. [Google Scholar] [CrossRef]
  44. Cannon, A.J.; Sobie, S.R.; Murdock, T.Q. Bias correction of GCM precipitation by quantile mapping: How well do methods preserve changes in quantiles and extremes? J. Clim. 2015, 28, 6938–6959. [Google Scholar] [CrossRef]
  45. Li, C.; Sinha, E.; Horton, D.E.; Diffenbaugh, N.S.; Michalak, A.M. Joint bias correction of temperature and precipitation in climate model simulations. J. Geophys. Res. Atmos. 2014, 119, 13153–13162. [Google Scholar] [CrossRef]
  46. Holdridge, L.R. Simple Method for Determining Potential Evapotranspiration from Temperature Data. Science 1959, 130, 572. [Google Scholar] [CrossRef]
  47. Hengl, T.; De Jesus, J.M.; Heuvelink, G.B.M.; Gonzalez, M.R.; Kilibarda, M.; Blagotić, A.; Shangguan, W.; Wright, M.N.; Geng, X.; Bauer-Marschallinger, B.; et al. SoilGrids250m: Global gridded soil information based on machine learning. PLoS ONE 2017, 12, e0169748. [Google Scholar] [CrossRef]
  48. Martinez, A.; Matovelle-Bustos, C.M.; Astudillo, L. Geographic Information Systems in the protection of water resources in the micro-basin of Tabacay River, Ecuador. Kill. Técnica 2019, 3, 1–10. [Google Scholar]
  49. MAE-MAGAP. Protocolo Metodológico para la Elaboración del Mapa de Cobertura y uso de la Tierra del Ecuador Continental 2013–2014, Escala 1:100000; Ministerio del Ambiente del Ecuador y Ministerio de Agricultura, Ganadería, Acuacultura y Pesca: Quito, Ecuador, 2015. [Google Scholar]
  50. Espinoza-Mendoza, V. Dinámica EGO: Una Herramienta Gratuita para Modelar y Brindar Soporte en el Análisis de CCUS; Maimónides University: Buenos Aires, Argentina, 2017; pp. 1–20. [Google Scholar]
  51. Piontekowski, V.J.; da Silva, S.S.; Mendoza, E.R.H.; Costa, W.L.d.S.; Ribeiro, F.C. Modelagem do desmatamento para o Estado do Acre utilizando o programa DINAMICA EGO. In Proceedings of the 4o Simpósio Geotecnologias no Pantanal, Bonito, MS, Brazil; 2012; pp. 20–24. [Google Scholar]
  52. Xu, X.; Liu, W.; Scanlon, B.R.; Zhang, L.; Pan, M. Local and global factors controlling water-energy balances within the Budyko framework. Geophys. Res. Lett. 2013, 40, 6123–6129. [Google Scholar] [CrossRef]
  53. Sánchez-Canales, M.; Benito, A.L.; Passuello, A.; Terrado, M.; Ziv, G.; Acuña, V.; Schuhmacher, M.; Elorza, F.J. Sensitivity analysis of ecosystem service valuation in a Mediterranean watershed. Sci. Total Environ. 2012, 440, 140–153. [Google Scholar] [CrossRef] [PubMed]
  54. da Silva, R.M.; Lopes, A.G.; Santos, C.A.G. Deforestation and fires in the Brazilian Amazon from 2001 to 2020: Impacts on rainfall variability and land surface temperature. J. Environ. Manag. 2023, 326, 116664. [Google Scholar] [CrossRef] [PubMed]
  55. Zhiña, D.X.; Mosquera, G.M.; Esquivel-Hernández, G.; Córdova, M.; Sánchez-Murillo, R.; Orellana-Alvear, J.; Crespo, P. Hydrometeorological factors controlling the stable isotopic composition of precipitation in the highlands of south Ecuador. J. Hydrometeorol. 2022, 23, 1059–1074. [Google Scholar] [CrossRef]
  56. Zhang, Q.; Ban, Y.; Liu, J.; Hu, Y. Simulation and analysis of urban growth scenarios for the Greater Shanghai Area, China. Comput. Environ. Urban Syst. 2011, 35, 126–139. [Google Scholar] [CrossRef]
  57. Zhang, Q.; Wallace, J.; Deng, X.; Seto, K.C. Central versus local states: Which matters more in affecting China’s urban growth? Land Use Policy 2014, 38, 487–496. [Google Scholar] [CrossRef]
  58. Li, H.; Yao, Y.; Zhang, X.; Zhu, H.; Wei, X. Changes in soil physical and hydraulic properties following the conversion of forest to cropland in the black soil region of Northeast China. Catena 2021, 198, 104986. [Google Scholar] [CrossRef]
  59. Shirmohammadi, B.; Malekian, A.; Salajegheh, A.; Taheri, B.; Azarnivand, H.; Malek, Z.; Verburg, P.H. Impacts of future climate and land use change on water yield in a semiarid basin in Iran. Land Degrad. Dev. 2020, 31, 1252–1264. [Google Scholar] [CrossRef]
  60. Pinos-Morocho, D.; Morales-Matute, O.; Durán-López, M.E. Suelos de páramo: Análisis de percepciones de los servicios ecosistémicos y valoración económica del contenido de carbono en la sierra sureste del Ecuador. Rev. Cienc. Ambient. 2021, 55, 157–179. [Google Scholar] [CrossRef]
  61. Liu, M.; Tian, H.; Chen, G.; Ren, W.; Zhang, C.; Liu, J. Effects of land-use and land-cover change on evapotranspiration and water yield in China during 1900–2000. J. Am. Water Resour. Assoc. 2008, 44, 1193–1207. [Google Scholar] [CrossRef]
  62. Li, S.; Yang, H.; Lacayo, M.; Liu, J.; Lei, G. Impacts of land-use and land-cover changes on water yield: A case study in Jing-Jin-Ji, China. Sustainability 2018, 10, 960. [Google Scholar] [CrossRef]
  63. Ouyang, Y. New insights on evapotranspiration and water yield in crop and forest lands under changing climate. J. Hydrol. 2021, 603, 127192. [Google Scholar] [CrossRef]
  64. Ochoa-Tocachi, B.F.; Buytaert, W.; De Bièvre, B.; Célleri, R.; Crespo, P.; Villacís, M.; Llerena, C.A.; Acosta, L.; Villazón, M.; Guallpa, M.; et al. Impacts of land use on the hydrological response of tropical Andean catchments. Hydrol. Process. 2016, 30, 4074–4089. [Google Scholar] [CrossRef]
  65. Buytaert, W.; Iñiguez, V.; De Bièvre, B. The effects of afforestation and cultivation on water yield in the Andean páramo. For. Ecol. Manag. 2007, 251, 22–30. [Google Scholar] [CrossRef]
  66. Ellison, D.; Futter, M.N.; Bishop, K. On the forest cover-water yield debate: From demand- to supply-side thinking. Glob. Chang. Biol. 2012, 18, 806–820. [Google Scholar] [CrossRef]
  67. Mark, A.F.; Dickinson, K.J.M. Maximizing water yield with indigenous non-forest vegetation: A New Zealand perspective. Front. Ecol. Environ. 2008, 6, 25–34. [Google Scholar] [CrossRef]
  68. Scanlon, B.R.; Jolly, I.; Sophocleous, M.; Zhang, L. Global impacts of conversions from natural to agricultural ecosystems on water resources: Quantity versus quality. Water Resour. Res. 2007, 43, 1–18. [Google Scholar] [CrossRef]
  69. Zhiña, D.; Montenegro, M.; Montalván, L.; Mendoza, D.; Contreras, J.; Campozano, L.; Avilés, A. Climate Change Influences of Temporal and Spatial Drought Variation in the Andean High Mountain Basin. Atmosphere 2019, 10, 558. [Google Scholar] [CrossRef]
  70. Lu, N.; Sun, G.; Feng, X.; Fu, B. Water yield responses to climate change and variability across the North-South Transect of Eastern China (NSTEC). J. Hydrol. 2013, 481, 96–105. [Google Scholar] [CrossRef]
  71. Yin, G.; Wang, X.; Zhang, X.; Fu, Y.; Hao, F.; Hu, Q. InVEST model-based estimation of water yield in North China and its sensitivities to climate variables. Water 2020, 12, 1692. [Google Scholar] [CrossRef]
  72. Yohannes, H.; Soromessa, T.; Argaw, M.; Dewan, A. Impact of landscape pattern changes on hydrological ecosystem services in the Beressa watershed of the Blue Nile Basin in Ethiopia. Sci. Total Environ. 2021, 793, 148559. [Google Scholar] [CrossRef]
  73. Ningrum, A.; Setiawan, Y.; Tarigan, S.D. Annual Water Yield Analysis with InVEST Model in Tesso Nilo National Park, Riau Province. IOP Conf. Ser. Earth Environ. Sci. 2022, 950, 012098. [Google Scholar] [CrossRef]
  74. Daneshi, A.; Brouwer, R.; Najafinejad, A.; Panahi, M.; Zarandian, A.; Maghsood, F.F. Modelling the impacts of climate and land use change on water security in a semi-arid forested watershed using InVEST. J. Hydrol. 2021, 593, 125621. [Google Scholar] [CrossRef]
  75. Li, M.; Liang, D.; Xia, J.; Song, J.; Cheng, D.; Wu, J.; Cao, Y.; Sun, H.; Li, Q. Evaluation of water conservation function of Danjiang River Basin in Qinling Mountains, China based on InVEST model. J. Environ. Manag. 2021, 286, 112212. [Google Scholar] [CrossRef] [PubMed]
  76. GAD del Cantón Azogues. Ordenanza para la Conservación, Restauración y Recuperación de las Fuentes de Agua, Zonas de Recarga Hídrica, Ecosistemas Frágiles y Otras Áreas Prioritarias para la Protección de la Biodiversidad, los Servicios Ambientales y el Patrimonio Natural del Can. R.O. 171, Azogues, Ecuador, 2014. p. 27. Available online: https://www.emapal.gob.ec/mdocuments-library/ (accessed on 31 August 2024).
  77. Bagstad, K.J.; Semmens, D.J.; Winthrop, R. Comparing approaches to spatially explicit ecosystem service modeling: A case study from the San Pedro River, Arizona. Ecosyst. Serv. 2013, 5, 40–50. [Google Scholar] [CrossRef]
  78. Power, A.G. Ecosystem services and agriculture: Tradeoffs and synergies. Philos. Trans. R. Soc. B Biol. Sci. 2010, 365, 2959–2971. [Google Scholar] [CrossRef]
  79. Zheng, H.; Li, Y.; Robinson, B.E.; Liu, G.; Ma, D.; Wang, F.; Lu, F.; Ouyang, Z.; Daily, G.C. Using ecosystem service trade-offs to inform water conservation policies and management practices. Front. Ecol. Environ. 2016, 14, 527–532. [Google Scholar] [CrossRef]
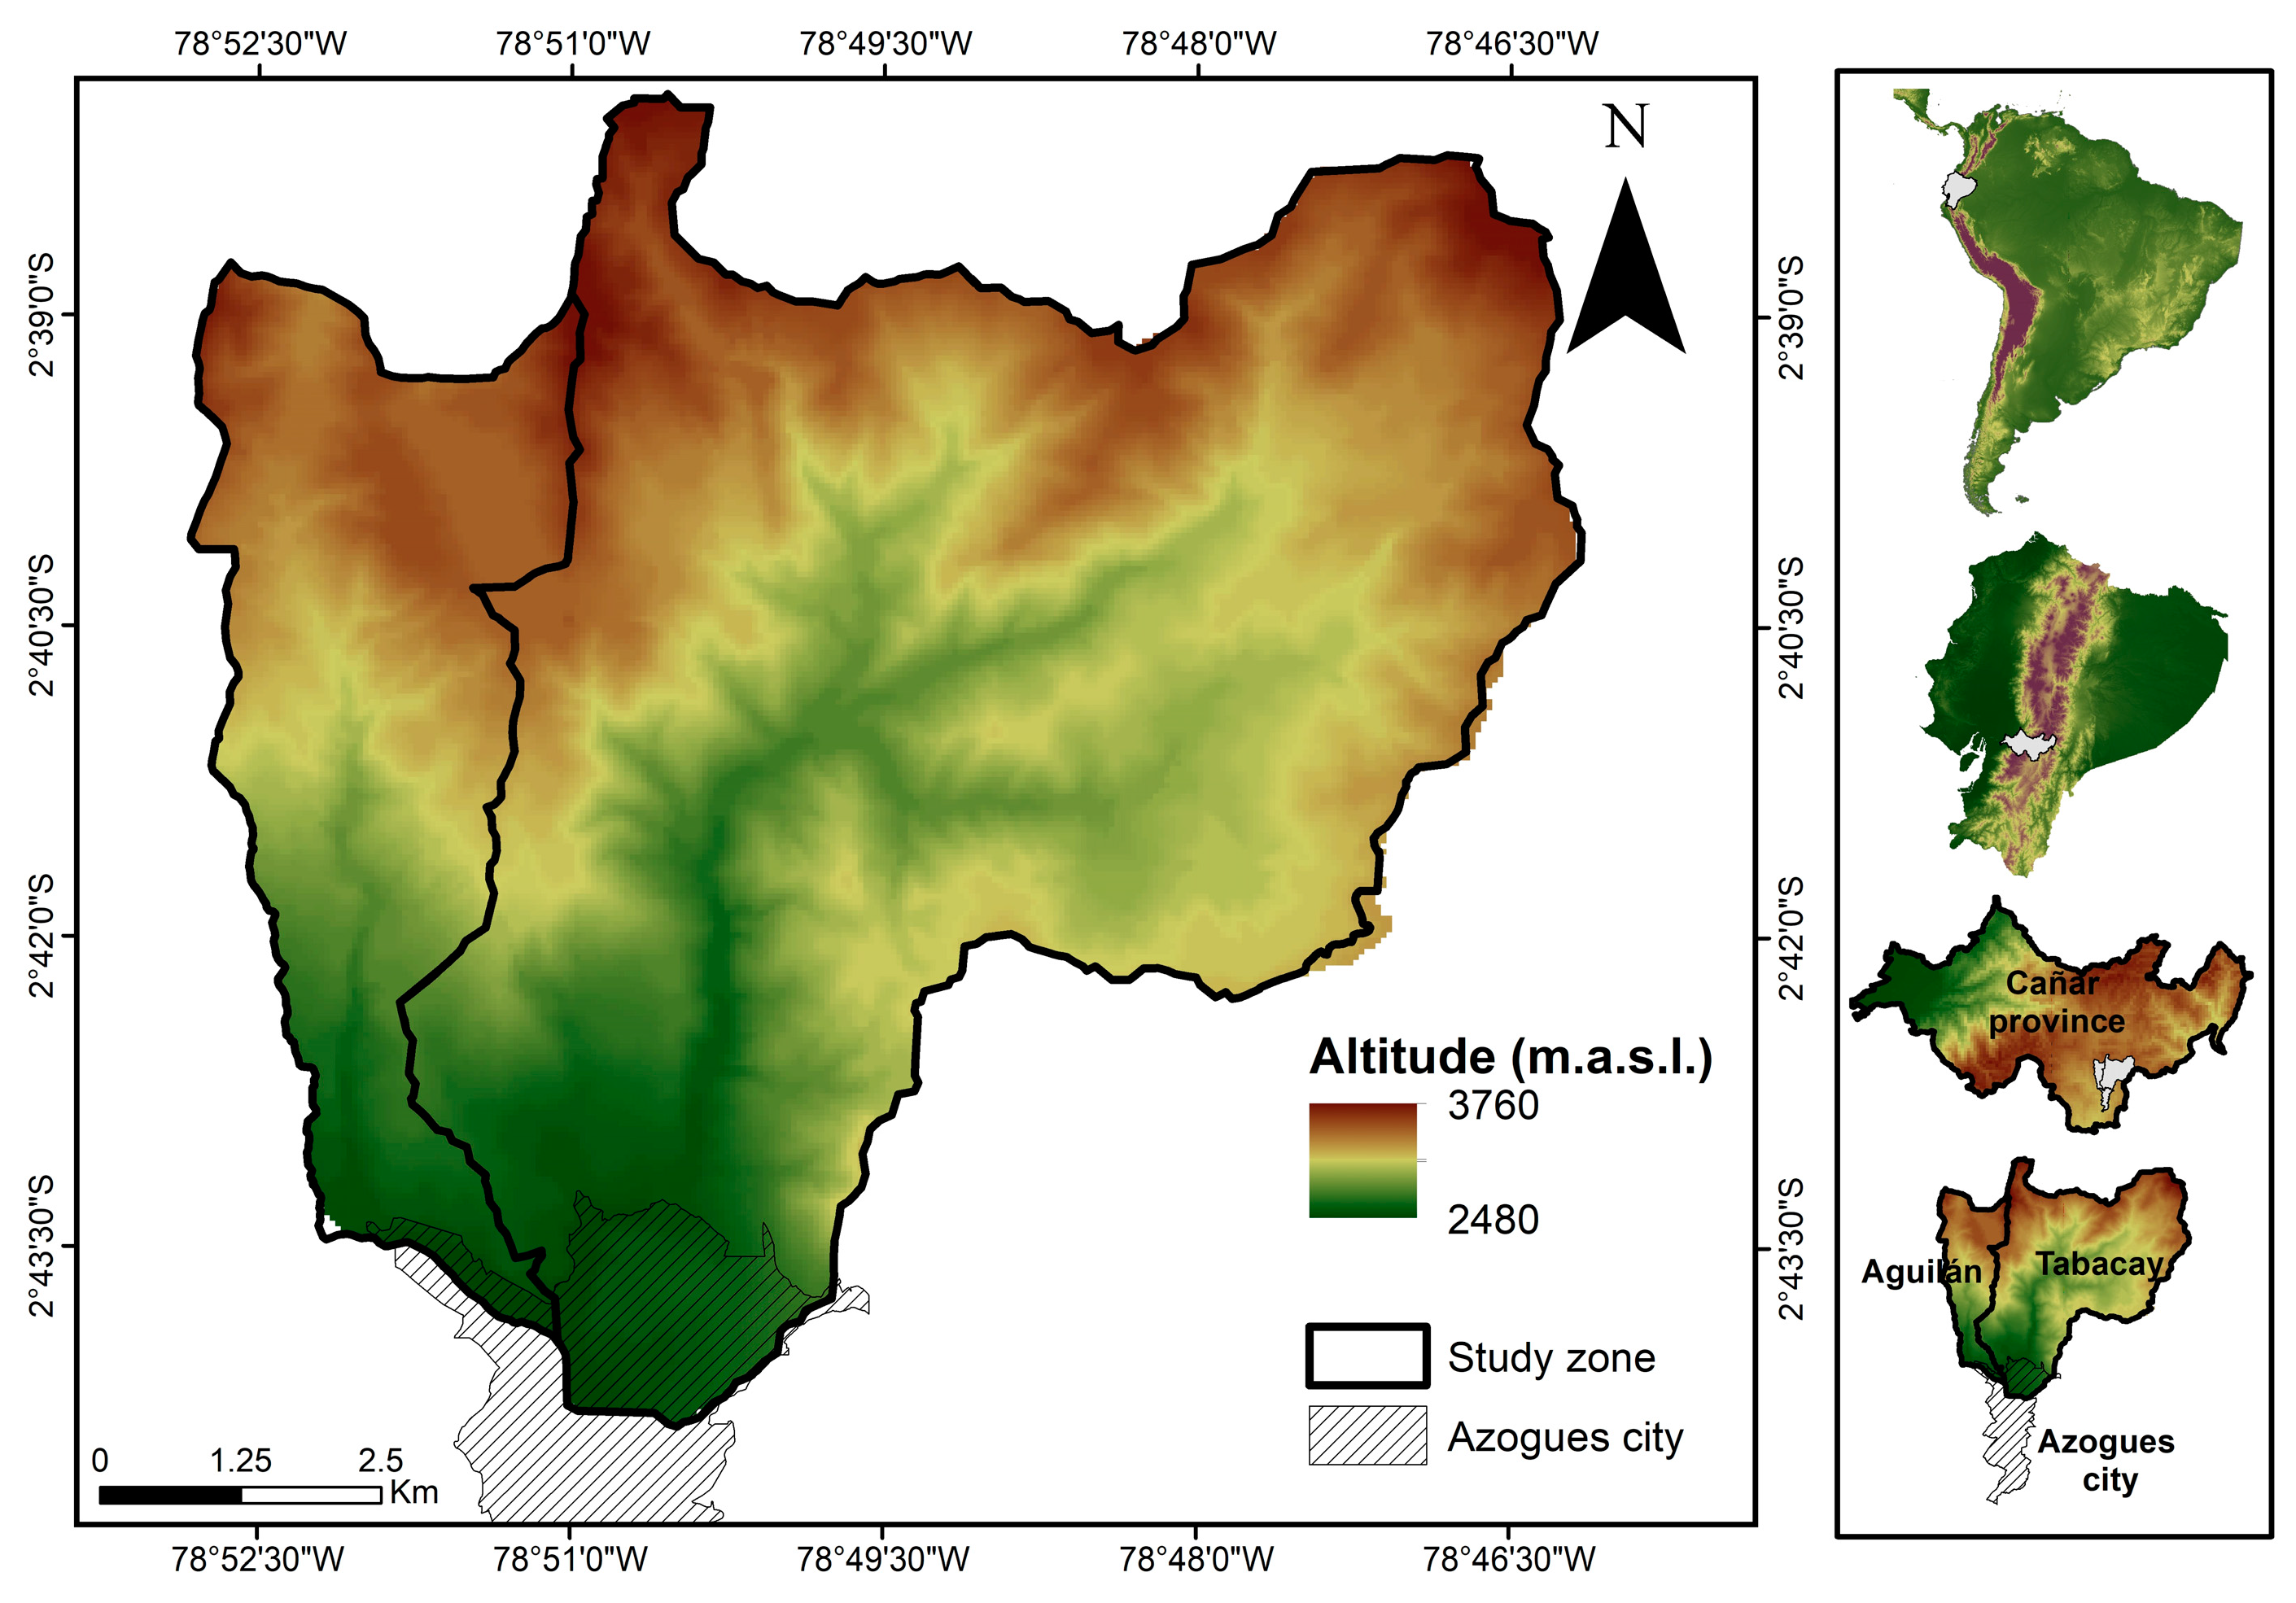
Figure 1. Study area localization: Tabacay and Aguilán river subbasins.
Hydrology 11 00157 g001
Figure 2. Variables required for the InVEST Water Yield Model: (a) precipitation (2014), (b) precipitation (2016), (c) precipitation (2018), (d) precipitation (RCP 4.5—2030), (e) precipitation (RCP 4.5—2040), (f) precipitation (RCP 4.5—2050), (g) precipitation (RCP 8.5—2030), (h) precipitation (RCP 8.5—2040), (i) precipitation (RCP 8.5—2050), (j) plant available water capacity, (k) soil depth, (l) land use and cover (2014), (m) land use and cover (2016), (n) land use and cover (2018), (o) land use and cover—trend scenario (2030), (p) land use and cover—trend scenario (2040), (q) land use and cover—trend scenario (2050), (r) land use and cover—pessimistic scenario (2030), (s) land use and cover—pessimistic scenario (2040), (t) land use and cover—pessimistic scenario (2050).
Hydrology 11 00157 g002
Figure 3. Fieldwork was carried out to validate the classification of root depth.
Hydrology 11 00157 g003
Figure 4. Area covered by each cover and land use within the study area in the different study periods and scenarios.
Hydrology 11 00157 g004
Figure 5. Water yield in the Tabacay and Aguilán river basins in different periods: (a) 2014, (b) 2016, (c) 2018, (d) 2030 (RCP 4.5—trend scenario), (e) 2040 (RCP 4.5—trend scenario), (f) 2050 (RCP 4.5—trend scenario), (g) 2030 (RCP 8.5—pessimistic scenario), (h) 2040 (RCP 8.5—pessimistic scenario), (i) 2050 (RCP 8.5—pessimistic scenario).
Hydrology 11 00157 g005
Figure 6. Flow duration curves of the streamflows that are within the study area: (a) Condoryacu streamflow, (b) Mapayacu streamflow, (c) Nudpud streamflow, and (d) Llaucay streamflow.
Hydrology 11 00157 g006
Figure 7. Boxplot of water yield for each land use and land cover in the study zone: (a) Cropland, (b) Mixed Forest, (c) Wooded Grassland.
Hydrology 11 00157 g007
Figure 8. Boxplot of water yield for each period within the study zone.
Hydrology 11 00157 g008
Figure 9. Sensitivity analysis of the different input parameters of the InVEST model with a variation of −10% (scenario 1), −20% (scenario 2), 0% (scenario 3), +10% (scenario 4), and +20% (scenario 5): (a) Precipitation variation, (b) ETo variation, (c) Root Restraint Layer Depth, (d) Plant available water capacity, and (e) Z-parameter.
Hydrology 11 00157 g009
Table 1. Location of points used to validate root depth classification.
XYQualitative ClassificationLiterature ClassificationField TestsFinal
Classification
738996.599705017.924Superficial<10080100
746905.339706492.673Shallow100–500420500
742884.149706173.413Moderately deep500–10006501000
740168.829698183.620Moderately deep500–10007001000
742064.259705251.796Deep1000–1500>10001500
Table 2. Biophysical table used in the InVEST water production model.
IdLucodeLULC_ClassesLULC_VegKcRoot_Depth
17Wooded grassland10.15500
211Cropland (row crops)10.901500
312Bare ground0110
413Urban and Built-Up0110
514Water01.0510
616Mixed forest10.251500
Table 3. Area covered by each cover and land use within the study area for the trend scenario.
Land Cover and Land UseBase PeriodTrending ScenarioRate Change
201420162018203020402050203020402050
Mixed Forest21.2520.5620.3218.3417.0216.38−9.7%−16.3%−19.4%
Wooded Grassland11.3411.2010.889.778.958.53−10.2%−17.8%−21.6%
Cropland50.3351.0651.5053.8355.1055.564.5%7.0%7.9%
Urban and Built-Up3.243.343.474.285.155.7423.4%48.5%65.5%
Wetland0.030.030.020.020.020.02−9.6%−9.6%−9.6%
Bare Ground0.240.240.230.240.240.242.0%2.0%2.0%
Table 4. Area covered by each cover and land use within the study area for the pessimistic scenario.
Land Cover and Land UseBase PeriodPessimistic ScenarioRate Change
201420162018203020402050203020402050
Mixed Forest21.2520.5620.327.605.485.40−62.6%−73.0%−73.4%
Wooded Grassland11.3411.2010.886.295.484.77−42.1%−49.6%−56.2%
Cropland50.3351.0651.5065.3964.5762.8927.0%25.4%22.1%
Urban and Built-Up3.243.343.476.7910.5613.0396.1%204.7%276.1%
Wetland0.030.030.020.020.020.02−9.6%−9.6%−9.6%
Bare Ground0.240.240.230.230.230.23−0.1%−0.1%−0.1%
Table 5. Comparison between estimated and observed water yield within the study site.
Year 2014Discharge (m3/s)
EstimatedObserved
Condoryacu0.1380.07
Llaucay0.2300.06
Mapayacu0.0620.07
Nudpud0.1770.07
Year 2016
Condoryacu0.0950.08
Llaucay0.1400.07
Mapayacu0.0420.07
Nudpud0.1150.07
Year 2018
Condoryacu0.1660.06
Llaucay0.2580.13
Mapayacu0.0760.08
Nudpud0.2210.08
Disclaimer/Publisher’s Note: The statements, opinions and data contained in all publications are solely those of the individual author(s) and contributor(s) and not of MDPI and/or the editor(s). MDPI and/or the editor(s) disclaim responsibility for any injury to people or property resulting from any ideas, methods, instructions or products referred to in the content.