Article

Livelihood Vulnerability from Drought among Smallholder Livestock Farmers in South Africa

by
Yonas T. Bahta
* and
Stephen Aniseth Nyaki
Department of Agricultural Economics, The University of the Free State, P.O. Box 339, Bloemfontein 9300, South Africa
*
Author to whom correspondence should be addressed.
Hydrology 2024, 11(9), 137; https://doi.org/10.3390/hydrology11090137
Submission received: 4 July 2024 / Revised: 28 August 2024 / Accepted: 30 August 2024 / Published: 1 September 2024

Abstract

:
The impacts of drought and climate change on agriculture have become increasingly apparent, and affect smallholder livestock farmers. Farmers’ livelihoods rely on agriculture; thus, they are vulnerable to the primary and secondary impacts of climate change. In South Africa, policies for increasing the resilience of smallholder livestock farmers who have suffered from agricultural drought have not paid sufficient attention to the level of livelihood vulnerability. This study assessed the level of livelihood vulnerability of smallholder livestock farmers in the drought-stricken Frances Baard District Municipality in the Northern Cape Province of South Africa. The livelihood vulnerability of 217 randomly selected farmers from the municipality were determined using the Livelihood Vulnerability Index (LVI) and Livelihood Vulnerability Index of the Intergovernmental Panel on Climate Change (LVI-IPCC), which includes seven components and 34 subcomponents addressing livelihood. A high level of livelihood vulnerability, with an LVI score of 0.436, was determined and attributed to high-risk livelihood strategies, food, social networks, health, water, sociodemographics, natural disasters, and climate change. The LVI-IPCC of 0.04 also showed moderate vulnerability due to high exposure, high sensitivity, and low adaptive capacity, especially for the Phokwane, Dikgatlong, and Magareng districts in the Frances Baard municipality. Given continued drought recurrences, it is crucial for the government and other stakeholders to implement strategic and targeted sustainable interventions. The resilience of smallholder livestock farmers should be enhanced by increasing their adaptive capacity through diversified livelihood options while decreasing exposure and sensitivity to agricultural drought risks.

1. Introduction

Climate change’s impacts on humans and the environment have become more apparent in the 21st century, given the significant consequences of recurrent and prolonged droughts and weather disasters [1]. This is more apparent in Africa, where agriculture is the mainstay for more than 70 percent of the population. Recurrent agricultural droughts are common in South Africa, and pose a significant threat to livestock farmers’ livelihoods when production costs increase, as the majority depend on rain-fed agricultural systems [2,3]. Climate change, as evidenced by long-term variations in temperature and weather patterns, has long-term impacts on the livelihoods of farmers. These impacts disproportionately affect certain sections of the population, especially low-income and farm-dependent households who cannot afford to adapt accordingly [4]. While the impacts of climate change can be observed directly when farm households reduce productive capacity, secondary stressors register a more significant impact. These include the emergence of infectious diseases, perilous economic cycles, and conflicts over resources [5].
One critical outcome of climate change is agricultural drought, which is characterised by an extended period of shortage of the water essential for farming, and results from factors such as water reserve shortage or low rainfall and high temperatures [6]. Drought can be categorised according to its manifestations in various forms, including socioeconomic, agricultural, hydrological, and meteorological occurrences [7]. This study, however, focuses specifically on agricultural droughts.
Globally, drought accounts for approximately 30 percent of all losses attributed to natural disasters [8]. In South Africa, the drought that occurred in 2015/16 led to a 13 percent decline in the agricultural industry sector, as significant livestock deaths/losses were recorded, costing approximately ZAR 10 million in damages [9]. The livestock sector, extending across approximately 5,900,000 km2, was impacted, leading to a 15 percent decline in national herd size. The extended impact of this drought is still experienced, and drought remains a threat to the livelihood of farmers, specifically smallholders who rely on agriculture for survival [10]. This is because drought results in the depletion of water sources, pastures, and fodder. Consequently, there are increases in farm production costs, livestock deaths, and the risk of disease outbreaks. These consequences negatively impact the livelihood vulnerability of livestock farmers because they reduce their ability to cope with and recover from shocks while increasing the likelihood of social tensions and forced migration [11].
For over a century, agricultural drought has continually impacted the Northern Cape Province of South Africa, which spans over 5.8 million hectares, with approximately 10,000 farms and a total capacity of 166,000 large livestock units [9,12]. The province is notable for livestock farming, with around 75 percent of households relying on animal production, which accounts for 86 percent of the land used, and approximately 33.8 million hectares are designated for agricultural purposes. Droughts have caused significant livestock losses in the region. Bahta and Myeki [12] reported that agricultural droughts in the province resulted in a more than 45 percent loss of cattle, sheep, and goats; a more than 27 percent deterioration in animal health; and a more than 19 percent decline in livestock prices. These losses expose farmers to economic vulnerabilities given that a lack of adaptation mechanisms results in economic downturns. This is because livestock farming is highly dependent on the climatic conditions. Thus, smallholder farmers are increasingly exposed to the adverse effects of climate change-induced drought. To better inform policymakers, it is imperative to assess the sensitivity and extent of smallholder livestock farmers’ livelihood vulnerability, given their reliance on livestock farming in the province. This assessment will explain the extent of smallholder farmers’ vulnerability based on their adaptive capacity, given the environmental and social change stressors they are exposed to.
Drought has a significant extended impact on the social, economic, and environmental conditions of smallholder farmers, one which extends beyond its direct effect on farm productivity. This includes factors such as food access, health status, and education attendance, all of which determine short- and long-term quality of life [13,14]. The reduced quality of such factors increases farmers’ exposure to risk and their inability to adapt. Consequently, this heightens the socioeconomic vulnerability of the household and community. Many livestock farmers have low levels of resilience to agricultural drought [15]. As drought events recur, a lack of resilience to climate shocks elevates the degree of susceptibility of farmers’ livelihoods to the adverse impacts of agricultural drought. It is therefore imperative to understand the level of livelihood vulnerability and how the socioeconomic characteristics of farmers can be used to devise specific policy interventions. This requires an assessment of livestock farmers’ levels of exposure to drought risk, sensitivity to impacts, and adaptive capacity. All of these indices entail livelihood vulnerability assessment based on the Livelihood Vulnerability Index of the Intergovernmental Panel on Climate Change (LVI-IPCC).
The literature on the assessment of livelihood vulnerability due to climate change and natural disasters among farmers, especially using the LVI-IPCC, is growing [7,16,17,18]. This is because the framework incorporates a range of indicators used to assess exposure to climate variability and natural disasters; the social and economic characteristics of households that determine their adaptive capacity; and the current state of health, food, and water resources that influence their sensitivity to the impacts of climate change [7,16,17,18]. In southern Africa, where weather events are erratic and climate change has affected more than 75 percent of farmers, studies on the level and extent of livelihood vulnerability are limited. Most studies have focused on social vulnerability and resilience [12,19]. A similar study in the region was conducted by Mugandani et al. [7]; however, the study included smallholder crop farmers in Zimbabwe, where climatological readings were different, with no focus on smallholder livestock farmers. Therefore, this study assesses the level of livelihood vulnerability due to agricultural droughts among smallholder livestock farmers in South Africa.

2. Materials and Methods

2.1. Study Area

The study was conducted in the Northern Cape Province of South Africa, which is the largest province in the country, with an area of 372,889 km2 (Figure 1). Despite its size, the province has the lowest population, approximately 1.2 million people, and is characterised by sparsely populated cities and towns. The province is divided into five district municipalities: Frances Baard (12,800 km2), John Taolo Gaetsewe (27,300 km2), Namakwa (126,900 km2), Pixley Ka Seme (103,500 km2), and ZF Mgcawu (102,500 km2). This study was conducted in the Frances Baard District Municipality, located in the eastern part of Northern Cape Province. This municipality is further sub-divided into four local municipalities: Magareng (1541.6 km2), Dikgatlong (2377.6 km2), Phokwane (833.9 km2), and Sol Plaatje (1877.1 km2) [20].
Topographically, the province is dominated by the Karoo Basin, which consists of sedimentary rocks and dolerite intrusions. The south and southeast of the province is composed of highlands, 1200–1900 m above sea level, in the Roggeveld and Nuweveld districts. The west coast is dominated by the Namaqualand region, which is well-known for its spring flowers. This area is hilly to mountainous and consists of granite and other metamorphic rocks. The central areas of the province are generally flat, with interspersed salt pans. Kimberlite (igneous rock) intrusions punctuate the Karoo rocks, giving the province its most precious natural resource, diamonds. The north is primarily composed of the Kalahari Desert, characterised by parallel red sand dunes and Acacia trees in a dry savanna [21].
Smallholder livestock farmers in the province use government-owned communal lands for farming. The farmers do not have full access or property rights because they do not own the land. As a result, they have difficulty obtaining credit [22].
The Northern Cape province is located at an elevation of 1028.74 m (3375.13 feet) above sea level, and the province has a Subtropical desert climate (Classification: BWh) [20]. The FBDM is located within the Northern Steppe climate region, and thus receives summer and autumn rainfall. It is classified into nine climate zones: 1306S, 7S, 568S, 569S, 13S, 558S, 571S, 570S, and 931S, with extreme maximum and minimum temperatures of 43 °C and −10 °C and frost periods of 85 to 155 days [20,21].
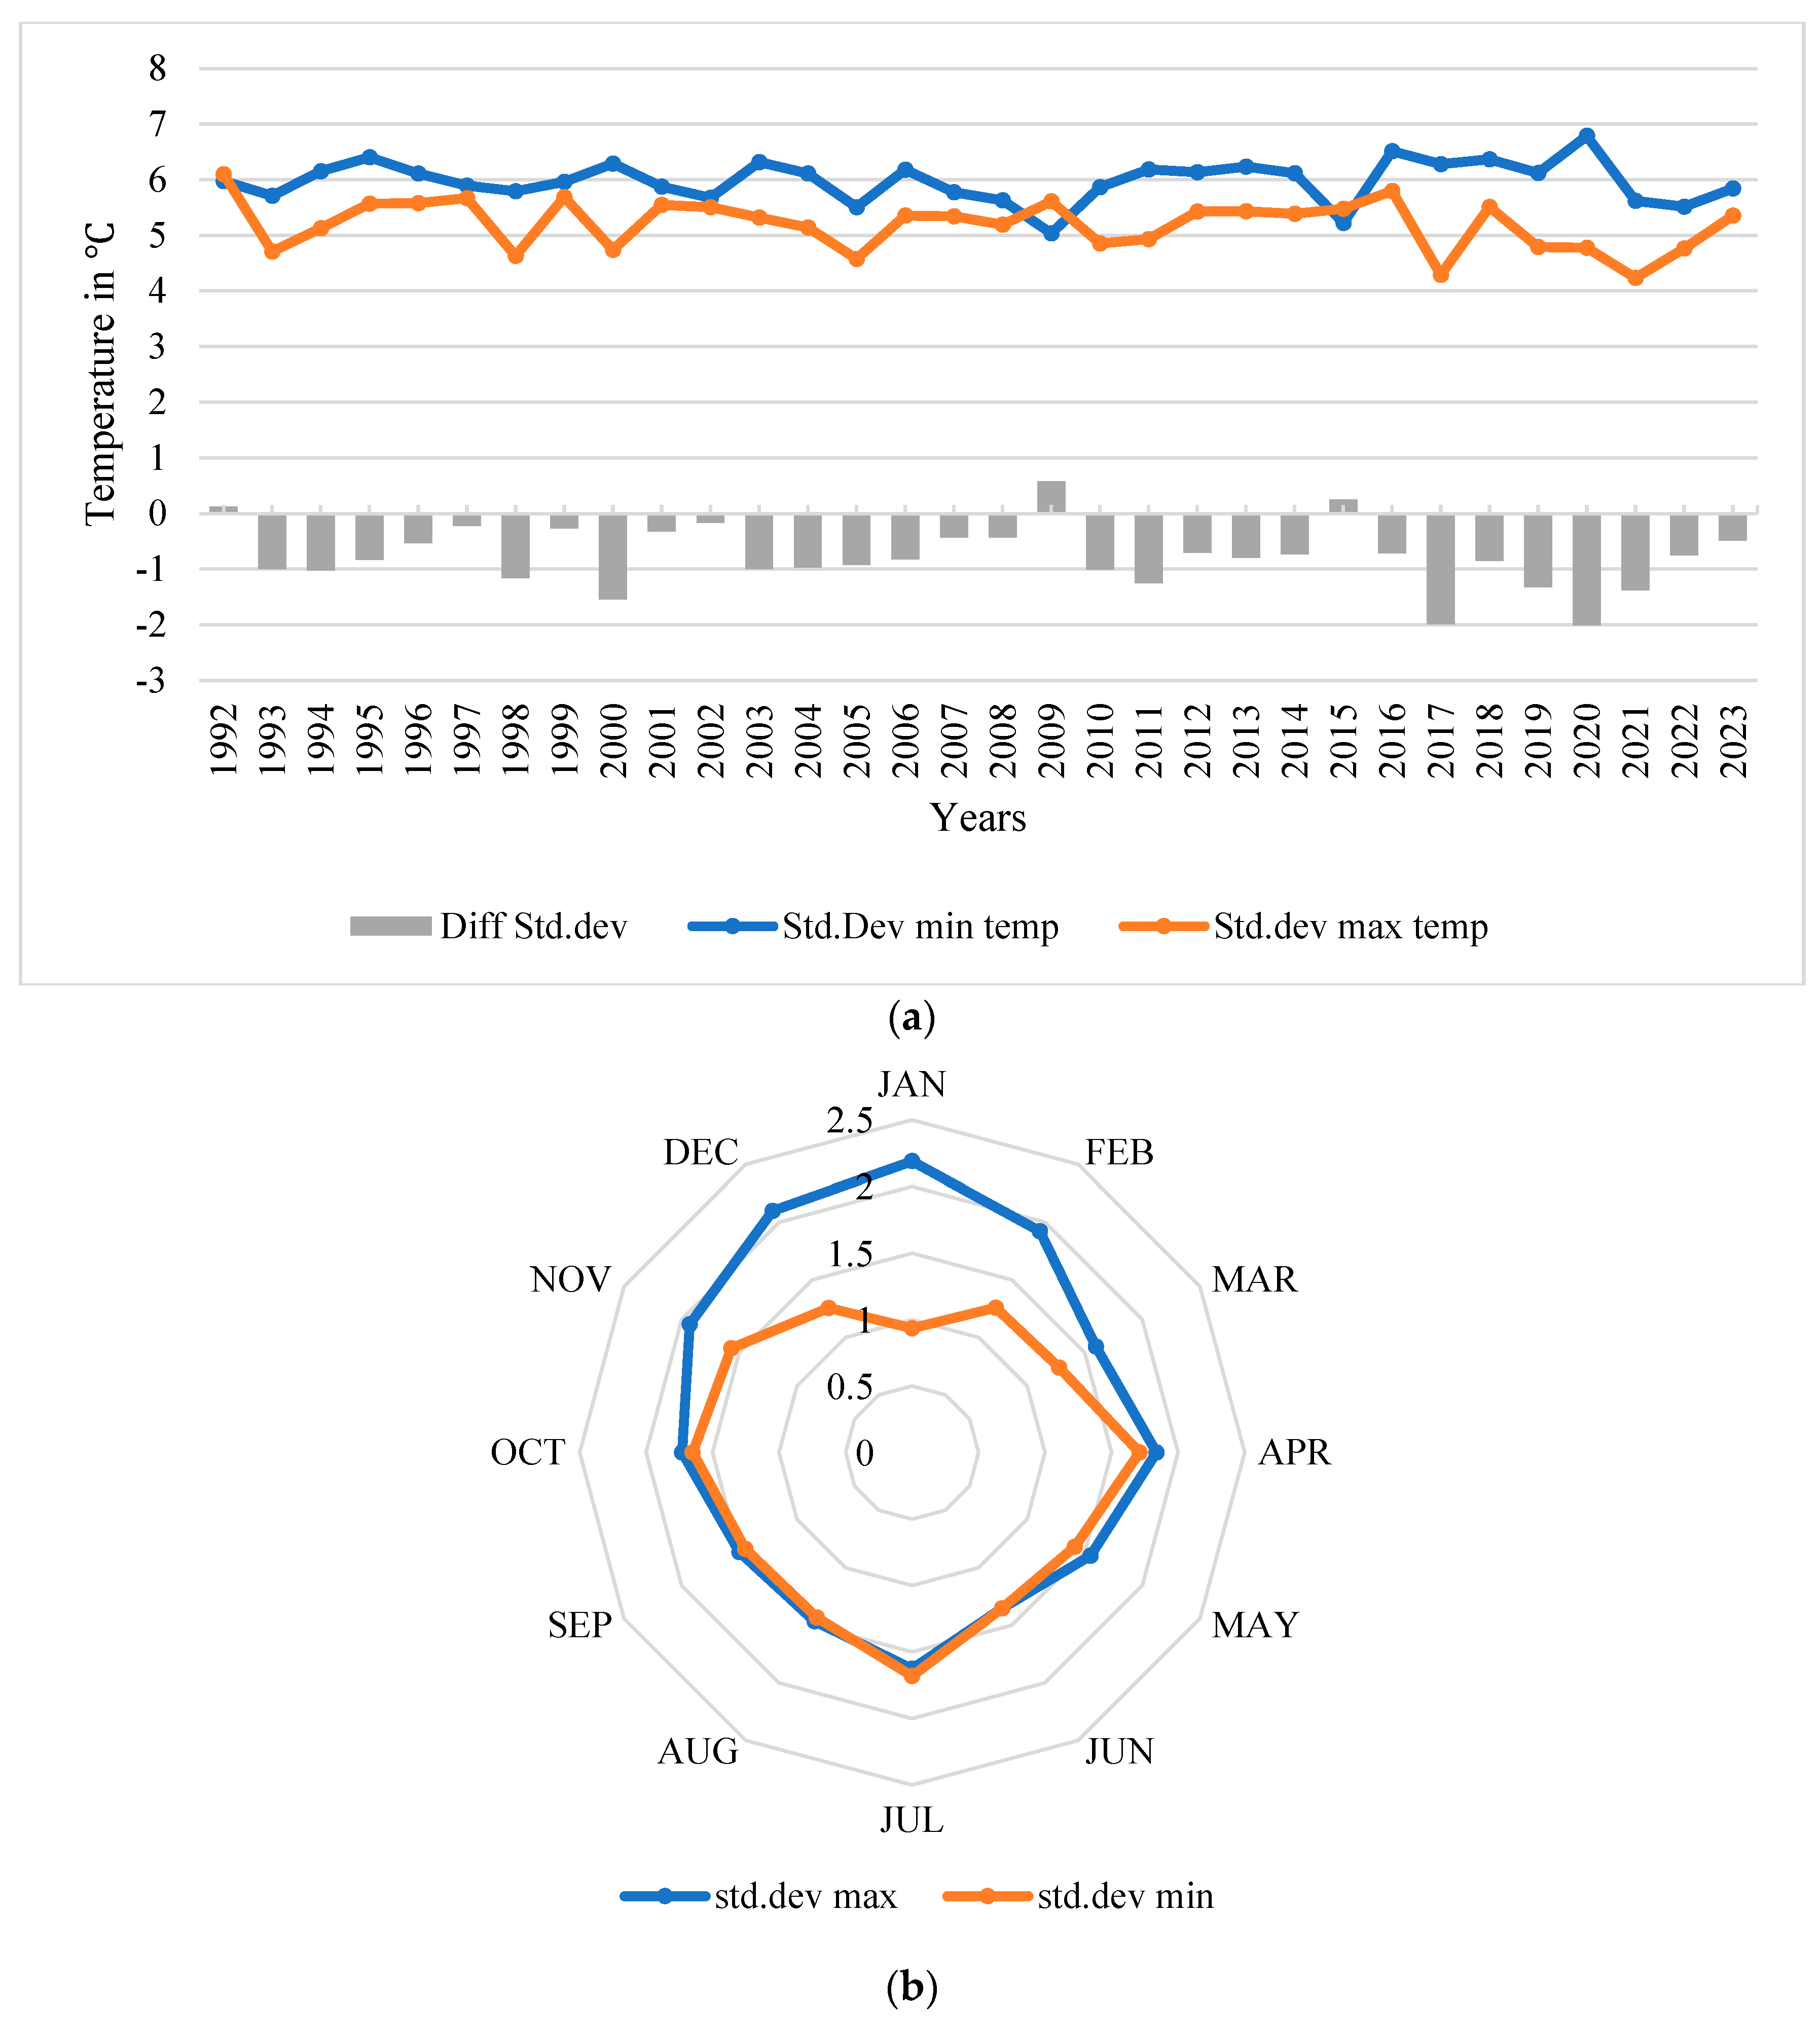
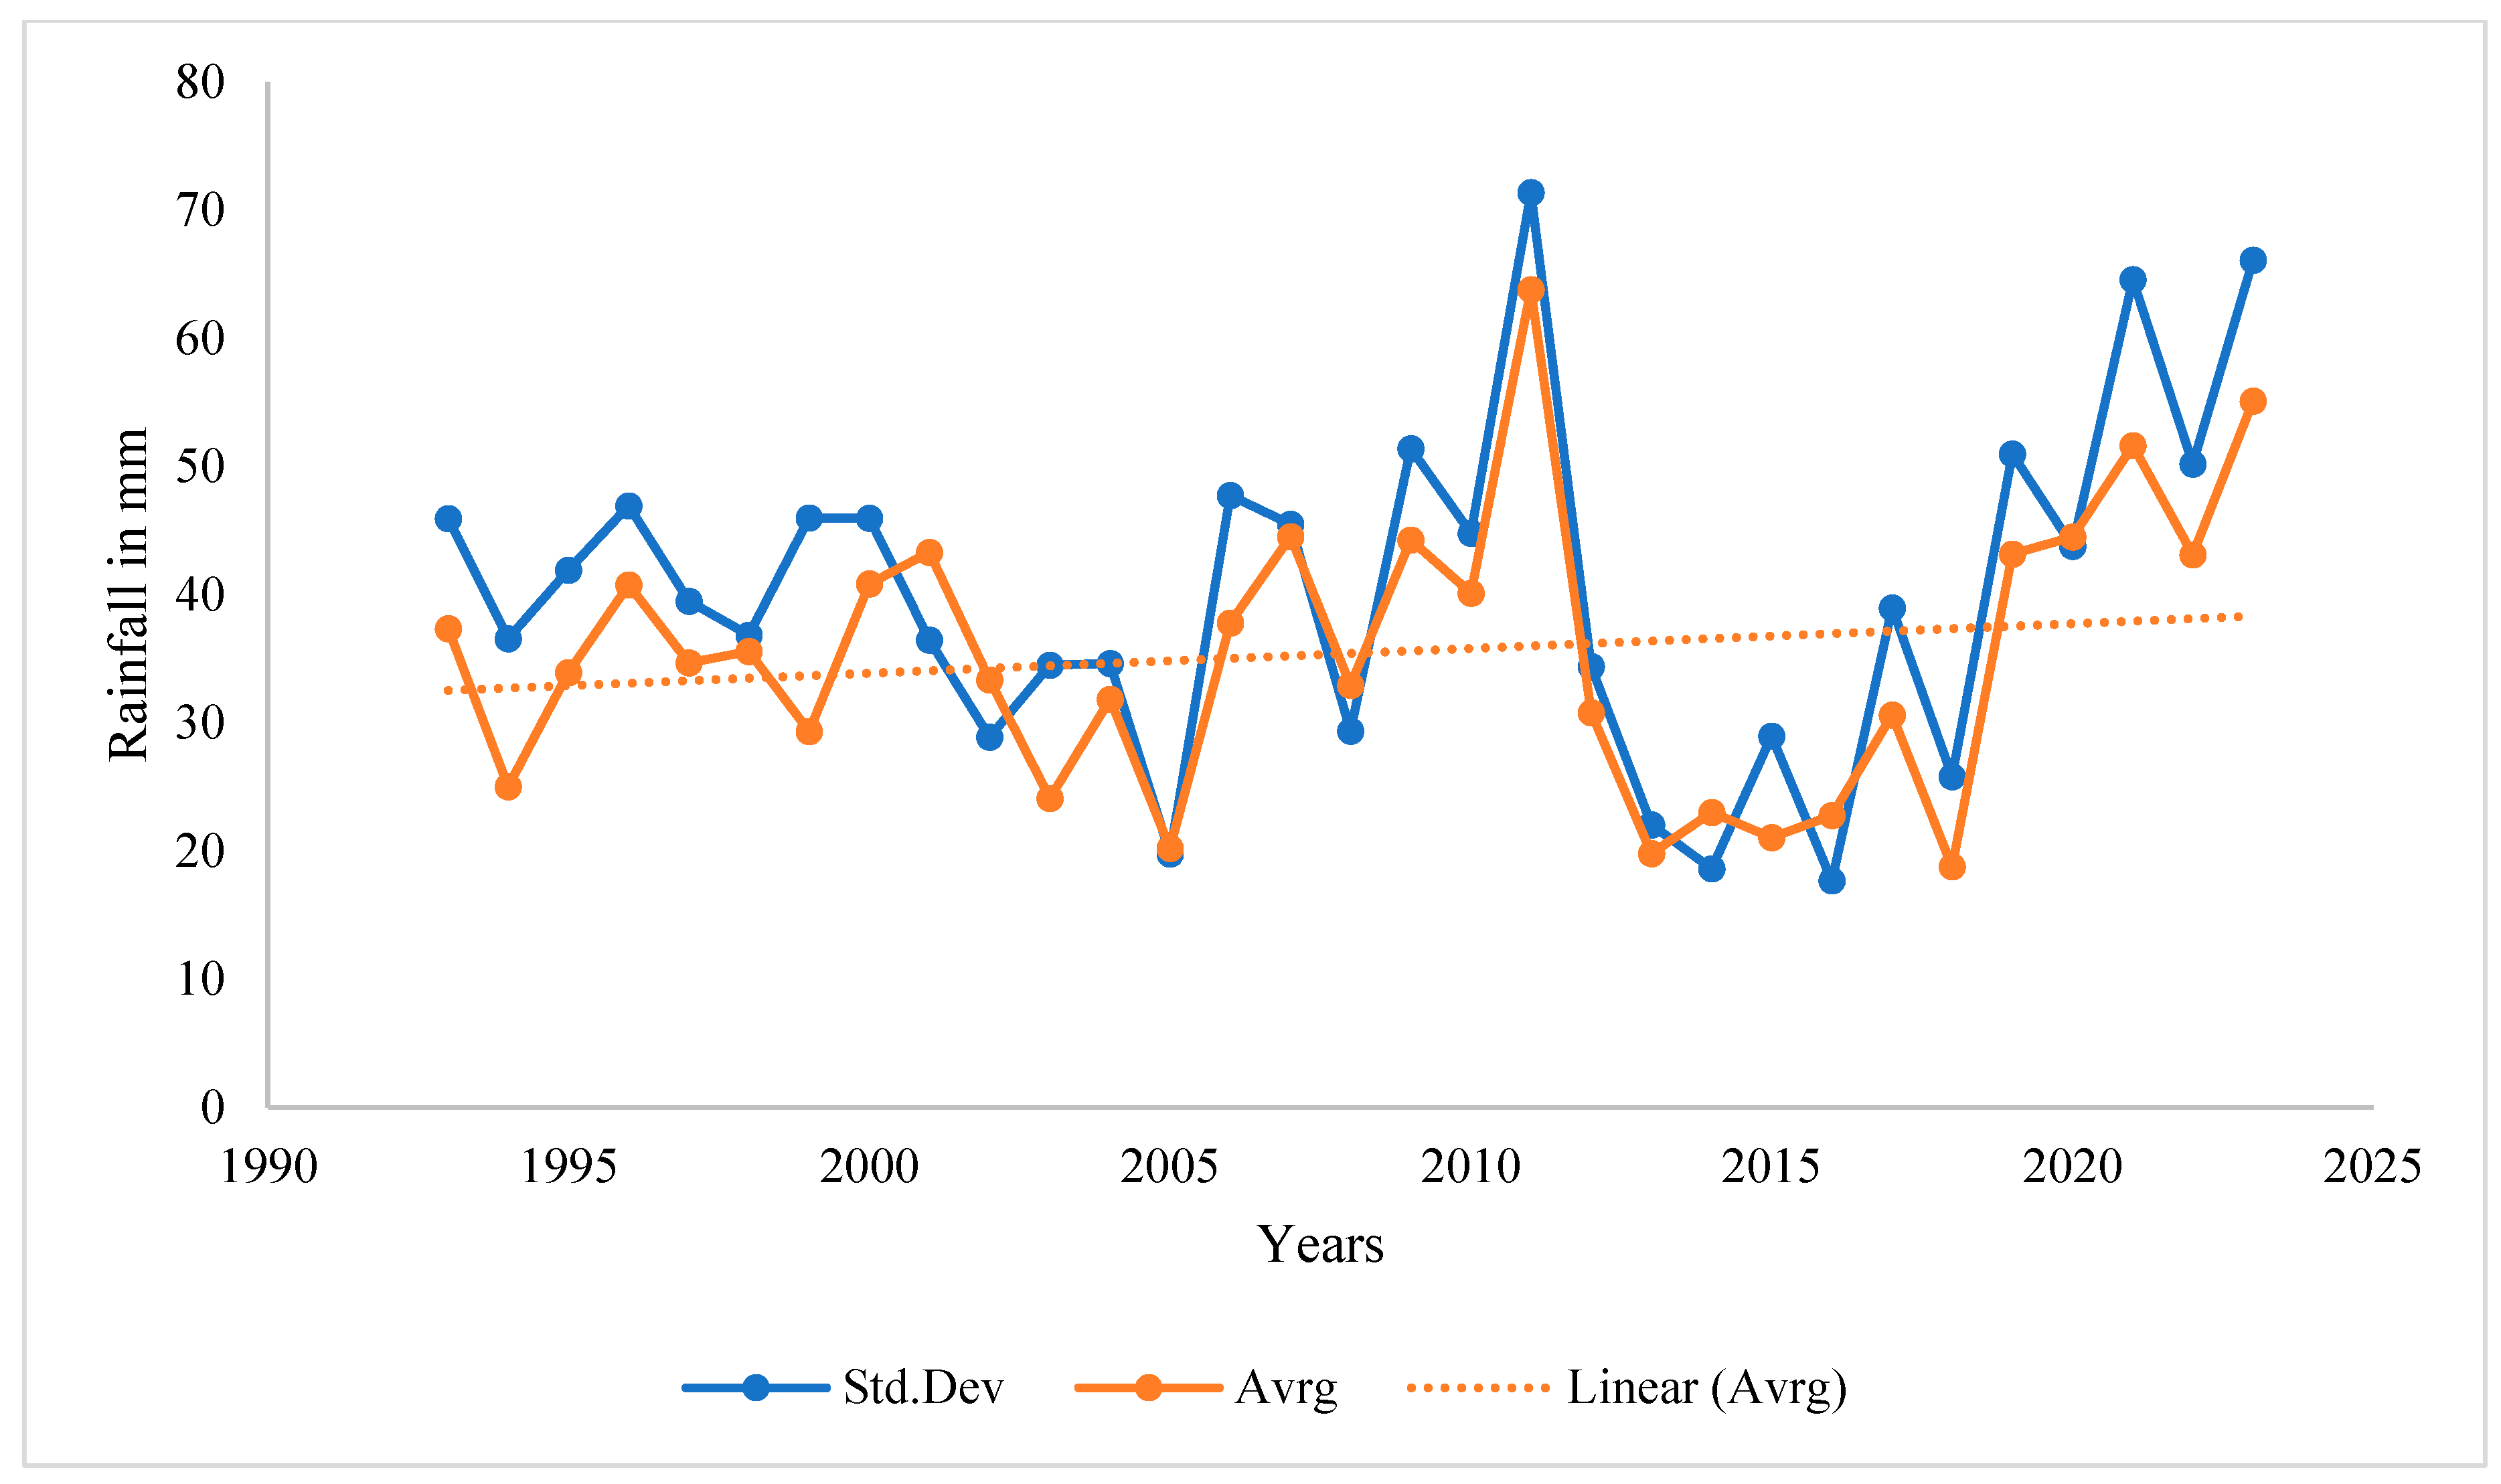
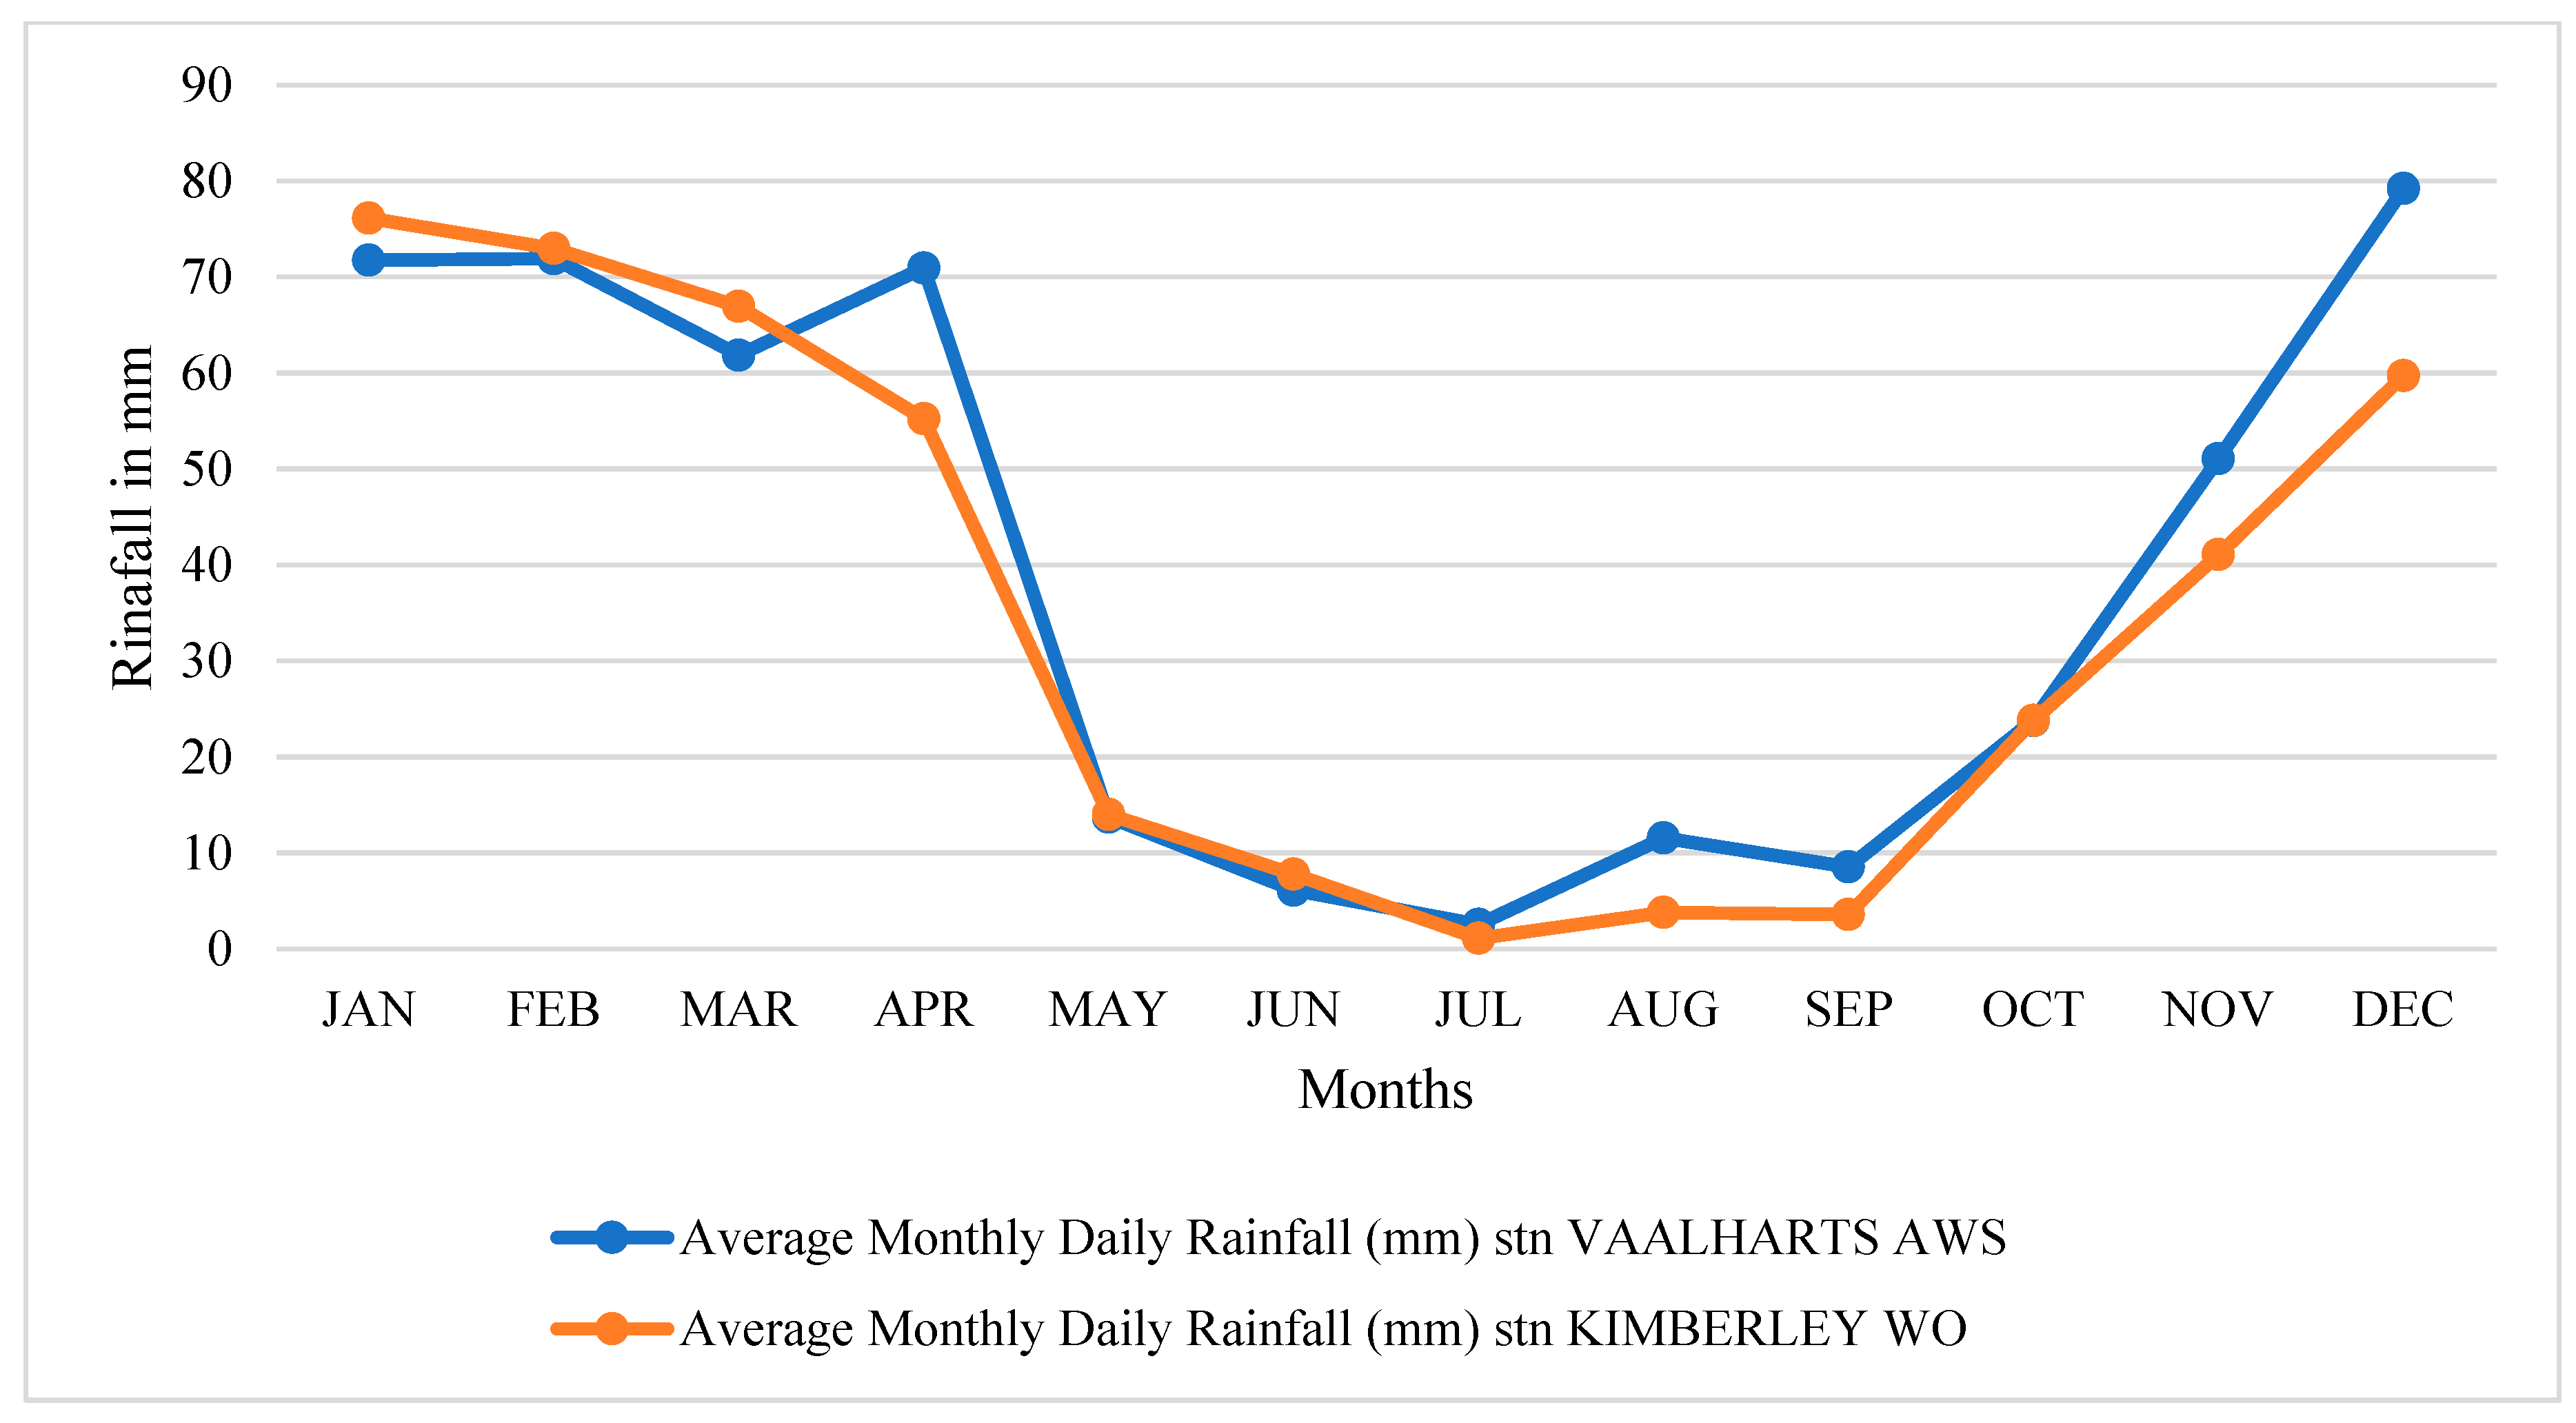
Climatologically, using temperature and rainfall data sourced from the South African Weather Office for the period 1992 to 2023, the average monthly minimum and maximum temperatures for the FBDM station (0290468A9, Kimberley Weather Office) were 10 °C and 27 °C, respectively. During the summer months, the average monthly maximum temperature was 36.7 °C, while the average monthly minimum temperature during the winter months was −2 °C. The temperature variability is reflected by the standard deviations from the average minimum and maximum temperatures recorded during the same period, with highly variable minimum temperatures observed, as depicted in Figure 2a,b. Significant deviations were observed between November and March. The area experienced an average monthly minimum rainfall of 19 mm and an average monthly maximum rainfall of 67 mm between 1992 and 2023 (Figure 3). For the past decade, both the Vaalharts Automated Weather Station and the Kimberley Weather Office have recorded an average monthly maximum rainfall of 70 to 80 mm between December and January and an average monthly minimum rainfall of 0 to 10 mm between June and September (Figure 4). The Northern Cape Province is home to many agricultural activities because of the significant differences in climate between district municipalities. Livestock production is the most popular business, with more than 75 percent of agricultural households focusing solely on animal production [23].

2.2. Study Design

This study employed a mixed-method approach, with both qualitative and quantitative approaches, to collect relevant data. The questionnaire consisted of open- and closed-ended questions. The first section of the questionnaire probed data on the socioeconomic characteristics of farmers, such as age, sex, household size, marital status, education, years of farming, and source of funding. The second section solicited information on the types of resources available to farmers, such as natural capital items such as land ownership, land size, access to water, etc. The third section contained questions on production and farming activities (e.g., the number of livestock and feed availability). The fourth section solicited information on household consumption, expenditure, and resource endowment. The final section solicited information on drought exposure, sensitivity, adaptive capacity, livelihood, and environmental variables, as informed by the LVI components [16,17,18]. Qualitative data were collected through face-to-face interviews conducted between October and December 2020 using a structured questionnaire. The interviews explored the experiences of livestock farmers concerning drought impacts, incurred losses, support systems, and adaptive/resilience measures. Ethical approval was obtained from the University of the Free State for the data collection, which included meetings with key stakeholders in the Northern Cape Province, such as smallholder livestock farmers, the African Farmers Associations of South Africa (AFASA), the Northern Cape Department of Agriculture, Forestry, and Fisheries, and the Department of Rural Development and Land Reform. The study objective was clarified before the meeting, and participation was voluntary.

2.3. Sampling Procedure

A multistage sampling procedure was adopted to conduct the survey. In the first stage, the Northern Cape Province, South Africa’s main livestock-producing province, was purposefully selected. Furthermore, in 2018, the South African government declared the province to be a disaster-prone area. The Frances Baard District Municipality was chosen randomly in the second stage, with Phokwane, Magareng, Sol Plaatje, and Dikgatlong purposefully defined as its key livestock-producing municipalities. In the third stage, the sample was derived from the list of smallholder farmers who received aid during the 2015/2016 crop season, as identified by the Northern Cape Department of Agriculture, Forestry, and Fisheries [24]. The department assisted 878 smallholder livestock farmers registered for aid in four local municipalities. From this list, 217 livestock farmers were selected using a simple random sampling formula based on Cochran [25] and Bartlett [26].

2.4. Data Analysis

2.4.1. Livelihood Vulnerability Index

The livelihood vulnerability assessment was adopted from the framework created by Hahn et al. [27] and the Intergovernmental Panel on Climate Change (IPCC). The Livelihood Vulnerability Index (LVI) framework, as discussed by Hahn et al. [27], utilised several indicators to assess the exposure of livestock farming households to climate variability and natural disasters. The LVI encompasses seven main components: sociodemographic profiles (SDP), livelihood strategies (LS), social networks (SN), health (H), food (F), water (W), natural hazard-induced disasters (NHID), and climate variability (CV). In this study, the LVI was computed using these seven components, each with different numbers of subcomponents, depending on the survey data of smallholder livestock farmers affected by agricultural droughts in the study area. Given that the subcomponents were assessed on various scales, they were first standardised using the United Nations Development Programme’s (UNDP) Human Development Index (HDI) [28]. This approach involved adapting the HDI to calculate the life expectancy index (Equation (1)), which was determined as the ratio of the difference between the actual life expectancy and a preselected minimum to the range of the predetermined maximum and minimum life expectancy [28].
i n d e x s d = s d s m i n s m a x s m i n  
where s d is the original subcomponent for the municipality d, s m i n is the minimum value, and s m a x is the maximum value for each subcomponent. The livestock diversity index, as a subcomponent of livelihood, was generated with the assumption that an increase in the crude indicator, which is the number of livestock populations kept by households, would result in a decrease in vulnerability.
The Livestock Diversity Index was used to evaluate the variety of livestock by considering their proportion to the overall household livestock population. This index is calculated by subtracting 1 from the ratio of the number of livestock species to the sum of the squared proportions of each species. The resulting value ranges between 0 and 1, with a higher value closer to 1 indicating better diversification and greater resilience against climate change effects, whereas a lower value, closer to 0, suggests less diversification and a higher likelihood of being impacted by climate change (Equations (2) and (3)).
L i v e s t o c k   D I = 1 S q u a r e d   P r o p o r t i o n s N u m b e r   o f   l i v e s t o c k   S p e c i e s
L i v e s t o c k   D I = 1 n N 2 S
However, this procedure suffers from distributional properties; thus, the Margelef index was used because it has good discriminating abilities and better goodness of fit (Equation (4)) [29,30].
D M g = S 1 L n ( N )
where D M g is the Margalef index, S is the total number of livestock types reared by the household, N is the total number of individuals or total count of animals held by the household, and L n is the natural logarithm. An index of zero for Margalef signifies complete specialisation, whereas any value greater than zero indicates some degree of diversification. The Livestock Diversity Index was subsequently standardised using Equation (1), along with other subcomponents. Following standardisation, the subcomponents were averaged to compute the value for each major component using Equation (5).
M d = i = 1 n i n d e x s d i n
where M d = one of the major components for the municipality d, which are the sociodemographic profile (SDP), livelihood strategies (LS), social networks (SN), health (H), food (F), water (W), and natural disasters and climate variability (NDCV). Each of the seven major components for a district was subsequently averaged using Equation (6).
L V I d = i = 1 7 W M i M d i i = 1 7 W M i
  L V I d = w S D P S D P d + w L S L S d + w S N S N d + w H H d + w F F d + w W W d + w N D C V N D C V d w S D P + w L S + w S N + w H + w F + w W + w N D C V
where L V I d is the livelihood vulnerability index for the municipality d, and W M i are the numbers associated with the subcomponents which make up each major component. According to Hahn et al. [27], the LVI is measured on a scale of zero to 0.5, with zero representing the least vulnerable and 0.5 representing the most vulnerable.

2.4.2. Livelihood Vulnerability Index-Intergovernmental Panel on Climate Change

The IPCC describes vulnerability as the degree to which a system is susceptible to, or unable to cope with, the adverse consequences of climate change, including climate variability and extremes [31]. According to the IPCC [31], vulnerability has three main components: exposure to climate-related shocks and natural hazards, the sensitivity of the system to climate shocks, and the capacity of the system to adapt to these shocks. Exposure was measured by the number of natural disasters that occurred in the past decade. Climate variability was measured using the average standard deviation of the maximum and minimum monthly temperatures and the monthly precipitation from 1992 to 2023 in the study area. The second component, sensitivity, was assessed by evaluating the current state of the municipality’s food and water security and health status. The third component, adaptive capacity, was determined by factors such as the demographic profile of the municipality, the types of livelihood strategies employed, and the strength of social networks. Both sensitivity and adaptive capacity are considered internal factors of the system, whereas exposure to natural climate variability is considered an external factor [27,32]. A system with high exposure, low adaptive capacity, and high sensitivity is likely to have high vulnerability. As presented in Figure 2, to obtain the LVI-IPCC, we used the same subcomponents of the same categorisation by combining them using Equations (8)–(11):
  C F d = i = 1 n W M i M d i i = 1 n W M i
  E x p d = w N D C V N D C V d w N D C V  
S e n d = w H H d + w F F d + w W W d w H + w F + w W
A d p . C a p d = w S D P S D P d + w L S L S d + w S N S N d w S D P + w L S + w S N
where C F d is an IPCC-defined contributing factor (exposure, sensitivity, or adaptive capacity) for municipality d, M d i are the major components for district d indexed by i, W M i is the weight of each major component, and n is the number of major components in each contributing factor. After obtaining exposure ( E x p d ), sensitivity ( S e n d ), and adaptive capacity ( A d p . C a p d ), the three contributing factors were combined using Equation (12).
L V I I P C C d = E x p d A d p . C a p d × S e n d ,
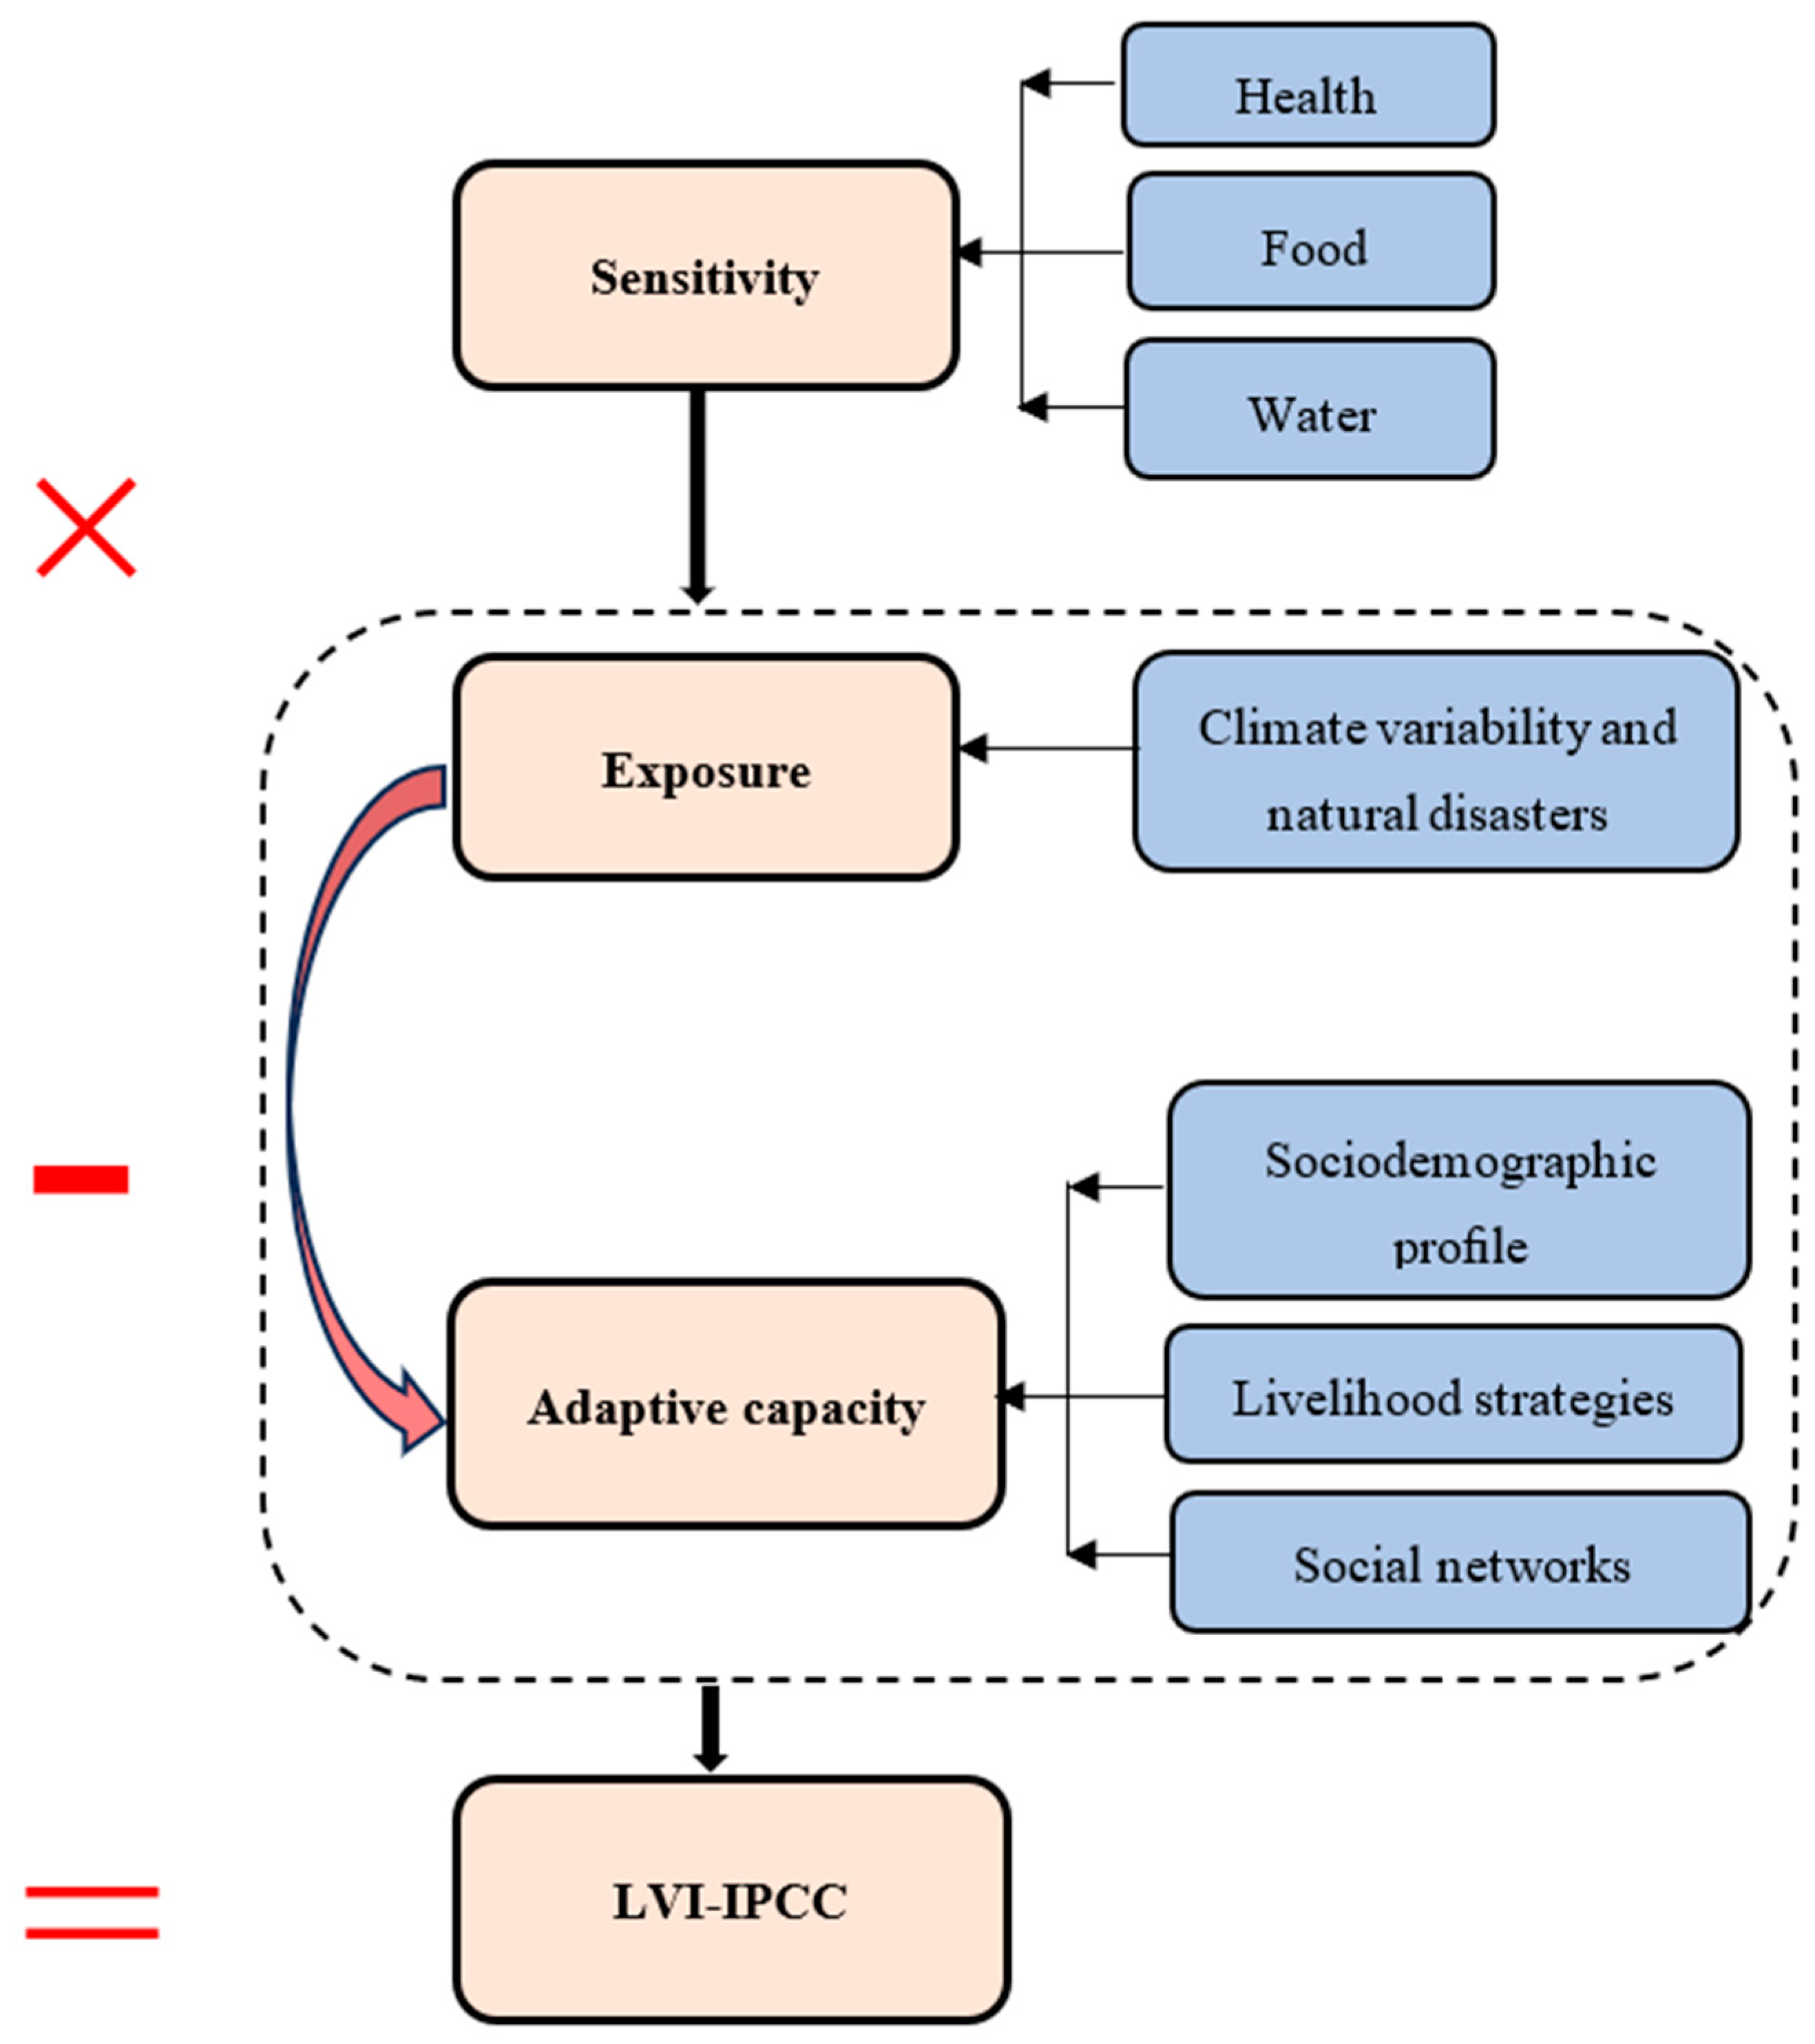
The LVI–IPCC was scaled from 0 (least vulnerable) to 1 (most vulnerable). Figure 5 displays the LVI-IPCC framework, in which vulnerability is obtained as a product of sensitivity to drought impact (health, food, and water components), difference of exposure to drought risk (climate variability and natural disasters components) and adaptive capacity (sociodemographic profile, livelihood strategies, and social networks components).

3. Results

3.1. Social and Economic Characteristics of Livestock Farmers

Table 1 presents the descriptive statistics of the socioeconomic attributes of the livestock farmers from the Northern Cape Province. The farmers were adults, with an average age of 51 years, with 75 percent being older than 41 years. About 72 percent of the farmers were male, while 28 percent were female. More than half (54 percent) of the farmers had a basic/primary education, with an average of 8 years of schooling; 42 percent had a secondary education; and only 4 percent had a tertiary (college/university) education. The average family size was five, with most (95 percent) comprising fewer than ten individuals. The median number of farming experience was nine years, and many farmers (90 percent) had less than twenty years of experience. The median numbers of the livestock animals held by farmers were seven cattle, nine sheep, ten goats, and ten chickens. Although the majority of farmers did not keep any pigs, the few who did had a maximum of 52 pigs. The median land size used for livestock keeping was 1 ha, and the maximum was 9400 hectares. The median values were used given the large standard deviations.

3.2. Livelihood Vulnerability Index

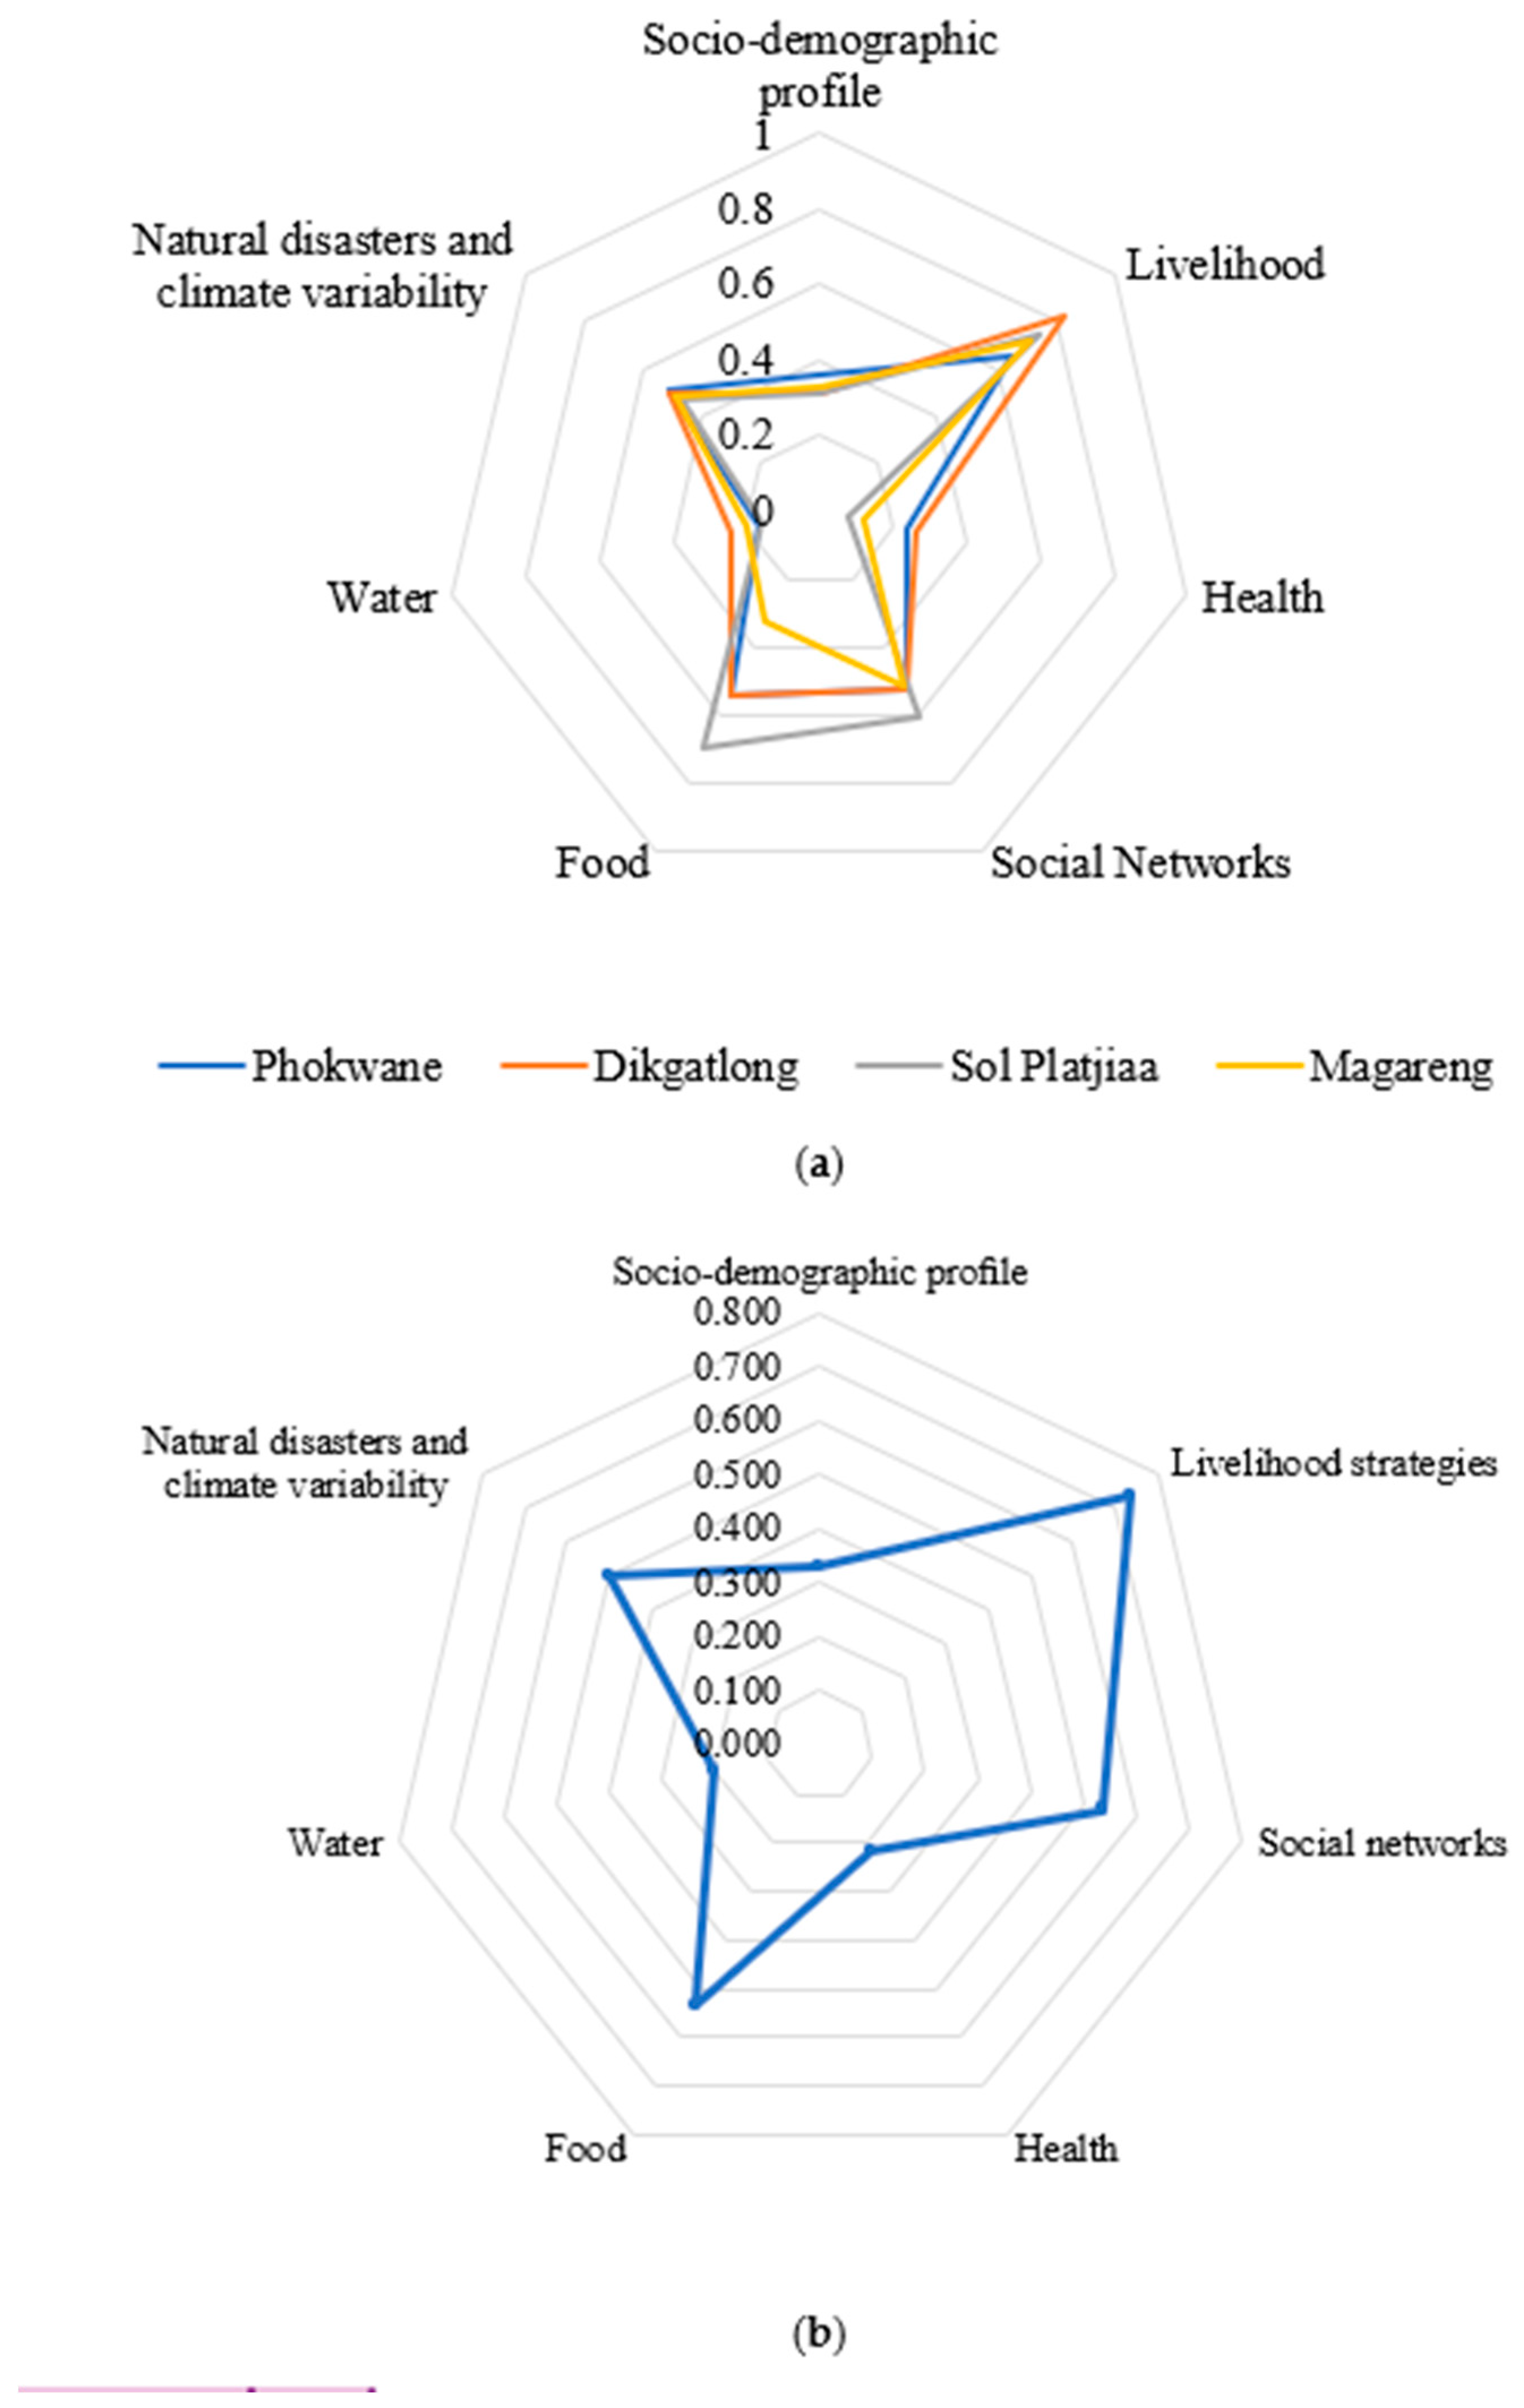
The results for the components, subcomponents, and index values for all 34 subcomponents are presented in Table 2 and in Figure 6a,b. The subcomponent variables included in the livestock farmers’ sociodemographic profiles revealed that the dependence ratio for all households in the municipalities was 4.4, with a higher number of dependents from Phokwane and fewer from Sol Plaatje, based on standardised index values. The average household size was five individuals. About 29 percent of all households were female-headed, with a higher proportion being from Phokwane, given higher standardised (index) values. Only 12 percent of the heads of households lacked formal schooling, mostly in Phokwane, and the average age of all household heads was 52 years, with the heads of female-headed households having an average age of 50 years. On average, the heads of households had an elementary/primary school education, with an average of eight years of schooling. The average standardised index value (Md) for all sociodemographic profile variables (Md) obtained from the index value of each variable across all municipalities was 0.333. Independently, Phokwane, with 0.361, had a higher value than Dikgatlong (0.307), Sol Plaatje (0.313), or Magareng (0.330).
The subcomponents of livelihood strategies showed that 69 percent of the surveyed households had family members working outside the community, and 78 percent of households depended solely on agriculture (livestock keeping) as a source of income. Dikgatlong registered a higher proportion (standardised index value 0.822) than the other local municipalities. The agricultural livelihood diversification index (ALDI) was the proportion of household members with multiple occupations. The general subcomponent value of a standardised agricultural LDI was 0.434, and the average subcomponent value was 0.74, with both Dikgatlong and Sol Plaatje having a value of 0.8. The average standardised index value for all variables of the livelihood strategy component (Md) across all municipalities was 0.737; this was also homogeneous, although Dikgatlong had a higher average value of 0.828.
Regarding health vulnerability, 17 percent of households had a family member who had to miss school or work due to drought. The average standardised value was 0.171. Phokwane (0.214) and Dikgatlong (0.178) had higher incidences/proportions than Sol Plaatje (0.05) and Magareng (0.087). On average, 28 percent of households had member who experienced anxiety and depression due to drought, with the standardised index value at 0.276. Only Dikgatlong (0.344) and Magareng (0.304) had higher index values. Similarly, 24 percent experienced depression due to livestock death, with an average index value of 0.235. Farmers from Phokwane (0.262) and Dikgatlong (0.289) reported higher values. On average, 20 percent of households had poor health conditions due to drought (index value of 0.198), with Phokwane (0.25) and Dikgatlong (0.233) recording higher standardised values. The standardised average of health in general was 0.22 and varied across municipalities, with Phokwane (0.238) and Dikgatlong (0.261) showing higher values.
With respect to social networks, 78 percent of farmers did not approach the government or non-governmental organisations for assistance (standardised index value of 0.776). Less than half (47 percent) of the households reported using the internet (index value of 0.47), a value which was only higher in Sol Plaatje (index value of 0.6). Only 11 percent of households reported participating in village help activities (average standardised index value of 0.114). The proportion of households owning a mobile phone was 60 percent, and 35 percent reported having no radio. About 91 percent of households did not borrow or lend money in the month before the survey, and this was similar across the four municipalities. The general value of the standardised average of the social network (Md) was 0.536, with the Sol Plaatje municipality reflecting a higher-than-average value of 0.611.
Regarding food vulnerability, 62 percent of households reported a decrease in food consumption patterns due to drought. The proportion was higher in Sol Plaatje, with an index value of 0.8, and lower in Magareng (0.261). The proportion of households in which choice of food preferences was affected by drought was 55 percent, with a higher proportion seen in Sol Plaatje, with an index value of 0.8, and a lower one in Magareng (0.348). The average livestock diversification index was 0.43 across all municipalities. The index showed that Sol Plaatje had more diversity in livestock, with an index value of 0.51, and that there was less diversification in Magareng (0.37). As for the general food value, the standardised average (Md) for the food component was 0.535, which was also higher in Sol Plaatje municipality (0.703) and lower in Magareng (0.326).
The availability of water was a problem: 20 percent of households used natural water sources, 23 percent had a water storage system, and only 18 percent had sufficient drinking water for livestock. These proportions were the same across all municipalities; only 8 and 5 percent of households in Phokwane and Sol Plaatje, respectively, had enough water for livestock. The overall Md for water vulnerability was 0.202.
Regarding vulnerability from climate variability and natural disaster exposure, climatological variables showed that the mean standard deviation of monthly average maximum and minimum daily temperatures from 1992 to 2023 was 5.2 °C and 5.974 °C, respectively. The mean standard deviation of monthly average precipitation during the same period was 40.192 mm. Regarding natural disasters, 68 percent of households lost livestock due to natural disasters, including death, in the last five years. An average of 21 percent of livestock were lost due to climate- and weather-related events, and a higher proportion of loss occurred in Dikgatlong (average index value of 0.097). Regarding drought, 56 percent of farmers experienced a high environmental impact, 62 percent experienced a high financial impact, and 59 percent experienced a high personal impact. The Md for climate variability and the natural disaster component was 0.499.
Generally, high vulnerability was observed with livelihood strategies, food and natural disasters, and climate change components, while health, water, and sociodemographic components had moderate vulnerabilities. Using Equation (7), composite livelihood vulnerability was computed, and these values are presented in Table 2. Figure 6a,b shows major LVI components per local municipality and in general. Farmers from all municipalities were highly vulnerable, with a composite LVI of 0.436, which was close to the highest value of 0.5, which is associated with the most vulnerable individuals. In relative terms, Dikgatlong had the highest LVI score, 0.449, while Magareng had the lowest LVI score, with 0.398, although all scores indicated a high vulnerability to climate change impacts associated with drought in the province.

3.3. Livelihood Vulnerability Index-Intergovernmental Panel on Climate Change

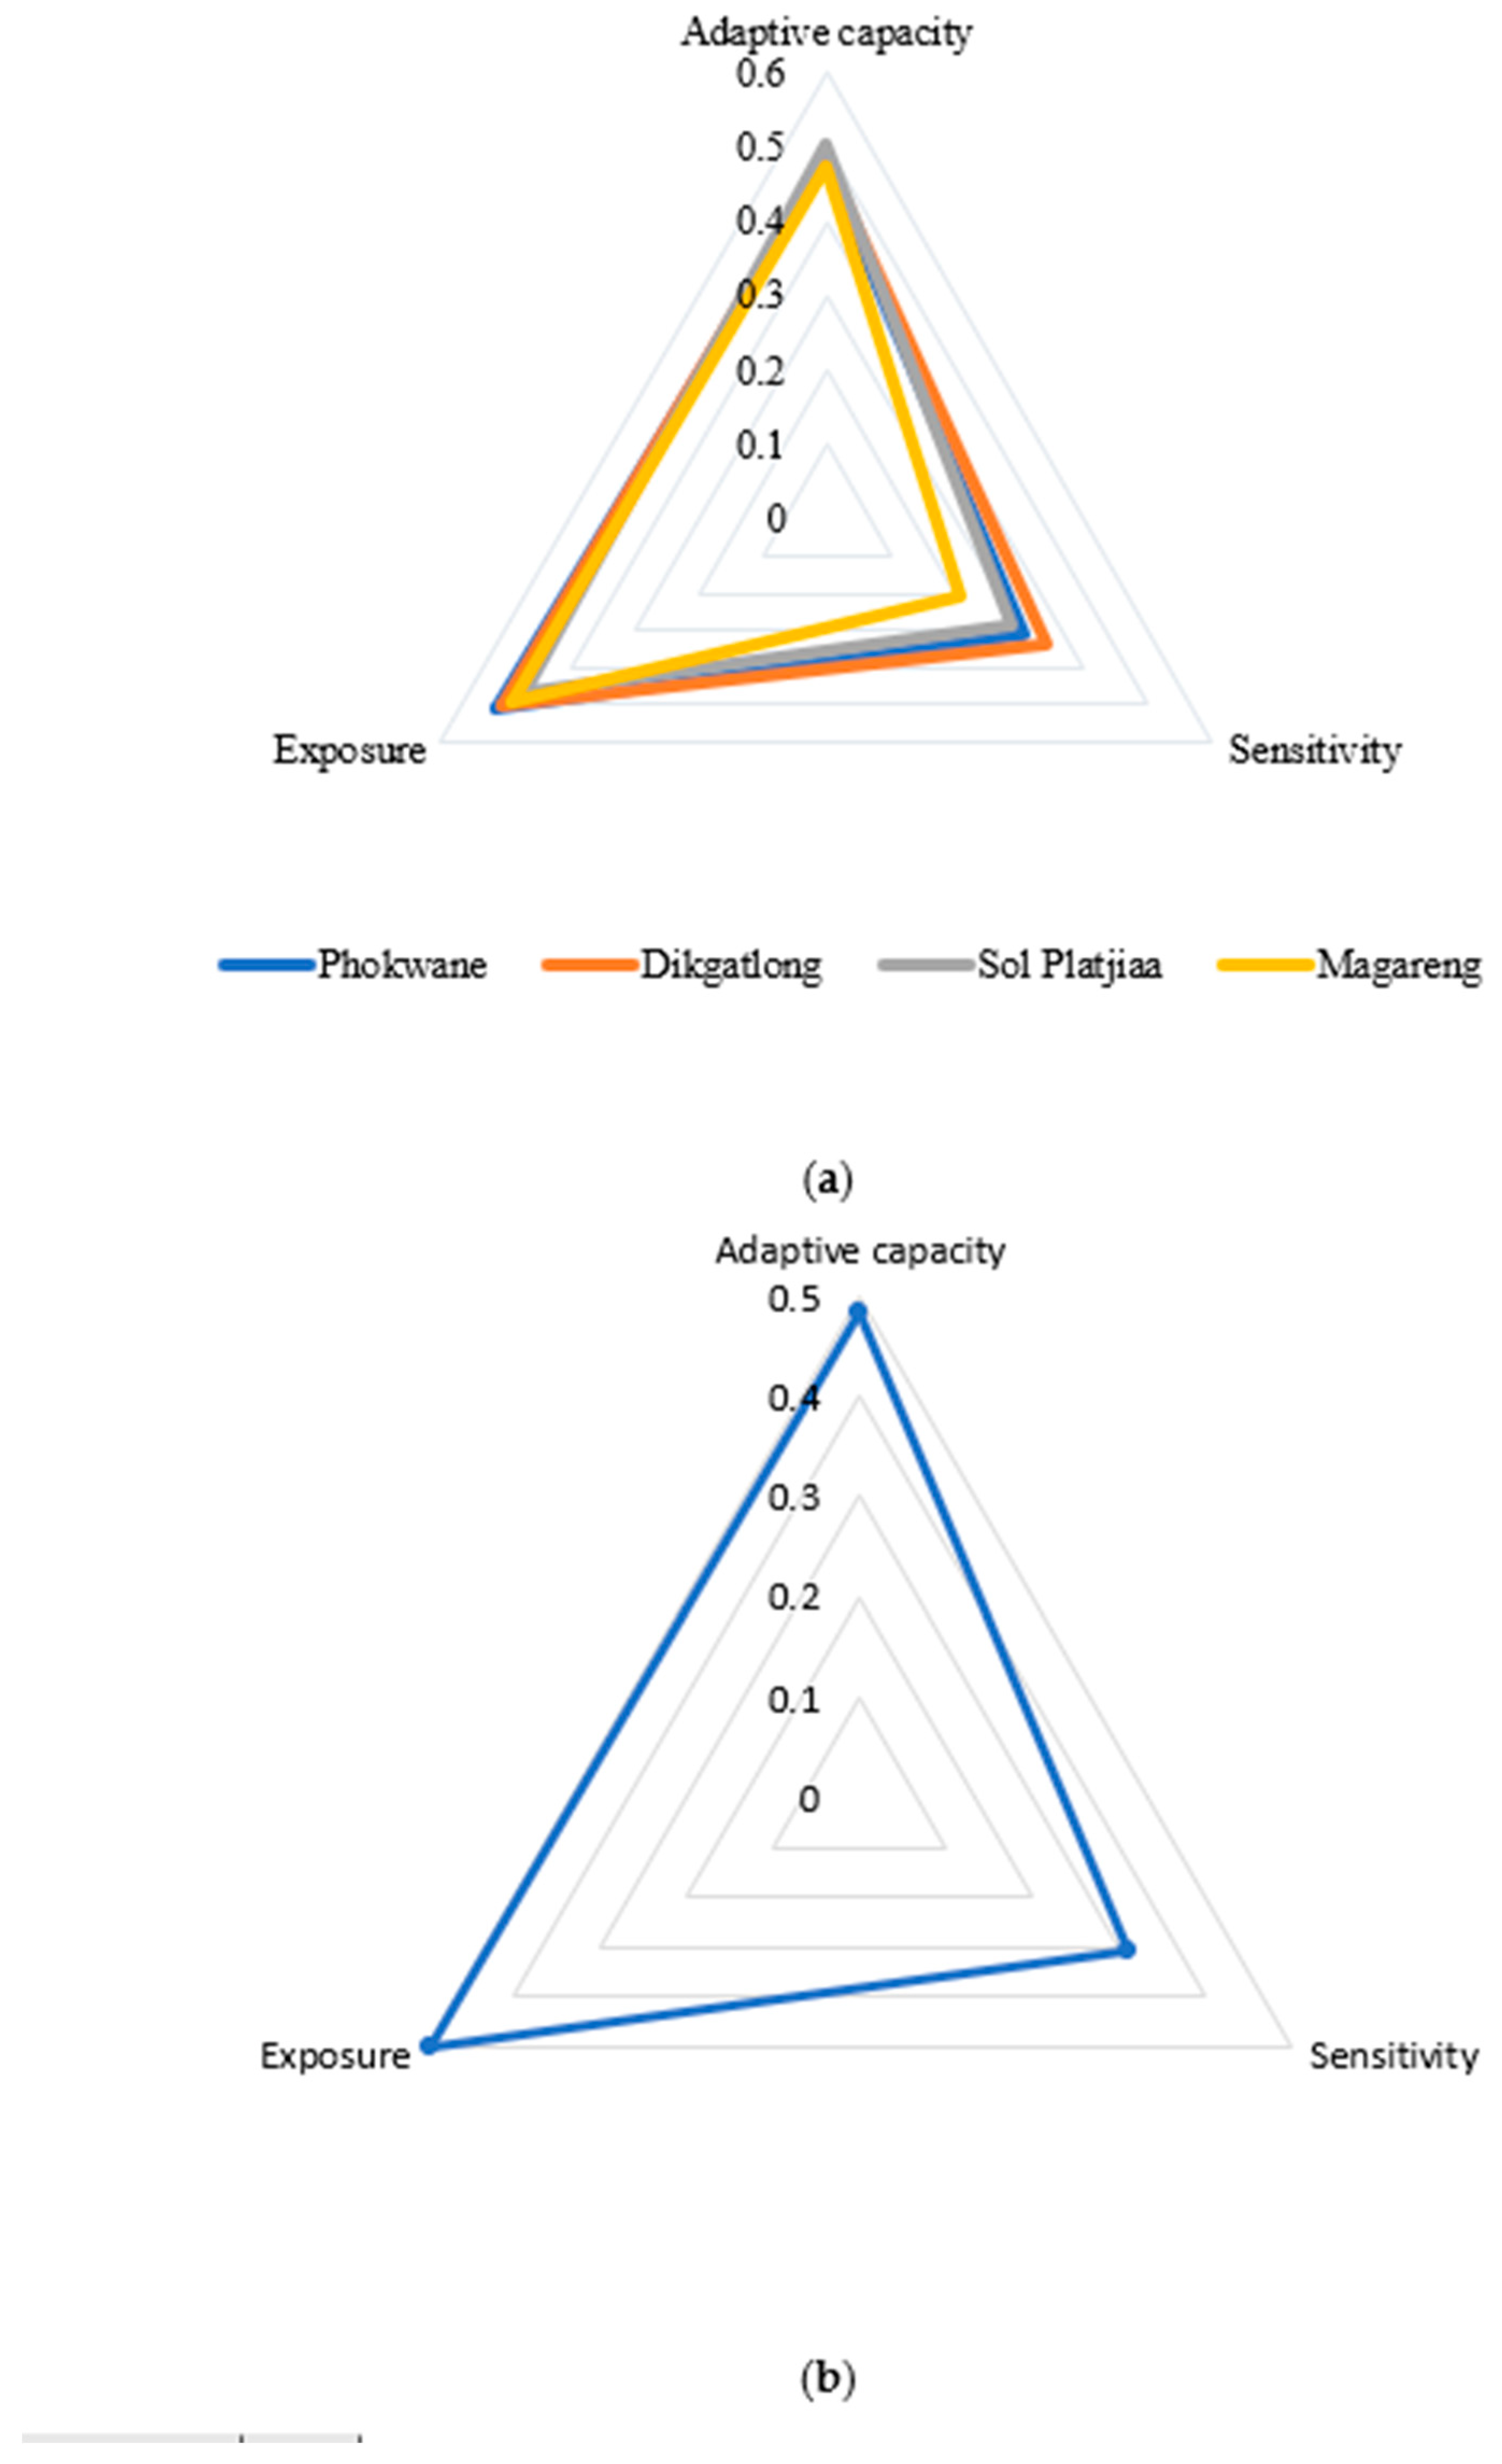
The LVI analysis using the IPCC analysis generated similar results to the LVI–IPCC scores: Phokwane, 0.011; Dikgatlong, 0.005; Sol Plaatje, −0.011; and Magareng 0.003 (Table 3). Figure 7a,b present local municipality and general vulnerability triangles, respectively. The triangles demonstrate that Phokwane (0.513) and Dikgatlong (0.504) may be more exposed to the impacts of climate change than Sol Plaatje (0.469) and Magareng (0.489).
Similar results were obtained when considering health status, food, and water security, where Phokwane (0.308) and Dikgatlong (0.341) were more sensitive to climate change than Sol Plaatje (0.289) and Magareng (0.206). Regarding demographics, livelihoods, and social networks, Sol Plaatjie showed a higher adaptive capacity (0.5505), followed by Dikgatlong (0.488), Phokwane (0.477), and Magareng (0.472). The overall LVI–IPCC scores reflected that Phokwane (0.011), Dikgatlong (0.005), and Magareng (0.003) farmers were more vulnerable than those of Sol Plaatje (−0.011) who exhibited a moderate level of vulnerability, which can be attributed to higher adaptive capacity.

4. Discussion

The results of this study indicated that the social profile of the farmers comprised adults with an elementary education but with experience in livestock farming. However, many conducted their farming on a small scale (in land size), with fewer farmers owning large areas of land and performing commercial livestock farming. These findings are also reflected by Stats SA [33]. Most small-scale farming households reared a range of livestock which included cattle, sheep, goats, and chickens.
The results of the sociodemographic LVI showed a high dependence ratio, especially for Phokwane farmers, which also reflected a higher standardised index and thus higher sensitivity to climate/drought risks. Old age, high dependence, and fewer years of education resulted in a general vulnerability of 0.33. Higher sociodemographic vulnerability makes farmers more sensitive to drought risks because few resources will be targeted to enhance farm adaptive capacity, thus necessitating immediate attention to risks. These findings are consistent with Ntali and Lyimo [34] in South Africa and Rakgase and Norris [35] in Cameroon. In these studies, sociodemographic variables such as education and dependence constrained adaptive capacity during drought periods, subsequently elevating the risk of incidence. This necessitates pragmatic policy approaches to improve sociodemographic profiles and increase resilience to droughts. This also enhances calls for government assistance, training, and insurance coverage to increase farmers’ adaptive capacities.
The results showed that livelihood strategies contribute significantly to farmers’ vulnerability. Many farmers relied on livestock keeping, leaving them with limited livelihood options. The reliance on small-scale livestock rearing as the sole source of income diminishes a farmer’s ability to cope with risks arising from droughts and natural disasters. It is worth noting that engaging in multiple farm and non-farm income-generating activities can serve as a buffer against drought-related risks, thereby enhancing adaptive capacity. Hahn et al. [27], Mugandani et al. [7], and Sujakhu et al. [36] in Zimbabwe, Nepal, and Mozambique, respectively, reported high levels of vulnerability for livelihood strategies because farmers lacked social support, and smaller livelihood diversity with an over-reliance on agriculture. This calls for policy approaches which are more sustainable and that will expand livelihood diversity.
Smallholder livestock farmers exhibited health vulnerability associated with anxiety and depression because of drought-related impacts, especially in Dikgatlong and Magareng. Livestock farmers from these municipalities experienced more depression due to the death of livestock and deterioration of their health. This condition increases their susceptibility to secondary drought and disaster impacts. This condition has a cumulative effect by increasing farmers’ sensitivity to drought risks because of suboptimal resource allocation. Obrien et al. [37] and Stain et al. [38] provide similar deductions in which drought conditions influence farmers’ psychological and health conditions, which weakens their adaptive capability and elevates their exposure to subsequent climate change risks. Thus, appropriate measures to decrease livestock lost due to drought are important for improving farmers’ adaptive abilities.
Social network vulnerability was high, as many farmers did not report or seek help from the government or non-governmental organisations and did not own mobile phones or radios. A lack of social connections lowers the chances of obtaining relevant information related to climate or related mitigating options. This calls for policy action to increase access to information related to climate and sustainable farming practices by strengthening farmers’ networks [39,40].
The general vulnerability as to food and water was also high, as farming households showed decreased food consumption patterns, food preferences, and smaller livestock diversity. Moreover, with few natural water sources, farmers did not have sufficient water for livestock. This reflects the high food and water insecurity. Similarly, Sujakhu et al. [36] related that food and water security play a significant role in determining livelihood vulnerability, and increasing their access and security is important, especially in drought-stricken areas. Limited water sources and storage infrastructure for farmers could be addressed by the construction of dams and water tanks.
Vulnerability due to climatological factors and natural disasters was also high among smallholder livestock farmers; this risk is brought about by large variations in temperature and rainfall. Livestock death due to drought, climate, and weather-related events, and subsequent secondary environmental, personal, and financial impacts were also reported as disasters. Studies by Awazi et al. [41], Bahta and Lombard [19], and Sattar et al. [40] show that climatological factors and natural disasters have had significant impacts on farmers in Cameroon and South Africa, as they increase vulnerability and affect food and financial security. In general, this caused municipalities to record a high LVI. Therefore, strategic and targeted interventions are needed to enhance the resilience of smallholder livestock farmers toward climatological factors and natural disasters.
The LVI-IPCC framework similarly showed high exposure to drought impact among livestock farmers, especially those from Phokwane and Dikgatlong municipalities, which was attributed to losses incurred due to drought and climatological factors. The same municipalities also exhibit high sensitivity to climate change impacts owing to poor health, food and water insecurity, and low adaptive capacity. In general, farmers exhibited moderate vulnerability, and these findings concur with Bahta [42] and Myeki and Bahta [15], who found that drought events increased the social vulnerability of livestock farmers in the region. This calls for government and stakeholder-coordinated support to enhance farmers’ agricultural drought resilience. Farmers should have access to targeted financial support/aid and programmes which would enable them to recover from drought-related losses and build their adaptive capacity to drought impacts.

5. Conclusions

Agricultural drought in the Northern Cape has significantly increased the livelihood vulnerability of smallholder livestock farmers. The major findings from both the LVI and the LVI-IPCC revealed that smallholder livestock farmers’ livelihoods in the Northern Cape Province were vulnerable to the impacts of drought caused by climate change. High livelihood vulnerability was attributed to narrow livelihood options/strategies; weak or poor sociodemographic components due to high dependence and low education; lack of social networks, which constrained access to information and social support; high food, water, and health insecurity due to changing consumption patterns; lack of enough water for livestock; the psychological impact of drought; and overall losses due to variations in climatological factors (temperature and rainfall) and natural disasters. The LVI-IPCC showed high exposure, high sensitivity, and low adaptive capacity, resulting in high vulnerability, especially for the Phokwane, Dikgatlong, and Magareng municipalities in the Frances Baard District Municipality.
The policy implications of this study include pragmatic sustainable efforts that will enable smallholder farmers to decrease their overall dependence on farming and increase livelihood diversity, thereby increasing their adaptive capacity and resilience to droughts. This study also calls for improved and strengthened government and non-governmental organisation/stakeholder networks and information access among farmers, which will increase coordinated efforts to address drought/climate-related impacts. Stakeholder-coordinated efforts are called for to decrease this sensitivity by increasing food, water, and health security to address the decrease in livestock losses through sustainable farming while ensuring farmers’ access to food and water. In general, given the continued recurrences of drought in the area, strategic and targeted interventions to enhance the resilience of smallholder livestock farmers by increasing their adaptive capacity, while decreasing exposure risks and sensitivity by the government and other stakeholders are called for.
The findings of this research are not without limitations. The research did not include certain control variables/subcomponents from the standard LVI framework, such as the average give and lend money ratio for the social network component, the average time to a health facility for the health component, and the number of litres of water stored for the water component, which could have improved the vulnerability assessment process. Additionally, the climatological variables were averaged for all municipalities due to the lack of municipality-specific climate information. This study’s reliance on data from farmers may have introduced biases, particularly in reporting negative or high-impact information. It should also be noted that the study was limited to the Frances Baard District Municipality; therefore, any inferences made for the entire Northern Cape Province should be made with caution. Further research is needed to evaluate the vulnerability of a distinct set of livestock farmers in the area, as the tolerance and adaptation to drought risks may vary across livestock species.

Author Contributions

All the authors contributed significantly to the preparation of this paper. S.A.N. was involved in the study design, conceptualization, analysis, and review, and the writing of the first draft. Y.T.B. aided in the study design, conceptualization, and review, and the writing of the final draft, secured resources, and served as a project manager. All authors have read and agreed to the published version of the manuscript.

Funding

The National Research Foundation (NRF) of South Africa funded this research, grant number TTK170510230380.

Institutional Review Board Statement

The study obtained an ethical clearance certificate from the University of the Free State General/Human Research Ethics Committee (GHREC); the reference number is UFSHSD2020/0359/2704.

Informed Consent Statement

Informed consent was obtained from all subjects involved in the study.

Data Availability Statement

The datasets used and analysed during the current study are available from the corresponding author (Y.T.B.) upon reasonable request.

Acknowledgments

We acknowledge and thank the National Research Foundation (NRF), Thuthuka funding instrument, for funding the project “Household Resilience to Agricultural Drought in the Northern Cape province of South Africa” (contract number/project number TTK170510230380).

Conflicts of Interest

The authors declare no conflicts of interest.

References

  1. Abbass, K.; Zeeshan, M.; Huaming, Q.; Muntasir, S.; Mahmood, H. A review of the global climate change impacts, adaptation, and sustainable mitigation measures. Environ. Sci. Pollut. Res. 2022, 29, 42539–42559. [Google Scholar] [CrossRef]
  2. Lottering, S.; Mafongoya, P.; Lottering, R. Drought and its impacts on small-scale farmers in sub-Saharan Africa: A review. S. Afr. Geogr. J. 2021, 103, 319–341. [Google Scholar] [CrossRef]
  3. Nhemachena, C.; Nhamo, L.; Matchaya, G.; Nhemachena, C.R.; Muchara, B.; Karuaihe, S.T.; Mpandeli, S. Climate Change Impacts on Water and Agriculture Sectors in Southern Africa: Threats and opportunities for sustainable development. Water 2020, 12, 2673. [Google Scholar] [CrossRef]
  4. Bahta, Y.T.; Myeki, V.A. Adaptation, coping strategies and resilience of agricultural drought in South Africa: Implication for the sustainability of livestock sector. Heliyon 2021, 7, e08280. [Google Scholar] [CrossRef]
  5. Ogundeji, A.A. Adaptation to Climate Change and Impact on Smallholder Farmers’ Food Security in South Africa. Agriculture 2022, 12, 589. [Google Scholar] [CrossRef]
  6. Thao, N.T.T.; Khoi, D.N.; Xuan, T.T.; Tychon, B. Assessment of Livelihood Vulnerability to Drought: A Case Study in Dak Nong Province, Vietnam. Int. J. Disaster Risk Sci. 2019, 10, 604–615. [Google Scholar] [CrossRef]
  7. Mugandani, R.; Muziri, T.; Murewi, C.T.F.; Mugadza, A.; Chitata, T.; Sungirai, M.; Zirebwa, F.S.; Manhondo, P.; Mupfiga, E.T.; Nyamutowa, C.; et al. Mapping and Managing Livelihoods Vulnerability to Drought: A Case Study of Chivi District in Zimbabwe. Climate 2022, 10, 189. [Google Scholar] [CrossRef]
  8. Daniell, J.; Wenzel, F.; Schaefer, A. The economic costs of natural disasters globally from 1900–2015: Historical and normalised floods, storms, earthquakes, volcanoes, bushfires, drought and other disasters. In Geophysical Research Abstracts; Geophysical Insititute & Center for Disaster Management and Risk Reduction Technology, Karlsruhe Institute of Technology: Karlsruhe, Germany; Melbourne, VIC, Australia, 2016; p. 2016. [Google Scholar]
  9. Maltou, R.; Bahta, Y.T. Factors influencing the resilience of smallholder livestock farmers to agricultural drought in South Africa: Implication for adaptive capabilities. Disaster Risk Stud. 2019, 11, 4102. [Google Scholar] [CrossRef]
  10. Vetter, S. Effect of drought on communal livestock farmers in KwaZulu-Natal, South Africa. Afr. J. Range Forage Sci. 2020, 37, 93–106. [Google Scholar] [CrossRef]
  11. Bogale, G.A.; Erena, Z.B. Drought vulnerability and impacts of climate change on livestock production and productivity in different agro-Ecological zones of Ethiopia. J. Appl. Anim. Res. 2022, 50, 471–489. [Google Scholar] [CrossRef]
  12. Bahta, Y.T.; Myeki, V.A. The Impact of Agricultural Drought on Smallholder Livestock Farmers: Empirical Evidence Insights from Northern Cape, South Africa. Agriculture 2022, 12, 442. [Google Scholar] [CrossRef]
  13. Danso-abbeam, G.; Ogundeji, A.A.; Ojo, T.O.; Okolie, C.C. Livelihood Impact and Risk Management of Drought: The Experiences of Farming Households in the Free State Province, South Africa. Free. State. Nat. Hazards 2021. Preprint. [Google Scholar]
  14. Nordstrom, A.; Cotton, C. Impact of a Severe Drought on Education: More Schooling but Less Learning; Department of Economics, Queen’s University: Kingston, LO, Canada, 2020; pp. 1–31. [Google Scholar]
  15. Myeki, V.A.; Bahta, Y.T. Determinants of smallholder livestock farmers’ household resilience to food insecurity in South Africa. Climate 2021, 9, 117. [Google Scholar] [CrossRef]
  16. Kayastha, R.B.; Lee, W.K.; Shrestha, N.; Wang, S.W. Assessing the Livelihood Vulnerability of Nomads to Changing Climate in the Third Pole Region of Nepal. Land 2023, 12, 1105. [Google Scholar] [CrossRef]
  17. Maru, H.; Haileslassie, A.; Zeleke, T.; Esayas, B. Analysis of smallholders’ livelihood vulnerability to drought across agroecology and farm typology in the upper awash sub-basin, Ethiopia. Sustainability 2021, 13, 9764. [Google Scholar] [CrossRef]
  18. Tofu, D.A.; Haile, F.; Tolossa, T. Livelihood vulnerability and socio-economic determinants of households to climate change-induced recurrent drought in Ethiopia. GeoJournal 2023, 88, 5043–5067. [Google Scholar] [CrossRef]
  19. Bahta, Y.T.; Lombard, W.A. Nexus between Social Vulnerability and Resilience to Agricultural Drought amongst South African Smallholder Livestock Households. Atmosphere 2023, 14, 900. [Google Scholar] [CrossRef]
  20. RSA. Frances Baard District, Northern Cape: Profile and Analysis, District Development Model. 2020. Available online: https://municipalities.co.za/map/134/frances-baard-district-municipality (accessed on 25 April 2024).
  21. uMoya-NILU Consulting (Pty) Ltd. Air Quality Management Plan for the Northern Cape; Air Quality Baseline Assessment Report for Northern Cape Department of Environment and Nature Conservation, Report No. uMN072-2017; uMoya-NILU Consulting (Pty) Ltd.: Kimberley, South Africa, 2017. [Google Scholar]
  22. Melketo, T.; Schmidt, M.; Bonatti, M.; Sieber, S.; Müller, K.; Lana, M. Determinants of pastoral household resilience to food insecurity in Afar region, northeast Ethiopia. J. Arid. Environ. 2021, 188, 104454. [Google Scholar] [CrossRef]
  23. Stats, S.A. (Statistics South Africa), Community Survey 2016: Provincial Profile Northern Cape; Report No. 03-01-14; Statistics: Pretoria, South Africa, 2016. [Google Scholar]
  24. Northern Cape Department of Agriculture, Forestry, and Fisheries (NDAFF). Beneficiaries of an Agricultural Drought Relief Program; NDAFF: Kimberly, South Africa, 2020. [Google Scholar]
  25. Cochran, W.G. Sampling Techniques; John Wiley & Sons: Hoboken, NJ, USA, 1977. [Google Scholar]
  26. Bartlett, J.E.; Kotrlik, J.; Higgins, C. Organizational research: Determining appropriate sample size in survey research appropriate sample size in survey research. Inf. Technol. Learn. Perform. J. 2001, 19, 43–50. [Google Scholar]
  27. Hahn, M.B.; Riederer, A.M.; Foster, S.O. The Livelihood Vulnerability Index: A pragmatic approach to assessing risks from climate variability and change-A case study in Mozambique. Glob. Environ. Chang. 2009, 19, 74–88. [Google Scholar] [CrossRef]
  28. UNDP. Human Development Report 2007/2008—Fighting Climate Change: Human Solidarity in a Divided World [Internet]; Palgrave Macmillan: New York, NY, USA, 2007. [Google Scholar]
  29. Mekuria, W.; Mekonnen, K. Determinants of crop-livestock diversification in the mixed farming systems: Evidence from central highlands of Ethiopia. Agric. Food Secur. 2018, 7, 1–15. [Google Scholar] [CrossRef]
  30. Rehima, M.; Belay, K.; Dawit, A.; Rashid, S. Factors affecting farmers’ crops diversification: Evidence from SNNPR, Ethiopia. Int. J. Agric. Sci. 2013, 3, 558–565. [Google Scholar]
  31. IPCC. Climate Change 2001: Impacts, Adaptation & Vulnerability [Internet]. Contribution of Working Group II to the Third Assessment Report of the Intergovernmental Panel on Climate Change. Cambridge, United Kingdom. 2001. Available online: http://www.ipcc.ch/ipccreports/tar/wg2/index.htm (accessed on 12 June 2024).
  32. Mainali, J.; Pricope, N.G. Mapping the need for adaptation: Assessing drought vulnerability using the livelihood vulnerability index approach in a mid-hill region of Nepal. Clim. Dev. 2019, 11, 607–622. [Google Scholar] [CrossRef]
  33. Stats, S.A. Census of Commercial Agriculture, 2017: Northern Cape Financial and Production Statistics, Statistics: Pretoria, South Africa, 2020; Volume 10.
  34. Ntali, Y.M.; Lyimo, J.G. Community livelihood vulnerability to drought in semi-arid areas of northern Cameroon. Discov. Sustain. 2022, 3, 22. [Google Scholar] [CrossRef]
  35. Rakgase, M.; Norris, D. Factors that Influence Choice of Drought Coping Strategies in Limpopo Province, South Africa. J. Hum. Ecol. 2014, 47, 111–116. [Google Scholar] [CrossRef]
  36. Sujakhu, N.M.; Ranjitkar, S.; He, J.; Schmidt-Vogt, D.; Su, Y.; Xu, J. Assessing the livelihood vulnerability of rural indigenous households to climate changes in Central Nepal, Himalaya. Sustainability 2019, 11, 2977. [Google Scholar] [CrossRef]
  37. Obrien, L.V.; Berry, H.L.; Coleman, C.; Hanigan, I.C. Drought as a mental health exposure. Environ. Res. 2014, 131, 181–187. [Google Scholar] [CrossRef] [PubMed]
  38. Stain, H.J.; Kelly, B.; Carr, V.J.; Lewin, T.J.; Fitzgerald, M.; Fragar, L. The psychological impact of chronic environmental adversity: Responding to prolonged drought. Soc. Sci. Med. 2011, 73, 1593–1599. [Google Scholar]
  39. Devkota, N.; Phuyal, R.K. Adoption Practice of Climate Change Adaptation Options among Nepalese Rice Farmers: Role of Information and Communication Technologies (ICTs). Am. J. Clim. Chang. 2018, 7, 135–152. [Google Scholar] [CrossRef]
  40. Sattar, R.S.; Wang, S.; Tahir, M.N.; Caldwell, C. Assessment of smallholder farmer’s vulnerability due to climate change in arid areas of Pakistan. Appl. Ecol. Environ. Res. 2017, 15, 291–312. [Google Scholar] [CrossRef]
  41. Awazi, N.P.; Tchamba, M.N.; Temgoua, L.F.; Avana, M.L.T. Appraisal of smallholder farmers’ vulnerability to climatic variations and changes in the Western Highlands of Cameroon. Sci. Afr. 2020, 10, e00637. [Google Scholar] [CrossRef]
  42. Bahta, Y.T. Social vulnerability to agricultural drought: Insights from Northern Cape, South Africa. Sci. Afr. 2022, 17, e01324. [Google Scholar] [CrossRef]
Figure 1. Map of South Africa, highlighting the Northern Cape Province, district municipalities of the Northern Cape, and four local municipalities of Frances Baard District Municipality. Source: RSA. Frances Baard District, Northern Cape [20].
Hydrology 11 00137 g001
Figure 2. (a) Combined graph of standard deviations of annual average daily minimum and maximum temperatures in the Northern Cape from 1992 to 2023, and their differences. (b) Circular graph of standard deviations for average monthly maximum and minimum temperatures.
Hydrology 11 00137 g002
Figure 3. Line graph of annual average rainfall and standard deviation of average monthly rainfall between 1992 and 2023 (station 0290468A9, Kimberley Weather Office).
Hydrology 11 00137 g003
Figure 4. Line graph for average monthly daily rainfall from 2014 to 2023. AWS: automated weather station; WO: weather office.
Hydrology 11 00137 g004
Figure 5. Livelihood Vulnerability Index and Intergovernmental Panel on Climate Change (LVI-IPCC) methodological chart.
Hydrology 11 00137 g005
Figure 6. Vulnerability radar chart of the major components of the Livelihood Vulnerability Index (LVI) for smallholder livestock farmers, (a) for Phokwane, Dikgatlong, Sol Plaatje, and Magareng Municipalities; and (b) for Frances Baard District Municipality, in Northern Cape, South Africa.
Hydrology 11 00137 g006
Figure 7. Vulnerability triangle diagram of the contributing factors of the Livelihood Vulnerability Index-IPCC (LVI–IPCC) for smallholder livestock farmers, (a) for Phokwane, Dikgatlong, Sol Plaatje, and Magareng Municipalities; (b) for Frances Baard District Municipality in Northern Cape, South Africa.
Hydrology 11 00137 g007
Table 1. Descriptive statistics of socioeconomic characteristics of livestock farmers.
Freq%MeanMedianSt.devMinMax
Age (years)21–30135.9951.665214.162185
31–404219.35
41–504219.35
51–605927.19
61+6128.11
SexFemale6128.10.72 0.4501
Male15671.9
EducationPrimary11854.388.0194.31016
Secondary9141.94
Tertiary83.68
Household size1–10204944.9752.88125
11–25136
Farming experience (years)0.5–2019690.3210.9298.860.560
21–60219.68
Livestock holdingCattle 14.72722.600200
Sheep 13.97919.640121
Goats 17.031022.500198
Chickens 40.2610140.3601000
Pigs 3.4807.95052
Land size (ha) 477.0411338.3809400
Table 2. Normalised and indexed subcomponents, major components, and overall Livelihood Vulnerability Indexes (LVI) for smallholder livestock farmer households (HH) in Northern Cape Province, South Africa.
LVI ComponentsSubcomponents Subcomponent Value for All the LMs Index (sd)
UnitMaximum ValueMinimum ValueOverall Index ValuePhokwaneDikgatlongSol PlaatjeMagareng
Sociodemographic profileDependency ratio;Ratio 4.4112.510.2970.3420.2690.2130.312
Percent of female-headed HHs;Percent28.510000.2850.4340.1590.2500.261
Percent of HHs where the head did not attend school;Percent12.010000.1200.1670.1110.0000.087
Average age of HH heads;Years 51.6685210.4790.4530.5000.5310.469
Education level of HH head;Years 8.011600.5010.4380.5000.5000.563
Average age of female HH heads;Years 5079230.4820.4820.4820.5710.411
Average HH size. 4.972510.1650.2080.1250.1250.208
Md 0.3330.3610.3070.3130.330
Livelihood strategiesPercentage of HHs with family members working outside the community;Percent6910000.6900.5310.8620.6320.652
Percent of households dependent solely on agriculture as a source of income;Percent78.310000.7830.7380.8220.8000.783
Average Agricultural Livelihood Diversification Index (range: 0.20–1) = (1/(number of occupation + 1)).ALDI0.43430.50.250.7370.6800.8000.8000.720
Md 0.7370.6500.8280.7440.718
HealthPercentage of households in which a family member had to miss school or work due to drought;Percent17.110000.1710.2140.1780.0500.087
Percentage of households that experienced anxiety and depression due to drought;Percent27.610000.2760.2260.3440.1500.304
Percent of HHs that experienced depression due to livestock death;Percent23.510000.2350.2620.2890.1000.043
Percent of HHs with poor health conditions because of drought.Percent 19.810000.1980.2500.2330.0000.043
Md 0.2200.2380.2610.0750.119
Social NetworksPercentage of HHs that have not gone to government or non-governmental organisations for assistance;Percent 77.610000.7760.8050.7441.0000.556
Percentage of HHs using the internet;Percent 4710000.4700.4520.4670.6000.435
Percentage of HHs that participated in the village assistance activitiesPercent 11.410000.1140.1140.1140.1140.114
Percentage of HHs owning a mobile phone;Percent 59.510000.5950.5600.5960.6500.682
Percentage of HHs without radios;Percent 34.810000.3480.2960.3950.3000.391
Percentage of people who have not borrowed or lent money in the past month.Percent 91.210000.9120.9400.8671.0000.913
Md 0.5360.5280.5310.6110.515
FoodPercentage of households in which the food consumption pattern decreased due to drought;Percent 62.210000.6220.6670.6330.8000.261
Percentage of households in which choice of food preferences was affected because of drought;Percent 55.310000.5530.5360.5670.8000.348
Average Livestock Diversification Index (calculated by Margalef Diversification Index).Livestock DI 0.4295100.4300.4200.4400.5100.370
Md 0.5350.5410.5470.7030.326
WaterPercentage of HHs using natural water sources;Percent 19.8710000.1990.1990.1990.1990.199
Percent of HHs with water storage;Percent 22.710000.2270.2270.2270.2270.227
Percent of HHs having enough drinking water for livestock.Percent 1810000.1800.0830.3000.0500.174
Md 0.2020.1700.2420.1590.200
Natural disasters and climate variabilityMean standard deviation of monthly average minimum daily temperature (1992–2020);°C5.97386.78825.03610.5350.5170.5170.5170.517
The mean standard deviation of monthly average maximum daily temperature (2010–2020);°C5.20006.09714.23490.5180.5140.5140.5140.514
Mean standard deviation of monthly average precipitation (2010–2020);mm40.192171.349117.67090.4200.4720.4720.4720.472
Percentage of HHs suffering any loss (agriculture or livestock) to natural disasters, including death, in the last five years;Percent 67.710000.6770.6790.7110.6000.609
Average number of livestock lost due to climate and weather-related events;LU21.6930330.0620.0300.0970.0470.057
Percentage of HHs that experienced high environmental impact due to drought;Percent 56.210000.5620.6190.5110.5000.609
Percentage of HHs that experienced high financial impact due to drought;Percent 62.210000.6220.6550.6000.5500.652
Percentage of HHs that experienced high personal impact due to drought.Percent 59.410000.5940.6190.6110.5500.478
Md 0.4990.5130.5040.4690.489
LVI 0.4360.4360.4490.4330.398
Md: Average standardised index value.
Table 3. Livelihood Vulnerability Index-Intergovernmental Panel on Climate Change (LVI–IPCC) contributing factors calculation for smallholder livestock farmers in Northern Cape, South Africa.
Subcomponents Major Component ValuesNumber of Subcomponents per Major Component
PhokwaneDikgatlongSol PlaatjeMagarengGeneral
Adaptive capacitySociodemographic profile0.3610.3070.3130.3300.3337
Livelihood strategies0.6500.8280.7440.7180.7373
Social networks0.5280.5310.6110.5150.5366
SensitivityHealth0.2380.2610.0750.1190.2204
Food0.5410.5470.7030.3260.5353
Water0.1700.2420.1590.2000.2023
ExposureNatural disasters and climate variability0.5130.5040.4690.4890.4998
Contributing factor valuesAdapd0.4770.4880.5050.4720.485
Sensd0.3080.3410.2890.2060.309
Expd0.5130.5040.4690.4890.499
LVI-IPCC Value 0.0110.005−0.0110.0030.004
Disclaimer/Publisher’s Note: The statements, opinions and data contained in all publications are solely those of the individual author(s) and contributor(s) and not of MDPI and/or the editor(s). MDPI and/or the editor(s) disclaim responsibility for any injury to people or property resulting from any ideas, methods, instructions or products referred to in the content.