Abstract
Freshwater, vital for life and ecosystems, accounts for only 2.5% of Earth’s water, and is primarily located in polar caps, underground reservoirs, and surface water. Its quality varies due to environmental interactions, especially in groundwater. Tenerife, located in the Canary Islands, Spain, relies mainly on underground aquifers and tunnels capturing 51.6 cubic hectometers annually. Ensuring safe drinking water is a global challenge due to health risks from poor water quality, including diseases and cancer. Fluoride, sodium, and potassium are essential for health, and are mainly derived from groundwater as fluoride ions (F−) and sodium and potassium cations (Na+, K+). However, excessive F−, Na+, and K+ in drinking water is harmful. The World Health Organization limits F− to 1.5 mg/L, Na+ to 8.70 meq/L, and K+ to 0.31 meq/L. Geological, climatic, and human factors control the presence and transport of F−, Na+, and K+ in groundwater. Seismic events can impact water quality, with long-term effects linked to aquifer structure and transient effects from gas and fluid expansion during earthquakes. This study was motivated by a 3.8 mbLg earthquake in Tenerife in 2012, which allowed its impact on groundwater quality, specifically F−, Na+, and K− concentrations, to be examined. Post-earthquake, F− levels alarmingly increased to 8.367 meq/L, while Na+ and K+ showed no significant changes. This research quantifies the influence of earthquakes on increasing F− levels and evaluates F− reduction during low seismic activity, emphasizing the importance of water management on volcanic islands.
1. Introduction
The overall quality of freshwater is primarily determined by its physical, chemical, biological, and radiological attributes. Freshwater can adopt distinct chemical properties while in the atmosphere or during evapotranspiration processes; however, these properties can undergo significant transformations when freshwater infiltrates rock formations, leading to intricate alterations in its physical, chemical, and biological composition due to its interactions with the surrounding environment. The extent and nature of these modifications in freshwater composition are contingent upon the duration and geographical context of these interactions. In groundwater, constituents generally appear in ionic forms as almost completely dissociated salts, and in partially dissociated molecular forms.
The island of Tenerife has an area of 2034.38 square kilometers and a population of 927,993 inhabitants, receiving an average influx of 490,788 tourists each month, according to 2019 data extracted from the Canary Islands Institute of Statistics [1]. This island is geographically located within the archipelago of the Canary Islands, in the Macaronesia region of the North Atlantic Ocean, near the African coast.
Tenerife is an island of volcanic origin that relies largely on underground aquifers as a source of drinking water, serving both its population and irrigation needs. Groundwater extraction primarily occurs through an intricate network of water collection tunnels. These tunnels together produce an annual volume of 51.6 million cubic meters, according to records from the Tenerife Island Council for the calendar year 2015.
One of the paramount challenges inherent to the realm of global water policy is securing a permanent source of water to supply the populace, coupled with the stringent criteria mandated for human consumption. The continual consumption of water lacking the requisite quality for human health poses a substantial risk, potentially leading to a spectrum of maladies, including dermatological, dental, hepatic, and skeletal disorders. This peril extends to a heightened susceptibility to conditions such as cancer, as documented in various studies [2,3,4,5,6,7,8].
The most recent recommendation by the World Health Organization (WHO) for fluoride levels in drinking water was detailed in their “Guidelines for Drinking-water Quality, Fourth Edition, incorporating the First Addendum,” published in 2017. The WHO recommends a guideline value of 1.5 mg/L (milligrams per liter) (0.079 meq/L) of fluoride in drinking water to prevent dental and skeletal fluorosis while ensuring the dental benefits of fluoride.
Sodium and potassium play critical roles in human physiology, essential for cellular homeostasis, metabolism, nerve, and muscle function, and overall electrolyte balance maintenance. Their balance is pivotal for health, with imbalances potentially leading to pathological consequences [9]. The WHO establishes that the maximum permissible level of sodium in drinking water is 200 mg/L (8.70 meq/L). However, the WHO also recommends that the ideal sodium level in drinking water be below 20 mg/L (0.87 meq/L), aiming to minimize health risks associated with excessive sodium consumption. The WHO recommends a daily potassium intake of at least 90 mmol/day (3510 mg/day) in adults, aiming to reduce blood pressure and the risk of cardiovascular diseases, strokes, and coronary heart disease in adults, not exceeding 12 mg/l of potassium (0.31 meq/L) [10].
The presence and transport of ions and cations in groundwater are subject to control by geotectonic, climatic, and anthropogenic factors. The hydrological and chemical reactions observed in groundwater aquifers in the aftermath of major seismic events are a global concern, particularly in areas where groundwater plays a pivotal role as a critical resource [11,12,13,14].
Certain mechanisms that document alterations in water flow or quality subsequent to an earthquake tend to exhibit a long-term character, primarily those that bring about modifications in the aquifer’s structure or water distribution, often linked to fault displacements. Nevertheless, most of these mechanisms seem to trigger transient shifts in water quality and flow due to their ephemeral nature, such as the expansion or discharge of pressurized gasses and fluids. These changes tend to revert to their pre-earthquake states once the seismic activity subsides. A comprehensive body of research has extensively documented the groundwater response at varying distances from an earthquake’s epicenter across a range of rock types [15,16,17,18].
Numerous studies have investigated the impact of non-anthropogenic events, such as earthquakes, on groundwater wells, particularly focusing on changes in water levels and potential turbidity resulting from sediment displacement [19,20]. While there has been research into groundwater hydrochemistry as a potential precursor to seismic activities, especially within well environments, there remains a significant gap in understanding variations in groundwater chemical composition. The behavior of cations and anions in water before and/or after seismic events remains unclear [11,21,22].
Additionally, there is limited knowledge about the effects of seismic events on groundwater sourced from deep, saturated aquifers, such as those accessed through Qanat systems in the Middle East or through long, slightly inclined tunnels like those in the Canary Islands (located off the west coast of Africa, near the coasts of southern Morocco and northern Western Sahara) [23,24]. Unlike Qanats, the underground water tunnels in the Canary Islands do not have ventilation or access shafts and rely solely on water-conveying channels. These tunnels, which extend one to four kilometers or more, are excavated horizontally to reach inland areas that are remote from the surface, aiming to minimize contamination or to locate water in arid regions. Consequently, there are uncertainties about how seismic activity affects groundwater composition in these deep aquifers closer to earthquake epicenters.
The objective of this research is to determine the cause of variation in the concentrations of the ions F−, Na+, and K+ on the volcanic island of Tenerife during a period of 10 years (2011–2021). This area of research is of utmost importance due to its potential to adopt water management strategies in the context of volcanic islands.
The occurrence of a 3.8 mbLg earthquake in Tenerife in 2012 prompted this investigation, offering an opportunity to examine its impact on groundwater quality, specifically focusing on the concentrations of F−, Na+, and K+. Following the seismic event, notable increases in F− concentrations, peaking at 8.367 meq/L, were observed, whereas no significant variations were recorded for Na+ and K+ cations.
This study quantifies seismic influence on the escalation of fluoride (F−) levels and evaluates F− reduction during periods of subdued seismic activity. It underscores the critical importance of such investigations for effective water resource management in volcanic island environments, particularly concerning fluoride.
2. Data Sources and Methods
2.1. Study Area
This research was carried out on the island of Tenerife, located within the Spanish archipelago of the Canary Islands in the Atlantic Ocean, located at a latitude of 28.2916° north and a longitude of 16.6291° west. The island has an approximate area of 2034 square kilometers, with an estimated population of more than one million inhabitants.
The landscape of Tenerife is largely determined by the presence of the active volcano Teide, which rises to 3718 m above sea level. This volcanic summit, along with other peaks and volcanic formations, creates a distinctive and diverse terrain that plays an important role in shaping the island’s hydrological processes. Furthermore, the volcanic geology of Tenerife contributes to the existence of underground aquifers, highlighting the variability in both the quality and quantity of water resources.
Tenerife experiences a predominantly subtropical climate, marked by notable fluctuations shaped by altitude and geographical positioning. Northern sectors receive heightened precipitation levels, whereas southern areas typically endure arid climates and plentiful sunshine.
The island’s water reservoirs are finite and face increasing pressure due to rising demands associated with tourism and economic activities. Establishing effective and sustainable water management strategies is essential to ensure an adequate provision for the population, agricultural needs, and diverse industries. Furthermore, such initiatives are pivotal for preserving Tenerife’s natural ecosystems and unique biodiversity.
2.2. Characterization of Geological Units
Volcanic islands emerge through the progressive accretion of volcanic materials, including lavas and pyroclasts. However, the volcanic activity on these islands does not persist at a uniform or sustained intensity over time. Consequently, a stratigraphic arrangement comprising distinct mineralogical compositions arises, giving rise to diverse hydrogeological units through which groundwater flows.
According to the Tenerife Insular Hydrological Plan [25], the island exhibits a stratified geological composition, as delineated in Figure 1. These simplified geological units encompass sedimentary and volcanic deposits, with a prevalence of basalts, trachybasalts, lavas, and phonolitic pyroclasts, as well as trachytic lava flows and pyroclasts, and basaltic lava flows and pyroclasts.
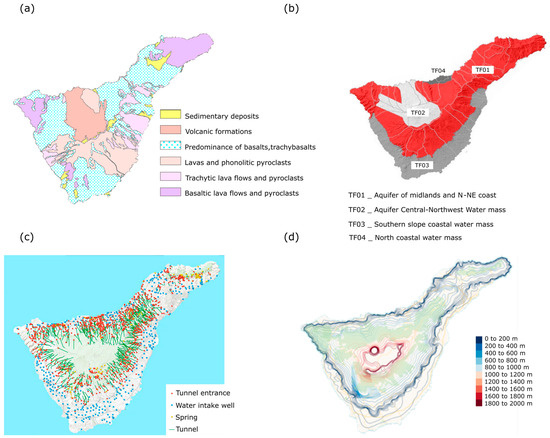
Figure 1.
(a) Geological units of Tenerife. (b) Water bodies of Tenerife Island. (c) Groundwater extraction zones. (d) Georeferenced information on the piezometric surface [20].
Groundwater samples were systematically collected on an annual basis from 2011 to 2021 in 45 tunnels, strategically selected to be representative of the entire island. The lithological compositions encountered in these tunnels are detailed in Table 1, as reported by Miguel-García [23].

Table 1.
Clusters of tunnels according to the terrain crossed.
2.3. Geological Setting of F−, Na+, and K+ on Volcanic Islands
Throughout the weathering and hydrological processes within rocks and soils, ions have the potential to be released and subsequently dissolved into groundwater and thermal gasses. The ion concentrations in groundwater exhibit significant variability, contingent upon geological conditions and the composition of rocks.
Predominant fluorine-bearing minerals include fluorite, apatite, and micas. Consequently, regions with heightened concentrations of these minerals within host rocks are prone to encountering fluoride-related issues [26]. The most common felsic minerals are quartz, muscovite, orthoclase, and sodium-rich plagioclases [27].
One prevalent example of potassium-rich volcanic rock is potassium-rich dacite or rhyolite, characterized by its high potassium feldspar content and often displaying a light hue due to its silica-rich constitution. Another variation is potassium-rich basalt, prevalent in specific volcanic locales, characterized by heightened levels of potassium feldspar and the potential presence of other potassium-rich minerals like biotite or amphibole [28].
2.4. Water Collection and Sampling Method
In order to obtain fresh groundwater in Tenerife, tunnels are drilled in a straight line with a single access point (Figure 2). Once they reach the aquifer, drilling stops. These tunnels are underground hydraulic works measuring two meters high and two meters wide, and a depth that in most tunnels exceeds three kilometers. The tunnels are built with an upward slope of 2%, so the water inside the tunnel flows from the end of the tunnel to the mouth by gravity.
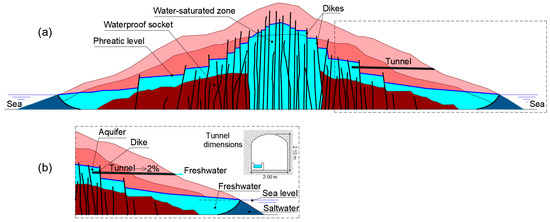
Figure 2.
Cross-section of the island of Tenerife: (a) identification of saturated zone in dikes and (b) the tunnel to the aquifer.
The water samples were taken at the tunnel entrance, whose position was referenced using UTM (Universal Transverse Mercator) coordinates. For this study, an annual water sample was analyzed from each tunnel from 2011 to 2021. Figure 3 shows a photograph of the entrance to a tunnel with its water collection point and the end of the tunnel, where one can see how the water comes out of the aquifer [29].
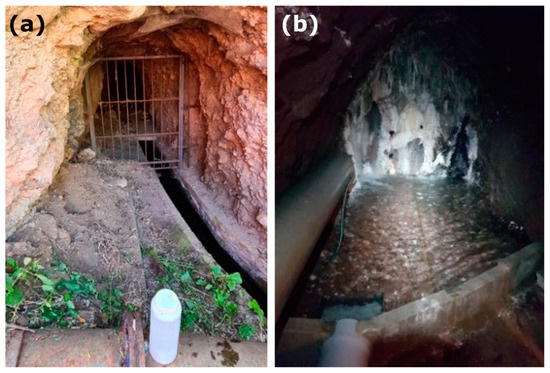
Figure 3.
Tunnel entrance and water sampling point (a), and the end of the tunnel (b).
Water samples were collected using sterilized 2-L bottles (Figure 3a), prepared according to ISO 5667-3:2024 (Part 3: Preservation and handling of water samples) and ISO 19458:2026 (Water quality-Sampling for microbiological analysis) standards, to prevent any external contamination. Each sample, taken from the exit of the tunnels, was then sent to a certified laboratory for analysis on the same day. The laboratory measured the concentrations of Na+, K+, and F−. Data were sourced from the Island Water Council of Tenerife database (https://www.aguastenerife.org/; CIATF 2022) (accessed on 23 July 2024).
The method used for measuring F− concentration in drinking water in the laboratory was with ion-selective electrodes (ISEs), while the method used for measuring K+ and Na+ concentrations in drinking water in the laboratory was Inductively Coupled Plasma Optical Emission Spectrometry (ICP-OES). To evaluate the precision of the chemical analyses of the 435 samples taken, the relative error in the ionic balance was calculated by comparing the sum of the charges of the cations and anions present in each sample. The maximum relative error obtained in a single sample was 4.597%, below 5%, indicating a low relative error and thus confirming the precision and reliability of the chemical analyses. The average relative error across the 435 water samples was 1.221%.
To ensure the reliability of this research, a substantial number of water samples were analyzed, totaling 435 samples extracted from 45 water tunnels distributed across the entire island, to achieve comprehensive sampling. To identify significant changes in F−, Na+, and K+ concentrations, an extensive sampling period of 10 years was undertaken; from 2011 to 2021, a water sample was taken annually from each tunnel, with efforts made to collect it during the first quarter of the year. The distribution of the tunnels from which water samples from the underground aquifer were taken is shown in Figure 4.
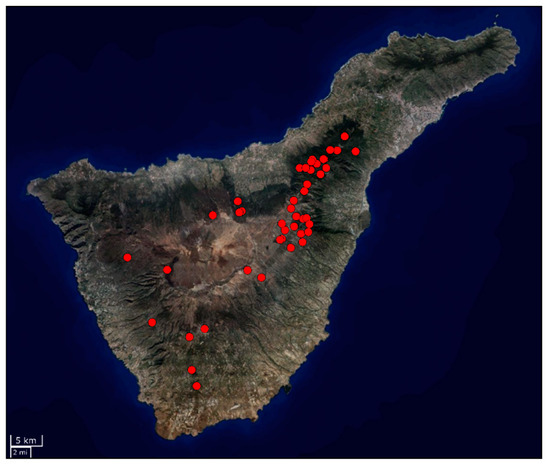
Figure 4.
Distribution of groundwater tunnels studied (red points) (tunnels referenced as Ref. 1 to Ref. 45 in Appendix A, Table A1, Table A2 and Table A3) on the island of Tenerife, Canary Islands, Spain.
3. Results and Discussion
3.1. Analysis of the Water Samples: F−, Na+, and K+
For this study, 45 tunnels were selected, distributed throughout the island of Tenerife, and a total of 435 water samples were analyzed. A water sample was extracted annually from each tunnel between 2011 and 2021, and the F−, Na+, and K+ values of each were determined. The values obtained for each water sample from each tunnel are shown in Figure 5, the normalized values of concentration. The values for each tunnel, j, were normalized to their mean value (μj) and standard deviation (σj) (Equation (1)).
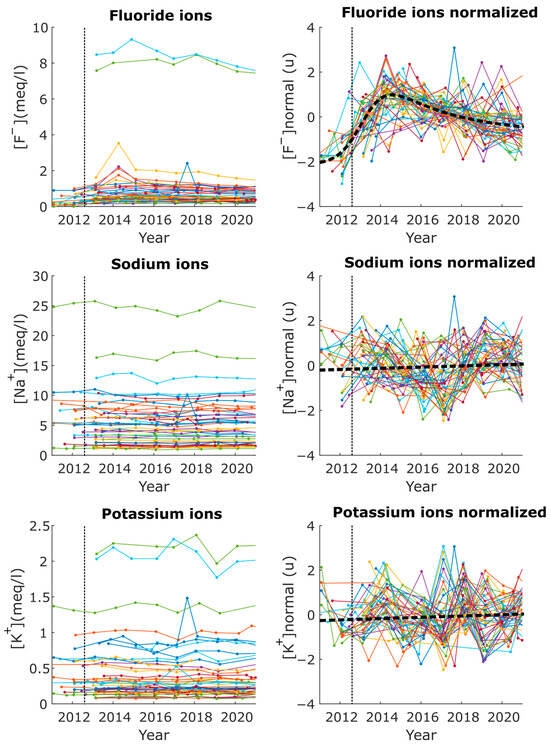
Figure 5.
Variations in F−, Na+, and K+ in water samples taken in 45 tunnels, between the years 2011 and 2021 (each colorful curve represents data from the same tunnel.). Ion concentration (meq/L) vs. normalized value. The dashed vertical line represents the 18 August 2012 earthquake with a magnitude of 3.8 mbLg and an intensity of IV EMS.
3.2. Analysis of the Variations in F−, Na+, and K+, before and after 2012
Based on the concentration values of F−, Na+, and K+, it is observed that, in 2012, there was a significant increase in F− across all water samples from the 45 tunnels studied in the water samples taken before the 18 August 2012 earthquake compared to those taken after. In the case of the Na+ and K+ cations, no significant variation was observed in the period from 2011 to 2021.
To determine if there was a change in the concentrations of F−, Na+, and K+ in the water of each tunnel, their average values were calculated before and after 18 August 2012. The arithmetic mean of the concentration values of F−, Na+, and K+ from each sample taken in the years prior to that date was computed and compared to the arithmetic mean of the concentration values from subsequent years, in order to obtain the percentage increase in concentration. Table 2 shows the percentage increase and decrease in F−, Na+, and K+ for the different slopes of the island of Tenerife, with respect to the number of tunnels studied. The results obtained from the increase or decrease in the average concentration of F−, Na+, and K+, of each tunnel in the years studied, are presented in the complementary material, Table A1, Table A2 and Table A3.

Table 2.
Percentage of increase (%) and decrease (%) of F−, Na+, and K+, for the slopes of the island of Tenerife, with respect to the number of tunnels studied.
To compare the means of the values obtained from the F−, Na+, and K− measurements before and after 2012, and determine if there were significant differences between them, an analysis of variance (ANOVA) was conducted. The results obtained are shown in Table 3.

The results obtained from the analysis of variance, in the case of the F− ions, show an F value greater than the critical value, so the null hypothesis can be rejected, which establishes that there is a significant difference between the means of the groups before and after August 2012. For the values obtained from the analysis of variance for the Na+ and K+ cations, the F value is less than the critical value, so the null hypothesis cannot be rejected, and therefore there is no significant difference between the group means before and after 18 August 2012.
3.3. Regional Increase in Fluoride Concentration in Groundwater Linked to Non-Anthropogenic Event
From the results obtained, it was detected that there was an increase in the concentration of F− in 100% of the tunnels investigated, with a total average increase of 89.5% in the year 2012. This, however, did not occur for the Na+ and K+ cations, whose values did not show a significant increase or decrease. An increase in F− concentration was recorded throughout the island of Tenerife, confirming a regional increase.
A non-anthropogenic event must have occurred in 2012 as a possible cause of this sudden change in the aquifer. The main non-anthropogenic events that could have affected groundwater quality are precipitation and earthquakes.
3.3.1. Precipitation
The variation in F− concentration could be due to annual or seasonal changes in precipitation, which could cause an elevation in F− levels. Within the Canary archipelago, rainfall is limited and usually occurs between October and March.
When examining seasonal temporal patterns, a decreasing trend is observed during winter and spring, while trends in summer and autumn may vary, either decreasing or increasing, depending on the specific location.
A comprehensive analysis of precipitation over the last two decades is feasible thanks to the extensive network of rainfall stations. This network has made it possible to compare rainfall data from meteorological stations spread throughout the island, which is characterized by remarkably diverse climates. The average accumulated precipitation data used in this study were obtained from the report prepared by Santana Pérez and Hernández Barrera (2020). These data come from the automated climate monitoring network established by institutions such as the “Agro Cabildo of Tenerife”, the State Meteorological Agency, and the Canary Islands Institute of Agricultural Research.
In the case of the island of Tenerife, the collected data indicate a lack of distinct alternation between rainy and dry periods. Tenerife is characterized by its highly mountainous terrain, with its highest point situated near the center of the island at an altitude of 3718 m, resulting in three primary slopes. Across slopes from the northwest to the northeast, there is a progressive increase in precipitation with altitude, exhibiting variability over the fourteen years under analysis. Conversely, slopes from the southeast to the south display significant fluctuations in precipitation, influenced by the arrival of Atlantic storms that can lead to heavy rainfall. Lastly, slopes from the southwest to the northwest show variations in precipitation levels without a clear pattern of elevation-related increase. However, the annual precipitation trend remains consistent along this slope.
Figure 6 depicts the 15 meteorological stations positioned along the northern, southern, and western slopes of Tenerife used in this study and showcases their annual accumulated precipitation from 2005 to 2018. Table A7 provides the average values and variance coefficients for each station during this period.
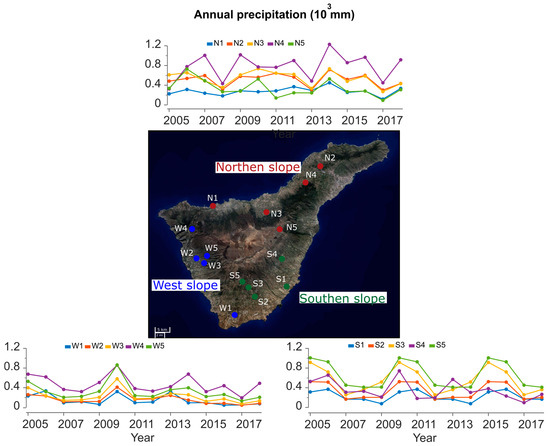
Figure 6 shows that, although there have been years with greater rainfall than others, depending on the slope of the island, the average precipitation is similar throughout the entire historical series studied. To demonstrate the correlation between the F− concentration in the groundwater and the precipitation, a Pearson correlation was performed between the annual average precipitation in Tenerife and the annual average estimated F− concentration over the years (Figure 7), where Pearson’s linear correlation coefficient is r = −0.2321. Therefore, the analysis of annual precipitation shows a weak correlation with variations in F− concentration, suggesting that there is no significant linear relationship between these two variables. Consequently, this hypothesis should be discarded, and a hypothesis based on seismic activity should be investigated, as seismic activity can induce changes in the aquifer system, as documented in previous studies [13,22,30].
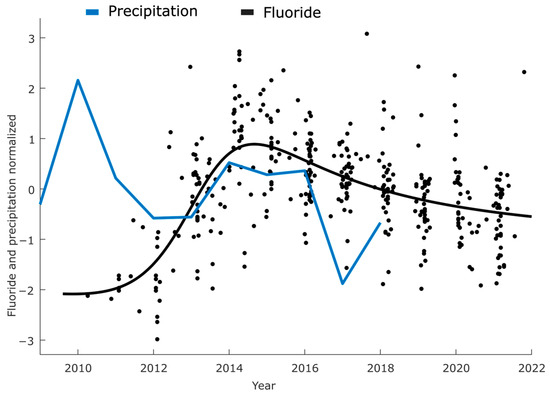
Figure 7.
Normalized average precipitation and F− concentration: Black dots represent the F− concentration in 45 groundwater tunnels, while the black line illustrates the modeled F− concentration in water. The blue line denotes the average precipitation recorded at the meteorological stations.
3.3.2. Earthquakes
Chemical alterations in groundwater can result from seismic activity, which generates stresses and/or ruptures in faults or fractures, thus altering the characteristics of the aquifer that contains those groundwaters [13,22,30]. To explore this hypothesis, data on all seismic events that occurred on the island of Tenerife were collected and subsequently correlated with the concentration of F− in the groundwater.
The geographical distribution of earthquakes from 2011 to 2021, with intensities ranging between II and IV on the European Macroseismic Scale (EMS), was provided by the Spanish National Geographic Institute, under the jurisdiction of the Ministry of Public Works. Notably, among all the earthquakes, one event on 18 August 2012, stood out as it was felt by the population with a maximum intensity of IV.
On 18 August 2012, in the northern region of the island of Tenerife, a seismic event occurred. The earthquake took place in the sea, off the coast of El Sauzal, at 01:50 in the morning. The epicenter was located at a latitude of 28.5295° and a longitude of −16.5136°, with a depth of 27 km. The magnitude of the tremor was recorded at 3.8 mbLg, with a maximum intensity of IV on the EMS.
The earthquake, deemed the most significant in two decades in the region, prompted widespread surprise and led to street evacuations. Multiple aftershocks followed, ranging from 2.6 to 2.8 mbLg in magnitude and occurring within minutes (18 August 2012). The seismic event’s precise location is depicted in Figure 8, alongside the intensity observed near the studied underground water tunnels.
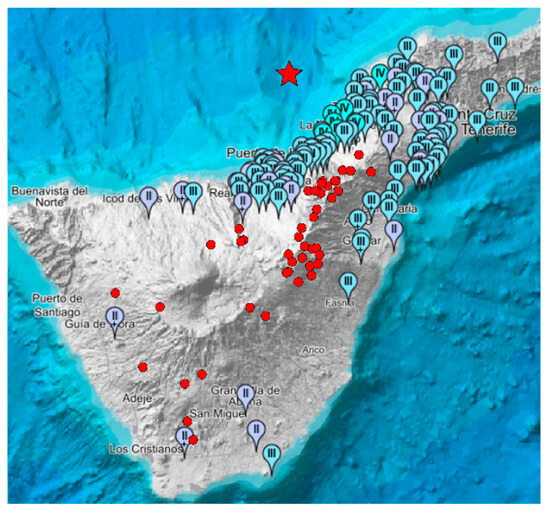
Figure 8.
Map of European Macroseismic Scale and location of groundwater tunnels. Distribution of groundwater tunnels (red dots ) studied on the island of Tenerife, Canary Islands, Spain on the map of the European Macroseismic Scale (Table A8), provided by the Spanish National Geographic Institute (IGN) on 18 August 2012, with a seism with a magnitude of 3.8 mbLg. The star is where the epicenter of the seism was located.
3.3.3. Causes of Fluoride Variation
Studies of fluorine geochemistry in volcanic rocks have generally described fluorine’s tendency to concentrate in various volcanic rocks such as tholeiites, alkaline basalts, rhyolites, pantellerites, and kimberlites [31,32,33,34,35,36]. However, it is also known to decrease with geochemical evolution [37].
Chemical alterations in groundwater can be ascribed to seismic movements generated by tension and/or rupture along faults or fractures, resulting in modifications in the properties of the aquifer housing that groundwater [13,30].
The fluctuation in water quality following an earthquake can manifest as short-term or long-term variations. In most cases, these events tend to induce temporary alterations in water quality and flow due to the transient nature of the mechanisms involved, such as the expansion or release of overpressurized gasses and fluids, which typically return to pre-earthquake conditions once the seismic activity subsides.
The deformation or stress induced by an earthquake can be divided into static and dynamic components: the former is a result of fault movement or displacement, while the latter is due to the deformation of seismic waves within the aquifer [38]. Groundwater response at various distances from the epicenter has been extensively documented in various rock types [11,15,18,39], including changes in groundwater levels, spring discharge, or physical and chemical groundwater parameters. The distance from the epicenter to groundwater, referred to as the near field (within the distance of the fault rupture length), intermediate field (1 to 10 fault rupture lengths), and far field (beyond 10 fault rupture lengths) according to previous studies [18], is important because the dynamic and static stresses caused by the earthquake decay differently with distance. This categorization can aid in predicting the hydrological effects of the earthquake. Considering the temporal aspect is also crucial when determining short-, medium-, and long-term effects on regional groundwater systems, especially since permanent deformations of large aquifers can impact major sources of drinking water [40].
The results obtained from the variation in F−, presented in Table A1, show that in 100% of the tunnels studied, the concentration increased; the average of this increase was 89.5%.
This increase was especially significant in the case of the samples taken in tunnel Ref. 3, rising from the measured levels of 1.400 meq/L F− before 2012 to a measured value of 2015 meq/L F− after that year, as well as in tunnels Ref. 12 and Ref. 13, which went from average levels of 5.000 meq/L F− to average values of 7.932 meq/L F− and 8.345 meq/L F− respectively. This increase in F− concentration necessitates immediate action since the water is considered unfit for human consumption according to the WHO.
3.3.4. Analysis of the Decrease in F− after the Earthquake of 18 August 2012
After the earthquake of 18 August 2012, the seismic activity that occurred on the island of Tenerife was moderate, with an intensity of less than IV (EMS) and with epicenters far from the area where the groundwater tunnels are located (Table 4 and Figure 9). As shown in Figure 9, there is a decreasing trend in F− concentration in the years after the earthquake of 18 August 2012. This correlates with the seismological data published by the Spanish National Geographic Institute showing that in the following years, the earthquakes in the Canary Islands have EMS intensities lower than that of 18 August 2012.

Table 4.
Earthquakes felt in Tenerife as of 18 August 2012 (information adapted from the Spanish National Geographic Institute database).
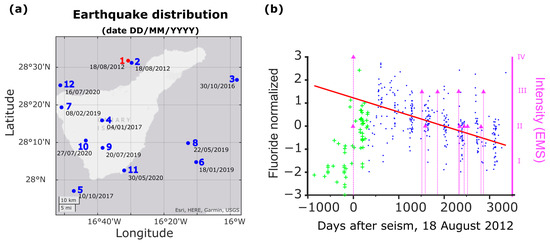
Figure 9.
Earthquake distribution and fluorine evolution. (a) Earthquake distribution since 18 August 2012 with intensities between II and IV (EMS). The red dot represents the location of the 18 August 2012 earthquake, which is the only one with a maximum intensity of IV. (b) shows the fit of a linear decreasing model (red line) with fluorine over time, starting from the maximum value reached after the earthquake of 18 August 2012 (blue dots). The green marks are the samples not used for the estimation of the linear decreasing model. The pink triangles represent the earthquake intensity located in (a).
Once fluoride concentrations reach their maximum values (about one to two years later), they decrease linearly on average, following, as shown in Figure 9, a linear model of the form:
where the coefficients (with 95% confidence intervals) are m = −0.0006123 (−0.0006255, −0.0005991) and [f]0 = 1.231 (1.204, 1.258). The fitting method is the linear least squares by minimizing the least absolute residual. The goodnesses of fit are SSE = 3.4171, R-square = 0.9877, adjusted R-square = 0.9877, and RMSE = 0.1021.
From this linear model, it can be deduced that it would take approximately 13.5 years (4927 days) for the average F− concentration to return to the level it was before the earthquake of 18 August 2012.
The variation in fluoride concentration in units of meq/L/day can be estimated for each tunnel, j, assuming that
Using the above equation, the concentration of F− in the water of each tunnel can be estimated over a future horizon (e.g., 1 year or 20 years) (Table 5). Taking into account the entirety of the studied water collection points, a prediction can be formulated with a spatiotemporal representation (Figure 10). As depicted in Figure 10, the estimated spatiotemporal variation in fluoride concentration is presented for different periods: before the earthquake, following it, and at 5, 10, and 20 years thereafter.

Table 5.
Estimation of fluoride concentration variation over time (per day, per year, and in 20 years) for each tunnel.
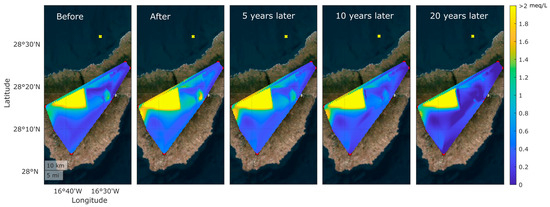
Figure 10.
Spatial estimation of fluoride concentration variations over time (before, after, 10 years later, and 20 years later). The yellow dot is the location of the 18 August 2012 earthquake.
In the specific case of the water sample taken from tunnel Ref. 3, as shown in Table 2, with a concentration of F− suitable for human consumption, after the 2012 earthquake, the water from that tunnel became unfit for human consumption with an F− concentration of 1.971 meq/L, a value not recommended by the WHO. In the cases of tunnels Ref. 12 and Ref. 13, the F− concentration increased by 58.6% and 67.3%, reaching values of 7.932 meq/L and 8367 meq/L, respectively. According to the prediction of the linear model (Equation (2)), a reduction in F− of −1.13 × 10⁻¹ meq/L/year, −7.44 × 10⁻² meq/L/year, and −1.08 × 10⁻² meq/L/year, respectively, would occur in these tunnels if there was no intense seismic activity for several years. Table 6 shows the F− values in these three water intake tunnels versus the number of years required for the water to become suitable for human consumption.

Table 6.
Predicted change in F− concentration values in the coming years assuming low seismic activity in the tunnels Ref. 3, Ref. 12, and Ref. 13.
As shown in Table 6, for the tunnel Ref. 3, the water will be suitable for human consumption after 5 years, with an F− concentration of 1.321 meq/L. In the case of tunnels Ref. 12 and Ref. 13, after 40 years, the F− concentration will be less than 5.000 meq/L, which was the concentration before the earthquake.
A significant limitation of this study is the challenge of replication, as it required long-term water sampling that coincided with the occurrence of high-intensity earthquakes near the sampling area, making the scenario unpredictable. Additionally, extracting water samples from deep aquifers, like those studied here, necessitates accessing the internal zones of the aquifer. This process demands substantial financial investment and the acquisition of research permits from the relevant authorities. These challenges restrict the feasibility of conducting physical and numerical simulations of fluorine dissolution and precipitation influenced by earthquakes.
4. Conclusions
In the year 2012, a sudden increase in the concentration of F− was detected; in the case of Na+ and K+ ions, this did not occur, and their concentrations remained stable during the study period. Previous studies have observed that the behavior of Na+ and K+ in relation to earthquakes suggests that variations in Na+ and K+ concentrations are not caused by seismic events. This was demonstrated in the study of the East Hokkaido Iburi earthquake [41]. This research indicates that, in some cases, changes in the Na+ and K+ ratio may be influenced by factors other than direct seismic activity, such as the presence of CO2, rather than reflecting changes caused by the earthquake itself. Therefore, the lack of significant changes in groundwater Na+ and K+ concentrations during seismic activity can be attributed to several factors related to water chemistry and aquifer dynamics. Firstly, the stability of these ions in the subsurface: Na+ and K+ are very soluble ions and are normally found in relatively stable concentrations in groundwater.
An analysis of precipitation on the island demonstrated the absence of a relationship between the variation in F− and precipitation during the entire study period. On the other hand, the date on which the sudden increase in F− occurred coincides with an earthquake recorded on 18 August 2012, which had a magnitude of 3.8 mbLg and an intensity of IV (EMS), establishing an obvious correlation between the seismic event and the increase in F− levels.
The results of the analyses clearly demonstrated that this high-intensity earthquake caused an increase in the concentration of F− in 100% of the water samples from all tunnels around the island, with the average increase in F− concentration being 89.5%. The increase in F− in several regions of the island exceeded the thresholds recommended by the WHO, as in the case of the tunnel Ref. 3, where the measured levels increased from 1.400 meq/L F− before 2012 to 1.971 meq/L F− after 2012.
After the earthquake, and following a period of low seismic activity, a clear trend towards a decrease in the concentration of F− was observed, allowing us to determine how many years must pass for the water extracted from the aquifer through the tunnels to become suitable for human consumption again, helping to manage the quality of water for human consumption.
This research highlights the need for a water quality management strategy on volcanic islands, emphasizing that after a significant earthquake, F− concentration levels must be monitored to ensure drinking water quality.
This study will inspire analogous research efforts around the world, providing invaluable insights into earthquake-induced fluctuations in water quality. In essence, it offers pragmatic solutions for the sustainable management of water resources, thus addressing the quality of freshwater for both human consumption and agricultural needs.
Author Contributions
Conceptualization, E.d.M.-G. and J.F.G.-G.; methodology, E.d.M.-G. and J.F.G.-G.; software, E.d.M.-G. and J.F.G.-G.; validation, E.d.M.-G. and J.F.G.-G.; formal analysis, E.d.M.-G. and J.F.G.-G.; investigation, E.d.M.-G. and J.F.G.-G.; resources, E.d.M.-G. and J.F.G.-G.; writing—original draft preparation, E.d.M.-G. and J.F.G.-G. writing—review and editing, E.d.M.-G. and J.F.G.-G.; visualization, E.d.M.-G. and J.F.G.-G.; supervision, E.d.M.-G. and J.F.G.-G. All authors have read and agreed to the published version of the manuscript.
Funding
This research received no external funding.
Data Availability Statement
Readers can contact the authors for the available data and materials.
Conflicts of Interest
The authors declare no conflicts of interest.
Appendix A

Table A1.
Mean values of F− (meq/L) before and after the earthquake of 18 August 2012 for each tunnel.
Table A1.
Mean values of F− (meq/L) before and after the earthquake of 18 August 2012 for each tunnel.
| Ref. | UTM Tunnel Coordinates (X,Y) | Before 18 August 2012 F− (meq/L) | After 18 August 2012 F− (meq/L) | Increase F− (%) | Ref. | UTM Tunnel Coordinates (X,Y) | Before 18 August 2012 F− (meq/L) | After 18 August 2012 F− (meq/L) | Increase F− (%) |
|---|---|---|---|---|---|---|---|---|---|
| 1 | 325530,3124783 | 0.600 | 0.868 | 44.7 | 24 | 358375,3125004 | 0.300 | 0.540 | 80.0 |
| 2 | 330723,3123682 | 0.700 | 0.979 | 39.8 | 25 | 356304,3144969 | 0.300 | 0.386 | 28.8 |
| 3 | 359831,3131169 | 1.400 | 1.971 | 40.8 | 26 | 356560,3128460 | 0.167 | 0.400 | 139.8 |
| 4 | 327694,3114694 | 0.270 | 0.312 | 15.4 | 27 | 357821,3132987 | 0.100 | 0.325 | 225.4 |
| 5 | 338319,3108872 | 0.300 | 0.565 | 88.2 | 28 | 354095,3144361 | 0.900 | 1.055 | 17.2 |
| 6 | 337819,3109353 | 0.500 | 0.569 | 13.9 | 29 | 356009,3128057 | 0.900 | 1.193 | 32.6 |
| 7 | 341363,3112501 | 0.200 | 0.385 | 92.6 | 30 | 356645,3131748 | 0.350 | 0.470 | 34.2 |
| 8 | 352623,3122104 | 0.200 | 0.379 | 89.6 | 31 | 355555,3143132 | 0.200 | 0.347 | 73.7 |
| 9 | 348566,3122975 | 0.483 | 0.800 | 65.5 | 32 | 358984,3149307 | 0.146 | 0.200 | 36.9 |
| 10 | 339559,3110059 | 0.300 | 0.444 | 48.1 | 33 | 365776,3141263 | 0.100 | 0.198 | 98.4 |
| 11 | 358949,3131786 | 0.900 | 1.289 | 43.2 | 34 | 359148,3136337 | 0.164 | 0.316 | 92.7 |
| 12 | 340652,3135273 | 5.000 | 7.932 | 58.6 | 35 | 356908,3144264 | 0.300 | 0.421 | 40.2 |
| 13 | 340652,3135273 | 5.000 | 8.367 | 67.3 | 36 | 358608,3131679 | 0.100 | 0.368 | 268.2 |
| 14 | 356790,3142907 | 0.100 | 0.268 | 167.8 | 37 | 364479,3140737 | 0.100 | 0.352 | 252.2 |
| 15 | 357104,3146116 | 0.100 | 0.241 | 141.3 | 38 | 356338,3127000 | 0.650 | 1.227 | 88.8 |
| 16 | 358539,3131162 | 0.800 | 1.135 | 41.9 | 39 | 355333,3144600 | 0.800 | 0.918 | 14.7 |
| 17 | 346128,3136156 | 0.100 | 0.373 | 272.9 | 40 | 355429,3143492 | 0.300 | 0.365 | 21.6 |
| 18 | 361116,3136791 | 0.536 | 0.584 | 8.9 | 41 | 362318,3139268 | 0.500 | 0.639 | 27.8 |
| 19 | 358000,3131570 | 0.200 | 0.480 | 140.0 | 42 | 356984,3146608 | 0.100 | 0.328 | 228.0 |
| 20 | 345338,3136827 | 0.700 | 0.909 | 29.8 | 43 | 357368,3134311 | 0.150 | 0.377 | 151.3 |
| 21 | 359549,3136173 | 0.500 | 0.739 | 47.8 | 44 | 357395,3132216 | 1.000 | 1.382 | 38.2 |
| 22 | 345479,3135797 | 0.500 | 0.958 | 91.6 | 45 | 358481,3131700 | 0.100 | 0.344 | 243.9 |
| 23 | 358538,3125846 | 0.300 | 0.533 | 77.8 |

Table A2.
Mean values of K+ (meq/L) before and after the earthquake of 18 August 2012 for each tunnel.
Table A2.
Mean values of K+ (meq/L) before and after the earthquake of 18 August 2012 for each tunnel.
| Ref. | UTM Tunnel Coordinates (X,Y) | Before 18 August 2012 K+ (meq/L) | After 18 August 2012 K+ (meq/L) | Increase K+ (%) | Ref. | UTM Tunnel Coordinates (X,Y) | Before 18 August 2012 K+ (meq/L) | After 18 August 2012 K+ (meq/L) | Increase K+ (%) |
|---|---|---|---|---|---|---|---|---|---|
| 1 | 325530,3124783 | 0.911 | 0.857 | −5.9 | 24 | 358375,3125004 | 0.352 | 0.343 | −2.6 |
| 2 | 330723,3123682 | 0.996 | 1.016 | 2.1 | 25 | 356304,3144969 | 0.231 | 0.216 | −6.7 |
| 3 | 359831,3131169 | 0.126 | 0.149 | 18.1 | 26 | 356560,3128460 | 1.366 | 1.358 | −0.6 |
| 4 | 327694,3114694 | 0.526 | 0.522 | −0.8 | 27 | 357821,3132987 | 0.295 | 0.326 | 10.6 |
| 5 | 338319,3108872 | 0.292 | 0.292 | 0.0 | 28 | 354095,3144361 | 0.090 | 0.104 | 14.7 |
| 6 | 337819,3109353 | 0.632 | 0.649 | 2.7 | 29 | 356009,3128057 | 0.618 | 0.602 | −2.6 |
| 7 | 341363,3112501 | 0.388 | 0.386 | −0.5 | 30 | 356645,3131748 | 0.518 | 0.469 | −9.3 |
| 8 | 352623,3122104 | 0.714 | 0.711 | −0.4 | 31 | 355555,3143132 | 0.194 | 0.193 | −0.6 |
| 9 | 348566,3122975 | 0.225 | 0.242 | 7.7 | 32 | 358984,3149307 | 0.126 | 0.152 | 20.9 |
| 10 | 339559,3110059 | 0.202 | 0.279 | 38.2 | 33 | 365776,3141263 | 0.126 | 0.130 | 3.1 |
| 11 | 358949,3131786 | 0.199 | 0.205 | 3.5 | 34 | 359148,3136337 | 0.292 | 0.264 | −9.4 |
| 12 | 340652,3135273 | 2.373 | 2.203 | −7.2 | 35 | 356908,3144264 | 0.228 | 0.207 | −9.1 |
| 13 | 340652,3135273 | 2.190 | 2.062 | −5.9 | 36 | 358608,3131679 | 0.208 | 0.225 | 8.2 |
| 14 | 356790,3142907 | 0.155 | 0.154 | −0.8 | 37 | 364479,3140737 | 0.350 | 0.352 | 0.3 |
| 15 | 357104,3146116 | 0.222 | 0.183 | −17.4 | 38 | 356338,3127000 | 0.618 | 0.587 | −4.9 |
| 16 | 358539,3131162 | 0.083 | 0.081 | −2.7 | 39 | 355333,3144600 | 0.093 | 0.090 | −3.4 |
| 17 | 346128,3136156 | 0.469 | 0.467 | −0.3 | 40 | 355429,3143492 | 0.093 | 0.088 | −5.4 |
| 18 | 361116,3136791 | 0.200 | 0.192 | −3.8 | 41 | 362318,3139268 | 0.291 | 0.291 | −0.1 |
| 19 | 358000,3131570 | 0.157 | 0.168 | 7.3 | 42 | 356984,3146608 | 0.226 | 0.212 | −6.2 |
| 20 | 345338,3136827 | 0.821 | 0.835 | 1.7 | 43 | 357368,3134311 | 0.175 | 0.208 | 18.9 |
| 21 | 359549,3136173 | 0.341 | 0.177 | −48.0 | 44 | 357395,3132216 | 0.357 | 0.326 | −8.7 |
| 22 | 345479,3135797 | 0.817 | 0.936 | 14.5 | 45 | 358481,3131700 | 0.178 | 0.153 | −14.1 |
| 23 | 358538,3125846 | 0.174 | 0.178 | 1.9 |

Table A3.
Mean values of Na+ (meq/L) before and after the earthquake of 18 August 2012 for each tunnel.
Table A3.
Mean values of Na+ (meq/L) before and after the earthquake of 18 August 2012 for each tunnel.
| Ref. | UTM Tunnel Coordinates (X,Y) | Before 18 August 2012 Na+ (meq/L) | After 18 August 2012 Na+ (meq/L) | Increase Na+ (%) | Ref. | UTM Tunnel Coordinates (X,Y) | Before 18 August 2012 Na+ (meq/L) | After 18 August 2012 Na+ (meq/L) | Increase Na+ (%) |
|---|---|---|---|---|---|---|---|---|---|
| 1 | 325530,3124783 | 8.702 | 8.904 | 2.3 | 24 | 358375,3125004 | 4.293 | 4.060 | −5.4 |
| 2 | 330723,3123682 | 7.257 | 7.539 | 3.9 | 25 | 356304,3144969 | 7.442 | 7.212 | −3.1 |
| 3 | 359831,3131169 | 1.669 | 1.720 | 3.1 | 26 | 356560,3128460 | 24.814 | 24.500 | −1.3 |
| 4 | 327694,3114694 | 3.933 | 3.846 | −2.2 | 27 | 357821,3132987 | 3.339 | 3.350 | 0.3 |
| 5 | 338319,3108872 | 2.825 | 2.770 | −1.9 | 28 | 354095,3144361 | 1.434 | 1.588 | 10.8 |
| 6 | 337819,3109353 | 7.767 | 6.860 | −11.7 | 29 | 356009,3128057 | 10.488 | 10.042 | −4.3 |
| 7 | 341363,3112501 | 1.632 | 1.634 | 0.2 | 30 | 356645,3131748 | 9.449 | 8.250 | −12.7 |
| 8 | 352623,3122104 | 6.883 | 6.701 | −2.7 | 31 | 355555,3143132 | 2.393 | 2.421 | 1.2 |
| 9 | 348566,3122975 | 7.762 | 8.245 | 6.2 | 32 | 358984,3149307 | 1.735 | 1.814 | 4.5 |
| 10 | 339559,3110059 | 1.220 | 1.347 | 10.4 | 33 | 365776,3141263 | 1.176 | 1.054 | −10.4 |
| 11 | 358949,3131786 | 2.958 | 3.116 | 5.3 | 34 | 359148,3136337 | 10.757 | 10.445 | −2.9 |
| 12 | 340652,3135273 | 16.764 | 16.594 | −1.0 | 35 | 356908,3144264 | 6.174 | 6.128 | −0.7 |
| 13 | 340652,3135273 | 13.495 | 12.975 | −3.9 | 36 | 358608,3131679 | 2.028 | 2.060 | 1.6 |
| 14 | 356790,3142907 | 1.766 | 1.706 | −3.4 | 37 | 364479,3140737 | 5.468 | 5.188 | −5.1 |
| 15 | 357104,3146116 | 4.330 | 3.793 | −12.4 | 38 | 356338,3127000 | 6.218 | 6.277 | 0.9 |
| 16 | 358539,3131162 | 2.037 | 2.159 | 6.0 | 39 | 355333,3144600 | 4.138 | 4.147 | 0.2 |
| 17 | 346128,3136156 | 4.517 | 4.424 | −2.1 | 40 | 355429,3143492 | 3.279 | 3.283 | 0.1 |
| 18 | 361116,3136791 | 6.298 | 6.504 | 3.3 | 41 | 362318,3139268 | 5.528 | 5.371 | −2.8 |
| 19 | 358000,3131570 | 1.535 | 1.596 | 4.0 | 42 | 356984,3146608 | 5.971 | 5.498 | −7.9 |
| 20 | 345338,3136827 | 5.512 | 5.579 | 1.2 | 43 | 357368,3134311 | 5.078 | 5.304 | 4.5 |
| 21 | 359549,3136173 | 10.806 | 9.722 | −10.0 | 44 | 357395,3132216 | 7.625 | 7.609 | −0.2 |
| 22 | 345479,3135797 | 5.267 | 5.993 | 13.8 | 45 | 358481,3131700 | 1.364 | 1.308 | −4.1 |
| 23 | 358538,3125846 | 1.292 | 1.280 | −0.9 |

Table A4.
Annual accumulated precipitation (mm) on the northern slope of the island of Tenerife (annual precipitation in the 21st century in Tenerife. L. M. Santana Pérez and S. Hernández Barrera. 2020 Cabildo de Tenerife).
Table A4.
Annual accumulated precipitation (mm) on the northern slope of the island of Tenerife (annual precipitation in the 21st century in Tenerife. L. M. Santana Pérez and S. Hernández Barrera. 2020 Cabildo de Tenerife).
| Station | Ref. | 2005 | 2006 | 2007 | 2008 | 2009 | 2010 | 2011 | 2012 | 2013 | 2014 | 2015 | 2016 | 2017 | 2018 |
|---|---|---|---|---|---|---|---|---|---|---|---|---|---|---|---|
| C. Viento | N1 | 225 | 314 | 238 | 184 | 287 | 267 | 285 | 370 | 295 | 450 | 254 | 282 | 117 | 335 |
| Padilla | N2 | 483 | 538 | 596 | 315 | 580 | 561 | 645 | 566 | 307 | 717 | 517 | 600 | 301 | 435 |
| Benijos | N3 | 611 | 653 | 487 | 354 | 609 | 737 | 644 | 621 | 336 | 734 | 479 | 587 | 270 | 431 |
| Ravelo | N4 | 325 | 777 | 1006 | 433 | 1017 | 771 | 764 | 901 | 485 | 1230 | 858 | 967 | 449 | 916 |
| Izaña | N5 | 337 | 729 | 492 | 267 | 279 | 526 | 141 | 246 | 244 | 528 | 268 | 282 | 92 | 309 |

Table A5.
Annual accumulated precipitation (mm) on the southern slope of the island of Tenerife (annual precipitation in the 21st century in Tenerife. L. M. Santana Pérez and S. Hernández Barrera. 2020 Cabildo de Tenerife).
Table A5.
Annual accumulated precipitation (mm) on the southern slope of the island of Tenerife (annual precipitation in the 21st century in Tenerife. L. M. Santana Pérez and S. Hernández Barrera. 2020 Cabildo de Tenerife).
| Station | Ref. | 2005 | 2006 | 2007 | 2008 | 2009 | 2010 | 2011 | 2012 | 2013 | 2014 | 2015 | 2016 | 2017 | 2018 |
|---|---|---|---|---|---|---|---|---|---|---|---|---|---|---|---|
| San Juan | S1 | 315 | 370 | 168 | 168 | 77 | 315 | 370 | 168 | 168 | 77 | 315 | 370 | 168 | 168 |
| Charcho | S2 | 524 | 515 | 170 | 205 | 206 | 524 | 515 | 170 | 205 | 206 | 524 | 515 | 170 | 205 |
| Pinalete | S3 | 916 | 721 | 257 | 363 | 517 | 916 | 721 | 257 | 363 | 517 | 916 | 721 | 257 | 363 |
| El Bueno | S4 | 528 | 656 | 309 | 329 | 213 | 743 | 183 | 196 | 570 | 305 | 382 | 232 | 98 | 267 |
| Vilaflor | S5 | 1007 | 927 | 453 | 411 | 414 | 1007 | 927 | 453 | 411 | 414 | 1007 | 927 | 453 | 411 |

Table A6.
Annual accumulated precipitation (mm) on the west slope of the island of Tenerife (annual precipitation in the 21st century in Tenerife. L. M. Santana Pérez and S. Hernández Barrera. 2020 Cabildo de Tenerife).
Table A6.
Annual accumulated precipitation (mm) on the west slope of the island of Tenerife (annual precipitation in the 21st century in Tenerife. L. M. Santana Pérez and S. Hernández Barrera. 2020 Cabildo de Tenerife).
| Station | Ref. | 2005 | 2006 | 2007 | 2008 | 2009 | 2010 | 2011 | 2012 | 2013 | 2014 | 2015 | 2016 | 2017 | 2018 |
|---|---|---|---|---|---|---|---|---|---|---|---|---|---|---|---|
| Galletas | W1 | 239 | 341 | 101 | 120 | 68 | 327 | 103 | 116 | 325 | 101 | 103 | 54 | 56 | 81 |
| Isora | W2 | 265 | 238 | 121 | 126 | 127 | 416 | 168 | 179 | 250 | 155 | 88 | 90 | 53 | 88 |
| El Pozo | W3 | 404 | 243 | 149 | 160 | 212 | 584 | 183 | 194 | 287 | 262 | 130 | 179 | 81 | 141 |
| V. Arriba | W4 | 679 | 623 | 370 | 326 | 511 | 860 | 388 | 337 | 426 | 680 | 326 | 446 | 200 | 494 |
| Aripe | W5 | 533 | 326 | 211 | 230 | 332 | 865 | 246 | 228 | 365 | 403 | 226 | 268 | 139 | 212 |

Table A7.
Average accumulated precipitation, variance coefficient, and altitude at meteorological stations.
Table A7.
Average accumulated precipitation, variance coefficient, and altitude at meteorological stations.
| Northern Slope | Station Ref. N1 | Station Ref. N2 | Station Ref. N3 | Station Ref. N4 | Station Ref. N5 |
|---|---|---|---|---|---|
| Altitude (m) | 17 | 400 | 906 | 922 | 2369 |
| Average (mm) | 278.8 | 511.5 | 539.5 | 778.5 | 338.6 |
| Variance coef. (%) | 28.6 | 25.3 | 27.5 | 34.0 | 50.6 |
| Southern Slope | Station Ref. S1 | Station Ref. S2 | Station Ref. S3 | Station Ref. S4 | Station Ref. S5 |
| Altitude (m) | 135 | 505 | 850 | 930 | 1258 |
| Average (mm) | 203.6 | 293.6 | 500.9 | 311.4 | 606.0 |
| Variance coef. (%) | 52.8 | 57.5 | 51.2 | 62.2 | 46.0 |
| West Slope | Station Ref. W1 | Station Ref. W2 | Station Ref. W3 | Station Ref. W4 | Station Ref. W5 |
| Altitude (m) | 95 | 476 | 700 | 990 | 1032 |
| Average (mm) | 124.6 | 146.9 | 203.3 | 445.7 | 293.8 |
| Variance coef. (%) | 85.4 | 65.5 | 63.7 | 40.2 | 62.7 |

Table A8.
Definitions of intensity degrees used in the European Macroseismic Scale (EMS).
Table A8.
Definitions of intensity degrees used in the European Macroseismic Scale (EMS).
| Arrangement of the Scale | II | III | IV |
|---|---|---|---|
| Effects on humans. | The tremor is felt only in isolated instances (<1%) of individuals at rest and in a specially receptive position indoors. | The earthquake is felt indoors by a few people. People at rest feel a swaying or light trembling. | The earthquake is felt indoors by many people and is felt outdoors only by very few. A few people are awakened. The level of vibration is not frightening. The vibration is moderate. Observers feel a slight trembling or swaying of the building, room, bed, chair, etc. |
| Effects on objects and on nature. | No effect. | Hanging objects swing slightly. | Clanging of crockery, glassware, windows, and doors. Hanging objects sway. In some cases, light furniture shaking visibly. In some cases, clicking of carpentry. |
| Damage to buildings. | No damage. | No damage. | No damage. |
References
- Canary Islands Institute of Statistics (Instituto Canario de Estadística). Tourists According to Places of Residence and Types of Traveler. Canary Islands for Months. Available online: https://www3.gobiernodecanarias.org/istac/statistical-visualizer/visualizer/data.html?resourceType=dataset&agencyId=ISTAC&resourceId=E16028B_000011&version=1.11#visualization/table (accessed on 20 October 2022).
- Edmunds, W.M.; Smedley, P.L. Fluoride in Natural Waters BT—Essentials of Medical Geology: Revised Edition; Selinus, O., Ed.; Springer: Dordrecht, The Netherlands, 2013; pp. 311–336. ISBN 978-94-007-4375-5. [Google Scholar]
- Hamilton, I.R.; Bowden, G.H. Response of Freshly Isolated Strains of Streptococcus Mutans and Streptococcus Mitior to Change in PH in the Presence and Absence of Fluoride during Growth in Continuous Culture. Infect. Immun. 1982, 36, 255–262. [Google Scholar] [CrossRef] [PubMed]
- Karthikeyan, G.; Shunmugasundarraj, A. Isopleth Mapping and In-Situ Fluoride Dependence on Water Quality in the Krishnagiri Block of Tamil Nadu in South India. Fluoride 2000, 33, 121–127. [Google Scholar]
- Lenton, R.; Wright, A.M.; Lewis, K. Health, Dignity and Development: What Will It Take? Earthscan: London, UK, 2005; ISBN 1844072193. [Google Scholar]
- Ozsvath, D.L. Fluoride and Environmental Health: A Review. Rev. Environ. Sci. Biotechnol. 2009, 8, 59–79. [Google Scholar] [CrossRef]
- Russell, A.L.; Elvove, E. Domestic Water and Dental Caries. VII. A Study of the Fluoride-Dental Caries Relationship in an Adult Population. Public Health Rep. 1951, 66, 1389–1401. [Google Scholar] [CrossRef] [PubMed]
- UNICEF. UNICEF Handbook on Water Quality; UNICEF: New York, NY, USA, 2008. [Google Scholar]
- Pohl, H.R.; Wheeler, J.S.; Murray, H.E. Sodium and Potassium in Health and Disease. Met. Ions Life Sci. 2013, 13, 29–47. [Google Scholar] [CrossRef]
- Cotruvo, J.; Fawell, J.K.; Giddings, M.; Jackson, P.; Magara, Y.; Festo Ngowi, A.V.; Ohanian, E. Potassium in Drinking-Water Background Document for Development of WHO Guidelines for Drinking-Water Quality; World Health Organization: Geneva, Switzerland, 2009. [Google Scholar]
- Barberio, M.D.; Barbieri, M.; Billi, A.; Doglioni, C.; Petitta, M. Hydrogeochemical Changes before and during the 2016 Amatrice-Norcia Seismic Sequence (Central Italy). Sci. Rep. 2017, 7, 11735. [Google Scholar] [CrossRef]
- Pasvanoglu, S.; Canik, B.; Rosen, M.R. Hydrogeology and Possible Effects of the Mw 7.4 Marmara Earthquake (17 August 1999) on the Spring Waters in the Orhangazi-Bursa Area, Turkey. J. Geol. Soc. India 2004, 63, 313–322. [Google Scholar]
- Reddy, D.V.; Nagabhushanam, P.; Sukhija, B.S. Earthquake (M 5.1) Induced Hydrogeochemical and Δ18O Changes: Validation of Aquifer Breaching-Mixing Model in Koyna, India. Geophys. J. Int. 2011, 184, 359–370. [Google Scholar] [CrossRef]
- Skelton, A.; Claesson, L.; Chakrapani, G.; Mahanta, C.; Routh, J.; Mörth, M.; Khanna, P. Coupling between Seismic Activity and Hydrogeochemistry at the Shillong Plateau, Northeastern India. Pure Appl. Geophys. 2008, 165, 45–61. [Google Scholar] [CrossRef]
- Claesson, L.; Skelton, A.; Graham, C.; Dietl, C.; Mörth, M.; Torssander, P.; Kockum, I. Hydrogeochemical Changes before and after a Major Earthquake. Geology 2004, 32, 641–644. [Google Scholar] [CrossRef]
- Falcone, R.A.; Carucci, V.; Falgiani, A.; Manetta, M.; Parisse, B.; Petitta, M.; Rusi, S.; Spizzico, M.; Tallini, M. Changes on Groundwater Flow and Hydrochemistry of the Gran Sasso Carbonate Aquifer after 2009 L’Aquila Earthquake. Ital. J. Geosci. 2012, 131, 459–474. [Google Scholar] [CrossRef]
- Hartmann, J.; Levy, J.K. The Influence of Seismotectonics on Precursory Changes in Groundwater Composition for the 1995 Kobe Earthquake, Japan. Hydrogeol. J 2006, 14, 1307–1318. [Google Scholar] [CrossRef]
- La Vigna, F.; Carucci, V.; Mariani, I.; Minelli, L.; Pascale, F.; Mattei, M.; Mazza, R.; Tallini, M. Intermediate-Field Hydrogeological Response Induced by L’Aquila Earthquake: The Acque Albule Hydrothermal System (Central Italy). Ital. J. Geosci. 2012, 131, 475–485. [Google Scholar] [CrossRef]
- King, C.Y.; Zhang, W.; Zhang, Z. Earthquake-Induced Groundwater and Gas Changes. Pure Appl. Geophys. 2006, 163, 633–645. [Google Scholar] [CrossRef]
- Liu, C.-Y.; Chia, Y.; Chuang, P.-Y.; Chiu, Y.-C.; Tseng, T.-L. Impacts of Hydrogeological Characteristics on Groundwater-Level Changes Induced by Earthquakes. Hydrogeol. J. 2018, 26, 451–465. [Google Scholar] [CrossRef]
- Gori, F.; Barberio, M.D. Hydrogeochemical Changes before and during the 2019 Benevento Seismic Swarm in Central-Southern Italy. J. Hydrol. 2022, 604, 127250. [Google Scholar] [CrossRef]
- Röshoff, K. Seismic Effects on Bedrock and Underground Constructions. A Literature Survey of Damage on Constructions, Changes in Groundwater Levels and Flow, Changes in Chemistry in Groundwater and Gases; Swedish Nuclear Fuel and Waste Management Company: Stockholm, Sweden, 1989. [Google Scholar]
- de Miguel-García, E.; Gómez-González, J.F.; Cruz, J.L. Determining Groundwater Quality Based on Volcanic Terrain: A Case Study from the Island of Tenerife, Spain. J. Afr. Earth Sci. 2023, 207, 105059. [Google Scholar] [CrossRef]
- Nasiri, F.; Mafakheri, M.S. Qanat Water Supply Systems: A Revisit of Sustainability Perspectives. Environ. Syst. Res. 2015, 4, 13. [Google Scholar] [CrossRef]
- CIATF (Island Water Council of Tenerife) Hydrogeological Units of Tenerife. Available online: https://www.aguastenerife.org/images/pdf/PHT1erCiclo/I-DocumentoInformacion/I-1-Memoria/I_1_Memoria%20Informacion.pdf (accessed on 23 July 2024).
- Frencken, J.E. Endemic Fluorosis in Developing Countries Causes, Effects and Possible Solutions; TNO Institute for Preventive Health Care: Leiden, The Netherlands, 1992. [Google Scholar]
- Lemaitre, R.W. Igneous Rocks: A Classification and Glossary of Terms. 2nd Edition. Cambridge (Cambridge University Press), 2002, Xvi + 236 Pp. Price £45.00. ISBN 0 521 66215 X. Mineral. Mag. 2002, 66, 623–624. [Google Scholar] [CrossRef]
- Nicholls, I.A.; Whitford, D.J. Potassium-Rich Volcanic Rocks of the Muriah Complex, Java, Indonesia: Products of Multiple Magma Sources? J. Volcanol. Geotherm. Res. 1983, 18, 337–359. [Google Scholar] [CrossRef]
- de Miguel-García, E.; Gómez-González, J.F. A New Methodology to Estimate the Powder Factor of Explosives Considering the Different Lithologies of Volcanic Lands: A Case Study from the Island of Tenerife, Spain. Tunn. Undergr. Space Technol. 2019, 91, 103023. [Google Scholar] [CrossRef]
- Woith, H.; Wang, R.; Maiwald, U.; Pekdeger, A.; Zschau, J. On the Origin of Geochemical Anomalies in Groundwaters Induced by the Adana 1998 Earthquake. Chem. Geol. 2013, 339, 177–186. [Google Scholar] [CrossRef]
- Greenland, L.; Lovering, J.F. Fractionation of Fluorine, Chlorine and Other Trace Elements during Differentiation of a Tholeiitic Magma. Geochim. Cosmochim. Acta 1966, 30, 963–982. [Google Scholar] [CrossRef]
- Floyd, P.A.; Fuge, R. Primary and Secondary Alkali and Halogen Element Distribution in Iceland Research Drilling Project Basalts from Eastern Iceland. J. Geophys. Res. 1982, 87, 6477–6488. [Google Scholar] [CrossRef]
- Aoki, K.; Ishiwaka, K.; Kanisawa, S. Fluorine Geochemistry of Basaltic Rocks from Continental and Oceanic Regions and Petrogenetic Application. Contrib. Mineral. Petrol. 1981, 76, 53–59. [Google Scholar] [CrossRef]
- Paul, D.K.; Buckley, F.; Nixon, P.H. Fluorine and Chlorine Geochemistry of Kimberlites. Chem. Geol. 1976, 17, 125–133. [Google Scholar] [CrossRef]
- Bailey, D.K.; Macdonald, R. Fluorine and Chlorine in Peralkaline Liquids and the Need for Magma Generation in an Open System. Miner. Mag. 1975, 40, 405–414. [Google Scholar] [CrossRef]
- Sigvaldason, G.E.; Óskarsson, N. Fluorine in Basalts from Iceland. Contrib. Mineral. Petrol. 1986, 94, 263–271. [Google Scholar] [CrossRef]
- Ishikawa, K.I.; Kanisawa, S.; Aoki, K.I. Content and Behavior of Fluorine in Japanese Quaternary Volcanic Rocks and Petrogenetic Application. J. Volcanol. Geotherm. Res. 1980, 8, 161–175. [Google Scholar] [CrossRef]
- Hosono, T.; Yamada, C.; Manga, M.; Wang, C.Y.; Tanimizu, M. Stable Isotopes Show That Earthquakes Enhance Permeability and Release Water from Mountains. Nat. Commun. 2020, 11, 2776. [Google Scholar] [CrossRef] [PubMed]
- Skelton, A.; Andrén, M.; Kristmannsdóttir, H.; Stockmann, G.; Mörth, C.M.; Sveinbjörnsdóttir, Á.; Jónsson, S.; Sturkell, E.; Gudrúnardóttir, H.R.; Hjartarson, H.; et al. Changes in Groundwater Chemistry before Two Consecutive Earthquakes in Iceland. Nat. Geosci. 2014, 7, 752–756. [Google Scholar] [CrossRef]
- Malakootian, M.; Nouri, J. Chemical Variations of Ground Water Affected by the Earthquake in Bam Region. Int. J. Environ. Res. 2010, 4, 443–454. [Google Scholar]
- Zandvakili, Z.; Nishio, Y.; Sano, Y. Geofluid Behavior Prior to the 2018 Hokkaido Eastern Iburi Earthquake: Insights from Groundwater Geochemistry. Prog. Earth Planet. Sci. 2024, 11, 32. [Google Scholar] [CrossRef]
Disclaimer/Publisher’s Note: The statements, opinions and data contained in all publications are solely those of the individual author(s) and contributor(s) and not of MDPI and/or the editor(s). MDPI and/or the editor(s) disclaim responsibility for any injury to people or property resulting from any ideas, methods, instructions or products referred to in the content. |
© 2024 by the authors. Licensee MDPI, Basel, Switzerland. This article is an open access article distributed under the terms and conditions of the Creative Commons Attribution (CC BY) license (https://creativecommons.org/licenses/by/4.0/).