Abstract
Humans have influenced the sediment transport of rivers on a centurial scale. Our goal was to use the rate of lateral channel processes as a proxy to reconstruct sediment budget (SB) changes of a lowland river (Middle Tisza, Hungary) on a historical scale (1838–2017). The gross sediment budget (GSB) refers to the total area of eroded and accumulated surfaces, and the net sediment budget (NSB) indicates the sediment sink or source characteristics. At the beginning (1838–1890), the artificial cut-offs increased the slope and channel erosion, but the eroded sediment deposited in the oxbows, so the reach acted as a sediment sink (NSB: +0.1–0.8 m2/m/y). Then (1890–1929), a quasi-equilibrium state developed (NSB: −0.2 m2/m/y to +0.4 m2/m/y). Later (1929–1976), the bank protections impeded lateral erosion, so the system became a sediment sink again (NSB: +0.1–0.7 m2/m/y). Finally (1976–2017), the erosional processes accelerated due to dam construction and revetment collapses, and now the river is a sediment source (NSB: −0.03 to −0.08 m2/m/y). This study proved that (1) the actual SB could not be projected in the long term, as it was heavily modified, and (2) lateral channel changes could be used as a proxy to estimate long-term SB.
1. Introduction
The sediment budget (SB) of river systems refers to the balance between sediment added to and removed from the system [1]. On the other hand, sediment conveyance indicates the sediment movement from the point of origin to the point of exit from the drainage system [2]. The SB of rivers is fundamentally influenced by headward erosion [3], run-off and slope processes [1,4], and vertical and horizontal channel changes [5,6,7,8]. Among them, the lateral channel migration should be highlighted, which could contribute up to 80–90% of the sediment load in the case of some rivers [7,9,10].
The influencing factors of bank processes [11,12,13] and the mechanism of bank retreat [14,15] were studied in detail. However, climate change or human impacts also change the rate of bank retreat on a centurial scale; thus, the SB alters in the long term [1,16,17]. For example, the riparian vegetation was effectively altered by humans during the last centuries, influencing the erodibility of the banks [15]. River engineering works (e.g., revetments) also drastically change the bank materials [18,19] and, consequently, the bank erosion [20] and SB [16,21]. It must be noted that according to De Rose and Basher [22], most of the eroded material (up to 80%) is redeposited within the system.
Former studies often highlighted the erosional processes as sediment sources [23] and regularly neglected the role of accumulation, though the sediment sinks are very important elements of the SB [6,22,24]. This discrepancy could be related to the applied methods and the spatiotemporal resolution of the studies. According to Wishart et al. [17], the SB of a reach is determined by the input from upstream, bank, and channel erosion; knick-point regression; and human disturbances (e.g., in-channel mining). However, Lauer et al. [8] highlighted the importance of in-channel and overbank aggradation as well.
In order to understand the influencing factors, mechanism, and rate of bank retreat, usually the studies applied at-a-site measurements, such as measuring the exact location of the bankline by repeated GPS surveys or remote sensing-based measurements, bank profiling, and erosion pins. As these field works are labor intensive, the researchers usually selected a short section of a river and monitored the changes for a limited time. For this reason, field works were performed on a few meters to ca. 10 km long sections [5,7], which usually had the highest bank-retreat rates. Moreover, lateral migration was often measured during highlighted events with great erosivity or just for some years [6,22,25,26]. As the sections and periods with limited erosion or accumulation were often neglected, quite contradictory results exist on the role of bank processes on an SB [11,22,27]. Therefore, larger-scale studies are needed to understand the importance of bank erosion and accumulation in the SB of a river.
In recent decades, the development of remote sensing technologies (e.g., photogrammetry, LiDAR) has made available the detailed study of fluvial erosion and accumulation [5,6,7]. These methods are suitable for analyzing the processes of longer sections, but usually just for shorter periods (e.g., 2–3 years; [6]) and just on shallow rivers [5,8]. Their disadvantages are that they are not suitable for evaluation for longer, e.g., centurial bankline or SB changes, and their applicability is limited by deep channels, high suspended sediment concentration, and dense riparian vegetation [5]. In SB calculations applying aerial photo interpretation, the horizontal error could be ca. ±5%. However, the vertical error is much greater (±20%), especially in areas with great depth variations and where channel depth is estimated [17]. If all errors are considered, the error in the estimated and measured SB calculations could be as much as ±50% [17].
Volumetric and areal approaches were developed to analyze the SB. Spiekermann et al. [7] calculated the volume of erosion and accumulation by combining horizontal (planform) changes of a river with bank height. Using transects perpendicular to the channel centreline at regular intervals is common to detect lateral bank migration [7]. Other researchers preferred to use the polygonal area between two banklines to evaluate migration rates because, in this way, no information is lost between the transects [22,28]. In this case, the polygon area is divided by the length of the polygon. Eventually, the mean lateral channel change could be expressed in meters. A crucial point of the volumetric approach is bank height [7] and channel cross-section [8], as the elevation differences can change considerably due to the changes in thalweg depth and bankline elevation. Thus, in centurial SB calculations, an assumed constant bank height might contribute to significant errors [22]. Therefore, according to Spiekermann et al. [7], no long-term trends could be detected by applying the volumetric approach. In a long-term study (ca. 80 y), Lauer et al. [8] tried to solve the challenge of volumetry by estimating bankfull cross-sectional area by at-a-station analysis, but it also carries large errors due to in-channel processes.
Despite these weaknesses, the long-term SB should be reconstructed to allow for an understanding of the actual sediment characteristics of the rivers. To evaluate the actual sediment household from the point of view of long-term SB is especially important, as during the last century and especially in recent decades, human impacts and climate change have fundamentally changed the sediment transport characteristics of river systems. The actual, measured sediment load data could not be applied if someone wants to understand the behavior of rivers for longer periods.
Large-scale engineering works started on the Tisza River (Central Europe) in the mid-19th century, when over one hundred cut-offs were made, and the natural floodplain was confined by artificial levees [29]. Therefore, this work is considered the largest human intervention in the Carpathian Basin [30]. The engineering works continued in the 20th century with the construction of revetments, groynes, and dams. The works will continue, as there is a plan for a new dam and increased water withdrawal, but there are limited data on sediment discharge and SB. At-a-site suspended sediment measurements are performed just at 11 points on the 962 km long river, and these measurements are performed monthly, irrespective of the hydrological situation. Hence, only limited data exist on the real sediment transport and budget; furthermore, they reflect the sediment transport of the actual, highly altered fluvial system.
Therefore, the present study aims to reconstruct the long-term SB of the Tisza River based on horizontal channel changes. The aims are to (1) evaluate the total amount (GSB) of eroded and trapped material along the 243 km long reach of the Middle Tisza (Hungary) during the last 180 years; (2) to calculate the net SB (NSB) changes; (3) to highlight the periods and locations of active sediment sources or sinks; and finally (4) to evaluate the role of various human impacts on long-term SB changes. The mean bankfull depth of the Tisza is rapidly changing (11.5–21.5 m) spatiotemporally [31]; thus, to avoid considerable errors, the areal approach of Wishart et al. [17] was followed, and the depth was not considered in the SB calculations.
2. Study Area
The Tisza River (Central Europe) drains the eastern half of the Carpathian Basin (catchment area: 157,200 km2). Its total length is 962 km, and its 243 km long middle reach (403–160 river km) was analyzed in detail. The upstream boundary of the studied reach is the Kisköre Dam, while its downstream boundary is the Hungarian–Serbian border (Figure 1).
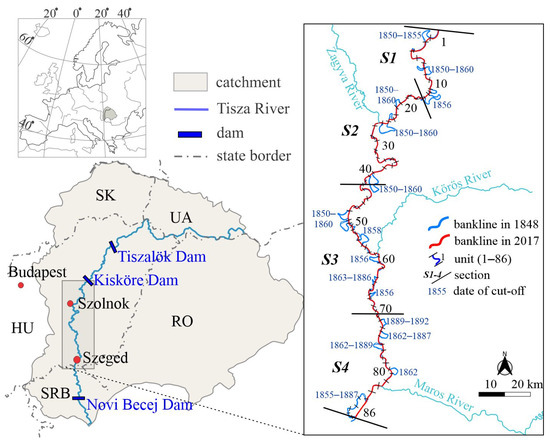
Figure 1.
The Middle Tisza River in Central Europe was studied in detail. The reach was divided into four sections (S1–S4) and 86 units (bends).
Along the studied reach, three main tributaries join the Tisza (Zagyva: Qav: 5 m3/s; Körös: Qav: 107 m3/s; and Maros: Qav: 179 m3/s). The average discharge increases from 500 m3/s at Kisköre to 864 m3/s at Szeged [32], although it fluctuates within a wide range (Qmin: 60 m3/s; Qmax: 4350 m3/s measured at Szeged). Usually, floods occur in spring (March–April), while August–October is the low-stage period [29]. This regime slightly changed during the last decade, as floods shifted to the winter months and they reached much lower stages.
The mean slope of the reach decreases from 3.7 cm/km to 2.5 cm/km; therefore, the flow velocity is low (0.1–1 m/s), and the Tisza transports mainly suspended sediments [29]. Based on monthly data measured at Szeged (2015–2021), the suspended sediment concentration varies between 34 ± 14 and 97 ± 75 g/m3 [33]. The highest concentrations appear before the peak of floods, but during low stages, most of the transported suspended sediment is deposited at the bottom. According to Bogárdi’s [34] measurements from the 1960s, the annual amount of suspended sediment is ca. 18.7 million tonnes, and the bedload is just 9000 t/y. In the 19th and 20th centuries, no systematic sediment load measurements were performed. According to a description [35], the amount of bedload drastically increased at the time of 19th-century channel regulation works, and large mid-channel bars were formed, so the riffles (channel depth: ≤1 m) prevented navigation.
2.1. Characteristics of the Channel before the Engineering Works
Natural channel conditions existed until the late 18th century. The channel was highly meandering (sinuosity: ≥1.96), and its floodplain was 10–100 km wide [29]. The channel had a very low slope, which was ≤2 cm/km along the studied reach [29]. The channel development was rapid in the upstream part of the studied reach, indicating erodible (sandy) bed material [36]. Contrarily, the downstream part of the channel is mostly embedded in silty and clayey sediments, and the lateral migration rate was only 0.7 m/y [37,38].
2.2. River Regulation Works
The river regulation and floodplain protection works started in 1846 along the Tisza River. In its time, it was the largest river engineering project in Europe, with approx. 17,300 km2 large area (18% of Hungary) became flood-free due to the construction of a 2940 km long artificial levee system [29]. The artificial levees were replaced and heightened several times; thus, their internal structure is multi-layered, and their current height is 5–7 m [38]. As a result of levee construction, the originally 10–100 km wide floodplain became 1–5 km wide. As the floods with high suspended sediment concentration entered the narrow floodplain, the overbank sedimentation accelerated; thus, 0.4–2.6 m of sediment was deposited, drastically increasing flood levels and reducing flood safety [38].
Altogether, 112 cut-offs were made along the entire Tisza simultaneously with the levee constructions (1846–1918), and 25 meanders were cut off along the studied reach. At first, a straight pilot channel was dug. Its width was just 11–45 m, and its depth was 1.6–3.7 m [29], so its dimensions were ⅒ to ⅓ of the channel itself. The idea was that the river would erode a new channel with the necessary parameters. However, along the studied reach, only nine pilot channels developed according to the plan, but at 16 locations, the channel development was very slow due to the low slope and the non-erosive bed material. So, further digging and dredging was necessary [30,36]. As a result, the previously 1419 km long Tisza was shortened by 37% [29]. The original length of the studied reach was shortened by 40%, from 405 km to 243 km. The slope of the river almost doubled, and its mean bankfull depth became 8.1 m (7.8–8.4 m) [29].
The increased slope amplified the stream power of the Tisza; thus, the bank erosion accelerated (max: 2.4 m/y), especially in the sharp meanders [37]. Since the lateral channel migration endangered the nearby artificial levees, bank revetments and groynes were built to stabilize the channel. These works started in the early 20th century, but most stone revetments (80%) were built between the 1930s and 1960s [39]. Today, more than half of the banks are stabilized [38]. As a result of the revetments, the channel became deeper (9.8 ± 1.1 m; [40]). The point-bar formation continued on the convex side of the channel. Therefore, the channel became narrower (−15–19%), and the cross-sectional area decreased (3.5%; [41]). Finally, the channel became so incised that the stones of the revetments simply rolled into the pools, and the revetments collapsed [39]. Currently, 58% of the revetments are damaged [20], and the bank erosion behind them accelerated to 0.56–1.16 m/y [40].
Finally, reservoirs and dams were built to provide irrigation water for farms (Lászlóffy, 1982). Three dams were built on the Tisza, two in Hungary at Tiszalök (1954), Kisköre (1973), and another in Serbia at Novi Becej (1976). The Tiszalök and Novi Becej dams impound water just in the channel, whereas the reservoir at Kisköre occupies the floodplain, too. The hydrology of the study reach is highly dependent on the operation of the dams. The studied reach starts at the Kisköre Dam; moreover, its downstream section (along ca. 100 km) is influenced by the impoundment of the Novi Becej Dam. In each reservoir, ca. 600–900 thousand m3 of sediment is deposited annually [42,43]. Approximately 30% of the annual suspended sediment load is trapped in them.
3. Materials and Methods
3.1. Data Source
The hydrological background of the lateral channel changes was evaluated based on daily stage data measured at Szolnok (1876–2020). The annual highest, mean, and lowest stages were calculated. The annual duration of overbank floods (Df) was defined as the annual number of days over 500 cm. The duration of low stages (Dl) refers to the number of days with stages lower than −100 cm.
The lateral channel shift was mapped using maps and a LiDAR survey. The maps were made by hydrologists, and the sheets represent the actual position of the bankline (bankfull channel) and the location of cut-offs, revetments, groynes, and artificial levees. However, they do not display depth data. All spatial data were transformed into the HD72/EOV (EPSG: 23700) coordinate system.
The first survey (made in 1838–1842) represents natural conditions performed before the river regulation works. The next survey (1890–1891) was conducted just before the end of the works. They were published together on maps (scale = 1:25,000) without a coordinate system; therefore, georeferencing was necessary using the Georeferencer tool in QGIS 3.28.11 and applying 4–5 ground control points on each map sheet. To avoid measurement errors and problems related to the georeferencing, the banklines of this map were compared just with each other, but they were not compared to the banklines of the subsequent maps.
The next series of maps (scale = 1:10,000) represent the banklines from the 1890–1891, 1929–1931, and 1976 surveys. The maps were originally created to illustrate the hydro-engineering constructions, and channel depth data are not included in them. Finally, a digital elevation model of a LiDAR survey made in 2017 was used (with the permission of the Lower Tisza District Water Directorate). The elevation model has a 1 m grid (absolute horizontal accuracy < 10 cm). Cross-sections were taken every 5 m along the centerline to define the exact location of the banklines by applying the “Profile Tool” in QGIS. The brink-lines of the riverbanks were identified based on the visible vertex points and connected to form a continuous bankline. To vectorize the riverbank lines and to create the line string geometry shapefile layers, QGIS was applied.
3.2. Dividing the Studied River Reach into Units and Sections
The studied 243 km long reach was divided into 86 units based on the map made in 1976. Each unit represents an artificial cut-off or a single bend. In the case of artificial cut-offs, the starting and end points of a cut-off were selected as unit’s boundaries so that multiple bends are within these units. In the case of bends without artificial cut-off, the inflection points (intersection between the centerline and the thalweg) were determined and set as the boundaries of the units, marking only single bends. The same boundaries were applied, regardless of meander migration.
Based on the spatiotemporal characteristics of the units, the reach was divided into four sections (S1: 403–361 river km; S2: 361–289 r km; S3: 289–212 r km; and S4: 212–160 r km; Figure 1).
3.3. Evaluation of the Area of Lateral Accumulation or Erosion
The vector layers of the banklines were overlapped using the “Union” vector geoprocessing tool of QGIS. Then, the combined pairs of vector line layers were used as the input for the “Polygonize” processing tool. The created polygons enclosed areas by banklines from subsequent survey years (Figure 2). The area (m2) of the polygons was calculated and used to measure the lateral erosion (E) or accumulation (A) related to horizontal channel migration. The lateral accumulation and erosion have complex spatial patterns; thus, they could alternate along the banks within a unit.
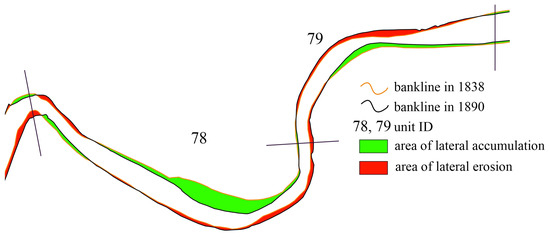
Figure 2.
The areas affected by lateral accumulation and erosion were determined within each unit.
3.4. Calculation of Local Sediment Budget Parameters following the Areal Approach
In the present study, the areal approach was followed. Based on the location of the subsequent banklines, the area influenced by active erosion (E) and accumulation (A) was calculated. As the units have various lengths, the area affected by lateral channel movement was calculated for a unit length of one year (m2/m/y). The total area of annual erosion (E) and accumulation (A) refers to the total amount of mobilized sediments, thus the yearly gross SB (GSB) (Table 1). Nonetheless, as erosion and accumulation are opposite processes, only some sediment could be transported away from a unit; thus, the yearly net SB (NSB) was also calculated. If the unit has a negative sign, it serves as a sediment source as erosion exceeds accumulation. In contrast, the positive sign refers to the dominance of accumulation, which is a sediment sink.

Table 1.
Calculated parameters for the analysis of lateral sediment dynamics.
The volumetric approach was not suitable in the case of the Tisza, as the depth data could result in large errors. The errors originate from different sources. (1) In the 19th and 20th centuries, only one (if any) cross-section was surveyed in each unit at a random location. The location fundamentally influences the measured depth, as in the 2017 survey, the depth conditions of a unit varied between 12 and 32 m, compared to the mean depth by ±12–40% (see Appendix A). (2) The elevation of the bankline (bankfull level) continuously increased, as the overbank aggradation was 0–2.64 m since the regulations [38]. Unfortunately, elevation data exist only for 2017. (3) The depth of the channel changes by 3–5 m during a flood due to the mobilization of the sandy bed material [44]. (4) After great floods, deep pools developed (in U71, the greatest depth was 29 m after the flood in 2006), which were gradually filled and buried in the subsequent years. So, the timing of a survey fundamentally influences the measured depth data. When these errors were considered, we decided not to apply the volumetric method but to use the areal approach.
4. Results
4.1. Temporal Changes in Hydrology at Szolnok
The years between 1876 and 2017 were divided into six terms (Figure 3).
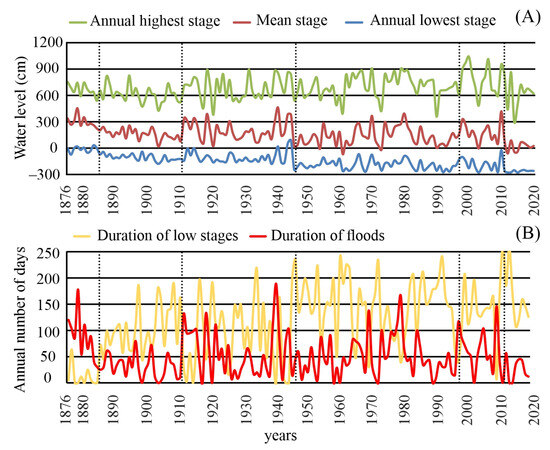
Figure 3.
(A) Highest, mean, and lowest annual stages at Szolnok measured between 1876 and 2020. (B) Annual duration of low stages (≤100 cm) and overbank floods (≥500 cm).
In the first years (1876–1885), overbank floods occurred each year. They became gradually shorter as their duration dropped from 3–5 months to one month (mean Df: 87 d/y). The highest flood level (753 cm) of the period was registered in 1876. Low stages lasted for 11 days on average. The lowest (−75 cm) and longest (64 days) low-stage period occurred in 1877.
Later on (1886–1912), the stages slightly dropped. Floods became less uniform, and their duration decreased to 1–2 months (mean Df: 31 d/y). Even flood-free years appeared on the record. In this period, two new, record-high flood peaks were registered (1888: 818 cm and 1895: 827 cm); thus, the peak flood level increased by 74 cm. Newer and newer lowest record levels were measured in five years (1888: −99 cm; 1890: −118 cm; 1900: −139 cm; 1903: −146 cm and 1904: −180 cm); thus, the level of low stages dropped by 105 cm compared to the first period. Their duration increased (mean Dl: 103 d/y), though the longest low-stage period lasted for more than 6 months (1909).
The beginning and end of the years between 1913 and 1945 were more humid. Thus, the annual mean and low-stage levels shifted higher than in the previous period. The duration of overbank floods (Df: 60 d/y) doubled. The flood in 1941 was not exceptionally high, but it was the longest (189 d) on record. New, record-high floods were registered twice (in 1919: 884 cm and in 1932: 894 cm); thus, compared to the second period, the peak flood level increased by 67 cm. Due to the high and long floods, the duration of the low stages decreased (Dl: 88 d/y). However, the yearly lowest stages decreased further by −2 cm. Thus, a new record was set in 1939 (−182 cm).
The fourth period (1946–1997) was similar to the previous one, but the low stages dropped, and all parameters became more diverse. Overbank floods did not cover the floodplain every year, and their duration decreased by 20% (mean Df: 48 d/y). A new flood record was recorded just once, in 1970 (909 cm), which was higher by 15 cm than in 1932. This flood was considered one of the largest floods in history, as simultaneous floods developed in the entire fluvial system of the Tisza, and the flood protection of settlements required great efforts [44]. Record low stages were documented in 1946 (−247 cm) and 1963 (−260 cm). Thus, the recorded lowest stage dropped further by 78 cm compared to the previous period. The mean duration of low stages increased 1.7-fold (mean Dl: 110 d/y), and in several years, the low stages lasted for 7–8 months (max: 241 d).
The fifth period (1998–2011) was outstanding from the view of floods. Extremely high floods followed each other in 1999 (974 cm) and 2000 (1041 cm). Though the flood in 2006 was just the second highest on record (1013 cm), it lasted more than three months. The peak flood level increased by 139 cm, which was outstanding in the fluvial history of the river. The duration of overbank floods increased by 37% (mean Df: 66 d/y) compared to the previous period. Despite the floods, the low stages lasted long (Dl: 130 d/y), and a new record-low stage was recorded in 2003 (−279 cm), indicating a further drop of 19 cm.
Recently (2012–2020), droughts hit the catchment. Thus, water levels dropped. The duration of floods decreased by more than 70% (mean Df: 23 d/y); meanwhile, the duration of low stages (Dl: 170 d/y) increased by over 30%. The lowest stage on record was detected in 2015 (−279 cm), reaching the same level as in 2003. No new record flood was measured. It should be noted that the mean stages varied almost in the same range as the low stages were at the beginning of the measurements, as their level dropped by almost 300 cm.
4.2. Centurial Sediment Budget Changes of the Studied Reach, Sections and Units
Based on the area affected by lateral channel migration, the mean yearly gross sediment budget (GSB) was calculated for the whole study reach (Figure 4, Table A1 and Table A2 in Appendix B). The mean GSB was 1.4 m2/m/y during the entire studied 179 years, but it varied between the periods (GSB: 0.3–2.3 m2/m/y). The mean yearly net SB was smaller with a positive sign (NSB: +0.2 m2/m/y), referring to the sediment sink nature of the reach in the long term. The NSB values also differed significantly between the five surveys (NSB: −0.1 to +0.5 m2/m/y).
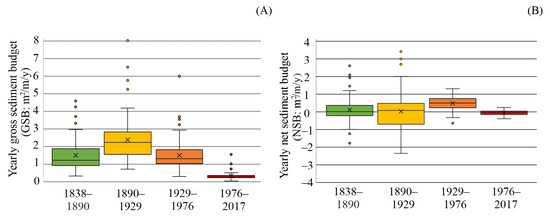
Figure 4.
Temporal changes in yearly gross (A) and yearly net (B) sediment budget values of the units of the studied Middle Tisza River.
4.2.1. First Period: 1838–1890
In the first period, the ongoing artificial cut-offs and levee constructions influenced the channel processes. The total area influenced by lateral channel shifts was the largest (~33 million m2), and the mean GSB of the reach was slightly higher (1.6 m2/m/y) than the long-term average (Figure 4A). The GSB (1.9 ± 0.9 m2/m/y) was the highest in the S1 section, where the greatest length reduction (−48%) was measured (Figure 5). On the contrary, the lowest GSB characterized the S2 section (1.2 ± 0.5 m2/m/y), where the length reduction caused by artificial cut-offs was only −35%. The local maxima of the GSB graphs (Figure 6A) were at the artificial cut-offs (e.g., U11,13,24,40,49,64 and U86) and sharp bends (e.g., U4,47 and U52).
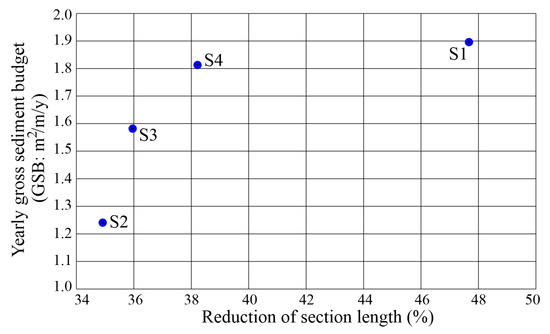
Figure 5.
Relationship between the rate of channel shortening and the yearly gross sediment budget (GSB) of the sections at the time of the artificial cut-offs (1838–1890).
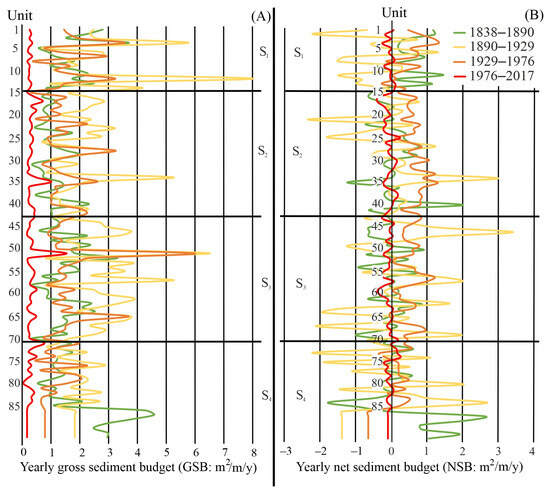
Figure 6.
Spatiotemporal changes in yearly gross (A) and yearly net (B) sediment budget of the units of the Middle Tisza River between 1838 and 2017.
These differences are less characteristic when the NSB values are considered (Figure 4B and Figure 5B). The mean NSB of the reach was +0.3 m2/m/y; hence, the studied reach acted as a sediment sink. In this period, the active channel area had the greatest reduction (−8 million m2), as narrowing (−10.5%) was very intensive, mainly in the oxbow lakes created by artificial cut-offs. The upstream section (S1) had the highest sediment trapping capacity, and the NSB decreased downstream, referring to gradually balanced lateral erosion and accumulation (Figure A3). This spatial trend terminated in the lowermost section (S4), where the GSB and NSB values slightly increased (Figure 6B). This reach had the lowest channel narrowing (−5.1%), as the narrowing (−15%) related to the sedimentation in the oxbow lakes was compensated by the widening (+10%) of the active channel.
4.2.2. Second Period: 1890–1929
In this period, no direct human interventions altered the channel. The area affected by lateral channel changes decreased by 34% (~21.7 million m2), and the channel narrowing continued, but with a lower rate (−5.8%). However, the mean GSB of the reach (2.3 m2/m/y) increased by 43%, referring to intensified processes in a limited area. The rate of sediment mobilization reached its maximum in S3 (GSB: 2.8 ± 1.2 m2/m/y). The location of the lowest GSB (1.9 ± 0.9 m2/m/y) remained in S2, similar to the previous period. Almost every unit reached its highest GSB value during this period. However, it varied within a wide range (0.7–8 m2/m/y), having the highest variability during the studied 180 years (Figure 4A and Figure 6A).
The NSB also became much more variable, ranging between −2.4 and 3.5 m2/m/y (median: 0.08 m2/m/y and average: 0.02 m2/m/y). The larger part of the box plot in the negative range (Figure 4B) suggests that the natural widening of the pilot channels was the most intensive during this period, supplying material for rapid aggradation, as reflected by the outliers in the positive range. The reach was quite variable at a unit level (Figure 6B). Compared to the previous period, the highest NSB values shifted downstream and occurred in units downstream of the artificial cut-offs (U12,14,23,51,53,57,61,65,76 and U 82); though, some sharp bends remained active (U1,4, and U28).
The mean NSB of the reach decreased (+0.1 m2/m/y), referring to almost an equilibrium between erosion and accumulation (Figure A3 in Appendix B). In contrast to the high positive NSB of the previous period, the S1 switched to a negative range, reflecting greater sediment erosion than accumulation, while the other sections still had net accumulation (Table A2). The most pronounced changes occurred in S3, where both GSB and NSB intensified, and the section’s evolution shifted towards a dominantly depositional direction.
4.2.3. Third Period: 1929–1976
In the first half of this period, most revetments were built to stabilize the channel. The area affected by lateral channel movements (16.3 million m2) decreased further (−25%), and the channel became narrower (−14%). Contrary to the previous period, the mean GSB of the reach (1.4 m2/m/y) decreased by 40%. There has been a steady reduction of areas involved in lateral movement, and the amount of transported material has dropped (Figure 4A). Considering the section-scale changes, the GSB values decreased to or below the values of the first period, and they became more similar to each other than before. The majority of the intensive sediment transport was in units downstream of artificial cut-offs (U12,22,41,42,51,65 and U76) and sharp bends (U4,28 and U71) (Figure 6A).
The mean NSB of the reach increased significantly (+0.5 m2/m/y) compared to the former periods, referring to the sediment sink behavior of the reach (Figure 4B). The NSB became less variable (Figure 6B) and strongly shifted in the positive range (+0.5–0.7 m2/m/y), especially in the units of the upper three sections (S1–S3). Similar to the previous periods, the S4 behaved differently, as it had similar characteristics as before. The strong decrease in the standard deviation of the NSB values (±0.3–0.5) of all sections reflects similar evolution of the units, independently of their location or morphology.
4.2.4. Fourth Period: 1976–2017
The Kisköre Dam, just upstream of the reach, started to operate in 1973, and the Novi Becej Dam began operations in 1976, impounding the downstream section of the reach. During the last period, the area of the active channel showed a slight increase (+1.2%), referring to channel widening. The total area of lateral movements was the lowest on record, as it covered only 3.1 million m2 (−81%). The GSB (0.3 m2/m/y) and the NSB of the reach (−0.1 m2/m/y) decreased significantly. The narrow box plots refer to very similar SBs of the units (Figure 4 and Figure 6). The sediment transport of the sections also became more uniform and limited, and they developed similarly, with little variations. A more uniform SB and active channel development with decreasing sediment transport evolved along the studied reach. The GSB graph in Figure 4 has only four local maxima (U17,35,51 and U71): these units were the last bends of the river without direct human impacts. By this time, a significant portion of the eroding banks had been stabilized by stone revetments, effectively preventing lateral channel movement. Thus, the fluvial activity has been reduced, even in the units with previously significant lateral movement. The negative sign of the NSB of most units and in all sections suggests the dominance of lateral erosion, which seems to be in contrast with the existence of the revetments. As the lateral erosion was limited by the presence of bank revetments almost everywhere, the erosion appeared only along very small patches, but its rate was considerable.
Ultimately, during the study, which lasted nearly 180 years, the area of riverbanks affected by lateral channel shifts drastically decreased (−90%), resulting in a similar decrease in GSB (−81%). The total area of the active channel, including losses due to artificial cut-offs, has been reduced by 39.6 million m2.
4.3. Sediment Budget in Units with Characteristic Morphology
The section- and unit-scale analysis revealed that the evolution of the SB was different in the units with different morphologies. Therefore, the units were classified based on morphology and human impacts (Figure 7).
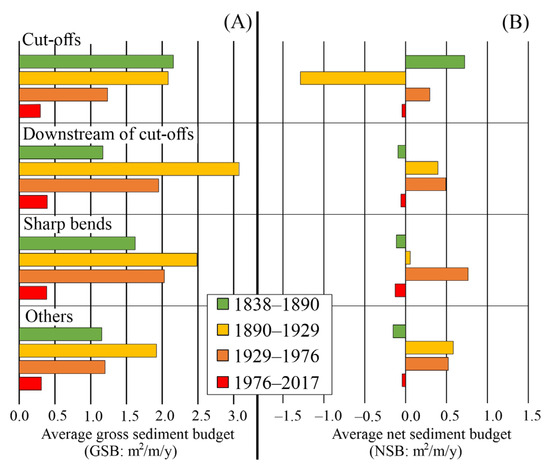
Figure 7.
Average yearly gross (A) and yearly net (B) sediment budget of the morphological types.
4.3.1. Units at Artificial Cut-Offs
The units at artificial cut-offs have a complex morphology, as they contain (1) a cut-off channel section, which became an oxbow lake, and (2) a pilot channel, which developed into a straight or slightly sinuous channel section (Figure 7).
The SB of these units refers to very active processes between 1838 and 1890, as their GSB (2.2 m2/m/y) and NSB (+0.7 m2/m/y) values were greater by 35–40% than in any other units. At the time of the river regulations, the water flow was shared between the pilot channels and the still-active oxbow lakes as they became detached from the main river gradually. As a result, the water-surface area of the oxbow lakes decreased (−22.8%), indicating considerable sediment storage in these units (14 million m2). The SB of cut-offs decreased between 1890 and 1929 (GSB: 2.1 m2/m/y; NSB: −1.3 m2/m/y). Most of the oxbow lakes have already been disconnected from the active channel, which means that most of the sediment has moved along the main channel. Erosion dominated in the pilot channels, as ca. 3.5 million m2 bank area was eroded. The erosion was driven by the increased stream power related to the local slope increase. Hence, intensive widening (+41.9%) of the active (pilot) channels was measured. In the next periods, the SB of the cut-offs decreased. Between 1929 and 1976, both values decreased, with the GSB at 1.2 m2/m/y and the NSB at +0.3 m2/m/y. Their decline continued from 1976 to 2017, as the GSB (0.28 m2/m/y) and NSB (−0.01 m2/m/y) values decreased further by 77%. It indicates the onset of erosional processes, resulting in a 1.1% channel widening.
From the group of cut-off units, two units (U25 and U55) were highlighted to present their evolution in detail (Figure 8). Both units had a higher gross budget (GSB: 0.4–3.6 m2/m/y) than the other units in the group. The meander in U25 was cut off in the 1850s, while in U55, it was made in 1858. Their oxbow lakes are intensively aggraded, indicated by their variable bankfull channel widths (43–395 m) and large accumulation surfaces (U25: 560,000 m2 and U55: 790,000 m2). As a consequence, their NSBs in the first period reflect sediment storage (U25: +0.34 m2/m/y; U55: +0.74 m2/m/y). Erosion was also active in these units (U25: 266,000 m2 and U55: 350,000 m2) because the pilot channels gradually expanded. However, widening was a slow process due to the low erodibility of the clayey channel materials. For that reason, it took a long time for the pilot channels to be fully occupied by the Tisza and for the final blockage of the oxbows from the active channel.
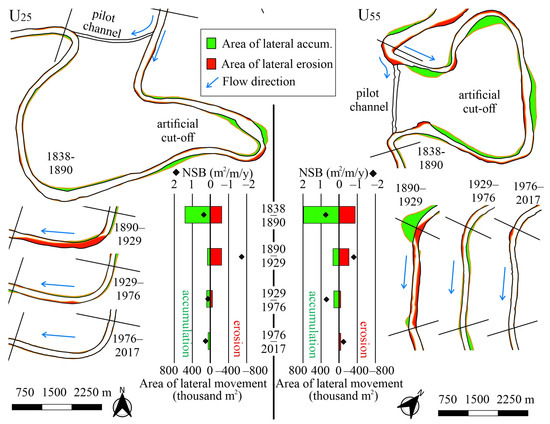
Figure 8.
The evolution of artificial cut-off units based on the examples of the units U25 (340–337 r km) and U55 (254–251 r km).
The further development of U25 provides a classic example of the evolution of a cut-off unit (Figure 8). The channel had insignificant lateral migration between 1890 and 1929, and the unit had exclusively erosional character (263,000 m2). Thus, it was a sediment source (NSB: −1.8 m2/m/y). In the next period (1929–1976), the area of lateral accumulation (72.500 m2) and erosion (57,000 m2) decreased, and the unit became a negligible sediment sink (NSB: +0.1 m2/m/y). The sediment sink character continued after 1976 (NSB: +0.24 m2/m/y). However, at this point, the evolution of the U25 split from the evolution of the other cut-off units, as most of them refer to accelerated erosion. The sediment sink behavior of U25 could be explained by local factors, as significant bank erosion (99,500 m2) occurred upstream of the unit (U21–24), and a large proportion of the eroded sediment was trapped within the U25 unit (A: 38,500 m2).
Meanwhile, the SB changes in U55 had a very special temporal pattern, as the erosion of the pilot channel was combined with significant lateral channel migration (Figure 8). This particular evolution is explained by the regulation of the upstream unit (U54). Its geometry was misfitted to the downstream unit, so the thalweg shifted very close to the bank, and rapid erosion started at the boundary between them. The channel was narrowed (−70%) by groynes between 1890 and 1929 to stop the extreme widening and lateral channel shift. In the upstream part of U55, it resulted in intensive lateral accumulation (112,500 m2), whereas bank erosion (48,000 m2) remained limited. In the downstream part of the unit, the widening of the pilot channel (E: 162,500 m2) continued, interrupted by minor accumulation patches (A: 24,000 m2). The NSB of the unit reflected a sediment source (−0.8 m2/m/y) character. After 1929, only small areas began to erode (33,500 m2) because the groynes shifted the thalweg towards the centerline. A new point-bar started to form along the left (eastern) bank (A: 80,500 m2). Thus, the NSB reversed once again (+0.7 m2/m/y), and this unit showed quite a high rate of sediment storage. In the last period, the revetment started to collapse, so the bank behind began to erode (E: 17,500 m2). Today, the U55 has become a prominent sediment source (NSB: −0.2 m2/m/y).
4.3.2. Units Downstream of Artificial Cut-Offs
The units downstream of cut-offs had low GSB (1.2 m2/m/y) between 1838 and 1890. Then (1890–1929), it increased markedly by 2.6-fold (GSB: 3.1 m2/m/y), and these units had the highest average GSB of all groups (Figure 8). This could be explained by the accelerated point-bar formation (GSBmax: 8 m2/m/y), as the erosion of pilot channels provided surplus sediment flux, which influenced the SB of the downstream units. In these units, the bank erosion also became more intensive. Still, its extent was slight, so the NSB (+0.4 m2/m/y) refers to a sediment sink behavior. Consequently (1890–1929), the active channel became narrower (−9.7%), as the total area of accumulation surfaces was 4.3 million m2 in this group of units. This area was similar in size to the eroded area due to the expansion of the pilot channels.
Later (1929–1976), the average GSB decreased by 39% (1.9 m2/m/y). In the units downstream of cut-offs, the total area of lateral accumulation (1.6 million m2) exceeded the total area of lateral erosion (1.2 million m2); thus, they still acted as sediment sinks (NSB: +0.5 m2/m/y). Therefore, the channel narrowing reached its peak (−12.7%). In this period, revetments were built to prevent erosion along the concave bank, but the formation of point-bars continued at the same rate along the convex banks. Therefore, in the last period (1976–2017), the average GSB decreased further (−79%). However, these units still had the highest GSB values (0.39 m2/m/y) compared to all groups. The channel started to widen (1.8%), similar to the units at cut-offs, but it was more intensive than the units upstream.
Two units were chosen to present the channel evolution of the units downstream of cut-offs (Figure 9). The meanders upstream of these selected units were cut off almost simultaneously (U3: 1865; U56–57: 1858). The U3 was already a significant sediment sink in 1838–1890 (NSB: +0.37 m2/m/y), with considerable point-bar formation along its entire length (A: 336,000 m2). In the next period (1890–1929), the area of point-bars increased (A: 429,000 m2), whereas the area affected by erosion only slightly increased (251,000 m2). So, the unit remained a sediment trap with increasing efficiency (NSB: +0.7 m2/m/y). The sediment storage (NSB: +1.2 m2/m/y) within the unit became even more effective between 1929 and 1976 when several smaller point-bars started to develop instead of the former one. The total area of lateral accumulation increased by 18% (505,000 m2).
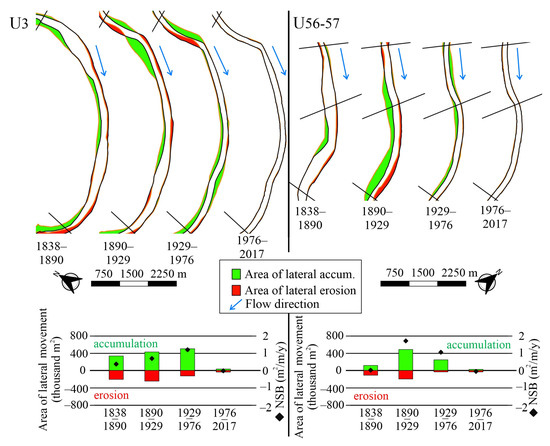
Figure 9.
Evolution of units downstream of artificial cut-offs (U3: 395–388 r km; U56–57: 251–247 r km).
In the U56–57, the area of lateral erosion (114,000 m2) and accumulation (117,500 m2) were balanced between 1838 and 1890, so the NSB (+0.02 m2/m/y) reflects almost an equilibrium state. Between 1890 and 1929, a huge amount of sediment (495,000 m2) was deposited along the banks, so the unit became a very effective sediment sink (NSB: +1.7 m2/m/y). However, between 1929 and 1976, the area of point-bars decreased (A: 251,000 m2), but the unit still acted as a sediment sink (NSB: +1.1 m2/m/y).
In the 20th century, the units tended to become closer in their NSB values, so by 1976–2017, the evolution of the studied units (U3 and U56–57) became very similar. The formerly extensive point-bar formation became limited to smaller areas (U3: 32,500 m2 and U56–57: 25,500 m2). Simultaneously, the bank erosion exceeded the sediment accumulation. The most intensive erosion appeared at the downstream end of the damaged revetments, creating steep and unstable riverbanks sliding into the channel. The NSB entered a negative range (U3: −0.03 m2/m/y and U56–57: −0.06 m2/m/y), so these units started functioning as sediment sources.
4.3.3. Units at Sharp Bends
The sharp bends are prominent sites of bank erosion and sediment accumulation. In the first period (1838–1890), the GSB was 1.7 m2/m/y and the NSB −0.1 m2/m/y (Figure 7); thus, the sharp bends acted as sediment sources. Therefore, the channel width in these units increased slightly (+1.3%) compared to the other groups. Then (1890–1929), the sediment movement in these units increased (GSB: 2.5 m2/m/y), but accumulation dominated (NSB +0.1 m2/m/y); therefore, the channel at sharp bends began to narrow (−2.1%). Later (1929–1976), the GSB declined (2.0 m2/m/y), but the units became the greatest sediment sinks on record (NSB: +0.8 m2/m/y). Thus, unlike the other units, the channel narrowing accelerated (−18.2%). In the last period (1976–2017), the channel widened (+2.7%), but its rate was much higher than in other units, suggesting very effective bank erosional processes. Eventually, the average GSB of the sharp meanders also decreased (0.38 m2/m/y), and again, they became highlighted sediment sources (NSB: −0.13 m2/m/y).
Most members of the morphological group of sharp bends followed unique evolutionary pathways depending on local conditions (e.g., slope, erodibility of bank material) and human interventions. To illustrate these differences, the evolution of two sharp meanders (U17 and U71) is presented (Figure 10).
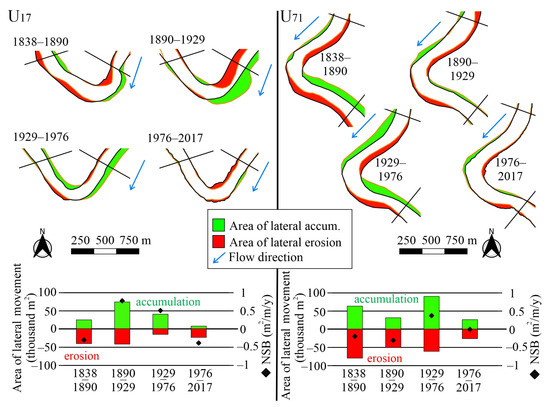
Figure 10.
Evolution patterns of sharp bends (U17: 358–357 r km and U71: 212–211 r km).
These sharp bends were characterized by significant lateral channel migration and GSB (U17: 1.2 m2/m/y and U71: 1.7 m2/m/y) during the river regulation works (1838–1890). The area of lateral erosion dominated (U17: 41,000 m2 and U71: 79,500 m2) over accumulation (U17: 24,500 m2 and U71: 62,500 m2) in both units. Thus, they acted as sediment sources, as their NSB ranged from −0.3 to −0.2 m2/m/y.
The development of the bends diverged after the cut-offs were completed (1890–1929). In unit U17, the lateral channel migration became more intensive as the GSB increased (2.9 m2/m/y). Contrary to the previous period, the area of lateral accumulation increased (73,500 m2), and the erosion slightly decreased (42,500 m2). NSB (+0.8 m2/m/y) became positive, indicating a transformation from sediment source to sink. On the contrary, the GSB (1.3 m2/m/y) in the other unit (U71) decreased, as both the area affected by accumulation (31,000 m2) and erosion (50,500 m2) decreased. The NSB of the unit remained unchanged (−0.3 m2/m/y). In the next period (1929–1976), revetments were built along the Tisza. The U17 was also bank-protected, so within this unit, the eroded area decreased significantly (15,500 m2), but the accumulation of the point-bar continued (40,000 m2). Therefore, the GSB decreased by almost 62% (1.1 m2/m/y), and the sediment sink characteristic is well reflected by the high NSB value (+0.5 m2/m/y). As a result, the active channel became narrower (−15.4%). In the last period (1976–2017), the point-bar formation stopped due to the lack of sediment supply, while bank erosion accelerated at some points, especially in the form of landslides. These landslides appeared on the concave and convex banks; thus, the previous point-bar also started sliding down. Due to these processes, the middle of the sharp bend widened by +12.5%, and this unit started to function as a sediment source (NSB: −0.4 m2/m/y).
Meanwhile, the U71 bend was not revetted, and it developed almost naturally. Between 1929 and 1976, the GSB increased (2 m2/m/y), as both the area of lateral accumulation (89,500 m2) and erosion remained large (61,000 m2). The NSB of the unit (+0.4 m2/m/y) indicated a similar degree of sediment sink as of the revetted U17. Due to these processes, the channel also became narrower (−9.6%), but to a smaller extent than in the revetted bend. Finally (1976–2017), the ongoing point-bar formation (A: 25,700 m2) was offset by bank erosion (26,400 m2); hence, the NSB (U71: −0.01 m2/m/y) reached its equilibrium. Therefore, the channel width (+0.2%) remained almost the same.
4.3.4. Other Units
The remaining units are not located at or downstream of cut-offs or at a sharp bend. Their SBs evolved differently than the other morphological groups (Figure 7). Between 1838 and 1890, they similarly developed as the units downstream of cut-offs (GSB: 1.1 m2/m/y; NSB: −0.2 m2/m/y). In the subsequent period (1890–1929), their SB increased, though with less than that of the other groups (GSB: 1.9 m2/m/y) with the dominance of accumulation (NSB: +0.6 m2/m/y). Between 1929 and 1976, the GSB of these units gradually declined (1.2 m2/m/y), but they remained sediment sinks (NSB: +0.5 m2/m/y). Finally (1976–2017), the GSB declined further (0.31 m2/m/y), and these units became sediment sources (NSB: −0.04 m2/m/y).
5. Discussion
5.1. Evolution of Sediment Budget on a Centurial Scale
The GSB of the studied reach varied between 0.3 and 2.3 m2/m/y during 180 years; thus, the Tisza transported a significant mass of sediment. The average NSB for the whole period was much smaller (+0.2 m2/m/y) with a positive sign. This suggests that the amount of trapped sediment slightly exceeded that of eroded sediment. On a long-term basis, the reach acted as a sediment sink. It is in contradiction with the fact that during the studied one and half centuries, peak floods increased by 288 cm, and the low stages dropped by 204 cm. The extreme stages could support bank erosion [11,12,13,14,15], as the high stages can increase the weight of the banks promoting mass movements and erode the slipped material. Whereas during low stages, the banks lose their support. Nevertheless, the extremely high floods of the Tisza River developed because of the narrowing channel [38] and not because of the increase in peak discharge [44].
The long-term SB changes reflect the response of the system to the various human disturbances by changing sediment transport.
Most artificial cut-offs were made during the first period (1838–1890). The main aim of the artificial cut-offs was quickly achieved, as the duration of floods decreased because the flood waves rapidly propagated in the shortened channel with a greater slope. However, the SB responded slower. As the pilot channels were smaller than the active channel, the river had to excavate the necessary channel size itself [36]. Along the pilot channels, the slope increased, and the bank erosion became very active. Therefore, the total area affected by lateral erosion was the largest, and the GSB was high (1.6 ± 0.9 m2/m/y). The erosion of pilot channels supplied a large amount of sediment, and along the pilot channels, the channel intensively widened and deepened. Nonetheless, the oxbows still conveyed some part of the flow for a while, though the flow velocity gradually decreased in them. Hence, most of the conveyed sediment was deposited in the oxbow lakes. The accelerated accumulation formed sediment plugs at the ends of the oxbows, and their channel became narrower and shallower [36]. Therefore, the whole reach acted as a sediment sink (NSB: +0.3 ± 0.7 m2/m/y). A similar evolution of the cut-offs and their oxbows were formerly described on several rivers [45,46,47].
By the next period (1890–1929), almost all cut-offs were finished, and only two meanders were cut off at this time. As a result of cut-offs, the slope doubled, and the stream power increased [29]. Contrarily, the erosional and accumulation areas became more restricted as the total area of lateral channel movement was reduced by a third. Moreover, these locations had rapid channel changes, especially at and downstream of cut-offs. GSB reached its peak (2.3 ± 1.3 m2/m/y). The lateral erosion and accumulation became balanced; thus, the NSB (+0.1 ± 1.1 m2/m/y) decreased. Therefore, a new equilibrium state developed on a reach scale corresponding to the new slope conditions. However, the uppermost section (S1) with the highest reduction in channel length had a unique development phase, as this section became a net sediment source.
Engineers faced a new challenge in the next period (1929–1976). The increased slope caused by artificial cut-offs led to accelerated bank erosion, so artificial levees were endangered at some locations due to the rapid lateral shift of the active channel. Therefore, revetments were built along the concave banks, causing a dramatic reduction in lateral erosion [39]. Simultaneously, the development of point-bars on the convex banks continued. Channel narrowing peaked, and incision started [20,45], which was also reflected by the dropping stages and the increasing duration of the low stages. Thus, in this period, the area of lateral erosion decreased, triggering the decrease in accumulation areas as well. The SB declined by 40% (GSB: 1.4 ± 0.8 m2/m/y). However, it was dominated by accumulation (NSB: +0.5 m2/m/y). Net SB shifted from equilibrium as the sediment sink function dominated. This sediment trapping affected the active channel, and the oxbow lakes were just slightly influenced (as floods could enter them during very high stages. Similar responses on revetment constructions were also described on other large rivers as well [46,47,48].
During the last period (1976–2017), the Kisköre Dam started to operate (1973) at the upstream end of the reach, while the downstream part of the reach was influenced by the impoundment of the Novi Becej Dam (1976). Their effects were combined with the effects of the still-existing revetments. The lateral channel movements were restricted to a much smaller area (−81%) than before, and active lateral processes became typical just at a limited number of sites. It resulted in a decrease in GSB by −78% (0.3 ± 0.2 m2/m/y). For the first time during the studied period, the NSB of the studied reach had a negative sign (−0.1 m2/m/y); thus, the entire studied reach of the Tisza became a sediment source dominated by erosional processes to counterbalance the sediment deficit of the system. The increased erosion was partly related to the incised channel, as the revetments collapsed into the deepened pools and accelerated bank erosion started behind them [20]. Simultaneously, the limited sediment supply of the system and the deep channel triggered the erosion of the point-bars as well. Today, these forms gradually disappear [20,40]. The sediment deficit of the reach was also supported by Cserkesz-Nagy et al. [49], who performed ultrahigh-resolution seismic measurements on the upstream half of the study area. They found a limited amount or no sandy bedload over the ancient silty–clayey channel material. The erosional processes may further increase, as 58% of the revetments show some degradation rate [20]. These processes resulted in slight (+1.2%) channel widening, so the channel narrowing following the revetment construction terminated. The modern sediment shortage of the Tisza is not unique, as erosion-dominated rivers are common in many regions [1,5,7,16,17,46,47,48], mainly because of reduced run-off from the catchments and impeded vertical and horizontal channel erosion by engineering structures.
5.2. Engineering Works and the Evolution of the Local Sediment Budget
5.2.1. Sediment Budget Changes Due to Artificial Cut-Offs
The first large-scale engineering works on the Tisza were the artificial meander cut-offs (1846–1918). A small pilot channel was excavated and eroded by the river to an appropriate size. Therefore, the system responded to this intervention with increased sediment flux. A similar increase in sediment load was detected at neck cut-offs [50,51]. A close relationship between GSB and cut-off length was proven at a section scale. The increased slope at the cut-offs accelerated the lateral and vertical erosion [20,40]; thus, the pilot channels widened and deepened, fitting the bankfull discharge. Therefore, in the cut-off units, the GSB was 7.5 times greater during the response time (1890–1929) than recently (1976–2017). So, the cut-off units served as highlighted sediment sources. The ultrahigh-resolution seismic measurements also support it, as downstream of artificial cut-offs, there is still a surplus of bedload sediment above the bed material [49]. Most cut-off units were well-designed; thus, the thalweg and the center line merged, and the lateral erosion became limited later. However, the design of some units was inadequate: the thalweg shifted close to the bank, increasing the lateral erosion and producing sediment even after the response period of cut-offs.
The units downstream of the pilot channels responded later to the increased slope and the sediment supply from the upstream units. Their SB increased only after ca. 50 years of engineering work. The sediment surplus initiated accelerated point-bar formation, as Hooke [50] described at natural cut-offs and Cserkesz-Nagy et al. [49] downstream of artificial cut-offs. As the bank erosion could not balance the point-bar formation, these units typically functioned as sediment sinks, and their active channel became significantly narrower.
The increased sediment supply related to cut-offs also caused rapid sedimentation in the oxbow lakes. Hooke [50] and Li and Gao [51] described the rapid formation of sediment plugs. In addition, the water surface of the oxbow lakes of the Tisza was reduced by nearly 25% during artificial cut-offs, as the abandoned channel sections acted as excellent sediment traps due to the reduced flow velocity. Increased sediment transport and oxbow lake sedimentation due to artificial cut-offs were also observed on the Maros River, a tributary of the Tisza, where during the channel regulation works, the sedimentation rate (1.9–2.4 cm/y) was 2–5 times higher than during the post-regulation period. Thus, the oxbow lakes disappeared in a few decades [52]. The increased sediment transport was combined with the artificially reduced width of the floodplain (i.e., levee constructions). The natural floodplain aggradation rate (0.2–0.8 cm/y) was doubled [52,53]. Similarly, increased aggradation rates due to channel regulation and flood protection measures were measured along several rivers [54,55,56].
5.2.2. Sediment Budget Changes Due to Revetment Constructions
The construction of revetments and groynes was performed throughout the studied reach, mainly between the 1930s and 1960s, though the works continued today. As a result, along ca. half of the reach one bank is revetted today. Revetment construction was necessary because (1) the increased slope caused by cut-offs triggered rapid lateral channel shift, especially along meanders, and (2) the artificially confined floodplain did not provide enough space for the channel belt. In the period of revetment constructions, the formerly increased GSB related to artificial cut-offs returned to its original value (1929–1976: 1.4 ± 0.8 m2/m/y). However, the NSB (1929–1976: +0.5 ± 0.4 m2/m/y) indicated that the system acted as the most effective sediment sink during this period. Simultaneously, the channel became deeper by 5–48% to counterbalance the narrowing, and the cross-sectional bankfull channel area decreased by 17–45% [45]. The formation of point-bars and sediment sheets caused channel narrowing. This phenomenon was observed not only at revetted units but also in freely developing meanders and cut-off units, as 91% of the studied units became narrower. Thus, it could be concluded that the groynes enhanced the sediment-trapping function of the whole reach. So here, the ‘legacy sediment’ defined by James [57] could be applied, as due to human impacts, accumulation and storage of sediments within reach were documented.
The revetments caused channel deepening [46,47,48], which finally led to their destruction as they slid to the bottom [20]. In general, the downstream ends of a revetment were damaged, and intensive lateral erosion (0.56–1.16 m/y) was initiated [40]. In the extensively over-regulated system, the GSB (1976–2017: 0.3 ± 0.2 m2/m/y) decreased significantly (−80–87%) compared to previous periods. Moreover, the negative range of the NSB values (1976–2017: −0.1 ± 0.1 m2/m/y) suggests that for the first time in historic times, the whole studied reach of Tisza became a sediment source to counterbalance the sediment deprivation of the system.
5.2.3. Sediment Budget Changes Due to Construction of Dams
The channel evolution was influenced by nearby dams (Kisköre and Novi Becej) in the last period of the survey. In the reservoirs, a significant amount of sediment was trapped [42,43]. Therefore, the sediment deficit of the system after 1976 was caused by the combined effects of dams and revetments. However, there is no clear evidence of a direct impact of dams on the SB, as in the uppermost section downstream of Kisköre Dam (S1), the GSB was not changed by clear water erosion. On the other hand, the downstream section (S4) is influenced by the impoundment of the Novi Becej Dam, but its sediment sink function was not accelerated either.
5.3. Validity of Recent Sediment Discharge Measurements: Long-Term Objectives
The various engineering interventions effectively changed the rate of lateral bank erosion and accumulation; thus, they significantly altered the long-term SB of the Tisza River. Currently, the NT indicates the dominance of sediment deficit, which means the river attempted to respond to the human impacts by intensive erosion. On a centurial scale, similar declining SBs were documented by Webb-Sullivan and Evans [17] and Wishart et al. [17]. Analogous erosion-dominated fluvial systems have been described by Bravard et al. [16], Wishart et al. [17], Lea and Legleiter [5], and Spiekermann et al. [7]. As human impacts affect an increasing number of rivers and to a growing extent [15,16], the variability of the SB could be expected on a decadal scale [1,17]. Therefore, current sediment discharge measurements are often performed on rivers with a decline in sediment discharge. The results of the measurements could not be generalized over a longer term, and the applicability of the measured data for prediction or past reconstructions is also questionable.
In addition, bank erosion produces mainly fine-grained sediment, while coarser sediments could be derived from the upper sub-catchments [6,52]. If less material is transported from the upper sub-catchments to the lower reaches due to system disconnections (e.g., dams, reservoirs; [24]) and the role of local bank erosion in local SB changes, the grain composition of the transported sediment (coarse-grained vs. fine-grained) and the mode of transport (bedload vs. suspended sediment) may also change. Thus, the measured data could have different characteristics than a river’s long-term SB.
In the present study, the SB was calculated from lateral channel changes (areal approach). Their combination with depth data (areal approach) would make it possible to determine the exact volume of material involved in the transport. Unfortunately, in our case, no accurate depth data were available from the first survey (1838), and the subsequent surveys recorded depth just by 1–2 km intervals. These cross-sections were taken in random locations: at the apex of a meander, at an inflection point, or between them. Consequently, they reflect varying depths of pools and riffles; therefore, calculating the volume of sediment from these sparse data could result in large errors [17]. To solve this problem, Spiekermann et al. [7] addressed the application of a constant bank height for each period. However, the Tisza’s bank height varied from 8.2 to 22.4 m in 1891 and 11.5 to 21.5 m in 2017 [40], showing that calculating the volume under such variable depth conditions would lead to significant bias.
6. Conclusions
The sediment budget (SB) of rivers is determined by sediments (1) eroded from the upper sub-catchments and (2) the vertical and horizontal channel movements. Nevertheless, rivers are under increasing human impact, as the floodplains are confined providing flood-free lands for agriculture and settlements, and the channels are regulated supporting shipping and energy production, for example. All these engineering works affect the SBs of rivers. The introduced case study was performed on a 234 km long reach of the Middle Tisza (Hungary) on a centurial scale. The detailed hydrological surveys since 1838 made it possible to perform a long-term SB analysis from the point of view of human impacts.
The various human activities influenced the SB in different ways. The earliest artificial cut-offs increased the SB substantially, and the response of the river gradually declined as a new equilibrium was reached in ca. 80–100 years. However, the artificial riverbank stabilizations caused a long-lasting disturbance. First, they increased the sediment sink behavior of the system as the point-bar accumulation continued on the opposite banks of the revetments. In this way, the system moved far from its equilibrium SB. To restore the equilibrium, in the incised channel, the revetments started to collapse, and the lateral erosion accelerated behind them. After all, the SB is still negative, referring to sediment deficit and a non-equilibrium state.
No long-term depth data are available on most rivers, but horizontal channel changes could be easily detected on maps. In the present paper, we aimed to prove that lateral channel migration data could be applied as a proxy to reconstruct long-term SB changes. Therefore, we encourage fluvial researchers to reconstruct centurial SB based on horizontal channel changes, even if no volumes of the transported sediment could be determined in this way.
Author Contributions
Conceptualization, T.K. and G.T.T.; methodology, M.T. and T.K.; writing—original draft preparation, T.K. and M.T.; writing—review and editing, G.S. and G.T.T.; visualization, M.T.; project administration, G.T.T. All authors have read and agreed to the published version of the manuscript.
Funding
The research was funded by the Sustainable Development and Technologies National Programme of the Hungarian Academy of Sciences (FFT NP FTA).
Data Availability Statement
The data that support the findings of this study are available on request from the corresponding author, (e-mail: kisstimi@gmail.com).
Acknowledgments
The authors are grateful to the Lower Tisza District Water Directorate (ATIVIZIG) for providing the hydrological maps and LiDAR data. Thanks to the anonymous reviewers for their valuable comments.
Conflicts of Interest
The authors declare no conflicts of interest.
Appendix A
The volumetric approach was tested in four units for the last period (1976–2017), as detailed depth data were available only from 2017. The depth was measured along the thalweg (mean bankfull depth) and in characteristic points of a unit. The depth data were multiplied by the total area of erosion and accumulation to calculate the volume of mobilized sediments.
The volume of the mobilized sediment differed by ±12–40% compared to the mean of the unit (Figure A1). The U4, U17, and U71 represent sharp bends (Figure A2); thus, their depth conditions were highly variegated. The maximum depth (31.2 m) was measured at U17, where an already collapsing revetment accelerated the incision. On the contrary, the U46 is almost a straight unit; its depth variations are still close to the freely developing U4 bend. Thus, the volumetric approach in this unit also led to 12% errors compared to the mean.
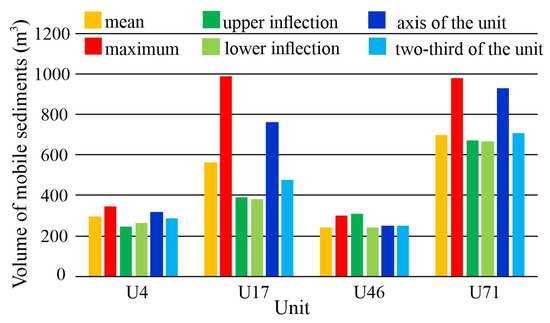
Figure A1.
The gross sediment budget (m3) of selected units depending on the location of depth measurement.
The volumetric approach, while a valuable tool, resulted in considerable errors (±12–40%) in the calculation of total SB. These calculated errors were found to be similar to the error (50%) calculated for volumetric calculations by Wishart et al. [17]. Therefore, in light of these findings, the areal approach of SB was followed in the presented paper, highlighting the need for alternative methods in the case of mobile riverbeds and the lack of depth data.
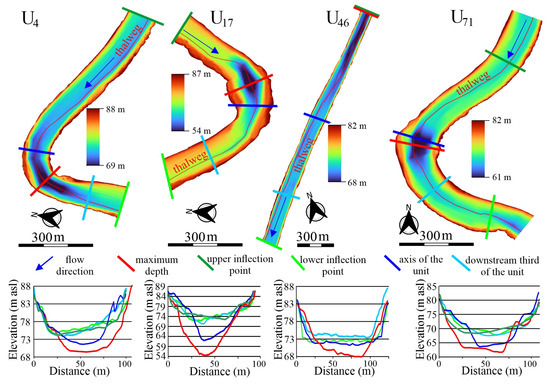
Figure A2.
The bankfull depth was measured on various points of units to test the volumetric approach. The depth measurements were performed on the digital elevation map made in 2017.
Appendix B

Table A1.
Yearly gross sediment budget (±standard deviation) of the sections (S1–S4) and the average of the Middle Tisza River reach between 1838 and 2017.
Table A1.
Yearly gross sediment budget (±standard deviation) of the sections (S1–S4) and the average of the Middle Tisza River reach between 1838 and 2017.
| Yearly Gross Sediment Budget (m2/m/y) | 1838–1890 | 1890–1929 | 1929–1976 | 1976–2017 | 1838–2017 |
|---|---|---|---|---|---|
| S1 | 1.9 ± 0.9 | 2.3 ± 2.0 | 1.6 ± 0.9 | 0.27 ± 0.1 | 1.5 ± 1.0 |
| S2 | 1.2 ± 0.5 | 1.9 ± 0.9 | 1.4 ± 0.6 | 0.33 ± 0.2 | 1.2 ± 0.5 |
| S3 | 1.6 ± 0.7 | 2.8 ± 1.2 | 1.6 ± 1.0 | 0.34 ± 0.3 | 1.6 ± 0.8 |
| S4 | 1.8 ± 1.2 | 2.0 ± 0.6 | 1.2 ± 0.6 | 0.28 ± 0.2 | 1.3 ± 0.6 |
| Reach average | 1.6 ± 0.9 | 2.3 ± 1.3 | 1.4 ± 0.8 | 0.30 ± 0.2 | 1.4 ± 0.8 |

Table A2.
Yearly net sediment budget (±standard deviation) of the sections (S1–S4) and the average of the Middle Tisza River reach between 1838 and 2017.
Table A2.
Yearly net sediment budget (±standard deviation) of the sections (S1–S4) and the average of the Middle Tisza River reach between 1838 and 2017.
| Yearly Net Sediment Budget (m2/m/y) | 1838–1890 | 1890–1929 | 1929–1976 | 1976–2017 | 1838–2017 |
|---|---|---|---|---|---|
| S1 | +0.8 ± 0.6 | −0.2 ± 1.0 | +0.6 ± 0.5 | −0.03 ± 0.1 | +0.3 ± 0.5 |
| S2 | +0.4 ± 0.6 | +0.1 ± 0.9 | +0.7 ± 0.3 | −0.04 ± 0.2 | +0.3 ± 0.5 |
| S3 | +0.1 ± 0.5 | +0.4 ± 1.2 | +0.5 ± 0.3 | −0.08 ± 0.1 | +0.2 ± 0.5 |
| S4 | +0.2 ± 1.0 | +0.1 ± 1.0 | +0.1 ± 0.3 | −0.04 ± 0.1 | +0.1 ± 0.7 |
| Reach average | +0.3 ± 0.7 | +0.1 ± 1.1 | +0.5 ± 0.4 | −0.1 ± 0.1 | +0.2 ± 0.6 |
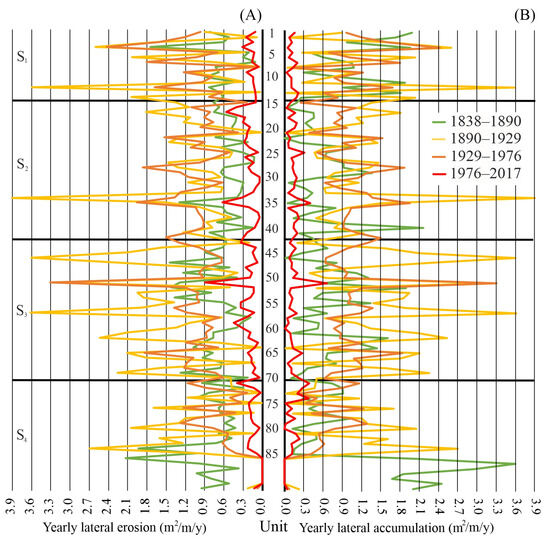
Figure A3.
Spatiotemporal changes in annual lateral erosion (A) and lateral accumulation (B) in each unit of the studied Middle Tisza River between 1838 and 2017.
References
- Webb-Sullivan, L.D.; Evans, J.E. Sediment budget approach to understanding historical stages of the Ottawa River in the context of land-use change, northwestern Ohio and southeastern Michigan, USA. Anthropocene 2014, 7, 42–56. [Google Scholar] [CrossRef]
- Faulkner, D.; McIntyre, S. Persisting sediment yields and sediment delivery changes. JAWRA J. Am. Water Resour. Assoc. 1996, 32, 817–829. [Google Scholar] [CrossRef]
- Nichols, M.H.; Nearing, M.; Hernandez, M.; Polyakov, V.O. Monitoring channel head erosion processes in response to an artificially induced abrupt base level change using time-lapse photography. Geomorphology 2016, 265, 107–116. [Google Scholar] [CrossRef]
- Walling, D.E. Tracing suspended sediment sources in catchments and river systems. Sci. Total Environ. 2005, 344, 159–184. [Google Scholar] [CrossRef] [PubMed]
- Lea, D.M.; Legleiter, C.J. Mapping spatial patterns of stream power and channel change along a gravel-bed river in northern Yellowstone. Geomorphology 2016, 252, 66–79. [Google Scholar] [CrossRef]
- Rusnák, M.; Kaňuk, J.; Kidová, A.; Šašak, J.; Lehotský, M.; Pöppl, R.; Šupinský, J. Channel and cut-bluff failure connectivity in a river system: Case study of the braided-wandering Belá River, Western Carpathians, Slovakia. Sci. Total Environ. 2020, 733, 139409. [Google Scholar] [CrossRef] [PubMed]
- Spiekermann, R.; Betts, H.; Dymond, J.; Basher, L. Volumetric measurement of river bank erosion from sequential historical aerial photography. Geomorphology 2017, 296, 193–208. [Google Scholar] [CrossRef]
- Lauer, J.W.; Echterling, C.; Lenhart, C.; Belmont, P.; Rausch, R. Air-photo based change in channel width in the Minnesota River basin: Modes of adjustment and implications for sediment budget. Geomorphology 2017, 297, 170–184. [Google Scholar] [CrossRef]
- Dymond, J.R.; Herzig, A.; Basher, L.; Betts, H.D.; Marden, M.; Phillips, C.J.; Ausseil, A.-G.E.; Palmer, D.J.; Clark, M.; Roygard, J. Development of a New Zealand SedNet model for assessment of catchment-wide soil-conservation works. Geomorphology 2016, 257, 85–93. [Google Scholar] [CrossRef]
- Wilkinson, S.; Henderson, A.; Chen, Y.; Sherman, B. SedNet User Guide. Client Report; CSIRO Land and Water: Canberra, Australia, 2008; 109p. [Google Scholar]
- Hooke, J.M. Magnitude and distribution of rates of river bank erosion. Earth Surf. Process. 1980, 5, 143–157. [Google Scholar] [CrossRef]
- Lawler, D.M.; Grove, J.R.; Couperthwaite, J.S.; Leeks, G.J.L. Downstream change in river bank erosion rates in the Swale–Ouse system, northern England. Hydrol. Process. 1999, 13, 977–992. [Google Scholar] [CrossRef]
- Zaimes, G.; Schultz, R.; Isenhart, T.M. Stream Bank Erosion Adjacent to Riparian Forest Buffers, Row-Crop Fields, and Continuously-Grazed Pastures Along Bear Creek in Central Iowa. J. Soil Water Conserv. 2004, 59, 19–27. [Google Scholar]
- Lawler, D.M. The Impact of Scale on the Processes of Channel-Side Sediment Supply: A Conceptual Model. In Effects of Scale on Interpretation and Management of Sediment and Water Quality; IAHS Press: Wallingford, UK, 1995. [Google Scholar]
- Rutherford, I. The influence of riparian management on stream erosion. In Principles for Riparian Lands Management; Land & Water Australia: Canberra, Australia, 2007; pp. 85–117. [Google Scholar]
- Bravard, J.P.; Landon, N.; Peiry, J.L.; Piégay, H. Principles of engineering geomorphology for managing channel erosion and bedload transport, examples from French rivers. Geomorphology 1999, 31, 291–311. [Google Scholar] [CrossRef]
- Wishart, D.; Warburton, J.; Bracken, L. Gravel extraction and planform change in a wandering gravel-bed river: The River Wear, Northern England. Geomorphology 2008, 94, 131–152. [Google Scholar] [CrossRef]
- Czech, W.; Radecki-Pawlik, A.; Wyżga, B.; Hajdukiewicz, H. Modelling the flooding capacity of a Polish Carpathian river: A comparison of constrained and free channel conditions. Geomorphology 2016, 272, 32–42. [Google Scholar] [CrossRef]
- Klingeman, P.C.; Kehe, S.M.; Owusu, Y.A. Streambank Erosion Protection and Channel Scour Manipulation Using Rockfill Dikes and Gabions; Water Resources Research Institute, Oregon State University: Corvallis, OR, USA, 1984. [Google Scholar]
- Kiss, T.; Amissah, G.J.; Fiala, K. Bank Processes and Revetment Erosion of a Large Lowland River: Case Study of the Lower Tisza River, Hungary. Water 2019, 11, 1313. [Google Scholar] [CrossRef]
- Billi, P.; Bartholdy, J. Human impact and channel dynamics of a low sinuosity pseudomeandering river. Catena 2024, 239, 107895. [Google Scholar] [CrossRef]
- De Rose, R.C.; Basher, L.R. Measurement of river bank and cliff erosion from sequential LIDAR and historical aerial photography. Geomorphology 2011, 126, 132–147. [Google Scholar] [CrossRef]
- Haddadchi, A.; Bind, J.; Hoyle, J.; Hicks, M. Quantifying the contribution of bank erosion to a suspended sediment budget using boat-mounted LiDAR and high-frequency suspended sediment monitoring. Earth Surf. Process. Landf. 2023, 48, 2920–2938. [Google Scholar] [CrossRef]
- Brierley, G.J.; Fryirs, K.A. Geomorphology and River Management; Blackwell Publishing: Malden, MA, USA, 2005. [Google Scholar]
- Fuller, I.C. Geomorphic impacts of a 100-year flood: Kiwitea Stream, Manawatu catchment, New Zealand. Geomorphology 2008, 98, 84–95. [Google Scholar] [CrossRef]
- Thompson, C.J.; Croke, J.; Fryirs, K.; Grove, J.R. A channel evolution model for subtropical macrochannel systems. Catena 2016, 139, 199–213. [Google Scholar] [CrossRef]
- Walker, M.; Rutherfurd, I. An Approach to Predicting Rates of Bend Migration in Meandering Alluvial Streams. In Proceedings of the Second Australian Stream Management Conference: The Challenge of Rehabilitating Australia’s Streams, Adelaide, VIC, Australia, 28 February 1999; pp. 659–665. [Google Scholar]
- Janes, V.; Holman, I.; Birkinshaw, S.; O’Donnell, G.; Kilsby, C. Improving bank erosion modelling at catchment scale by incorporating temporal and spatial variability. Earth Surf. Process. Landf. 2017, 43, 124–133. [Google Scholar] [CrossRef]
- Lászlóffy, W. The Tisza; Akadémiai Kiadó: Budapest, Hungary, 1982; 610p. [Google Scholar]
- Botár, I.; Károlyi, Z. Regulation Works on the Tisza River I-II; VITUKI: Budapest, Hungary, 1971; 75p. [Google Scholar]
- Amissah, G.J. Channel Processes of a Large Alluvial River under Human Impacts. Ph.D. Thesis, University of Szeged, Szeged, Hungary, 2019. [Google Scholar]
- OVF. Yearbook of the Hydrographical Service of Hungary; OVF: Budapest, Hungary, 2019; Volume CXXI, 336p.
- Mohsen, A.; Kovács, F.; Kiss, T. Remote Sensing of Sediment Discharge in Rivers Using Sentinel-2 Images and Machine-Learning Algorithms. Hydrology 2022, 9, 88. [Google Scholar] [CrossRef]
- Bogárdi, J. Sediment Transport of Rivers; Akadémiai Kiadó: Budapest, Hungary, 1971; 840p. [Google Scholar]
- Korbély, J. River Regulation of the Tisza; Magyar Nemzeti Könyv-és Lapkiadóvállalat: Debrecen, Hungary, 1937; 255p. [Google Scholar]
- Károlyi, Z. A Tisza Mederváltozásai, Különös Tekintettel az Árvízvédelemre; VITUKI: Budapest, Hungary, 1960; Volume 8, 102p. [Google Scholar]
- Fiala, K.; Kiss, T. Channel changes of the Lower Tisza since the 1890s II. Hidrológiai Közlöny 2006, 86, 13–17. [Google Scholar]
- Kiss, T.; Nagy, J.; Fehérvári, I.; Amissah, G.J.; Fiala, K.; Sipos, G. Increased flood height driven by local factors on a regulated river with a confined floodplain, Lower Tisza, Hungary. Geomorphology 2021, 389, 107858. [Google Scholar] [CrossRef]
- Amissah, G.J.; Kiss, T.; Fiala, K. Morphological Evolution of the Lower Tisza River (Hungary) in the 20th Century in Response to Human Interventions. Water 2018, 10, 884. [Google Scholar] [CrossRef]
- Amissah, G.J.; Kiss, T.; Fiala, K. Active point bar development and river bank erosion in the incising channel of the lower Tisza river, Hungary. Acta Geogr. Debrecina Landsc. Environ. Ser. 2019, 13, 13–28. [Google Scholar] [CrossRef]
- Fiala, K.; Kiss, T. Channel changes of the Lower Tisza since the 1890s I. Hidrológiai Közlöny 2005, 85, 60–64. [Google Scholar]
- Csoma, J.; Szilágyi, J.; Zboray, K. A tiszalöki duzzasztott tér víz-, hordalék- és jéglevonulási viszonyai. Vízügyi Közlemények 1967, 49, 249–259. [Google Scholar]
- Rákoczi, L. River Processes in Lowland Rivers. In Proceedings of the St. Petersburg Workshop, Saint Petersburg, Russia, 18–19 September 1996; pp. 86–112. [Google Scholar]
- Kiss, T.; Fiala, K.; Sipos, G.; Szatmári, G. Long-term hydrological changes after various river regulation measures: Are we responsible for flow extremes? Hydrol. Res. 2019, 50, 417–430. [Google Scholar] [CrossRef]
- Kiss, T.; Fiala, K.; Sipos, G. Alterations of channel parameters in response to river regulation works since 1840 on the Lower Tisza River (Hungary). Geomorphology 2008, 98, 96–110. [Google Scholar] [CrossRef]
- Earchi, E.; Roth, G.; Siccardi, F. The Po: Centuries of river training. Phys. Chem. Earth 1995, 20, 475–478. [Google Scholar] [CrossRef]
- Lehotský, M.; Novotný, J.; Szmańda, J. A suburban inter-dike river reach of a large river: Modern morphological and sedimentary changes (the Bratislava reach of the Danube River, Slovakia). Geomorphology 2010, 117, 298–308. [Google Scholar] [CrossRef]
- Provansal, M.; Dufour, S.; Sabatier, F.; Anthony, E.J.; Raccasi, G.; Robresco, S. The geomorphic evolution and sediment balance of the lower Rhône River (southern France) over the last 130years: Hydropower dams versus other control factors. Geomorphology 2014, 219, 27–41. [Google Scholar] [CrossRef]
- Cserkész-Nagy, Á.; Toth, T.; Vajk, Ö.; Sztanó, O. Erosional scours and meander development in response to river engineering: Middle Tisza region, Hungary. Proc. Geol. Assoc. 2010, 121, 238–247. [Google Scholar] [CrossRef]
- Hooke, J.M. River channel adjustment to meander cutoffs on the River Bollin and River Dane, northwest England. Geomorphology 1995, 14, 235–253. [Google Scholar] [CrossRef]
- Li, Z.; Gao, P. Channel adjustment after artificial neck cutoffs in a meandering river of the Zoige basin within the Qinghai-Tibet Plateau, China. Catena 2019, 172, 255–265. [Google Scholar] [CrossRef]
- Kiss, T.; Andrási, G. Effects of the Croatian water power plants on the hydrology and bed-load size of the River Dráva. Hidrológiai Közlöny 2011, 91, 17–29. [Google Scholar]
- Nagy, J. Overbank Sedimentation and Its Influencing Factors in the Lower Tisza River. Ph.D. Thesis, University of Szeged, Szeged, Hungary, 2020. [Google Scholar]
- Biedenharn, D.S.; Thorne, C.R.; Watson, C.C. Recent morphological evolution of the Lower Mississippi River. Geomorphology 2000, 34, 227–249. [Google Scholar] [CrossRef]
- Hupp, C.R.; Schenk, E.R.; Kroes, D.E.; Willard, D.A.; Townsend, P.A.; Peet, R.K. Patterns of floodplain sediment deposition along the regulated lower Roanoke River, North Carolina: Annual, decadal, centennial scales. Geomorphology 2015, 228, 666–680. [Google Scholar] [CrossRef]
- Sedláček, J.; Bábek, O.; Kielar, O. Sediment accumulation rates and high-resolution stratigraphy of recent fluvial suspension deposits in various fluvial settings, Morava River catchment area, Czech Republic. Geomorphology 2016, 254, 73–87. [Google Scholar] [CrossRef]
- James, L.A. Legacy sediment: Definitions and processes of episodically produced anthropogenic sediment. Anthropocene 2013, 2, 16–26. [Google Scholar] [CrossRef]
Disclaimer/Publisher’s Note: The statements, opinions and data contained in all publications are solely those of the individual author(s) and contributor(s) and not of MDPI and/or the editor(s). MDPI and/or the editor(s) disclaim responsibility for any injury to people or property resulting from any ideas, methods, instructions or products referred to in the content. |
© 2024 by the authors. Licensee MDPI, Basel, Switzerland. This article is an open access article distributed under the terms and conditions of the Creative Commons Attribution (CC BY) license (https://creativecommons.org/licenses/by/4.0/).