1. Introduction
Sediment transport refers to the movement of solid particles suspended in moving water. Sediment transport in a catchment basin is affected by several factors such as the rainfall, slope, soil type, and landscape management activities including agriculture, construction, industry, and wasteland management [
1,
2]. In particular, fine sediment, such as suspended sediment (SS), plays a crucial role in the hydrological, ecological, and geomorphological functioning of the river system and is, therefore, essential in a river ecosystem. In addition, the long-term deposition of sediments along a river network or at a river basin may have a significant effect on the marine ecosystem [
3,
4,
5,
6,
7,
8], and this necessitates an understanding of the sedimentation process in a river basin in order to implement efficient management strategies to effectively mitigate soil erosion and reduce sediment delivery to the rivers [
9].
For example, sedimentation in alluvial rivers may occur due to an excessive release of SS through dams, which may lead to siltation in the dams if there are no other dams. Excessive water inflow due to large storms may be associated with high SS concentrations, which may be deposited during low inflows due to decreased water energy levels. Similarly, an excessive input of SS to rivers due to levee and dike erosion may also cause sedimentation in river channels. As a result, stream habitats may be affected. Navigation and channel morphology may also be affected, thereby influencing the catchment flood risk [
10].
Fine sediment (SS) in a river system may also affect the water quality at the downstream end of the river basin. SS may act as an ecological stressor since it may contain detrimental substances such as agricultural inputs, heavy metals, and pesticides [
11]. This is because SS can absorb contaminants and pollutants including heavy metals and nutrients, which can then be transported in the water along a river network to the downstream end [
12]. Deposition of these pollutants at the river’s downstream end may negatively affect aquatic and human life. It is, therefore, important to gain a thorough understanding of the dynamics of sediment transport in a watershed in order to ensure the proper functioning of river systems.
Nutrients, organic contaminants, and heavy metals generated from various sources (e.g., industrial and densely populated urban areas) can be attached to, and transported along with, fine sediment particles [
11]. Some of these contaminants, e.g., pesticides, metals, and polycyclic aromatic hydrocarbons, are readily adsorbed by sediment and resist degradation [
13]. Fine soil sedimentation may also affect hydraulic systems and environmental engineering projects such as dams, hydropower plants, canals, irrigation networks, wastewater treatment plants, and water intakes, thereby necessitating sediment management measures for the trouble-free operation of the facilities. Sedimentation may cause additional problems, e.g., reduced channel conveyance, decreased reservoir storage, and blockage of power generation facilities such as turbine inlets. Sediments can also have adverse biological effects on people and habitats for fish and wildlife [
14]. High sediment levels can cover spawning gravels, impair fish feeding and respiration, diminish food sources, and decrease dissolved oxygen levels [
15]. Fine sediment also absorbs the heat from sunlight, and high concentrations may cause the water temperature to rise, leading to a decrease in the survival rate of fish adults and embryos [
16]. Areas that are impervious due to sedimentation inhibit groundwater recharge, which results in low summer base flows in rivers [
17]. The clogging of streambed interstices by fine sediment may also reduce the flushing of dissolved oxygen concentrations, thereby reducing the microhabitats for aquatic animals [
18].
The estimation and forecasting of the sediment load during the lifecycle of a project is thus a key design parameter in water resource planning and management [
19]. Information about sedimentation is crucial with regard to flood risk management. Even though sediment can be transported as bedload sediment or in suspension, it has been demonstrated that most of this sediment is transported as suspended sediment to the river basin [
20]. The river morphology may be altered during sediment transportation, thus influencing the maximum river discharge. Several numerical models have been applied to clarify the complexity of flows, sediment transport, and the corresponding morphological changes in rivers and floodplains, but the methods for accurately determining suspended sediment sources in large basin scales are poorly understood.
Collins and Walling [
21] used various analytical techniques to discriminate the sources of SS in a catchment basin based on the levels of pyrophosphate-dithionite; oxalate-extractable, acid-extractable metals; base cations; organic constituents; and environmental radionuclides [
21], but due to the extreme variability of mineral magnetic properties in some catchments, the sediment sources could not be accurately identified. It was also difficult to identify the best combination of the fingerprinting properties of the suspended sediments.
Ishida et al. [
22] performed a chemical composition analysis to identify the source of sediment transport, but this method could not accurately determine the sources of SS in a catchment basin because a linear regression method was used, which cannot account for the nonlinear effect on sedimentation. Beitia et al. [
23] also estimated the export rate of sediment in a river catchment basin by conducting an X-ray fluorescence analysis combined with a neural network analysis (NNA), but the sampling locations in that study were not uniformly distributed in the application of the NNA for the estimation of sedimentation, and this could have negatively affected the results obtained. It is, therefore, necessary to identify a method that will identify sediment sources based on several diagnostic sediment properties. An NNA is one of the methods that can have a nonlinear effect on the process and can also handle a large amount of data. This unique advantage of NNAs is a key factor in the selection of the most appropriate method, and we thus deemed an NNA the most suitable data analytical method for our present study.
The chemical composition of SS as revealed by atomic absorption spectrometry has been applied to investigations of the source(s) of SS [
24]. Based on the results of that analysis, it was concluded that sediment generation was influenced mainly by human activities, and the study demonstrated the high possibility and applicability of chemical composition information for clarifying SS sources. We thus used an NNA in our present study to identify the fine sediment sources in Japan’s Oromushi River Catchment Basin based on the characteristics and the nature of sediment accumulation at the downstream end of the river. In general, NNAs are powerful analytical tools that have been used extensively in various fields to analyze data.
We examined the Oromushi River basin in Japan’s Hokkaido prefecture. This location was selected for the present case study because the Oromushi River is characterized by high fine sediment concentration and is thus prone to the adverse effects of sedimentation. We obtained samples from different locations of the catchment basin, identified the geochemical components in the samples by either the press or glass-bead method, and analyzed the results by X-ray fluorescence (XRF) and X-ray diffraction (XRD). We used a simple NNA with a single-layer network to identify the primary sources of SS in the catchment basin when both XRF and XRD analyses were used.
2. Materials and Methods
2.1. Study Area
The Oromushi river catchment basin is located in Hokkaido prefecture, at the end of the northernmost region of Japan. This catchment basin covers an area of 29.3 km
2 and its downstream end is located at 43°43′ N and 143°47′ E. The Oromushi River, a branch of the Tokoro River flows through this catchment. The Oromushi River has a total length of 9.7 km and a mean slope gradient of 1/43. This river is characterized by high SS concentrations (>10,000 mg L
−1) during flood events, and a mean runoff concentration time of ~1.5 h [
23]. The Oromushi River Catchment Basin is mainly forested, with a few agricultural fields. Forest cover accounts for ~80.7% of the basin, and agricultural fields account for ~15.8% of the catchment basin area.
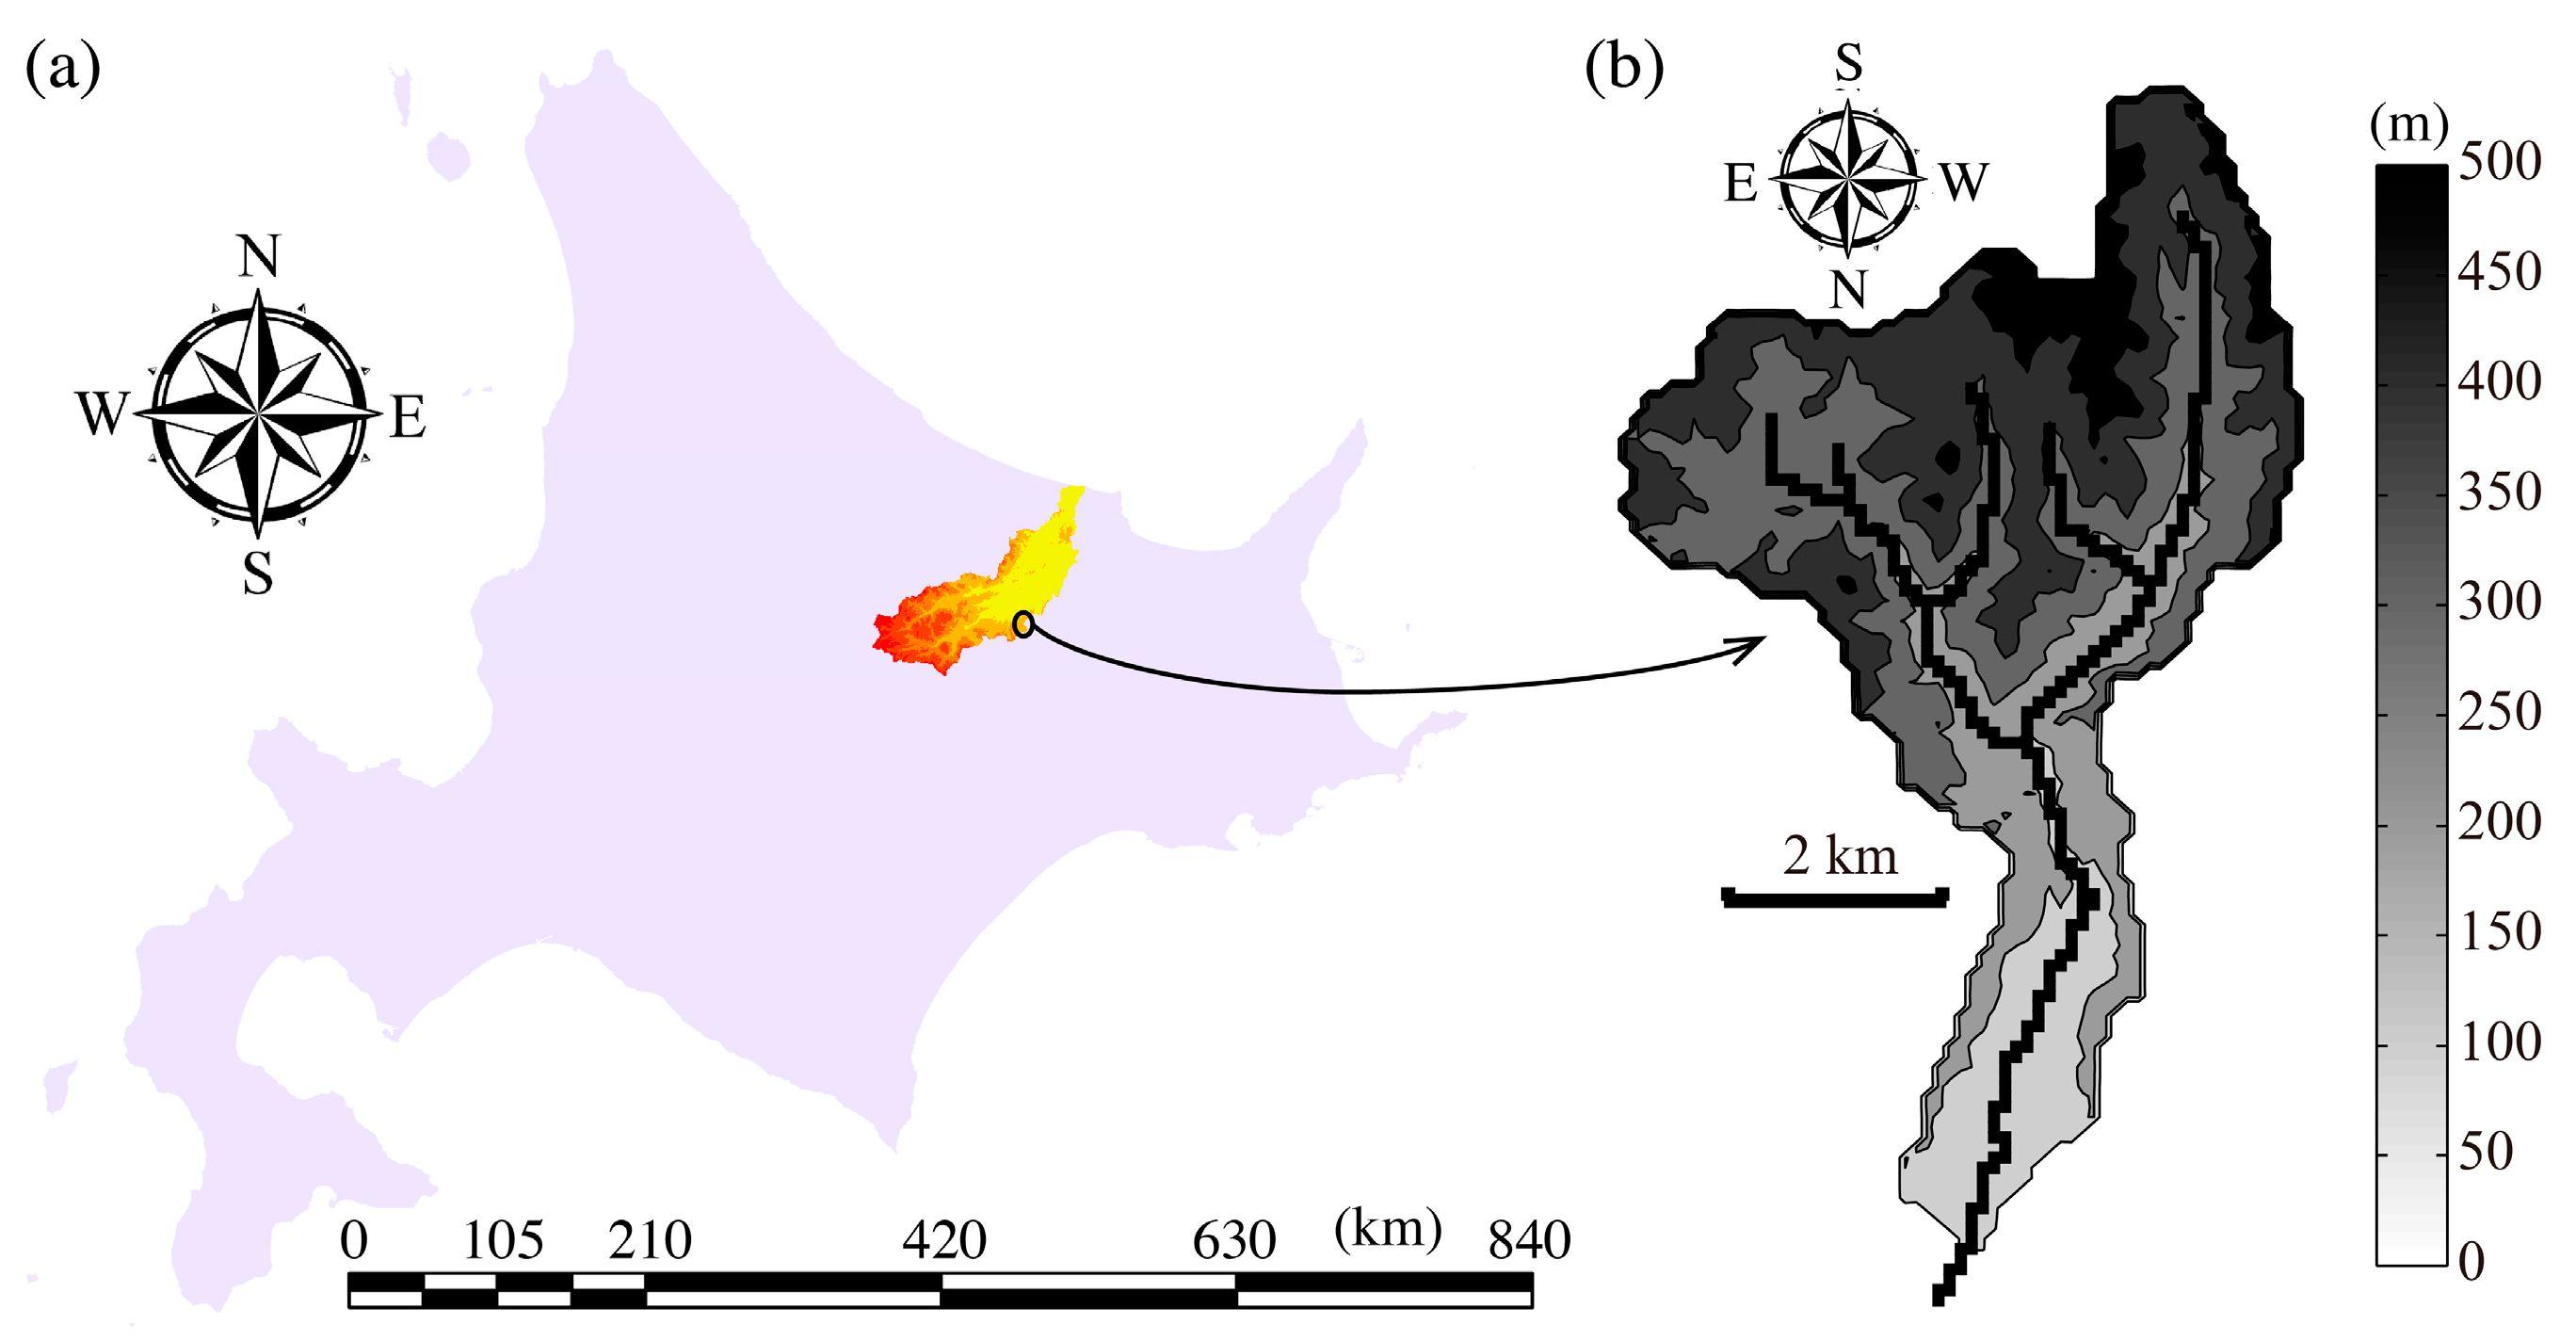
Figure 1 shows the geographical location and the characteristics of our study site.
2.2. Data Collection
The study data were collected as described [
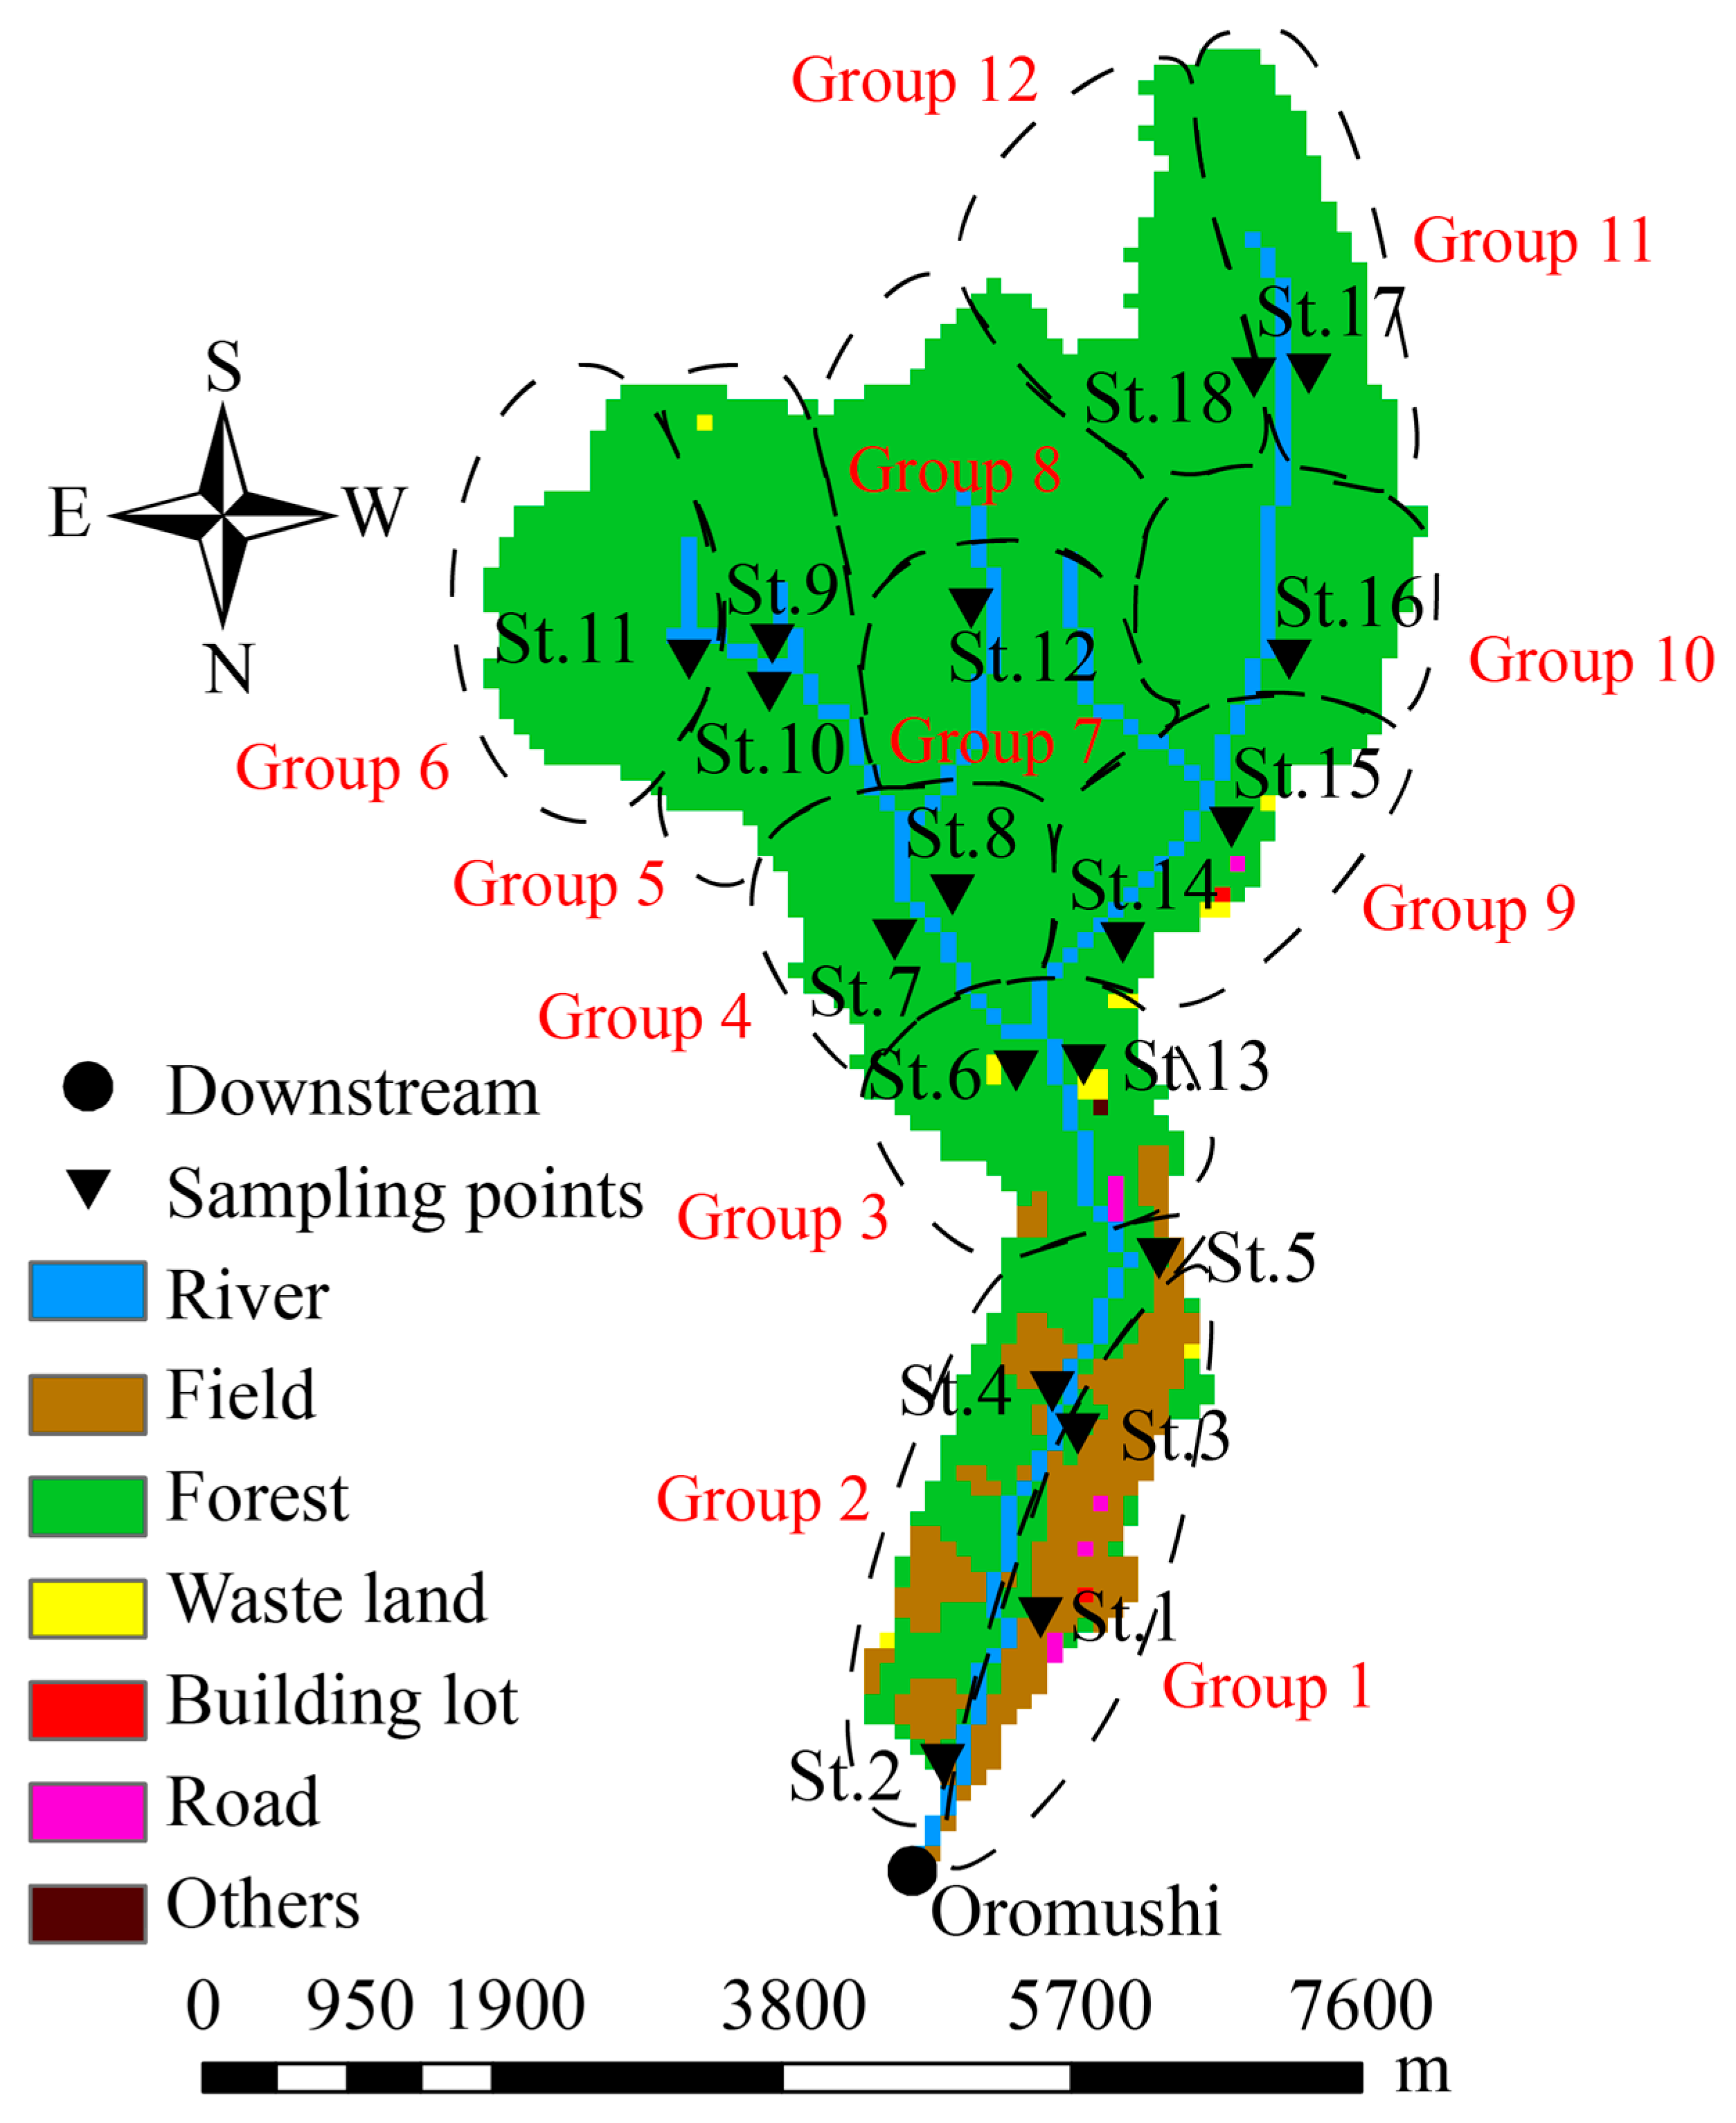
22]. The Oromushi River basin was divided into 12 land groups with 18 sampling stations (
Figure 2). The groups were defined using factors in geographical information systems (GIS) such as land use, surface soil type, and vegetation type. At least one sampling station was located within each group’s boundaries except for Groups 7 and 8, which were both served by Station 12. Three representative soil samples of approx. 15 cm × 15 cm × 5 cm (horizontal square area × depth) were taken from the surface layer of selected locations within each of the sampling stations, and one ~4500 cm
3 sample was taken at the bottom of the channel at the downstream end of the river. Special care was taken (by thoroughly cleaning sampling tools and using double-sealed and labeled plastic bags for storage and transportation) in order to avoid contamination of the samples at each sampling site. The samples collected from the same group were well mixed to represent the spatial heterogeneity of the soil.
Figure 2 shows the different types of land use, sampling locations (stations), and the groups in the Oromushi River Catchment basin.
2.3. The X-Ray Fluorescence Analysis
XRF provides a quantitative analysis of the total elemental composition of samples, regardless of their crystalline structure. We used a laser scattering particle distribution analyzer (model LA-950, Horiba, Fukuoka, Japan) to investigate the particle size distribution in the Oromushi river catchment basin. Therefore, we performed a geochemical composition analysis for the particle size range 0.1 μm to 2 mm since the largest particles in the Oromushi river catchment basin were found to be <2 mm. Particles with a diameter <63 μm were wet-sieved with water, and the soil was dried at 110 °C for 24 h. The dried soil was ground using an alumina mortar and pressed to make a circular-shaped sample with a 3-cm dia. and 1-mm thickness.
A medal-type sample was used to measure geochemical decomposition by an XRF analyzer (Supermini model, Rigaku, Tokyo, Japan). A fused glass bead of the sample was used in the XRF analysis to confirm whether the geochemical decomposition was consistent with and without the glass bead method. We then grouped the stations according to the type of soil cover, vegetation type, and land-use pattern, and we used the geochemical decomposition to estimate the total amount of suspended sediment that each group contributed to the downstream side of the Oromushi River Catchment basin by conducting an NNA.
An NNA is a data analytical method that uses interconnected nodes or neurons in a layered structure to effectively process large amounts of data. Our NNA model was comprised of the input layer, middle (hidden) layer, and the output layer that generated the required output data (suspended sediment contribution of each group to the downstream end of the river). An NNA usually consists of a multi-layer network, but we applied a single-layer network because it enabled us to determine the suspended sediment contribution from each station to the downstream end.
2.4. The X-Ray Diffraction Analysis
Unlike XRF, which quantifies elemental compositions, XRD provides a qualitative analysis by identifying the crystalline phases in the samples, thus clarifying the mineralogical composition. In this study, the samples that were collected from the 18 sampling stations were wet-sieved, dried, and crushed to obtain very fine particles (approx. 5–10 μm) with a limited size range, as in the XRF analysis described above. The fine particles were then combusted at 750 °C to oxidize the compounds present. The oxidized samples from the 18 stations were then mounted into the sample holder of the X-ray diffractometer with an X-ray tube (40 kv/20 mA). The resultant intensities were continuously recorded as the samples and the detectors were rotated through their respective angles. The data were collected from 3–80° with a stepwise increase of 0.02.
The X-ray intensity was plotted against 2-theta degrees, and a diffraction pattern for each station was displayed. The position of the diffraction peaks represented the specific crystalline phases. Since multiple diffraction peaks were obtained for each station, we selected only high peak intensities for additional analysis. In addition, since the peak intensities for each station were located at different d-spacings, only the stations’ peak intensities that frequently occurred in the same d-spacing were considered for further analysis. In this study, we disregarded the intensity values in the d-spacing whose frequency was <5. We then categorized the stations into 12 groups based on the type of surface soil cover, vegetation type and land-use pattern. For each group, we used the average value for the stations’ peak intensity values as the input in the NNA model and analysis, similar to the XRF analysis. We assumed that there was no interaction among any of the groups, and we thus directly connected all of the first-layer components to the second-layer components. The groups’ average spectrum data were used as the input data, and the downstream spectrum data were used as the output data.
2.5. Estimation of Suspended Sediment Sources Using a Neural Network Analysis
Neural networks can rapidly perform numerical calculations by “learning” from existing data and efficiently solving complex signal-processing problems. These networks were thus ideal for determining the major sources of SS in the Oromushi River Catchment basin [
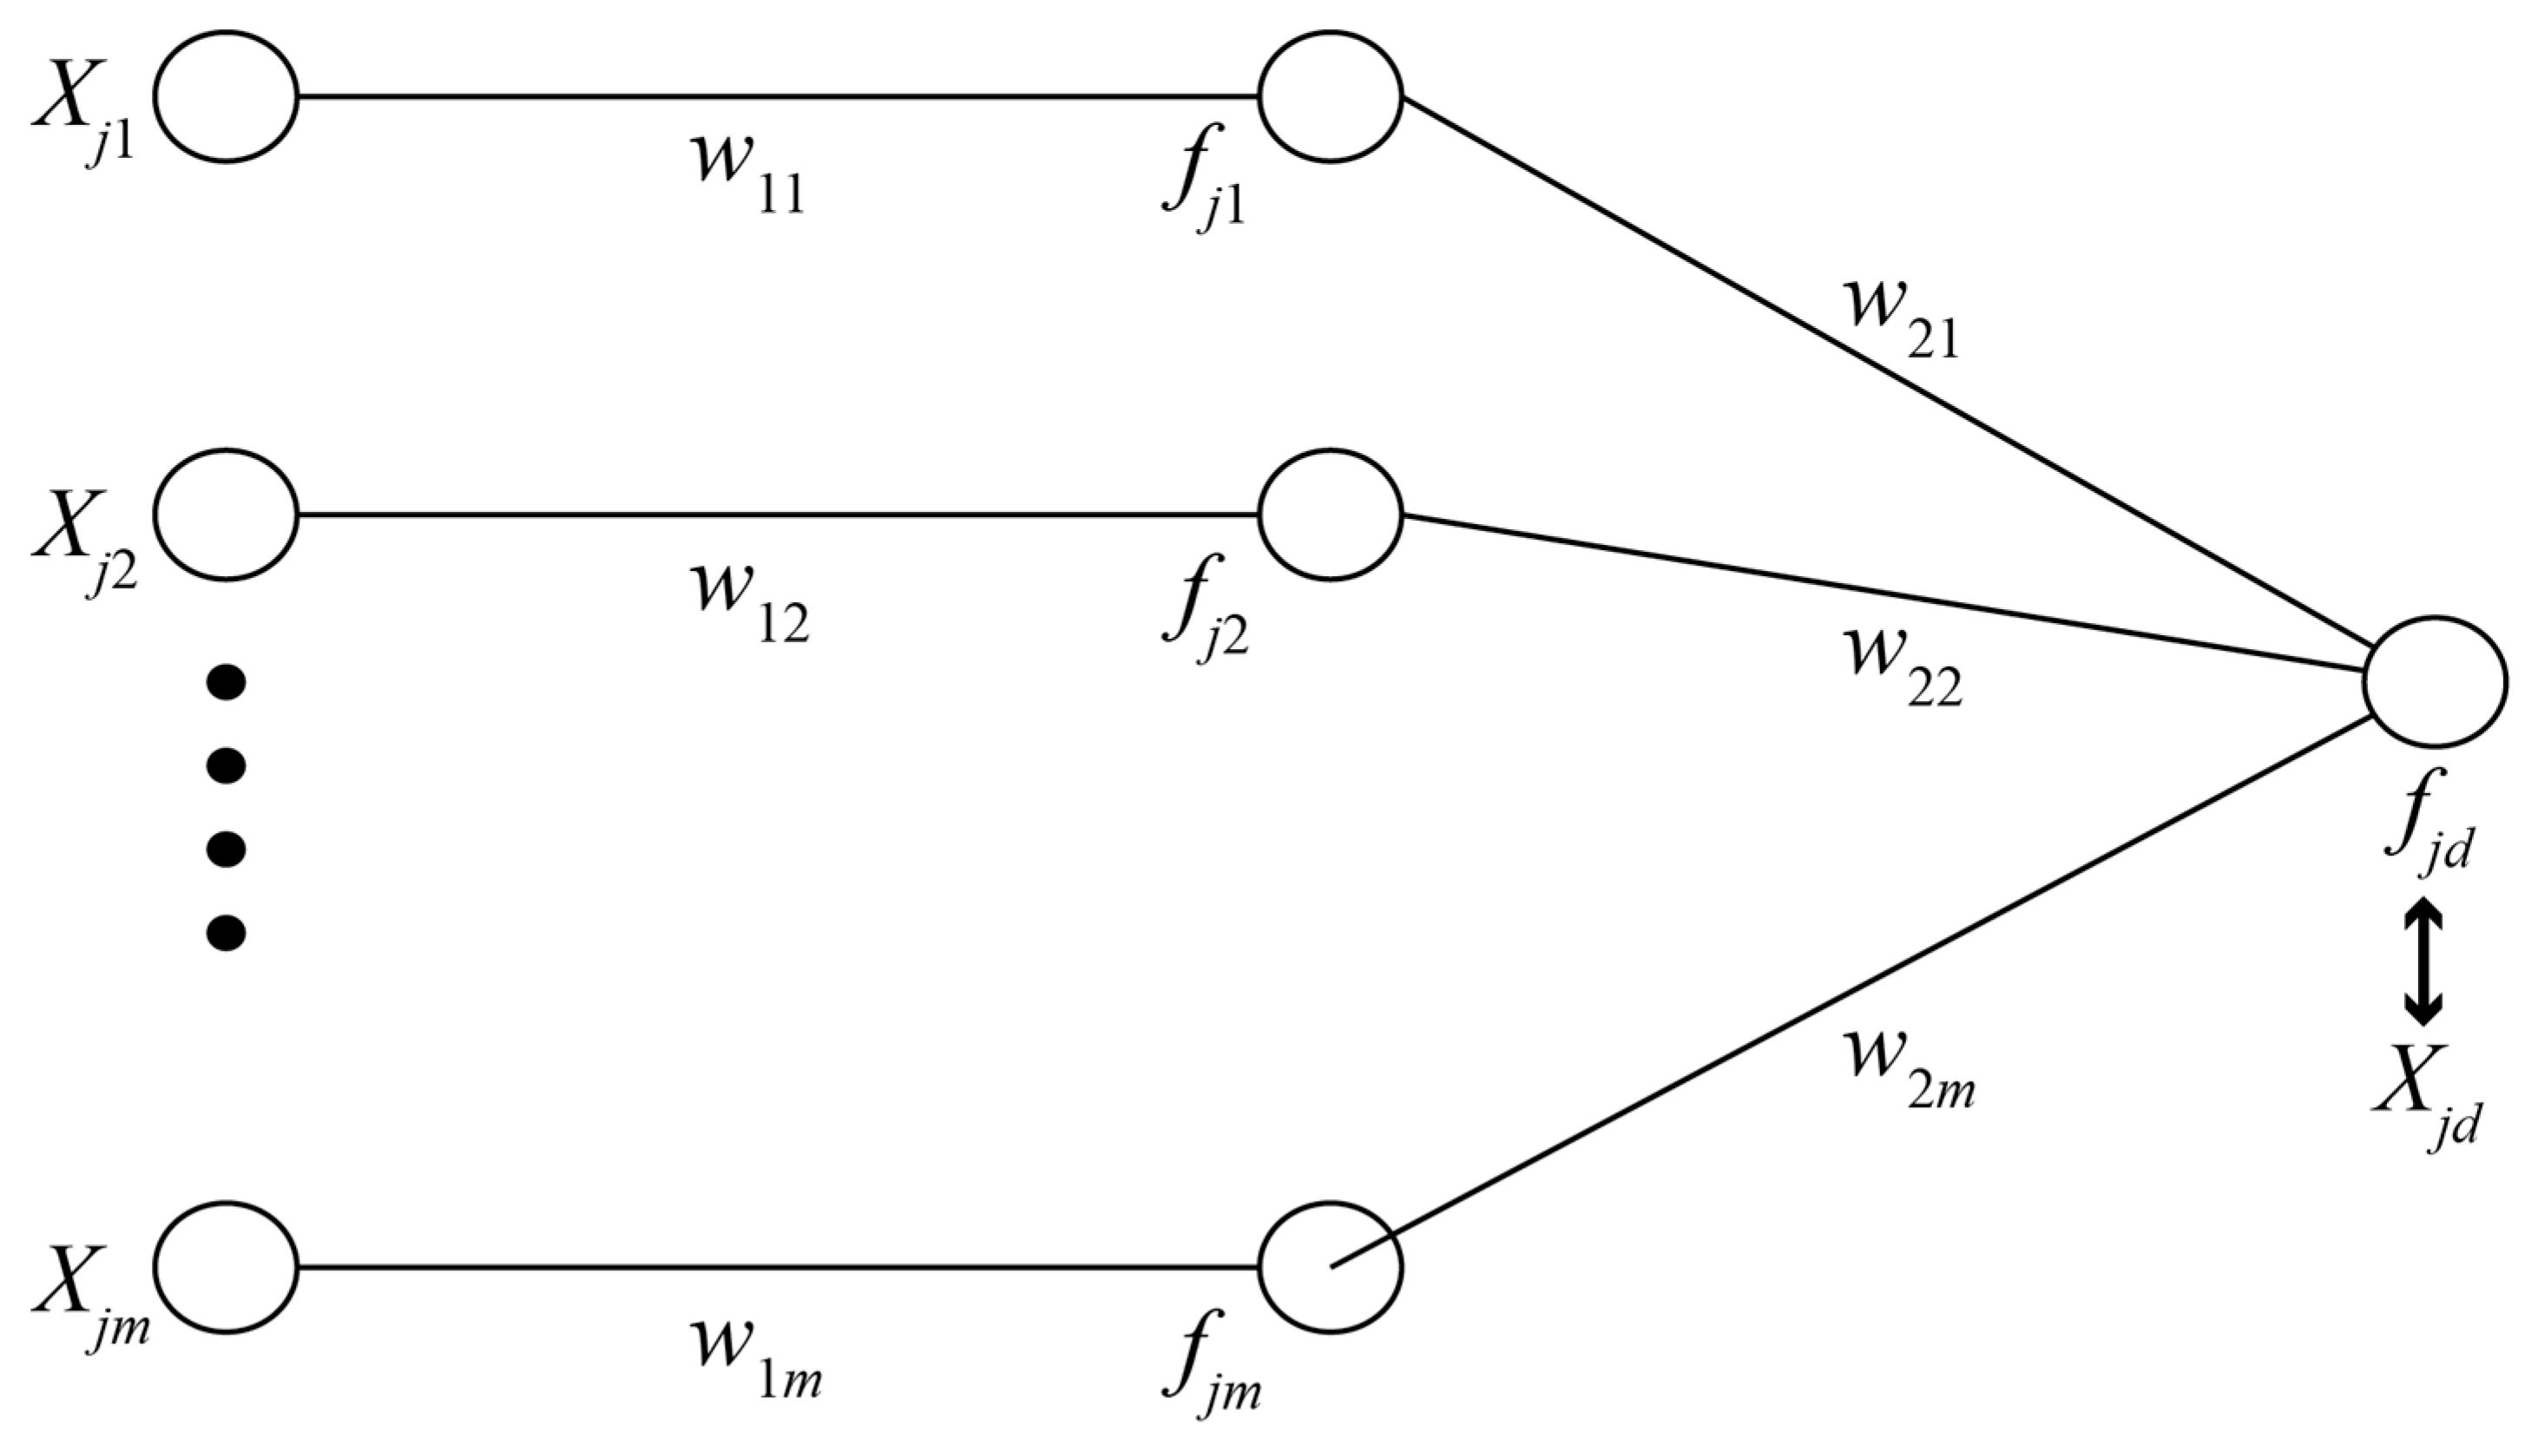
23]. A simplified NNA model that consisted of only three layers, i.e., the input layer, the middle (hidden) layer, and the output layer, was used in this study (
Figure 3). The output layer consisted of only one neuron. We also assumed that the groups in our model were independent, therefore, all of the first-layer components were directly connected to the corresponding middle-layer components. Even though we used a simplified model without the complex networks, applying the sigmoid function enabled us to analyze nonlinear phenomena such as sediment transport from different soil and vegetation types [
23].
To minimize the error between the desired output and the expected output, we used a backpropagation algorithm to train the neural network. A modified sigmoid function was applied as the activation function, and the connection weights were adjusted according to the backpropagated error computed between the observed and estimated results. For example, the middle-layer components were calculated by multiplying the modified sigmoid function by the product of the respective input layer and the weight between the input layer and the middle layer. The estimated output was thus obtained as the product of the modified sigmoid function and the summation from Group 1 to Group 12 of the middle-layer components and the weights between the middle layer and the output.
During this supervised machine learning procedure, the weight was adjusted immediately when the input data were fed, and we ensured that the model was appropriately fitted by minimizing the errors between the desired and predicted outputs [
25,
26]. The series of equations used to estimate the contributions of suspended sediment from different regions of the catchment basin were as follows:
where
n is the total count of the component,
m is the total count of the group,
fji is the output for component
j (=
1 to
n) and group
i (=
1 to
m) from the middle layer,
Xji, is the input for component
j and group
i,
w1i is the weight for group
i between the input and middle layers,
fjd is the output for component
j (=
1 to
n) at the downstream,
w2i is the weight for group
i between the middle and output layers, mSig is the modified sigmoid function,
γ is the coefficient for a modified sigmoid function,
SSTi is the transportation rate from group
i to the downstream, and
η is the coefficient for a weight.
3. Results
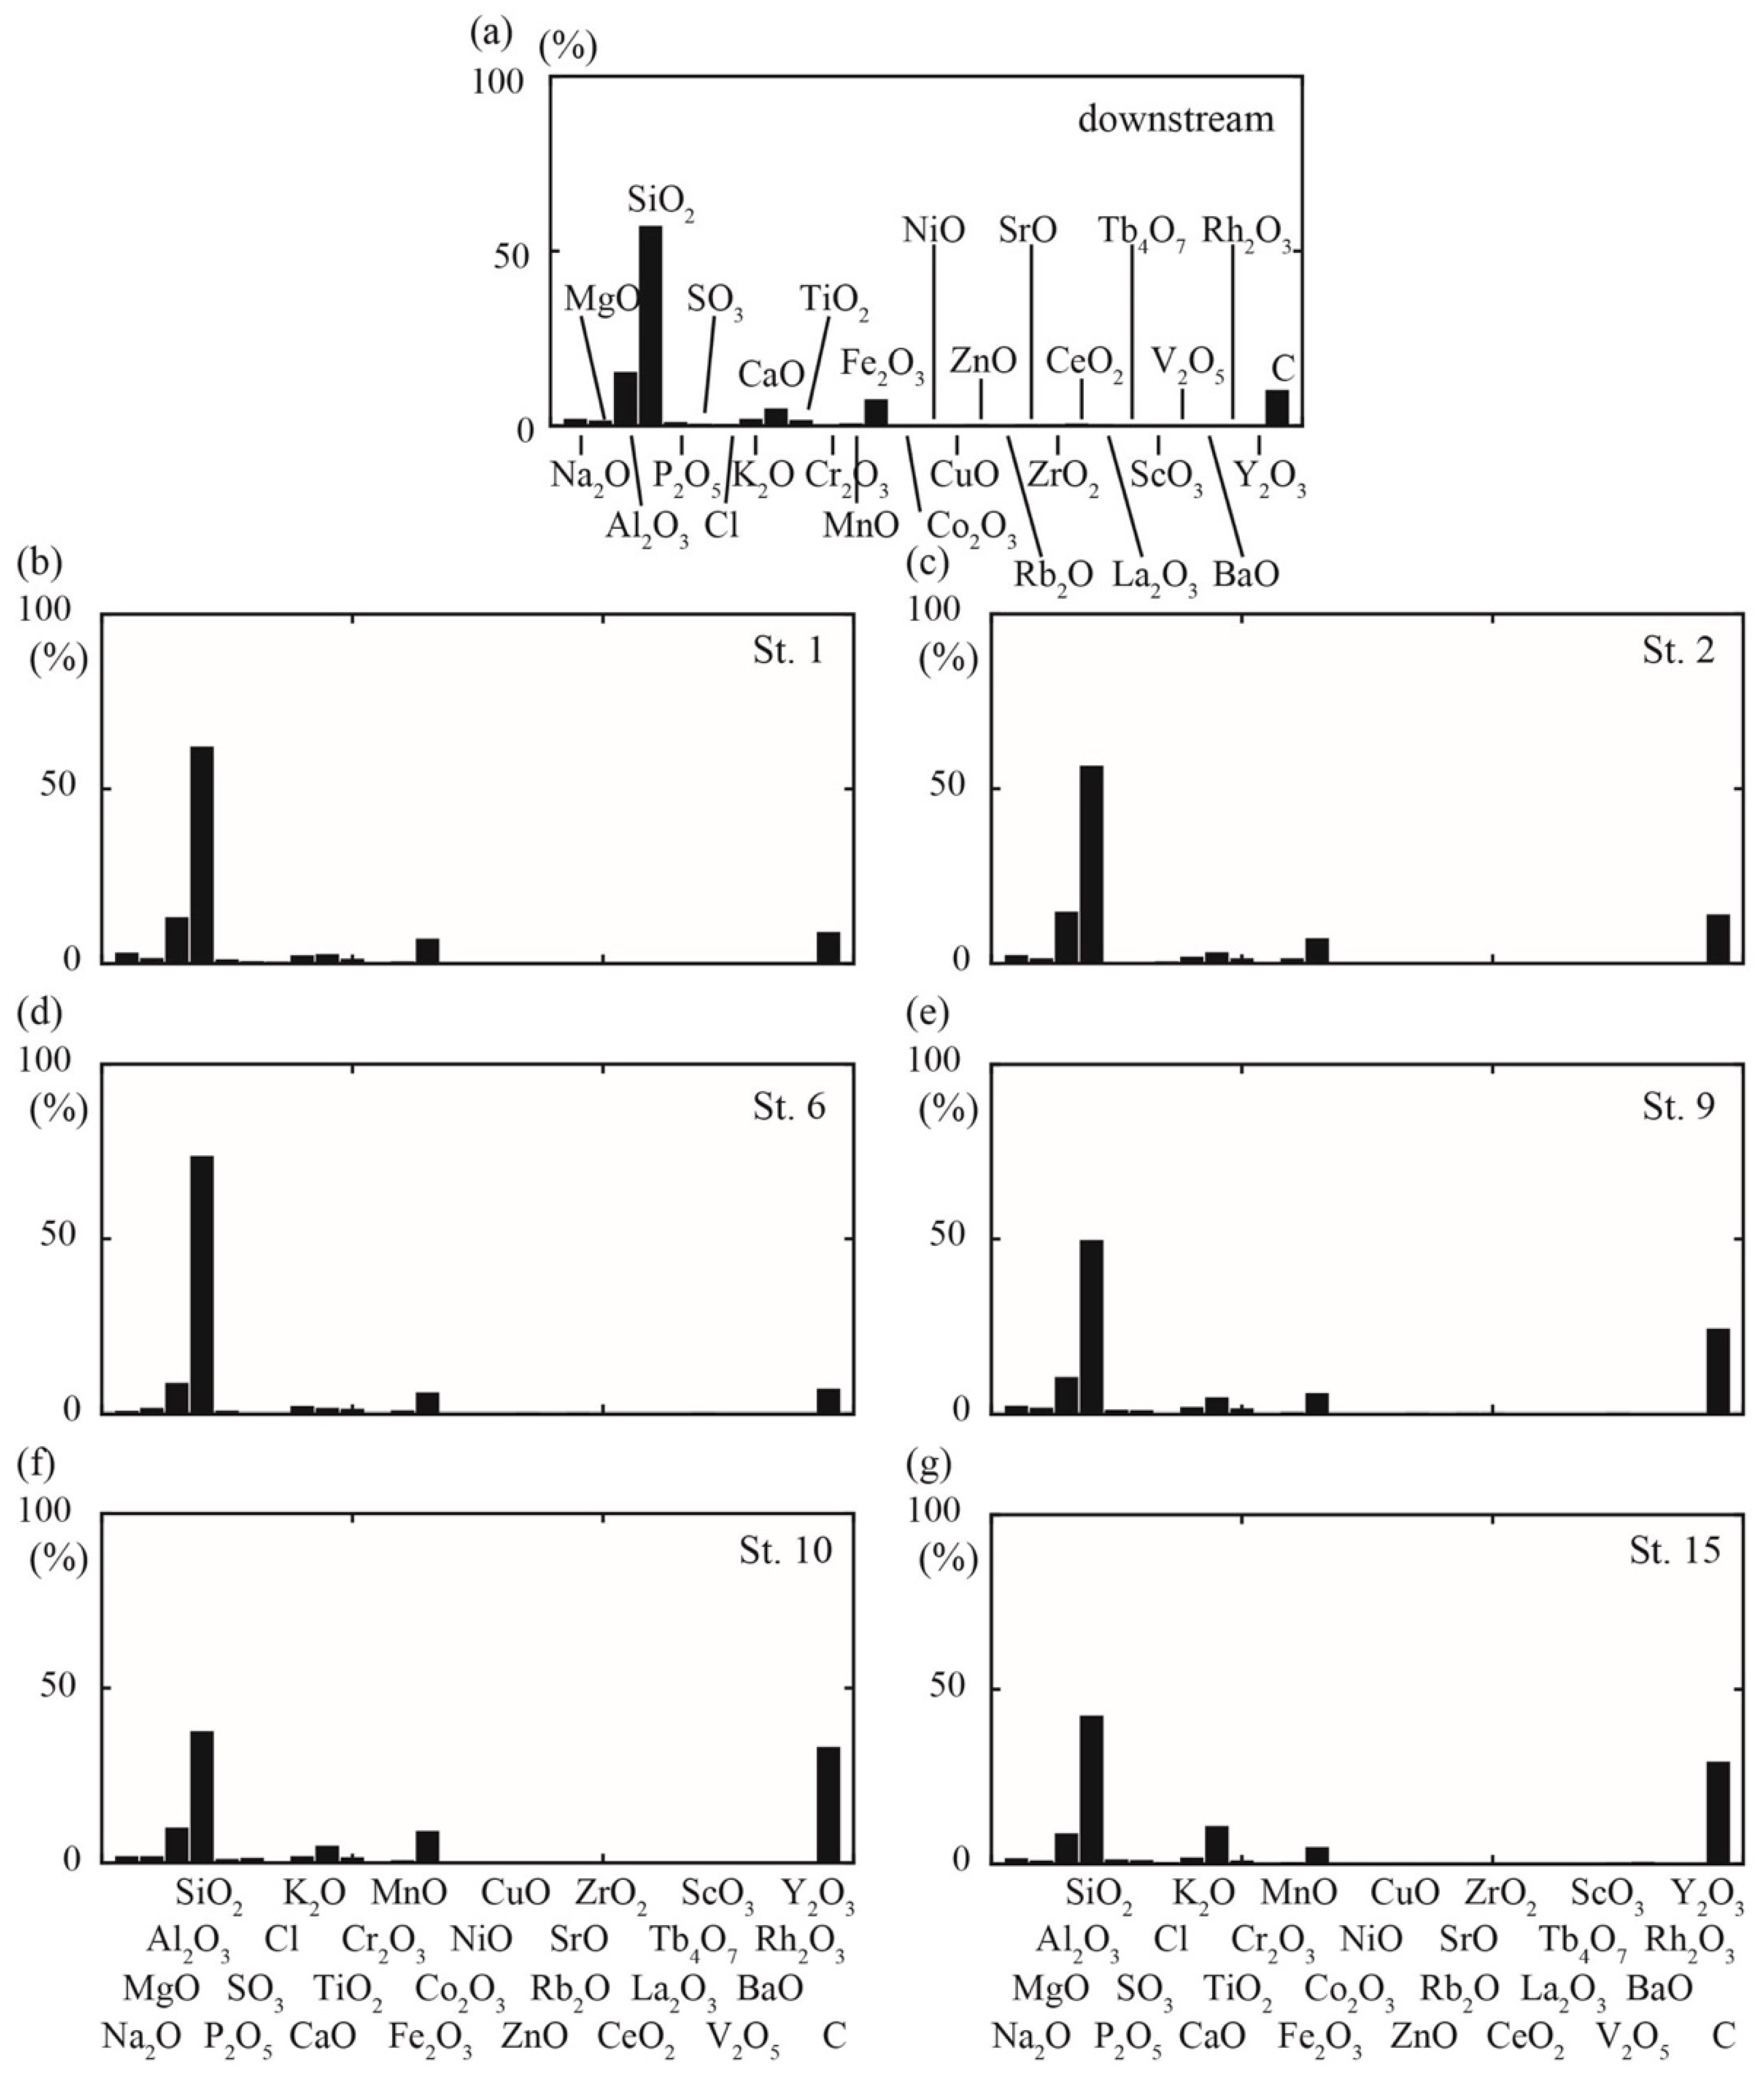
The results of the XRF analysis showed that the main geochemical component was SiO
2, which could be expected given the influence of volcanic ash in the study area (
Figure 4). Our comparisons of the SiO
2 concentrations revealed that agricultural fields (St. 1) were the most similar to the downstream end, rather than the forest regions (St. 9, St. 10, and St. 15). The carbon (C) content from ignition loss was larger in the forest region than in the agricultural fields. The difference in the standard deviation of SiO
2, Al
2O
3, CaO, and Fe
2O
3 was larger among the stations than the other geochemical components. In the NNA, geochemical components with lower concentrations were not used, meaning that the analysis focused on 15 components: Na
2O, MgO, Al
2O
3, SiO
2, P
2O
5, SO
3, Cl, K
2O, CaO, TiO
2, MnO, Fe
2O
3, ZnO, SrO, and ZrO
2. Therefore, we applied 15 geochemical components as the total component count with 12 subbasin groups into the NNA analysis. We can obtain 15 different transportation rates from each subbasin group
i to the downstream. To obtain the same transportation rates from each subbasingroup
i to the downstream within 15 different geochemical components, we iterated the NNA calculation 10,000 times to achieve the steady state for
w1i and
w2i. The output was each geochemical component downstream, which was compared to the estimated value using the NNA analysis.
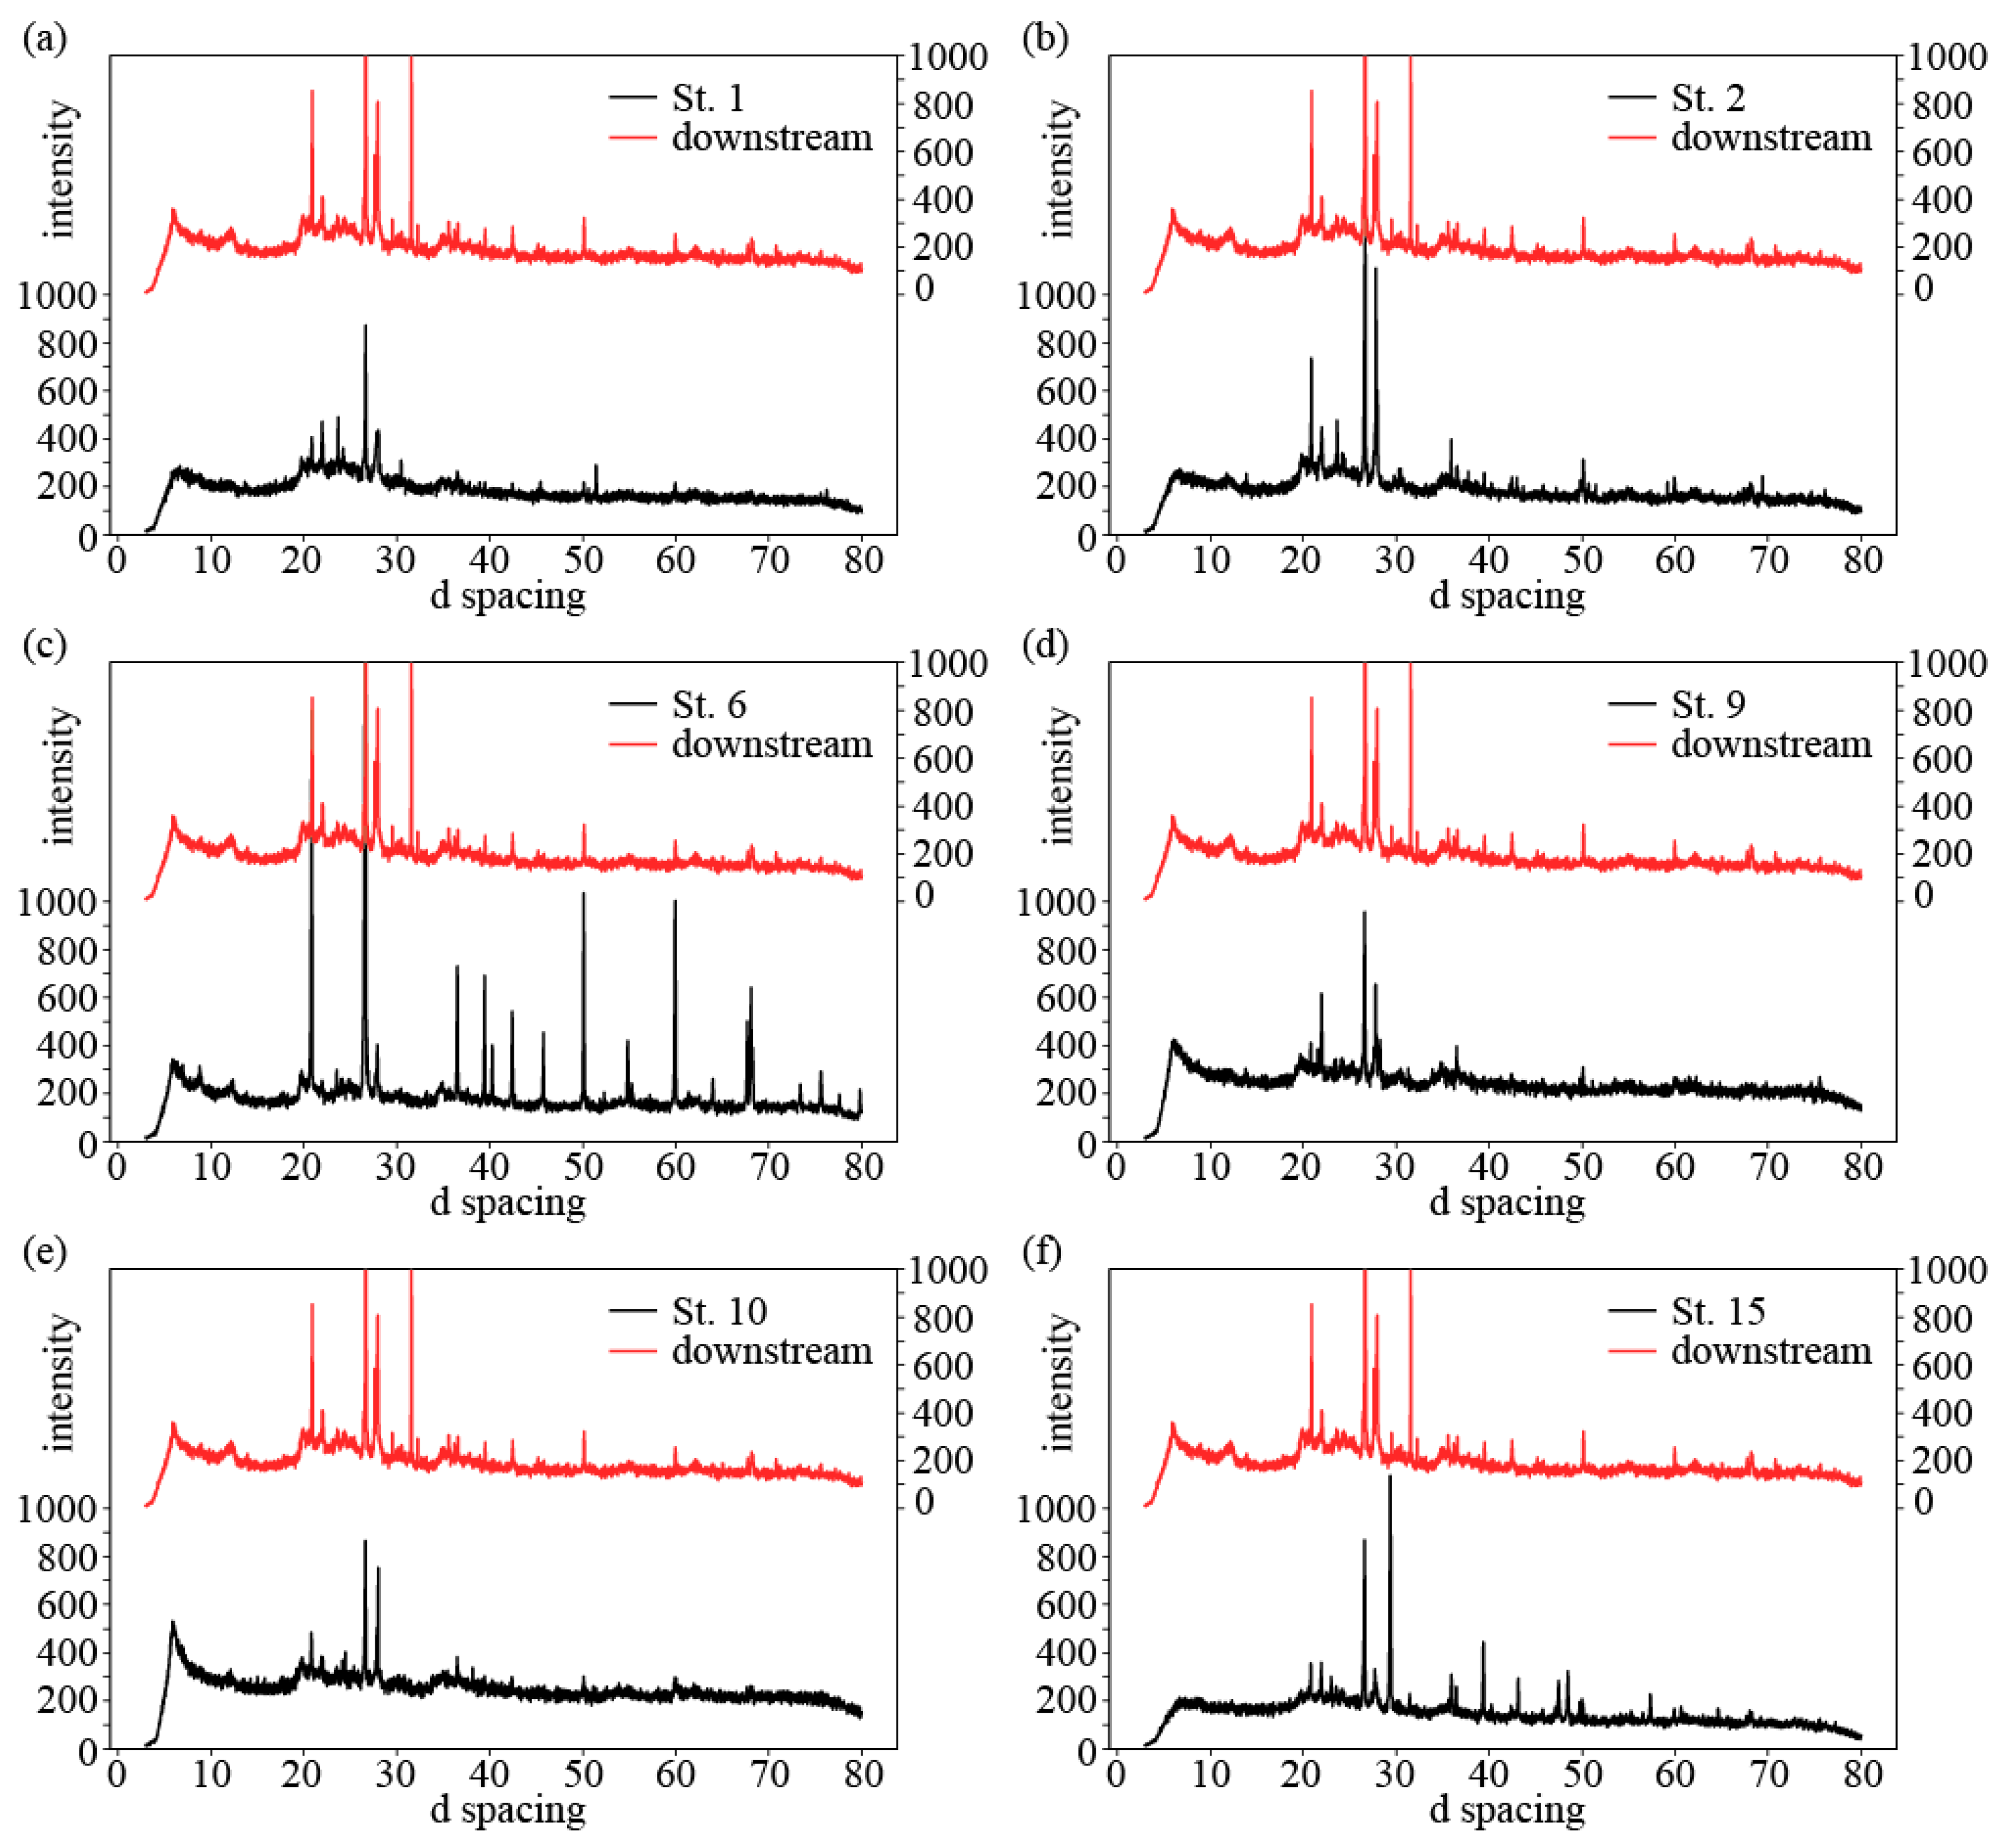
The XRD intensity peaks of some selected stations are shown in
Figure 5. The XRD spectra demonstrated that Stations 1, 2, 6, 9, 10, and 15 were much more closely correlated to the downstream side compared to the rest of the other stations. This implies that Stations 1, 2, 6, 9, 10, and 15 may have made a significant contribution of SS in the Oromushi River Catchment basin. However, very many peaks were obtained, and we thus used only the high peak intensities in each d-spacing group for the subsequent analysis.
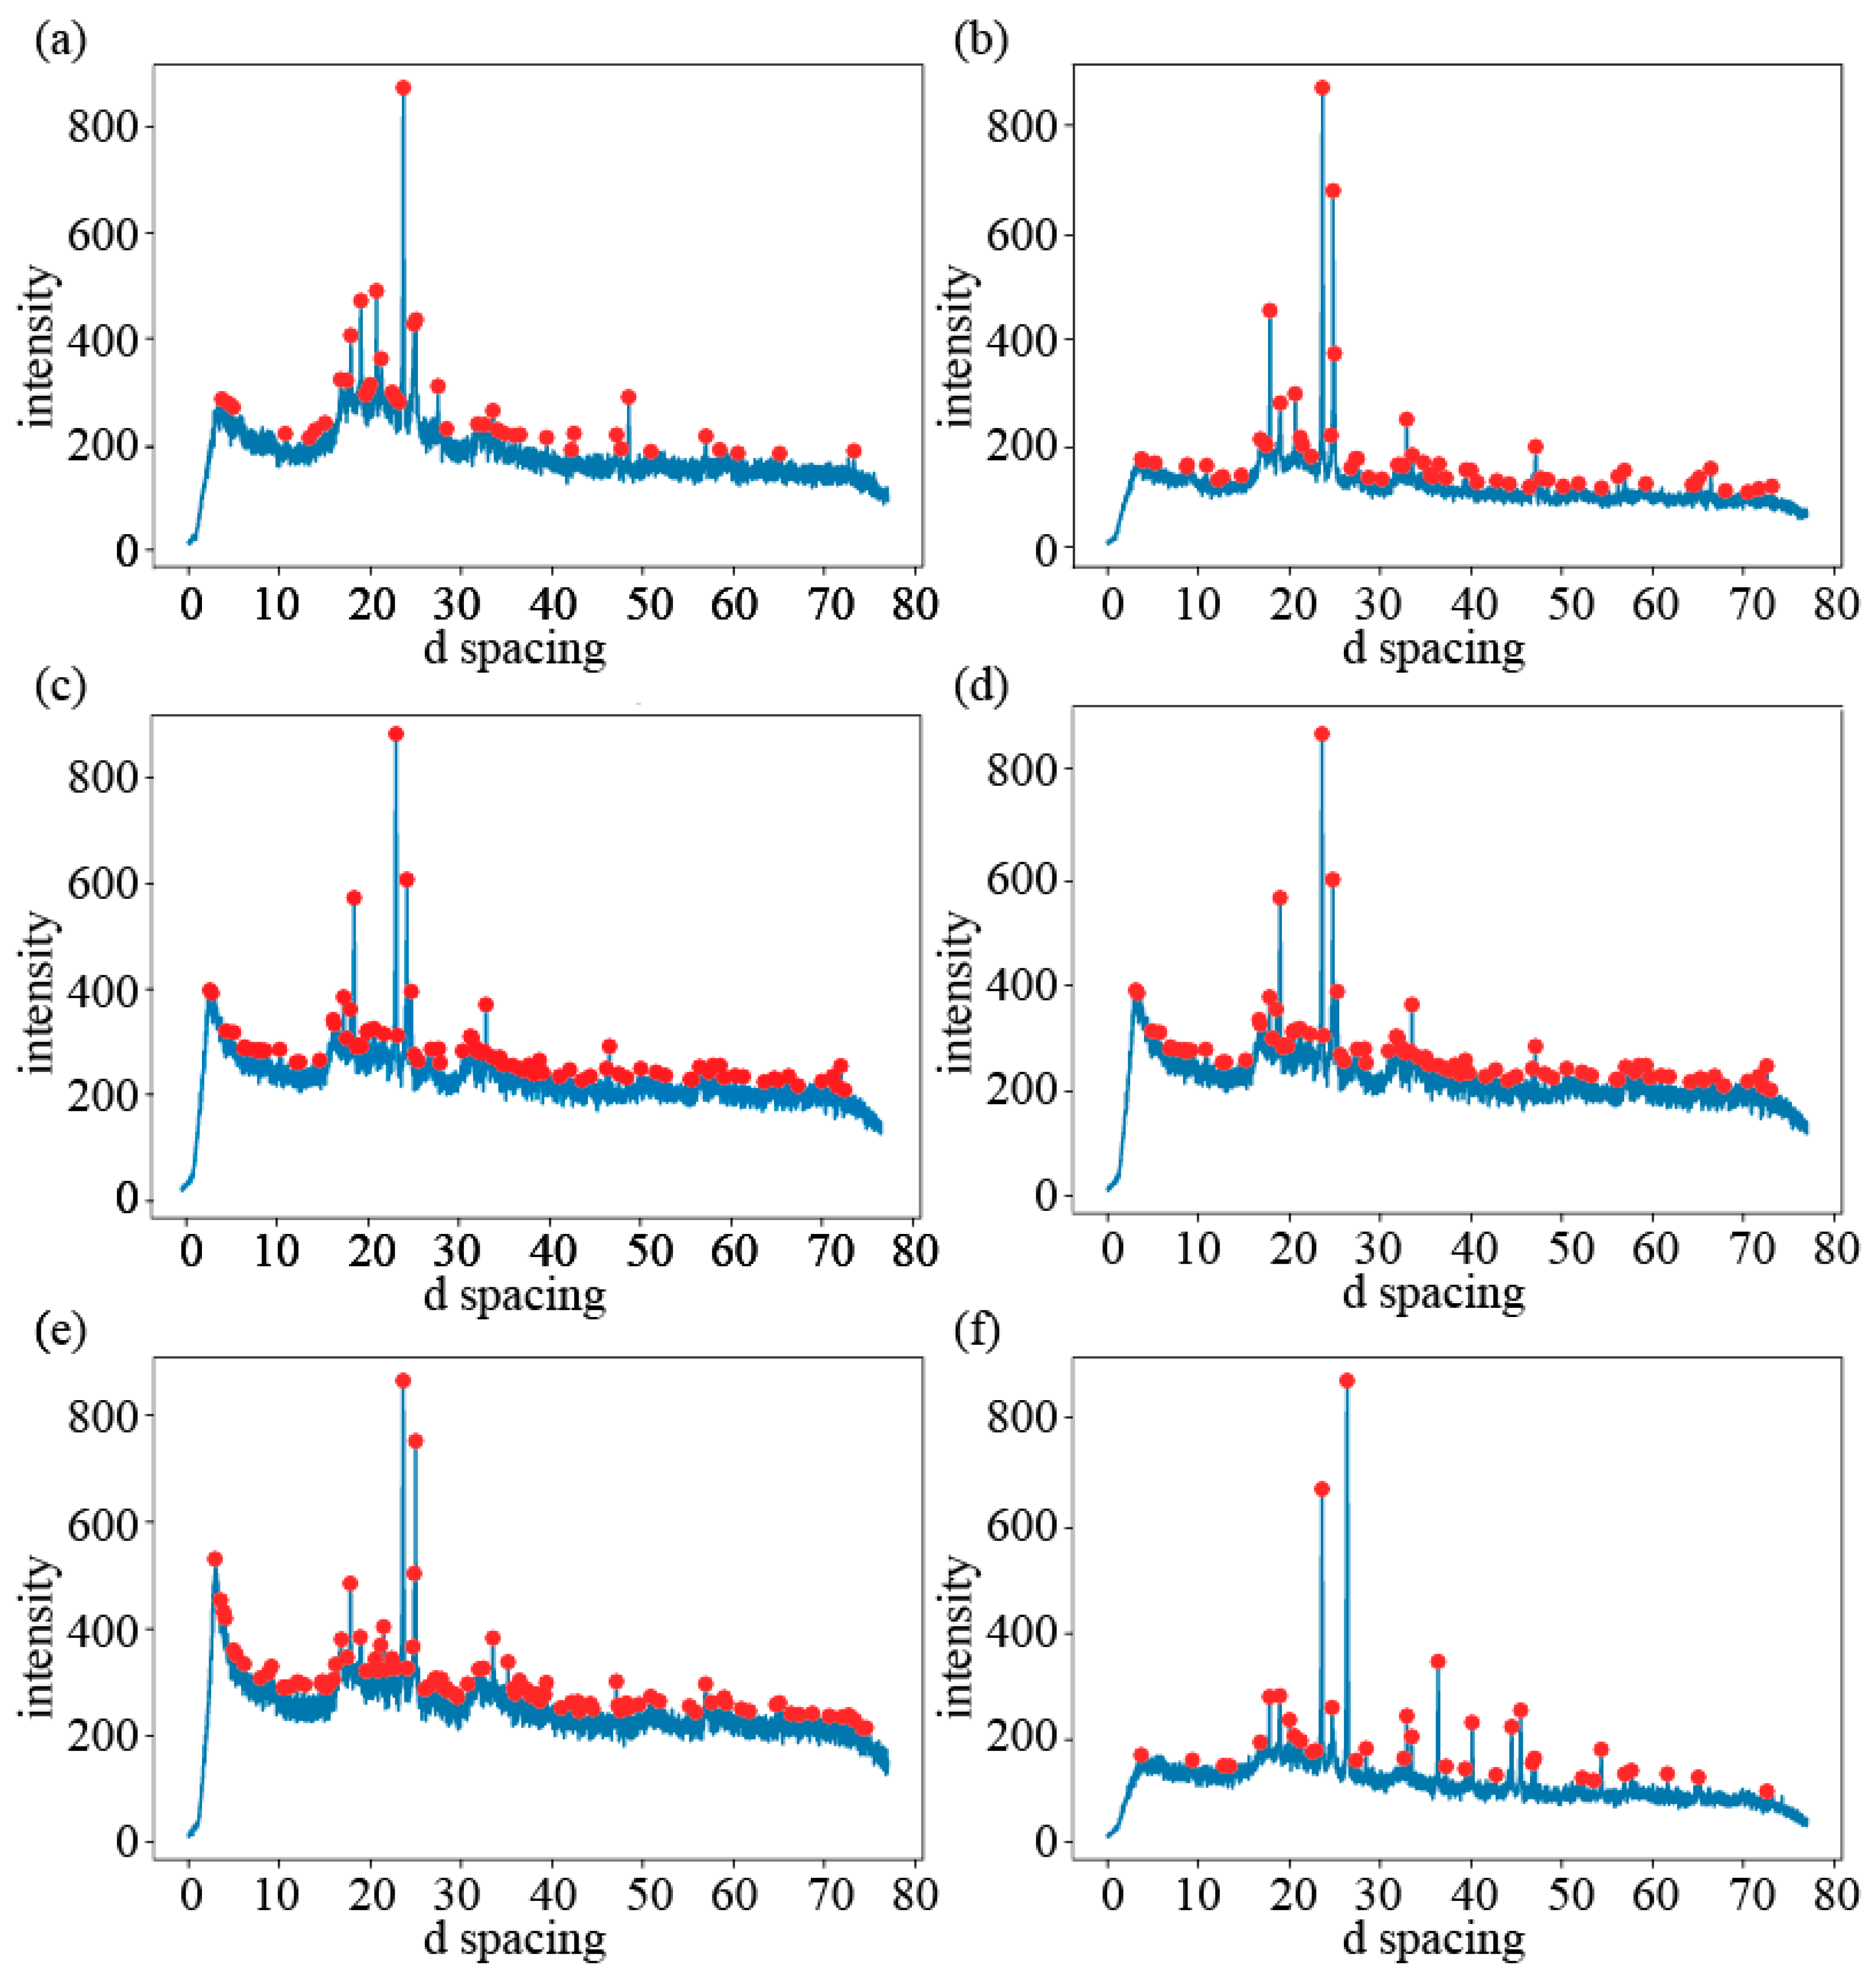
For every station, we selected high peak intensities (indicated by the red circles in
Figure 6) for the additional analysis using a simplified neural network model. The stations were categorized into groups based on the error differences between the stations. The XRD pattern for each group was used as the input into the neural network model, and the sigmoid function was used as the activation function. We also subjected samples from the same sampling stations to an XRF analysis, and the obtained geochemical components were also separately analyzed using the simplified neural network model. Finally, we selected 14 high peak intensities as the total count of the component with the total count of the group of 12 into the NNA analysis. Like the XRF, we iterated the NNA calculation 10,000 times to achieve the steady state for
w1i and
w2i and to obtain the same transportation rates from each subbasin group
i to the downstream within 14 different high peak intensities obtained from the XRD analysis. The output was each high peak intensity downstream, which was compared to the estimated value using the NNA analysis.
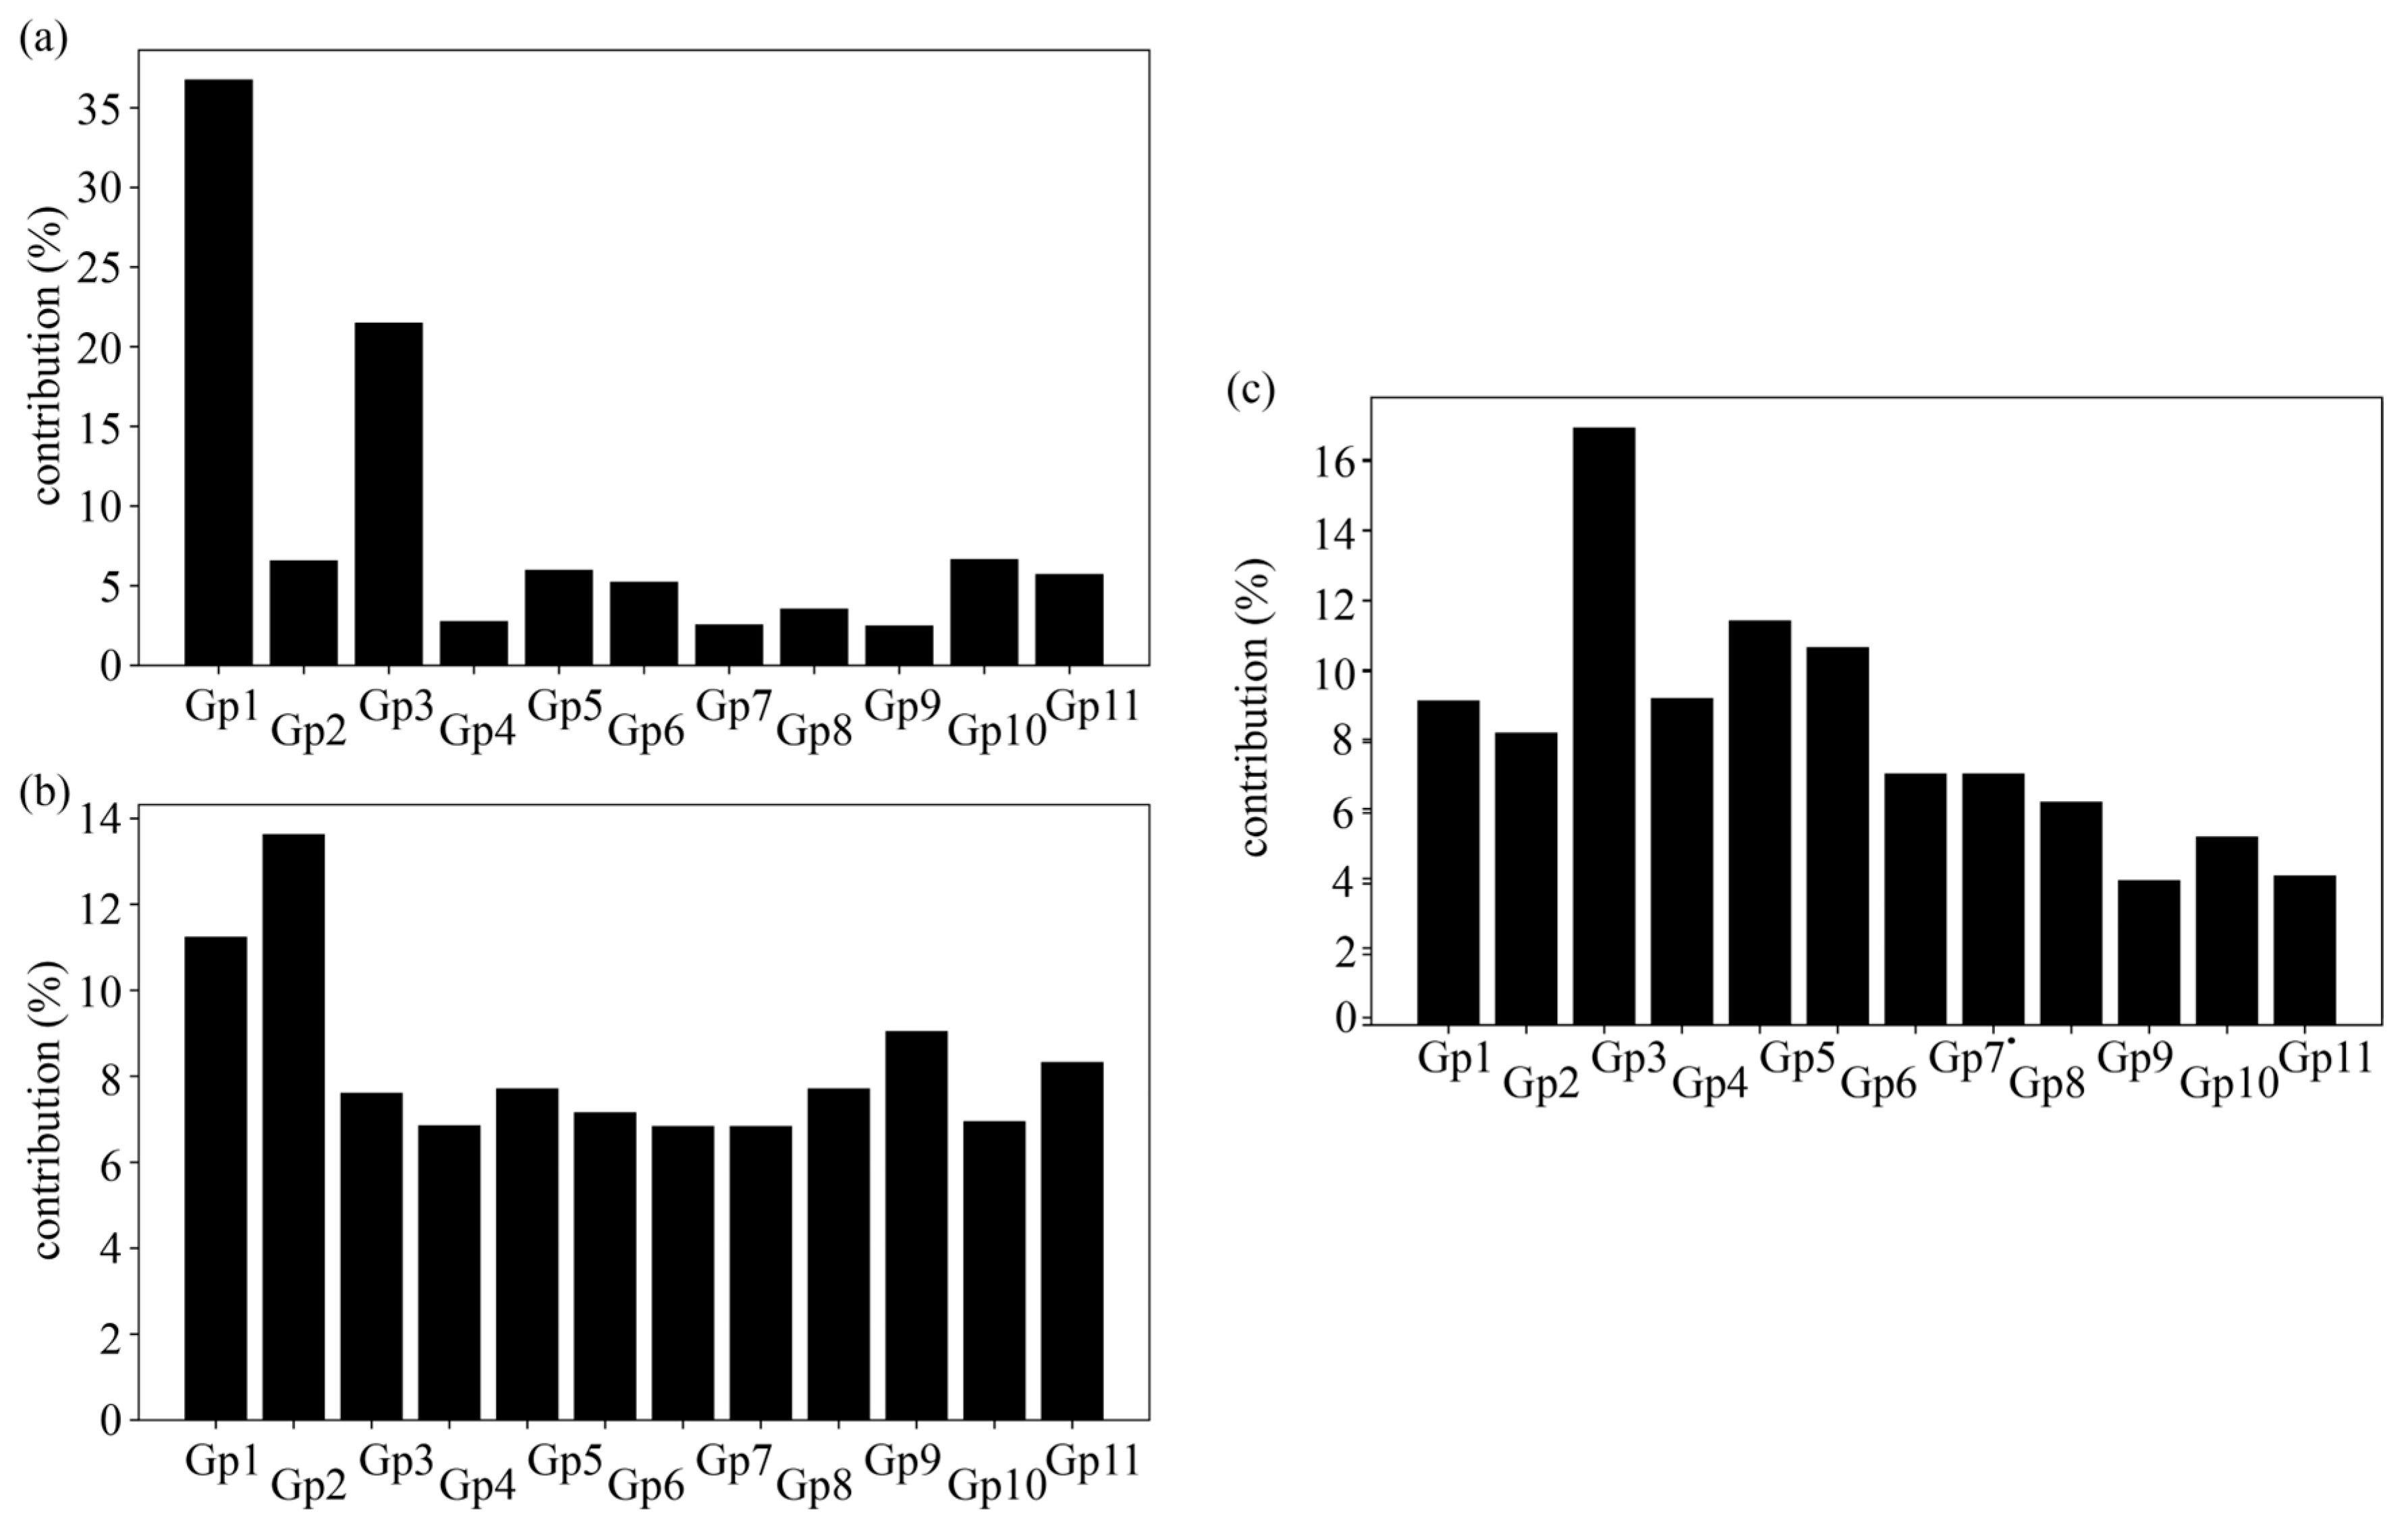
From the NNA, we obtained the percentage of SS contribution by each group to the downstream side of the Oromushi River Catchment basin using either XRF or XRD analyses as shown in
Figure 7. The XRF and the XRD analyses showed good agreement with a high correlation of the r2 of 0.94 (
p-value of 1.69 × 10
−9) and the r2 of 0.93 (
p-value of 2.63 × 10
−8). Both results based on the XRF and XRD showed a high correlation, suggesting the reliability of both results is very high. However, there are some differences between the XRF and XRD regarding the potential suspended sediment sources downstream.
The major sources of SS to the downstream end of the catchment basin as analyzed by XRF are shown in
Figure 7a. The XRF analysis indicated that Group 1 was the major contributor of SS to the downstream side of the basin, and Group 3 was the next major contributor of SS. Group 1 mainly comprises agricultural fields (
Figure 7a), which are more prone to soil erosion due to the depletion of vegetation cover, especially during the crop-sowing period. This may have significantly contributed to the sediment generation from this group.
Unlike Group 1, Group 3 was mainly forested, but the higher sediment transport from the region may be attributed to the presence of a quarry. Notably, an XRF analysis incorporates carbon, which is an unstable component of organic matter, and its composition varies depending on the season and the chemical reactions of micro-organisms. This variation in carbon composition may have affected the reliability of the obtained results. We thus eliminated the carbon content from our samples by conducting an ignition loss test. The geochemical composition of the samples (without carbon content) was determined using XRF and analyzed using the NNA. We used the same procedure as that applied above to analyze the geochemical composition of the samples using NNA.
As shown in
Figure 7b, the results indicated that Group 2 was the major source of SS in the Oromushi River Catchment basin, and Group 1 was the next major source. Group 1 is composed mainly of agricultural fields, and Group 2 is mainly forested with a few agricultural fields (
Figure 2). The soil surface type of Group 1 is lithosols and terrestrial regosols, whereas Group 2 consisted of three soil types: lithosols, terrestrial regosols, and rich volcanic soil. The rich volcanic soils in Group 2 (
Figure 7b) may thus have contributed to the increase in sediment transport.
Similarly, the next major contributors of SS were Groups 3, 5, 9, 10, and 12. All of these groups are considerably covered by rich volcanic soils. All of the remaining groups made nearly the same SS contributions to the catchment basin. It is thus evident in
Figure 7a,b that carbon plays a significant role in the obtained results. Unlike the XRF analysis, the XRD analysis gave different results for major sediment sources (
Figure 8). In this case, Group 3, a region whose soil surface cover is volcanic ash, was revealed to be the major source of SS in the Oromushi River Catchment Basin. Group 5, the next major source of SS, surface soil type is rich volcanic soil, and as observed, the surface soil type significantly affects sediment generation, and consequently, the amount of sediment delivered to the river. Even though we excluded carbon from our analysis of the geochemical composition of SS in both the XRF analysis without carbon content and the XRD analysis, there was some difference in the groups’ contributions of SS to the downstream side of the Oromushi River Catchment Basin. This may be attributed to the differences in the characteristics of XRF and XRD.
4. Discussion
There are several negative effects of sediment transport on disaster prevention and ecosystem protection in rivers such as changes in the coastline and beach morphology, damage to infrastructure, and cultural heritage sites. As a result, the quantification of a river’s sediment transport capacity has received much attention from researchers worldwide. However, the accurate prediction of sediment transport has proved to be a challenging research topic. Several equations have been used to estimate sediment transport, including the alongshore transport equation [
27,
28,
29,
30], but these equations are unreliable for estimations of sediment transport under different conditions, such as during storms [
28], and measured hydrodynamics are therefore necessary to reduce the bias in the obtained results. Van Rijn demonstrated that the yearly predictions of sediment in rivers varied, and even the direction of net transport was uncertain [
31]. Several sediment transport functions have also been applied based on various concepts and approaches to increase the accuracy of sediment transport estimations [
32], but due to the discrepancy in the obtained results, these approaches have yet to become universally accepted. Kitsikoudis et al. [
33] used three machine learning techniques for deriving sediment transport formulae for sand-bed rivers from field and laboratory flume data (artificial neural networks, symbolic regression based on genetic programming, and an adaptive-network-based fuzzy inference system), and they compared the techniques’ efficacy. Their results suggested that the machine learning techniques are superior to the commonly used sediment transport formulae. We thus speculated that the use of NNAs has the potential to identify potential fine sediment sources downstream accurately.
A simple NNA model comprised of a single-layer network was applied in this study. The XRF and XRD analyses generated the datasets to identify the fine sediment sources downstream using the NNA model. The XRF analysis identified 15 geochemical components as the major components of SS in the Oromushi River Catchment Basin. The major components of SS exhibited a similar trend at all 18 stations, with SiO2 as the major SS component in the catchment basin. Based on the geochemical composition of the soil samples, it can thus be deduced that SiO2, a by-product of volcanic eruption, was the dominant component of SS in the region. The surface soil type therefore influenced the generation and transportation of sediment in the Oromushi River Catchment Basin.
In order to further clarify the regions from which the most geochemical components emanated, we applied an NNA. The geochemical composition of the sediment components obtained by XRF was used as the input data in the NNA model. Similarly, the 14 XRD intensity peaks for all the sampling stations were used as the input data. In both cases, the optimal condition was obtained with a single hidden layer and the output of only one neuron. The results of the XRF analysis indicated that regions covered mainly by agricultural fields were the primary sources of SS in the Oromushi River Catchment Basin. These results are consistent with those reported by Beitia et al. [
23], which indicated that agricultural fields were the major contributor to SS in the Oromushi River Catchment Basin.
Unlike our present XRF analysis, the XRD analysis indicated that Group 3 was the major source of SS in the catchment basin, and the second major source was Group 5. As shown in
Figure 8, the soil surface cover of both Group 3 and Group 5 is volcanic ash, which is composed of fine particles that can easily be eroded into a river. The nature of the surface soil type may thus have influenced the transportation of sediment in the Oromushi River Catchment Basin. This can also be observed in
Figure 4, where SiO
2 is the major component of the SS. Essentially, unlike an XRF analysis, an XRD analysis does not incorporate carbon, and it includes detailed information on crystalline phases [
34]. Carbon, being an unstable component of organic matter, is likely to be influenced by several ecological factors, and its composition may vary depending on the season and the chemical reactions of micro-organisms.
To offset the effect of carbon in the analysis, we conducted an ignition loss test using the soil samples [
35]. The geochemical components of the samples were then determined by XRF and analysed using the NNA. The results indicated the group contribution of SS to the downstream side of Oromushi River Catchment Basin without the influence of carbon. However, despite the results analysed using XRF (without the carbon content) and XRD, there were still some anomalies in the obtained results (
Figure 7a,b). The differences in the results may be attributed to the difference in the characteristics of XRF and XRD [
36]. XRD spectrum data provide more information compared to XRF. For example, XRD can determine the number of mineral species present in a sample, and it can identify the phases [
34]. In contrast, XRF only gives details of the chemical composition of the samples. Even though XRF is an excellent data analytical method, XRD proved to be a better method in the present study since it provides more information about the characteristics of the samples and does not incorporate carbon in an analysis of soil geochemical components, thus providing reliable results. In order to determine the contribution of SS from sub-river basins to the downstream of a river, it is therefore crucial to exclude the contribution of organic compounds, which can be achieved through an XRD analysis. We propose that conducting an XRD analysis may be preferable, particularly if the contribution of non-organic matter to the SS is to be studied.
