Article

A Composite Approach for Evaluating Operational Cloud Seeding Effect in Stratus Clouds

1
CMA Key Laboratory of Cloud-Precipitation Physics and Weather Modification (CMPL), Beijing 100081, China
2
CMA Weather Modification Centre, Beijing 100081, China
3
Center of Weather Modification of Shannxi Province, Xi’an 710016, China
4
Hubei Meteorological Service Center, Wuhan 430205, China
*
Author to whom correspondence should be addressed.
Hydrology 2024, 11(10), 167; https://doi.org/10.3390/hydrology11100167
Submission received: 13 August 2024 / Revised: 30 September 2024 / Accepted: 4 October 2024 / Published: 8 October 2024

Abstract

:
Robust water management is in intense demand in many water scarcity areas, such as arid and semi-arid regions in the world. As part of the regional water management strategy, rain enhancement is vital to replenish groundwater reservoirs, and the key challenge is how to assess its effectiveness. Some recent weather modification experiments attained cloud seeding effect through advanced in situ measurement coupled with accurate numerical simulation. However, there is still a lack of an objective and scientific approach to quantitatively evaluate the rain enhancement effect, especially for many non-randomized operational cloud seeding activities in China. In this study, we proposed a composite evaluation approach by analyzing two operational aircraft cloud seeding cases in stratus clouds in Shaanxi, China. By calculating the aircraft cloud seeding agent plumes, the target areas (as well as the control areas) of cloud seeding were dynamically and roughly determined. Physical properties, such as radar reflectivity and precipitation, were individually quantified in these areas. The cloud seeding effect was then evaluated by calculating the difference in parameter variation between target and control areas. This approach can be applied to qualitative analysis in a single aircraft cloud seeding operation and can also provide quantitative statistical results from multiple cloud seeding cases. We found that the average precipitation enhancement percentage of 18 operational aircraft cloud seeding cases is ~4.84%. Note that the homogeneity hypothesis of the seeding cloud, the error in the calculation of the target area, and the selection of control areas are the major uncertainties likely in the evaluation of the cloud seeding effect by this approach.

1. Introduction

Cloud seeding is a common technique of artificial precipitation enhancement, which aims to change the amount or distribution of local precipitation. The strategy employs refrigerant, glaciogenic, or hygroscopic aerosols introduced via airborne or ground-based instruments into suitable clouds to modify the cloud-precipitation chain processes. The effectiveness of cloud seeding has been a subject of ongoing scientific debate, with some studies showing positive results while others have found no significant impact. One of the challenges in evaluating cloud seeding is the difficulty in isolating its effects from natural variability in precipitation patterns. Scientific and accurate assessment of cloud seeding continues to challenge scientists, even though many well-designed weather modification experiments and projects have been conducted over the past few decades. The means through which precipitation enhancement might be accomplished by glaciogenic and hygroscopic cloud seeding has been well documented [1,2], and the direct effects (changes in cloud microphysics) illustrated in some case studies [3,4,5,6], but the quantitative changes in surface precipitation still lack scientific proof [7,8].
Two questions should be answered in quantifying the cloud seeding effect: one is how large the affected area is, and the other is how much precipitation has been increased. Several successful experiments have demonstrated a statistically significant rainfall increase of up to 20%, with an extra area effect potentially extending tens to hundreds of kilometers. The average precipitation enhancement percentage seems modest, but it is a long-term and comprehensive result of multiple cases. For a specific cloud system, such as convective clouds or winter orographic clouds advocated by WMO [9], the amount or pattern of local precipitation distribution may change through cloud seeding, and the effect may be more valid.
To address the cloud seeding effect area, one must know how the seeding (material) plumes are transported and dispersed within the atmosphere, that is, the spatial distribution and concentration of the seeding agent. The widths, heights, and densities of seeding plumes are greatly affected by wind and thermodynamic profiles, terrain, and cloud dynamics. Only through accurate calculation or measurement of cloud seeding plumes can the target area (TA) of cloud seeding be approximated. Previous observational studies have well documented the dispersion and transport of seeding plumes by ground and airborne releases [10,11,12]. In addition to observational experiments, theoretic calculations and numerical models have helped investigate seeding plumes’ dispersion and transport. Lagrangian particle trajectories and Gaussian plume diffusion models (e.g., air quality model) have been commonly used to simulate seeding plume transport and dispersion [13]. The results of these modeling studies not only inform the spatiotemporal distribution of cloud seeding plumes but also allow linking seeding-induced changes in cloud microphysics. Analysis of the flow of cloud seeding materials and the resulting microphysical-dynamics feedback, the cloud microphysical ‘‘chain of events’’ caused by cloud seeding can be documented and understood [14,15].
Quantitative analysis of tracers has enabled the calculation of TA and cloud seeding effects through observations of gaseous tracers in the atmosphere and the chemical composition in snowpack [16,17]. Bruintjes et al. used SF6 to trace the targeting of seeding material released from ground-based generators over complex terrain in northern Arizona [18]. Airborne in situ observations and modeling studies were compared and showed good agreement. Airflow, topography, and their interactions were considered as the dominant factors in determining the dispersion and transport of seeding plumes.
To acquire scientific and objective evidence of cloud seeding, a number of advanced measurements have been employed in field experiments, such as ground-based or airborne radar [4,5,19,20,21,22,23], satellite retrieval [6,15,24], airborne probes [5,25,26,27], and surface precipitation [28,29,30], etc. In particular, with the development of cloud-resolving numerical models and the application of advanced detection instruments, several convincing seeding effect pieces of evidence have been gained through laboratory, modeling, and field experimental studies [21,31,32,33]. Arguably, all these effective results are based on scientific guidance and evaluation.
Notwithstanding the difficulty of evaluating the cloud seeding effect, precipitation enhancement by weather modification is still a thriving activity due to its high potential benefit in water-limited regions. China has been one of the most active countries in operational cloud seeding programs, which are primarily aimed at precipitation enhancement or hail suppression [34]. There are about 30 provinces that have implemented non-randomized operational cloud seeding activities by using well-equipped seeding airborne and ground-based seeding tools. However, except for several case studies that gained conspicuously seeding effect [6,24,25,27], a vast amount of operational cloud seeding evaluation still lacks valid evidence or remains highly uncertain, with some critical issues not being resolved yet.
Present here is a study to describe and test a new approach for operational cloud seeding evaluation by using conventional meteorological observation (such as S- or C- band radar, satellite, rain gauge, etc.) in a relatively homogeneous cloud (e.g., stratus). One of the novel aspects of this approach is evaluating the cloud seeding effect by comparing the variation tendency of cloud or precipitation parameters between TA and control areas (CAs). This approach can be applied for qualitative analysis in a single aircraft cloud seeding operation and can also give a quantitative statistical result of multiple cloud seeding cases. Section 2 briefly introduces the formulation of the approach. Section 3.1.1 and Section 3.1.2 provide two case studies of implementing the approach by composite analysis of satellite, radar, and precipitation. Section 3.1.3 presents a statistical result from multiple cases. The main conclusions are summarized in Section 4.

2. Materials and Methods

2.1. Study Zone

This study focuses on the regions of southern Shaanxi province, which is the source of the Han River and Jialing River, tributaries of the Yangtze River, and it is also located in the upstream basin of Danjiangkou Reservoir. The study zone includes the Guanzhong Plain area (upper part of the dashed box in Figure 1) and the Qinba Mountain area (lower part of the dashed box in Figure 1) in Shaanxi Province. The Guanzhong Plain is 460–850 m above sea level, with an annual average temperature of 12–14 °C and an annual precipitation of 500–700 mm. The east–west mountain in the middle is Qinling Mountain, which is a part of the demarcation line of China’s north–south climate. The altitude of the Qinba Mountain area is 1000–3000 m, with an annual average temperature of 14–16 °C and annual precipitation of 700–900 mm. In some regions of southern Shaanxi, the annual precipitation can reach as much as 900 to 1250 mm.

2.2. Formulation of the Composite Approach

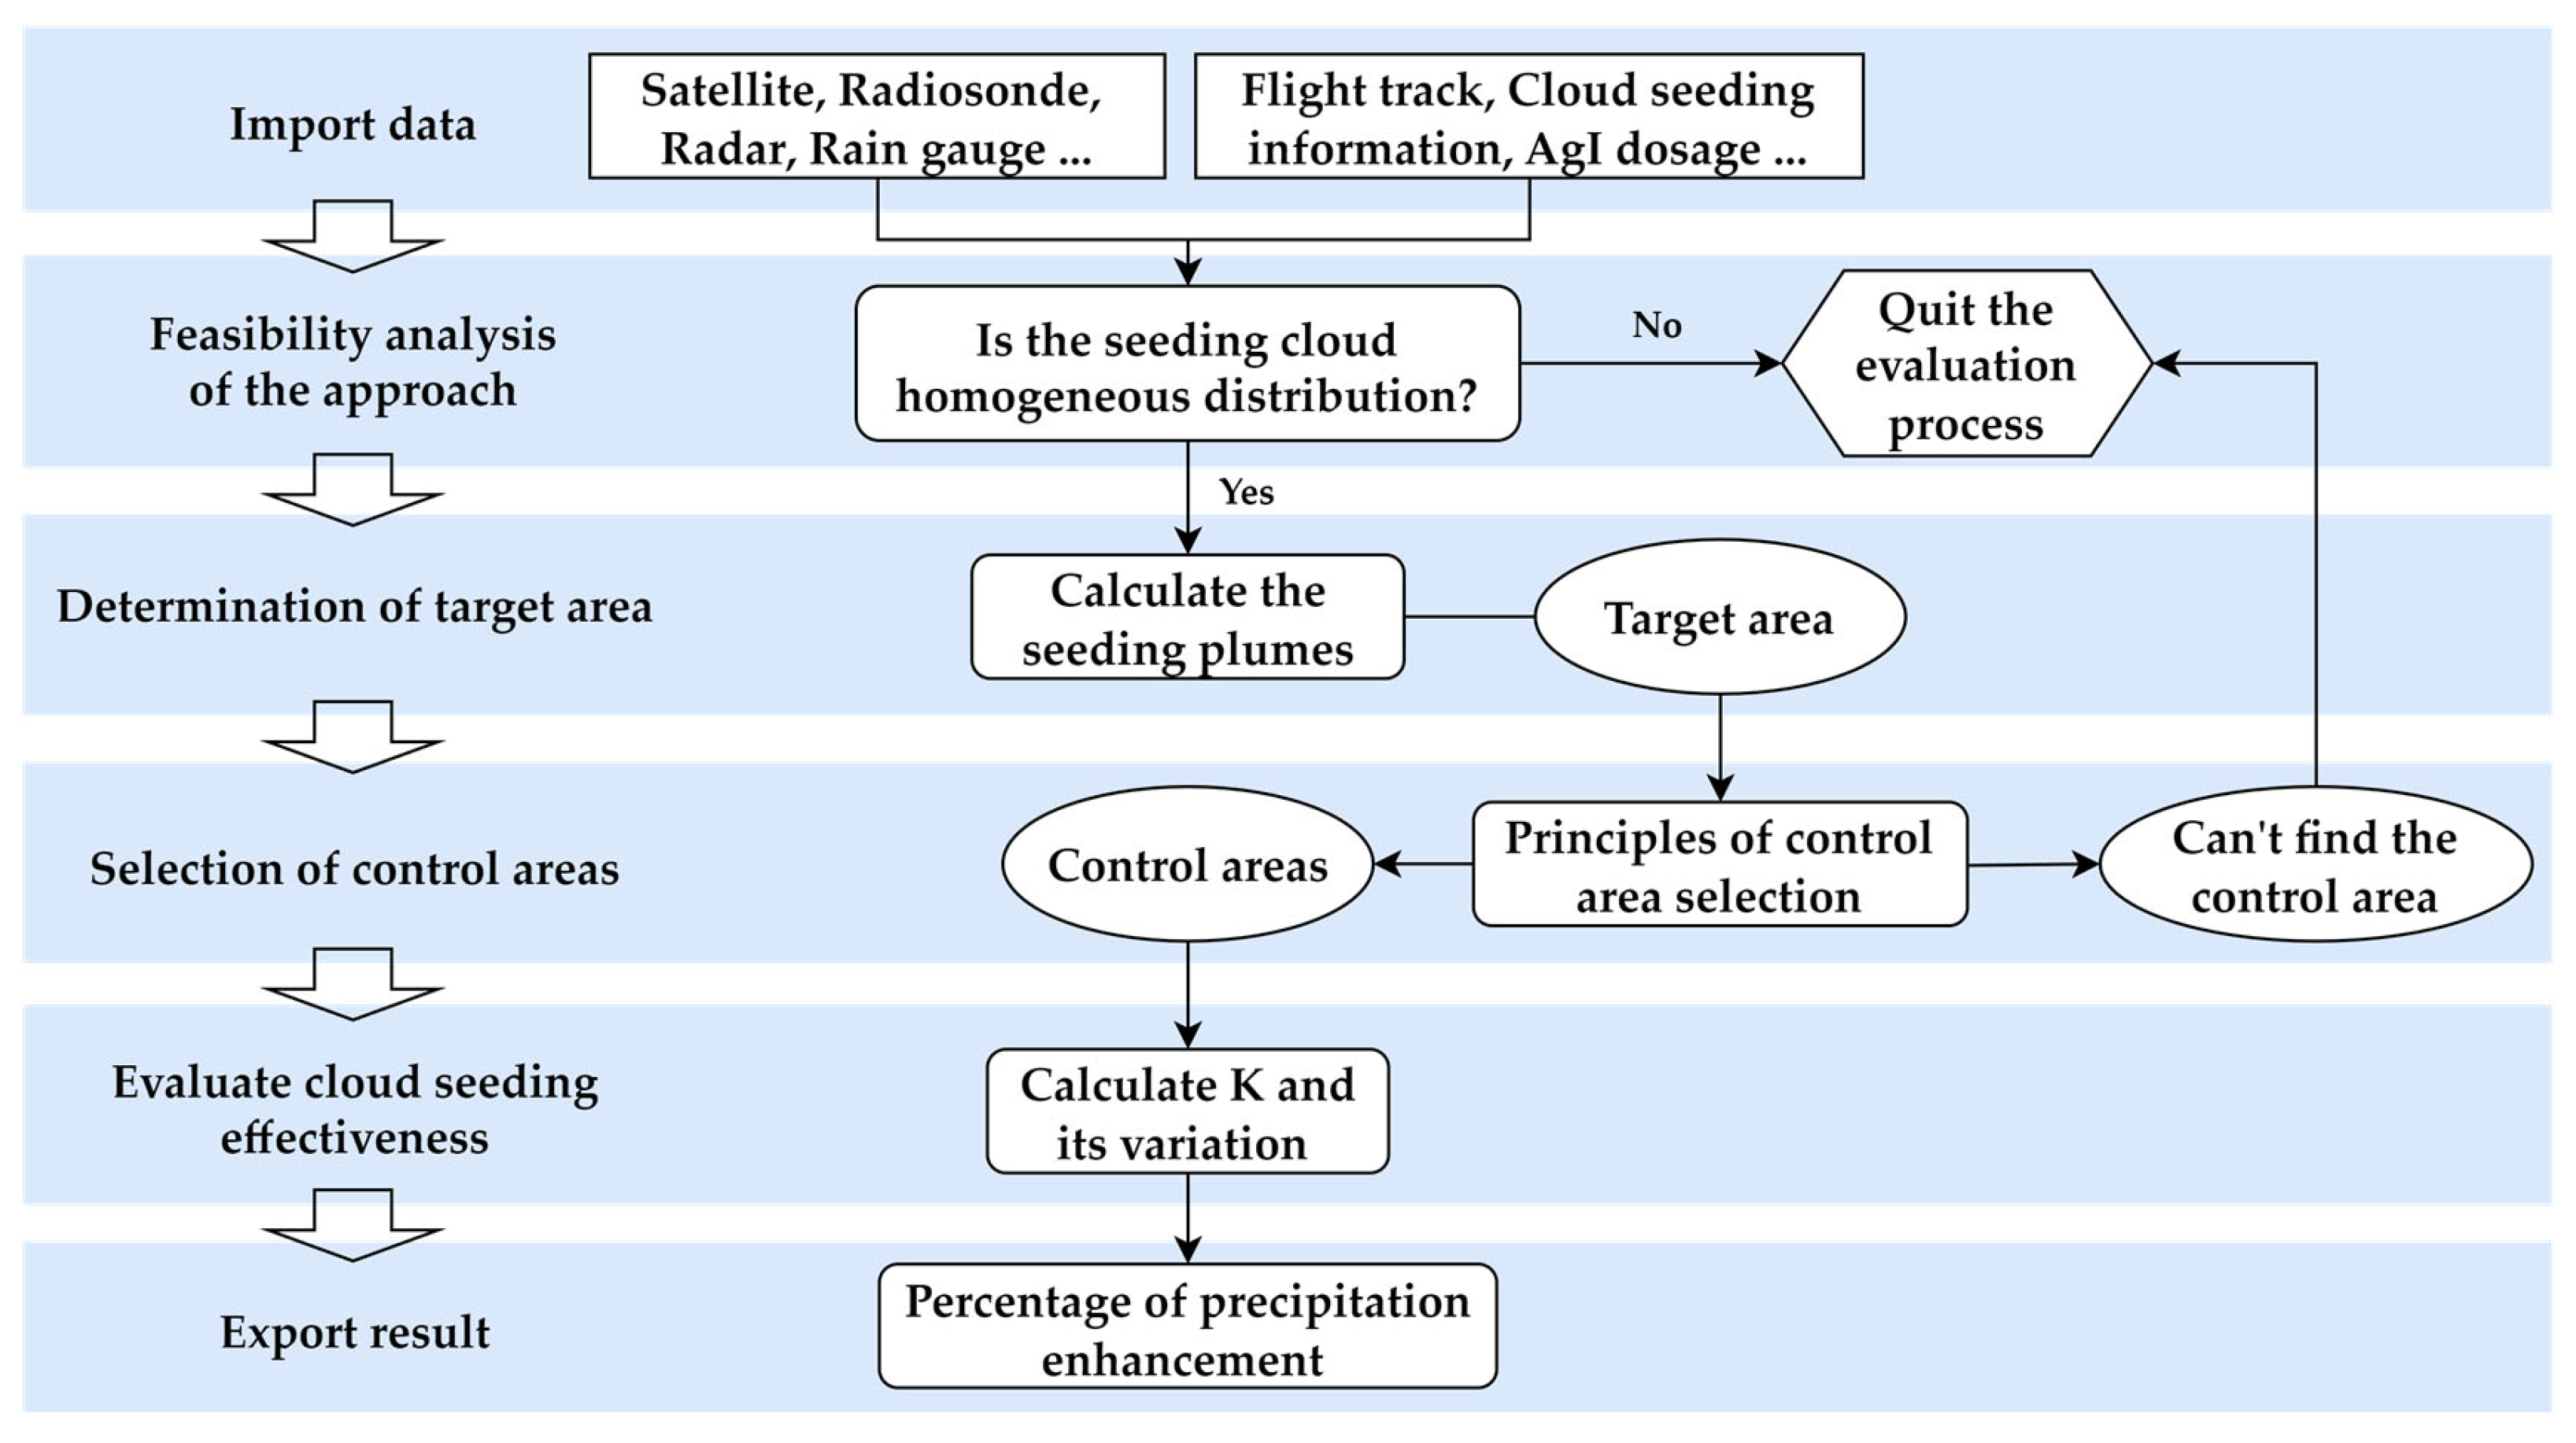
Several key procedures had to be determined prior to the application of this method for the evaluation of an operational cloud seeding case (Figure 2). First, considering the applicability of the methodology, the stratus cloud with homogeneous distribution is suggested to be the optimum seeding target. Assuming that there was no cloud seeding carried out, the evaluation of cloud properties in the TA and its surrounding area is homologous. So, the homogeneous level of the seedable cloud, to some extent, determines the confidence of the assessment result. Second, we must know the dispersion and transport of seeding materials spatiotemporally to gain insight regarding the potential TA influenced by seeding plumes. Third, the selection of the CA is based on several criteria to avoid potential contamination. Fourth, the assessment obtained by comparison between the TA and the CA needs to be proved by abundant observational data, such as radar, satellite, and precipitation.

2.2.1. Transport and Diffusion Regularity of Cloud Seeding Plumes

Theoretical frameworks of cloud seeding materials transport and dispersion have been formulated, most of which are based on the well-known Lagrangian particle-based model or Gaussian plume model [15]. In this study, we applied a diffusion model of mobile continuous point sources based on Lagrangian methodology, with a primary focus on airborne operational cloud seeding. The simplified expression for the transport and diffusion of substances in a free atmosphere is formulated as follows:
q t + u q x + v q y + w q z = k H 2 q x 2 + k H 2 q y 2 + k V 2 q z 2 ,
where q is the concentration of tracer or cloud seeding materials, u, v, and w are wind components in the x, y, and z directions at any given time (t), kH and kV are the horizontal and vertical turbulent diffusion coefficients. Assuming that the ambient atmosphere is homogeneously mixed, and the tracer or seeding material has zero terminal fall velocity (v = 0 m s−1), the analytical solution of Equation (1) calculates the advection-diffusion and transport of seeding plumes injected by aircraft is plausible. More complete and detailed descriptions are provided by references herein [35].

2.2.2. Determination of Target Area

Through inputting the source term (such as releasing rate of cloud seeding materials) and horizontal wind data (obtained from, e.g., radiosonde, wind profile radar, reanalysis data, etc.), the diffusion of cloud seeding materials at any time was calculated based on the advection transport algorithm mentioned above. Considering the common time accuracy of observational data (such as 6 min for radar reflectivity, 30 min for satellite retrieved product, and 60 min for surface precipitation data), the cloud seeding TA at any time interval was obtained. However, taking the displacement of the raindrop terminal falling into consideration, there might be a certain deviation between the actual distribution of surface precipitation and the TA calculated by Equation (1). The deviation can be subsequently revised by raindrop falling calculation.

2.2.3. Selection of Control Areas

Several criteria are considered in the selection of control regions:
  • The TA and the CA should be controlled by the same synoptic system. Since the stratus cloud is the prime target of this approach, it is suggested that both the TA and the CA are covered by a spatially homogeneous and temporally continuous cloud deck;
  • The size of the CA is the same as that of the TA at any moment or duration after seeding initiation. In addition, the spatial separation between the TA and the CA should be large enough to prevent potential contamination;
  • It is recommended to select regions with similar terrain for TA and CA comparison;
  • The spatial distribution of variables to be analyzed in the TA and the CA is comparable, such as the number or density of rain gauges distributed as similarly as possible in the TA and the CA.
In addition, it is suggested that as many CAs are selected as possible, and a correlation analysis is made to ensure that the parameters of the TAs and CAs vary in harmony, which may influence the confidence of the final evaluation result.

2.2.4. Description of Multi-Parameter Dynamic Comparison Approach

In this study, we propose a dynamic comparison method based on multi-parameter analysis to satisfy the demand for operational cloud seeding evaluation. Both the TA and the CA are dynamically moved according to the principles mentioned in Section 2.2.2 and Section 2.2.3. A key factor, K, is introduced to indicate the ratio of observational parameters in TAs and CAs, and K can be conveniently expressed as follows:
K = M T M C ,
where MT and MC represent regional averages of parameters in target and control areas, respectively. The variation and discrepancy of observational parameters in each TA and corresponding CA are analyzed. The result may partly reflect if cloud seeding produces an effect on these parameters, that is, the effectiveness of cloud seeding.

2.2.5. Applicability and Limitations

Note that, applicability analysis should be discussed before evaluating operational cloud seeding by this approach. First, to avoid the subjectivity of the definition of stratus cloud, parameters that represent the homogenization of the seeding cloud should be involved. Tracking these parameters pre- and post-cloud seeding to avoid abrupt variation which may affect the confidence of evaluation results. Secondly, when using the diffusion model mentioned in Section 2.2.1, it is necessary to consider the evolution of the seeded cloud (e.g., through radar or satellite images) to reduce uncertainty in the TA calculation, for example, the significant differences between wind data and actual cloud movement, the dissipation of the seeded clouds, etc. Third, it is worth strict inspection to make sure the selection of a CA follows the five principles in Section 2.2.3. Finally, it is important to use physical parameters that depend on the observation conditions, the precision and stability of the instrument, and the demand for qualitative or quantitative evaluation.
Here, we present two operational cloud seeding cases to show the application of the composite approach.

3. Results and Discussion

3.1. Application in Estimating Cloud Seeding Effect

To testify the feasibility of the multi-parameter dynamic comparison method, the following two operational aircraft cloud seeding cases are selected to conduct analysis from the perspective of precipitation and radar echo to study the cloud seeding effect.

3.1.1. Evaluation of Operational Cloud Seeding by Precipitation Data on 4 March 2018

An operational aircraft cloud seeding activity was conducted on 4 March 2018 over Shaanxi, China. As a combustion product of the glaciogenic agent, AgI was introduced by pyrotechnic flares equipped on a Y-12 aircraft. It is a turboprop cloud seeding aircraft with a typical speed of 60–70 m s−1. Flight time, altitude, and geolocation data are recorded by a compass navigation satellite system (CNSS), which is calibrated by the GPS. The aircraft took off from Xianyang Airport at 02:56 UTC, then flew southeast to the upstream basin of Danjiangkou Reservoir to implement precipitation enhancement. The airborne cloud seeding was initiated at 03:30 UTC and lasted ~150 min, with an average altitude of ~3940 m (ambient temperature was ~−8 °C, see Figure S1). A total of ~2500 g composite AgI agent was released by burning 20 flares during cloud seeding (at a seeding rate of 0.368 g s−1). Moderate aircraft icing was recorded, suggesting abundant supercooled water at the spatial and temporal scales of cloud seeding [24]. CMA rain gauge data of hourly precipitation were employed in this case study to find the end result of the cloud seeding effect.
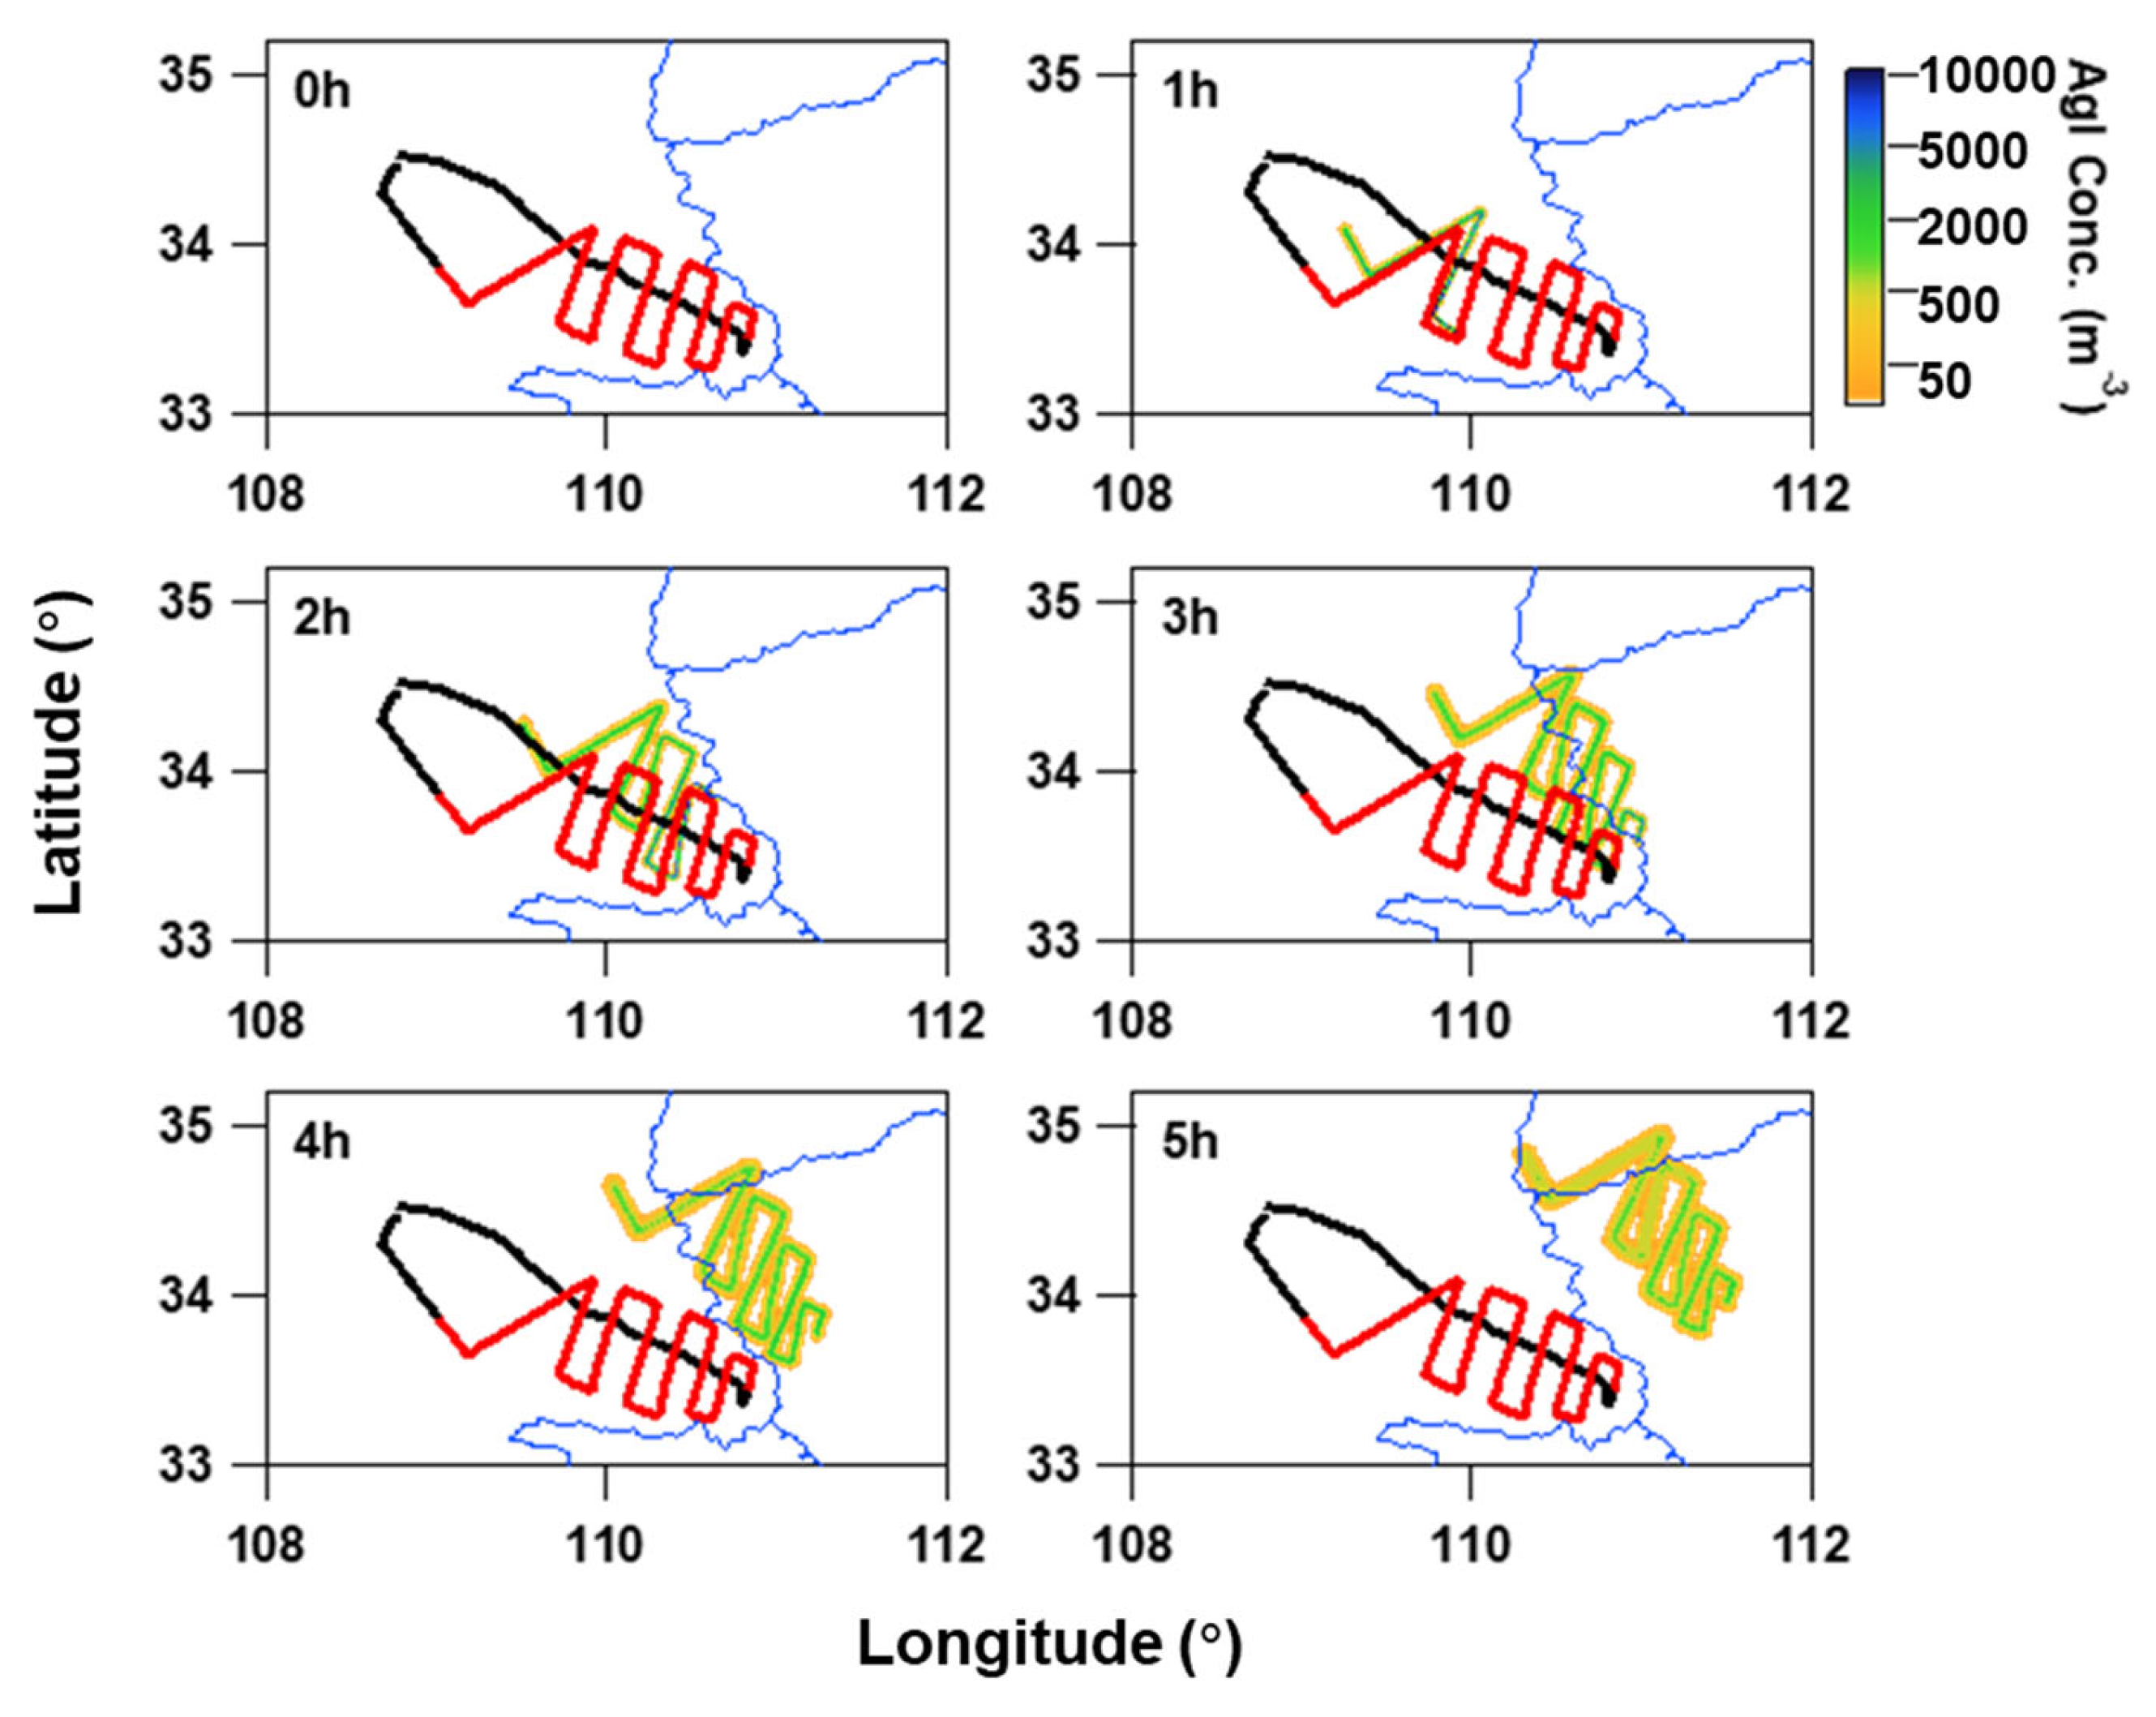
An upper-level trough and a low-level vortex constituted the primary synoptic system (image omitted). Satellite images showing large-scale stratocumulus over central China, and a high-value cloud optical thickness (COT) in the vicinity of the seeded region (Figure 3). Through comprehensive analysis of sounding data and cloud motion from satellite images, it is concluded that the wind direction was ~235° and wind speed was ~10 m/s at the cloud seeding layer (Figure S1). According to the transport and diffusion algorithm of the seeding agent mentioned in Section 2.1, the AgI concentration was calculated hourly and shown in Figure 4 (The diffusion coefficient is kH = 140 m2/s in this study).
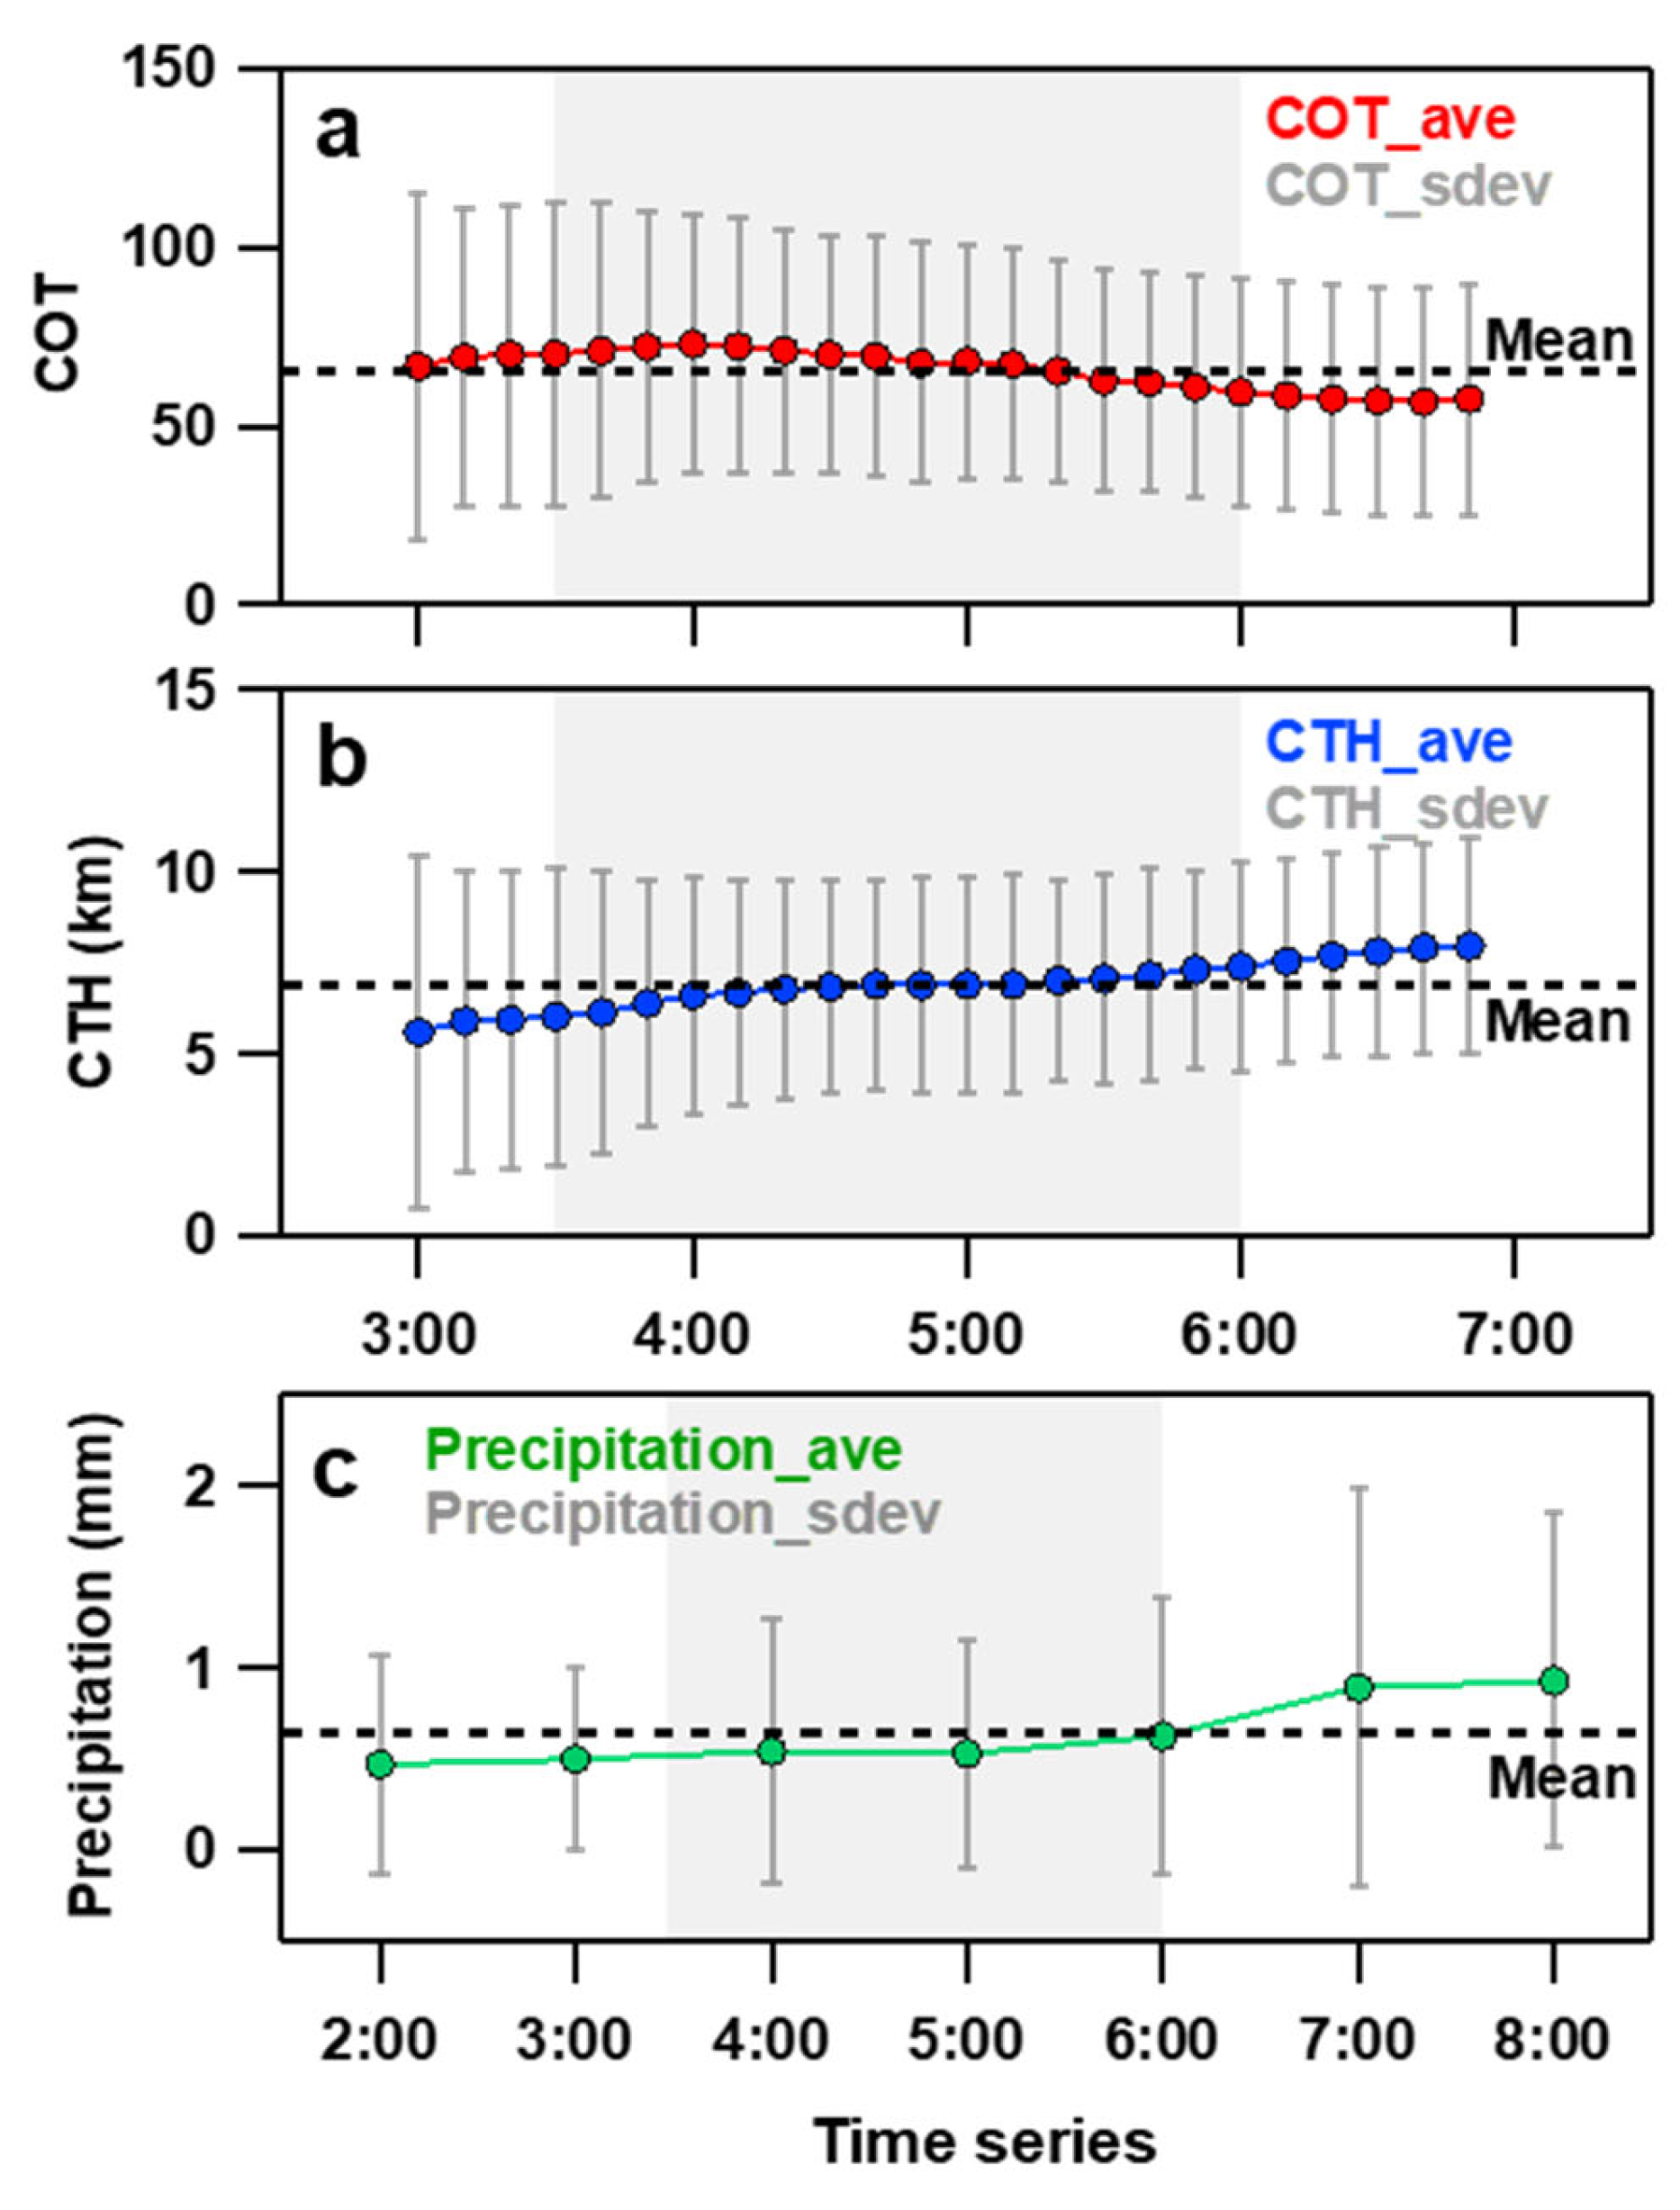
The distribution of COT, cloud top height (CTH), and rain gauge data in 107~114° E, 32~36° N (in light of diffusion and transport of AgI plumes) was analyzed to discuss the homogeneity of cloud and precipitation as well as the feasibility of the approach. The standard deviation and time series of COT, CTH, and precipitation can provide references for judging the horizontal homogeneity and temporal continuity of the target cloud. For example, assuming the regional mean (defined as a predictive value here) represents the homogeneity of the cloud, the diversity between the imaginary cloud and actual cloud was tried to quantify by calculating the error between the observational value and the predictive value of the above parameters. Statistical tools and techniques (see Supplementary Materials) include the Root Mean Square Error (RMSE), Mean Relative Error (MRE), and Median Bias (MDB) of the above parameters (such as COT, CTH, and precipitation) were determined for error calculation in this case study (Table 1). By analyzing these statistical parameters, we can judge the spatial variation and temporal continuity of the target cloud to some extent. For example, assuming the target cloud is uniform and stable distribution, then the value of RMSE and MRE tend to be smallish, and MDB approaches zero. Figure 5 shows the time series of COT and CTH from 3:00 to 7:00 UTC and surface precipitation from 2:00 to 8:00 UTC. It can be concluded that the mean COT, CTH, and precipitation vary continuously and linearly, indicating the target cloud is approximately homogeneous and stable distributed pre- and post-cloud seeding. The averaged COT was ~65.3 ± 36.46, with an increasing CTH (from 5.6 km to 7.8 km) and increasing surface precipitation (from 0.47 mm h−1 to 0.93 mm h−1) correspondingly. Overall, using the multi-parameter dynamic comparison method to rough evaluate the cloud seeding effect is appropriate for this case study.
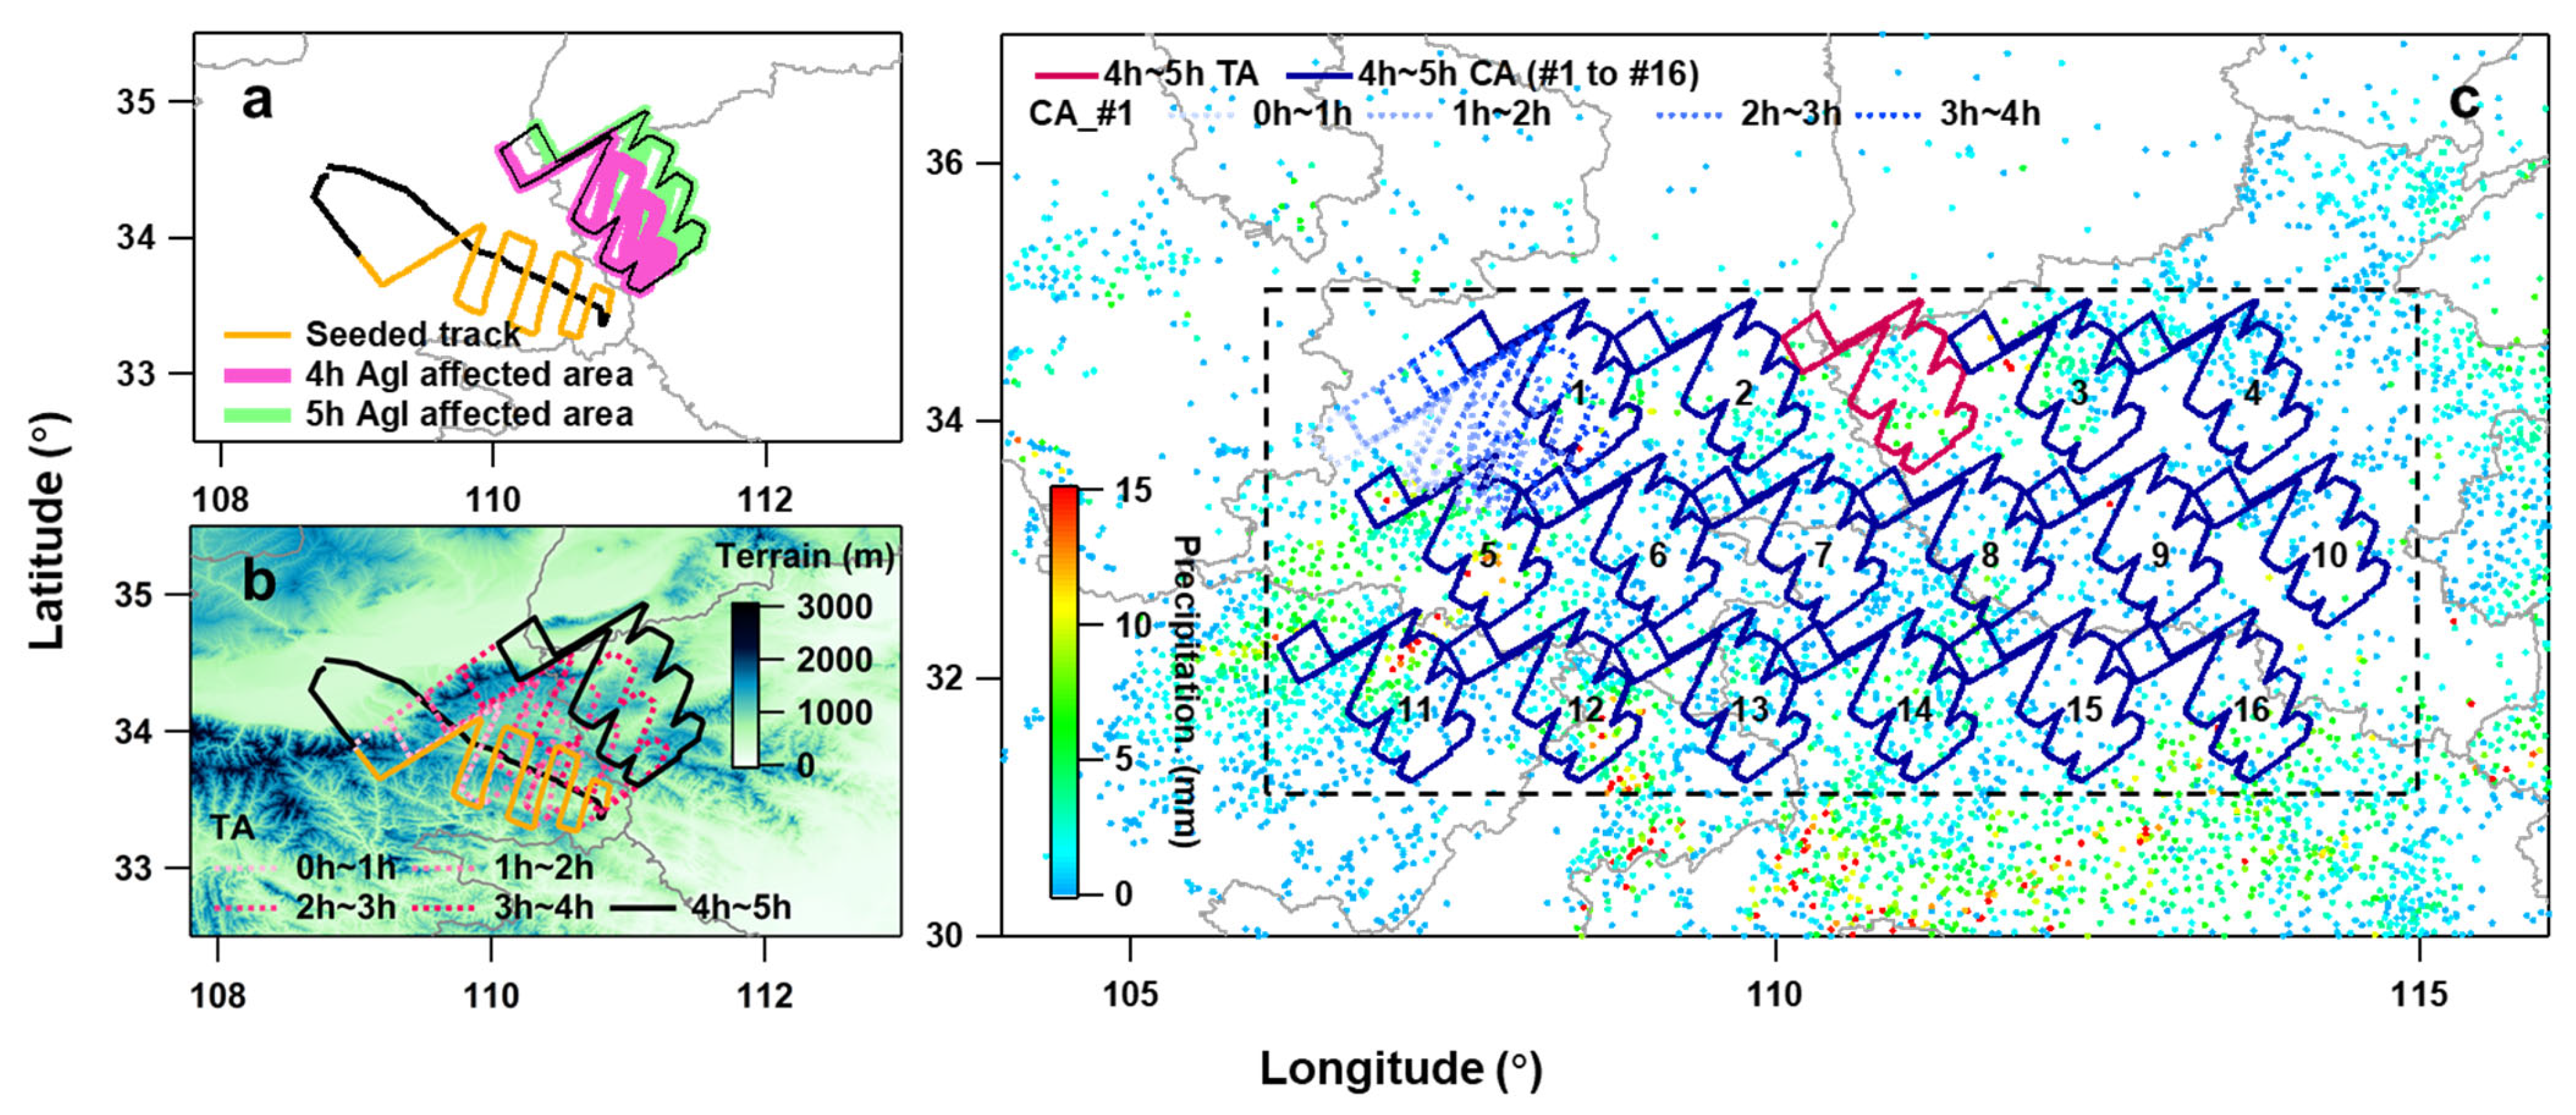
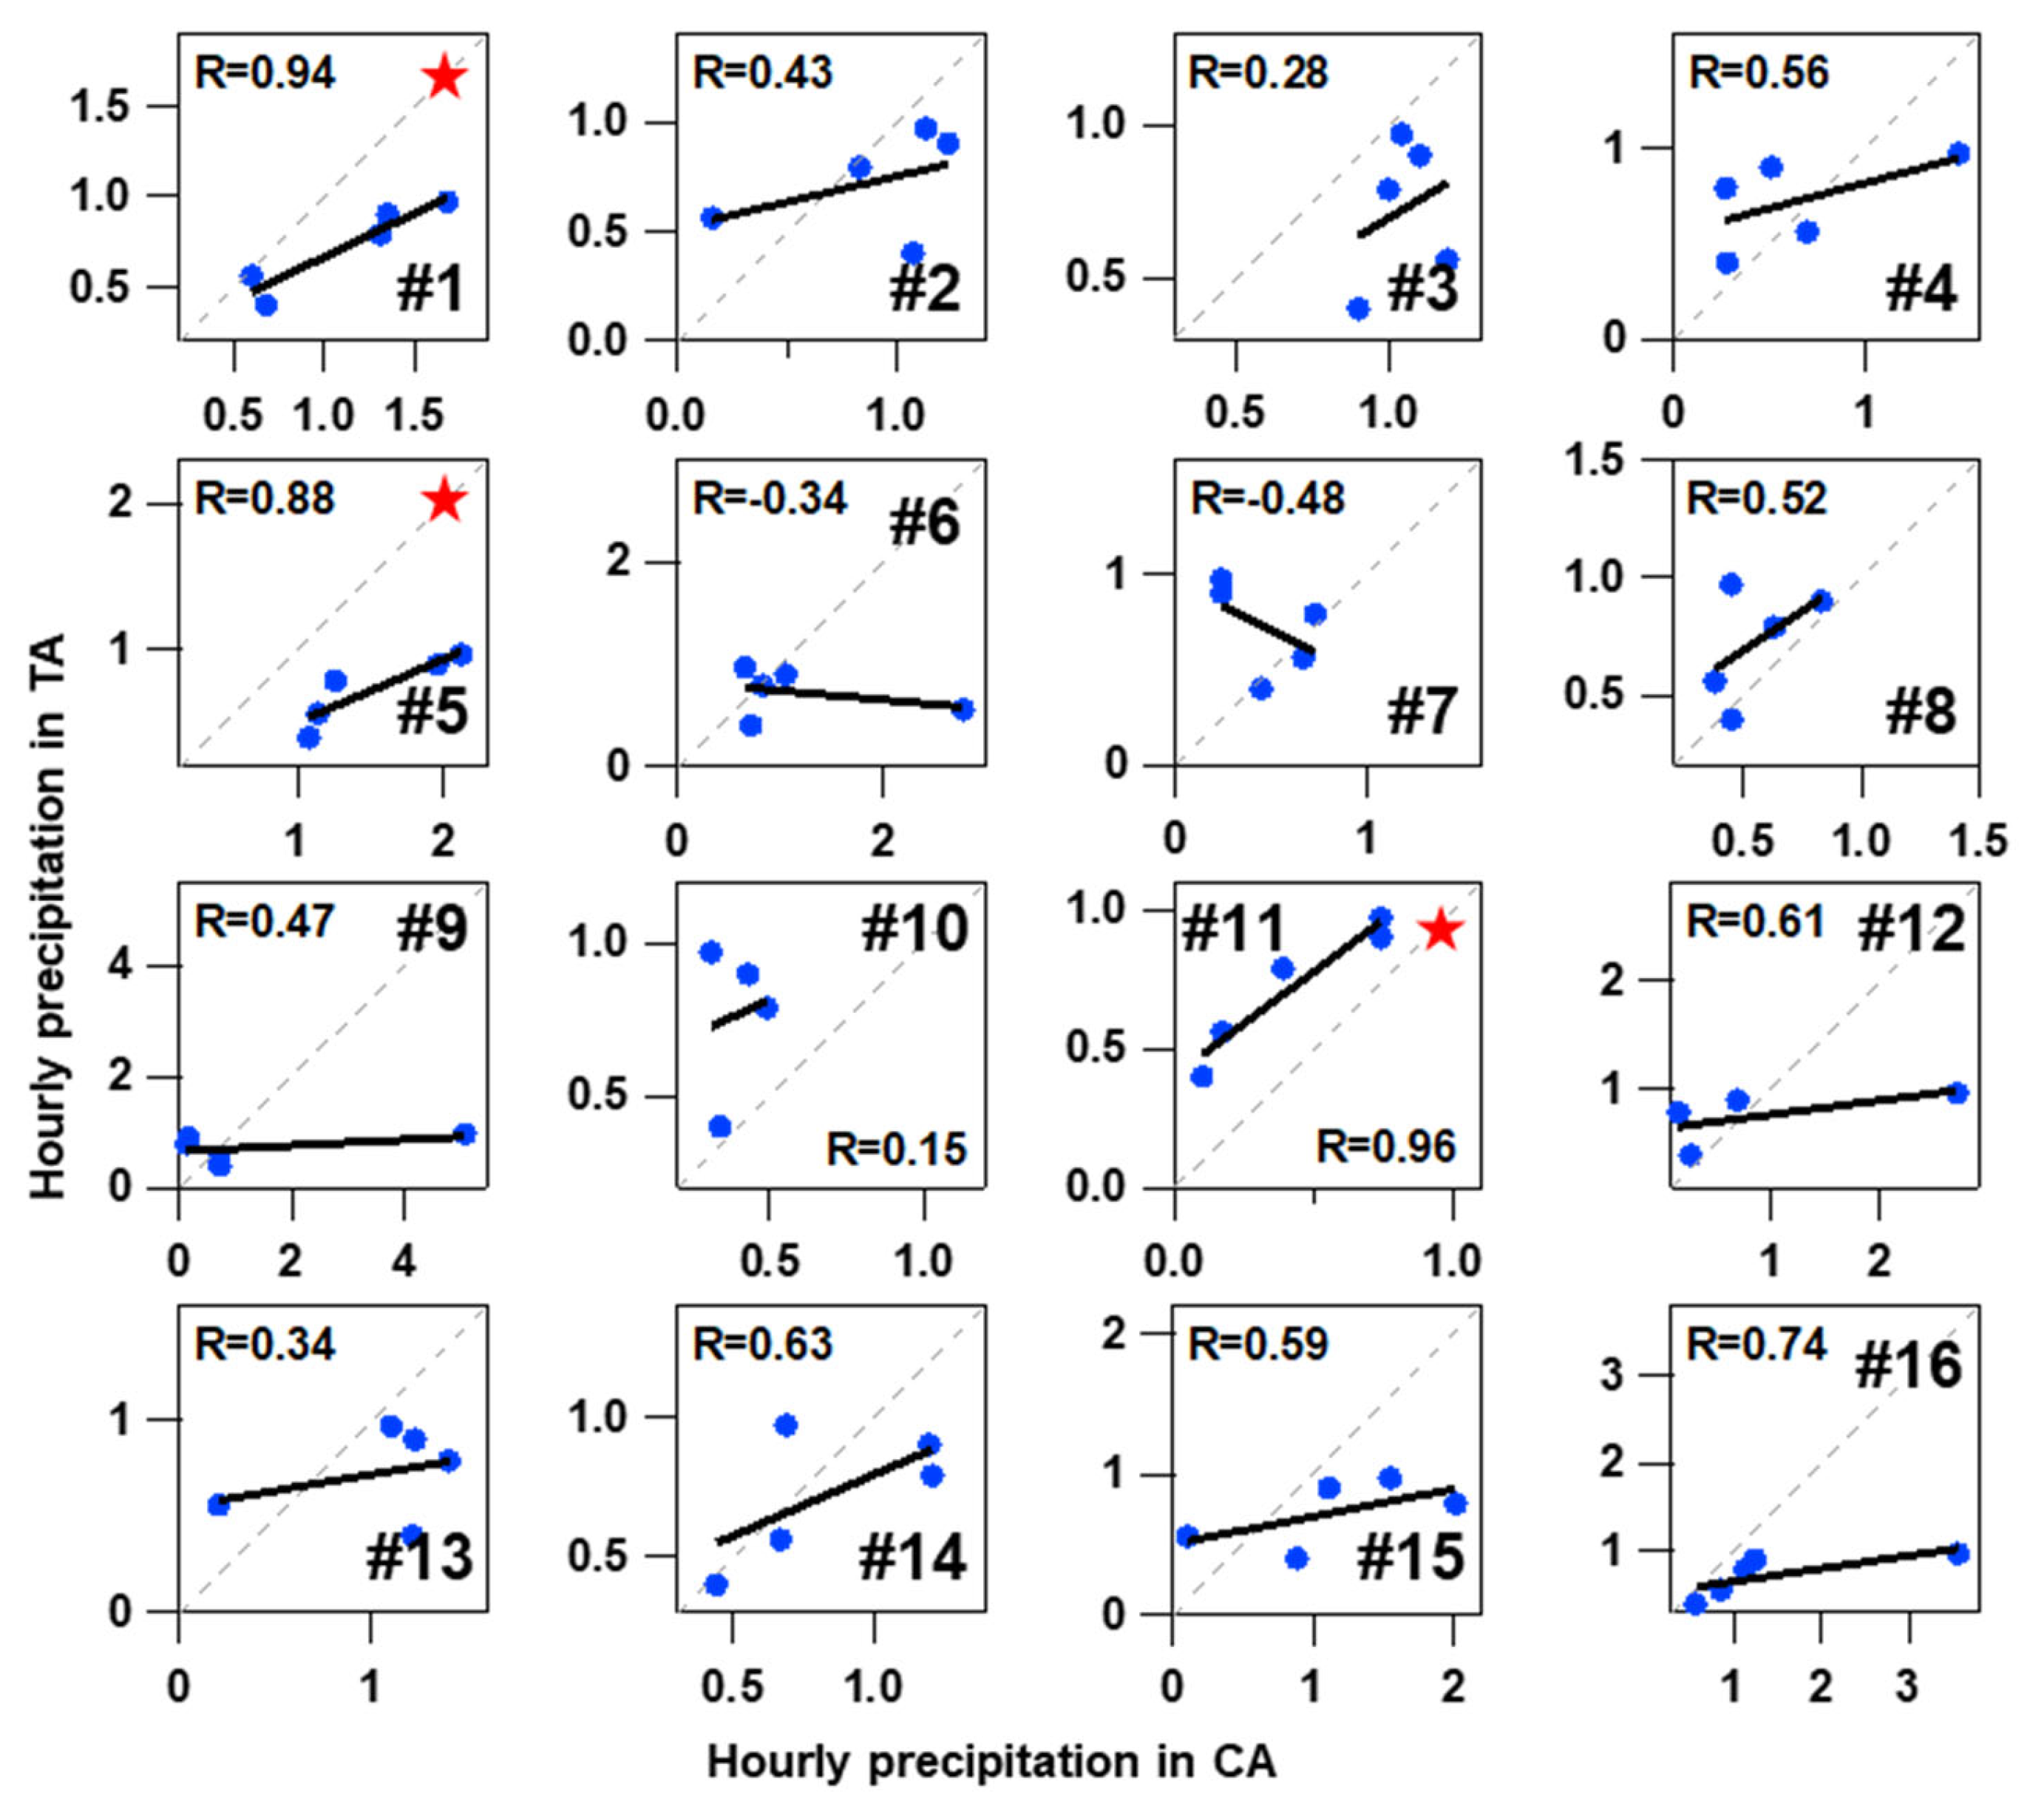
Attempts were made to identify the TA and CA according to the hourly distribution of cloud seeding agents in Figure 4. Since the hourly precipitation is a cumulative quantity and the diffusion of the AgI agent is an instantaneous quantity, to match each other, we define the area of AgI plumes (AgI concentration ≥ 50 m−3) in two consecutive moments as the cumulative TA. Taking the fourth and fifth hour of AgI distribution as an instance, the area surrounded by the black line is the 4~5 h cumulative TA after cloud seeding initiation (Figure 6a). The cumulative TA of any time period can be obtained by analogy (Figure 6b). Therefore, the regional average precipitation of hourly cumulative TA (0~5 h) was calculated after cloud seeding initiation. According to the principle of control region selection in Section 2.2.3 and considering the distribution of precipitation during the operation period, sixteen regions in the vicinity of TA were selected as CA for comparison in this study (Figure 6c). There are 2730 rain gauges homogeneously distributed in the above regions (106~115° E, 31~35° N), with a spatial resolution of ~10 km. The number of rain gauges contained in the TA and each CA is approximate. Although the five-hour rainfall accumulations show a roughly wide and homogeneous distribution (Figure 6c), there were still some differences in hourly precipitation between the TA and each CA (Figure 7). The mean correlation coefficient between the TA and 16 CAs is ~0.45. CA_#1, CA_#5, and CA_#11 correlate better with the TA than other CAs, and the correlation coefficients were 0.94, 0.88, and 0.96, respectively. It is important to note that the CAs that correlate better with the TA were all located upstream of the cloud seeding area in this case study.
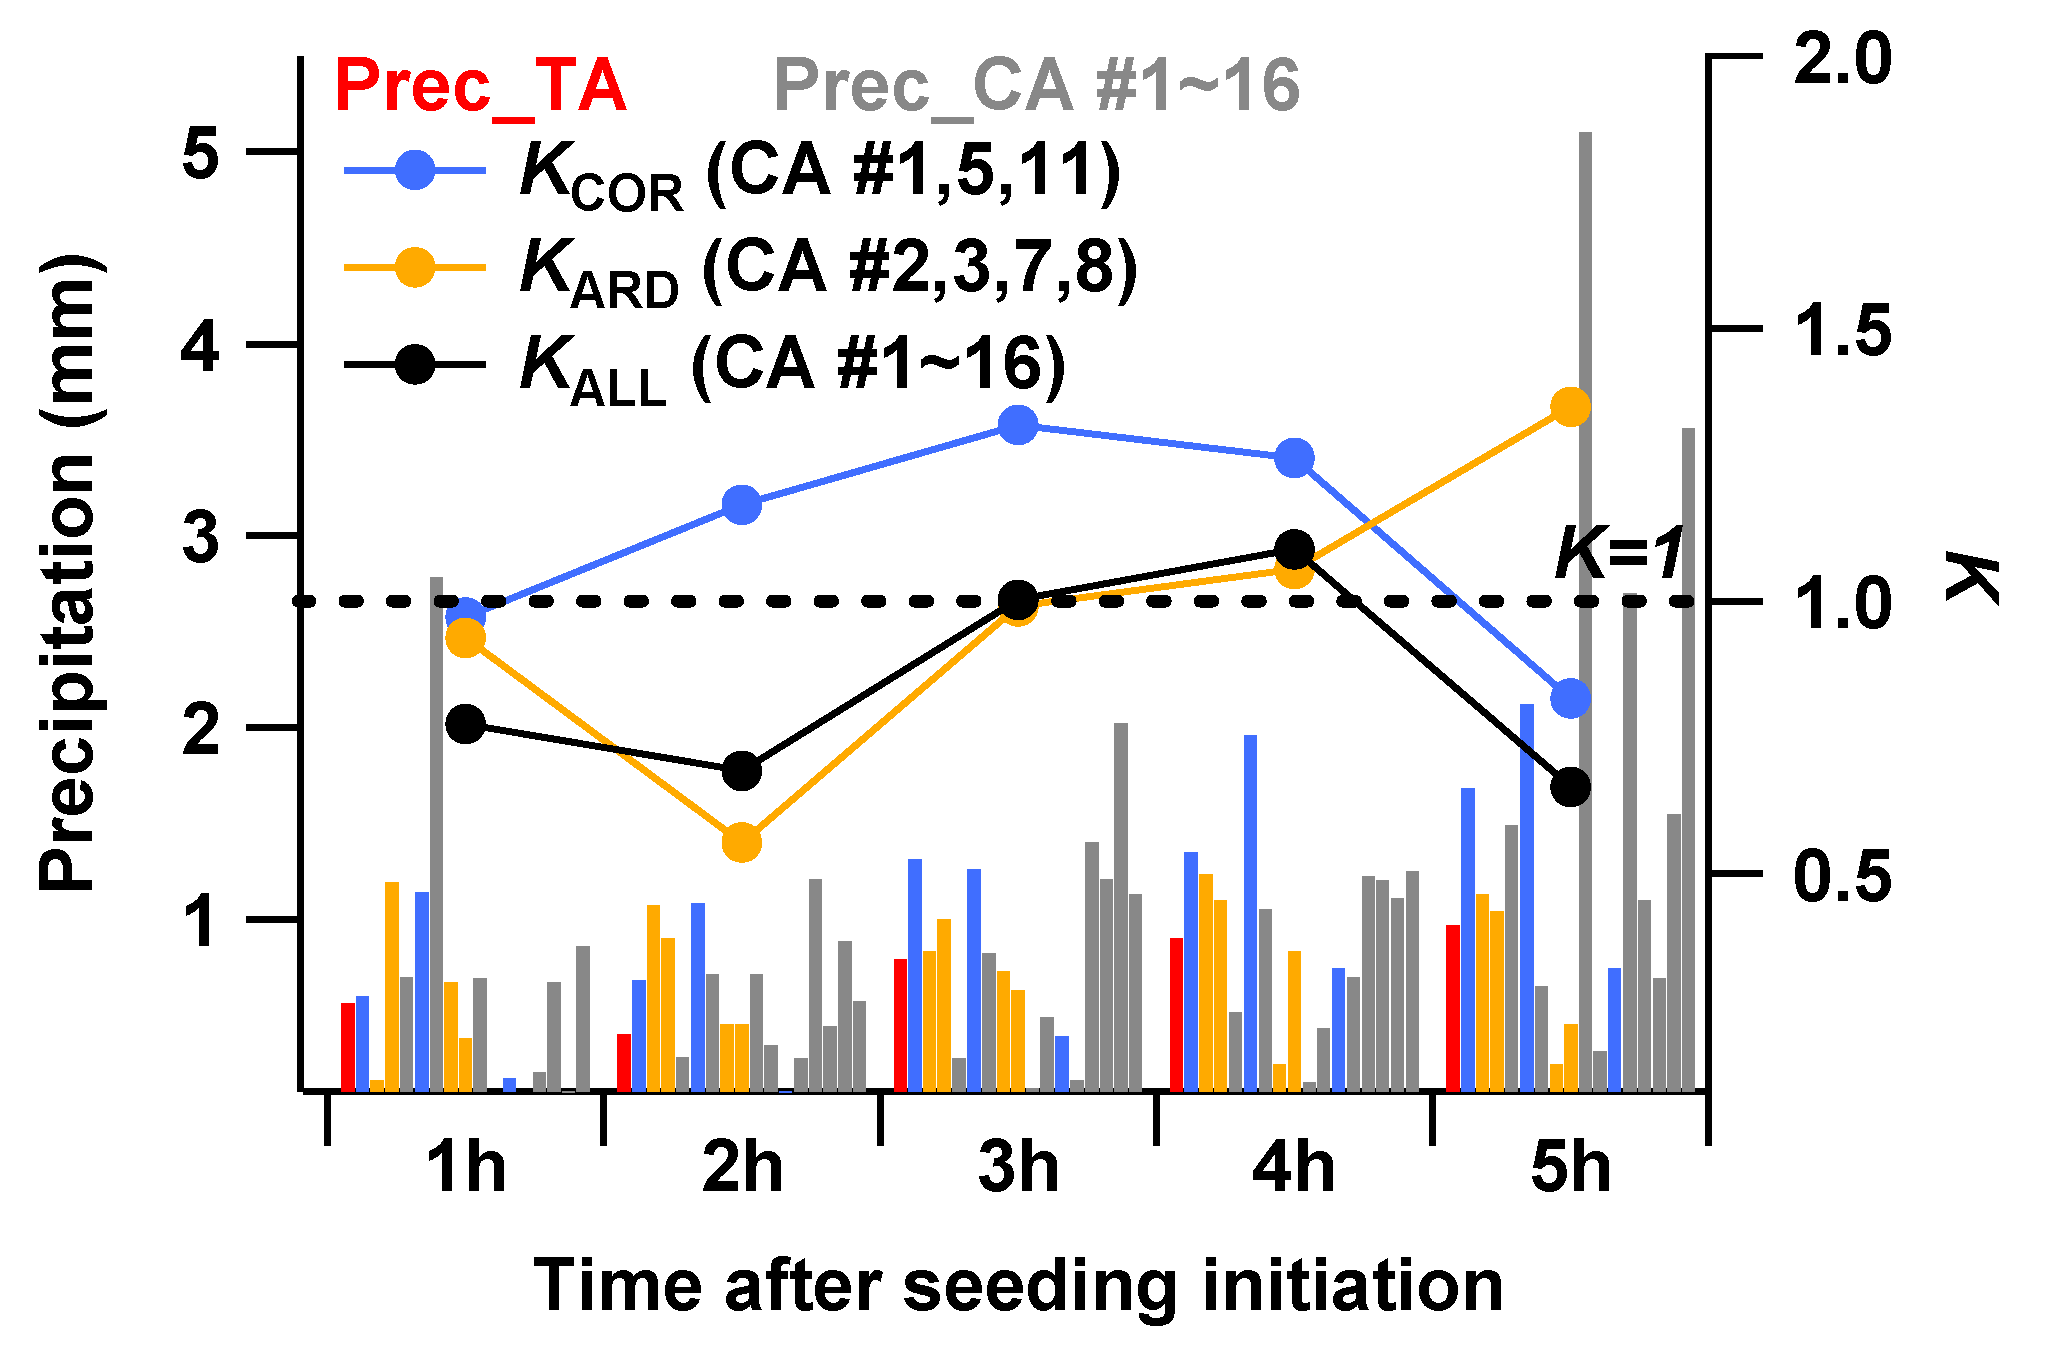
To discuss the impact of different CA selections on the final evaluation results, we calculate the hourly ratio of surface precipitation in TA to that in (a) the regions with better relevance (CACOR, corresponding to CA_#1, CA_#5, and CA_#11), (b) the regions in the vicinity of TA (CAARD, corresponding to CA_#2, CA_#3, CA_#7, and CA_#8), (c) all sixteen regions (CAALL, corresponding to CA_#1~16). Here, we define the ratio as KCOR, KARD, and KALL according to Equation (2), respectively. As the 16 regions contain most of the areas covered by this precipitation, it can roughly present a natural precipitation change (or considered as the background variation of precipitation) around the TA. Then, the ratio of precipitation in the TA to that in different CAs can be approximately regarded as the operational cloud seeding effect. Therefore, the effect can be qualitatively evaluated through K value vary analysis (Figure 8). Taking all 16 regions as CAs for comparison, KALL = 0.86 since cloud seeding initiation, and increased until the fourth hour and then decreased. Hourly rainfall in TA is greater than that in CA (from KALL > 1) during the third and fourth hour since cloud seeding initiation, indicating that a possible cloud seeding effect may appear in this period. If CA was delimited according to the correlation of hourly rainfall (such as CACOR), KCOR = 0.97 initially, and increased first and then decreased. Rainfall in the TA is approximately the same as that in the CA at the first hour since cloud seeding initiation. Considering the AgI agent involved in the nucleation of ice crystals to generate surface precipitation by a series of physical processes, therefore, precipitation changes in the first hour near the beginning of cloud seeding can be approximately regarded as a nature background. The first hour K value is considered to reflect a background rainfall difference.
With the continued cloud seeding operation, KCOR gradually increases and reaches the maximum in the third hour. The average precipitation in the TA is ~1.32 times that in the CA and then decreases to ~0.82 at the fifth hour. The variation of KCOR and KALL was relatively consistent with the expectation of the first hour. The increased K value at 2~4 h since cloud seeding initiation indicates that compared with CA (or background field), the increase of precipitation in TA is more obvious and can last for 2~3 h. If we take the nearest surrounding area of the cloud seeding region as the CA (CAARD), we can conclude that the hourly rainfall in the TA is approximately that of the CA during the first hour, after which KARD drops to a minimum and then continues to increase until the fifth hour. KARD variation is significantly different from KCOR and KALL at both 1~2 h and 4~5 h, making it inappropriate to employ the nearest surrounding area of the cloud seeding region as the CA for assessment. Taking the temporal variation of K values and the correlation between the TA and the CA into consideration, the evaluation calculated from KCOR is more plausible in this case study.

3.1.2. Evaluation of Operational Cloud Seeding by Radar Data on 19 March 2017

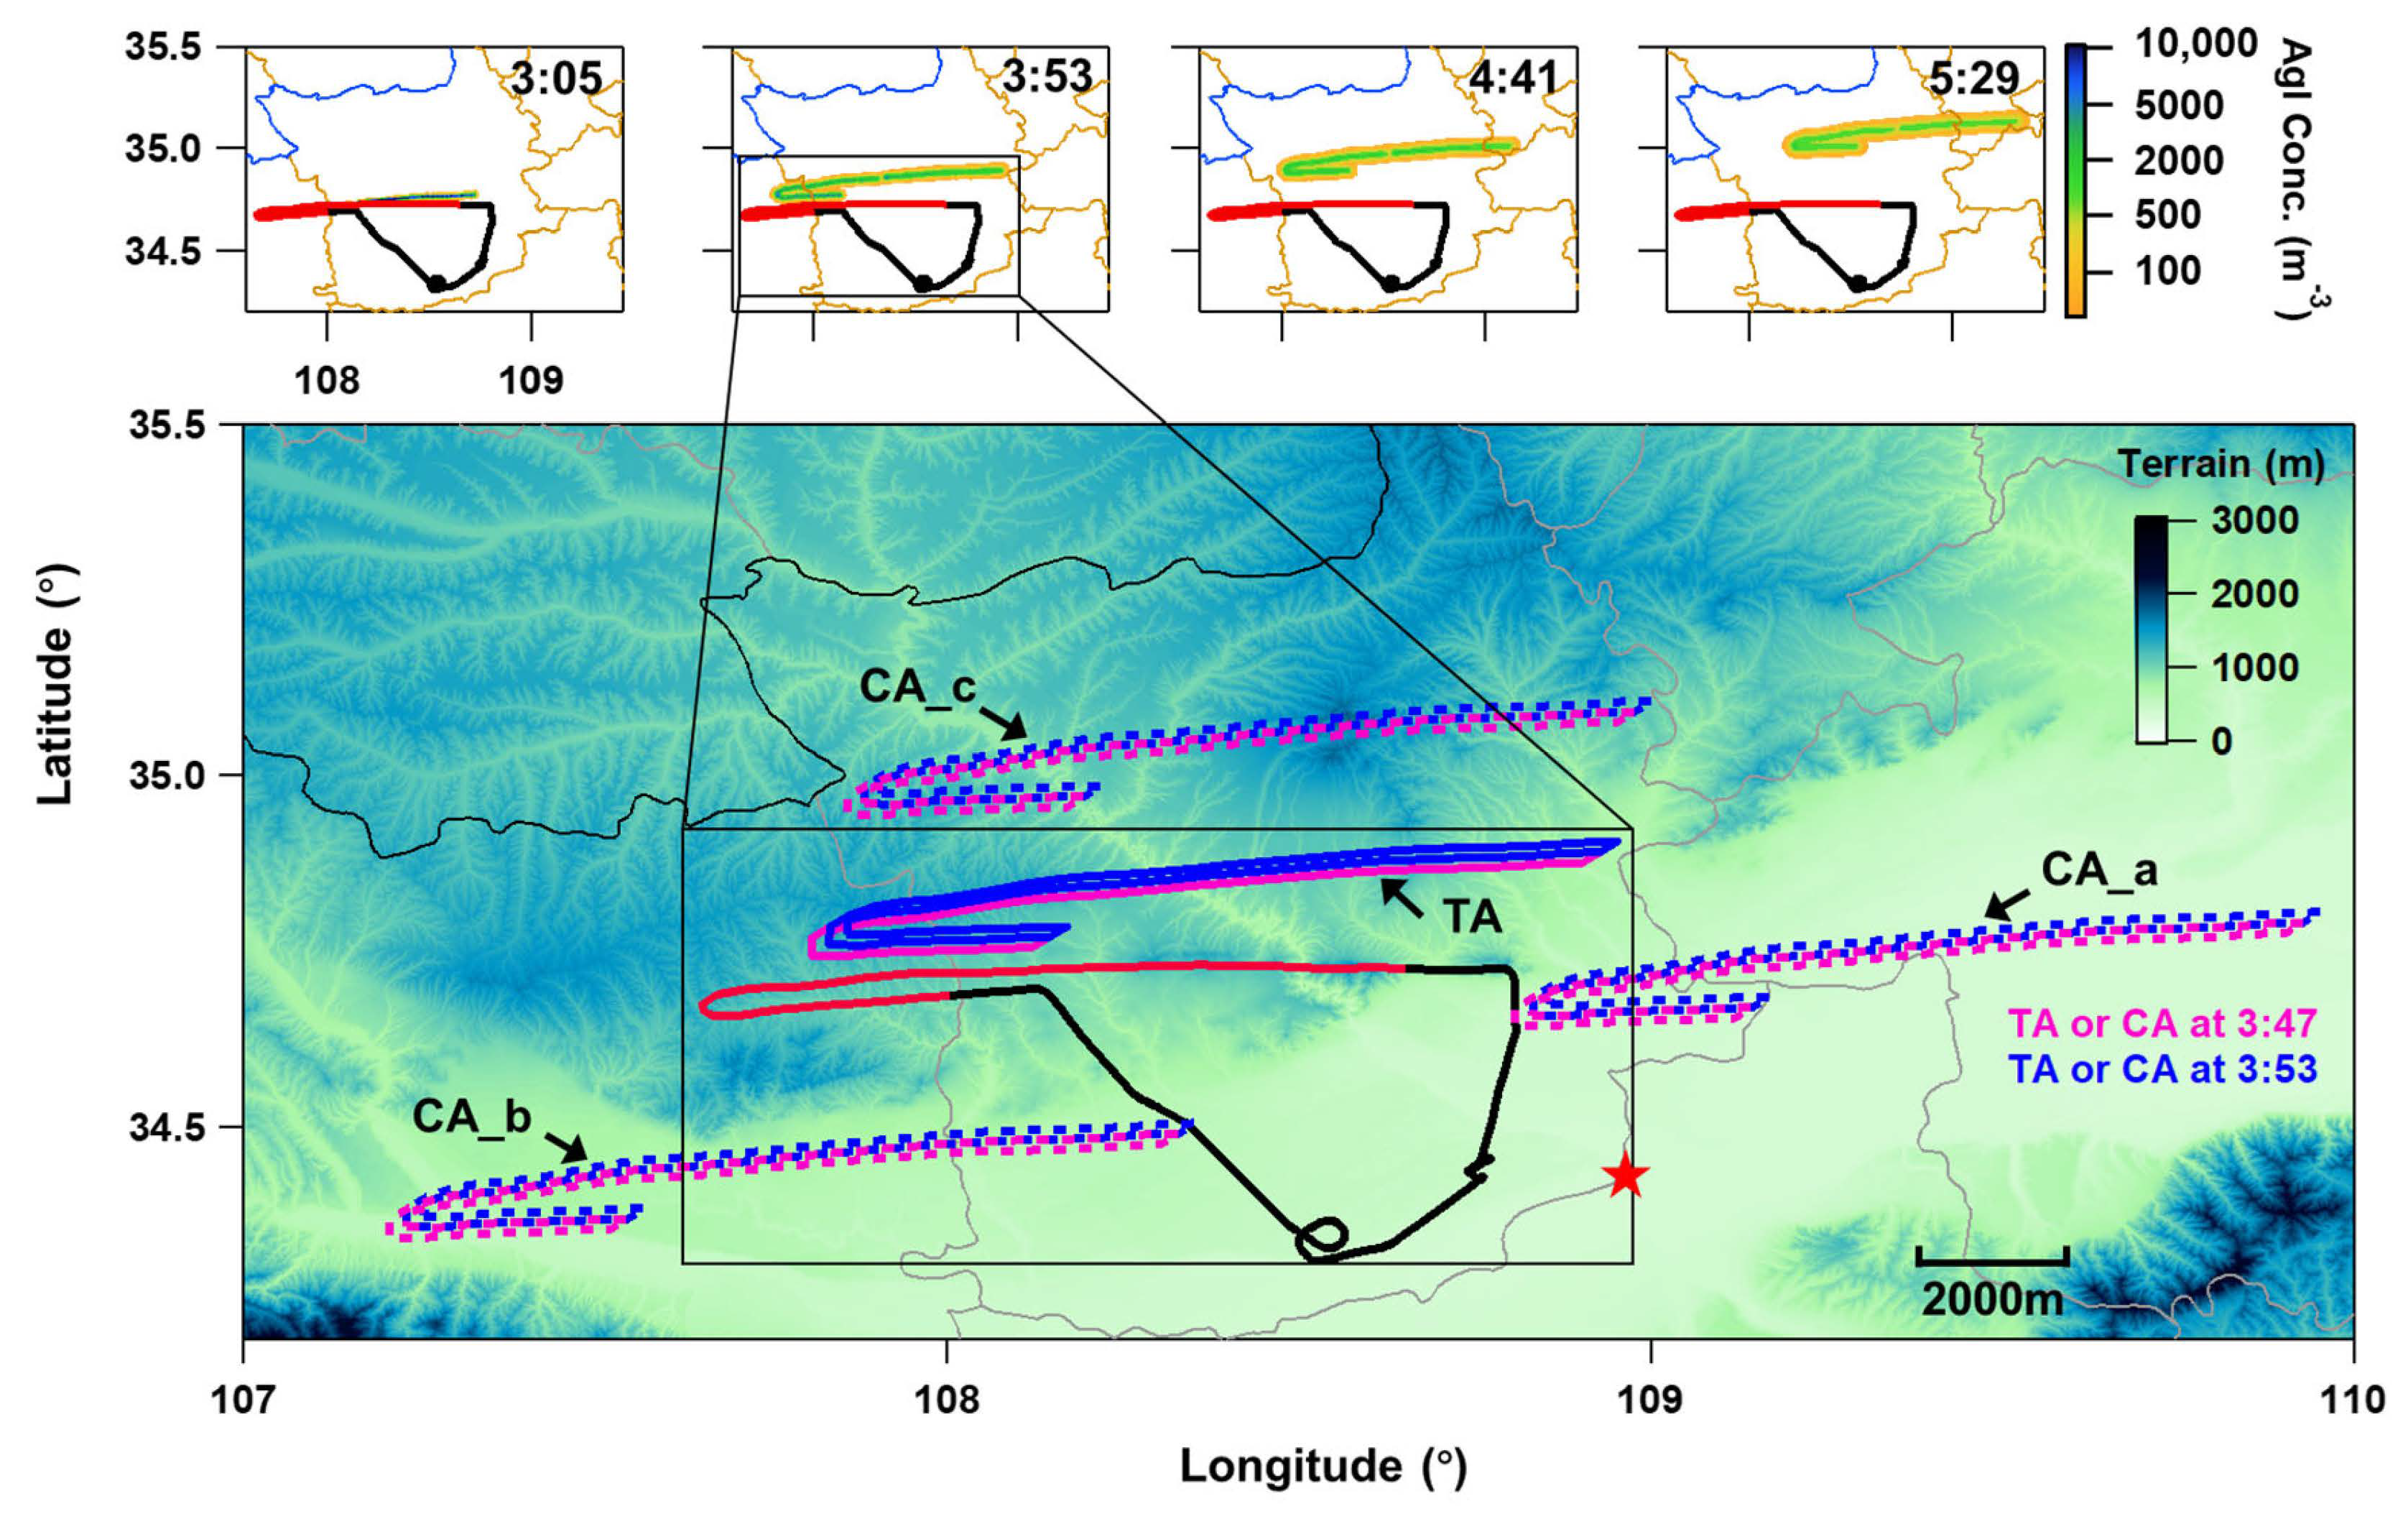
To better understand the multi-parameter dynamic comparison method, radar echo parameters from another cloud seeding case were selected for comparison (Figure 9). A Y-12 aircraft conducted cloud seeding above the western Guanzhong Basin in Shaanxi Province on 19 March 2017. Affected by an upper-level trough and a warm ridge flank, there was extensive stratocumulus over the cloud seeding region. A homogenous supercooled water cloud in the vicinity of the flight track was shown in the Moderate Resolution Imaging Spectroradiometer (MODIS) cloud type product (Figure S2). The CTH of the seeding region was ~4000 m, corresponding to an ambient temperature near −15 °C. The average altitude of the seeding leg was ~3900 m under a strong temperature inversion layer (3990~4328 m) near the cloud top. During the seeding period (2:41~3:14 UTC), about 750 g AgI aerosols were released with a rate of ~0.368 g s−1. The wind speed and direction of the seeding level were ~9 m s−1 and 239°, respectively, according to the sounding and satellite data. The spatial distribution of the AgI agent at 3:05, 3:53, 4:41, and 5:29 UTC was shown in Figure 10 (The diffusion coefficient is kH = 140 m2/s in this case). A detailed analysis of this case is described in previous research [6,36].
The cloud parameters in the cloud seeding region and its surrounding area are approximately homogenous and varied continuously (Figure S3). Therefore, in this study, we use the multi-parameter dynamic comparison method to evaluate the operation effect from another perspective by analyzing the radar data.
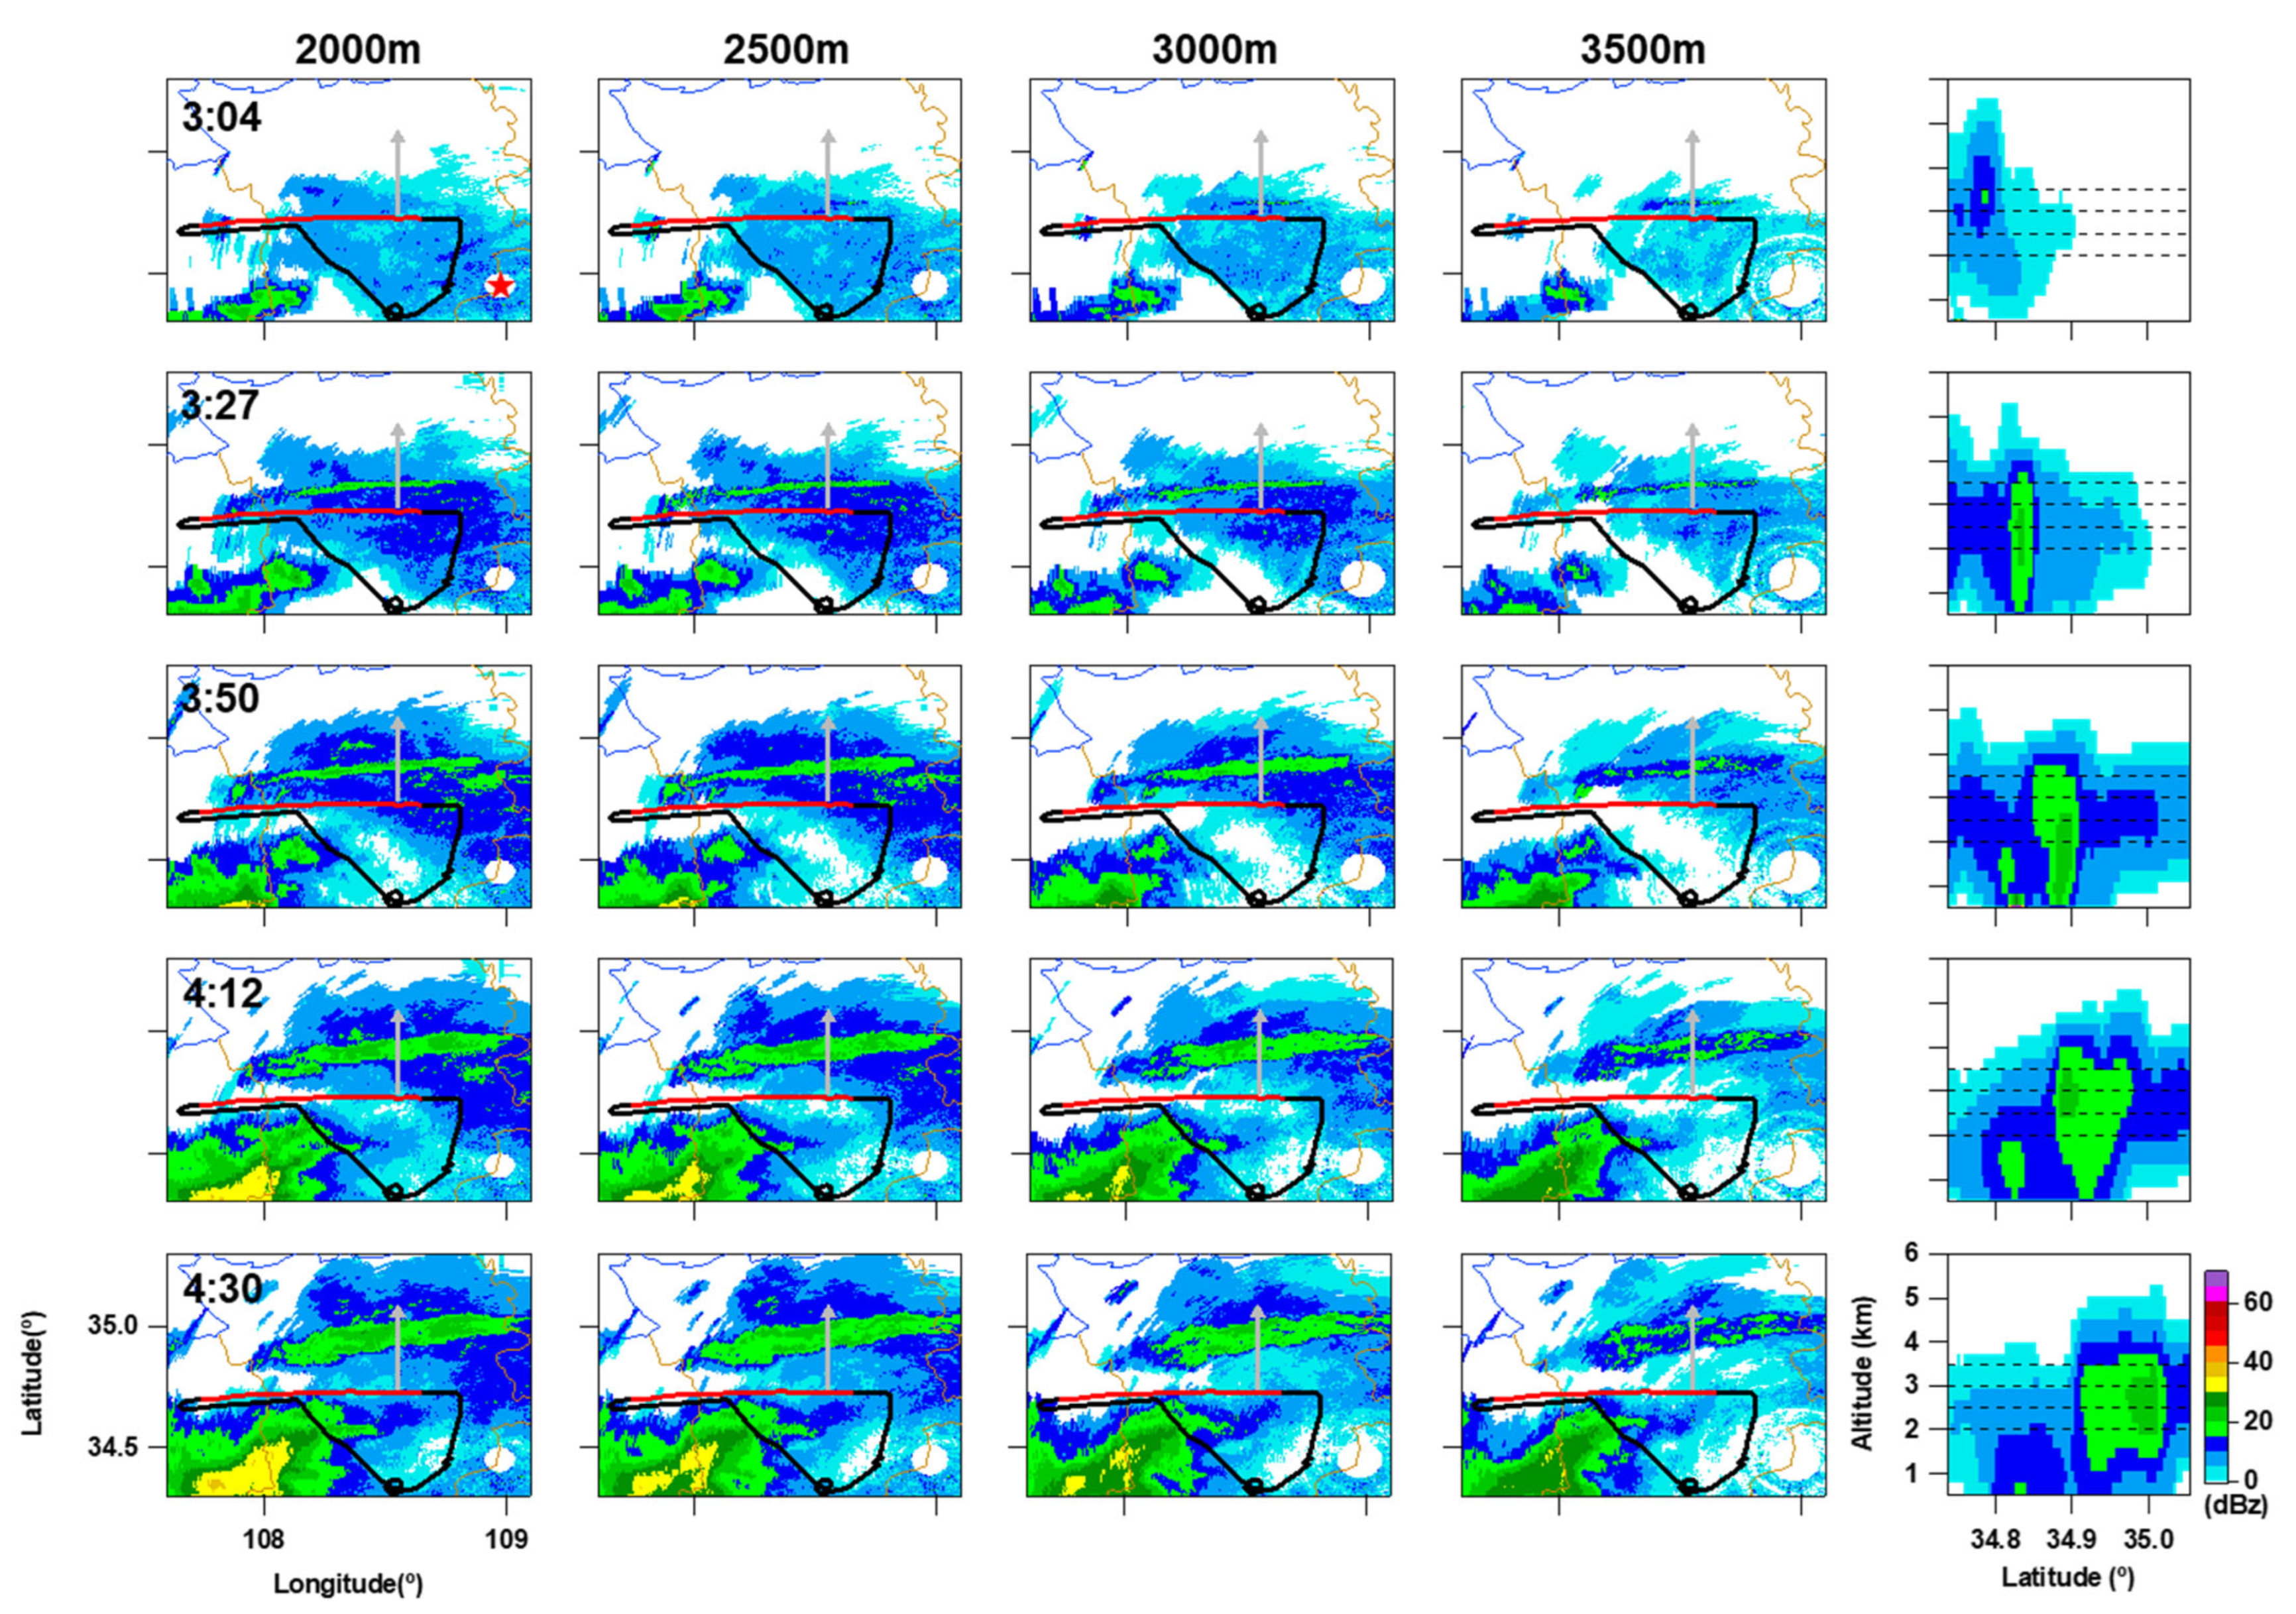
The radar constant altitude plan position indicator (CAPPI) from 2000 m to 3500 m with a 500 m interval at 3:04, 3:27, 3:50, 4:12, and 4:30 UTC was selected to show the evolutional seeded echo by using radar grid data (Figure 9). Quality control and data gridding were performed to ensure radar reflectivity spatial and temporal consistency [25,36]. As seen from Figure 9, a clear cloud seeding signature with reflectivity of 10~20 dBZ was initially recognized at 3:04 UTC on 3000~3500 m, then gradually extended as the AgI dispersed. The vertical cross-section (VCS) along the gray line in Figure 9 shows the seeded radar echo strong-developing vertically. The seeded echo then reached the surface at 3:27 UTC with a relatively homogeneous vertical distribution from ground to echo top. To better understand the cloud seeding effect by radar data, we take the 3000 m CAPPI and VCS of seeded echo, for instance, to track the seeding signature horizontally and vertically. The seeded echo moved with the prevailing wind and spatial extending accompanied by a background reflectivity increase (Figure S3c). Excluding background effects, it only takes ~22 min (at 03:04 UTC) for the reflectivity of seeded echo to increase from ~0 dBZ to ~20 dBZ. The width of seeded echo (>15 dBz) expended to ~15 km at 04:47 UTC. The seeded echo continued to move ~100 km to the northeast, and its width expanded to ~15 km at 04:47 UTC, then weakened and dissipated after 06:35 UTC [36].
The area of AgI plumes in two consecutive moments is defined as cloud seeding TA (see the preceding in Section 3.1) in this case study. For example, the outer edge enclosed by TA of 03:47 and 03:53 UTC is shown as cumulative TA in Figure 10. We calculated a time series of 3000 m averaged CAPPI and obtained the fractional contribution of every 5 dBz (from 0 to 30 dBz) to the total reflectivity in each TA (Figure 11a). CA was chosen randomly for comparison in the vicinity of TA (see the CA selection principles in Section 2.2.3; the minimal distance of a random CA to the TA is 10 km), and the parameters were calculated in the same method (Figure 11b). The time series of the TA mean reflectivity comparatively completely depicted the life history of seeded echo, which lasted at least for ~3.5 h. Despite the enhancement of echo reflectivity obtained in CA, this phenomenon is more pronounced in the TA. The mean reflectivity >20 dBz in the TA once exceeded 60%, which is rare in CAs. A similar conclusion can also be drawn from K variation and normalized K (to avoid background difference, we normalized the initiate K to 1), which was calculated by Equation (2).

3.1.3. Statistical Analysis of Multiple Operational Cloud Seeding Cases

Based on the analysis of the above two cases, we adopt the multi-parameter dynamic comparison approach to evaluate the stratus operational cloud seeding in Shaanxi from 2016 to 2018. There are 18 aircraft cloud seeding cases selected by analyzing the applicability of the approach, that is, the homogeneity of the background cloud. The TA and CAs were calculated based on the algorithm in Section 2.
The duration of cloud seeding is ~2 h on average, during which ~20 AgI flares were consumed in each operational flight (each flare contains ~125 g AgI dosage). According to the precipitation data, the hourly K values (from the initiation of cloud seeding to the fifth hour) were calculated by Equation (2). In this study, we define the first-hour rainfall as natural precipitation, which was not affected by cloud seeding, and the K value in the first hour is naturally taken as the background difference between the TA and CAs. After normalization, the K value variation at the subsequent time is considered as the difference between the TA and the CA, which is probably caused by cloud seeding. Therefore, the cloud seeding effect is calculated quantitatively. Detailed information about cloud seeding duration, AgI dosage, and the calculated hourly K values of each case are shown in Table 2.
Figure 12 shows the average hourly K variation since cloud seeding initiation. We take the K0~1h as the background difference between TA and CA. K1~2h, K2~3h, K3~4h, and K4~5h represent the difference in precipitation between TA and CA caused by cloud seeding. After normalization, the hourly K′ (defined as the initiate K normalized to 1) are 1, 1.06, 1.07, 1.08, and 0.99, respectively. Taking the average value K2~5h = 1.05 as the cloud seeding effect, it is estimated that the percentage of relative precipitation enhancement of these 18 cases is ~4.84%. The uncertainties probably include the homogeneity hypothesis of the seeding cloud, the error of TA calculation, and the selection of CAs, etc. However, this study provides a feasible scheme for batch calculation cloud seeding effect in operation.

3.2. Discussion

The effectiveness of cloud seeding includes direct effects, which refer to changes in cloud macro or micro parameters, and indirect effects, which refer to changes in surface precipitation. Many approaches and methodologies have been utilized to evaluate the cloud seeding effect, but quantitative and universal research is rare. Randomized statistical test was a common method in previous studies, but currently, most quantitative evaluations are achieved by numerical simulations. Recent studies have proposed a physical test evaluation approach based on a radar rainfall estimation algorithm [4,36], but it is mostly employed for typical cases that cannot be widely used. In this study, we propose a composite evaluation approach by analyzing two operational aircraft cloud seeding cases in stratus clouds. It mainly focuses on comparing the variation of physical parameters in TA and CA. The only difference is the physical parameters adopted in them. The first is radar reflectivity, and the second is hourly precipitation. Both of them have advantages and disadvantages. For example, as one of the direct effects, radar echo variation caused by cloud seeding is much easier observed and illustrated than that of surface precipitation, which is regarded as the indirect effect. In addition, radar data commonly have higher temporal resolution than rain gauge data. However, precipitation is an in situ observation and utilizing the quantitative variation of rainfall as a cloud seeding effect present to the public is more intuitive. This approach proposed by this study can be applied to qualitative analysis in a single aircraft cloud seeding operation and can also provide quantitative statistical results from multiple cloud seeding cases.
The proposed approach is of practical value in evaluating the operational cloud seeding, but it also has some uncertainties. For example, it must demonstrate the appropriateness of the approach by evaluating the spatial homogeneity and the temporal continuity of the target cloud. In addition, this study mainly focuses on the method of comparing the parameter variation in the TA and the CA, so the process of TA calculation and CA selection can also impact the final result. As an aspect of observational data, the temperature and wind of the cloud seeding layer were derived from the sounding data, and their uncertainties were probably related to the measurement accuracy or the spatial and temporal differences between sounding and cloud seeding. Radar and Precipitation data at target and control regions were obtained from rain gauge measurements, which were operated and maintained by the China Meteorological Administration and reserved to guarantee their availability.

4. Conclusions

The operational aircraft cloud seeding effect in a relatively homogeneous condition (such as stratus) was discussed by using a composite approach in this study. TAs and CAs were dynamically and approximately determined by calculating the seeding agent plumes based on Lagrangian methodology. Physical properties, such as radar reflectivity and precipitation, were quantified in the TA and CAs individually. Based on the identification of TAs and CAs, we proposed a multi-parameter dynamic comparison method by quantifying the enhanced (or weakened) radar reflectivity or precipitation. The cloud seeding effect was then studied by calculating the difference in parameter variation between the TA and CAs. This approach can be applied for qualitative analysis in a single aircraft cloud seeding operation and can also give a quantitative statistical result of multiple cloud seeding cases.
To testify to the feasibility of the multi-parameter dynamic comparison method, we selected two operational aircraft cloud seeding cases to study the cloud seeding effect from the perspective of radar parameters and precipitation, respectively. The distribution of satellite parameters and precipitation in the vicinity of the cloud seeding region was analyzed firstly to discuss the homogeneity of the seeding cloud as well as the feasibility of this approach. Hourly precipitation and radar reflectivity in CAs increased significantly during 2~4 h after cloud seeding initiation, especially in the third and fourth hour. In the case of 4 March 2018, 16 CAs were selected for comparison to discuss the impact of CA determination on the final evaluation result. The cloud seeding effect may have appeared in an hour after seeding initiation and probably lasted for 3~4 h. The correlation analysis of hourly precipitation variation between the TA and the CA helped to screen the CA for final comparison. More CAs in evaluation through this approach may also help to determine the cloud seeding effect. Radar reflectivity in the cloud seeding layer shows similar variation in the second case. Compared with three randomly chosen CA, the mean radar reflectivity, as well as the proportion of strong echo (>20 dBz) in TA, was significantly higher. The lifetime of the seeded echo was apparently longer than that of the surrounding unseeded echo.
Based on the qualitative evaluation of the two cases, we adopt this approach to analyze the cloud seeding effect of 18 cases. The ratio of hourly precipitation in TA and CA (defined as K in this study) continued increasing until the fourth hour since cloud seeding initiation. The first-hour precipitation is defined as the approximate background, which was not affected by cloud seeding. It is quantitively estimated that the percentage of relative precipitation enhancement of these 18 cases is ~4.84%. The homogeneity hypothesis of the seeding cloud, the error of TA calculation, and the selection of CAs are the major uncertainties probably in the evaluation of the cloud seeding effect by this approach.
The results of this study indicated that obtaining an explicitly and scientifically quantitative result in a single operational cloud seeding case is challenging and lacks proof of cloud seeding effectiveness in the classical sense. However, the analyses of multiple cases may suggest a long-term rainfall variation by seeding-induced in a specific area.

Supplementary Materials

The following supporting information can be downloaded at https://www.mdpi.com/article/10.3390/hydrology11100167/s1, Figure S1: Vertical profiles of temperature, dew-point temperature, relative humidity, wind speed and direction from radiosonde measurements at 00:00 UTC on 4 March 2018 at Jinghe and Aakang; Figure S2: Cloud type retrieval by MODIS (water or ice) and H8 (cloud classification) data at 3:20 UTC on 19 March 2017; Figure S3: Time series of COT, CTH from 2:00 to 6:00 UTC, and 3000 m CAPPI from 2:30 to 4:30 UTC in the vicinity of cloud seeding region (107~110° E, 34.2~35.5° N) in case 2 [37].

Author Contributions

Z.Y. and J.W. designed the aircraft campaign. F.W., B.C., D.L. (Dejun Li) and Z.Y. performed the experiments. F.W., Y.T., D.L. (Dawei Lin) and T.L. analyzed the airborne data. F.W., B.C. and Z.Y. wrote the paper. All authors have read and agreed to the published version of the manuscript.

Funding

This study was primarily supported by the CMA Innovative and Development Program (CXFZ2023J035), the Key Laboratory of Smart Earth (KF2023ZD03-05), the National Key Research and Development Program of China (2023YFD2302700), and the National Natural Science Foundation of China (42275085).

Data Availability Statement

The datasets used in this study are available at https://doi.org/10.5281/zenodo.8265127 (accessed on 1 August 2024).

Acknowledgments

The authors greatly appreciate the research team and the flight crew of Shaanxi Weather Modification Centre for their participation in the rain enhancement operation, and also thanks for the conceptualization work and suggestions from Yuquan Zhou. We acknowledge support from the CMA Key Innovation Team (CMA2022ZD10) and the WMC Innovation Team (WMC2023IT03). The reviewers are also gratefully acknowledged for their constructive comments.

Conflicts of Interest

The authors declare no conflicts of interest.

References

  1. Kerr, R.A. Cloud seeding: One success in 35 years. Science 1982, 217, 519–521. [Google Scholar] [CrossRef] [PubMed]
  2. Dennis, A.S. Weather modification by cloud seeding. Int. Geophys. Ser. 1980, 24, 195–202. [Google Scholar]
  3. Hobbs, P.V.; Lyons, J.H.; Locatelli, J.D.; Biswas, K.R.; Radke, L.F.; Weiss, R.R.; Rangno, A.L. Radar Detection of Cloud-Seeding Effects. Science 1981, 213, 1250–1252. [Google Scholar] [CrossRef] [PubMed]
  4. Friedrich, K.; Ikeda, K.; Tessendorf, S.A.; French, J.R.; Rauber, R.M.; Geerts, B.; Xue, L.; Rasmussen, R.M.; Blestrud, D.R.; Kunkel, M.L. Quantifying snowfall from orographic cloud seeding. Proc. Natl. Acad. Sci. USA 2020, 117, 5190–5195. [Google Scholar] [CrossRef]
  5. French, J.R.; Friedrich, K.; Tessendorf, S.A.; Rauber, R.M.; Geerts, B.; Rasmussen, R.M.; Xue, L.; Kunkel, M.L.; Blestrud, D.R. Precipitation formation from orographic cloud seeding. Proc. Natl. Acad. Sci. USA 2018, 115, 1168–1173. [Google Scholar] [CrossRef]
  6. Wang, J.; Yue, Z.; Rosenfeld, D.; Zhang, L.; Zhu, Y.; Dai, J.; Yu, X.; Li, J. The Evolution of an AgI Cloud-Seeding Track in Central China as Seen by a Combination of Radar, Satellite, and Disdrometer Observations. J. Geophys. Res. Atmos. 2021, 126, e2020JD033914. [Google Scholar] [CrossRef]
  7. Silverman, B.A. A critical assessment of glaciogenic seeding of convective clouds for rainfall enhancement. Bull. Am. Meteorol. Soc. 2001, 82, 903–924. [Google Scholar] [CrossRef]
  8. Silverman, B.A. A critical assessment of hygroscopic seeding of convective clouds for rainfall enhancement. Bull. Am. Meteorol. Soc. 2003, 84, 1219–1230. [Google Scholar] [CrossRef]
  9. Flossmann, A.I.; Manton, M.J.; Abshaev, A.; Bruintjet, R.; Murakami, M.; Prabhakaran, T.; Yao, Z. Peer Review Report on Global Precipitation Enhancement Activities; WMO: Geneva, Switzerland, 2018; pp. 113–115. [Google Scholar]
  10. Super, A.B. Silver iodide plume characteristics over the Bridger Mountain Range, Montana. J. Appl. Meteorol. Climatol. 1974, 13, 62–70. [Google Scholar] [CrossRef]
  11. Holroyd, E.W., III; McPartland, J.T.; Super, A.B. Observations of silver iodide plumes over the Grand Mesa of Colorado. J. Appl. Meteorol. Climatol. 1988, 27, 1125–1144. [Google Scholar] [CrossRef]
  12. Boe, B.A.; Heimbach, J.A., Jr.; Krauss, T.W.; Xue, L.; Chu, X.; McPartland, J.T. The dispersion of silver iodide particles from ground-based generators over complex terrain. Part I: Observations with acoustic ice nucleus counters. J. Appl. Meteorol. Climatol. 2014, 53, 1325–1341. [Google Scholar] [CrossRef]
  13. Reid, J.D. Studies of pollutant transport and turbulent dispersion over rugged mountainous terrain near Climax, Colorado. Atmos. Environ. 1979, 13, 23–28. [Google Scholar] [CrossRef]
  14. Li, Z.; Pitter, R. Numerical comparison of two ice crystal formation mechanisms on snowfall enhancement from ground-based aerosol generators. J. Appl. Meteorol. 1997, 36, 70–85. [Google Scholar] [CrossRef]
  15. Yu, X.; Dai, J.; Rosenfeld, D.; Lei, H.; Xu, X.; Fan, P.; Chen, Z. Comparison of Model-Predicted Transport and Diffusion of Seeding Material with NOAA Satellite-Observed Seeding Track in Supercooled Layer Clouds. J. Appl. Meteorol. 2005, 44, 749–759. [Google Scholar] [CrossRef]
  16. Hobbs, P.V. The nature of winter clouds and precipitation in the Cascade Mountains and their modification by artificial seeding. Part III: Case studies of the effects of seeding. J. Appl. Meteorol. Climatol. 1975, 14, 819–858. [Google Scholar] [CrossRef]
  17. Fisher, J.M.; Lytle, M.L.; Kunkel, M.L.; Blestrud, D.R.; Dawson, N.W.; Parkinson, S.K.; Edwards, R.; Benner, S.G. Assessment of Ground-Based and Aerial Cloud Seeding Using Trace Chemistry. Adv. Meteorol. 2018, 2018, 7293987. [Google Scholar] [CrossRef]
  18. Bruintjes, R.T.; Clark, T.L.; Hall, W.D. The dispersion of tracer plumes in mountainous regions in central Arizona: Comparisons between observations and modeling results. J. Appl. Meteorol. Climatol. 1995, 34, 971–988. [Google Scholar] [CrossRef]
  19. Friedrich, K.; French, J.R.; Tessendorf, S.A.; Hatt, M.; Weeks, C.; Rauber, R.M.; Geerts, B.; Xue, L.; Rasmussen, R.M.; Blestrud, D.R.; et al. Microphysical Characteristics and Evolution of Seeded Orographic Clouds. J. Appl. Meteorol. Climatol. 2021, 60, 909–934. [Google Scholar] [CrossRef]
  20. Li, D.; Zhao, C.; Li, P.; Liu, C.; Gong, D.; Liu, S.; Yuan, Z.; Chen, Y. Macro-and Micro-physical Characteristics of Different Parts of Mixed Convective-stratiform Clouds and Differences in Their Responses to Seeding. Adv. Atmos. Sci. 2022, 39, 2040–2055. [Google Scholar] [CrossRef]
  21. Chu, X.; Geerts, B.; Xue, L.; Rasmussen, R. Large-Eddy Simulations of the Impact of Ground-Based Glaciogenic Seeding on Shallow Orographic Convection: A Case Study. J. Appl. Meteorol. Climatol. 2017, 56, 69–84. [Google Scholar] [CrossRef]
  22. Jing, X.; Geerts, B.; Boe, B. The extra-area effect of orographic cloud seeding: Observational evidence of precipitation enhancement downwind of the target mountain. J. Appl. Meteorol. Climatol. 2016, 55, 1409–1424. [Google Scholar] [CrossRef]
  23. Pokharel, B.; Geerts, B.; Jing, X. The impact of ground-based glaciogenic seeding on clouds and precipitation over mountains: A case study of a shallow orographic cloud with large supercooled droplets. J. Geophys. Res. Atmos. 2015, 120, 6056–6079. [Google Scholar] [CrossRef]
  24. Rosenfeld, D.; Yu, X.; Dai, J. Satellite-Retrieved Microstructure of AgI Seeding Tracks in Supercooled Layer Clouds. J. Appl. Meteorol. 2005, 44, 760–767. [Google Scholar] [CrossRef]
  25. Wang, F.; Li, Z.; Jiang, Q.; Wang, G.; Jia, S.; Duan, J.; Zhou, Y. Evaluation of hygroscopic cloud seeding in liquid-water clouds: A feasibility study. Atmos. Chem. Phys. 2019, 19, 14967–14977. [Google Scholar] [CrossRef]
  26. Dong, X.; Zhao, C.; Huang, Z.; Mai, R.; Lv, F.; Xue, X.; Zhang, X.; Hou, S.; Yang, Y.; Yang, Y. Increase of precipitation by cloud seeding observed from a case study in November 2020 over Shijiazhuang, China. Atmos. Res. 2021, 262, 105766. [Google Scholar] [CrossRef]
  27. Dong, X.; Zhao, C.; Yang, Y.; Wang, Y.; Sun, Y.; Fan, R. Distinct Change of Supercooled Liquid Cloud Properties by Aerosols From an Aircraft-Based Seeding Experiment. Earth Space Sci. 2020, 7, e2020EA001196. [Google Scholar] [CrossRef]
  28. Woodley, W.L.; Rosenfeld, D. The development and testing of a new method to evaluate the operational cloud-seeding programs in Texas. J. Appl. Meteorol. 2004, 43, 249–263. [Google Scholar] [CrossRef]
  29. Manton, M.J.; Peace, A.D.; Kemsley, K.; Kenyon, S.; Speirs, J.C.; Warren, L.; Denholm, J. Further analysis of a snowfall enhancement project in the Snowy Mountains of Australia. Atmos. Res. 2017, 193, 192–203. [Google Scholar] [CrossRef]
  30. Silverman, B.A. An evaluation of eleven operational cloud seeding programs in the watersheds of the Sierra Nevada Mountains. Atmos. Res. 2010, 97, 526–539. [Google Scholar] [CrossRef]
  31. Xue, L.; Chu, X.; Rasmussen, R.; Breed, D.; Geerts, B. A case study of radar observations and WRF LES simulations of the impact of ground-based glaciogenic seeding on orographic clouds and precipitation. Part II: AgI Dispers. Seeding Signals Simulated By WRF. J. Appl. Meteorol. Climatol. 2016, 55, 445–464. [Google Scholar]
  32. Xue, L.; Weeks, C.; Chen, S.; Tessendorf, S.A.; Rasmussen, R.M.; Ikeda, K.; Kosovic, B.; Behringer, D.; French, J.R.; Friedrich, K.; et al. Comparison between Observed and Simulated AgI Seeding Impacts in a Well-Observed Case from the SNOWIE Field Program. J. Appl. Meteorol. Climatol. 2022, 61, 345–367. [Google Scholar] [CrossRef]
  33. Geresdi, I.; Xue, L.; Sarkadi, N.; Rasmussen, R. Evaluation of Orographic Cloud Seeding Using a Bin Microphysics Scheme: Three-Dimensional Simulation of Real Cases. J. Appl. Meteorol. Climatol. 2020, 59, 1537–1555. [Google Scholar] [CrossRef]
  34. Guo, X.; Fu, D.; Li, X.; Hu, Z.; Lei, H.; Xiao, H.; Hong, Y. Advances in cloud physics and weather modification in China. Adv. Atmos. Sci. 2015, 32, 230–249. [Google Scholar] [CrossRef]
  35. Zhou, Y.; Zhu, B. Study on Diffusion regularity and operation design of antiaircraft-gun, rocket and plane cloud seeing. Meteorol. Mon. 2014, 40, 965–980. (In Chinese) [Google Scholar]
  36. Yue, Z.; Yu, X.; Liu, G.; Wang, J.; Dai, J.; Li, J. Effect evaluation of an operational precipitation enhancement in cold clouds by aircraft. Acta Meteorol. Sin. 2021, 79, 853–863. [Google Scholar]
  37. Wang, J.; Rossow, W.B. Determination of cloud vertical structure from upper-air observations. J. Appl. Meteorol. 1995, 34, 2243–2258. [Google Scholar]
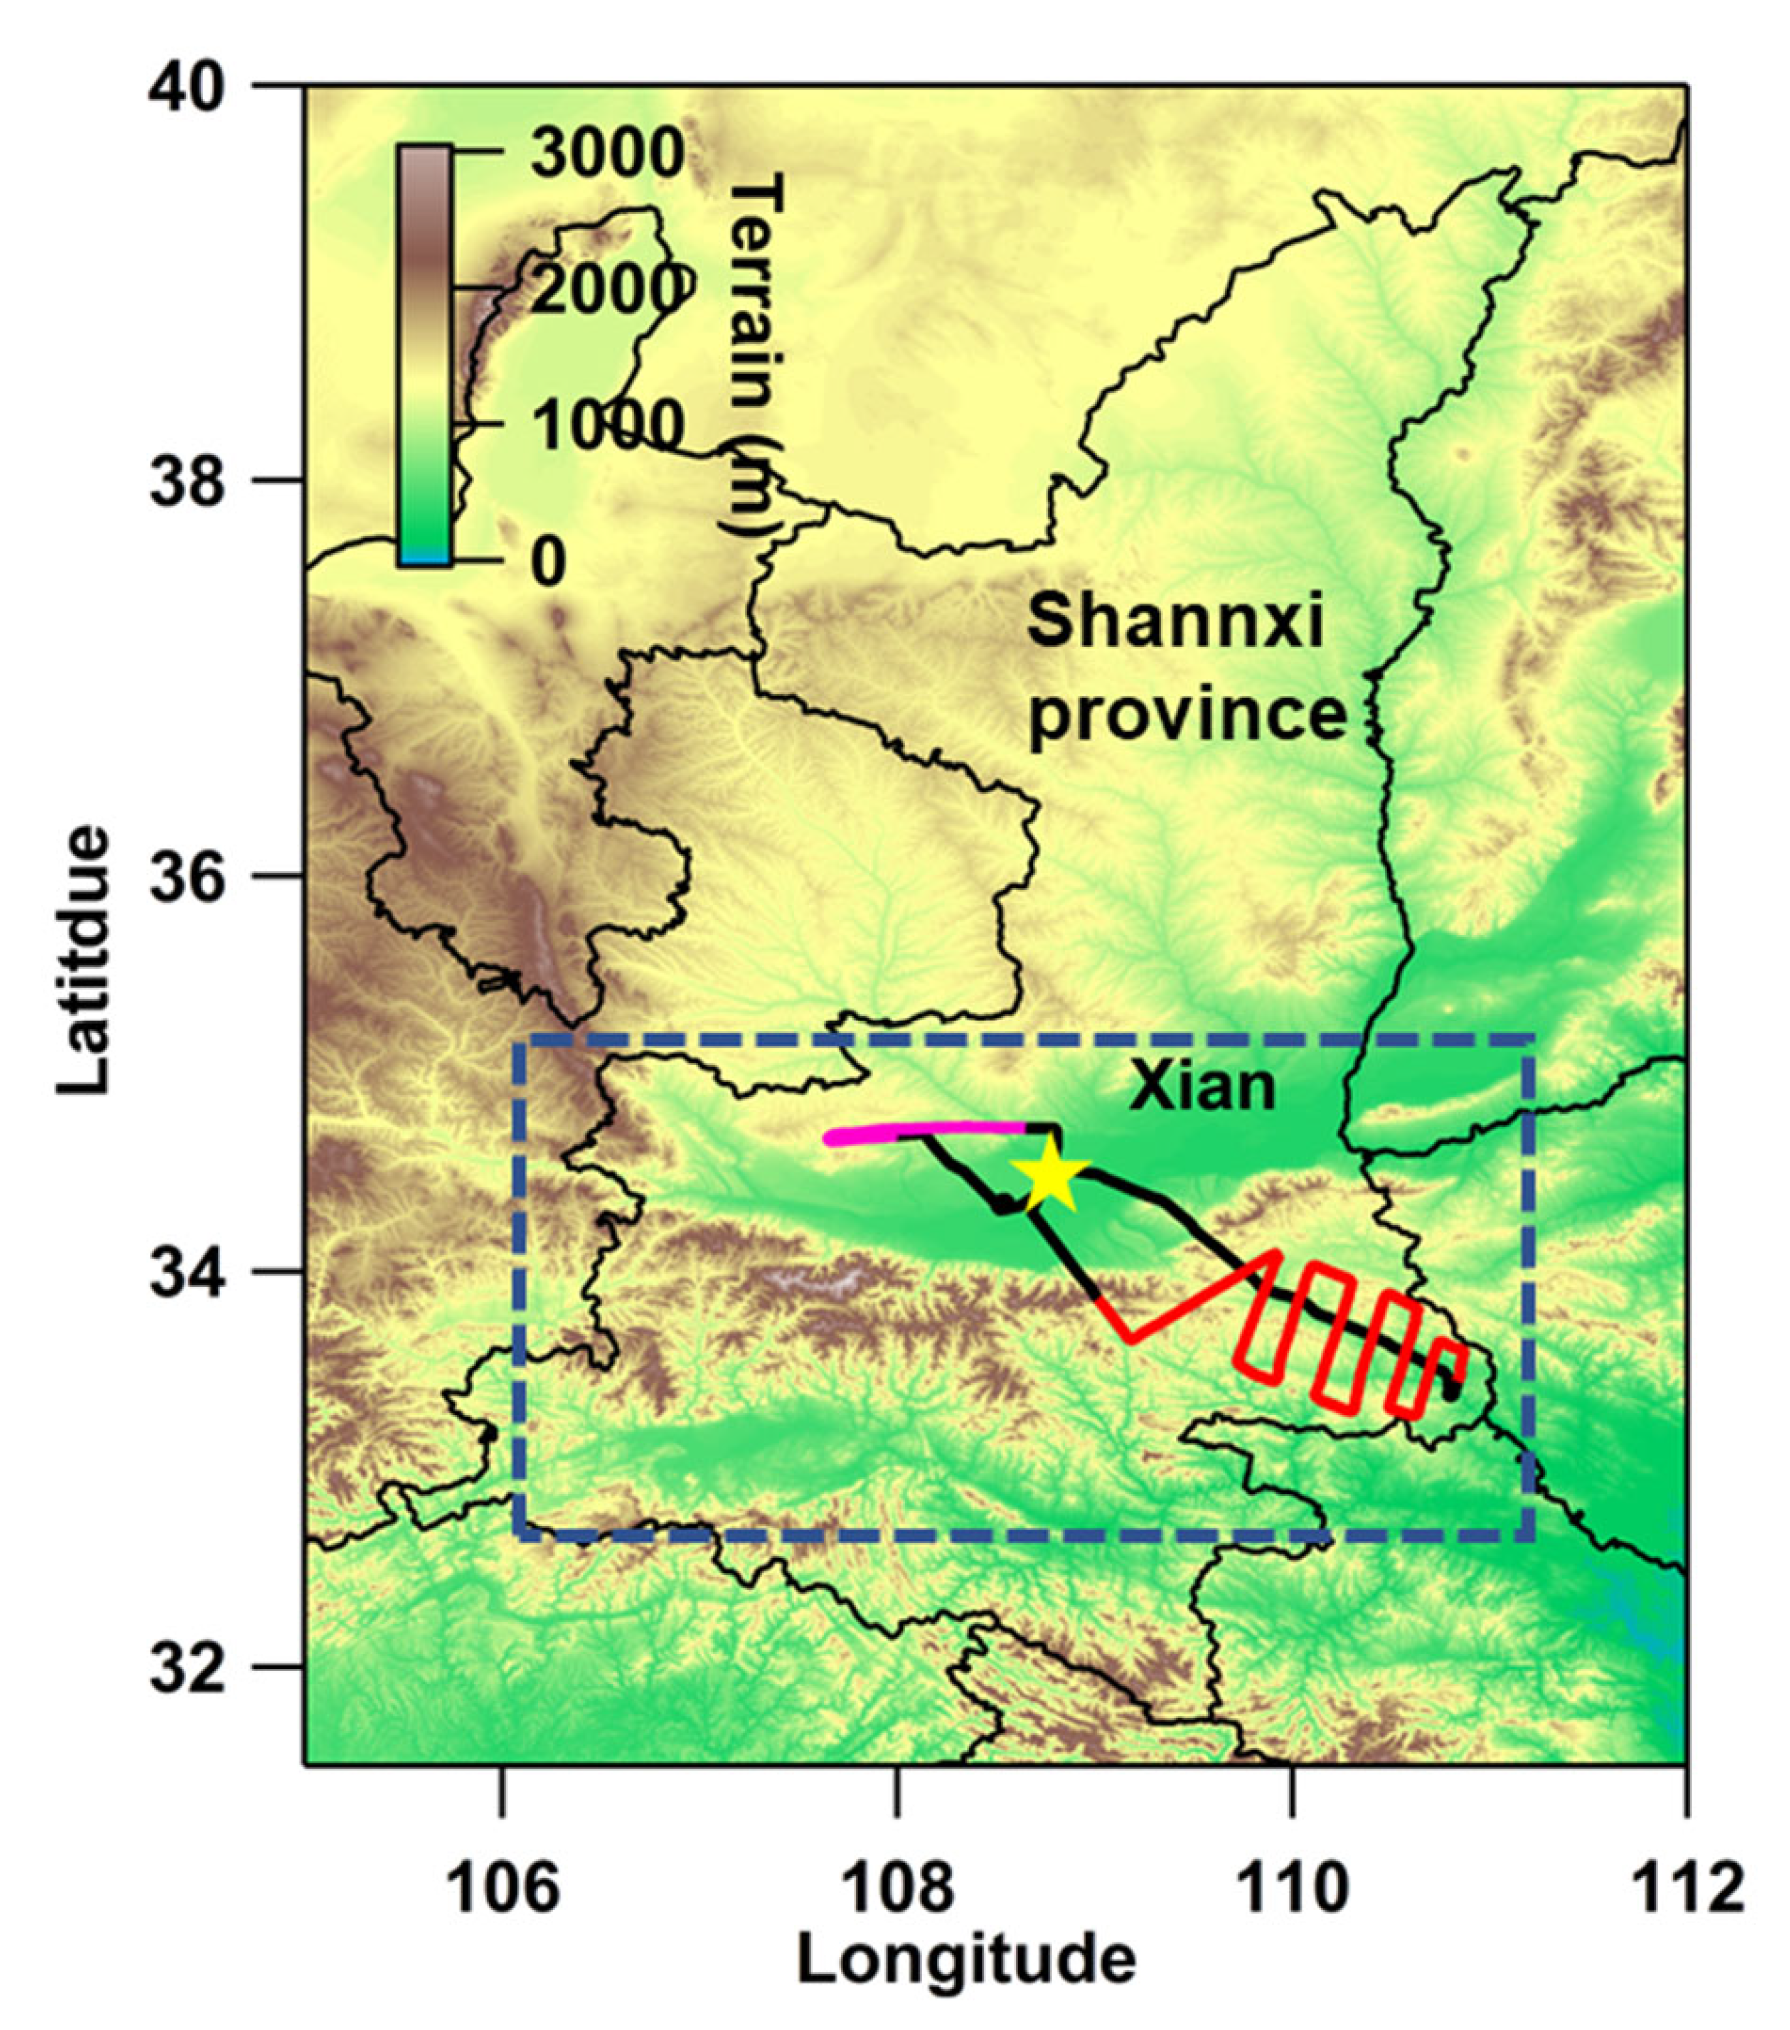
Figure 1. Terrain and the flight track of the study area (the dashed box is the regions of southern Shaanxi province. The red line indicates the seeded track of case_20180304, and the pink line indicates the seeded track of case_20170319, the yellow star shows the capital of Shaanxi province).
Hydrology 11 00167 g001
Figure 2. Flow chart of the multi-parameter dynamic comparison approach.
Hydrology 11 00167 g002
Figure 3. Spatial distribution of CTH (a) and COT (b,c) from Himawari-8 retrievals at 03:00 on 4 March 2018 (case 1). The solid line in the rectangles indicates the operational flight track.
Hydrology 11 00167 g003
Figure 4. Hourly distribution of AgI plumes since cloud seeding initiation in case 1 (0~5 h). The airborne cloud seeding was initiated at 03:30 UTC and lasted ~150 min. The red line indicates the seeded flight track, and the colored curve is the calculated AgI plume per hour since cloud seeding initiation.
Hydrology 11 00167 g004
Figure 5. Time series of COT (a), CTH (b) from 3:00 to 7:00 UTC, and surface precipitation (c) from 2:00 to 8:00 UTC in the vicinity of cloud seeding region (107~114° E, 32~36° N) in case 1. Shaded areas show the period of cloud seeding.
Hydrology 11 00167 g005
Figure 6. The TA illustrated by the fourth and fifth hours of AgI plumes (a) and the cumulative TA of every hour obtained by analogy (b). 5-h cumulative precipitation distribution, and the location of TA and 16 CA determined in case 1 (c). The orange line in (a,b) indicates the seeded flight track. The terrain in the vicinity of the cloud seeding region is also shown in (b). There are 2730 rain gauges homogeneously distributed in TA and CAs (refer to the dotted rectangle in (c), 106~115° E, 31~35° N).
Hydrology 11 00167 g006
Figure 7. The correlation relationship between the TA and 16 CAs calculated by hourly precipitation in case 1. Red stars indicate the correlation coefficient (R) > 0.8.
Hydrology 11 00167 g007
Figure 8. Histogram of hourly precipitation in the TA and 16 CAs in case 1. Spots and lines show the K value calculated by CAs selected in a rainfall upstream area (KCOR, with better correlation with TA, corresponding to CA_#1, CA_#5, and CA_#11), the surrounding TA (KARD, corresponding to CA_#2, CA_#3, CA_#7, and CA_#8), and all 16 regions (KALL).
Hydrology 11 00167 g008
Figure 9. Spatial and temporal variation of radar reflectivity caused by aircraft cloud seeding on 19 March 2017 (case 2). From top to bottom: reflectivity parameters at 3:04, 3:27, 3:50, 4:12, and 4:30 UTC. The left four columns: CAPPI at 2000 m, 2500 m, 3000 m, and 3500 m. The red line indicates the seeded flight track, and the red star in the first panel shows the Jinghe radar station (108.97° E, 34.45° N, 410 m above sea level). The rightmost columns are the vertical cross-section of the cloud seeding echo (along the gray arrows in the left columns).
Hydrology 11 00167 g009
Figure 10. Schematic diagrams showing TA and CAs determination in case 2. The top panels are the spatial distribution of AgI plumes at 3:05, 3:53, 4:41, and 5:29 UTC. The bottom panel is TA, and three random CAs are discussed in this study. The red line indicates the seeded flight track. The terrain around the cloud seeding region and the radar (red star) used in this study are also shown.
Hydrology 11 00167 g010
Figure 11. Time series of 3000 m averaged CAPPI and the fractional contribution of every 5 dBz (from 0 to 30 dBz) to the total reflectivity in TA (a) and CA (b). The parameters in b represent an averaged value of CA_a, CA_b, and CA_c. The time series of K and normalized K were also shown in (c). Shaded areas show the period of cloud seeding.
Hydrology 11 00167 g011
Figure 12. Averaged hourly K and normalized K variation of 20 operational aircraft cloud seeding cases discussed in this study (left panel). The right panel shows the increment of normalized K from the first hour to 2~5 h since cloud seeding initiation.
Hydrology 11 00167 g012
Table 1. Statistics describing COT, CTH, and precipitation distribution in the vicinity of cloud seeding region (107~114° E, 32~36° N) from 3:00 to 7:00 UTC on 4 March 2018.
VariablesMeanSDEVRMSEMREMDB
COT65.336.465.98.45%−0.47
CTH (km)6.893.20.647.41%0.1
Precipitation (mm)0.640.180.1823.7%0.07
Table 2. Detail information of operational aircraft cloud seeding and corresponding hourly K value since cloud seeding initiation.
DateFlight Time
(UTC)
AgI Dosage
(g)
K Value Since Cloud Seeding Initiation
0~1 h1~2 h2~3 h3~4 h4~5 hMean
2016091801:00~04:3625000.30.30.80.90.30.58
2016102205:15~07:2525000.910.81.2511.01
2016102301:06~04:1525000.50.70.40.50.20.45
2016102704:57~07:29250010.70.610.60.73
2016101202:08~05:102500 0.071.71.20.80.94
06:23~08:5625000.51.10.80.140.110.54
2017031208:25~10:2625000.51.50.861.62.11.52
2017032302:40~06:2325003.22.20.282.40.81.42
2017040901:09~04:3125001.41.41.311.91.40
2017050301:05~04:3025001.891.621.852.062.151.92
2017052205:12~08:0925002.762.671.791.021.31.70
2017090401:36~04:2325000.70.60.60.90.80.73
2018030402:29~07:3125001.41.81.81.40.91.48
2018041205:55~09:172500 3.65.23.13.13.75
2018050601:41~03:5725001.31.10.60.51.20.85
05:12~08:3025000.90.81.31.10.81.00
2018051002:15~05:5825000.60.61.222.31.53
07:17~10:5525001.20.9110.90.95
Disclaimer/Publisher’s Note: The statements, opinions and data contained in all publications are solely those of the individual author(s) and contributor(s) and not of MDPI and/or the editor(s). MDPI and/or the editor(s) disclaim responsibility for any injury to people or property resulting from any ideas, methods, instructions or products referred to in the content.