Article

A Long-Term Evaluation of the Ecohydrological Regime in a Semiarid Basin: A Case Study of the Huangshui River in the Yellow River Basin, China

by
Lijuan Fan
1,2,
Lanxin Liu
3,
Jing Hu
3,
Fen Zhao
4,
Chunhui Li
3,* and
Yujun Yi
3
1
Qinghai Provincial Key Laboratory of Physical Geography and Environmental Process, College of Geographical Science, Qinghai Normal University, Xining 810008, China
2
Haidong Municipal Water Resources Bureau of Qinghai Province, Haidong 810600, China
3
Key Laboratory for Water and Sediment Sciences of Ministry of Education, School of Environment, Beijing Normal University, Beijing 100086, China
4
School of Resources and Environmental Engineering, Ludong University, Yantai 264025, China
*
Author to whom correspondence should be addressed.
Hydrology 2024, 11(10), 168; https://doi.org/10.3390/hydrology11100168
Submission received: 3 September 2024 / Revised: 30 September 2024 / Accepted: 9 October 2024 / Published: 10 October 2024

Abstract

:
This study aimed to evaluate the ecohydrological regime and ecological water demand of the Huangshui River Basin under changing environmental conditions, seeking to safeguard its ecosystem. Based on monthly data spanning from 1956 to 2016, the ecohydrological regimes of the Huangshui River and the Datong River were evaluated using methods such as the Pettitt mutation test, the Tennant method, and ecological deficit and surplus analyses. The data were mainly obtained from Xiangtang Station of the Datong River and Minhe Station of the Huangshui River. The results showed the following. (1) The most abrupt increase in measured runoff at Xiangtang Station occurred in 1993, while the point of abrupt change in measured runoff at Minhe Station occurred in 1990. (2) Following an increase in human activities, changes in the ecological surplus at Xiangtang Station were negative in January, April to May, July, and from September to November, while the changes in the ecological deficit were positive from January to April, July to August, and October to December. Changes in the ecological surplus at Minhe Station were negative from March to July and from September to December, while changes in the ecological deficit were positive from January to April and from July to December. (3) The annual average ecological flow of the Datong River, Xiangtang section, was 28.42 m3/s, and the annual average ecological water demand was 896 million m3. The annual average ecological flow of the Minhe section was 19.98 m3/s, and the annual average ecological water demand was 631 million m3. According to a calculation of the degree of ecological water demand and ecological flow satisfaction, prior to the implementation of the Water Diversion Project from the Datong River to Huangshui River, the water volumes in both rivers were generally sufficient to meet the ecological water demand. However, high water consumption during the irrigation period led to an ecological deficit. To address these issues, it is crucial to evaluate the potential impacts of human activities, such as water diversion projects, on river ecological flow. Recommendations include expediting the Water Diversion Project from the Yellow River to Xining to secure sufficient water flow in the Huangshui River and enhancing water conservation efforts in agricultural irrigation.

1. Introduction

Climate change and increased human activities have led to a decline in river runoff worldwide, posing significant challenges for water resource management and ecological development [1]. Activities such as agricultural irrigation, the construction of water conservancy projects, and changes in land use can cause considerable hydrological variations [2,3].
Human activities significantly impact rivers, leading to considerable changes in hydrological conditions. Traditional methods for evaluating hydrologic alteration, such as the indicators of hydrologic alteration (IHA) and range of variability approach (RVA), mainly rely on the number of IHA index values within a target range obtained before interference [4]. Vogel et al. [5,6] introduced a dimensionally normalized ecological runoff index based on the flow–duration curve (FDC) using two dimensionless indicators: ecological surplus (ES) and ecological deficit (ED). These indicators assess hydrological regime changes in river ecosystems by representing the excess or deficiency in river runoff relative to the protected area. Gao et al. [7] further refined this method by defining the ecological surplus and deficit thresholds using the 75th and 25th percentile FDCs, respectively, rather than relying on the median FDC before mutation. This approach offers a clear conceptual framework and requires fewer indicators. It can be applied at various time scales (monthly, quarterly, or annually) and effectively reflects the overall impact of flow regulation during the specified period. This method provides a better description of changes in hydrological conditions and has been widely adopted by researchers [8,9,10,11,12].
Ensuring ecological flow is crucial for maintaining a healthy aquatic ecosystem amidst changes in river hydrological conditions. Often, the actual runoff of rivers falls short of meeting theoretical ecological water demands. To determine the degree to which the ecological water demand is met, it is essential to analyze the ecological water demand guarantee rate [13] and explore the trends and causes of river hydrological changes [8]. Ecological water demand is influenced by the natural attributes of the ecosystem, including its internal structure, external environment, and resource conditions. This demand exhibits characteristics such as dynamic orientation, target orientation, threshold orientation, and spatiotemporal variability. The numerical value of ecological water demand fluctuates within a specific threshold range. If the flow rate remains within this threshold, the ecosystem can sustain its health. However, if it falls outside this range, ecosystem health may be compromised [14,15,16]. The ecological water demand of rivers can be assessed based on factors such as river ecosystem characteristics, protected species, and natural hydrological conditions [17]. Common methods for determining ecological water demand include habitat simulation techniques such as the instant flow incremental methodology (IFIM) [18], hydraulic methods such as the wet perimeter method [19], and hydrological methods such as the Tennant method [20], the 7Q10 method [21], and the holistic approach framework [22]. Among these, hydrological methods are particularly favored by water resource management departments due to their efficiency in terms of time, labor, and cost. Consequently, they are the most widely used for assessing ecological water demand [17].
Fish habitats rely on continuous changes in water flow over many years, and fish encounter corresponding habitat conditions while adapting to the natural fluctuations in water flow in their habitats [23]. Triplophysa siluroides, Gymnodiptychus pachycheilus, Gymnocypris eckloni, and Schizopygopsis pylzovi are key protected species in the Huangshui River and are listed on the Red List of Chinese Species. As a semiarid area, ensuring the ecological water demand is met for key species in the Huangshui River is crucial. Due to high population density and industrial development in the Huangshui River Basin, previous water resource allocations have often failed to fully meet ecological water needs. This has led to the encroachment of ecological water into some rivers and issues of ecological water shortage. Currently, the main agricultural areas in certain tributaries of the Huangshui River Basin require substantial amounts of water for irrigation from April to June, but the inflow is insufficient to meet this demand. This has resulted in a significant mismatch between water supply and demand, with agricultural water use and other factors further reducing the river’s ecological water availability. The Water Diversion Project from the Datong River to the Huangshui River undertook a successful trial operation of the main canal at the end of 2015. By September 2023, the main canal projects in northwestern China had also been successfully inaugurated. In recent years, there has been a gradual increase in water diversion projects, such as the planned construction of the Water Diversion Project from the Yellow River to Xining in the Huangshui River Basin. To ensure the stability of river ecosystems, it is essential to closely monitor the hydrological changes and ecological flow of the Datong and Huangshui rivers under the influence of these engineering projects. Several scholars have investigated the ecological water demand of the Huangshui River. Zhang et al. [24] analyzed current runoff, cross sections, and pollution sources employing three methods: the average value of the driest month at different frequencies, an improved same frequency distribution method within the year, and the ecological hydraulic radius method, used to calculate ecological flow in the Xining section of the Huangshui River. Liu et al. [25] examined the ecological water demand of 20 tributaries of the Huangshui River and proposed a method for calculating ecological water demand in river channels. Sha et al. [26] used the GAMS system to allocate and optimize water resources in the area receiving water from the Diversion Project, considering both supply–demand balance and ecological water needs. While these studies provide valuable insights, they tend to approach the issue from a single perspective. This study integrates analyses of hydrological changes, ecological surplus/deficit, and ecological water demand, which is mainly based on the analysis of measured runoff and natural runoff data sequences. Measured runoff refers to the amount of water that passes through a certain cross section of a river during a certain period of time. Natural runoff refers to the amount of water that has been reverted from the measured river runoff, which generally refers to the measured runoff plus the utilization of water above the measured cross section. By comparing and analyzing the measured runoff and natural runoff, we can provide a comprehensive evaluation of the impacts of human activities and climate change on ecological flow. This approach aims to offer scientific support for watershed ecological protection in northwest China.
Therefore, this study aimed to analyze both natural and measured hydrological data for the Datong and Huangshui rivers from 1956 to 2016 and to evaluate the ecohydrological regime using two methods: the Tennant method and the ecological surplus and deficit method. The specific objectives were as follows: (1) examine the characteristics of runoff changes at major stations along the Huangshui River; (2) calculate the ecological surplus/deficit, ecological water demand, and ecological flow guarantee rate; and (3) propose appropriate measures for ensuring ecological flow to provide a theoretical basis for the ecological protection of the Huangshui River. Additionally, recommendations are provided to support decision-makers in basin ecological protection efforts.

2. Study Area

The main tributary of the upper stream of the Yellow River is the Huangshui River, while the largest tributary of the Huangshui River is the Datong River. It has gradually shifted from the west to the east, exiting Qinghai Province and entering Gansu Province at Minhe station. The watershed area under the jurisdiction of the Minhe Hydrological Control Station is 15,342 km2. The Datong River empties into the Huangshui River. The watershed area under the jurisdiction of the Xiangtang Hydrological Control Station is 15,126 km2. The Huangshui River Basin is the main agricultural area in the northeast of Qinghai Province, consisting of the Huangshui’s main stream area and the Datong River Basin. The Huangshui Valley in the central and southeastern parts of the basin has relatively high temperatures, low-lying terrain, and fertile land, which make it suitable for the development of agriculture and animal husbandry. The Huangshui River Basin features a semiarid plateau continental climate. This place experiences low temperatures and little rainfall throughout the year, with strong solar radiation. This study mainly focused on Minhe Station on the Huangshui River and Xiangtang Station on the Datong River (Figure 1). Minhe Station is located at 102°48′ E longitude and 36°20′ N latitude. It is the main control station for the Huangshui River. Xiangtang Station is located at 102°50′ E longitude and 36°21′ N latitude. It is the main control station for the Datong River. They are both national principal hydrometric stations that measure and report hydrological data such as runoff and sediment, as well as meteorological data such as rainfall and temperature according to national standard methods. This study mainly analyzed runoff and rainfall data measured by the two hydrological stations from 1956 to 2016.
According to the Qinghai Province Planning Report on Water Diversion Project from Datong River to Huangshui River, the project is expected to divert 750 million m3 of water overall by 2030. The Water Resources Planning Institute has evaluated and approved the Comprehensive Plan for the Huangshui River Basin (General Water Regulations [2014] no. 1182), which states that the Water Diversion Project from the Datong River to the Huangshui River will transfer 600 million m3 of water by 2030. The diversion of water from the Datong River affects the ecological water requirements of both the Datong and Huangshui rivers’ main streams. The Water Diversion Project from the Yellow River to Xining diverts water from the main stream of the Yellow River to the Xining and Haidong areas of the Huangshui River Basin. The preliminary determination of the project is that the water intake will be about 560 million m3 in 2030 and about 960 million m3 in 2040. The implementation of this project will greatly improve the water shortage problem in the Huangshui River Basin.

3. Methods

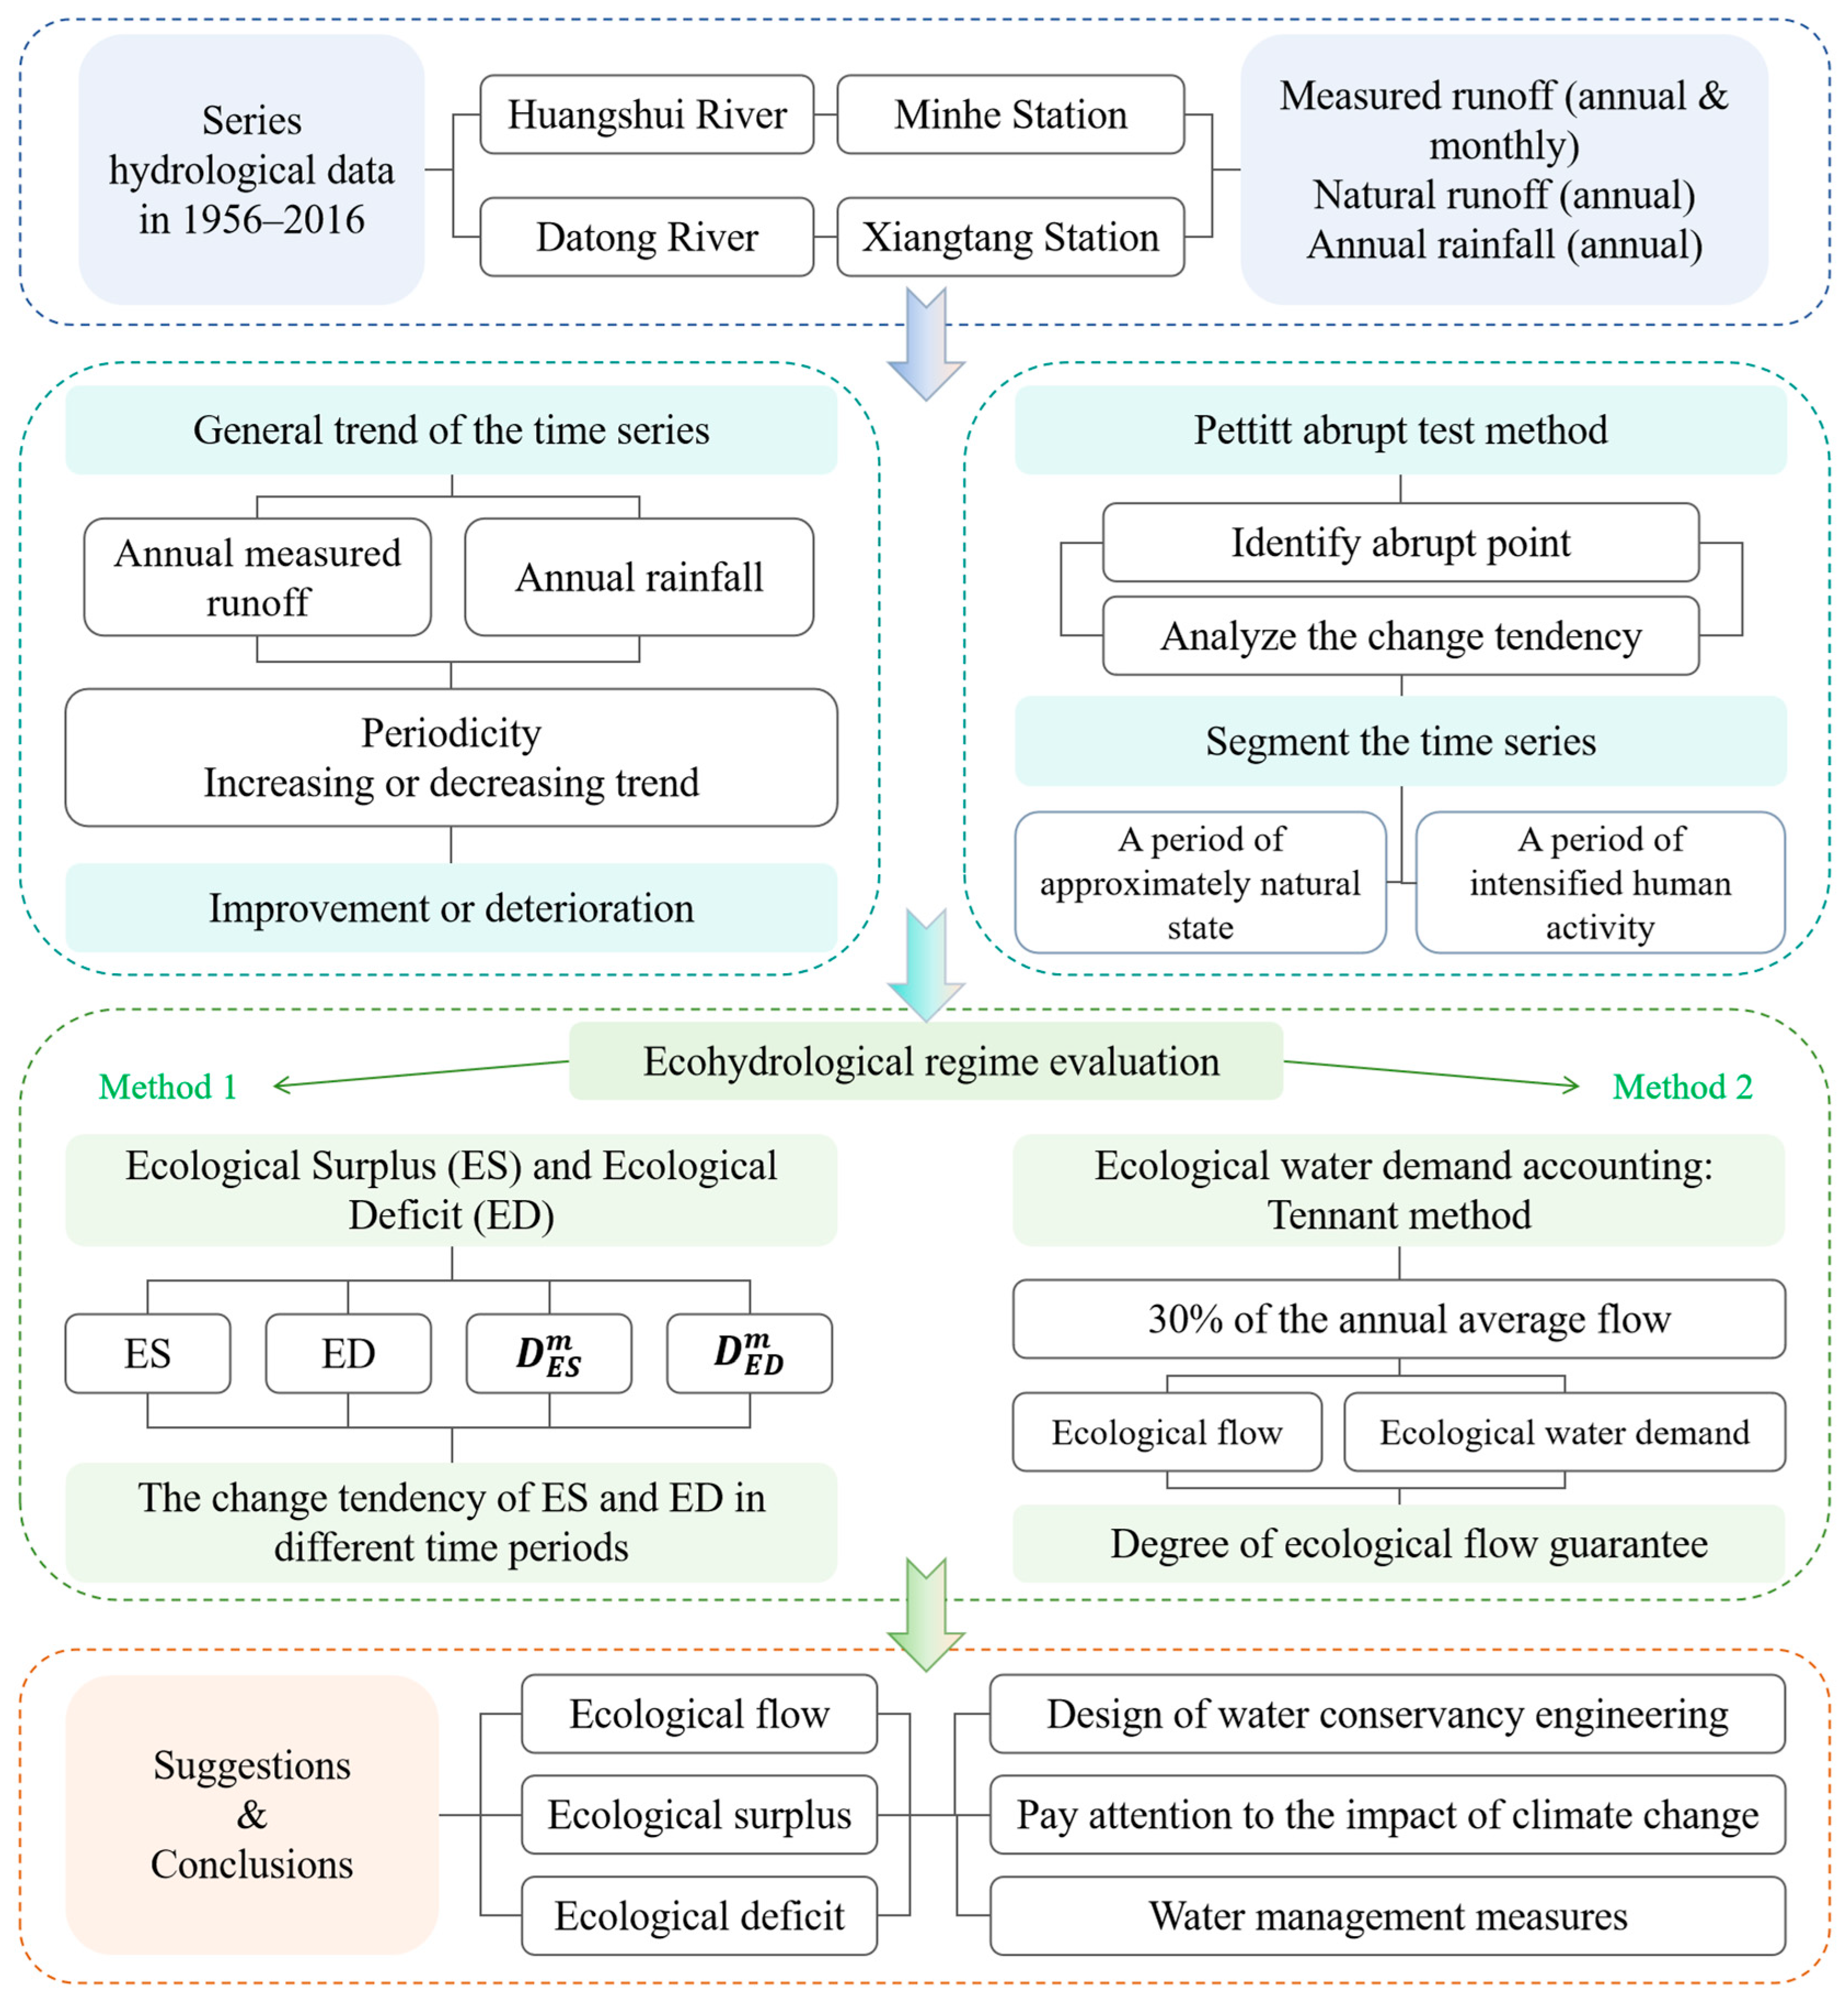
In this research, we analyzed the characteristics of runoff changes at major stations along the Huangshui River using data from 1956 to 2016. The Pettitt test was employed to detect abrupt changes in runoff. Subsequently, we evaluated the ecohydrological regime utilizing two approaches: calculating the ecohydrological condition through the ecological surplus/deficit method and assessing the ecological water demand and ecological flow guarantee rate via the Tennant method. Finally, we propose appropriate measures to ensure ecological flow, providing a theoretical basis for the ecological protection of the Huangshui River.
The analytical framework for this study is shown in Figure 2.

3.1. Pettitt Abrupt Test Method

The trend of and abrupt changes in runoff in the Huangshui River were identified using the Pettitt abrupt test. The Pettitt test is a commonly used non-parametric method for detecting abrupt changes in time series data that is particularly useful when the data distribution is unknown.
To identify abrupt points in long-term time series data, researchers frequently employ the Pettitt method, a reliable and effective non-parametric testing technique [27]. Because it does not rely on presumptions regarding data distribution, including variance stability or a normal distribution, it is very flexible when handling different types of time series data. It is popular because it can efficiently identify abrupt spots and is not dependent on the duration of the time series [28,29].
The null hypothesis H0 is that there is no abrupt at t in the long-term sequence. The alternative hypothesis H1 is that there is an abrupt change at t in the long-term sequence. Assuming that the initial time series featured an abrupt point xt, the time series X = (x1, …, xn) with n samples is split into two parts: x1, x2, …, xt and xt+1, xt+2, …, xn. We determine its Ut,n statistic via the following:
U t , n = U t 1 , n + j = 1 n s g n x t x j , t 2 , n
where sgn(·) is a sign function, specifically defined as follows:
s g n ( x j x k ) = 1 ( x j x k ) > 0 0 ( x j x k ) = 0 1 ( x j x k ) < 0
We define the statistic Kt for the time t, at which the abrupt point is most likely to occur:
K t = m a x | U t , n |   1 t n
We then calculate its significance level Pt:
P t = 2     e x p [ 6     K t 2 / ( n 3 + n 2 ) ]
For a given confidence level α (α = 0.05), if Pt > α, we accept the null hypothesis and assume that there is no significant abrupt change at time t. If Pt < α, we reject the null hypothesis and assume that there is a significant abrupt change at time t.

3.2. Ecological Hydrological Regime: Ecological Flow Surplus and Deficit Method

Monthly time scales were used to calculate the ecological flow surplus and deficit. We calculated the flow values of the 75% and 25% quantiles of approximate natural state periods based on the division of the period of intensified human activity and the approximate natural state period. The range between the two flow values is here used to represent the changes in ecosystem adaptation. Ecological surplus (ES) is the proportion over the 75% percentile, and ecological deficit (ED) is the proportion below the 25% percentile [30]. The formula is as follows:
E S m = Q i Q i , 75 % Q i , 75 % Q i > Q i , 75 %
E D m = Q i Q i , 25 % Q i , 25 % Q i < Q i , 25 %
where m is the month, m = 1,2,…,12; Qi is the average flow rate of month i in a certain year (m3/s); Qi,75% is the 75th percentile flow rate for the month (m3/s); and Qi,25% is the 25th percentile flow rate for the month (m3/s). The ecological surplus for month m is non-negative, and the ecological deficit for month m is non-positive.
Based on the above indicator system, the degree of variation in runoff was quantitatively analyzed, and the specific calculation formula is as follows:
T E S e x p m = N p o s t N p r e i = 1 N p r e E S o b s , p r e , i m
D E S m = i = 1 N p o s t E S o b s , p o s t , i m T E S e x p m T E S e x p m
T E D e x p m = N p o s t N p r e i = 1 N p r e E D o b s , p r e , i m
D E D m = i = 1 N p o s t E D o b s , p o s t , i m T E D e x p m T E D e x p m
where T E S e x p m is the sum of the expected monthly ES values for all years in the approximate natural state period based on the average ES value of month m in the approximate natural state period; N p o s t is the total number of years during which human activity intensified; N p r e is the total number of years in the approximate natural state time period; E S o b s , p r e , i m and E S o b s , p o s t , i m , respectively, represent the ES value of month m in the i year calculated according to Equation (5) in the approximate natural state period and intensified human activity period; i = 1 N p r e E S o b s , p r e , i m is the sum of the m-month’s ES of all years in the approximate natural state period; i = 1 N p o s t E S o b s , p o s t , i m is the sum of the m-month’s ES of all years during the period of intensified human activity; and D E S m is the degree of variation in the ES in month m. The indicators related to ecological deficit (ED) are similar to the aforementioned.
If the degree of variation in the ecological surplus is greater than 0, it indicates that the mean value of the ecological surplus at various time scales is greater than the approximate natural state period during the period of intensified human activity. The larger the degree of change, the longer the approximate natural state period. If the degree of variation in the ecological surplus is lower than 0, it indicates that the mean value of the ecological surplus at various time scales is lower than the approximate natural state period during the period of intensified human activity. The smaller the degree of change, the smaller the approximate natural state period.

3.3. River Ecological Water Demand: Tennant Method

The recommended levels of water demand to maintain the ecological environment in the river are split into two categories: a general water use period that spans from October to March of the following year, and a fish-spawning and juvenile period from April to September. The Tennant approach comprises eight levels, and the recommended value is based on the percentage of runoff.
The recommended ecological flows using the Tennant method are listed in Table 1.
This method considers 10%, 30%, and 60% to 100% of the annual average flow as the minimum ecological water demand in the river, the optimal flow required to ensure the survival of aquatic organisms, and ecological flow required to maintain the original natural river ecosystem, respectively. The formula is:
Q T = i 12 Q i × Z i
where QT is the ecological water demand of the river channel (m3); Qi is the average annual flow rate in i month of a given year (m3); and the recommended runoff percentage for the i month corresponds to Zi (%).

3.4. Ecological Flow Guarantee Rate and Evaluation Standard

In this study, we evaluated the ecological flow guarantee status of rivers based on the monthly average flow guarantee degree. The degree of ecological flow guarantee is here defined as the ratio of the number of months in which the monthly flow value was greater than the monthly ecological flow value to the total number of months corresponding to the long-term runoff year. The formula is:
D i = ( T b i / T i ) × 100 % ,   1 i 12
where Di is the ecological flow guarantee rate for the i month; Tbi is the number of months in the i month of the calculation year that meet the ecological flow for that month; and Ti is the total number of months in the i month of the calculation year.
The evaluation criteria for the ecological flow guarantee rate are listed in Table 2.

4. Results

4.1. Analysis of Runoff Trend in Huangshui River

4.1.1. Runoff Change Trends

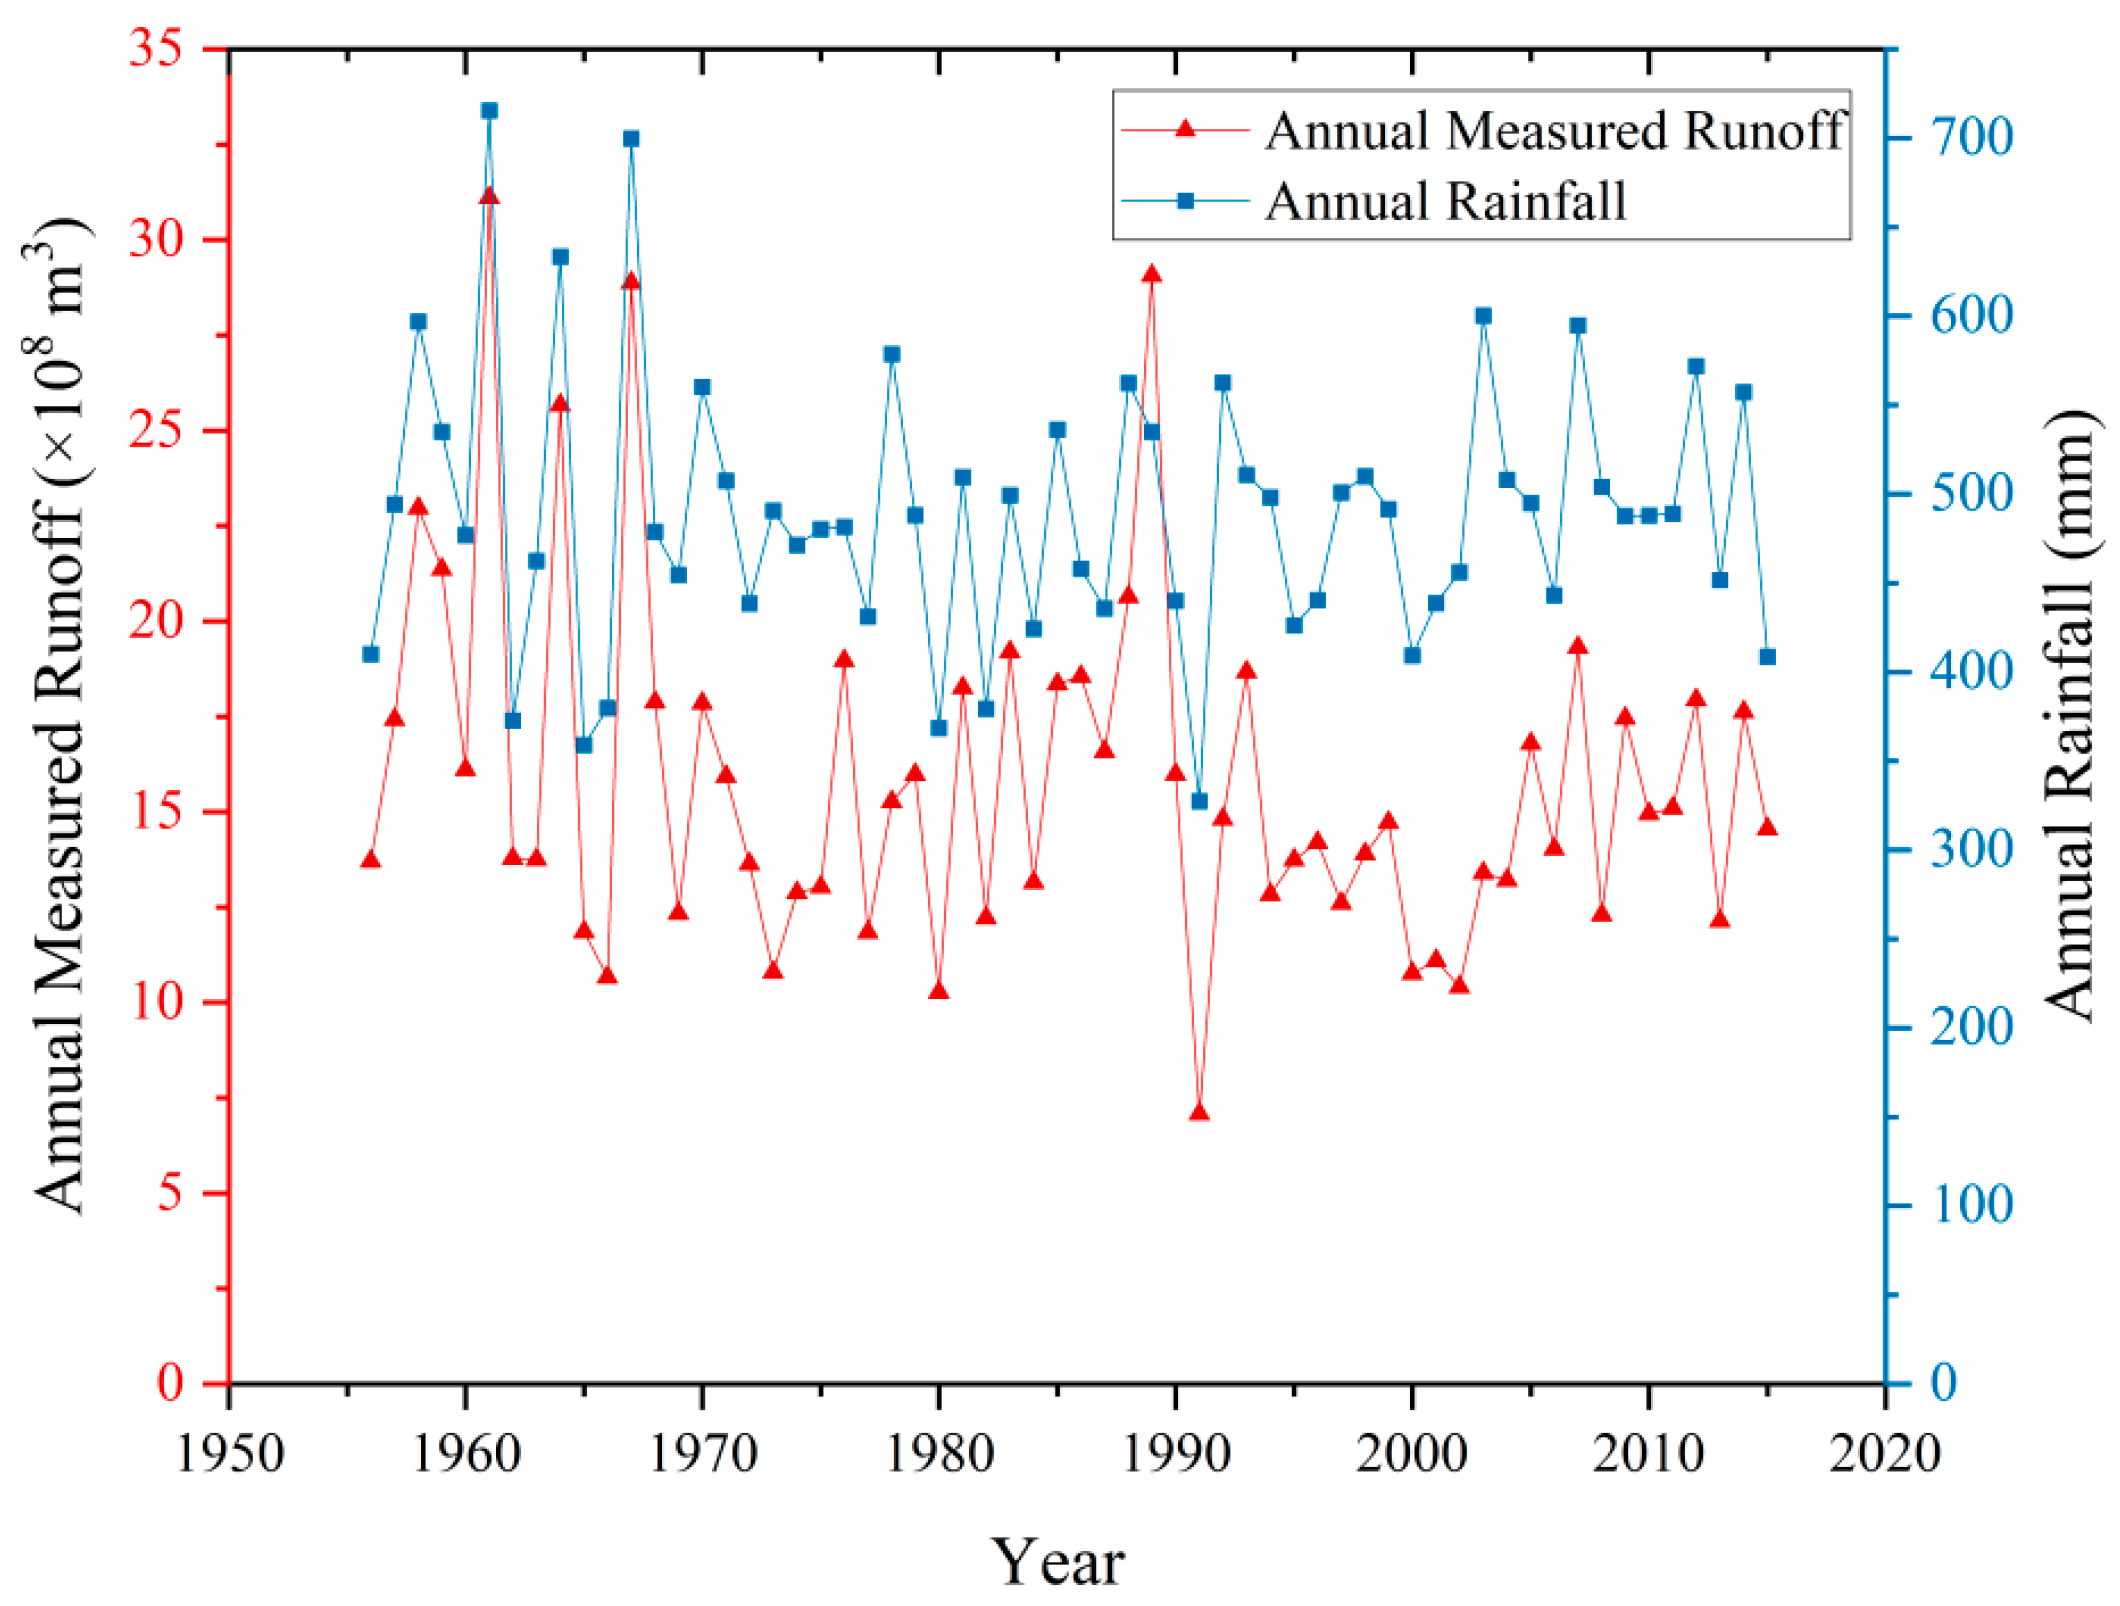
According to the analysis of hydrological and meteorological data from 1956 to 2015 for the Huangshui River Basin, it can be seen that the annual precipitation and runoff generally show a decreasing trend. The decrease in runoff was 10 million m3/10a, and the precipitation fluctuated at a rate of −2.0 mm/10a (Figure 3). The annual runoff went through a stage of increase before 1989 and a stage of decrease after 1989. In the increasing stage, the years of high flow and low flow were basically the same, that is, 11a and 13a, respectively. In the decreasing stage, the years of high flow and low flow were 15a and 6a, respectively. This indicates that the degree of runoff reduction was severe and that the sensitivity of runoff to precipitation changes was strong. The decreasing trend in annual runoff showed quasi-periodic changes in 4a, 9a, and 20a.

4.1.2. Analysis of Abrupt Changes of Runoff

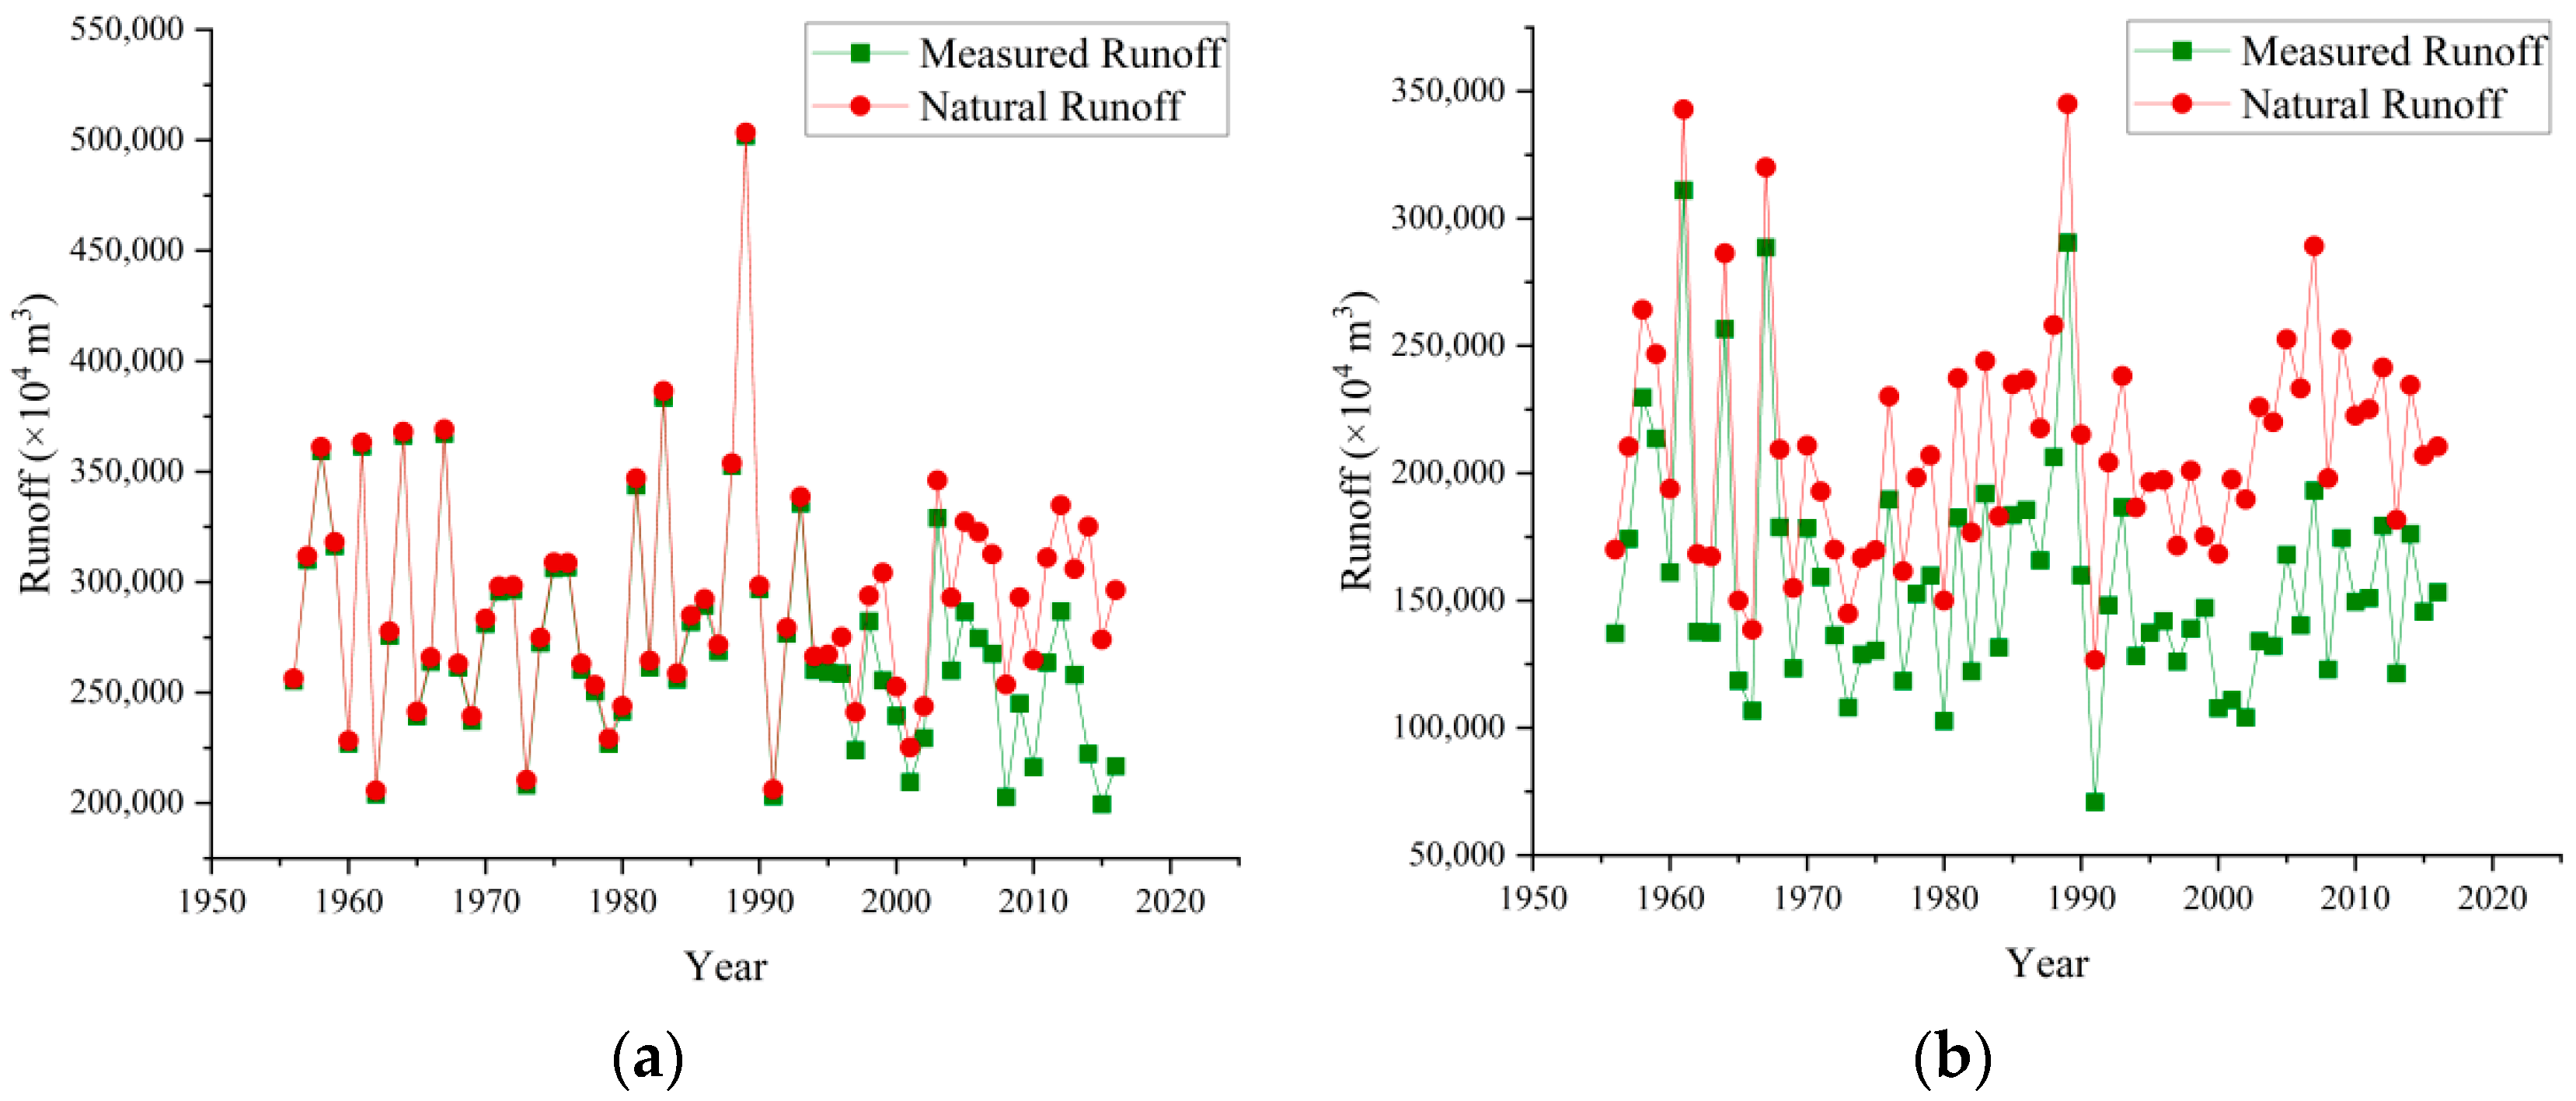
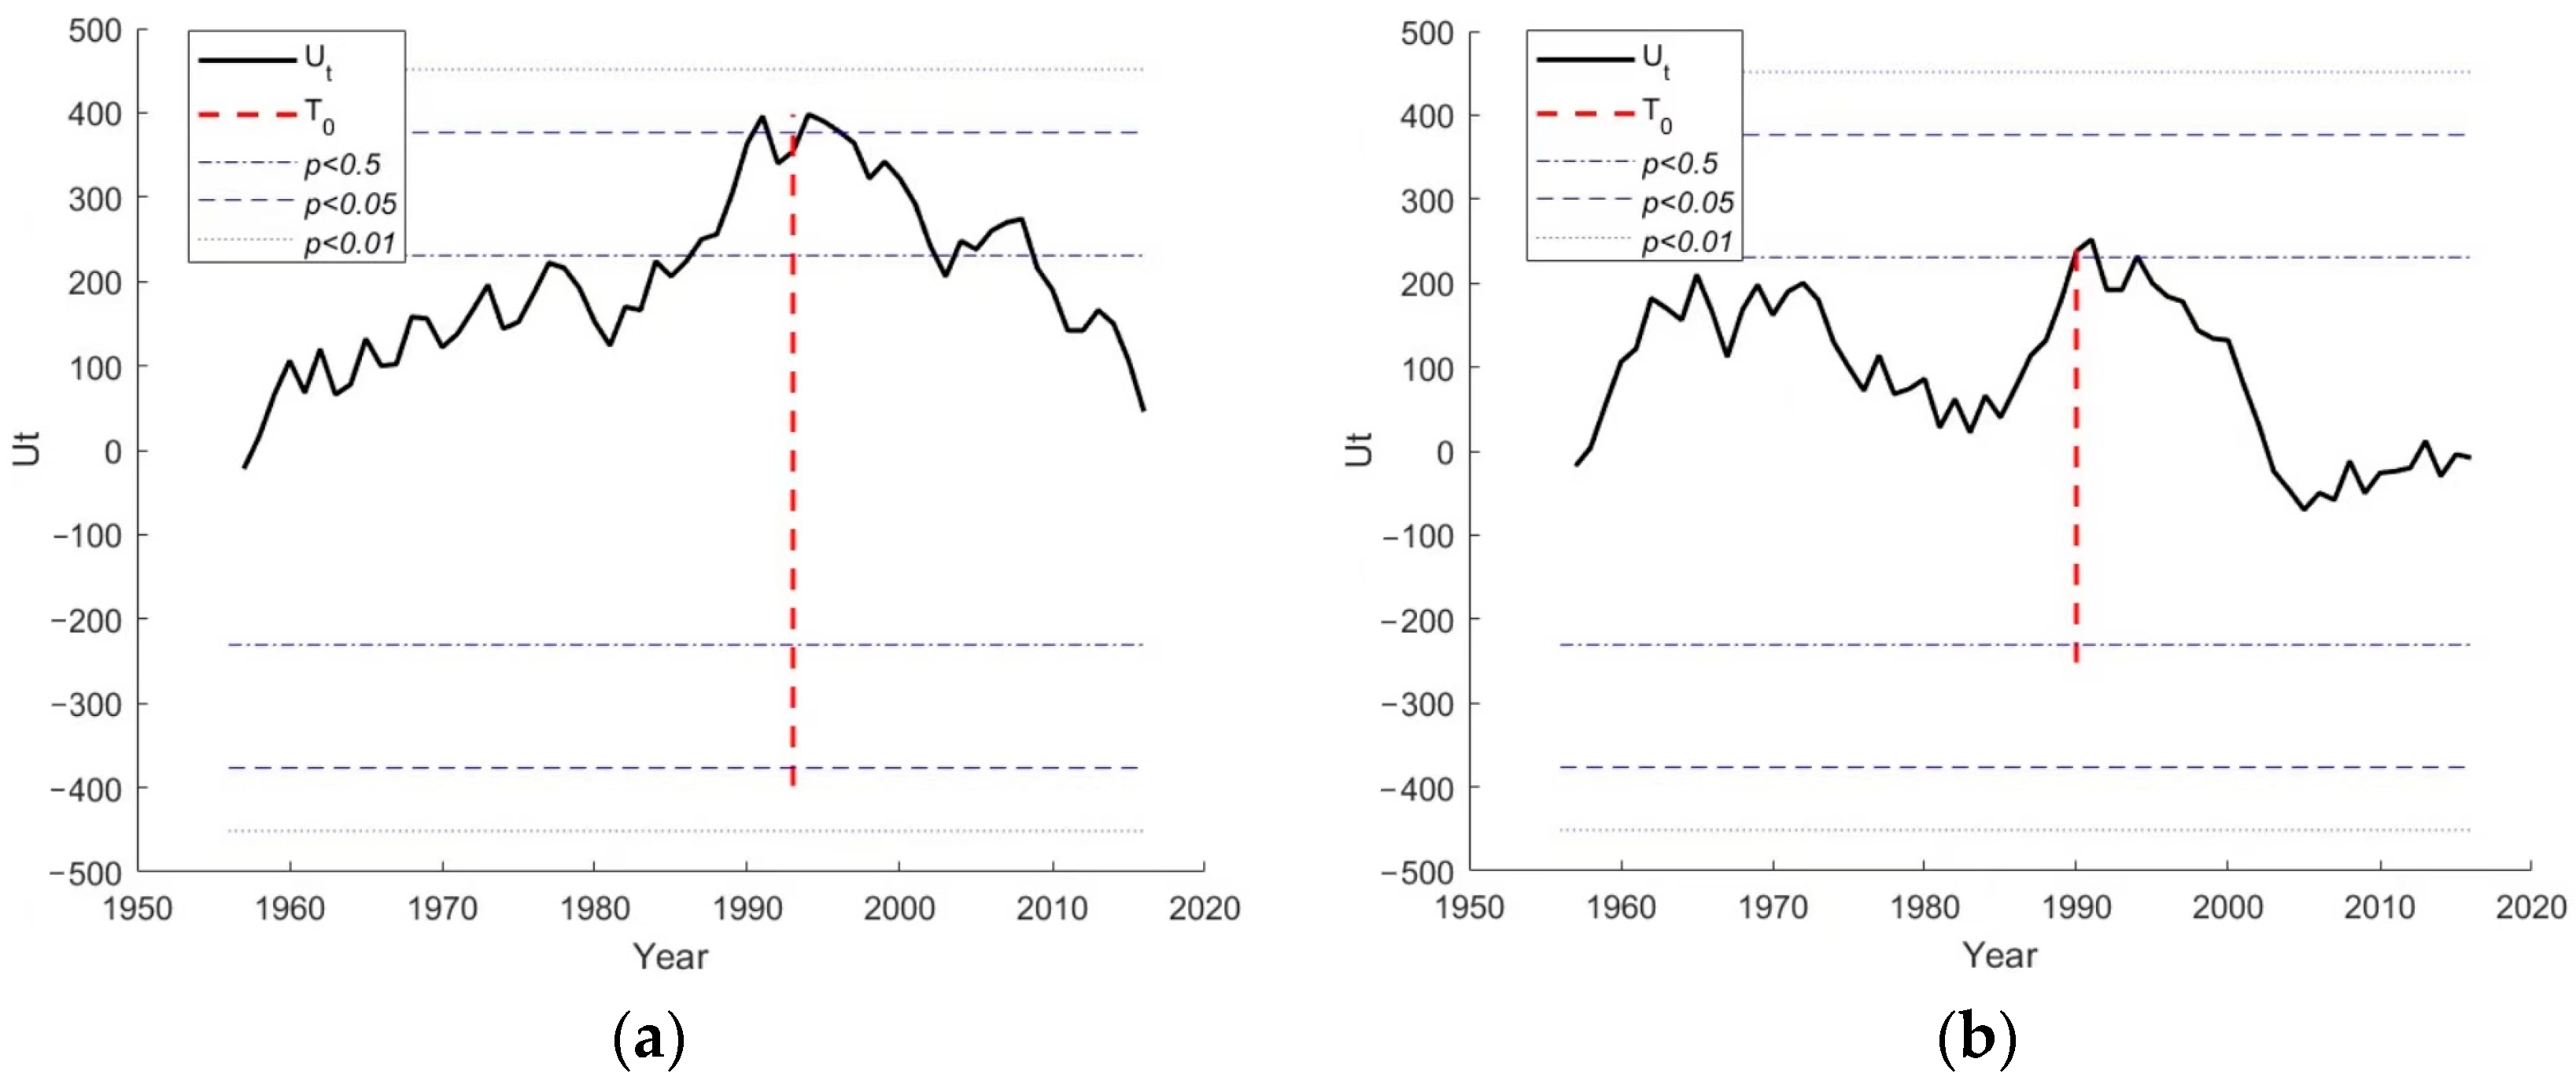
The processes of variation in natural runoff and measured runoff at Minhe Station and Xiangtang Station are shown in Figure 4. It is believed that the difference between natural and measured runoff is due to the combined effects of human activities and climate change, such as agricultural irrigation and reservoir regulation, which can affect river flow. The Pettitt abrupt test was performed using the long-term runoff data from the Xiangtang and Minhe stations from 1956 to 2016, and the results are shown in Figure 5. From the position of the red dashed line in the figure, it can be seen that the point of abrupt change in the measured runoff at Xiangtang Station occurred in 1993 and the abrupt change in the measured runoff at Minhe Station occurred in 1990. For Xiangtang Station, the measured runoff showed an increasing trend before 1993 and a decreasing trend after 1993. For Minhe Station, the measured runoff increased first and then gradually stabilized before 1970. From 1970 to 1980, it showed a fluctuating decrease, and then gradually increased from 1980 to 1990. Since 1990, the measured runoff at Minhe Station has sharply decreased, indicating that human activities began to intensify at this time. It was not until 2004 that the measured runoff began to slowly increase again. Similar results were obtained using the M-K test method.
Therefore, the period of research performed at the two stations can be divided into two sections. For Xiangtang Station, 1956–1993 represents an approximate period with the natural state, and 1994–2016 represents a period of intensified human activity. For Minhe Station, 1956–1990 represents an approximate period with the natural state, and 1991–2016 is a period of intensified human activity.

4.2. Analysis of Ecological Flow Surplus and Deficit Results

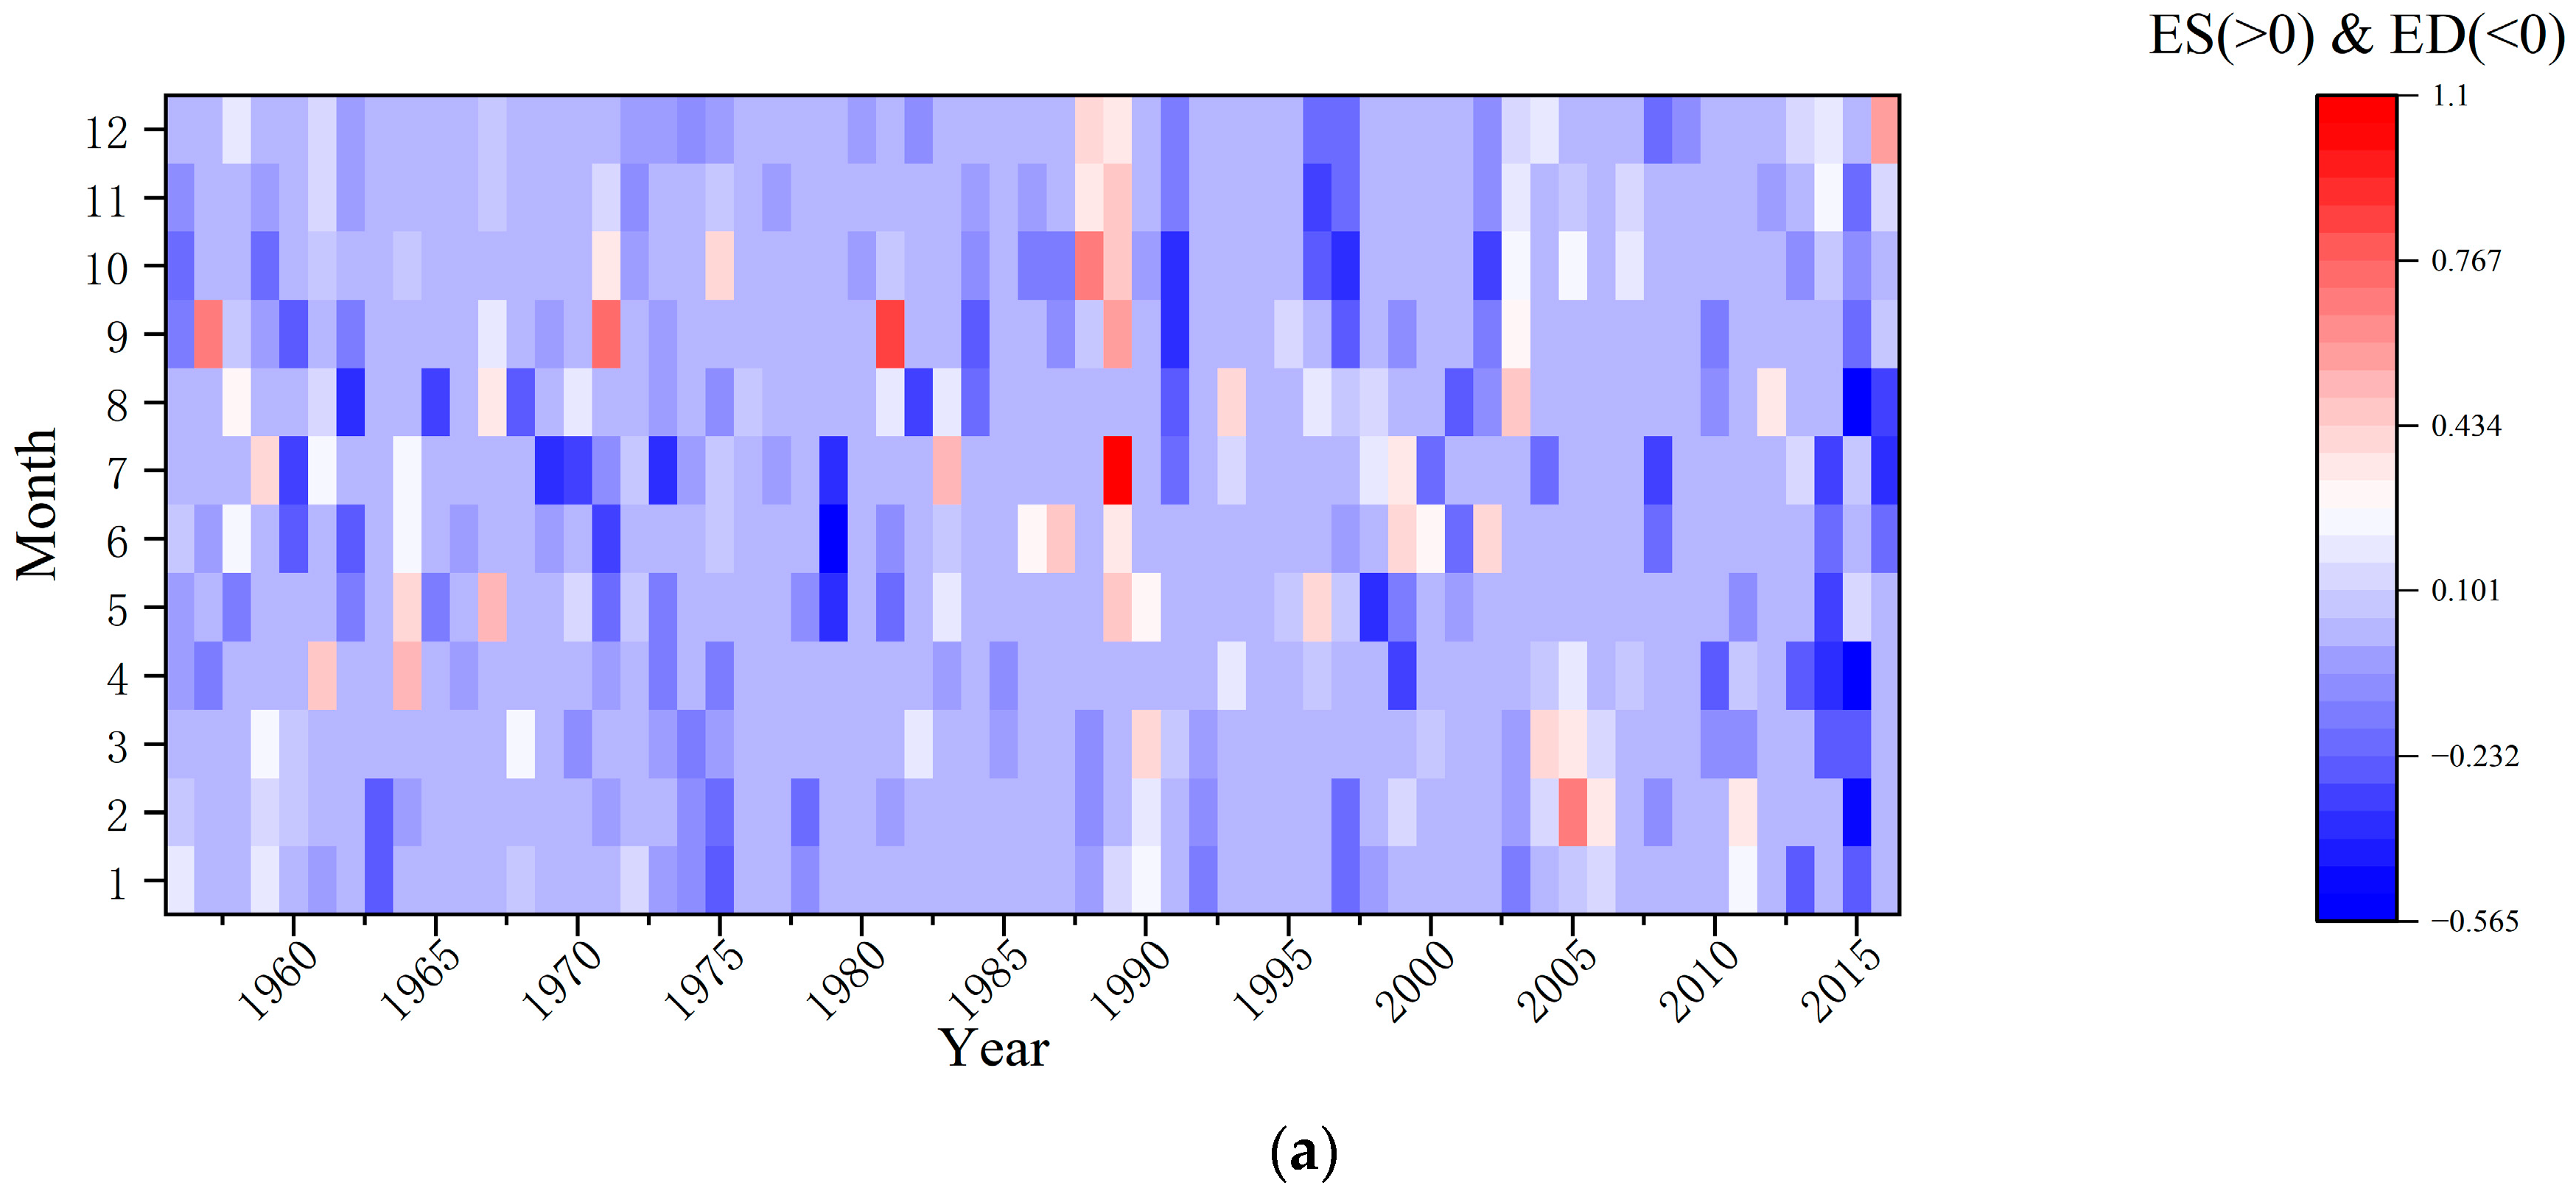
The results obtained from the ecological flow surplus and ecological flow deficit methods are listed in Table 3 and Table 4, respectively. The ecological surplus changes during the period of intensified human activity at the Xiangtang Hydrological Station (1994–2016) were negative in January, April to May, July, and September to November compared to the natural state period (1956–1993), while the ecological deficit changes were positive from January to April, July to August, and October to December. The ecological and hydrological conditions of the rivers deteriorated during these months. The ecological surplus decreased the most in September, reaching −71.4%, and in February, it increased the most, reaching 475%. The ecological deficit increased the most in April, reaching 285%, and the most significant decrease was in June, reaching −9.5%. The degree of change in the ecological deficit exceeded 100%, most notably from March to April and November to December. Ecological runoff has adverse effects on river ecosystems.
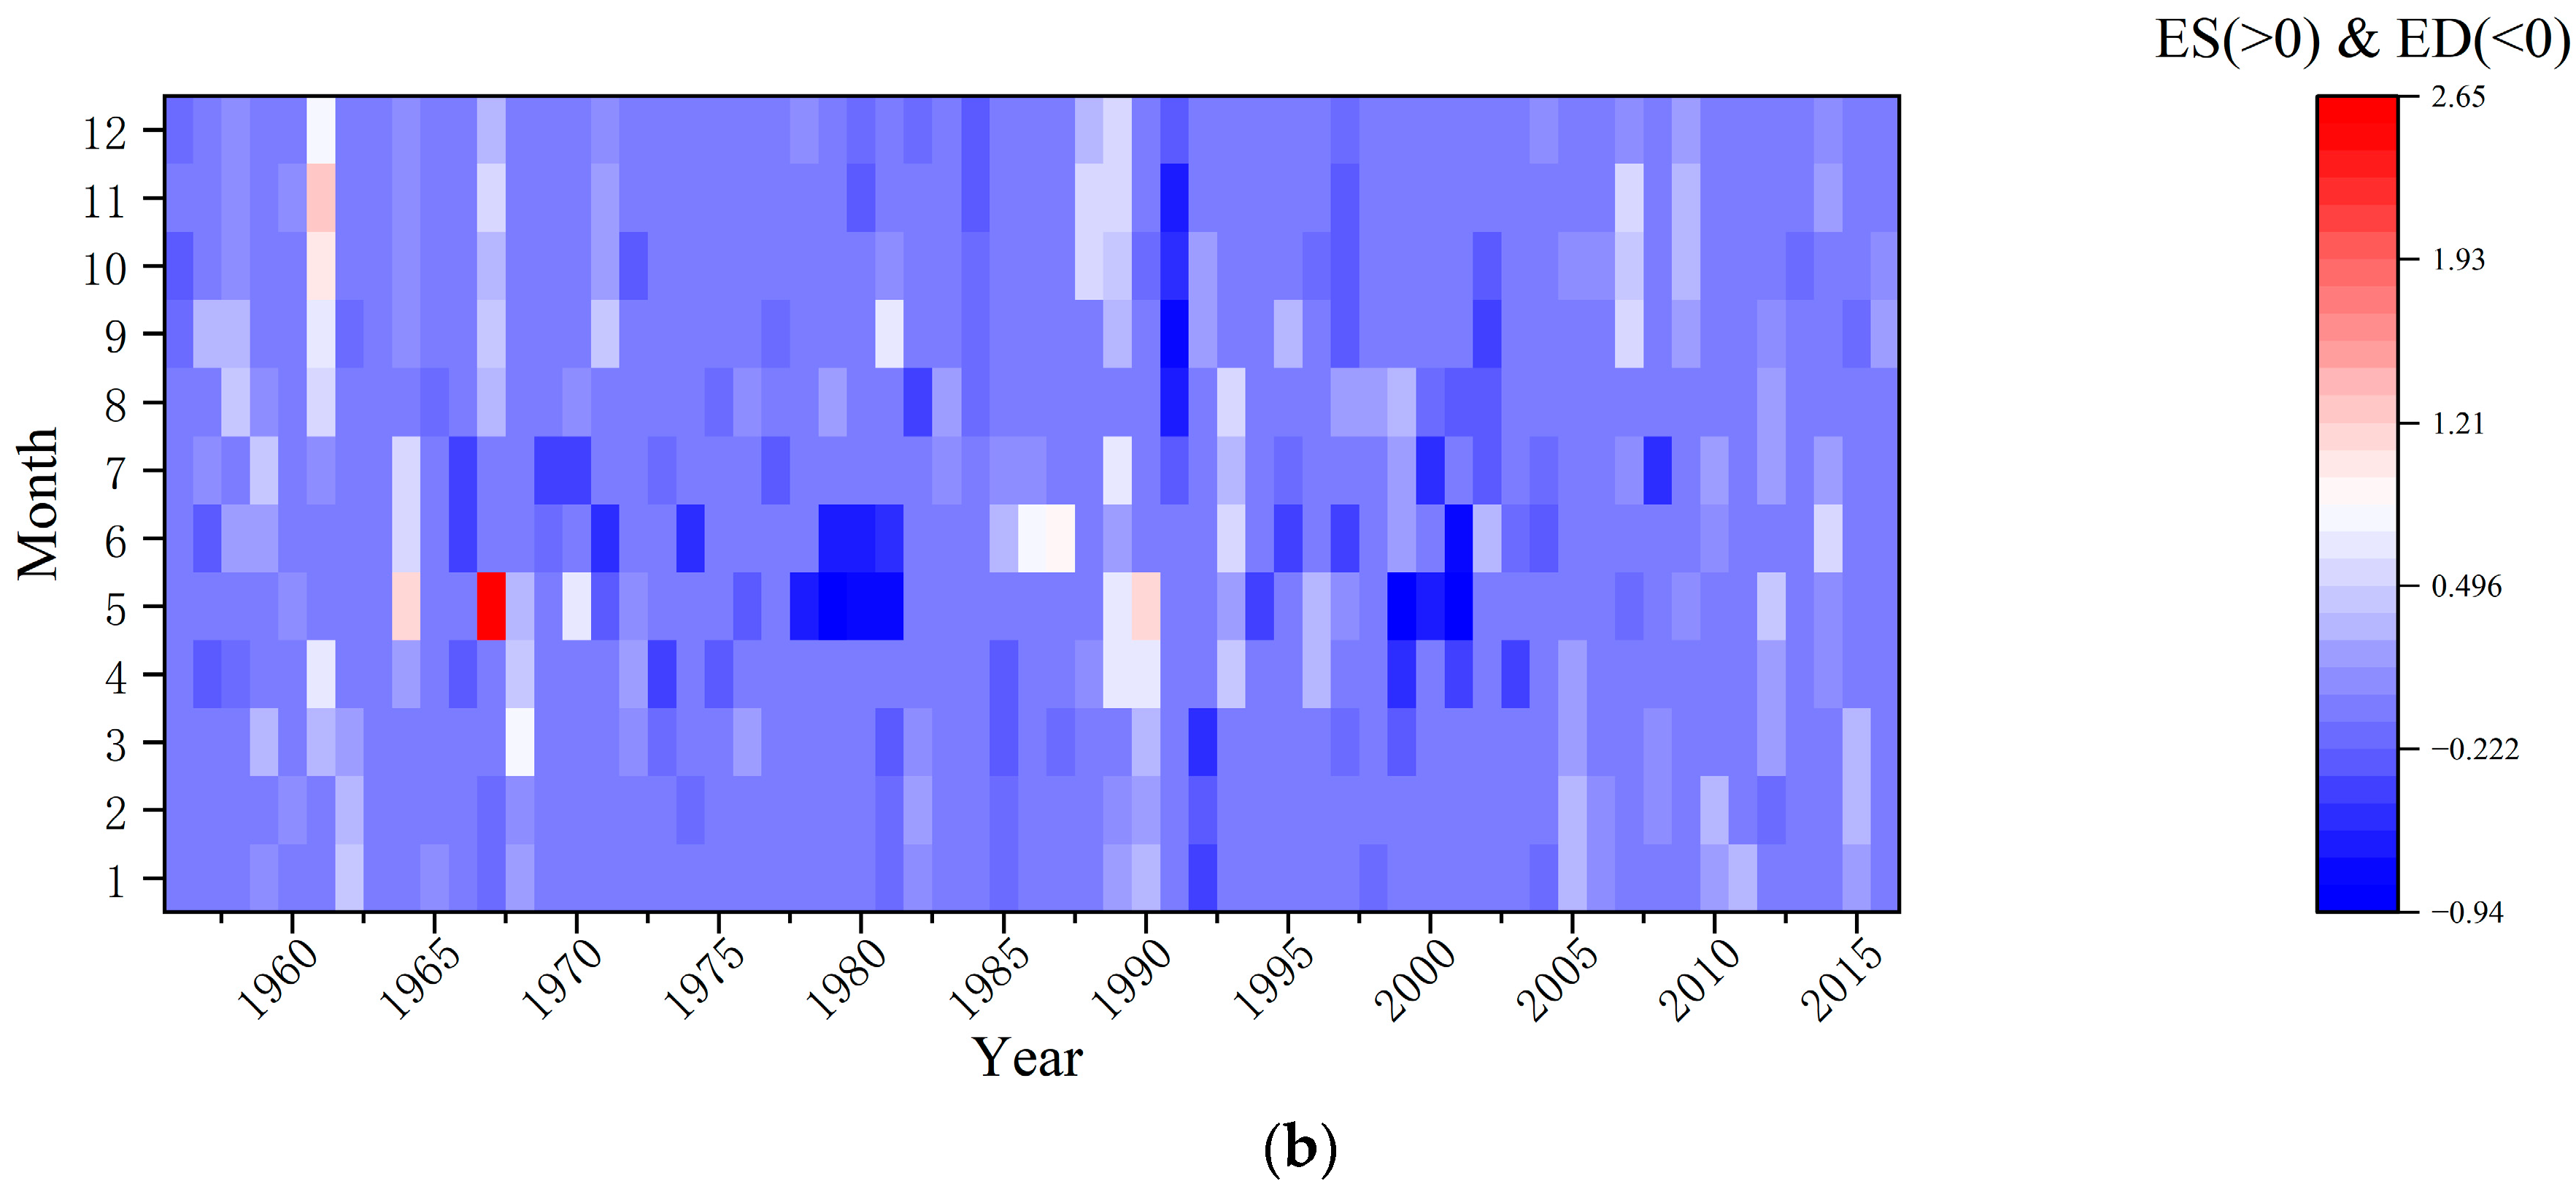
The ecological surplus changes during the period of intensified human activity at the Minhe Hydrological Station (1991–2016) were negative from March to July and September to December compared to the natural state period (1956–1990), while the ecological deficit changes were positive from January to April and July to December. The ecological and hydrological conditions of rivers deteriorated in these months. The ecological surplus decreased the most in May, reaching −78.7%, and in February, it increased the most, reaching 83.3%. The ecological deficit increased the most in September, reaching 150%, and the most significant decrease was in June, reaching −30%.
Overall, the months when the ecological flow surplus increased were mainly concentrated in the dry seasons for the rivers, which were primarily the discharge period of the reservoirs and not the agricultural irrigation period. These changes in human activity led to an increase in river flow. The ecological flow deficit in most months increased significantly after human activity intensified, with a slight decrease from May to June.
Figure 6 shows the monthly ecological surplus and deficit levels at Xiangtang and Minhe stations from 1956 to 2016. From the chart, it can be seen that the distribution of ecological surplus and deficit at Xiangtang Station over the past 61 years is relatively uniform. Before 1980, the ecological deficit during the rainy season was severe. From 1980 to 2005, there was a significant increase in the ecological surplus, but after 2014, the ecological deficit worsened. For Minhe Station, the degree of ecological surplus was relatively light, while there were two periods with obvious ecological deficits: from April to July around 1969–1982 and from 1991 to 2004. Both the Datong and Huangshui rivers showed significant ecological deficits before 1980, which may have been due to the impact of climate conditions at that time. After 1990, due to human activities such as water diversion, the ecological deficit of the Huangshui River improved, while the reduction in water volume in the Datong River exacerbated the ecological deficit of the Datong River.

4.3. Ecological Flow Guarantee Rate of Huangshui River and Datong River

Given the paramount ecological significance of the Huangshui River, in this study, we employed the Tennant method and designated 30% of the natural average flow spanning 1956 to 2016 as the ecological flow benchmark for this stretch. Adhering to the Implementation Rules of the Yellow River Water Regulation, the minimum flow required for a 95% guarantee rate at the Datong River Xiangtang Station is here set at 10 m3/s, while the warning flow level at Minhe Station stands at 8 m3/s. Integrating these criteria, we determine the monthly ecological flow thresholds for the Minhe and Xiangtang sections. The results are shown in Table 5.
The annual average ecological flow for the Xiangtang section of the Datong River was calculated as 28.42 m3/s, translating to an annual ecological water demand of 896 million m3. Similarly, the Minhe section’s annual average ecological flow was 19.98 m3/s, equating to an annual ecological water demand of 631 million m3.
After comparing and analyzing the monthly measured runoff and ecological flow data from Minhe Station and Xiangtang Station, we derived monthly ecological flow guarantee rates spanning from 1956 to 2016 (Table 6). Our calculations indicate that the ecological flow guarantee rate for the Xiangtang section of the Datong River in January stands at 98%, whereas the guarantee rates for the remaining months are set consistently at 100%. Notably, in March, August, and September, the guarantee rates for the same section also dipped to 98%, yet they remained at 100% for all other months. This fluctuation is primarily attributed to the influence of irrigation water on the guarantee rate of ecological water demand.
From these results, it is evident that the ecological flow guarantee of the Datong River in January can be categorized as “good”, whereas for the remaining months, it can be deemed “excellent”. Similarly, the ecological flow guarantee of the Huangshui River in March, August, and September can also be labeled “good”, with the other months achieving “excellent” status. This signifies that the water volumes of both the Datong River and Huangshui River adequately fulfill the requirements for ecological water demand.

5. Discussion

5.1. Impact of Climate Change and Human Activities on Hydrological Regime

Hydrological changes in the Huangshui River Basin are influenced by both climate change and human activities. Studies reveal that climate change causes 35.46% of the reduction in runoff within the basin [31]. Temperature plays a pivotal role, as it directly affects evaporation, a critical factor in determining runoff. The interplay between temperature and precipitation can either exacerbate or mitigate changes in runoff. For instance, combinations such as “rising temperature + decreasing precipitation” and “decreasing temperature + increasing precipitation” tend to worsen runoff changes, whereas “increasing temperature + increasing precipitation” and “decreasing temperature + decreasing precipitation” tend to lessen these changes [32]. Increased runoff due to climate change would raise the river’s ecological base flow and enhance the ecological flow guarantee rate. Conversely, decreased runoff would lower both the ecological base flow and the guarantee rate. With the projected increase in precipitation and decrease in runoff under climate change, it is crucial to manage water resources effectively in order to sustain the ecological flow.
The analysis also highlights that intensified human activities have led to abrupt changes in river flow, significantly affecting ecological surplus and deficit. For example, in 1994, following the completion of the main canal under the Water Diversion Project from the Datong River to Qinwangchuan, there was a marked change in the flow rate of the Datong River. During the construction of the Datong River to Huangshui River Water Diversion Project [33] from 1996 to 2018, both the ecological surplus and deficit of the Datong and Huangshui rivers underwent significant changes, showing a deteriorating trend. Although the water volumes of these rivers during the study period generally met the ecological water demands, their future trends need continuous monitoring due to their sensitivity to human activities.

5.2. Different Ecological Water Demand Accounting Methods

The ecological water demand in this study was primarily estimated using the Tennant method. Various techniques can be employed to estimate the ecological water demand of rivers, including hydrological, hydraulic, habitat, and holistic analysis methods [34]. Among these, hydrological methods are widely used due to their ability to quickly provide results based on recorded hydrological data. In contrast, the other three methods are more computationally complex and require additional data, such as hydraulic parameters and fish data. The Tennant method, along with the historical flow curve method, forms the basis of the historical flow approach, a research-oriented hydrological technique. The Tennant approach is known for its simplicity and user-friendliness, making it a relatively quick and straightforward method. Hydrological technology or monitoring stations can directly supply the necessary data for this method [35]. However, this method also has its limitations. For example, the reliance on simple flow percentage calculations may not capture the true needs of complex ecosystems. Additionally, the method primarily considers flow, overlooking the impact of other environmental factors such as temperature and seasonal variations. Zhang et al. [24] used three methods to calculate the ecological water demand of the Xining section of the Huangshui River and compared the results with the Tennant method for rationality. The result was that the ecological flow from April to June was 9.3 m3/s, from July to October, it was 12.2 m3/s, and from November to March of the following year, it was 5.6 m3/s. This result is comparatively smaller than those obtained in this study, as the Xining section is located upstream of the investigated river segment, resulting in a correspondingly lower flow rate. According to the Comprehensive Plan for the Huangshui River Basin (2019), the ecological water demand for the Minhe section varied, ranging from 28.3 m3/s from April to June to 41.7 m3/s from July to October and then decreasing to 8.6 m3/s for November to March of the following year. For the Xiangtang section, the minimum ecological flow ranged from 14.8 m3/s to 24.1 m3/s for April to June and remained stable at 24.1 m3/s from July to October. The findings of this study closely align with the projections set out in the Huangshui River Basin Comprehensive Plan.
In this study, due to the lack of specific water requirements for aquatic organisms in the region, only the overall runoff of the river could be used to roughly calculate the ecological water demand. This may affect the accuracy of the calculation results. Therefore, it is recommended to conduct a more comprehensive analysis of the ecological water demand of rivers after obtaining more sufficient water demand data for aquatic organisms in the future. It is also advisable to further explore the potential impacts of climate change and water transfer projects on the ecological water demand guarantee of the Huangshui River and its tributaries. This exploration should utilize daily flow data and detailed engineering water transfer scheduling plans to ensure more accurate assessments.

6. Conclusions and Suggestions

Based on the comprehensive analysis of hydrological data from 1956 to 2016, this study evaluated the ecohydrological regimes and ecological water demands of the Huangshui River Basin, focusing on the Minhe and Xiangtang stations. The key findings reveal the significant influence of human activities and climate change on river runoff, ecological surplus, and deficit patterns. These findings emphasize the need for targeted water management strategies. Below are the main conclusions and actionable suggestions.

6.1. Conclusions

(1)
Abrupt changes in measured runoff were observed at Xiangtang Station in 1993 and Minhe Station in 1990, primarily due to increased human activities such as agricultural irrigation and water diversion projects.
(2)
Human activities, particularly during the irrigation season, have exacerbated the ecological deficits at both stations. The most significant ecological deficits were observed in critical months, including April and September, where the flow rates were insufficient to meet the ecological water demands.
(3)
The implementation of the Water Diversion Project from the Datong River to the Huangshui River improved water availability. However, high water consumption for irrigation has resulted in ecological deficits during key periods, stressing the need for further intervention to balance water usage.
Our results show that the ecological deficit in most months has increased, indicating that intensified human activities have had a significant negative impact on river ecosystems. This study provides critical scientific support for watershed ecological protection in northwest China, particularly in the context of climate change and increased human activities.

6.2. Suggestions

This analysis of the Huangshui River’s ecological water demand guarantee rate and deficit indicates that high water consumption for agricultural irrigation adversely affects runoff and the ecological water demand guarantee rate. The impact of water diversion projects on river runoff is also significant. Therefore, the suggestions are as follows.
(1)
Optimizing Agricultural Water Use: The significant ecological deficits during the irrigation season suggest a need for enhanced water-saving agricultural practices. Farmers should adopt advanced irrigation technologies such as drip irrigation and soil moisture monitoring systems to reduce water wastage. Incentives for adopting water-efficient crops that require less water should be provided, particularly in arid zones.
(2)
Prioritizing Ecological Flow Maintenance in Future Water Diversion Projects: While water diversion projects, like the Yellow River to Xining initiative, are essential for sustaining agricultural and urban needs, ecological flow preservation must be integrated into project planning. A dynamic water allocation model should be implemented, ensuring that minimum ecological flows are maintained year-round, especially during dry months. Monitoring stations along the rivers should be enhanced to track the impacts of these projects on ecological water demands.
(3)
Strengthening the Management of Water Resource Allocation: A basin-wide integrated water resource management system should be established to balance the competing demands for agricultural, industrial, and ecological water. This includes the development of a centralized management system that coordinates the operation of reservoirs and water diversion projects, ensuring ecological water demands are consistently met. Public awareness campaigns should be initiated to promote water conservation among all stakeholders, particularly in the agriculture and industrial sectors.
(4)
Climate Change Adaptation Strategies: As climate change is expected to further alter precipitation patterns, a long-term water resource planning framework should be developed. This should include adaptive measures to cope with the increased variability in runoff, ensuring that the ecological integrity of the rivers is preserved under future climate scenarios. The framework should incorporate predictive models to simulate potential future scenarios, facilitating proactive decision-making.
(5)
Enhancing Scientific Research and Data Collection: Future research should focus on collecting more granular data on aquatic ecosystems to refine the estimation of ecological water demand. This includes detailed studies on the water needs of key protected species and their habitats. Additionally, daily flow data should be collected to improve the accuracy of ecohydrological assessments, allowing for more precise ecological flow management.
By implementing these strategies, the Huangshui River Basin can move towards sustainable water management, ensuring both human and ecological needs are met. Long-term monitoring and adaptive management will be crucial to safeguarding the river ecosystem in the face of increasing anthropogenic pressures and climate change.

Author Contributions

L.F.: conceptualization, data curation, formal analysis, and writing—original draft; L.L.: writing—original draft; J.H. and F.Z.: writing—original draft; C.L.: investigation, methodology, and project administration; Y.Y.: funding, resources, software, supervision, and writing—review and editing. All authors have read and agreed to the published version of the manuscript.

Funding

This work was supported by the Joint Funds of the National Natural Science Foundation of China (U2243236), the National Natural Science Foundation of China (grant 42201046), National Science Fund for Distinguished Young Scholars (52025092), and the Qinghai Haidong Urban-Rural Eco-Development Project (L3443-PRC-HD-CB-CS4). The authors express their gratitude to the editor and anonymous reviewers for their valuable comments, which have enhanced the quality of the article.

Data Availability Statement

Publicly available datasets were analyzed in this study. This data can be found here: doi: 10.6084/m9.figshare.27201213.

Conflicts of Interest

The authors declare that the research was conducted in the absence of any commercial or financial relationships that could be construed as a potential conflict of interest.

References

  1. Wang, H.; Liu, J.G.; Klaar, M.; Chen, A.F.; Gudmundsson, L.; Holden, J. Anthropogenic climate change has influenced global river flow seasonality. Science 2024, 383, 1009–1014. [Google Scholar] [CrossRef] [PubMed]
  2. Lv, X.Z.; Liu, S.S.; Li, S.P.; Ni, Y.X.; Qin, T.L.; Zhang, Q.F. Quantitative estimation on contribution of climate changes and watershed characteristic changes to decreasing streamflow in a typical basin of yellow river. Front. Earth Sci. 2021, 9, 752425. [Google Scholar] [CrossRef]
  3. Wang, S.J.; Yan, M.; Yan, Y.X.; Shi, C.X.; He, L. Contributions of climate change and human activities to the changes in runoff increment in different sections of the Yellow River. Quat. Int. 2012, 282, 66–77. [Google Scholar] [CrossRef]
  4. Cui, T.; Tian, F.Q.; Yang, T.; Wen, J.; Khan, M.Y.A. Development of a comprehensive framework for assessing the impacts of climate change and dam construction on flow regimes. J. Hydrol. 2020, 590, 125358. [Google Scholar] [CrossRef]
  5. Vogel, R.M.; Fennessey, N.M. Flow-Duration Curves. I: New Interpretation and Confidence Intervals. J. Water Resour. Plan. Manag. 1994, 120, 485–504. [Google Scholar] [CrossRef]
  6. Vogel, R.M.; Sieber, J.; Archfield, S.A.; Smith, M.P.; Apse, C.D.; Huber-Lee, A. Relations among storage, yield, and instream flow. Water Resour. Res. 2007, 43. [Google Scholar] [CrossRef]
  7. Gao, Y.X.; Vogel, R.M.; Kroll, C.N.; Poff, L.R.; Olden, J.D. Development of representative indicators of hydrologic alteration. J. Hydrol. 2009, 374, 136–147. [Google Scholar] [CrossRef]
  8. Liu, L.L.; Wei, L.X.; Xu, Y.; Xin, X.G.; Xiao, C. Projection of climate change impacts on ecological flow in the Yellow River basin. Adv. Water Sci. 2021, 32, 824–833. (In Chinese) [Google Scholar]
  9. Wang, Y.K.; Wang, D.; Lewis, Q.W.; Wu, J.C.; Huang, F. A framework to assess the cumulative impacts of dams on hydrological regime: A case study of the yangtze river. Hydrol. Process. 2017, 31, 3045–3055. [Google Scholar] [CrossRef]
  10. Deng, L.; Guo, S.; Tian, J.; Wang, H. Assessment of ecological flow alterations induced by hydraulic engineering projects in the Han River, China. Hydrol. Res. 2023, 55, 33–50. [Google Scholar] [CrossRef]
  11. Zhu, S.N.; Dong, Z.C.; Wu, S.J.; Fu, G.B.; Li, Z.Z.; Meng, J.Y.; Shao, Y.; Zhang, K. Evaluation of reservoir-induced ecological flow with consideration of ecological responses to multiple hydrological alterations: A case study in the Feiyun River Basin, China. Ecol. Indic. 2023, 154, 110859. [Google Scholar] [CrossRef]
  12. Wang, F.L.; Guo, X.M.; Zhang, S.; Hu, T. A Risk Assessment Method for Ecological Flows under Different Time Scales. J. Chang. River Sci. Res. Inst. 2023, 40, 29–35. (In Chinese) [Google Scholar]
  13. Yang, Y.; Wang, Z.H.; Wang, X.L.; Zhao, C.S.; Zhang, C.B.; Pan, T.L. Calculation of environment flow and analysis of spatial environment flow satisfaction rate: A case study of Ji’nan City. Adv. Earth Sci. 2020, 35, 513–522. (In Chinese) [Google Scholar]
  14. Zhang, X.X. Study on Theory and Process of Ecological Water Requirement of River Basin. Master’s Thesis, Tianjin University of Technology, Tianjin, China, 2013. (In Chinese). [Google Scholar]
  15. Tang, J.; She, X.Y.; Lin, N.F.; Ma, S.T. Advances in research on the theories and methods of eco-environmental water demand. Sci. Geogr. Sin. 2005, 25, 3367–3373. (In Chinese) [Google Scholar]
  16. Ma, L.K. Catchment Eco-Environmental Water Requirement through a Case Study in the Yanhe Basin. Ph.D. Thesis, Peking University, Beijing, China, 2008. (In Chinese). [Google Scholar]
  17. Zhao, F.; Pang, A.P.; Li, C.H.; Zheng, X.K.; Wang, X.; Yi, Y.J. Progress in ecological water requirements in the mainstream and estuary ecosystem of the Yellow River Basin. Acta Ecol. Sin. 2021, 41, 6289–6301. (In Chinese) [Google Scholar]
  18. Bovee, K.D. Stream habitat analysis using the instream flow incremental methodology. Reports 1982, 2, 19–28. [Google Scholar]
  19. Bartschi, D. A habitat-discharge method of determining instream flows for aquatic habitat. Proc. Symp. Specility Conf. Instream Flow Needs II 1976, 285–294. [Google Scholar]
  20. Tennant, D.L. Instream flow regimens for fish, wildlife, recreation and related environmental resources. Fisheries 1976, 1, 6–10. [Google Scholar] [CrossRef]
  21. Boner, M.C.; Furland, L.P. Seasonal treatment and variable effluent quality based on assimilative capacity. J. Water Pollut. Control Field 1982, 54, 1408–1416. [Google Scholar]
  22. Arthington, A.H.; Pusey, B.J. Instream flow management in Australia: Methods, deficiencies and future direction. Aust. Biol. 1993, 6, 52–60. [Google Scholar]
  23. Zhang, Z.G.; Tan, Q.L.; Zhong, Z.G.; Jin, Y.; Du, J.M. Study on ecological flow regime based on habitat requirements of fish. Water Power 2016, 42, 13–17. (In Chinese) [Google Scholar]
  24. Zhang, Y.; Hou, Q.Z.; Tian, F.C.; Cheng, P.R. Ecological flow calculation and simulation analysis of Huangshui River in Xining section based on water quality and water quantity coupling model. Water Power 2023, 49, 6–13+120. (In Chinese) [Google Scholar]
  25. Liu, B.J.; Cui, C.Y.; Wang, L.W.; Hou, B.J. Study on ecological water quantity of typical branch ditch replacement in Huangshui river valley. Water Resour. Plan. Des. 2020, 11, 58–63. (In Chinese) [Google Scholar]
  26. Sha, J.X.; Xie, X.M.; Zhang, S.P.; Lu, H.Y. Study on optimization and readjustment of water allocation for reception basin of Datonghe River-to-Huangshui River Water Diversion Project. Water Resour. Hydropower Eng. 2012, 43, 1–3. (In Chinese) [Google Scholar]
  27. Pettitt, A.N. A non-parametric approach to the change-point problem. J. R. Stat. Soc. 1979, 28, 126–135. [Google Scholar] [CrossRef]
  28. Karim, S.A.; Sedigheh, B.A. Evaluation of Terra Climate gridded data in investigating the changes of reference evapotranspiration in different climates of Iran. J. Hydrol. Reg. Stud. 2024, 52, 101678. [Google Scholar]
  29. Mendes, M.P.; Rodriguez-Galian, V.; Aragones, D. Evaluating the BFAST method to detect and characterise changing trends in water time series: A case study on the impact of droughts on the Mediterranean climate. Sci. Total Environ. 2022, 846, 157428. [Google Scholar] [CrossRef] [PubMed]
  30. Zhang, S.; Guo, X.M.; Zhou, M.; Hu, T. New method for evaluating changes in hydrologic regimes based on eco-flows metrics. J. Hydroelectr. Eng. 2021, 40, 65–76. (In Chinese) [Google Scholar]
  31. Zhang, T.F.; Zhu, X.D.; Wang, Y.J.; Li, H.M.; Liu, C.H. The impact of climate variability and human activity on runoff changes in the Huangshui River Basin. Resour. Sci. 2014, 36, 2256–2262. (In Chinese) [Google Scholar]
  32. Yang, J.J. Research on Runoff Simulation of Huangshui River Basin Based on SWAT Model. Master’s Thesis, Qinghai Normal University, Xining, China, 2009. (In Chinese). [Google Scholar]
  33. Li, H.C.; Qin, T.; Wang, Z.Q.; Qiu, Y.; Lei, X.H. Study on Management System of Inter-Basin Water Diversion Project—A Case Study of the Project of Drawing Water from Datong River into Huangshui River. IOP Conf. Ser. Earth Environ. Sci. 2018, 189, 022047. [Google Scholar] [CrossRef]
  34. King, J.; Louw, D. Instream flow assessments for regulated rivers in South Africa using the Building Block Methodology. Aquat. Ecosyst. Health Manag. 1998, 1, 109–124. [Google Scholar] [CrossRef]
  35. Li, C.W. Key Technologies of River Ecological Flow on Modified Tennant Method and Sensitive Ecological Requirements. Ph.D. Thesis, Huazhong University of Science and Technology, Wuhan, China, 2016. (In Chinese). [Google Scholar]
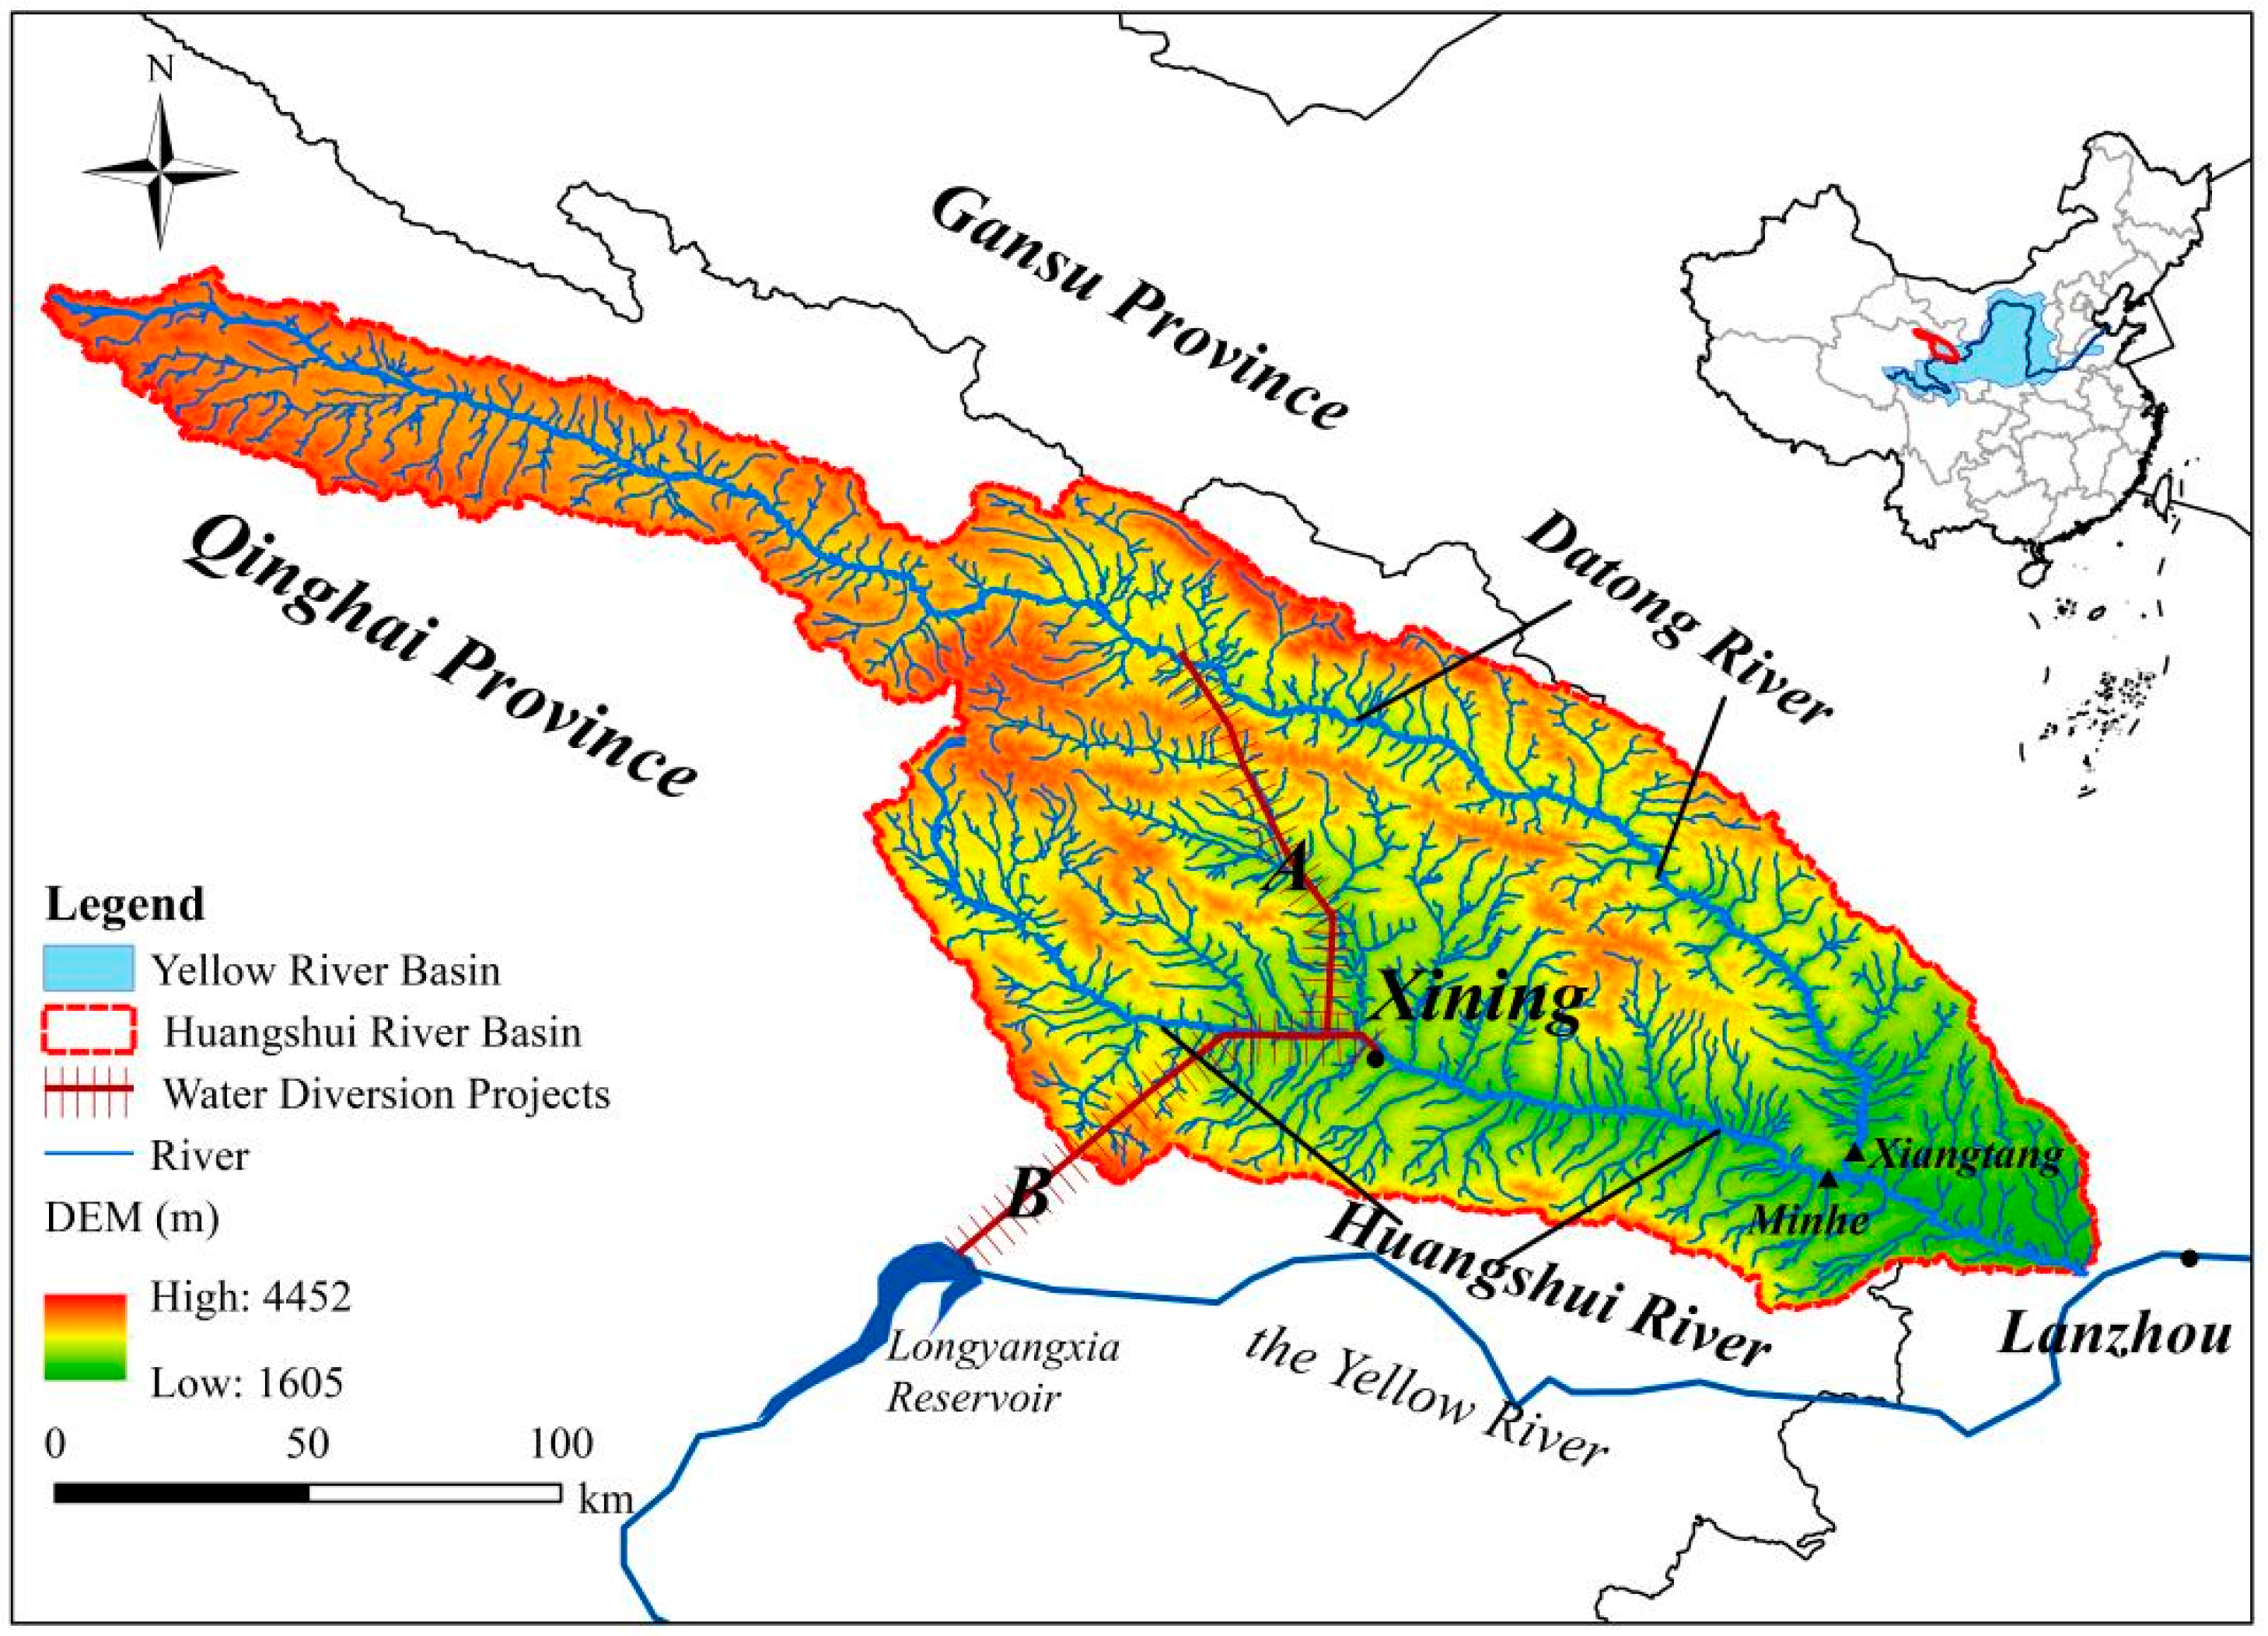
Figure 1. Site of the Huangshui River Basin. Note: A. Water Diversion Project from the Datong River to the Huangshui River; B. Water Diversion Project from the Yellow River to Xining City.
Hydrology 11 00168 g001
Figure 2. The analytical framework. Note: D E S m is the degree of variation in the ES in month m. D E D m is the degree of variation in the ED in month m.
Hydrology 11 00168 g002
Figure 3. The annual rainfall and measured annual runoff characteristics observed at Minhe Station on the Huangshui River from 1956 to 2015.
Hydrology 11 00168 g003
Figure 4. Changes in natural and measured runoff at Xiangtang (a) and Minhe (b) stations from 1956 to 2016.
Hydrology 11 00168 g004
Figure 5. Pettitt abrupt test for annual measured runoff observed by Xiangtang (a) and Minhe (b) stations from 1956 to 2016.
Hydrology 11 00168 g005
Figure 6. Monthly flow surplus and deficit chart of Xiangtang (a) and Minhe (b).
Hydrology 11 00168 g006aHydrology 11 00168 g006b
Table 1. The ecological flow recommended by the Tennant method.
Qualitative Description of HabitatsRecommended Base Flow Standard (Percentage of Annual Average Flow)
General Water Use Period (from October to March of the Following Year)Fish Spawning and Juvenile Period (from April to September)
Maximum200200
Optimum flow60~10060~100
Excellent4060
Very good3050
Good2040
Becomes vestigial1030
Poor or minimum1010
Extremely poor<10<10
Table 2. Evaluation criteria for ecological flow guarantee rate.
IndexEvaluation Criterion/%
ExcellentGoodMediumPoorInferior
Ecological flow guarantee rate10095~10090~9580~90<80
Table 3. Ecological surplus and deficit results of Xiangtang Station.
MonthEcological Surplus D E S m /%Ecological Deficit D E D m /%
1956–19931994–20161956–19931994–2016
January0.0260.022−15.4−0.025−0.03956.0
February0.0120.069475.0−0.027−0.03425.9
March0.0340.04223.5−0.013−0.032146.1
April0.0340.020−41.2−0.020−0.077285.0
May0.0580.030−48.3−0.042−0.0420
June0.0480.0528.3−0.041−0.037−9.5
July0.0710.035−50.7−0.056−0.0618.9
August0.0470.05414.9−0.049−0.0538.2
September0.0840.024−71.4−0.036−0.035−2.8
October0.0560.034−39.3−0.033−0.05154.5
November0.0350.031−11.4−0.014−0.036157.1
December0.0320.05159.4−0.012−0.035191.7
Table 4. Ecological surplus and deficit results of Minhe Station.
MonthEcological Surplus D E S m /%Ecological Deficit D E D m /%
1956–19901991–20161956–19901991–2016
January0.0380.04723.7−0.022−0.03140.9
February0.0240.04483.3−0.021−0.02623.8
March0.0640.029−54.7−0.035−0.0388.6
April0.0810.047−42.0−0.049−0.05512.2
May0.1970.042−78.7−0.117−0.114−2.6
June0.0900.065−27.8−0.110−0.077−30.0
July0.0650.043−33.8−0.050−0.07142.0
August0.0540.0551.9−0.037−0.05754.1
September0.0920.060−34.8−0.024−0.060150.0
October0.0750.040−46.7−0.029−0.05693.1
November0.0930.039−58.0−0.028−0.04042.9
December0.0650.018−72.3−0.023−0.02926.1
Table 5. Ecological flow (unit: m3/s).
SectionXiangtangMinhe
Month
January108.32
February108.65
March1010.13
April17.822.16
May28.8718.57
June37.8020.72
July60.8728.43
August58.5431.28
September52.1931.14
October29.9531.13
November1518.43
December1010.21
Table 6. Evaluation of ecological flow guarantee rate.
MonthEcological Flow Guarantee Rate/%Ecological Flow Guarantee
Datong RiverHuangshui RiverDatong RiverHuangshui River
January98100GoodExcellent
February100100ExcellentExcellent
March10098ExcellentGood
April100100ExcellentExcellent
May100100ExcellentExcellent
June100100ExcellentExcellent
July100100ExcellentExcellent
August10098ExcellentGood
September10098ExcellentGood
October100100ExcellentExcellent
November100100ExcellentExcellent
December100100ExcellentExcellent
Disclaimer/Publisher’s Note: The statements, opinions and data contained in all publications are solely those of the individual author(s) and contributor(s) and not of MDPI and/or the editor(s). MDPI and/or the editor(s) disclaim responsibility for any injury to people or property resulting from any ideas, methods, instructions or products referred to in the content.