
Cultural Heritage in the Light of Flood Hazard: The Case of the “Ancient” Olympia, Greece

 ,
,  , ,
, ,  and
and 
Abstract
1. Introduction
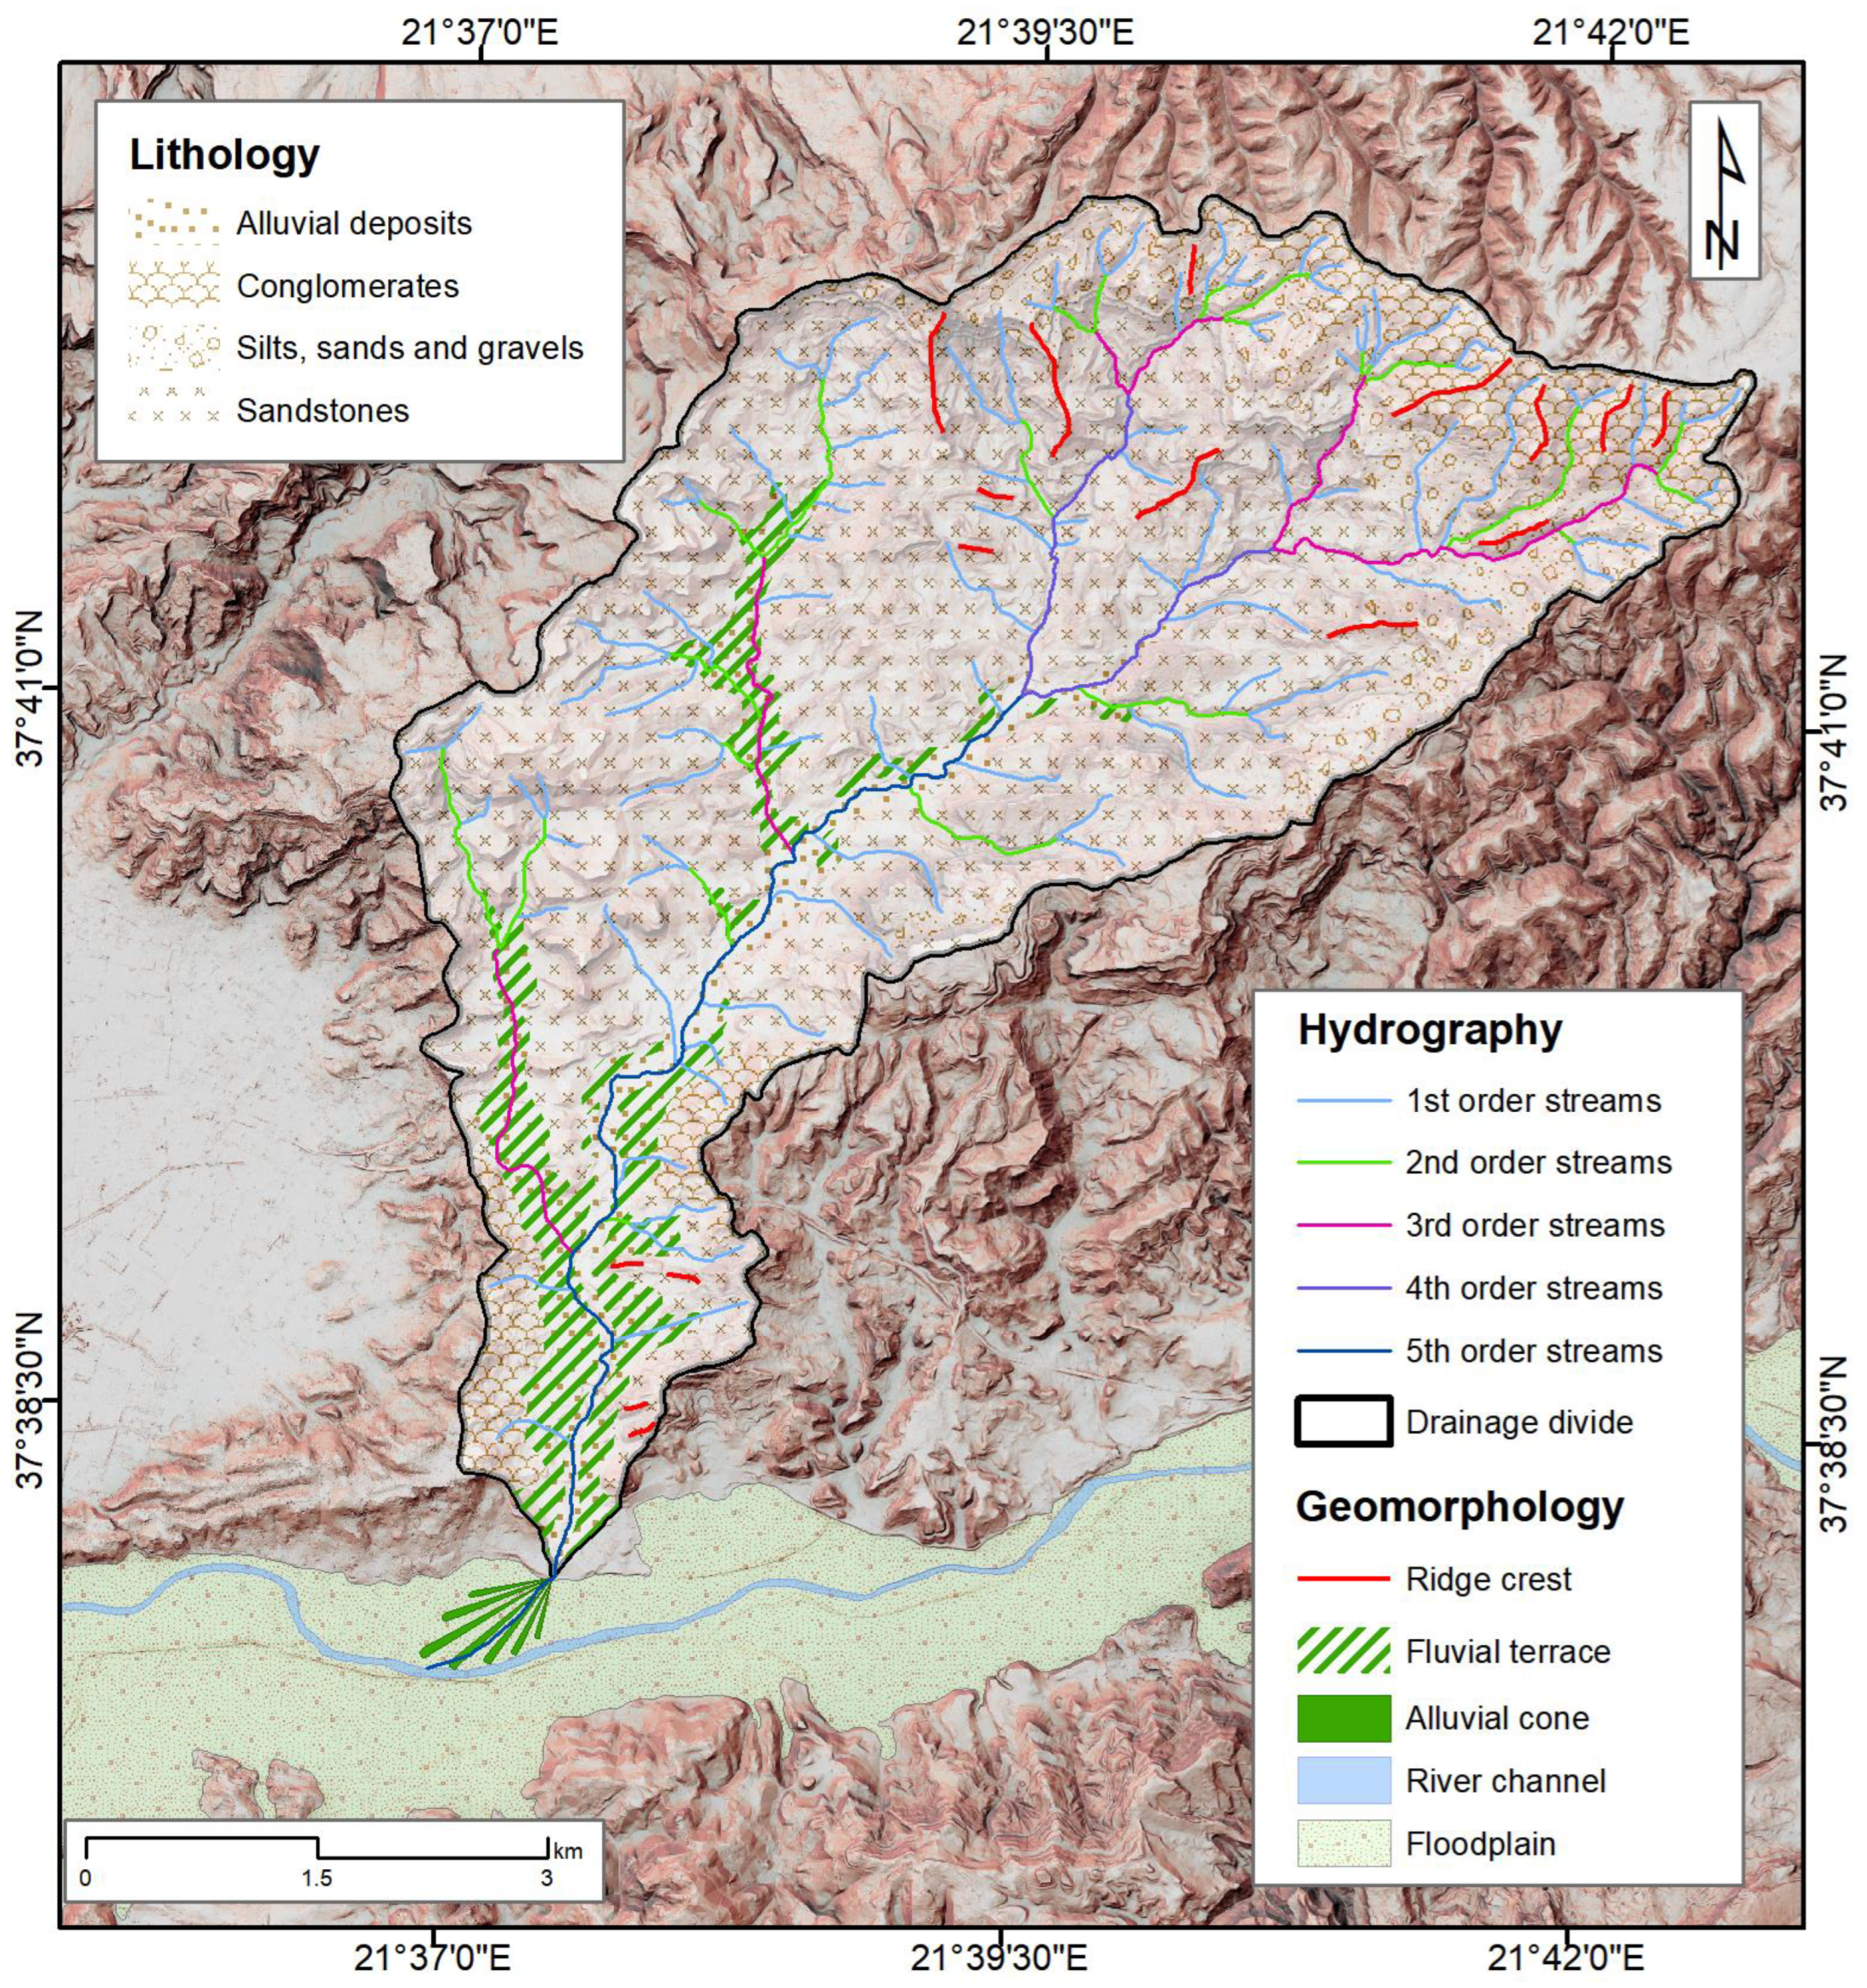
2. Study Area
3. Methodology
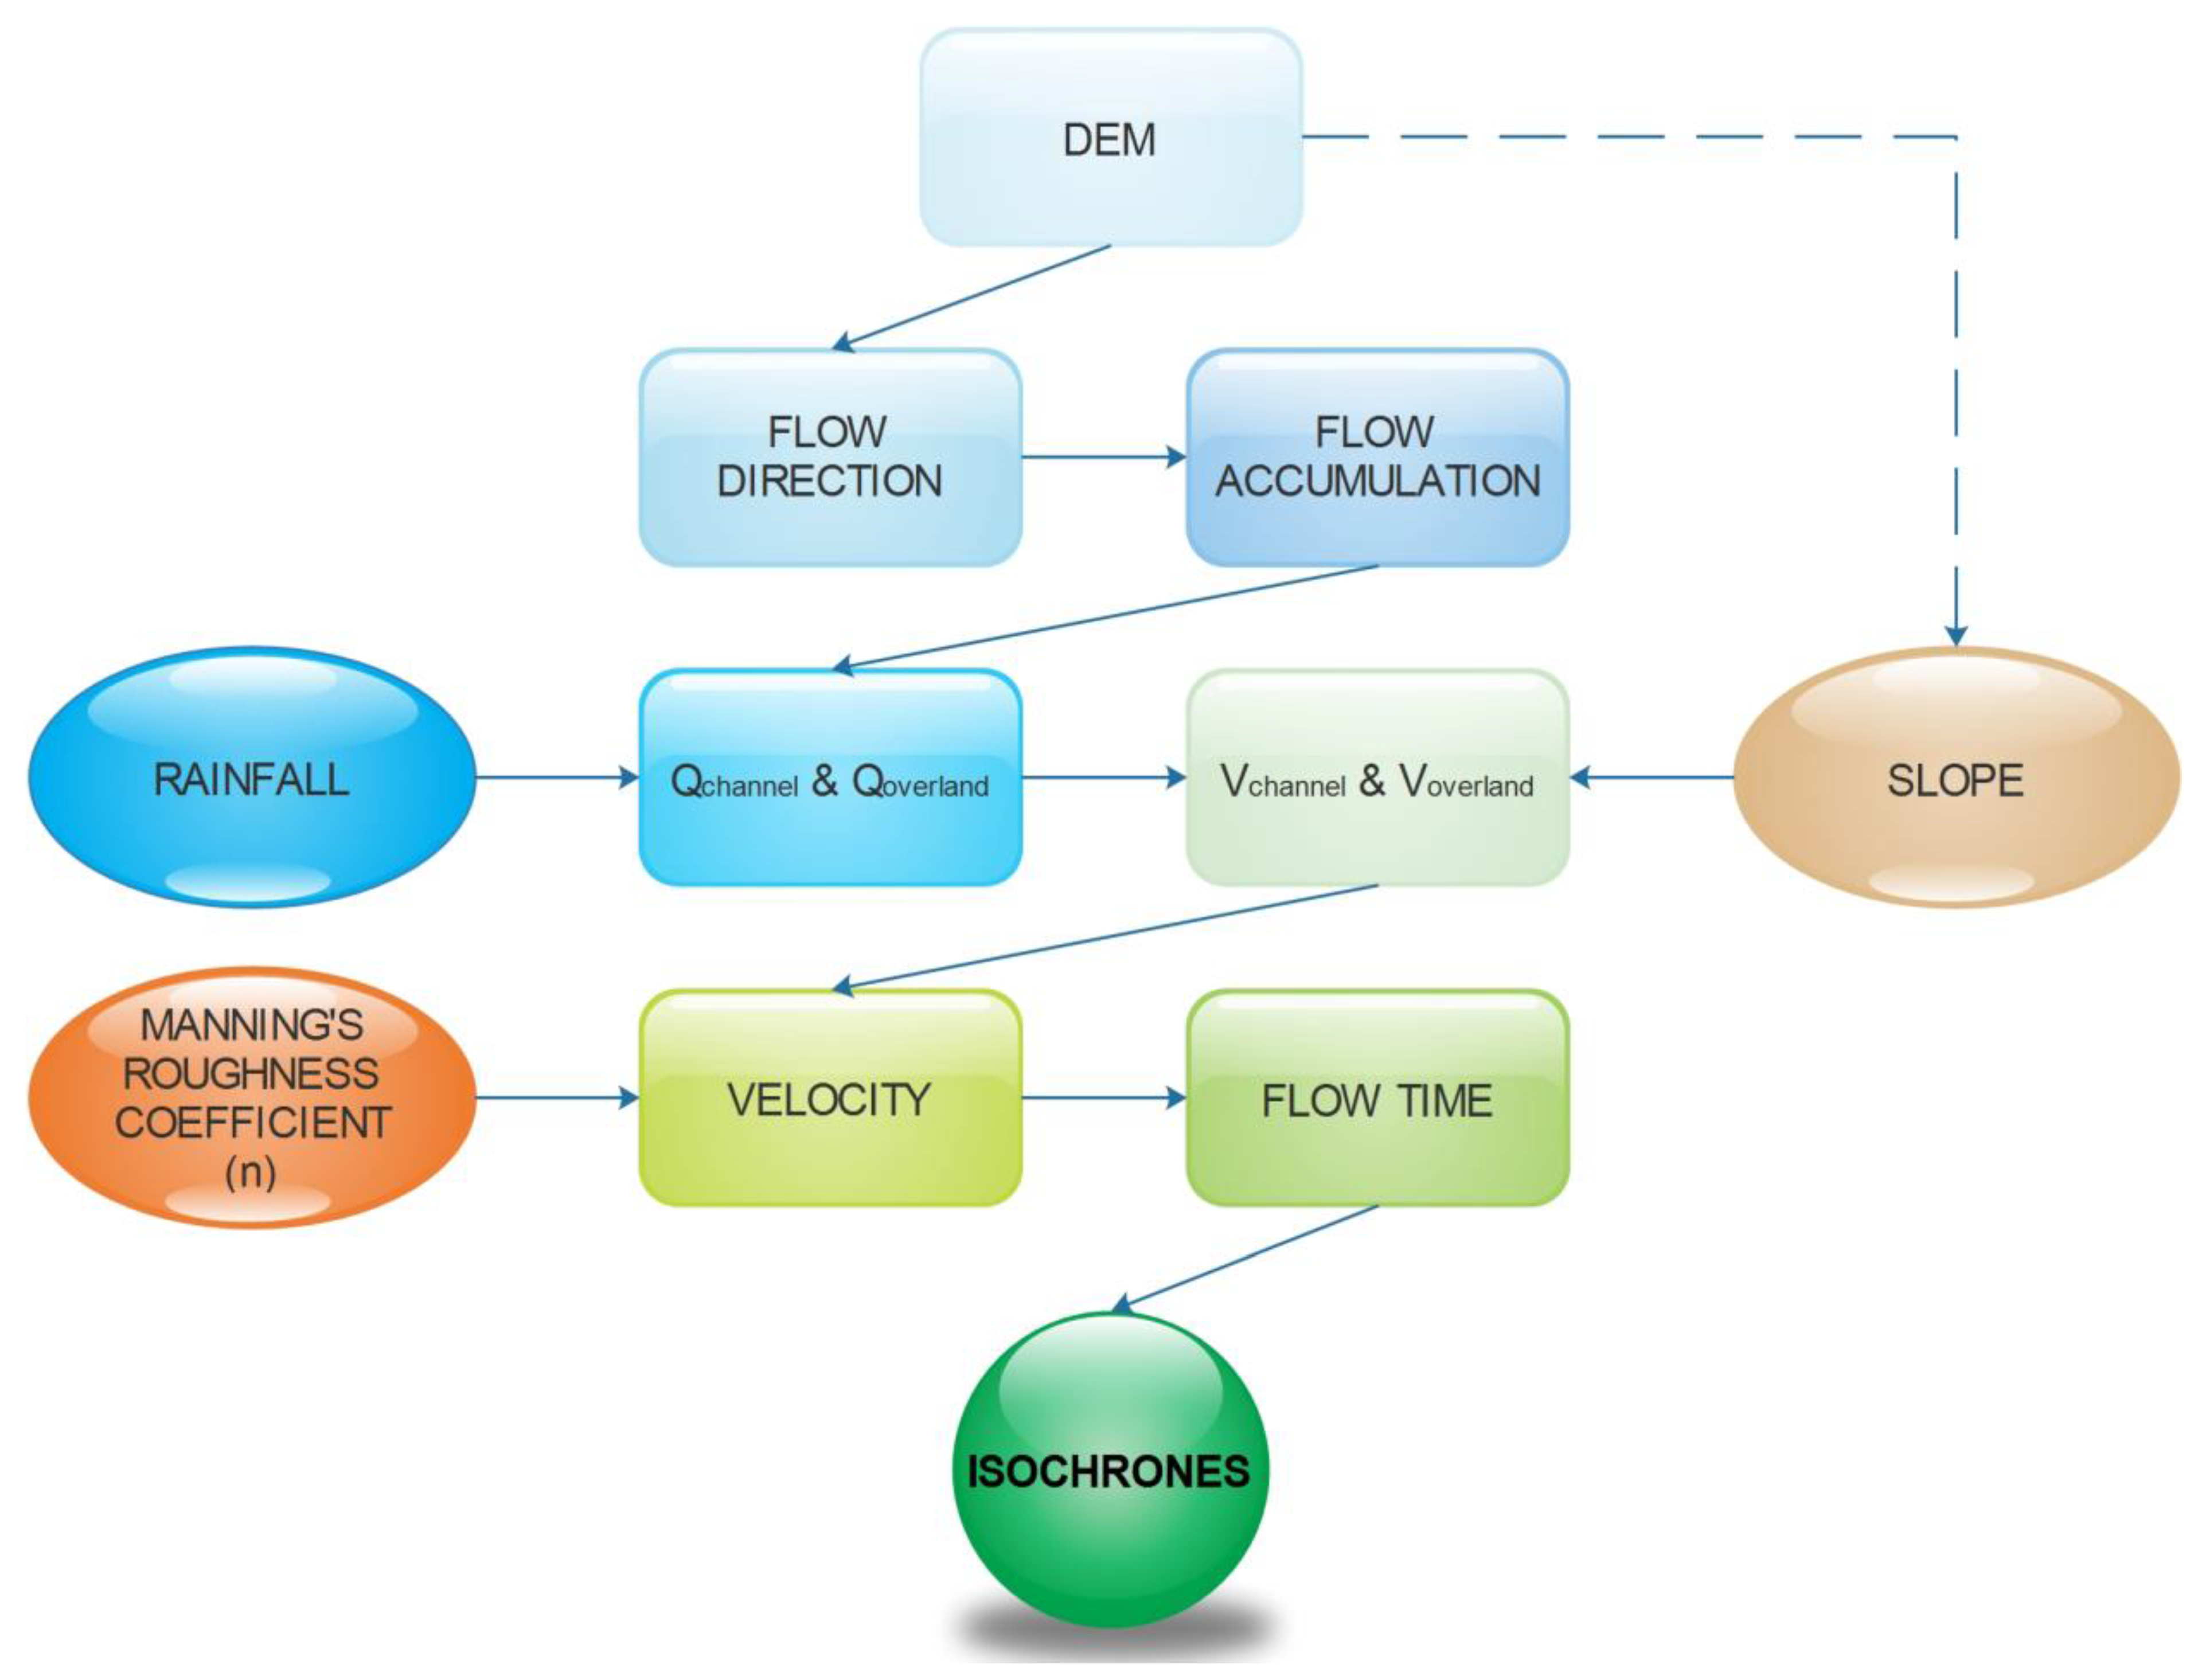
3.1. Hydrological and Morphometric Analysis
3.2. Hydrological Model Development
3.2.1. Hypothetical and Real Scenario Analysis
3.2.2. Entry Data
- Digital Elevation Model (DEM). A key aspect of the proposed process is the need to create a hydrologically valid DEM while preserving the actual morphological features of the study area. This makes the pre-processing of the DEM and its derivatives necessary and essential. A 5 × 5 m DEM was used (Greek Cadaster).
- Manning’s coefficient of roughness. For the purposes of the simulation, this coefficient was derived from a land cover map (Ilot Project, Greece). The resulting categorization according to land cover and the correspondence between each category and the Manning roughness coefficient is shown in the following table (Table 1).
3.2.3. Hydrological Modeling
4. Results and Discussion
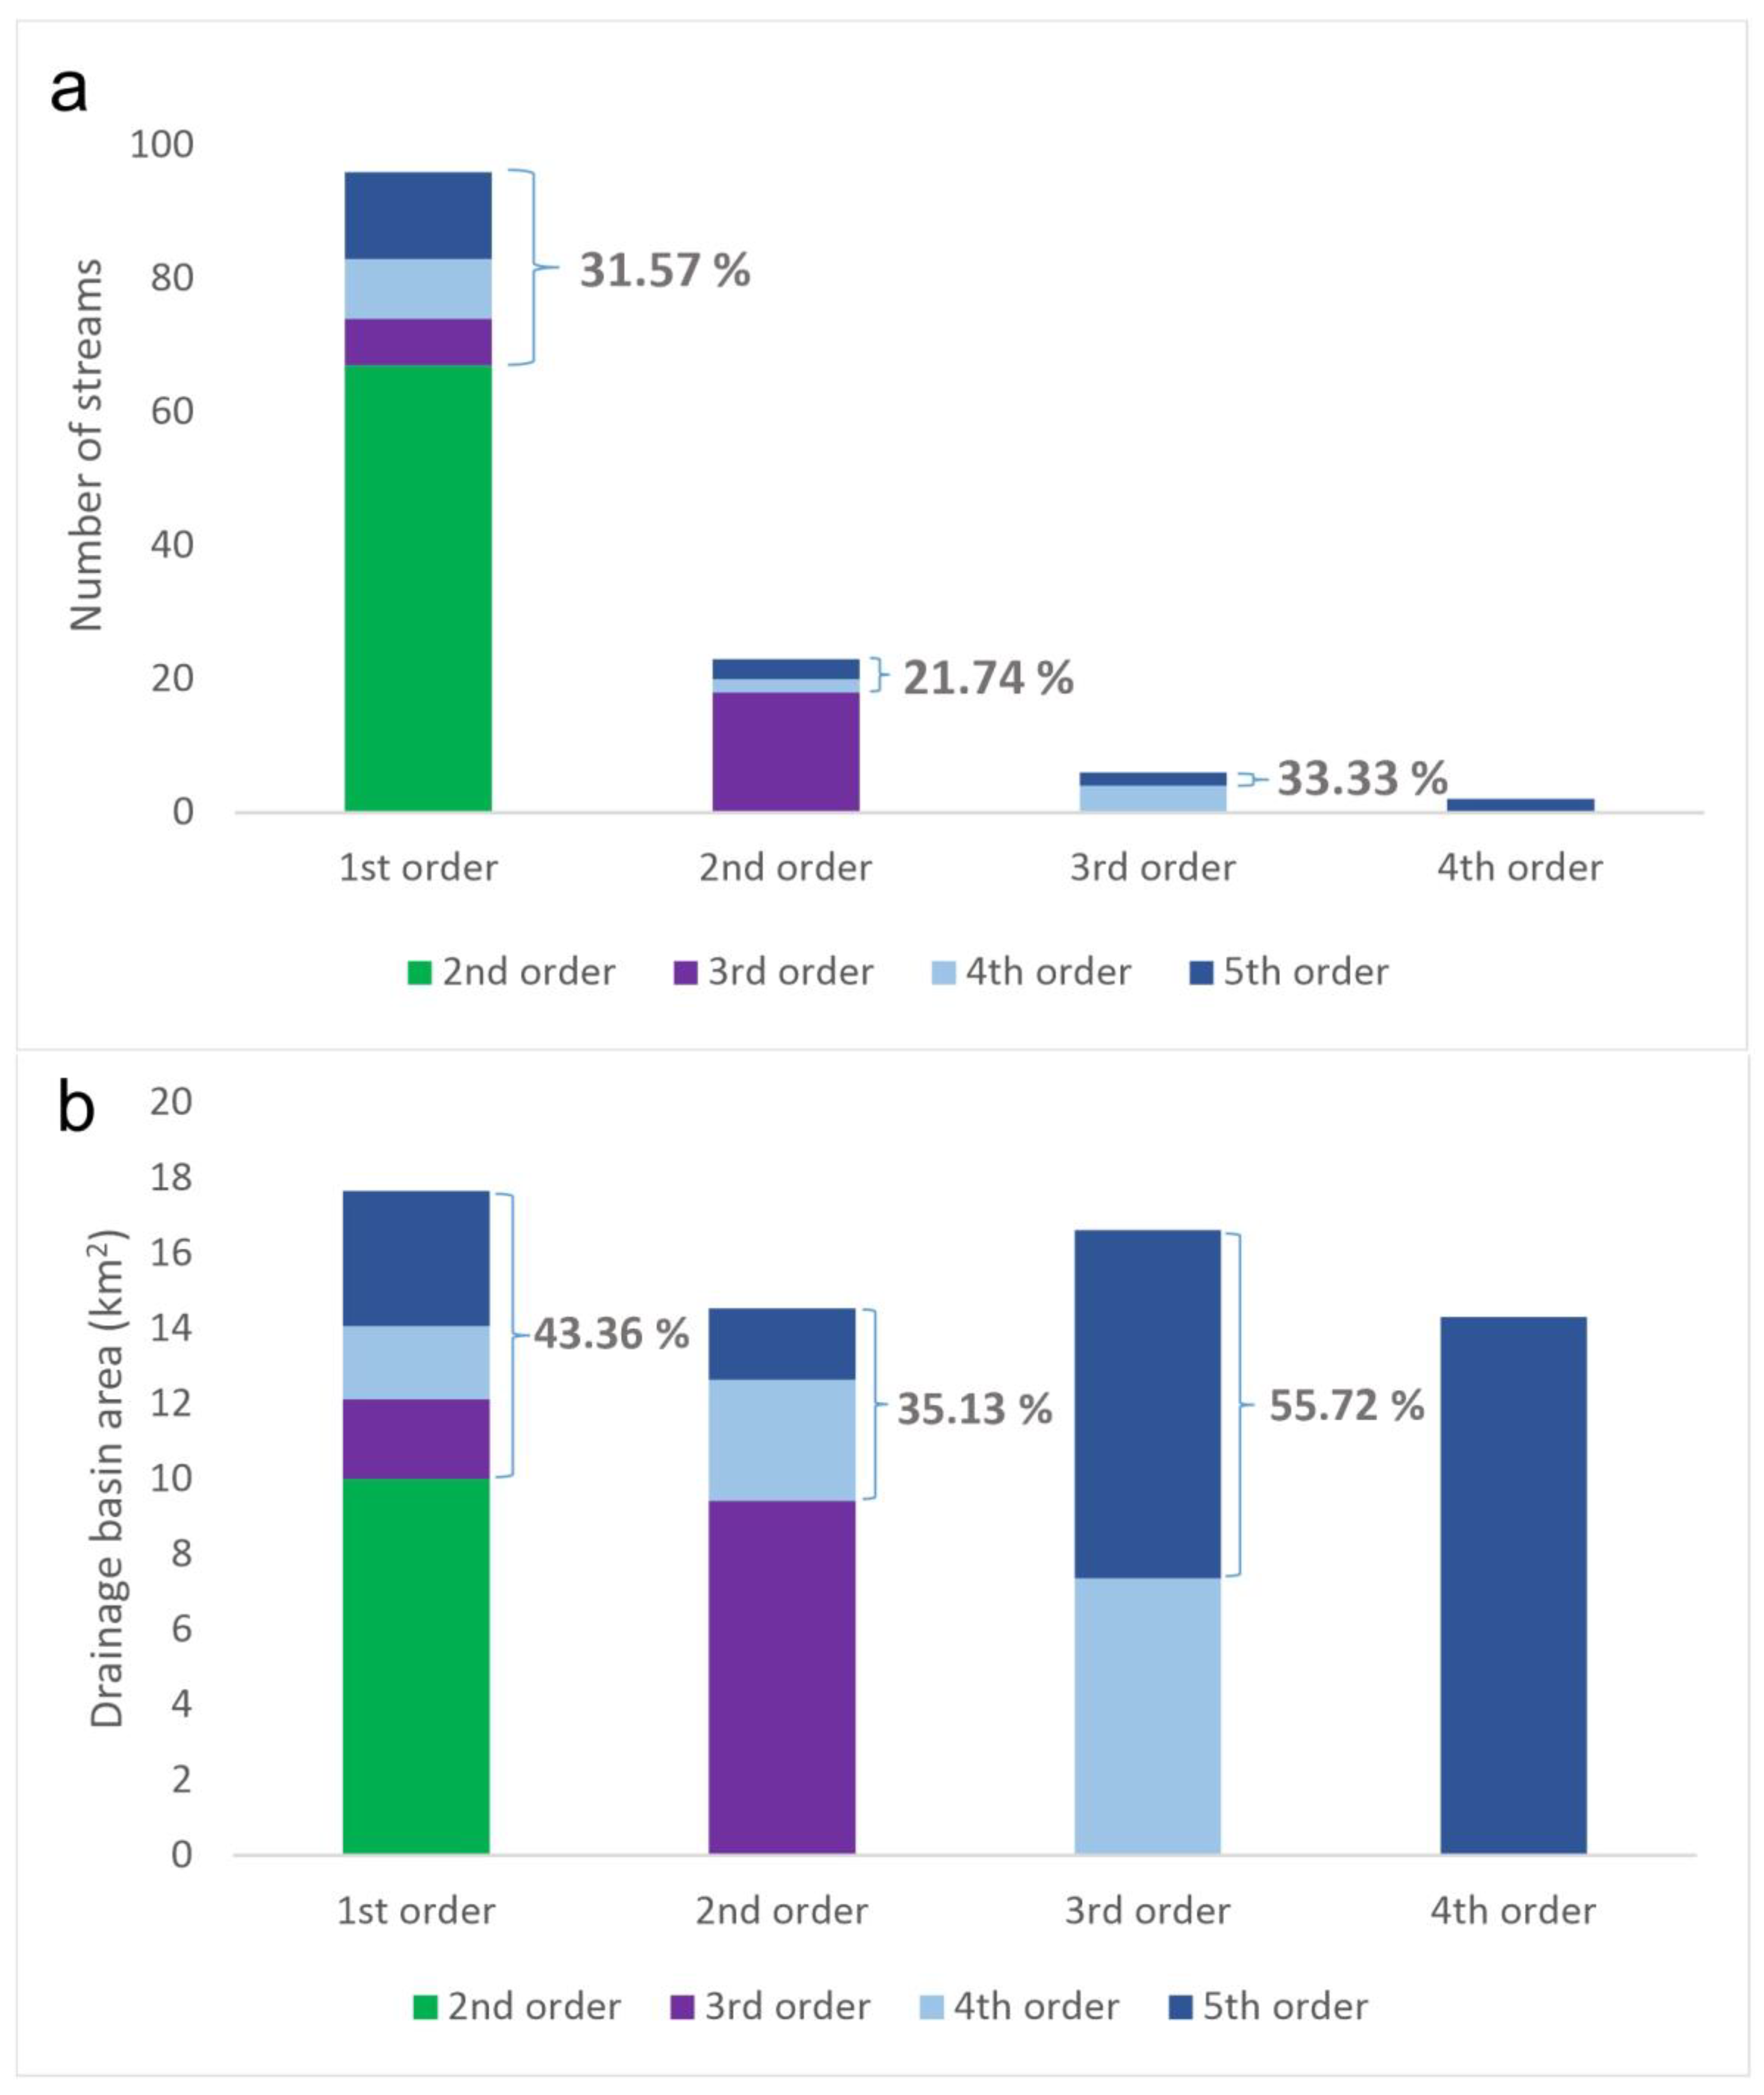
4.1. Hydro-Morphometric Analysis
4.2. Hydrological Modelling
- First peak: 265.61 m3/s at the 5th h (t critical)
- Second peak: 188.06 m3/s at the 10th h.
- Third peak: 231.67 m3/s at the 15th h.
- First peak: 341.48 m3/s at the 2nd h (t critical)
- Second peak: 108.54 m3/s at the 8th h.
5. Conclusions
Author Contributions
Funding
Data Availability Statement
Conflicts of Interest
References
- Kalogeropoulos, K.; Tsatsaris, A.; Stathopoulos, N.; Tsesmelis, D.E.; Psarogiannis, A.; Pissias, E. GIS & Remote Sensing for Local Development. Reservoirs Positioning. In GeoInformatics for Geosciences Advanced Geospatial Analysis Using RS, GIS & Soft Computing; Stathopoulos, N., Tsatsaris, A., Kalogeropoulos, K., Eds.; Earth Observation; Elsevier: Amsterdam, The Netherlands, 2023; ISBN 978-0-323-98983-1. (In press)
- Smith, K.; Petley, D.N. Environmental Hazards: Assessing Risk and Reducing Disaster, 5th ed.; Routledge: Abingdon, UK, 2009. [Google Scholar]
- Kalogeropoulos, K.; Stathopoulos, N.; Psarogiannis, A.; Pissias, E.; Louka, P.; Petropoulos, G.P.; Chalkias, C. An Integrated GIS-Hydro Modeling Methodology for Surface Runoff Exploitation via Small-Scale Reservoirs. Water 2020, 12, 3182. [Google Scholar] [CrossRef]
- Kalogeropoulos, K.; Chalkias, C. Modelling the Impacts of Climate Change on Surface Runoff in Small Mediterranean Catchments: Empirical Evidence from Greece. Water Environ. J. 2013, 27, 505–513. [Google Scholar] [CrossRef]
- Dinh, Q.; Balica, S.; Popescu, I.; Jonoski, A. Climate Change Impact on Flood Hazard, Vulnerability and Risk of the Long Xuyen Quadrangle in the Mekong Delta. Int. J. River Basin Manag. 2012, 10, 103–120. [Google Scholar] [CrossRef]
- Glas, H.; Rocabado, I.; Huysentruyt, S.; Maroy, E.; Salazar Cortez, D.; Coorevits, K.; De Maeyer, P.; Deruyter, G. Flood Risk Mapping Worldwide: A Flexible Methodology and Toolbox. Water 2019, 11, 2371. [Google Scholar] [CrossRef]
- de Moel, H.; van Alphen, J.; Aerts, J.C.J.H. Flood Maps in Europe—Methods, Availability and Use. Nat. Hazards Earth Syst. Sci. 2009, 9, 289–301. [Google Scholar] [CrossRef]
- Norman, L.M.; Huth, H.; Levick, L.; Shea Burns, I.; Phillip Guertin, D.; Lara-Valencia, F.; Semmens, D. Flood Hazard Awareness and Hydrologic Modelling at Ambos Nogales, United States-Mexico Border: Flood Hazard Awareness and Hydrologic Modelling at Ambos Nogales. J. Flood Risk Manag. 2010, 3, 151–165. [Google Scholar] [CrossRef]
- Maantay, J.; Maroko, A. Mapping Urban Risk: Flood Hazards, Race, & Environmental Justice in New York. Appl. Geogr. 2009, 29, 111–124. [Google Scholar] [CrossRef]
- Stamellou, E.; Kalogeropoulos, K.; Stathopoulos, N.; Tsesmelis, D.E.; Louka, P.; Apostolidis, V.; Tsatsaris, A. A GIS-Cellular Automata-Based Model for Coupling Urban Sprawl and Flood Susceptibility Assessment. Hydrology 2021, 8, 159. [Google Scholar] [CrossRef]
- Smith, K. Environmental Hazards: Assessing Risk and Reducing Disaster, 6th ed.; Routledge Taylor & Francis Group: London, UK; New York, NY, USA, 2013; ISBN 978-0-415-68105-6. [Google Scholar]
- Tapia-Silva, F.O.; Nuñez, J.M.; López-López, D. Using SRTM DEM, Landsat ETM+ Images and a Distributed Rainfall-runoff Model to Define Inundation Hazard Maps on Urban Canyons. In Proceedings of the 32nd International Symposium on Remote Sensing of Environment, San Jose, Costa Rica, 25 June 2007. [Google Scholar]
- Alaghmand, S.; Abdullah, R.B.; Abustan, I.; Vosoogh, B. GIS-Based River Flood Hazard Mapping in Urban Area (a Case Study in Kayu Ara River Basin, Malaysia). Int. J. Eng. Technol. 2010, 2, 488–500. [Google Scholar]
- Hewitt, K. Regions of Risk; Routledge: Abingdon, UK, 2014; ISBN 978-1-317-89417-9. [Google Scholar]
- Wang, Y. Using Landsat 7 TM Data Acquired Days after a Flood Event to Delineate the Maximum Flood Extent on a Coastal Floodplain. Int. J. Remote Sens. 2004, 25, 959–974. [Google Scholar] [CrossRef]
- Gioti, E.; Riga, C.; Kalogeropoulos, K.; Chalkias, C. A GIS-Based Flash Flood Runoff Model Using High Resolution DEM and Meteorological Data. EARSeL eProc. 2013, 12, 33–43. [Google Scholar]
- Kalogeropoulos, K.; Karalis, S.; Karymbalis, E.; Chalkias, C.; Chalkias, G.; Katsafados, P. Modeling Flash Floods in Vouraikos River Mouth, Greece. In Proceedings of the 10th Global Congress on ICM: Lessons Learned to Address New Challenges, EMECS 2013—MEDCOAST 2013 Joint Conference, Marmaris, Turkey, 30 October–3 November 2013; Volume 2, pp. 1135–1146. [Google Scholar]
- Tsesmelis, D.E. Development, Implementation and Evaluation of Drought and Desertification Risk Indicators for the Integrated Management of Water Resources. Ph.D. Dissertation, Department of Natural Resources Management & Agricultural Engineering, Agricultural University of Athens, Athens, Greece, 2017. [Google Scholar]
- Tsesmelis, D.E.; Karavitis, C.A.; Kalogeropoulos, K.; Zervas, E.; Vasilakou, C.G.; Skondras, N.A.; Oikonomou, P.D.; Stathopoulos, N.; Alexandris, S.G.; Tsatsaris, A.; et al. Evaluating the Degradation of Natural Resources in the Mediterranean Environment Using the Water and Land Resources Degradation Index, the Case of Crete Island. Atmosphere 2022, 13, 135. [Google Scholar] [CrossRef]
- Tsesmelis, D.E.; Vasilakou, C.G.; Kalogeropoulos, K.; Stathopoulos, N.; Alexandris, S.G.; Zervas, E.; Oikonomou, P.D.; Karavitis, C.A. Drought Assessment Using the Standardized Precipitation Index (SPI) in GIS Environment in Greece. In Computers in Earth and Environmental Sciences; Elsevier: Amsterdam, The Netherlands, 2022; pp. 619–633. ISBN 978-0-323-89861-4. [Google Scholar]
- Lekkas, E. Natural & Technological Disasters; Access Pre-Press. 2000. Available online: https://www.researchgate.net/publication/226053524_Natural_and_Technological_Disasters (accessed on 24 February 2023).
- Stathopoulos, N.; Kalogeropoulos, K.; Polykretis, C.; Skrimizeas, P.; Louka, P.; Karymbalis, E.; Chalkias, C. Introducing Flood Susceptibility Index Using Remote-Sensing Data and Geographic Information Systems. In Remote Sensing of Hydrometeorological Hazards; Earth Sciences, Engineering & Technology, Geography; CRC Press: Boca Raton, FL, USA, 2017; ISBN 978-1-315-15494-7. [Google Scholar]
- Liu, Y.B.; Gebremeskel, S.; De Smedt, F.; Hoffmann, L.; Pfister, L. A Diffusive Transport Approach for Flow Routing in GIS-Based Flood Modeling. J. Hydrol. 2003, 283, 91–106. [Google Scholar] [CrossRef]
- Nikolaos, S.; Kleomenis, K.; Elias, D.; Panagiotis, S.; Panagiota, L.; Vagelis, P.; Christos, C. A Robust Remote Sensing–Spatial Modeling–Remote Sensing (R-M-R) Approach for Flood Hazard Assessment. In Spatial Modeling in GIS and R for Earth and Environmental Sciences; Elsevier: Amsterdam, The Netherlands, 2019; pp. 391–410. ISBN 978-0-12-815226-3. [Google Scholar]
- Gigović, L.; Pamučar, D.; Bajić, Z.; Drobnjak, S. Application of GIS-Interval Rough AHP Methodology for Flood Hazard Mapping in Urban Areas. Water 2017, 9, 360. [Google Scholar] [CrossRef]
- Kourgialas, N.N.; Karatzas, G.P. Flood Management and a GIS Modelling Method to Assess Flood-Hazard Areas—A Case Study. Hydrol. Sci. J. 2011, 56, 212–225. [Google Scholar] [CrossRef]
- Melesse, A.M.; Graham, W.D. Storm Runoff Prediction Based on a Spatially Distributed Travel Time Method Utilizing Remote Sensing and GIS. J. Am. Water Resour. Assoc. 2004, 40, 863–879. [Google Scholar] [CrossRef]
- Tsanakas, K.; Gaki-Papanastassiou, K.; Kalogeropoulos, K.; Chalkias, C.; Katsafados, P.; Karymbalis, E. Investigation of Flash Flood Natural Causes of Xirolaki Torrent, Northern Greece Based on GIS Modeling and Geomorphological Analysis. Nat. Hazards 2016, 84, 1015–1033. [Google Scholar] [CrossRef]
- Tsatsaris, A.; Kalogeropoulos, K.; Stathopoulos, N.; Louka, P.; Tsanakas, K.; Tsesmelis, D.E.; Krassanakis, V.; Petropoulos, G.P.; Pappas, V.; Chalkias, C. Geoinformation Technologies in Support of Environmental Hazards Monitoring under Climate Change: An Extensive Review. IJGI 2021, 10, 94. [Google Scholar] [CrossRef]
- Pradhan, B. Flood Susceptible Mapping and Risk Area Delineation Using Logistic Regression, GIS and Remote Sensing. J. Spat. Hydrol. 2009, 9, 1–18. [Google Scholar]
- Ranaee, E.; Shoushtari, M.M.; Quchani, S.R. The Combination of HEC-Geo-HMS, HEC-HMS and MIKE11 Software Utilize in a Two Branches River Flood Routing Modeling. In Proceedings of the 2009 Second International Conference on Environmental and Computer Science, Dubai, United Arab Emirates, 28–30 December 2009; pp. 317–321. [Google Scholar]
- Chen, J.; Hill, A.A.; Urbano, L.D. A GIS-Based Model for Urban Flood Inundation. J. Hydrol. 2009, 373, 184–192. [Google Scholar] [CrossRef]
- Du, J.; Xie, H.; Hu, Y.; Xu, Y.; Xu, C.-Y. Development and Testing of a New Storm Runoff Routing Approach Based on Time Variant Spatially Distributed Travel Time Method. J. Hydrol. 2009, 369, 44–54. [Google Scholar] [CrossRef]
- Chow, V.T.; Maidment, D.R.; Mays, L.W. Applied Hydrology; McGraw-Hill Series in Water Resources and Environmental Engineering; McGraw-Hill: New York, NY, USA, 1988; ISBN 978-0-07-010810-3. [Google Scholar]
- Hornberger, G.M. (Ed.) Elements of Physical Hydrology, 2nd ed.; Johns Hopkins University Press: Baltimore, MD, USA, 2014; ISBN 978-1-4214-1373-0. [Google Scholar]
- Guerriero, L.; Ruzza, G.; Guadagno, F.M.; Revellino, P. Flood Hazard Mapping Incorporating Multiple Probability Models. J. Hydrol. 2020, 587, 125020. [Google Scholar] [CrossRef]
- Tufano, R.; Guerriero, L.; Annibali Corona, M.; Cianflone, G.; Di Martire, D.; Ietto, F.; Novellino, A.; Rispoli, C.; Zito, C.; Calcaterra, D. Multiscenario Flood Hazard Assessment Using Probabilistic Runoff Hydrograph Estimation and 2D Hydrodynamic Modelling. Nat. Hazards 2022. [Google Scholar] [CrossRef]
- Nuswantoro, R.; Diermanse, F.; Molkenthin, F. Probabilistic Flood Hazard Maps for Jakarta Derived from a Stochastic Rain-Storm Generator: Probabilistic Flood Hazard Maps for Jakarta. J. Flood Risk Manag. 2016, 9, 105–124. [Google Scholar] [CrossRef]
- Nedvedova, K. Flood Protection in Historical Towns. In WIT Transactions on the Built Environment; Brebbia, C.A., Ed.; WIT Press: Southampton, UK, 2015; Volume 1, pp. 757–762. ISBN 978-1-78466-157-1. [Google Scholar]
- Stathopoulos, N.; Kalogeropoulos, K.; Zoka, M.; Louka, P.; Tsesmelis, D.E.; Tsatsaris, A. An Integrated Approach for a Flood Impact Assessment on Land Uses/Cover Based on SAR Images & Spatial Analytics. The Case of an Extreme Event in Sperchios River Basin, Greece. In GeoInformatics for Geosciences Advanced Geospatial Analysis Using RS, GIS & Soft Computing; Stathopoulos, N., Tsatsaris, A., Kalogeropoulos, K., Eds.; Earth Observation; Elsevier: Amsterdam, The Netherlands, 2023; ISBN 978-0-323-98983-1. (In press)
- Despiniadou, V.; Athanasopoulou, E. Flood Prevention and Sustainable Spatial Planning. The Case of the River Diakoniaris in Patras Authors: D. Vespiniadou, E. Athanasopoulo. In Proceedings of the 46th Congress of the European Regional Science Association: “Enlargement, Southern Europe and the Mediterranean”, Volos, Greece, 30 August–3 September 2006. [Google Scholar]
- Drdácký, M.F. Impact of Floods on Heritage Structures. J. Perform. Constr. Facil. 2010, 24, 430–431. [Google Scholar] [CrossRef]
- Karymbalis, E.; Katsafados, P.; Kalogeropoulos, K.; Karalis, S.; Chalkias, C. Flood risk assessment in small torrential catchments. In The Geography of the Coastal and Insular Area; Papadopoulos, A.G., Karymbalis, E., Chalkias, C., Eds.; Stamoulis: Athens, Greece, 2013; p. 340. ISBN 978-960-351-927-0. [Google Scholar]
- Mentzafou, A.; Dimitriou, E. Hydrological Modeling for Flood Adaptation under Climate Change: The Case of the Ancient Messene Archaeological Site in Greece. Hydrology 2022, 9, 19. [Google Scholar] [CrossRef]
- Lanza, S.G. Flood Hazard Threat on Cultural Heritage in the Town of Genoa (Italy). J. Cult. Herit. 2003, 4, 159–167. [Google Scholar] [CrossRef]
- Wang, J.-J. Flood Risk Maps to Cultural Heritage: Measures and Process. J. Cult. Herit. 2015, 16, 210–220. [Google Scholar] [CrossRef]
- Deschaux, J. Flood-Related Impacts on Cultural Heritage. In Floods; Elsevier: Amsterdam, The Netherlands, 2017; pp. 53–72. ISBN 978-1-78548-268-7. [Google Scholar]
- Woodard, R.D. (Ed.) The Cambridge Companion to Greek Mythology; Cambridge University Press: Cambridge, UK; New York, NY, USA, 2007; ISBN 978-0-521-84520-5. [Google Scholar]
- Köppen, W. Versuch Einer Klassifikation Der Klimate, Vorzugsweise Nach Ihren Beziehungen Zur Pflanzenwelt. Geogr. Z. 1900, 6, 657–679. [Google Scholar]
- Köppen, W.; Köppen, R. Handbuch der Klimatologie; Gebrueder Borntraeger: Stuttgart, Germany, 1930. [Google Scholar]
- Angelakis, A.N.; Antoniou, G.; Voudouris, K.; Kazakis, N.; Dalezios, N.; Dercas, N. History of Floods in Greece: Causes and Measures for Protection. Nat. Hazards 2020, 101, 833–852. [Google Scholar] [CrossRef]
- Diakakis, M.; Deligiannakis, G.; Mavroulis, S. Flooding in Peloponnese, Greece: A Contribution to Flood Hazard Assessment. In Advances in the Research of Aquatic Environment; Lambrakis, N., Stournaras, G., Katsanou, K., Eds.; Springer: Berlin/Heidelberg, Germany, 2011; pp. 199–206. ISBN 978-3-642-19901-1. [Google Scholar]
- Strahler, A. Quantitative Analysis of Watershed Geomorphology. Am. Geophys. Union Trans. 1957, 38, 913–920. [Google Scholar] [CrossRef]
- Garbrecht, J.; Shen, H.W. The Physical Framework of the Dependence between Channel Flow Hydrographs and Drainage Network Morphometry. Hydrol. Process. 1988, 2, 337–355. [Google Scholar] [CrossRef]
- Tsanakas, K.; Karymbalis, E.; Gaki-Papanastassiou, K.; Maroukian, H. Geomorphology of the Pieria Mtns, Northern Greece. J. Maps 2019, 15, 499–508. [Google Scholar] [CrossRef]
- Fountoulis, I.; Mavroulis, S. Flood Hazard Assessment in the Kladeos River Basin (Olympia—Western Peloponnese, Greece). In Proceedings of the AQUA 2008 3rd International Conference, Athens, Greece, 16–19 October 2008. [Google Scholar]


| Description | Manning’s Roughness Coefficient |
|---|---|
| Forest areas | 0.2 |
| Urban area | 0.015 |
| Grassland-Pasture land | 0.1 |
| Arable crops | 0.1 |
| Permanent crops | 0.1 |
| Olive grove | 0.15 |
| Vineyard | 0.05 |
| Mixed forest land | 0.2 |
| Urban mixed areas | 0.015 |
| Meadows and grassland mixed | 0.1 |
| Edible mixed | 0.1 |
| Permanent mixed | 0.1 |
| Mixed olive groves | 0.15 |
| Mixed vineyard | 0.05 |
| Stream Order (u) | Number of Streams (Nu) | Bifurcation Ratio (Rb) | Mean Bifurcation Ratio (Rb(mean)) | Ideal Stream Number | Divergence (%) | Total Drainage Basin Area (km2) |
|---|---|---|---|---|---|---|
| 1 | 95 | Rb1,2 = 4.13 | 3.24 | 110 | −13.63 | 17.67 |
| 2 | 23 | 34 | −32.35 | 14.55 | ||
| Rb2,3 = 3.83 | ||||||
| 3 | 6 | 10 | −40 | 16.62 | ||
| Rb3,4 = 3.0 | ||||||
| 4 | 2 | 3 | −33.33 | 14.32 | ||
| Rb4,5 = 2.0 | ||||||
| 5 | 1 | 1 | 0 | 33.23 |
| Drainage by Stream Order | Number of Streams | % of Total Number by Order | Drainage Basin Area (km2) | % of Total Area by Order | ||||||||
|---|---|---|---|---|---|---|---|---|---|---|---|---|
| 1st to 2nd | 65 | 68.43 | 10.01 | 56.64 | ||||||||
| 1st to 3rd | 8 |  | 30 | 8.42 | | 31.57 | 2.12 | | 7.66 | 11.99 | | 43.36 |
| 1st to 4th | 9 | 9.47 | 1.94 | 10.97 | ||||||||
| 1st to 5th | 13 | 13.68 | 3.60 | 20.40 | ||||||||
| 2nd to 3rd | 18 | 78.26 | 9.44 | 64.87 | ||||||||
| 2nd to 4th | 2 |  | 5 | 8.69 | | 21.74 | 3.20 | | 5.11 | 22.0 | | 35.13 |
| 2nd to 5th | 3 | 13.05 | 1.91 | 13.13 | ||||||||
| 3rd to 4th | 4 | 66.67 | 7.36 | 44.28 | ||||||||
| 3rd to 5th | 2 | 33.33 | 9.26 | 55.72 | ||||||||
| 4th to 5th | 2 | 100 | 14.32 | 100 | ||||||||
Disclaimer/Publisher’s Note: The statements, opinions and data contained in all publications are solely those of the individual author(s) and contributor(s) and not of MDPI and/or the editor(s). MDPI and/or the editor(s) disclaim responsibility for any injury to people or property resulting from any ideas, methods, instructions or products referred to in the content. |
© 2023 by the authors. Licensee MDPI, Basel, Switzerland. This article is an open access article distributed under the terms and conditions of the Creative Commons Attribution (CC BY) license (https://creativecommons.org/licenses/by/4.0/).
Share and Cite
Kalogeropoulos, K.; Tsanakas, K.; Stathopoulos, N.; Tsesmelis, D.E.; Tsatsaris, A. Cultural Heritage in the Light of Flood Hazard: The Case of the “Ancient” Olympia, Greece. Hydrology 2023, 10, 61. https://doi.org/10.3390/hydrology10030061
Kalogeropoulos K, Tsanakas K, Stathopoulos N, Tsesmelis DE, Tsatsaris A. Cultural Heritage in the Light of Flood Hazard: The Case of the “Ancient” Olympia, Greece. Hydrology. 2023; 10(3):61. https://doi.org/10.3390/hydrology10030061
Chicago/Turabian StyleKalogeropoulos, Kleomenis, Konstantinos Tsanakas, Nikolaos Stathopoulos, Demetrios E. Tsesmelis, and Andreas Tsatsaris. 2023. "Cultural Heritage in the Light of Flood Hazard: The Case of the “Ancient” Olympia, Greece" Hydrology 10, no. 3: 61. https://doi.org/10.3390/hydrology10030061
APA StyleKalogeropoulos, K., Tsanakas, K., Stathopoulos, N., Tsesmelis, D. E., & Tsatsaris, A. (2023). Cultural Heritage in the Light of Flood Hazard: The Case of the “Ancient” Olympia, Greece. Hydrology, 10(3), 61. https://doi.org/10.3390/hydrology10030061