1. Introduction
The sediments in large rivers are often considered as a quantitative issue associated with erosion, hydromorphology, etc. However, these sediments are carrying organic and mineral pollutants, so that they can be sources of pollution [
1]. The description of the processes that determine the transportation of particulates and dissolved matter in the hydrographic network is of primary importance to characterize pollution emerging from elements with high speciation. A micropollutant is defined as a substance detectable in the environment at very low concentrations (microgram per liter or even nanogram per liter). Very low concentrations of these substances can cause negative effects on living organisms depending on their toxicity, persistence and/or bioaccumulation [
2]. Micropollutants are a major issue in the management of surface water quality around the world [
3,
4,
5]. The biogeochemical processes and the loads from the watershed that modulate micropollutant concentrations have received considerable attention in recent literature. Mathematical modelling helps to simulate the fate and transportation of micropollutants and supports water quality management decisions [
3].
Several international environmental organizations consider sediment contamination as a major risk in aquatic environments because heavy metals remain in the environment as micropollutants of high toxicity [
1].
The chemical forms (free ions, bound complexes, etc.) of trace metals are controlled by the physicochemical and biological characteristics of the system. Their mobility, transportation and partitioning in natural river systems (including water columns and sediments) involve very complex processes that depend on the physicochemical properties of the contaminants, water and sediments [
6]. Major variations of these forms and concentrations are due to the biogeochemical processes which drive speciation reactions. The dissolved concentrations of these elements depend on their interactions with solid components in the sediment, trough adsorption/desorption and dissolution/precipitation reactions coupled to complexation, acidification or redox reactions.
The chemical speciation is reported as the distribution of an element amongst defined chemical species in a system [
7]. Trace metals are highly persistent in sediments since they cannot be degraded. Once they have entered an aquatic ecosystem, trace metals are involved in biogeochemical processes and distributed under many different chemical forms. Their reactivity is (i) determined by their interaction with a large variety of inorganic and organic compounds and (ii) controlled by interdependent acid–base, redox, complexation, adsorption, and precipitation reactions [
8]. Trace metals interact with a broad spectrum of biotic and abiotic components via dynamic interrelated processes. As a result, they exist in different forms such as free uncomplexed ions, bound to small inorganic or organic ligands, particles, or inorganic or organic colloids, with different reactivity and biological availability [
8].
This study focused on Cu and Zn (dissolved and inorganic forms) while interacting with water columns and sediments. The characterization of the dissolved and particulate forms is also a challenge [
9]. Attention has to be paid to the solid–liquid partitioning coefficient of trace metals [
10]. The partitioning of trace metals between the particulate concentration and dissolved concentration in the water column, expressed as the partition coefficient (Kd), depends on the chemical processes affecting the trace metal phases. Most elements have been documented [
11].
The form of a trace metal is one of the major factors for the characterization of some specific pollution. It influences trace metal behavior, ability to sediment, and downstream transportation (depending on the flow velocity and other hydrodynamic conditions of the watercourse).
Particles in a river can be divided into two parts, permanently suspended particles and settleable particles, depending on their grain size and density as well as the flow conditions. The bed sediment is an integral part of a river which also constitutes a sink for metals [
1]. After sedimentation on the riverbed, the particles can return to suspension in the water column and may lead to the redistribution of trace metals between the particulate and dissolved phases [
10]. Particularly, it is believed that fine sediments of an aquatic system, such as silts and clays, are of extreme importance in the trace metal transportation due to their relative high surface area and their physicochemical properties facilitating then their capacity to adsorb substances [
1]. Suspended particles in the water column are usually in a temporary state of exchange with the bed sediment reservoir. On one hand, the hydrodynamic processes of sedimentation, resuspension and generation of particles, coupled with their high reactivity, play a key role in the availability, transportation and fate of metals in the aquatic environment. On another hand, variable physicochemical characteristics, adsorption and desorption reactions and mixing processes influence the particulate metal concentrations [
12,
13].
The goals of this paper were to (1) improve the description of the processes involved in the transportation and fate of trace metals in the river ecosystem, (2) estimate the partitioning coefficient of trace metals between the dissolved and particulate phases, and (3) provide useful data for water quality management [
14], i.e., European Water Framework Directive 2000/60/EC [
15], and the assessment of river sediments.
We decided to investigate two large basins in Western Europe: the Meuse District and the Mosel Basin (tributary of the Rhine). They are representative of the European aquatic ecosystem by their typology, hydromorphology and associated pressures.
2. Materials and Methods
2.1. Study Areas
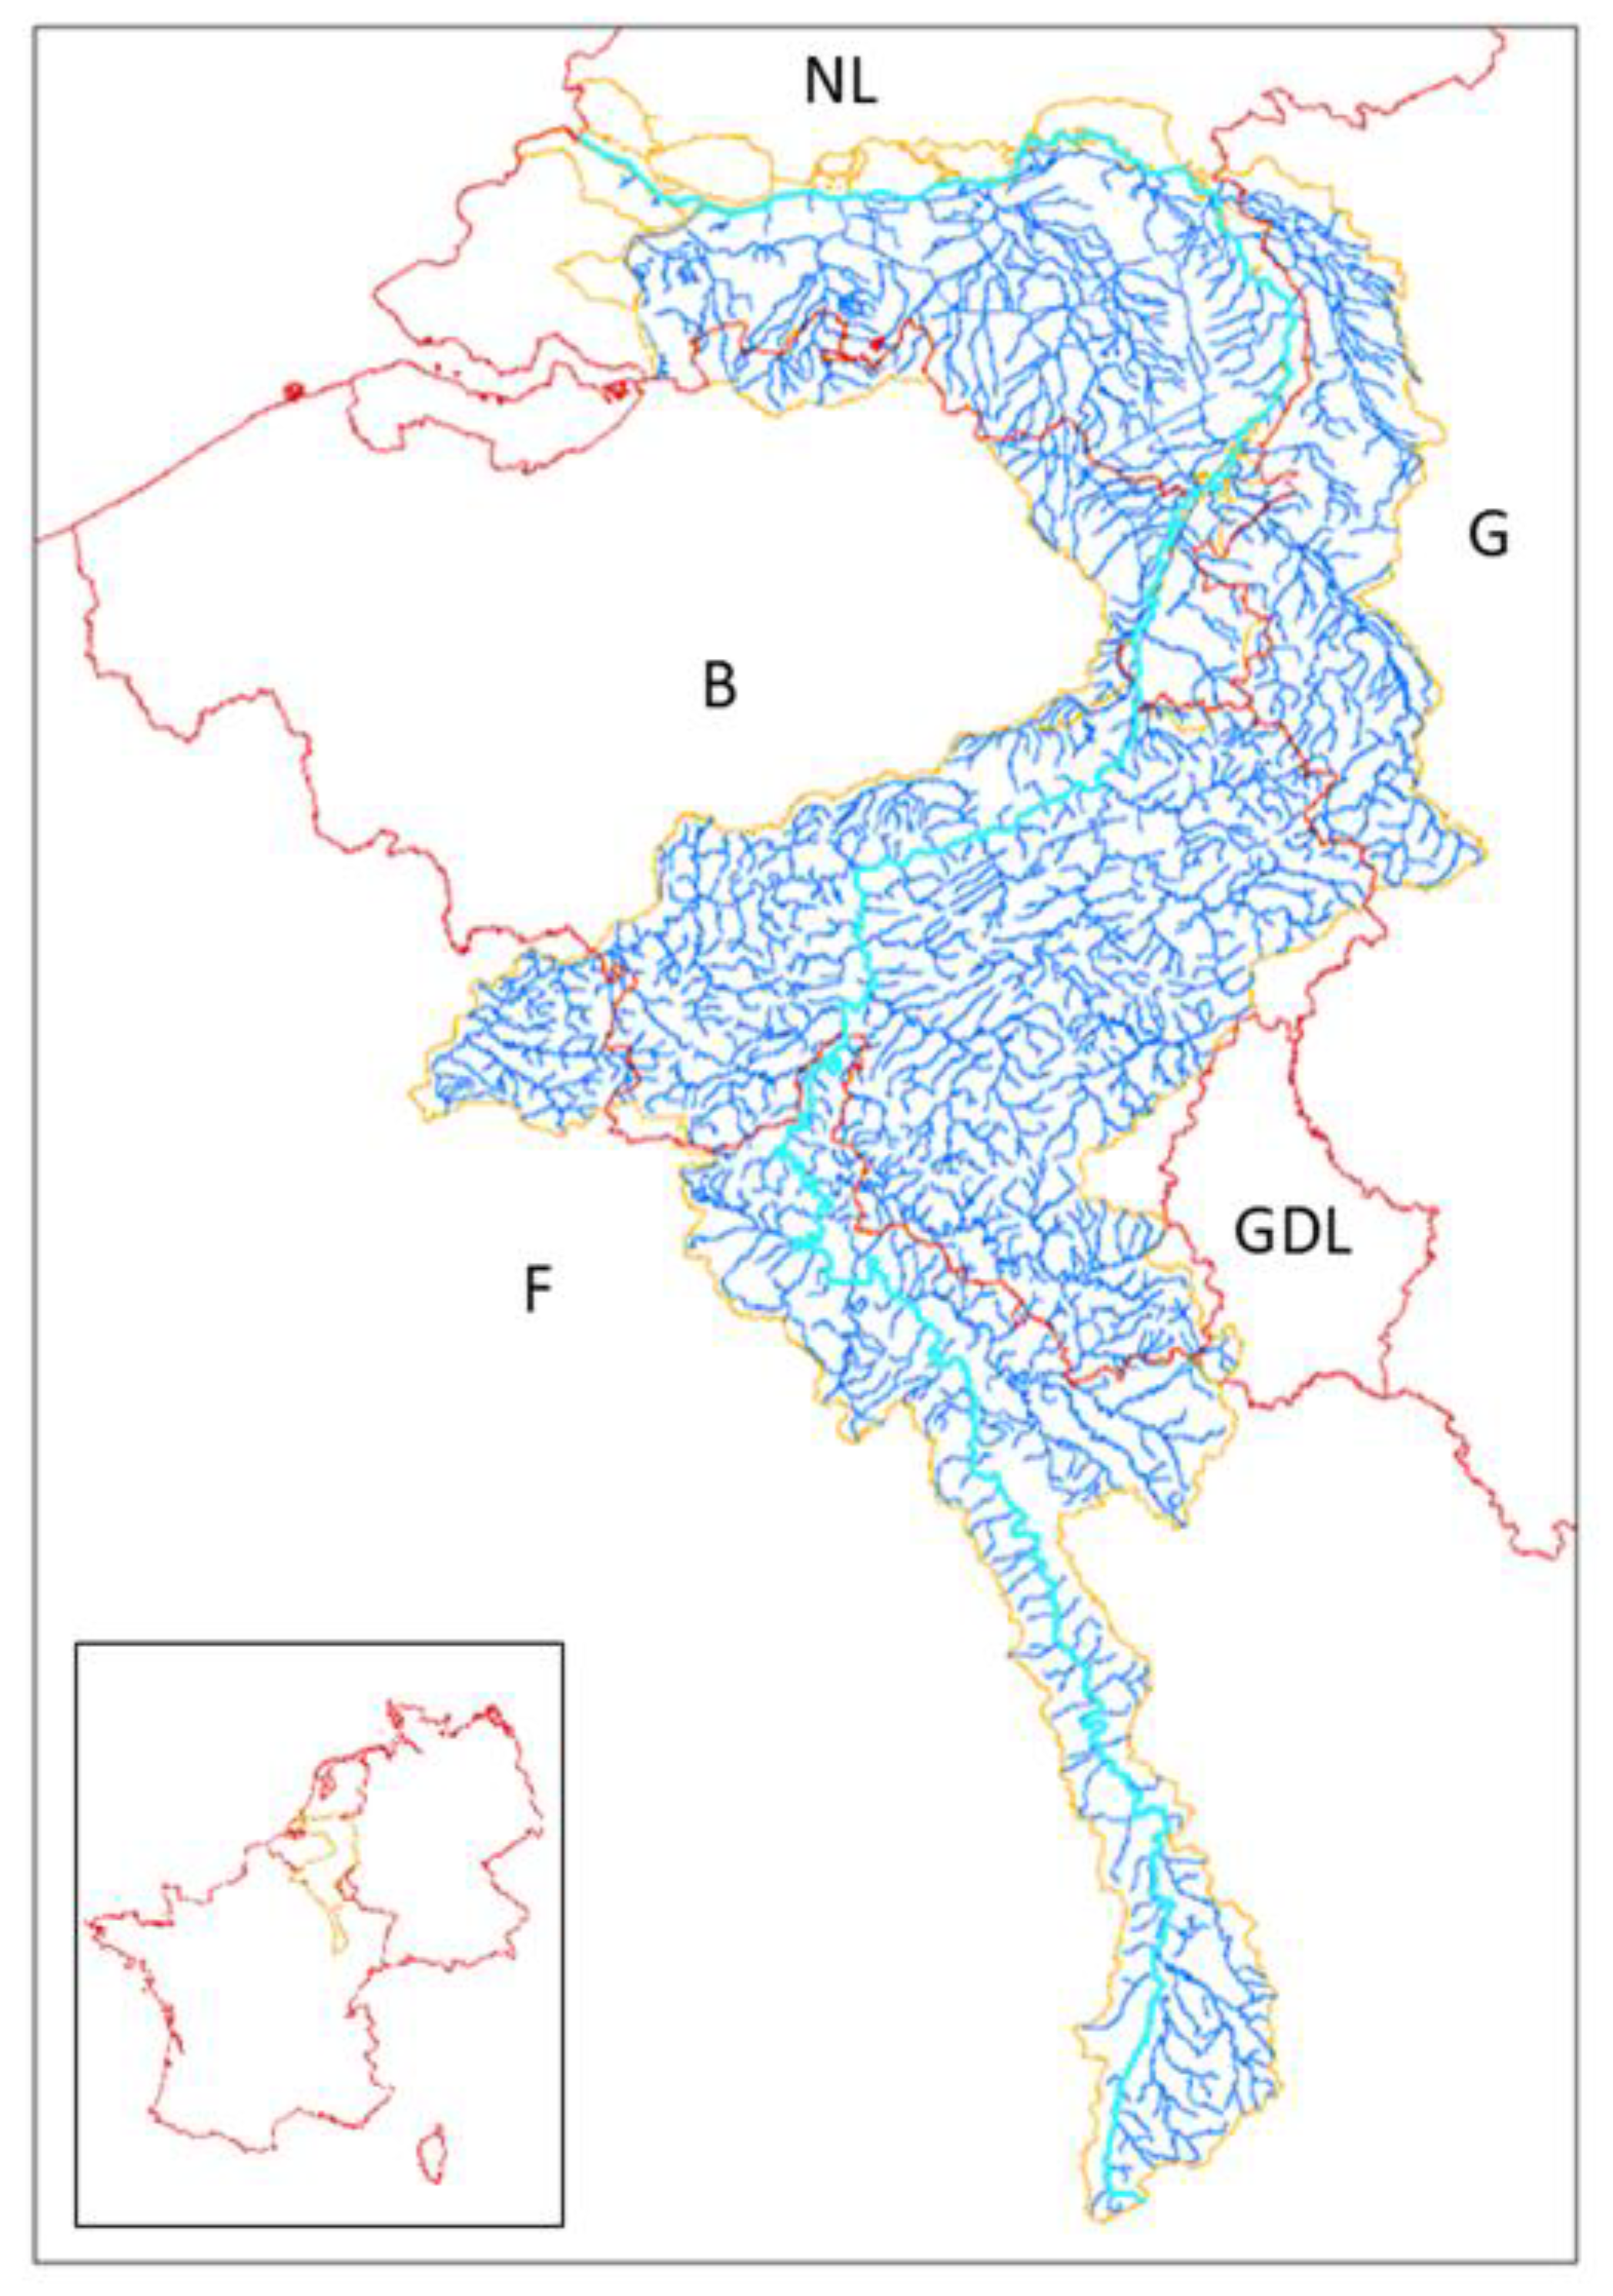
The first investigated basin was the Meuse International District, located in Western Europe (
Figure 1).
The Meuse River, which flows from the South to the North, has its source in France, near the Plateau de Langres. The Meuse length is 905 km, and its entire catchment has an area of 34,564 km2.
The study site was the Eijsden measurement station, located at the Belgian–Dutch border, at the 617 km point. At this point, the Meuse has a watershed of 20,554 km
2 and a characteristic low flow (i.e. daily flow not reached more than 10 days per year, the 2.7 percentile, 10/365), estimated to be 54.7 m
3/s for the year 2021 [
16]. The trace metals studied in this paper were copper and zinc. The natural background concentrations are generally about 0.06 µg/L [
17] and 0.7–10 µL/L [
18] in unpolluted river water, respectively, depending on the lithology of the bedrocks. The Cu and Zn average concentrations measured at Eijsden (~3 µg/L and ~20 µg/L, respectively, for the period 2002–2020) were higher than the lower thresholds provided from anthropogenic sources [
19]. These values allowed us to estimate the flux, at this point, of Cu about 5175 kg/an and Zn about 34,500 kg/an.
The French part of the watershed is managed by the Rhine–Meuse Water Agency and the Artois–Picardie Water Agency. The Meuse crosses the Walloon region (in Belgium) and the Netherlands, to flow towards the North Sea, south of Rotterdam. Some tributaries of the Meuse have their sources in the Grand Duchy of Luxembourg, in France (Artois-Picardie Water Agency), in the Flemish region (Belgium) and in Germany.
The French part of the Meuse River basin is essentially agricultural and forest. The Belgian part of the basin becomes more urban and industrial, up to the Netherlands [
20,
21,
22,
23,
24]. The Meuse River is then canalized and used for navigation and goods transportation.
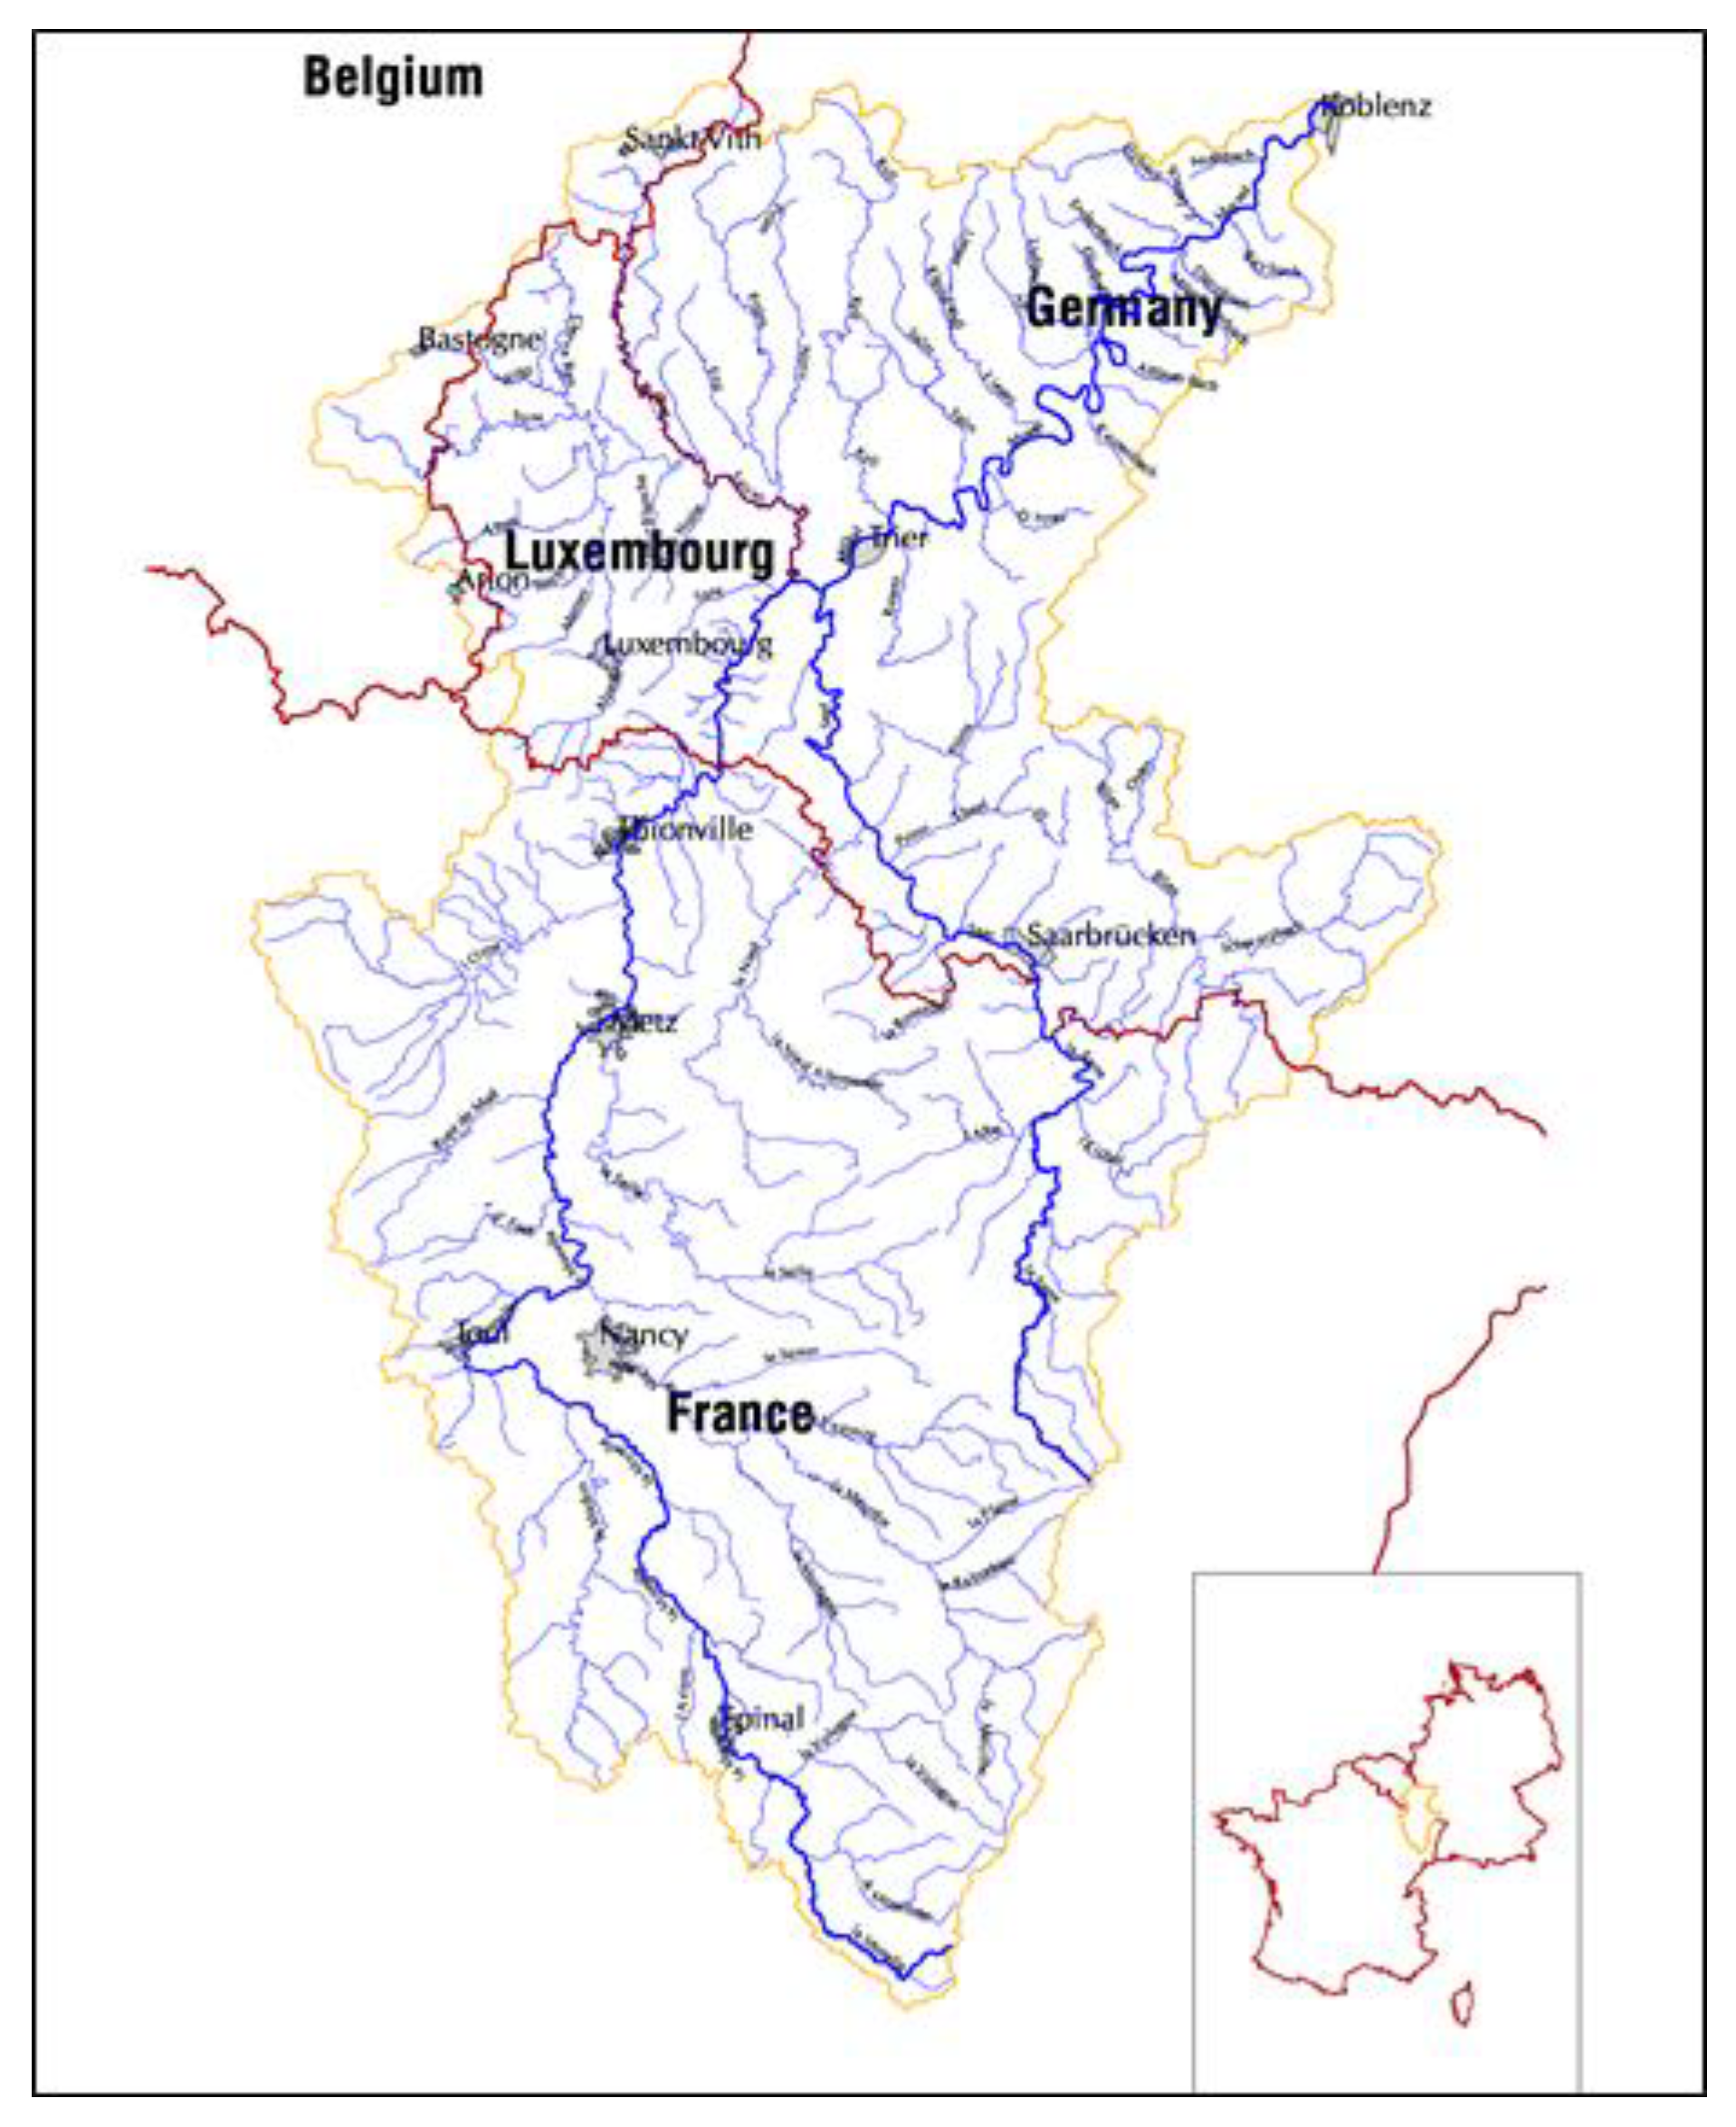
The Mosel, the second investigated watershed, is a part of the Mosel–Saar Transnational Basin, located in Western Europe (
Figure 2).
The Mosel has its source in France where it is managed by the Rhine-Meuse Water Agency. Its length is 544 km long and its entire catchment has an area of 28,286 km
2. The study reach was 314 km upstream located in France. At the French outlet, the Mosel has a watershed of 11,280 km
2. Low flow (i.e. monthly minimum flow reached once every five years; statistical flow that gives information on the severity of the low flow) of the Mosel at this point is about 31.6 m
3/s [
25]. The Cu and Zn annual fluxes are estimated at 13,000 kg/an and 30,000 kg/an, respectively [
26].
The Mosel streams towards the GD Luxembourg and Germany, and flows into the Rhine at Koblenz (Germany). The Mosel is canalized from Nancy (150 km from its source). The Mosel watershed is mainly agricultural and forest. Urbanized and industrial areas are developed on the downstream part of the basin [
27,
28].
2.2. Data
The Meuse and the Mosel are well-instrumented watercourses. They provided the two separately datasets used in this study.
In the Meuse District, the Eijsden measurement station monitors daily water quality (
Supplementary Materials, Figure S1). These measurements are freely downloadable on the website of the Rijkswaterstaat, Ministerie van Infrastructuur en Waterstaat [
19].
Decades of weekly measurements of the dissolved and total concentrations of several substances are also downloadable. Total suspended sediment (SS) concentrations, mass concentrations of total SS, grain size (percentages of SS < 2 µm, < 16 µm and < 63 µm) are available.
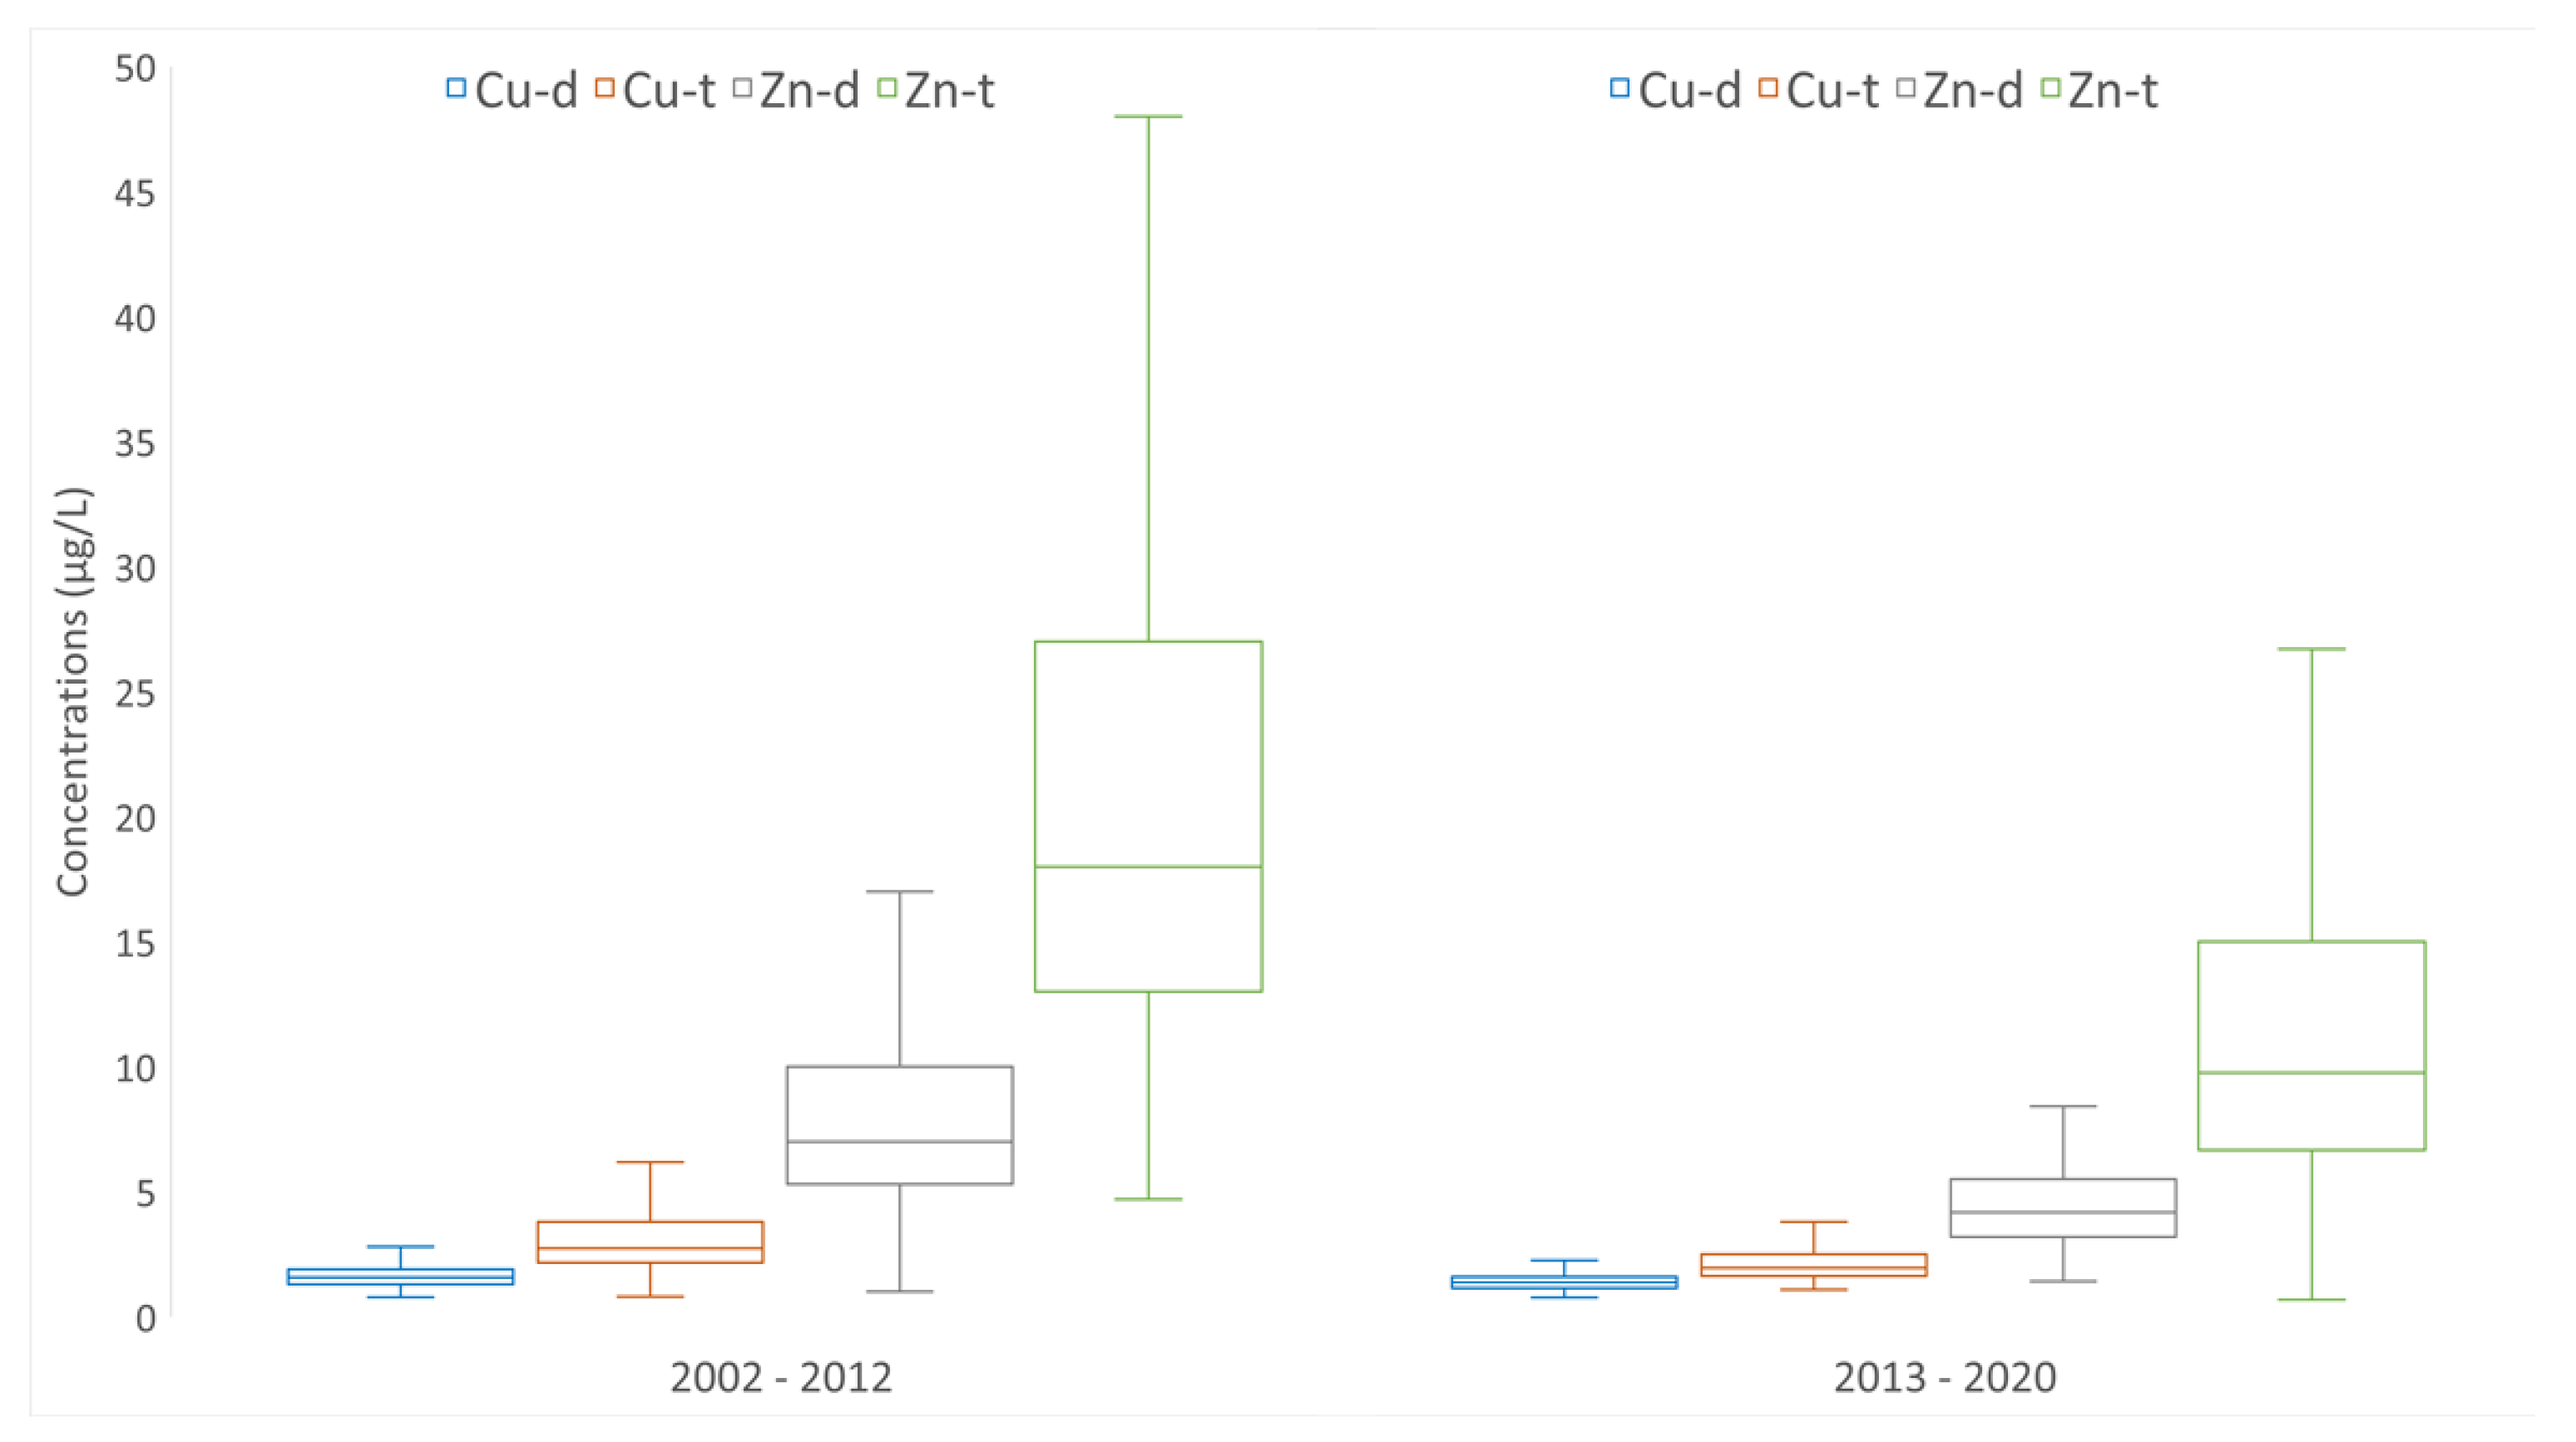
The dissolved and total concentrations of copper and zinc decreased in the Meuse between the two periods illustrated in
Figure 3. For the period 2002–2012, the values of total and dissolved copper concentrations ranged from 0.8 to 98 µg/L and 0.78 to 16 µg/L, respectively. The median value of the total and dissolved copper concentrations were 2.73 µg/L and 1.57 µg/L, respectively, and the average value of the total and dissolved copper concentrations were 3.70 µg/L and 1.74 µg/L, respectively. For the same period, the values of the total and dissolved zinc concentrations ranged from 4.7 to 533.0 µg/L and 1.0 to 110.0 µg/L, respectively. The median value of the total and dissolved zinc concentrations were 18 µg/L and 7 µg/L, respectively, and the average value of the total and dissolved zinc concentrations were 26.38 µg/L and 9.53 µg/L, respectively. For the period 2013–2020, the values of the total and dissolved copper concentrations ranged from 1.08 to 34.1 µg/L and 0.77 to 6.21 µg/L, respectively. The median value of the total and dissolved copper concentrations were 1.95 µg/L and 1.37 µg/L, respectively, and the average value of the total and dissolved copper concentrations were 2.52 µg/L and 1.44 µg/L, respectively. For the same period, the values of the total and dissolved zinc concentrations ranged from 2.09 to 143.0 µg/L and 1.42 to 18.1 µg/L, respectively. The median value of the total and dissolved zinc concentrations were 9.76 µg/L and 4.17 µg/L, respectively, and the average value of the total and dissolved zinc concentrations were 14.35 µg/L and 4.69 µg/L, respectively. This represented an average reduction in the total copper and zinc of 31.9% and 45.6%, respectively.
On the French Mosel watershed, the water quality is monitored by the Rhine–Meuse Water Agency and the measurements are freely downloadable on the website of the Agency [
29]. The dissolved and total copper and zinc concentrations are available for the years 2012–2019 from about 20 stations of the monitoring network. Adsorbed copper and zinc mass concentrations on bed sediment (particles < 2 mm) and on suspended sediments (particles < 2 mm) are available for the years 2012–2017 (no data were available between 2017 and 2019) from six stations of the monitoring network.
For both investigated basins, in the “Inventories of emissions, losses and discharges in the Rhine–Meuse basin” [
26] and “Etat des Lieux” [
30], copper and zinc are inventoried as pollutant substances with a high toxic risk and their fluxes are among the ten largest emitted flows in the Rhine–Meuse basin. In this study, we decided to focus on copper and zinc for the Meuse and Mosel basins.
2.3. Methodology
Trace metals and sediments represent a major threat to the quality of river surface waters.
The chemical speciation of trace metals plays an important role in geochemistry and determines to a large extent their mobility, toxicity and bioavailability [
31]. As it may vary continuously in space and time, measurements of the total metal concentrations are not sufficient to entirely describe the fate, biological effects and environmental impact of trace metals. The measurement of relevant specific metal species or groups of homologous metal species and their variation as a function of time is essential [
8].
The present study focused on the complexation and adsorption processes of two metals (copper and zinc) to inorganic particles. The objective was to establish geochemical coefficients characterizing Cu and Zn trace metals in a river ecosystem. In order to be used in model working at the watershed scale, partitioning coefficients were calculated, considering trace metals as inert tracers and simulating them by applying mass–balance relationships in the rivers [
32]. The trace metals behavior is strongly linked to the particles. Sedimentation and resuspension are two ubiquitous processes in a natural river. These processes may lead to the redistribution of trace metal concentrations between their particulate and dissolved phases in the water column and on the river bed [
10,
13,
33], acting like a sink or a source of contamination [
34].
The data acquirement comprised raw data extraction of targeted trace metals from recent monitored years. Data importation into spreadsheets enabled scientific consistency to check using algorithms developed on our own digital platforms: the consistency of the units, exclusion of periods without values, statistical processing, etc.
The first method was adapted to the large weekly dataset available at Eijsden. Copper and zinc mass concentrations of the suspended sediment (SS) were calculated by grain size, knowing the percentage of each grain size class and the total metal mass concentrations. These mass concentrations were used to calculate partitioning coefficient by grain size, divided by the dissolved metal concentrations. Based on these weekly results, statistics (median and average values) were then calculated to estimate the copper and zinc partitioning coefficients for the two selected periods (2002–2012 and 2013–2020). Note that the logarithmic values of the partitioning coefficients were compared to the literature data.
The second method was adapted to the dataset available for the Mosel River. Copper and zinc partitioning coefficients were calculated on one grain size class, less than 2 mm, for SS and BS, using monthly dissolved and mass concentrations. Statistics (median and average values) were calculated to estimate the copper and zinc partitioning coefficients of the SS (period 2012–2019) and bed sediment (BS) (period 2012–2017).
Four classes of fine mineral suspended sediments were considered (
Table 1), according to Fournier et al. [
35], who compiled data from Wenthworth [
36], Friedman and Sanders [
37], and Blott and Pye [
38]:
Generally, the concentrations of trace metals in sediments (SS and BS) are mainly influenced by fine particles [
10]. The smaller the particle size, the higher the surface area/volume ratio (and also the surface area/weight ratio): the concentration of metals in sediments (expressed in mg/kg) is therefore higher for small particles.
Metal partitioning coefficients, Kd, have been widely used to describe the distribution of metals between solid and solution phases in a number of fate and transportation models [
32,
39,
40,
41]. In this study, sorption processes were represented by a partitioning coefficient that is expressed as follows:
where Css is the metal particulate concentration per mass (mg/kg) and Cw is the dissolved metal concentration per volume (mg/m
3).
The dissolved metals in the water column are transported by the advection and dispersion processes. The metals in the particulate phase are also governed by sediment dynamics (transport, settling processes, etc.). Metals behavior in water is strongly influenced by sorption kinetics. Regarding the spatio-temporal scales of the involved processes and parameters (temperature, pH, etc.), we can assume pseudo-steady-state conditions while calculating Kd coefficients [
1,
42].
3. Results and Discussion
3.1. Spatial Variation of Dissolved and Particulate Metal Concentrations in the Meuse and Mosel Watersheds
Beyond the classical parameters, trace metals are among the pollutants that should be monitored in order to obtain a coherent and comprehensive overview of the quality status of an aquatic system [
13]. The dissolved fraction of metals is usually lower in natural water but is believed toxic to aquatic organisms and humans. They are also easily absorbed by SS, so attention has been paid to the solid–liquid partitioning coefficient of trace metals [
10].
3.1.1. The Meuse Watershed
Fluxes of macro- and micropollutants were estimated at the outlet of the Meuse River at the French border during the inventory of environmental data [
30]. The dissolved/total ratio, estimated from measurements at the monitoring stations (period 2017–2019), of Cu and Zn were 0.84 and 0.50, respectively (at Givet, 485 km on the Meuse River).
At Eijsden (Meuse River, 617 km), the period containing the most measurements covers years from 2002 to 2012. Then, this set of data was used in this study. There are measurements of Cu and Zn mass concentrations on the total SS, total SS concentrations, and percentages of SS < 2 µm, < 16 µm and < 63 µm.
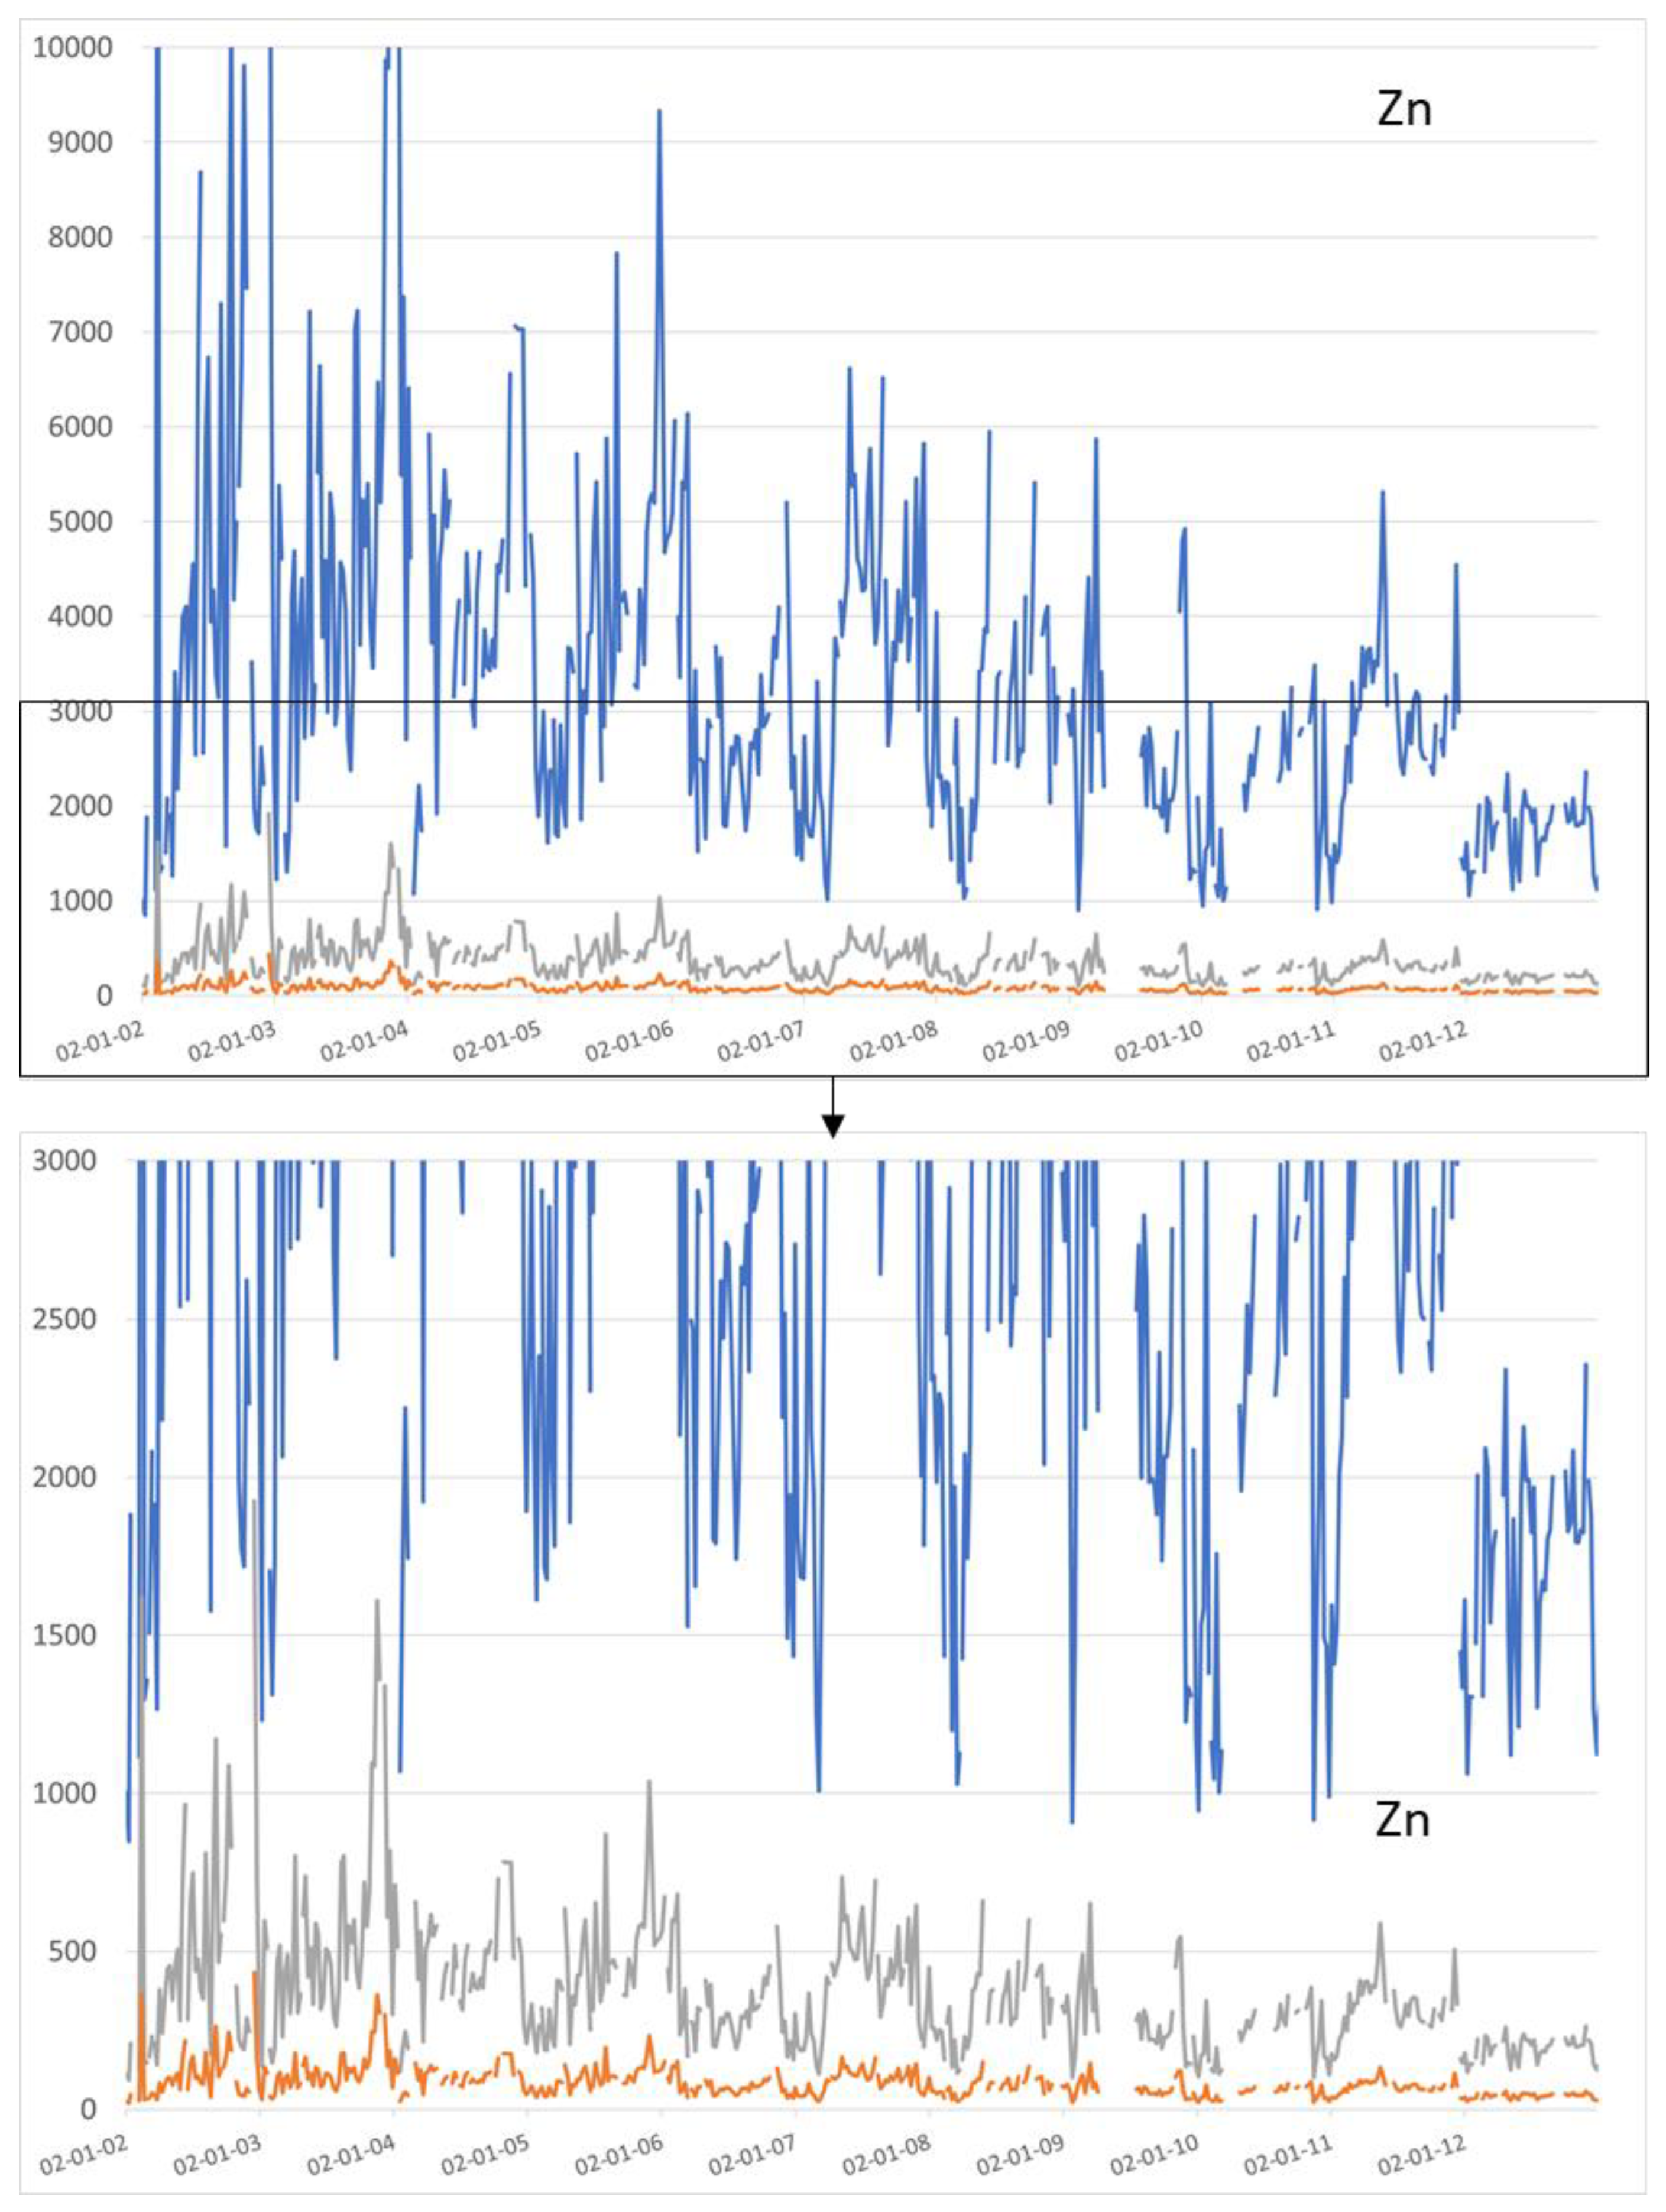
Figure 4 and
Figure 5 show the Cu and Zn mass concentrations at Eijsden (Meuse River) on the SS for particles of average diameter equal to 1 µm (clays), 9 µm (fine silts) and 40 µm (coarse silts).
At Eijsden, for the period 2002–2012, the values of the copper mass concentrations on clays and fine silts ranged from 77.19 to 1898.92 mg/kg and 8.58 to 210.99 mg/kg, respectively. The median values of the copper mass concentrations in clays and fine silts were 361.60 mg/kg and 40.18 mg/kg, respectively, and the average values of the copper mass concentrations on clays and fine silts were 449.63 mg/kg and 49.96 mg/kg, respectively. The values of the zinc mass concentrations in clays and fine silts ranged from 847.78 to 14,588.48 mg/kg and 94.20 to 1620.94 mg/kg, respectively. The median values of the zinc mass concentrations on clays and fine silts were 2981.39 mg/kg and 331.27 mg/kg, respectively, and the average values of the zinc mass concentrations on clays and fine silts were, respectively 3376.15 mg/kg and 375.13 mg/kg.
The copper mass concentrations decreased after the end of 2010 (
Supplementary Materials, Figure S2). The same observation was noted for zinc concentrations. These observations were potentially due to the reduction in metal release into the environment. Nevertheless, it is necessary to strengthen this study on the reduction in trace metal releases into surface water in occidental regions to assert this hypothesis.
3.1.2. The Mosel Watershed
Fluxes of micropollutants were estimated at the outlet of the Mosel River in France (at Sierck, 309.4 km along the river) during the inventory of environmental data [
26]. The dissolved/total ratios, estimated from measurements at monitoring stations (period 2017–2019), for Cu and Zn were 0.78 and 0.57, respectively.
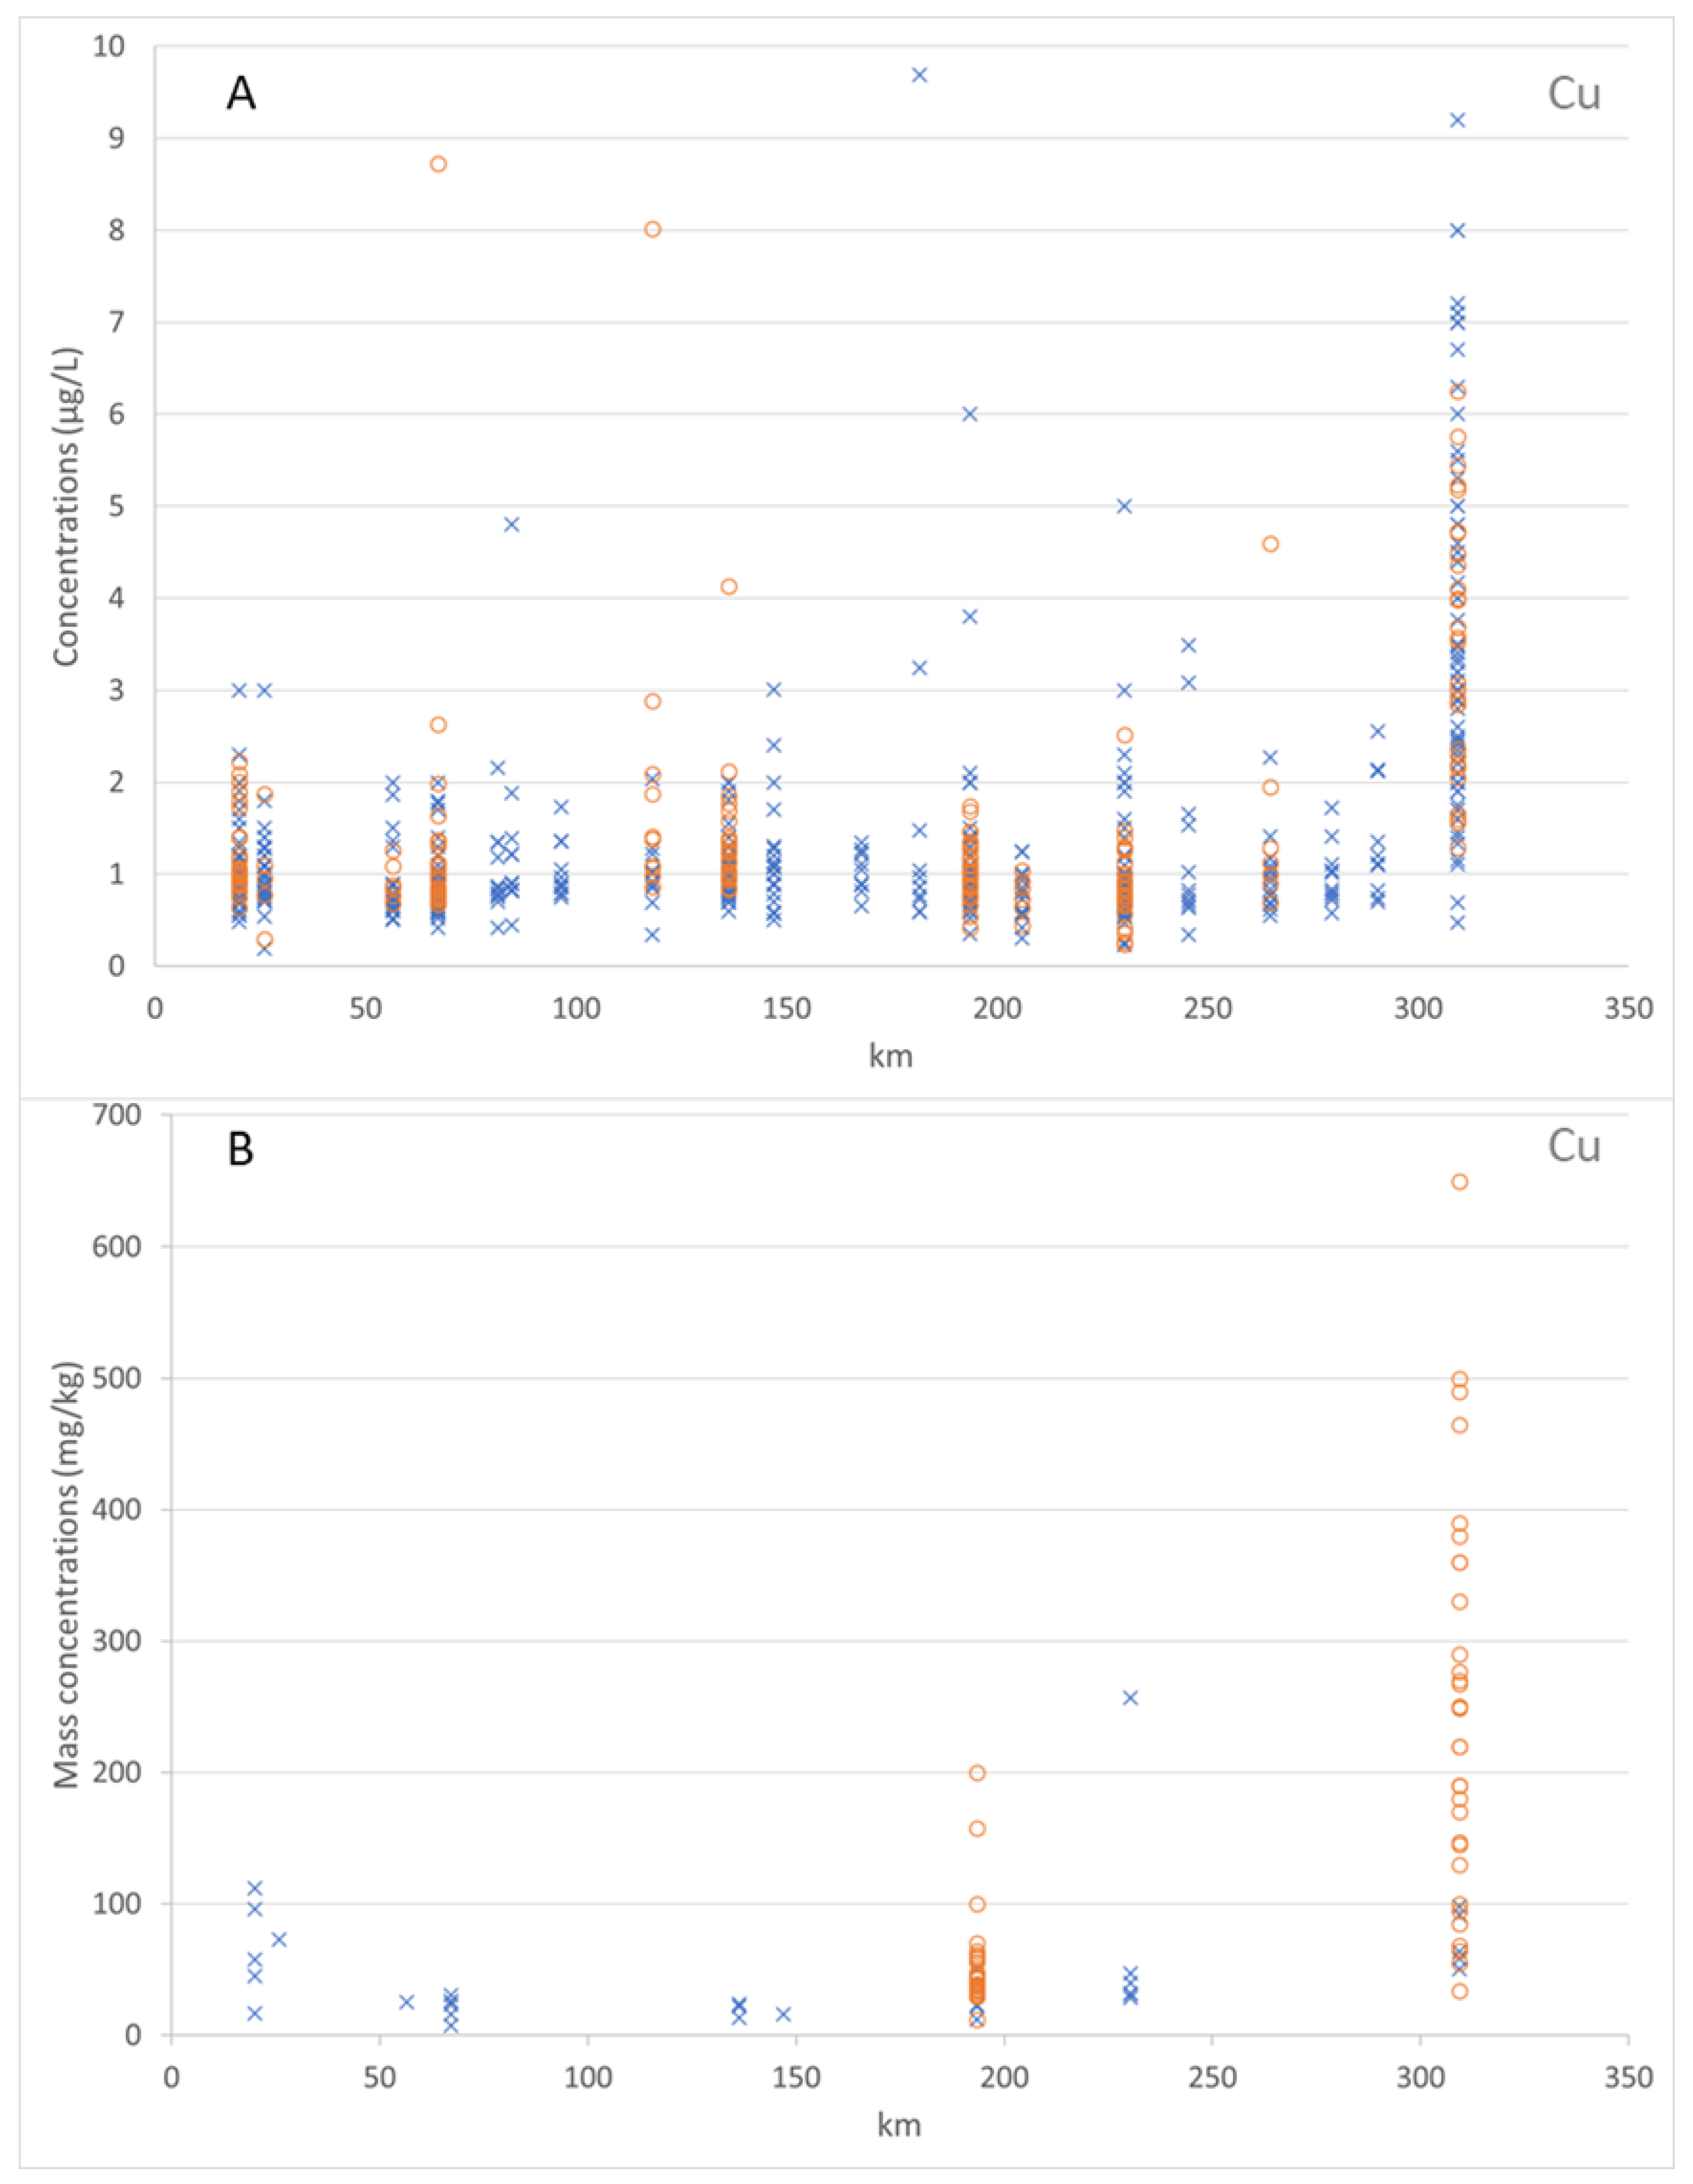
Figure 6 shows the dissolved and total Cu concentrations (in µg/L) in the water column along the Mosel River. For the years 2012–2019, the values of the dissolved Cu concentrations ranged from 0.19 to 9.69 µg/L. The median value of the dissolved Cu concentrations was 1.0 µg/L and the average value of the dissolved Cu concentrations was 1.88 µg/L. Over the period 2017–2019, the values of the total Cu concentrations ranged from 0.42 to 4.48 µg/L. The median value of the total Cu concentrations was 1.08 µg/L and the average value of the total Cu concentrations was 1.71 µg/L. This figure shows the adsorbed Cu mass concentrations on the bed sediment (particles < 2 mm) and on the suspended sediment (particles < 2 mm) along the Mosel River, for the years 2012 to 2017. The values of the adsorbed Cu mass concentrations on the bed sediment and suspended sediment ranged from 7.27 to 256.80 mg/kg and 12.0 to 650.0 mg/kg, respectively. The median value of the adsorbed Cu mass concentrations on the bed sediment was 31.1 mg/kg. The median value of the adsorbed Cu mass concentrations on the suspended sediment was 69.0 mg/kg. The average value of the adsorbed Cu mass concentrations on the bed sediment was 47.63 mg/kg. The average value of the adsorbed Cu mass concentrations on the suspended sediment was 148.47 mg/kg.
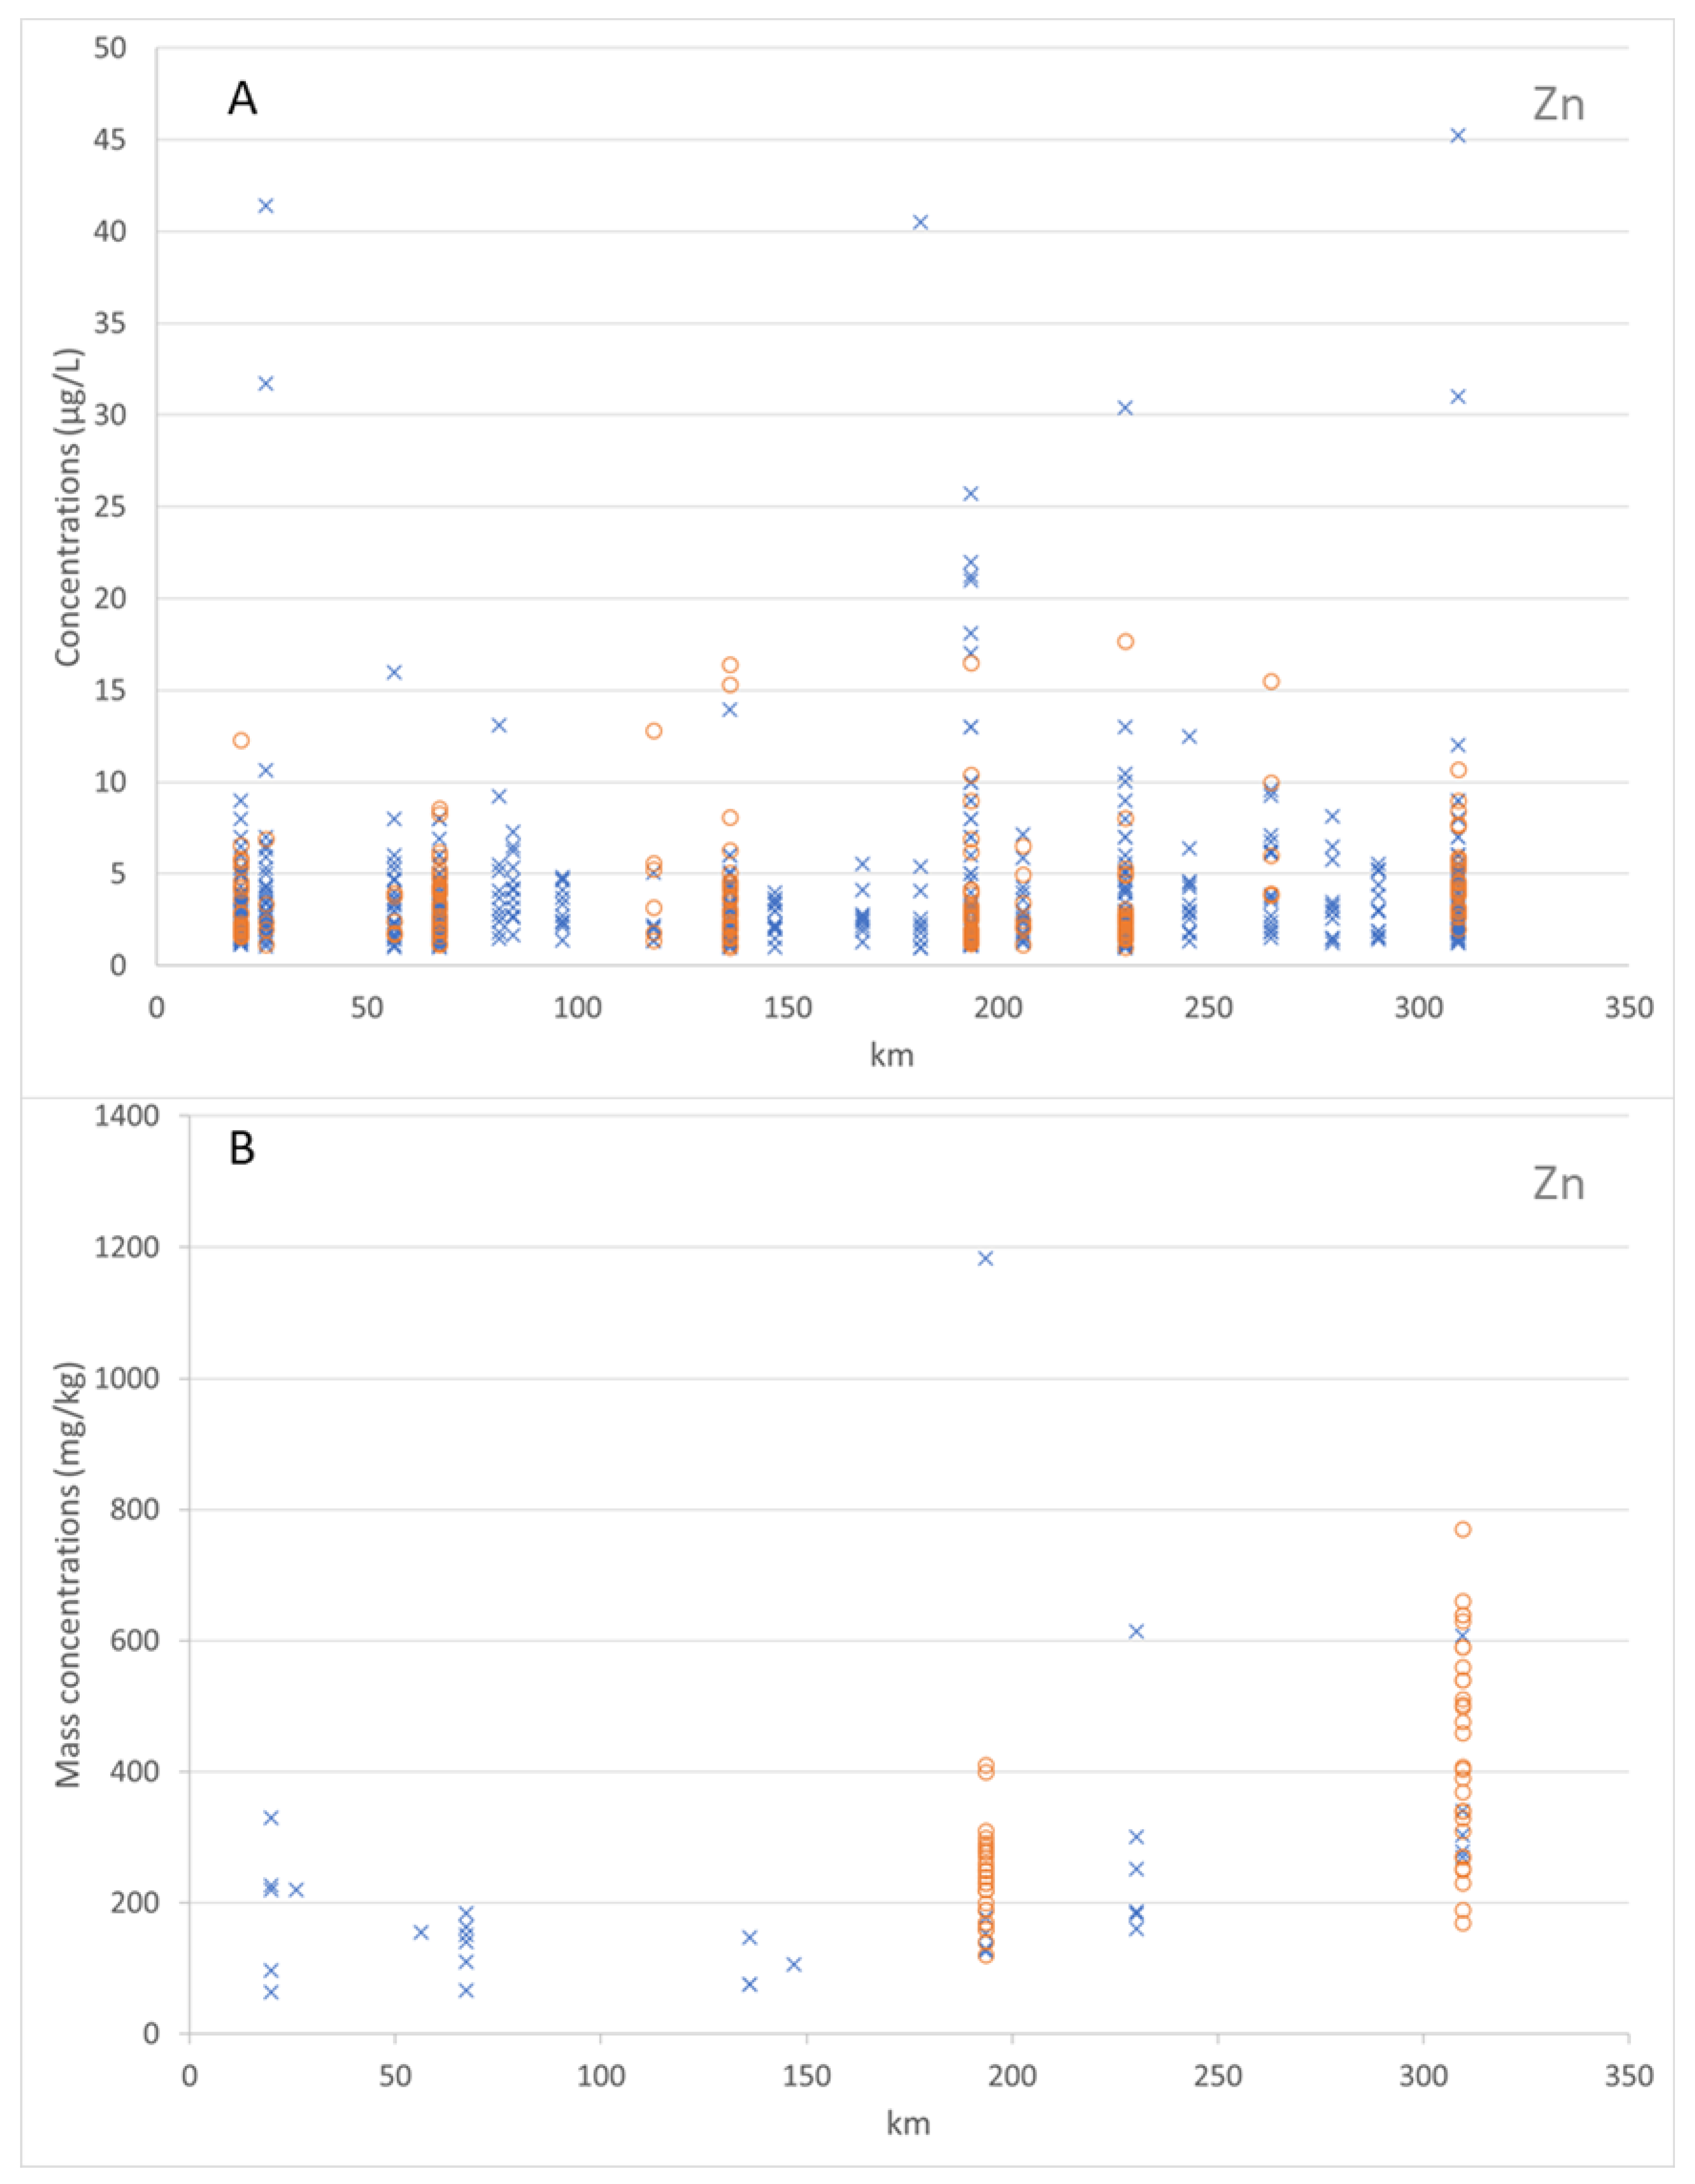
Figure 7 shows the dissolved and total Zn concentrations (in µg/L) in the water column along the Mosel River. For the years 2012 to 2019, the values of the dissolved Zn concentrations ranged from 0.93 to 110.0 µg/L. The median value of the dissolved Zn concentrations was 2.83 µg/L and the average value of the dissolved Zn concentrations was 4.25 µg/L. Over the period 2017–2019, the values of the total Zn concentrations ranged from 1.0 to 17.7 µg/L. The median value of the total Zn concentrations was 2.97 µg/L and the average value of the total Zn concentrations as 3.92 µg/L. This figure shows also the adsorbed Zn mass concentrations on the bed sediment (particles < 2 mm) and on the suspended sediment (particles < 2 mm) along the Mosel River, for the years 2012 to 2017. The values of the adsorbed Zn mass concentrations on the bed sediment and on the suspended sediment ranged from 63.7 to 1183.26 mg/kg and 120.0 to 770.0 mg/kg, respectively. The median value of the adsorbed Zn mass concentrations on the bed sediment was 177.2 mg/kg. The median value of the adsorbed Zn mass concentrations on the suspended sediment was 273.35 mg/kg. The average value of the adsorbed Zn mass concentrations on bed sediment was 236.17 mg/kg. The average value of the adsorbed Zn mass concentrations on the suspended sediment as 331.66 mg/kg.
The zinc concentrations were higher than the copper concentrations in the water column and on the sediments. The data analyses demonstrated that both Cu and Zn were more adsorbed by the suspended sediment than the bed sediment, due to the higher proportion of fine particles in the suspended sediment (coarser particles settling first).
3.2. Partitioning Coefficients of Metals between Water and Suspended Sediment
The partitioning coefficient provides empirical information regarding the combined effects of heterogeneous reactions on the solid/solution distribution of each trace metal [
43]. A high Kd value indicates a strong affinity of the material for the particulate phase [
10]. Suspended and bed particle size play a significant role in controlling particulate metals in the river. The smaller the particle size, the higher the content of trace metals [
10].
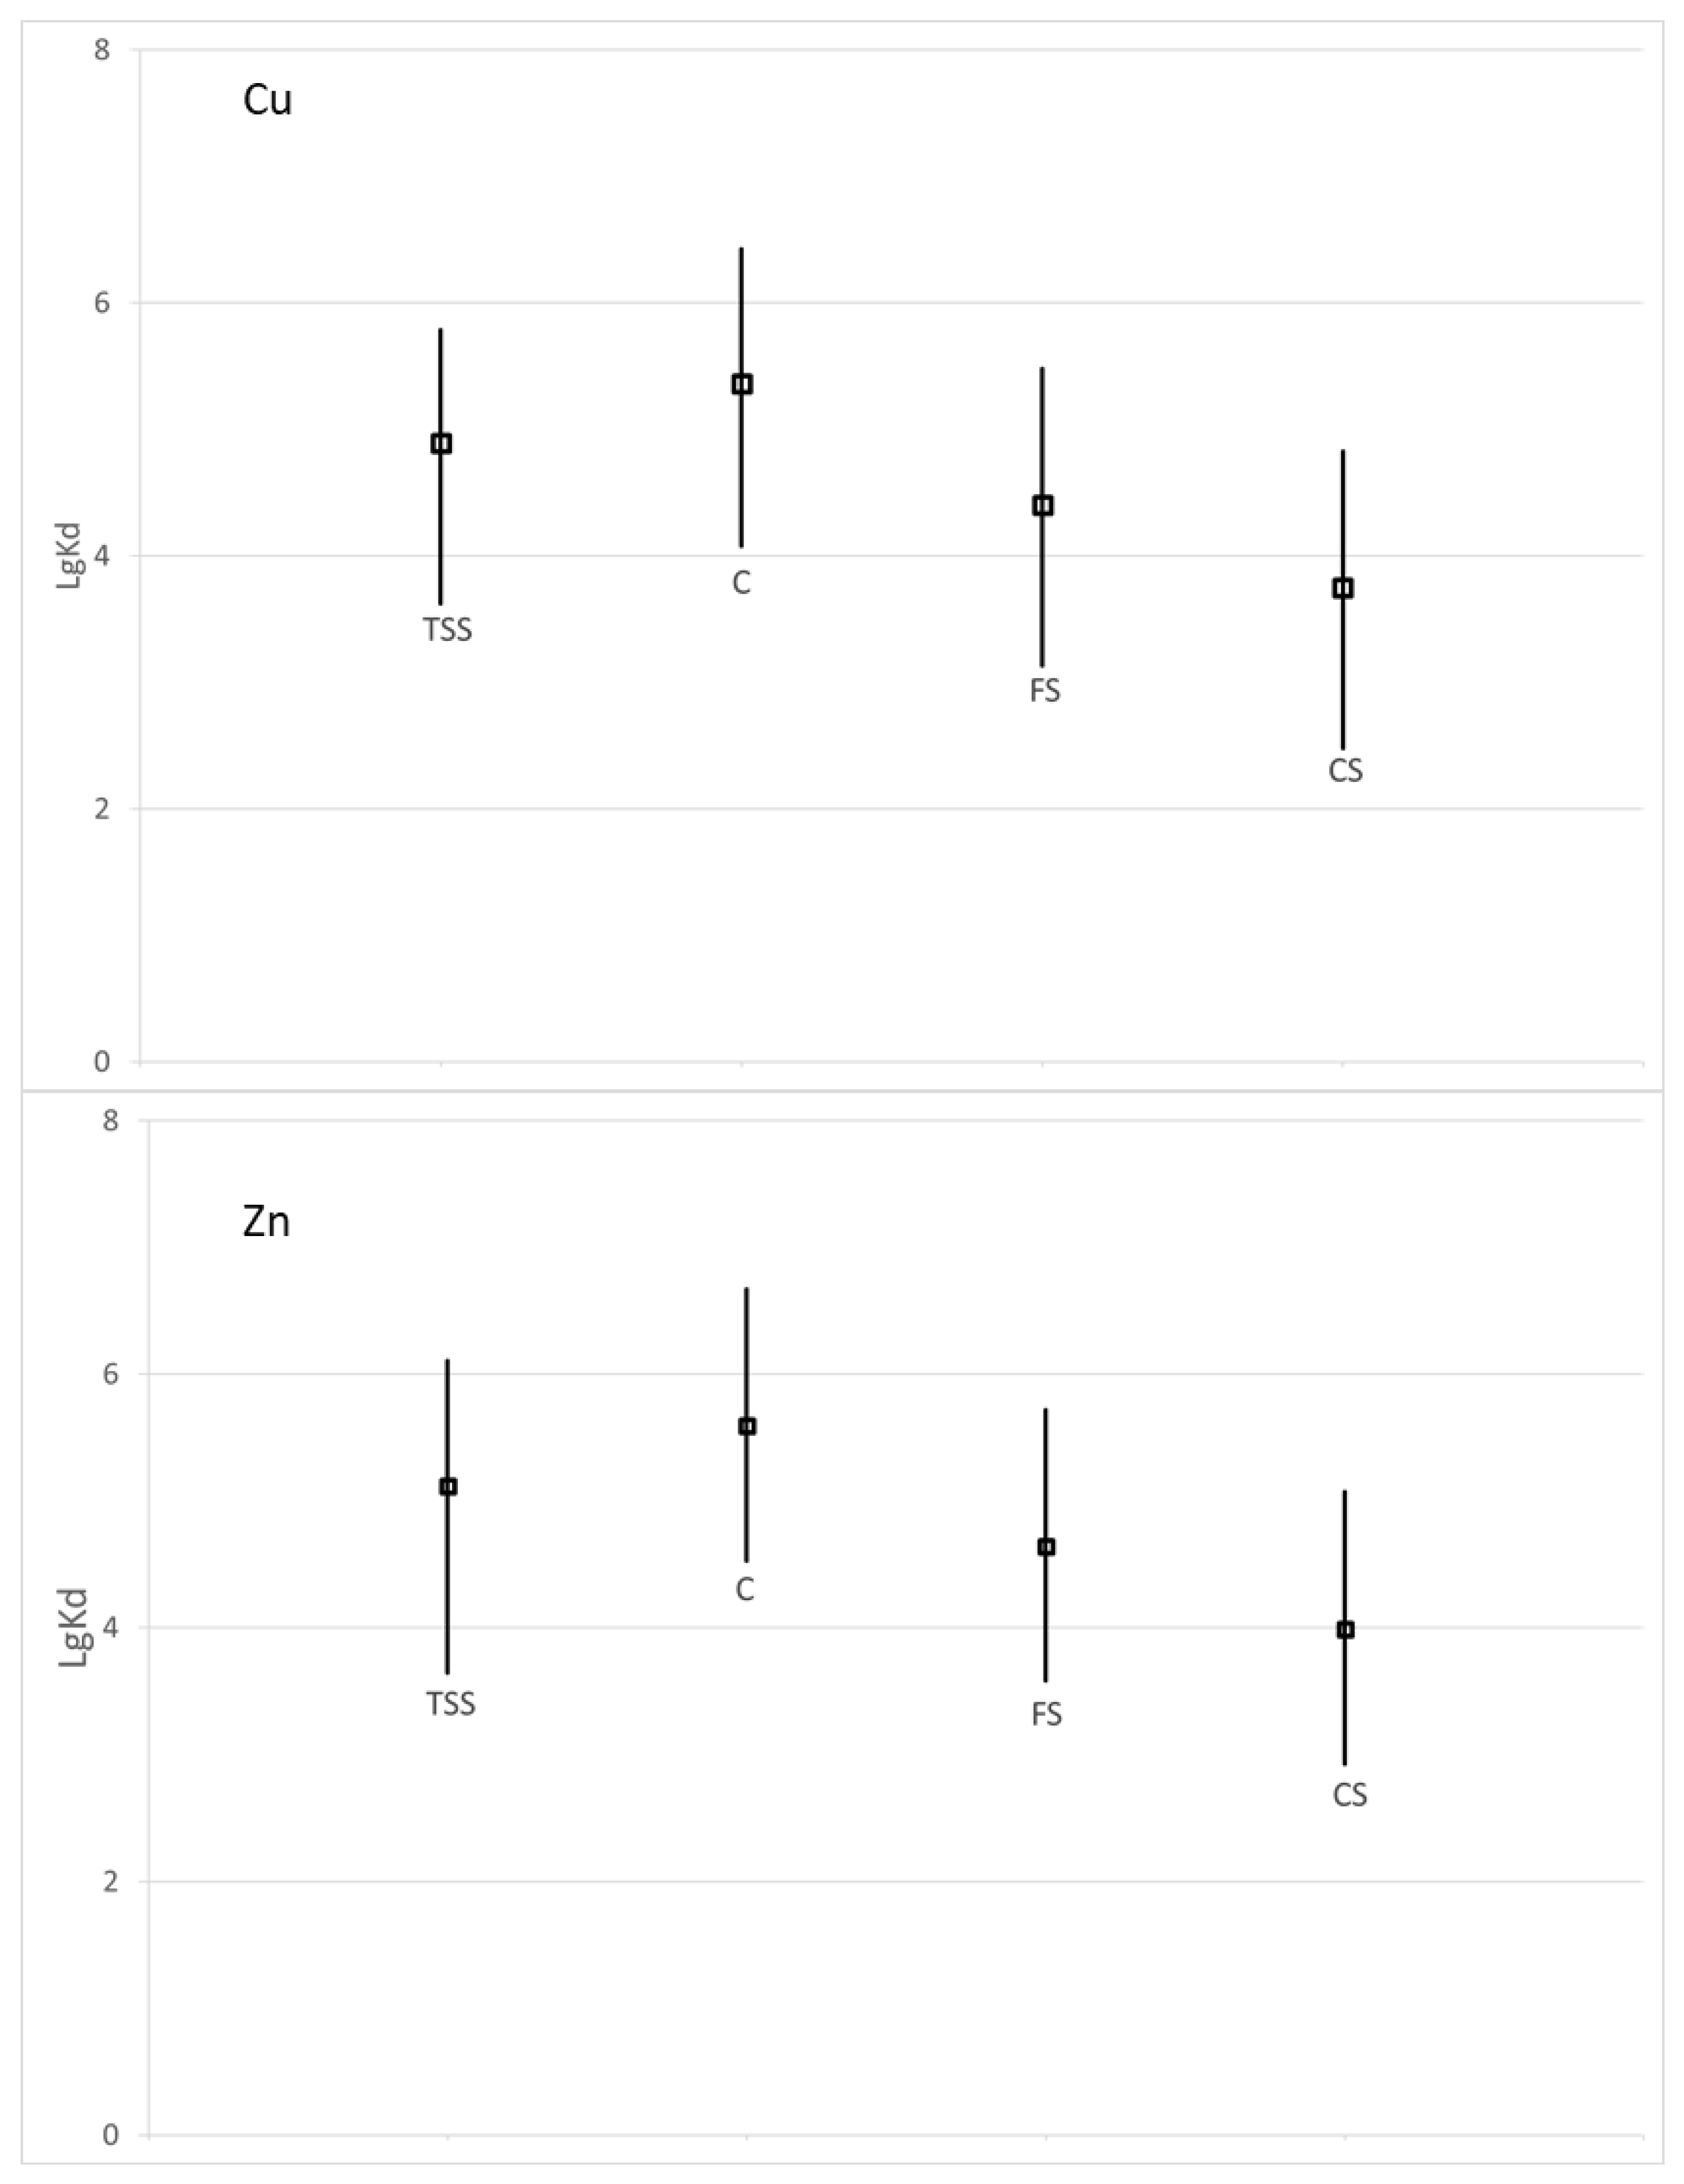
At Eijsden (Meuse River), large copper and zinc datasets were analyzed from 2002 to 2012. The lgKd (logarithm of Kd) values of Cu and Zn (
Figure 8), for total SS, ranged from 3.6 to 5.8 L/kg and 3.6 to 6.1 L/kg, respectively, with average values of 4.9 L/kg and 5.1 L/kg, respectively, and median values of 4.9 L/kg and 5.1 L/kg, respectively. All the lgKd values were higher than 3, indicating the strong adsorptive capacity of these trace metals for the SS in the Meuse River.
Regarding particle size, the lgKd values of Cu and Zn were higher for clays and ranged from 4.1 to 6.4 L/kg and from 4.5 to 6.7 L/kg, respectively, with average values of 5.4 L/kg and 5.6 L/kg, and median values of 5.3 L/kg and 5.6 L/kg, respectively. For fine silts, values ranged from 3.1 to 5.5 L/kg and from 3.6 to 5.7 L/kg, respectively, with average values of 4.4 L/kg and 4.6 L/kg, and median values of 4.4 L/kg and 4.6 L/kg, respectively. For coarse silts, values ranged from 2.5 to 4.8 L/kg and from 2.9 to 5.1 L/kg, respectively, with average values of 3.7 L/kg and 4.0 L/kg, and median values of 3.7 L/kg and 4.0 L/kg, respectively.
Figure 8 shows the high variations of lgKd with time indicating that the instantaneous equilibrium is a theoretical assumption. The Kd depends on chemical processes affecting trace metal speciation. It is far from constant: it varies depending on the chemical composition of the water and the sediment. The Kd is a simple way to characterize particle–solution distributions of metals. The Kd values are also influenced by the effects of seasons and river flow changes [
32]. The variation of the Kd should not be seen as resulting from a single geochemical process, but from a combination of simultaneous binding processes to ligands in the water and on the sediments.
Partitioning coefficient variations are also explained, at a second order of magnitude, by metals releases varying day by day.
In the Mosel watershed, the measurements of Cu and Zn mass concentrations are carried out on total SS < 2 mm. This granulometry does not correspond to (but includes) the fine grain size which is essentially concerned by the adsorption and desorption processes by sediments. The partitioning coefficients were calculated for Cu and Zn using these available data. The median values of the Cu and Zn lgKd were 4.7 L/kg (ranging from 3.2 to 5.3 L/kg) and 4.9 L/kg (ranging from 3.7 to 5.3 L/kg), respectively, and the average values were 4.6 L/kg and 4.8 L/kg, respectively. These values were lower regarding the ones calculated at Eijsden where a larger dataset was analyzed and a grain sizes description was carried out.
3.3. Partitioning Coefficients of Metals between Water and Bed Sediment
Measurements on the bed sediment < 2 mm (
Figure 6B and
Figure 7B) are carried out once a year along the Mosel river at six stations of the monitoring network. The partitioning coefficients between the water column and the bed sediment were calculated for Cu and Zn using these available data. The median values of the Cu and Zn lgKd were 4.4 L/kg (ranging from 3.9 to 5.5 L/kg) and 4.8 L/kg (ranging from 4.0 to 5.3 L/kg), respectively, and the average values were 4.6 L/kg and 4.8 L/kg, respectively. The median values of copper and zinc partitioning coefficients were lower for BS than SS.
Generally, partitioning coefficients of trace metals between particulate and dissolved fractions in the water column appeared in the following order: Zn > Cu [
10,
44]. The present study confirmed that zinc is more easily adsorbed by sediments due to its stronger affinity for the particulate phase.
3.4. Discussion
Partitioning coefficient depends on the nature of the suspended solids or sediments, geochemical parameters of the water and specific characteristics of each element [
11]. The influence of hydrometeorological conditions and metals releases will be further investigated through more appropriated modelling approaches. The Kd logarithmic values of Cu are shown in
Figure 9. These values ranged from 2.5 to 6.4 L/kg. The Kd logarithmic values of Zn are shown in
Figure 9. These values ranged from 2.9 to 6.7 L/kg. Zn exhibited higher values.
Regarding other studies in the world, these Kd values confirmed that our results in the Meuse (Belgian–Dutch border) and Mosel (France) were reliable. As an example, the Cu lgKd average value was 4.7 in the Garonne River (France) [
41]. These new partitioning coefficients, calculated according to grain sizes (clay, fine silt and coarse silt), can be used in environmental modelling dedicated to the assessment of water quality. One remaining question is to estimate if the sediments constitute a sink or a source of trace metals.
The Cu and Zn lgKd values in some rivers of the world range from 3.9 to 6.3, 3.9 to 8.5, respectively (
Table 2).
4. Conclusions and Future Perspectives
In the present study, we determined new copper and zinc partitioning coefficients in two large representative rivers in western Europe, the Meuse and the Mosel. Large sets of data were analyzed. Both dissolved and particulate phases play key roles in the controlling of copper and zinc partitioning in fresh river waters.
In the Meuse river, the copper and zinc partitioning coefficients were calculated according to grain sizes in the water column. These coefficients are strongly affected by particle sizes, and it was demonstrated that clays and fine silts preferentially adsorb trace metals. As observed in other studies, it was confirmed that zinc is more easily adsorbed by sediments due to its stronger affinity for the particulate phase.
In the Mosel River, the copper and zinc partitioning coefficients were calculated in the water column and on the river bed. Compared to copper and zinc adsorption by suspended sediment, the partitioning coefficients were lower on the bed sediment. To strengthen this assessment, it is necessary to improve the granulometry study and focus on fine bed sediments (<63 µm).
This is a preliminary paper to further investigate the environmental modelling of trace metals. Prerequisite knowledge is necessary to tackle trace metal modelling. Among this knowledge, the calibration of the processes involved in trace metal fate are required: partitioning coefficients, sedimentation velocity, critical deposition, erosion velocities, etc. Some of these processes have been improved. Explicit characterization of these processes constitutes a guarantee to best assess water quality. This will allow us to establish consistent pressure–impact relationships between the loads discharging into the river from the watersheds and the reduction in copper and zinc concentrations over the years. Useful added information were also provided for water quality management. The predictive capacity of environmental modelling in the scope of management plans, priority plans, depollution concerning dangerous substances such as trace metals and associated sediments will be challenged.
