Article

Simple and Cost-Effective Method for Reliable Indirect Determination of Field Capacity

1
Department of Water Resources, Faculty of Agrobiology, Food and Natural Resources, Czech University of Life Sciences Prague, 16500 Prague, Czech Republic
2
Department of Pedology and Soil Conservation, Research Institute for Soil and Water Conservation, 15600 Prague, Czech Republic
*
Author to whom correspondence should be addressed.
Hydrology 2023, 10(10), 202; https://doi.org/10.3390/hydrology10100202
Submission received: 15 September 2023 / Revised: 15 October 2023 / Accepted: 17 October 2023 / Published: 19 October 2023
(This article belongs to the Section Soil and Hydrology)

Abstract

:
This study introduces a simple and cost-effective method for the indirect determination of field capacity (FC) in soil, a critical parameter for soil hydrology and environmental modeling. The relationships between FC and soil moisture constants, specifically maximum capillary water capacity (MCWC) and retention water capacity (RWC), were established using undisturbed soil core samples analyzed via the pressure plate method and the “filter paper draining method”. The aim was to reduce the time and costs associated with traditional FC measurement methods, as well as allowing for the use of legacy databases containing MCWC and RWC values. The results revealed the substantial potential of the “filter paper draining method” as a promising approach for indirect FC determination. FC determined as soil water content at −33 kPa can be effectively approximated by the equation FC33 = 1.0802 RWC − 0.0688 (with RMSE = 0.045 cm3/cm3 and R = 0.953). FC determined as soil water content at −5 or −10 kPa can be effectively approximated by both equations FC5 = 1.0146 MCWC − 0.0163 (with RMSE = 0.027 cm3/cm3 and R = 0.961) and FC10 = 1.0152 MCWC − 0.0275 (with RMSE = 0.033 cm3/cm3 and R = 0.958), respectively. Historical pedotransfer functions by Brežný and Váša relating FC to fine particle size fraction were also evaluated for practical application, and according to the results, they cannot be recommended for use.

1. Introduction

Field capacity (FC) or field water capacity is defined as the maximum amount of water soil can hold against the force of gravity after excess water has drained away [1,2]. Despite this vague definition, FC is a crucial value for effective soil water management, crop growth, soil health and environmental conservation in agriculture and land management practices. It is a vital input parameter for environmental modeling, particularly in soil hydrology. It serves as a fundamental starting point for simulating water movement, infiltration and runoff in terrestrial ecosystems. Incorporating accurate FC values into models helps researchers and policy makers to predict and manage various environmental processes, such as watershed hydrology, groundwater recharge, flood risk assessment, irrigation and ecosystem health assessment. By providing a basic understanding of how much water the soil can retain, FC data enhance the precision and reliability of environmental models, facilitating informed decision making for sustainable land and water resource management.
Traditional in-situ determination of FC assumes soil, which is deep and permeable, without influence of the groundwater table, with no evaporation from the soil surface. The well-drained soil receives a sufficient amount of water, and after redistribution, the drainage rate decreases rapidly and becomes negligible within about 24 to 72 h. Water is drained from the large non-capillary pores and is now retained in the capillary pores. The fundamental problem is to define this negligibility, as it is a dynamic process [2]. The same authors state that there is no good alternative to the in situ method for the determination of FC. However, it is possible to determine FC from long-term field observations of soil water content and suction pressure [3].
For practical applications and comparability, the complicated in situ process of FC determination has been replaced by laboratory measurements performed on soil core samples. FC is determined as the water content of the soil equilibrated at a specific suction pressure value. The FC value varies with the dynamic properties of the soil profile, such as the hydraulic gradient, hysteresis, stratification of the soil profile, swelling and shrinkage, or the presence of an impermeable layer or a high groundwater table. Therefore, the suction pressure value for this water content cannot be generally defined, especially when a sample is taken and the hydraulic context of the soil is interrupted. However, for calculations and estimates, it is important to associate the FC with some suction pressure value. Coarse-textured soils reach conditions defined as an FC of around −5 or −10 kPa, medium-textured soils at −33 kPa and fine-textured soils at −50 kPa [2]. Therefore, the selected suction pressure level should always be recognized according to the studied soil. In spite of this, the basic concept is often ignored and water content at a suction pressure of −33 kPa is adopted as the most widely used value associated with FC.
The methods of a sand/kaolin box, temp cell [4] and pressure plate apparatus [5] are the most widely used, although they are rather time- and energy-consuming, and therefore costly. Measurements can take several weeks to months, depending on the soil type and the number of points on the soil water retention curve (SWRC) that need to be determined sequentially. It is likely that at least the permanent wilting point (WP) will be determined in addition to FC [6,7,8] if the full range of SWRC is not required. A modern and relatively fast method is the evaporation method [9], which is utilized, e.g., in the commercial instrument HYPROP (METER Group Inc., Pullman, WA 99163, USA). It can determine the FC within several days, but it is rather costly and requires regular attention, especially in its preparation for use.
Besides the methods mentioned above for the accurate determination of soil matric potential, there are cost-effective alternatives involving filter paper. In the in-contact filter paper technique, initially dry filter paper absorbs liquid water from the soil until equilibrium is reached. Good contact between the filter paper and the soil is essential. After equilibrium, the water content of the filter paper is measured, and the soil suction is estimated using a calibration curve [10,11].
A different method employing filter paper was developed in Central Europe to assess soil water retention properties. Instead of assessing the water content of the moist filter paper, this method involves determining the gravimetric soil water content of core samples. These samples are allowed to drain naturally on the filter paper for a specified period of time [12]. This “filter paper draining method” is used in this study and is further described, specifically regarding the maximum capillary water capacity (MCWC) and retention water capacity (RWC), which have a long history of use in the Czech Republic as an approximation of FC [12,13,14].
As an alternative to direct measurement, there is an estimation approach utilizing pedotransfer functions (PTFs). PTFs estimate a required soil property that is difficult to obtain (estimand), in this case, FC, from other easily obtainable soil properties (called predictors), typically soil texture, dry bulk density and organic matter content. PTFs employ a wide range of methods from linear regression equations to artificial neural networks, non-parametric algorithms and machine learning approaches [7,8,15,16,17,18]. The reliability of PTFs greatly varies and their general applicability may be limited. In any case, for accurate prediction, a database with measured predictors and estimands is needed. However, often, accurate information is not required and a value with higher uncertainty may be sufficient if it can be obtained quickly and at minimal cost.
Efforts to develop statistical relationships between predictors and soil moisture constants were undertaken long before the term PTFs was introduced [2]. It should be noted that the word “constant” can be misleading as it implies invariant behavior of the soil pore system. In Central Europe, regression equations for estimating FC and WP from a fine particle size fraction (FPSF; soil particles < 0.01 mm) have been established [13] and are still in use [19,20]. Although there are different varieties of PTFs for estimating the soil water retention curve or just its important points, such as FC and WP [15,16,17,18], they are rarely used by researchers and decision makers for practical applications. FC and WP often need to be determined or estimated for irrigation management purposes or for the quantification of available water capacity [21]. It appears that ease of use is the primary criterion for the practical application of PTFs.
The aim of this study was to investigate the relationship between FC, determined as the gravimetric water content at a given set suction pressure level, and the soil moisture constants “retention water capacity” (RWC) and “maximum capillary water capacity” (MCWC), which can be obtained using the rapid and inexpensive filter paper draining method. These relationships have been developed with the goal of becoming commonly used formulae for the rapid and relatively reliable estimation of FC and, to the present knowledge of the authors, such relationships have not been published yet.
Additionally, simple regression equations according to Brežný and Váša [13] relating FC to the fine particle size fraction (soil particles < 0.01 mm) were tested in this study.

2. Materials and Methods

2.1. Filter Paper Draining Method

The full procedure for processing an undisturbed soil core sample is described in detail including illustrative schemes in Spasić et al. [12]. Only relevant parts of the methodology are presented here.
When the undisturbed soil samples (100 cm3) were brought to the laboratory, their capillary saturation was the first step. After achieving capillary saturation and recording the initial weight for calculating the saturated water content, water drainage was initiated using folded dry filter paper. Saturated samples were placed under a hood on four layers of dry filter paper for exactly 30 min—precise timing was crucial. The weight was then recorded (not relevant to this study). The initial drainage for 30 min primarily addressed non-capillary pores. The samples were then transferred to four new and dry layers of filter paper under the hood for a further 90 min (2 h in total). The weight recorded at this stage was used to calculate the soil moisture constant MCWC. The wet filter paper was again replaced, and the samples were allowed to drain under the hood for a further 22 h (a total of 24 h) before being weighed to determine the soil moisture constant RWC. Standard qualitative filter paper 2R/80 in sheets cut to 30x35 cm was used, with up to 12 samples placed on this size of filter paper. Each ring was covered with a watch glass during the draining process.
After draining them on filter paper, the samples were transferred to pressure plate apparatus [5] for FC and WP determination (suction pressures of −33 and −1500 kPa, respectively). This step is not part of the filter paper draining method; however, it was included for the purpose of this study in order to compare the soil moisture constants obtained via the filter paper draining method with the FC determined as water content at −33 kPa. The final step was drying in an oven at 105 °C to a constant weight (usually 24 h). After cooling the samples in a desiccator, the weights of the dry samples were determined and the volumetric water contents of all relevant soil moisture constants were calculated via a gravimetric method. A graphical overview of the methodological steps is depicted in Figure 1. In addition, dry bulk density (BD; g/cm3) was calculated from the dry soil weight and the volume of the ring.

2.2. Data Origin and Processing

In total, 1212 database entries and/or soil samples from the Czech Republic containing the required information on FC indirect determination were utilized in this study. The total number consisted of three independent sets of data; datasets one and two were used for developing the statistical relationships between FC and MCWC/RWC, while dataset three was used for testing the existing regression equations according to Brežný and Váša [13] for FC estimation. The datasets originated from two sources: (i) the Database of Soil Hydrophysical Properties in the Czech Republic called HYPRESCZ, from which datasets one and three were derived, and (ii) dataset two, containing data on soil samples measured by the authors of this study. The availability and use of data from each dataset are further summarized in Table 1.

2.2.1. Dataset One

In the HYPRESCZ database [22], 534 entries containing both measured SWRC and the moisture constant MCWC determined using the filter paper draining method were found. Unfortunately, RWC data were not collected within the database. Suitable data for dataset one originated from 23 different localities, including surface and deeper soil horizons. The database contains data from different sources, and SWRCs were obtained via various methods. For unification, SWRCs were carefully fitted using the van Genuchten Equation (1) [23], as the water retention equilibrium points were obtained at different suction pressures. Each fitted curve was subjected to a careful assessment of the quality of the optimisation to ensure that it represented the measured data well. Further details on the data, including using the RETC code [24] for fitting the SWRC, are provided in Miháliková et al. [22].
(θ − θr)/(θs − θr) = 1/(1 + (α|h|)n)(1−1/n)
where θ is actual water content, θr and θs are model parameters expressing the residual and saturated soil water contents, respectively (cm3/cm3), α and n are shape factors, and |h| is the absolute value of the actual pressure head (cm).
Using the van Genuchten parameters, FC was calculated as the volumetric water content at four different suction pressures associated with FC as listed by Cassel and Nielsen [2]: −5, −10, −33 and −50 kPa. The resulting values of the fitted field capacity were denoted as FC5f, FC10f, FC33f and FC50f, respectively. Their statistical relationships with the measured MCWC values were investigated.

2.2.2. Dataset Two

The second dataset contains 207 undisturbed soil samples (100 cm3) and it was part of the dataset used for mapping the RWC of soils in the Czech Republic, which is provided as a public service by the Research Institute for Soil and Water Conservation, Prague, CZ, on the website https://mapy.vumop.cz/ (accessed on 1 September 2023). Samples were collected from the surface layer at about 100 different localities covering representative arable lands of the Czech Republic. More detailed information on the data can be found in the study by Vopravil et al. [14]. Soil moisture constants MCWC and RWC were determined using the filter paper draining method as described above prior to the determination of FC using the pressure plate method [5], and defined as the volumetric water content at a suction pressure of −33 kPa (further denoted as FC33m). The suction pressure of −33 kPa was selected based on textural analysis of the sampled soils. In total, 75% of the soils were medium-textured, specifically the loam, sandy loam and silt loam texture classes (USDA).
The statistical relationships of both MCWC and RWC with FC33m were investigated. This relatively large data set is unique in that the data were collected by the same team of researchers and processed in the same laboratory using identical methodologies and equipment. This substantially reduced the error rate associated with the varying treatment of samples, a common challenge in large data collections.

2.2.3. Dataset Three

The last dataset was again retrieved from the HYPRESCZ database, and it contains 471 relevant entries with available FPSF values and fitted van Genuchten parameters of the SWRC. Some entries may overlap with the first dataset; however, the database contains in total more than 2000 entries on arable land, which are fragmented and of varying completeness levels. Thus, all suitable data were used. On the third dataset, the regression functions, which can be considered historically as the first PTFs in the Czech Republic, were tested. These functions have been widely used, as will be further discussed. The functions are denoted as FC by Brežný (Equation (2)) [25] and FC by Váša (Equation (3)) [13].
FC by Brežný = 6.66 + 1.03 FPSF − 0.008 FPSF2
FC by Váša = (FPSF + 18) × 20)0.5
where FC is field capacity in % by volume, and FPSF is content of fine particle size fraction, which are soil particles < 0.01 mm (%).

2.3. Statistical Evaluation and Uncertainty Analysis

Data were processed in MS Excel, including statistical evaluation. Uncertainty analysis was carried out by employing the correlation coefficient (R), coefficient of determination (R2), mean absolute error (MAE) and root mean squared error (RMSE) to assess the quality of the findings and to foster their transparency and reliability. Equations (4) and (5) represent the latter two statistical indicators:
MAE = Σ|xi − x| N−1
RMSE = [Σ(xi − x)2 N−1]0.5
where x and xi represent the observed and predicted values for each data pair i, and N is the total number of observed data pairs.
Higher R and R2 values were indicative of a stronger linear relationship and better agreement between the observed variables. Conversely, lower MAE and RMSE values signified smaller discrepancies between the observed variables, reflecting a higher level of accuracy in the predictions. It is crucial to utilize several statistical indicators when assessing the quality of statistical relationships. For example, relying solely on a high R can be misleading, as it may suggest a strong linear relationship between two sets of data, while other errors and discrepancies may remain unaccounted for. The R² complements the R by providing insight into the proportion of variation in the observations that is explained by the predictions. Meanwhile, MAE and RMSE provide valuable information about the size and distribution of errors in the predictions. These two metrics help to identify situations where predictions, despite a seemingly strong R, may exhibit substantial deviations from the observed values. By combining these four indicators, a more comprehensive assessment of the reliability of the predictions can be obtained. This leads to improving the usefulness of the findings in practical applications and a good reflection of reality [26].

3. Results

3.1. Descriptive Statistics of Soil Properties in the Datasets

The results obtained from the statistical analysis of three distinct datasets, facilitating a comprehensive understanding of the investigated soil moisture characteristics, are presented in this section.
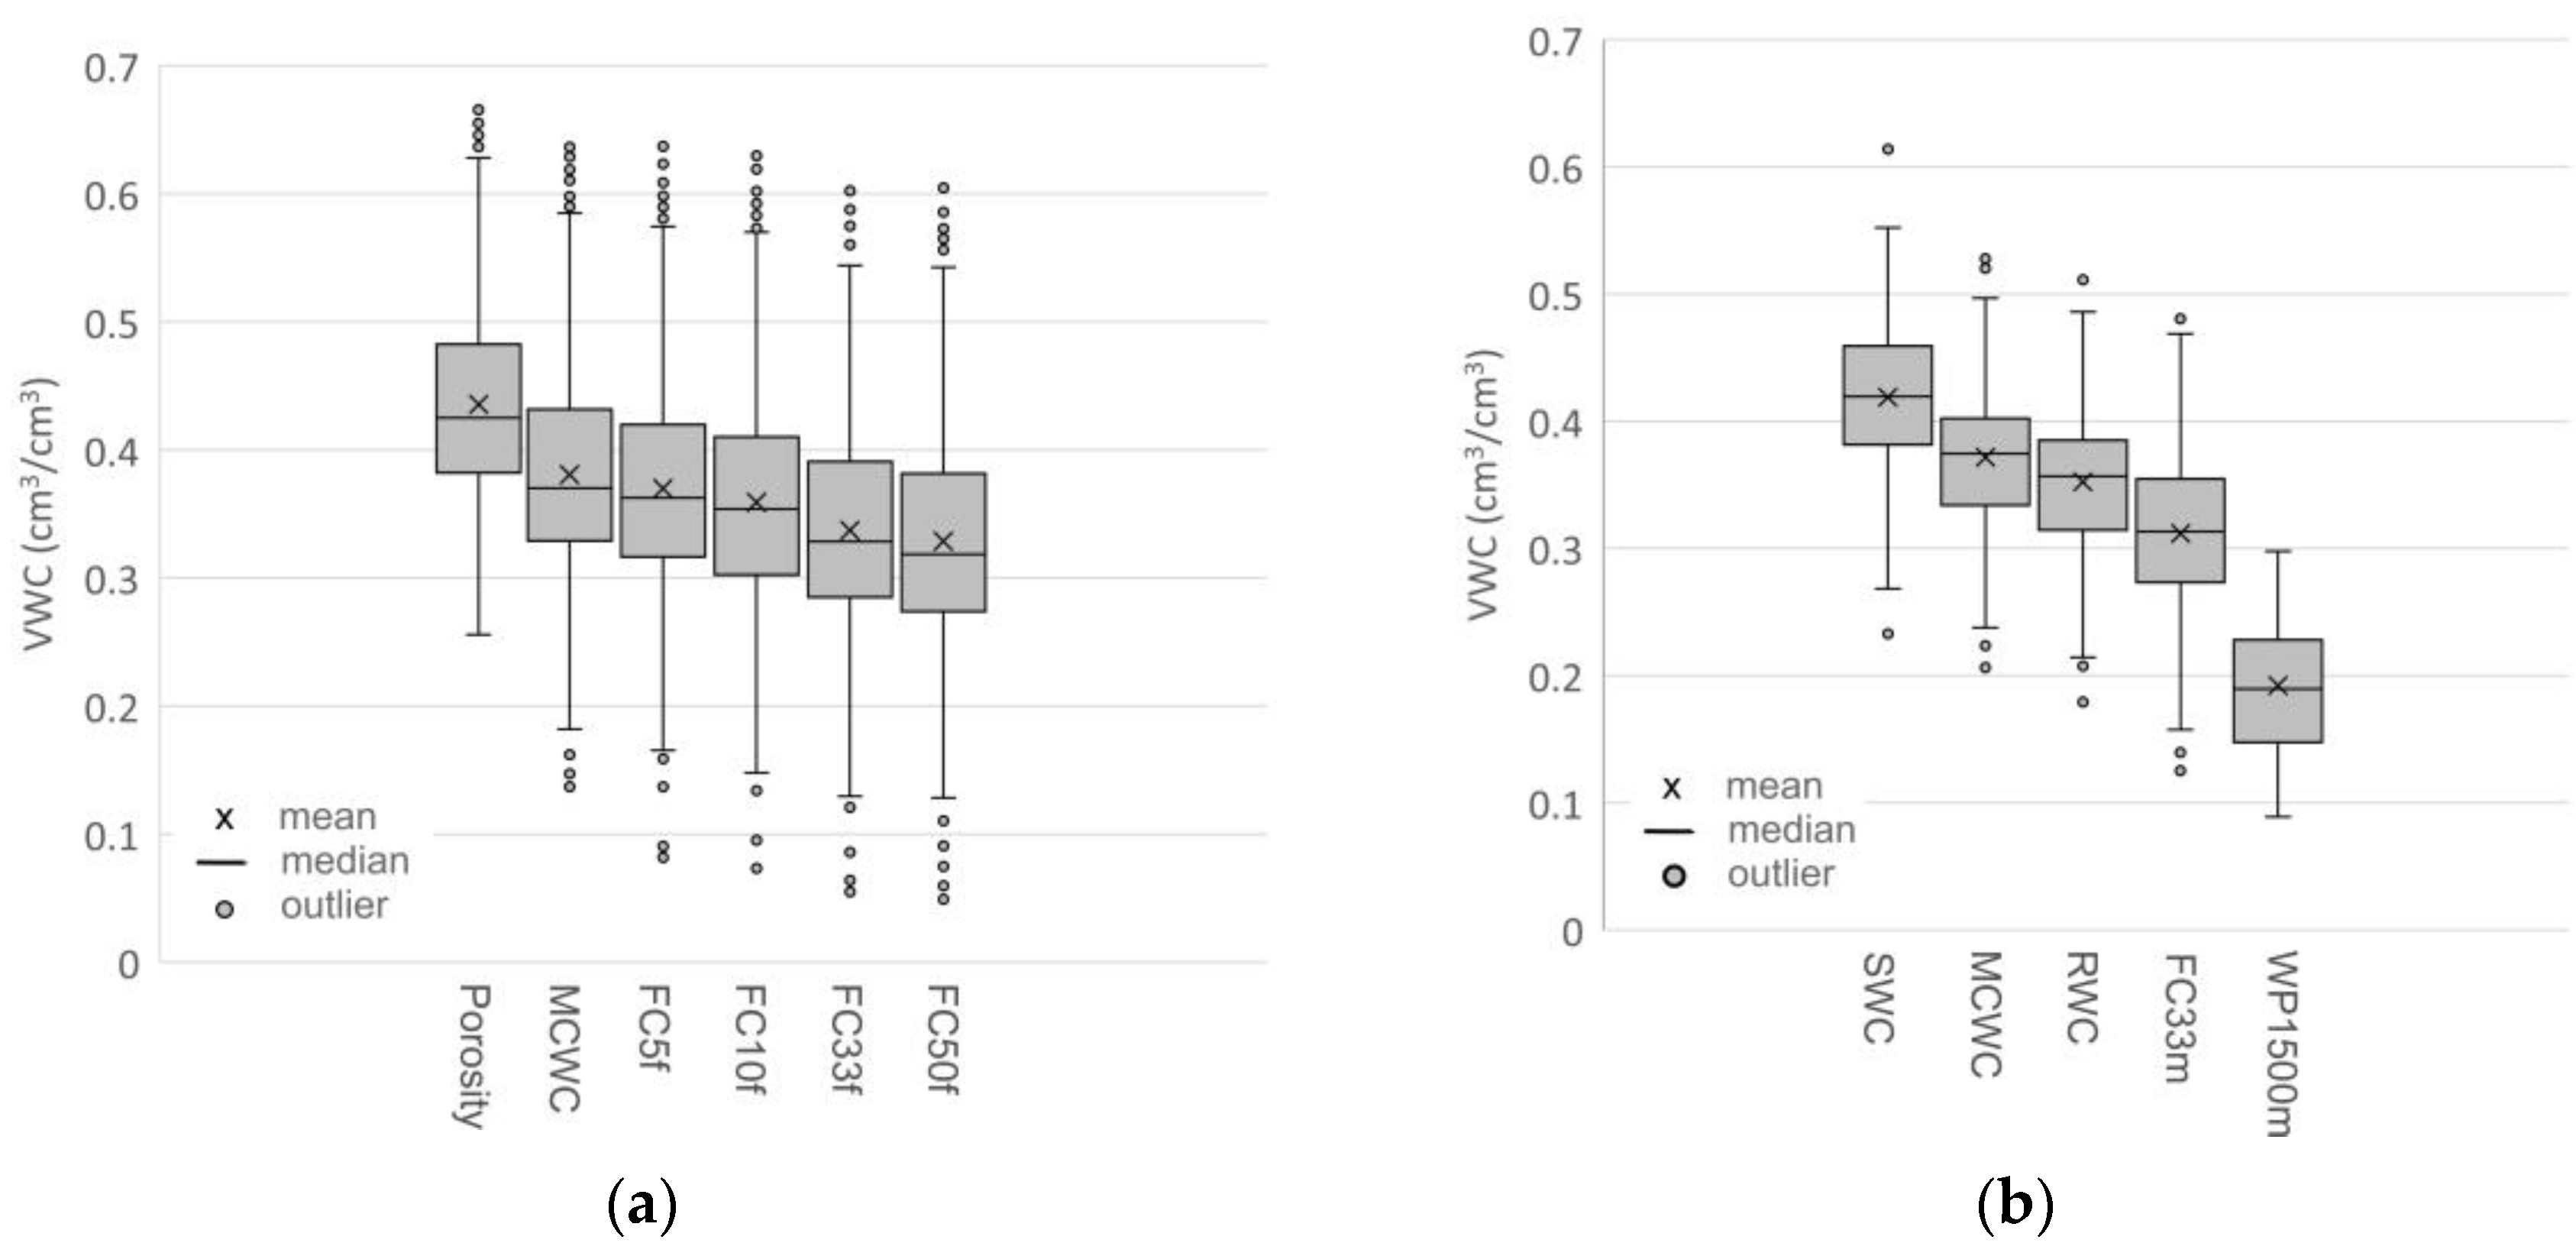
Table 2 offers an insight into the data derived from the HYPRESCZ database (dataset one). This dataset, which was used for investigating MCWC, includes a number of crucial soil properties, including the percentage of clay, silt and sand; dry bulk density (BD); organic matter content (OM); porosity, MCWC; and FC values fitted at four different suction pressures. An illustrative representation of filling the pores with water is summarized through box plots in Figure 2a. Higher values of the coefficient of variation for soil texture or organic matter indicate that there are different soils in the database, covering the high variability of the soils in the Czech Republic.
The descriptive statistics of dataset two, shown in Table 3, provide insight into the data relating to the investigation of RWC. This dataset consists of soil properties such as saturated water content, MCWC, RWC, FC measured at −33 kPa (FC33m), WP measured at −1500 kPa (WP1500m), and BD. To complement these statistics, Figure 2b provides box plots to visually represent the distribution and variability of soil moisture constants.
Furthermore, the descriptive statistics for dataset three are provided in Table 4. Besides the standard texture fractions of clay (<0.002 mm), silt (0.002–0.05 mm) and sand (0.05–2.0 mm), the FPSF (<0.01 mm) is provided, because it is a predictor of Equations (2) and (3). These statistics offer a comprehensive view of the variability exhibited by these soil properties.

3.2. Predictive Relationships between Soil Moisture Constants and Field Capacity

  • Maximum Capillary Water Capacity (Dataset One):
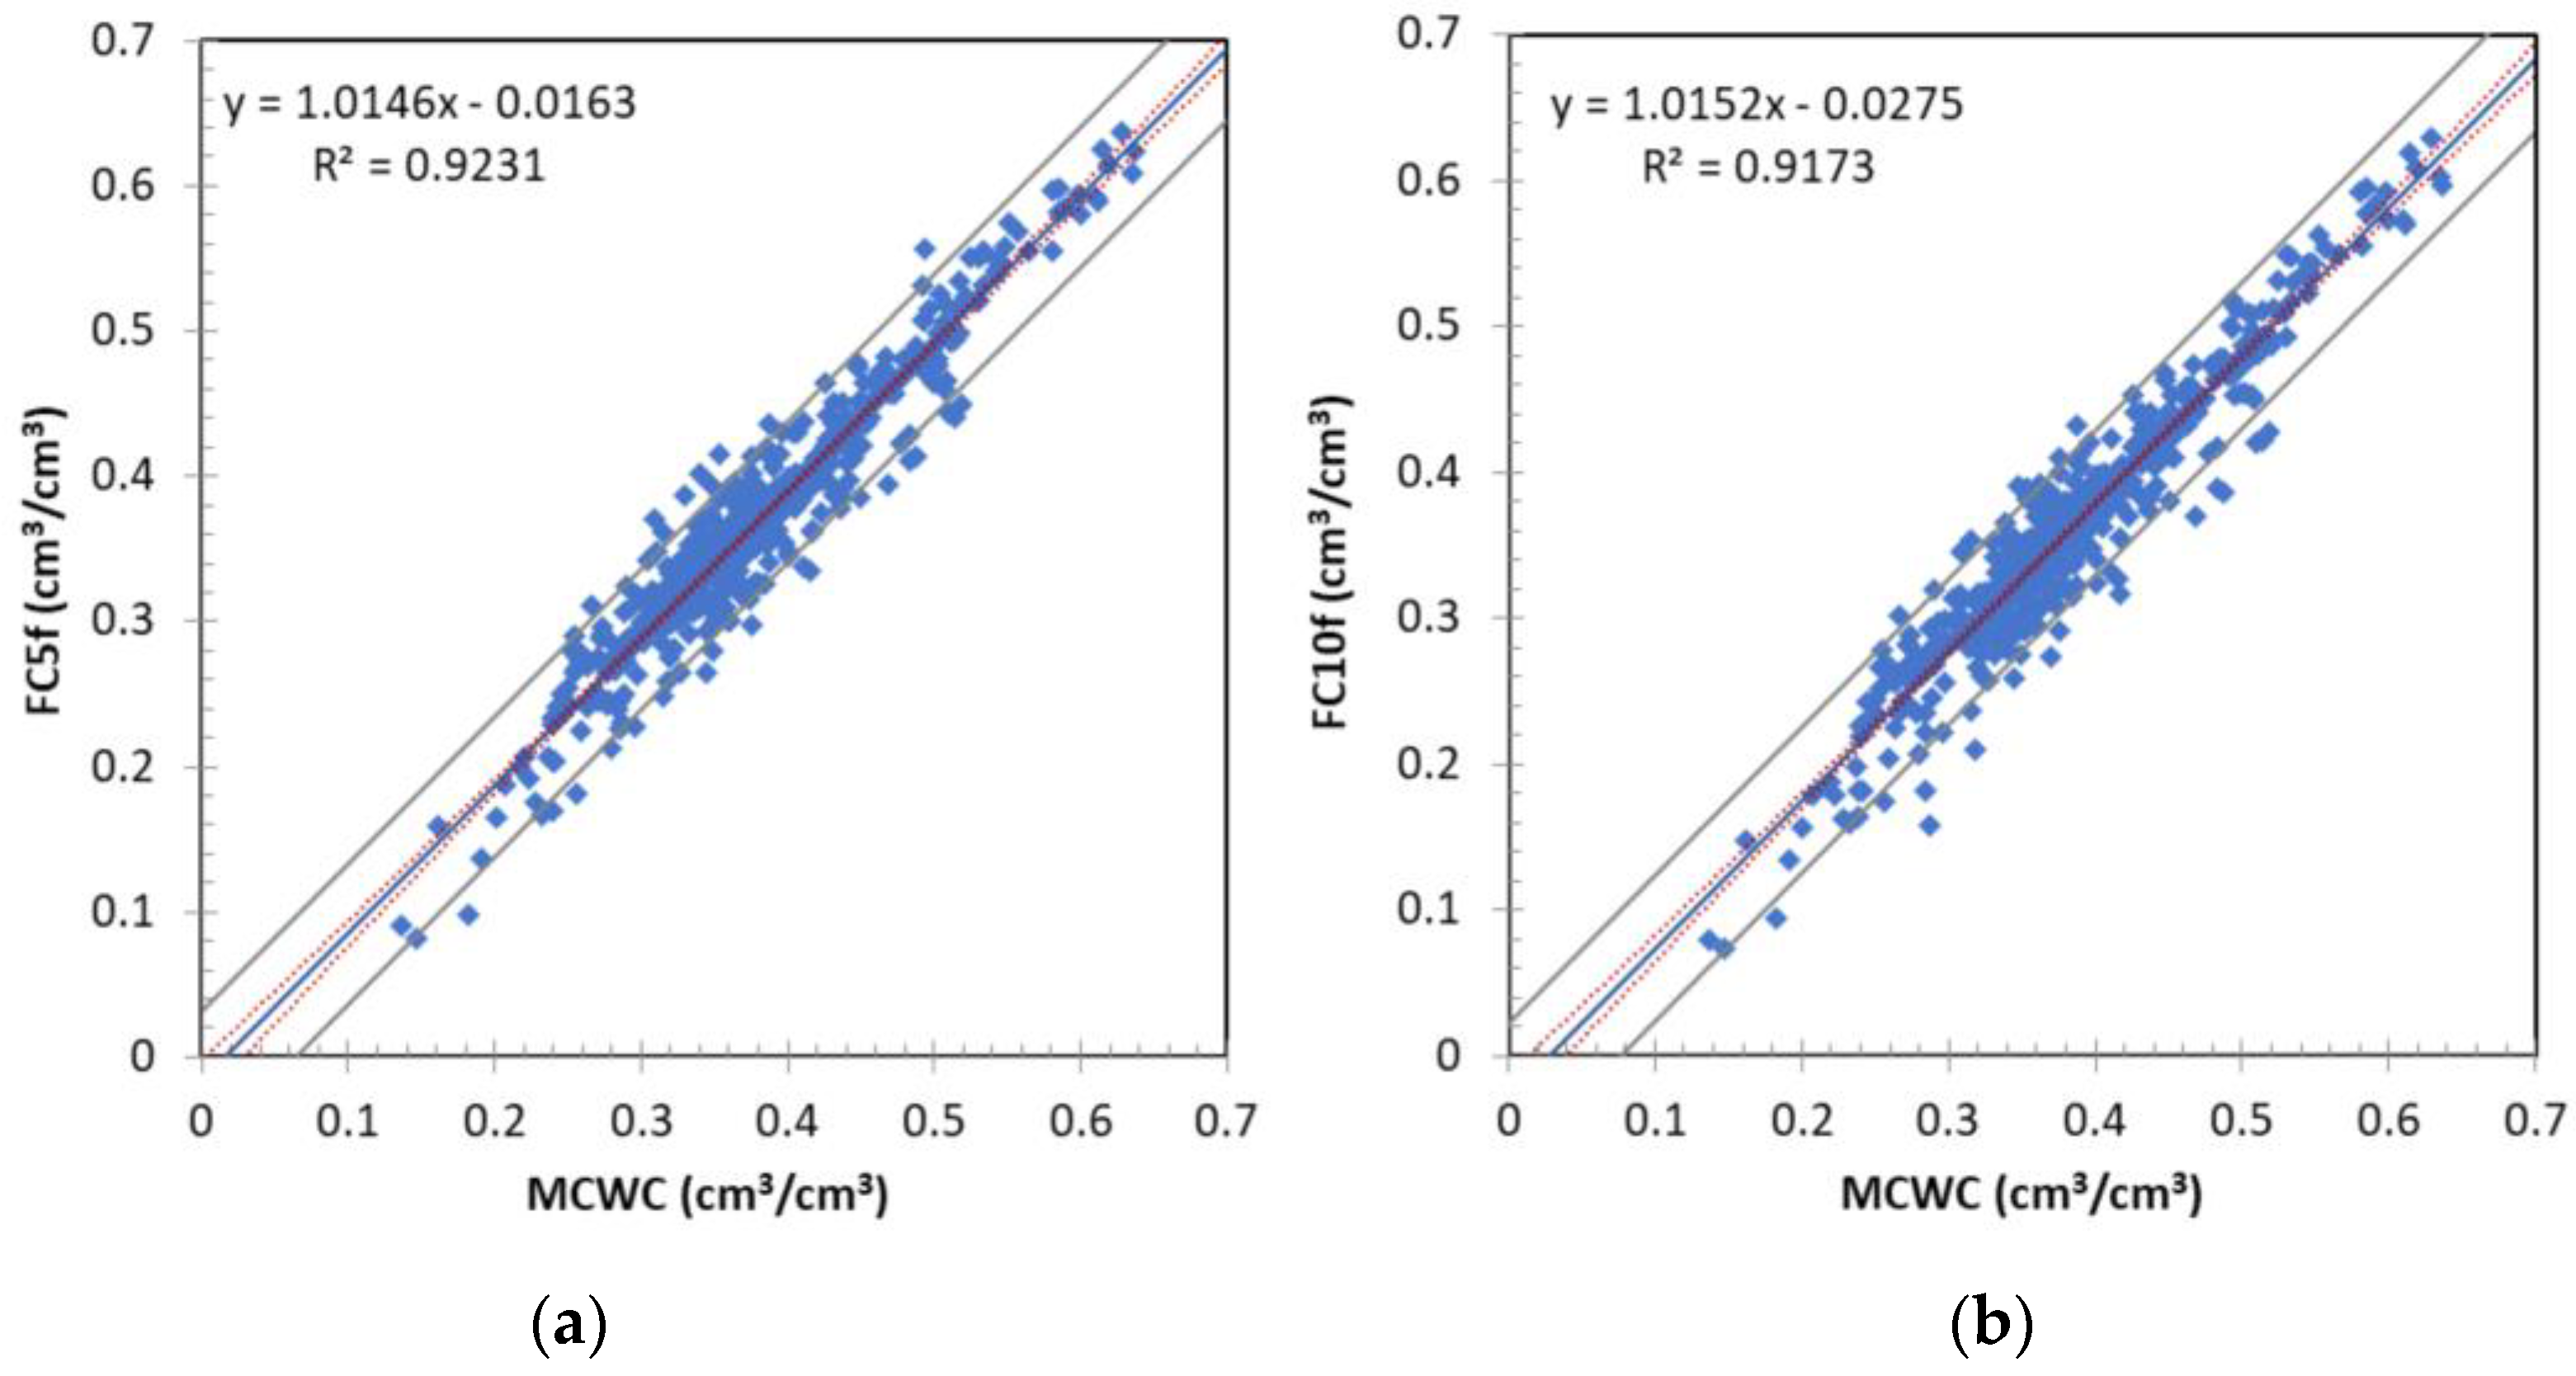
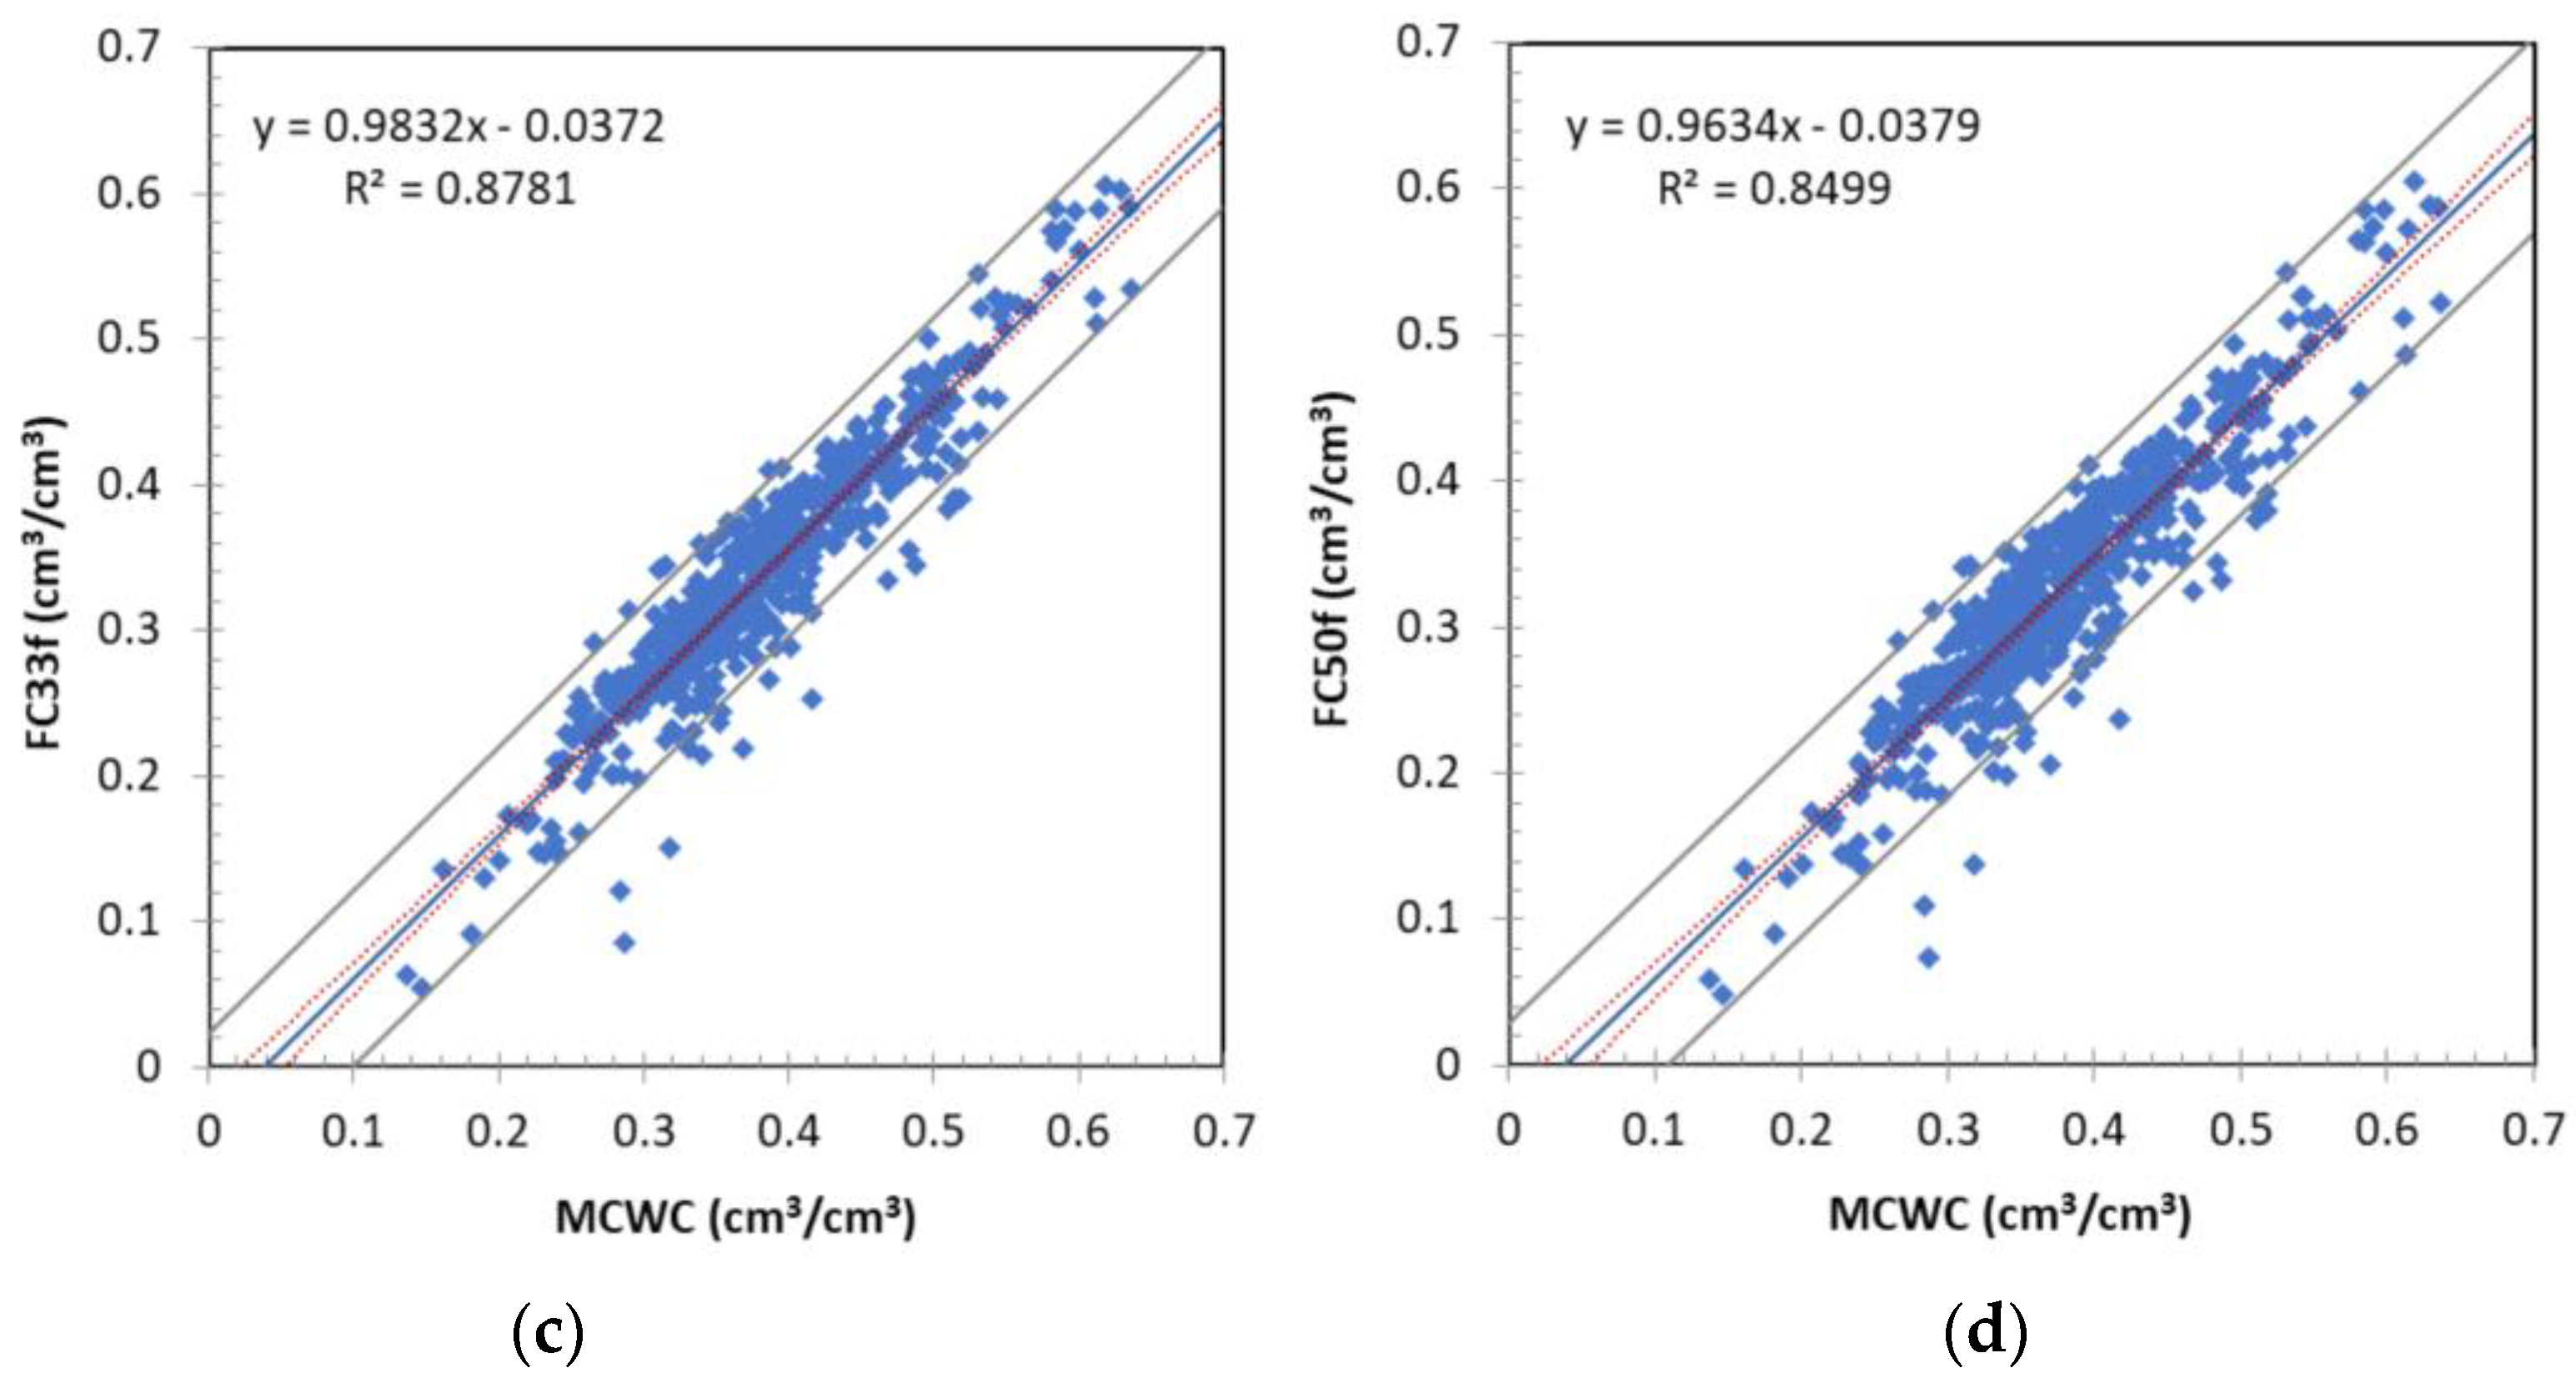
MCWC exhibits a strong correlation with FC5f, FC10f, FC33f and FC50f in dataset one (see Figure 3 and Table 5). These correlations have high R and R2 values, indicating a robust linear relationship between MCWC and the fitted field capacity values at different suction pressures. The RMSE and MAE values for MCWC in relation to FC5f, FC10f, FC33f and FC50f are relatively low, indicating accurate predictions. This suggests that MCWC is a reliable predictor for estimating field capacity in this dataset.
Confidence intervals (0.95) providing a view into the uncertainty when estimating the mean are included in the graphs, along with prediction intervals accounting for variation in the dependent variable around the mean.
It appears that the correlation between MCWC and FC5f stands out as the most favorable (Figure 3a). This correlation exhibits the lowest RMSE and MAE values, signifying smaller discrepancies between the observed and predicted values. It demonstrates the highest R and R2 values, indicating a strong linear relationship and better agreement between MCWC and FC5f.
  • Retention Water Capacity (Dataset Two):
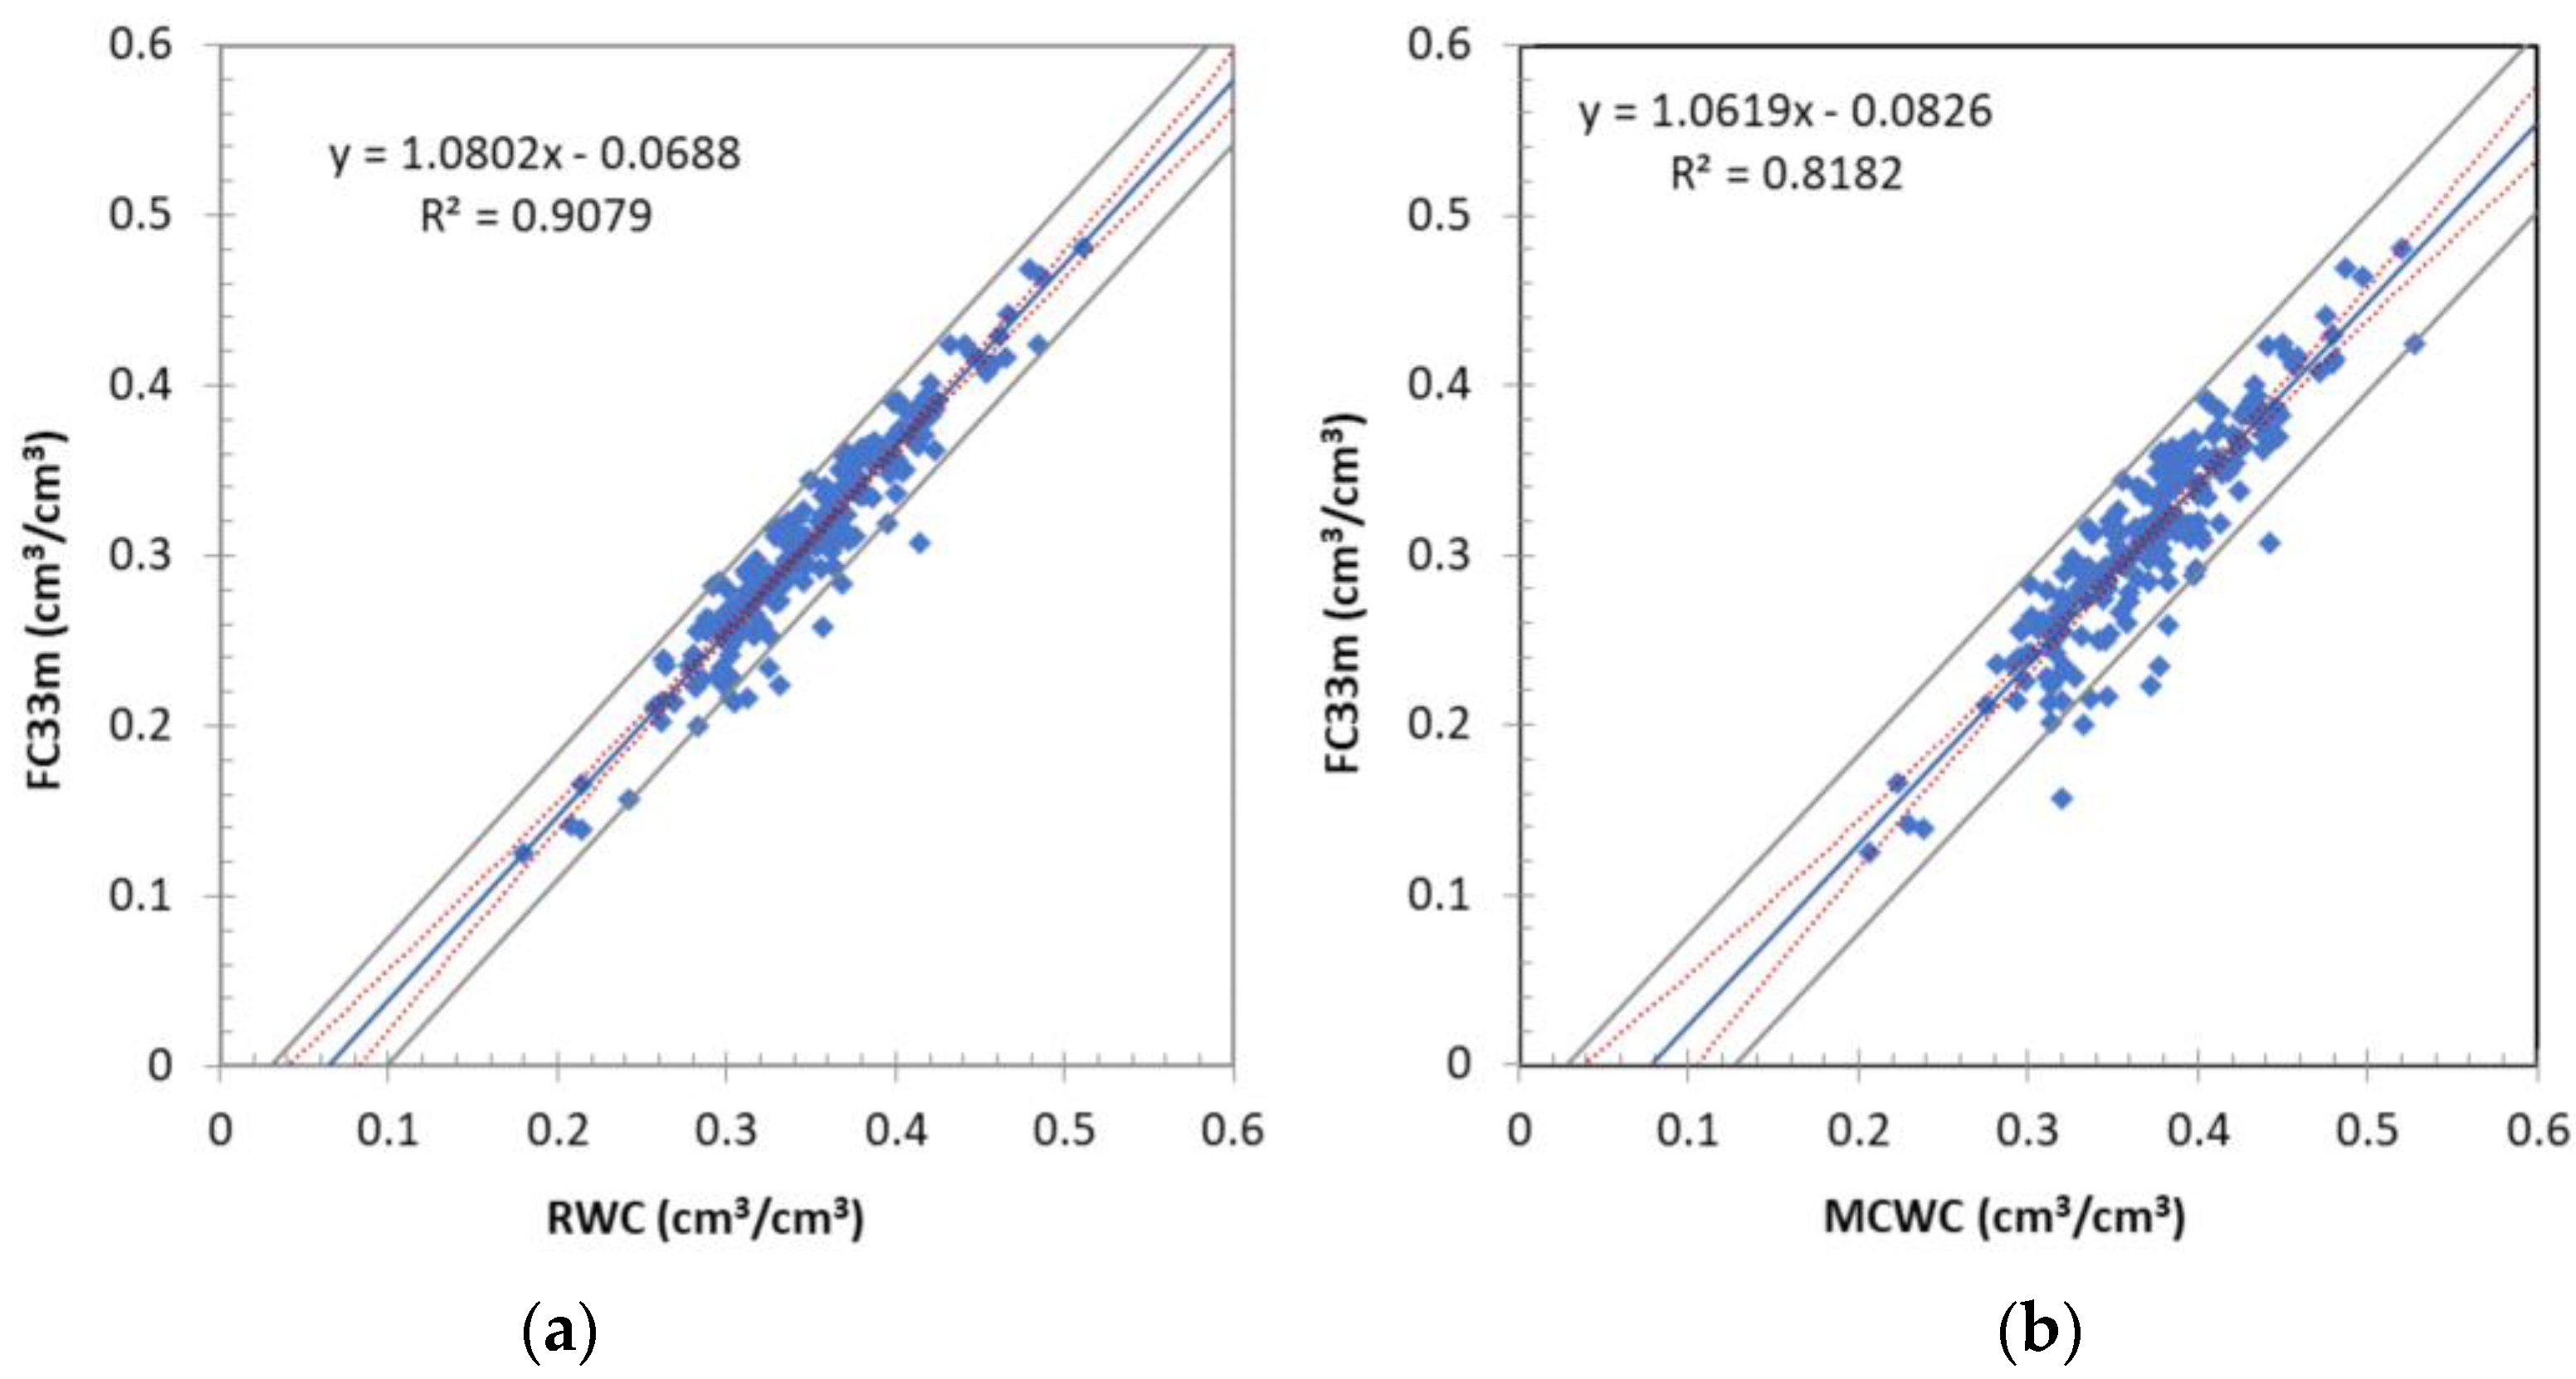
FC33m exhibits a strong correlation with both RWC and MCWC in dataset two (Figure 4). These correlations have high R and R2 values, implying a robust linear relationship. The RMSE and MAE values for FC33m in relation to RWC and MCWC are relatively low, indicating accurate predictions. This suggests that both retention water capacity and maximum capillary water capacity are reliable indicators for predicting FC at −33 kPa. Based on the uncertainty analysis values (Table 5), it appears that FC33m vs. RWC has better performance, indicating that it may be a more accurate predictor of FC compared to MCWC.

3.3. Results of Testing the Historical Pedotransfer Functions for Field Capacity Estimation

In dataset three, FC33f was estimated from FPSF by employing the equations FC by Brežný (Equation (2)) and FC by Váša (Equation (3)). The uncertainty analysis revealed rather modest correlations, with low R and R2 values, which is indicative of a moderate linear relationship. Moreover, the RMSE and MAE values are notably higher than those observed in the earlier datasets. This implies a significant level of discrepancy between the observed and predicted values. Ultimately, the performance of these PTFs is shown in Figure 5. The FC by Brežný (Figure 5a) exhibits slightly better performance than the FC by Váša. However, none of them can be recommended for general use. Similarly to FC33f, the estimation of other fitted field capacities, FC5f, FC10f and FC50f, using Equations (2) and (3) was tested as well. However, the results were rather worse; thus, only the FC33f estimation is presented.

4. Discussion

While the present study revealed an increase in both RMSE and MAE between the MCWC and soil water content at gradually increasing suction pressures (in absolute value), it is worth noting that the error magnitudes remained comparatively low. Additionally, a similar trend was observed for the minor decrease in R and R2 values obtained (see Table 5, Figure 3). As the suction intensifies, water is drained from progressively smaller and potentially more varied pores. The increased suction pressures when considered with soil hysteresis might also reduce the soil’s hydraulic connectivity, potentially leading to water entrapment [27]. Despite the slight increase in error and decrease in linearity with rising suction pressures, the relationship between MCWC and water content across the specified suction pressure values can still be considered linear to a significant degree.
MCWC is described [12] as the ability of the soil to retain water for plant needs. The presence and distribution of water within the soil pores continues to be influenced by gravity. The classification of water holding properties according to MCWC, from very poor water retention (MCWC < 5%) to very strong water retention (MCWC > 50%), is presented in Spasić et al. [12]. Good water retention occurs when the MCWC is between 10 and 30%. Compared to MCWC, RWC represents a rather steady state of soil moisture content close to negligible internal drainage. The influence of gravity no longer applies; the water in the pores is under the exclusive influence of capillary forces, specifically in capillary pores. Therefore, this value can represent the quantity of capillary pores in the soil.
The correlation between RWC and FC33m is very strong. This precision and accuracy are evident when evaluated in terms of the relatively short duration of MCWC determination (Table 5, Figure 4). Although MCWC presents a significant correspondence to FC33m given its more rapid assessment period, the disparities between the two measurements may underscore the importance of drainage duration. The FC at −33 kPa inherently represents an equilibrium state between the drained larger pores and the water-retaining smaller-capillary pores, which is better reflected by RWC than by MCWC.
Despite this fact, MCWC remains a more widely used soil moisture constant. MCWCs were extensively obtained during the General Soil Survey of Agricultural Soils (GSSAS), which took place in former Czechoslovakia in the years 1961–1970. Averaged MCWC values for different genetic soil types are presented in the study of Vopravil et al. [14]. The Stagnosols, together with Gleysols, exhibited the highest average MCWC (approx. 41%), while the Luvisols and Leptosols showed the lowest values (approx. 34%), and Cambisols, Fluvisols, Chernozems and Phaeozems were in between with approx. 36–37%. Pospíšilová et al. [28] pointed out that MCWC determines the value of maximum saturation of soil capillary pores. For loamy soils, it should not exceed 36%; otherwise, it shows problems with water infiltration. It is therefore the maximum water content to which the soil should be irrigated without the risk of water losses or waterlogging. Marfo et al. [29] selected MCWC as one the soil properties when assessing the soil’s fertility and productivity in their study on ecotone dynamics in the forest–agriculture land transition. They observed a decline in its value in the ecotone area.
Simple linear relationships for the approximation of soil properties are a rather popular form of PTF application. As an example, the linear relationship determined by Němeček et al. [30], which was widely used for the recalculation of clay fractions from a clay fraction of <0.001 mm (%) to a clay fraction of <0.002 mm (%), can be presented. This relationship was applied during conversion between the Taxonomic Classification System of Soils of the Czech Republic and the World Reference Base for Soil Resources [31]. The determination coefficient R2 of the presented linear regression was 0.9748.
As further examples, historical linear regression equations relating an FPSF to the WP, such as the equations by Váša, Solnář or Brežný [13], can be presented. These equations complement Equations (2) and (3) tested in this study and are still in use, although their reliability is questionable, as demonstrated by the results of this study.
Litschmann et al. [32] introduced a novel approach for the evaluation of moisture and temperature conditions in potato cultivation. In their study, soil moisture was expressed as the % of available water capacity (AWC), which is calculated as the difference between the FC and WP, and should not fall below 60% of AWC when growing potatoes. The equations by Brežný were included for obtaining FC and WP indirectly. Litschmann et al. [33] conducted a comprehensive study on determining FC through the permanent measuring of soil moisture after abundant rainfalls. They employed the equation by Brežný for FC inversely to obtain the value of FPSF, and consequently, used an equation by Brežný for WP calculation, which was 5.4% by volume. The researchers report fairly good agreement inversely with the values previously published for this site. On the national level, the equations by Brežný were used by Novák [34] in the area assessment of dried-up soils in the Czech Republic.
Haberle et al. [20] conducted research onto the associations between the 13C discrimination observed in specific plant species and the spatial heterogeneity of soil properties within agricultural fields. These soil properties were pertinent to the influence of water scarcity on crop productivity. 13C discrimination serves as an indicator of water stress in plants. Their investigation revealed the impact of drought through statistically significant correlations between 13C discrimination during arid periods and soil properties such as AWC. To support their analysis, they derived FC and WP values using the methodology established by Brežný.
Similarly, Haberle et al. [35] used the equations by Váša in their study on the comparison of the calculated and experimentally determined available water supply in the root zone of selected crops.
Vlček and Hybler [19] conducted a rather extensive study to test different simple regression-type PTFs for estimating FC and WP, including the equations by Váša. Among the tested models of PTFs, the equations by Váša showed the poorest performance for both soil moisture constants (R 0.89 and 0.81, respectively). However, the researchers highlighted the fact that minimum input data (only FPSF) were utilized.

5. Conclusions

This study investigated the potential of the so called “filter paper draining method” to be used in the rapid and cost-effective indirect determination of FC. The filter paper draining method is based on draining capillary-saturated soil core samples (typically 100 cm3 in volume) using filter paper at accurate time intervals. While keeping the experimental settings described in detail in the Section 2, it can be summarized that 2 h of draining results in an MCWC soil moisture constant value, while 24 h of draining results in an RWC soil moisture constant value. Adding the time necessary for capillary saturation (1–3 days) and time for oven drying (1 day), MCWC and RWC as predictors for FC can be obtained within 3 to 5 days. It should be noted that expensive devices’ capacity, as seen with the pressure plate apparatus or HYPROP, is limited. The capacity of the filter paper draining method can be increased instantly even with a very low budget. In addition, the method is environmentally friendly with minimum energy requirements compared to, e.g., the pressure plate method.
The results of the present study revealed a very strong correlation between MCWC/RWC and FC determined as soil water content at a selected suction pressure, which allows for the reasonable use of the following equations for indirect FC determination:
  • FC determined as soil water content of −33 kPa can be effectively approximated using the equation:
FC33 = 1.0802 RWC − 0.0688 (with RMSE = 0.045 cm3/cm3 and R = 0.953).
  • FC determined as soil water content of −5 or −10 kPa can be effectively approximated, respectively, using the equation:
FC5 = 1.0146 MCWC − 0.0163 (with RMSE = 0.027 cm3/cm3 and R = 0.961) or
FC10 = 1.0152 MCWC − 0.0275 (with RMSE = 0.033 cm3/cm3 and R = 0.958).
The results of the present study were verified on more than 700 samples covering the range of arable lands of the Czech Republic and thus can be potentially used in three ways:
  • The use of legacy databases containing MCWC and RWC values together with the equations developed in this study.
  • The fast and effective indirect determination of FC in new studies. The potential use of the equations developed in this study out of the Czech Republic should be verified via traditional FC determination.
  • The development of similar, site-specific equations.
The last contribution of this study is the outcome from the testing of the historical PTFs by Brežný and Váša [13,25], which estimate FC from the fine particle size fraction, on a rather big dataset of 471 entries. Despite modern PTF development, these traditional equations are still in use by many researchers. However, according to the results of the present study, they cannot be recommended for the estimation of FC defined as water content at a certain suction pressure.

Author Contributions

C.A. contributed to the conceptualization, investigation, validation, visualization and writing. M.M. contributed to the conceptualization, data curation, formal analysis, investigation, methodology, project administration, supervision, validation, visualization and writing. K.B. contributed to the conceptualization, data curation, formal analysis, methodology, validation, visualization and writing. J.V. contributed to the data curation, funding acquisition, investigation, project administration, resources, supervision and validation. S.M. contributed to the funding acquisition, investigation, project administration, resources and supervision. T.K. contributed to the data curation, investigation and resources. R.S.K. contributed to the investigation and writing. All authors contributed to the editing and provision of ideas for writing. All authors have read and agreed to the published version of the manuscript.

Funding

This study was supported by the Ministry of Agriculture of the Czech Republic, National Agency for Agricultural Research, project No. QK1910299, and by the Czech University of Life Sciences Prague, Faculty of Agrobiology, Food and Natural Resources, project No. SV22-15-21380.

Data Availability Statement

The data presented in this study are available on request from the corresponding author. The data are not publicly available to exclude the possibility of unauthorized use during ongoing related research.

Conflicts of Interest

The authors declare no conflict of interest. The funders had no role in the design of the study; in the collection, analyses, or interpretation of the data; in the writing of the manuscript; or in the decision to publish the results.

List of Abbreviations

FC Field capacity (cm3/cm3 or %)
FC5f Field capacity determined at suction pressure of −5 kPa; letter f indicates fitted value (similarly for suction pressures of −10, −33 and −50 kPa) (cm3/cm3 or %)
FC33mField capacity determined at suction pressure of −33 kPa; letter m indicates measured value (cm3/cm3 or %)
FPSF Fine particle size fraction (soil particles < 0.01 mm) (%)
MCWC Maximum capillary water capacity (cm3/cm3 or %)
PTFs Pedotransfer functions
RWC Retention water capacity (cm3/cm3 or %)
SWRC Soil water retention curve
WP Permanent wilting point (cm3/cm3 or %)

References

  1. Veihmeyer, F.J.; Hendrickson, A.H. Soil moisture conditions in relation to plant growth. Plant Physiol. 1927, 2, 71–82. [Google Scholar] [CrossRef]
  2. Cassel, D.K.; Nielsen, D.R. Field Capacity and Available Water Capacity. In Methods of Soil Analysis: Part 1. Physical and Mineralogical Methods, 2nd ed.; Klute, A., Ed.; American Society of Agronomy-Soil Science Society of America: Madison, WI, USA, 1986; pp. 901–926. ISBN 0-89118-088-5. [Google Scholar]
  3. Doležal, F.; Hernandez-Gomis, R.; Matula, S.; Gulamov, M.; Miháliková, M.; Khodjaev, S. Actual evapotranspiration of unirrigated grass in a smart field lysimeter. Vadose Zone J. 2018, 17, 1–13. [Google Scholar] [CrossRef]
  4. Klute, A. (Ed.) Water Retention: Laboratory methods. In Methods of Soil Analysis: Part 1. Physical and Mineralogical Methods, 2nd ed.; American Society of Agronomy-Soil Science Society of America: Madison, WI, USA, 1986; pp. 635–662. ISBN 0-89118-088-5. [Google Scholar]
  5. Richards, L.A. A Pressure-membrane Extraction Apparatus for Soil Solution. Soil Sci. 1941, 51, 377–386. [Google Scholar] [CrossRef]
  6. Gülser, C.; Ekberli, I.; Candemir, F. Spatial variability of soil physical properties in a cultivated field. Eurasian Soil Sci. 2016, 5, 192–200. [Google Scholar] [CrossRef]
  7. Gunarathna, M.H.J.P.; Sakai, K.; Nakandakari, T.; Momii, K.; Kumari, M.K.N. Machine Learning Approaches to Develop Pedotransfer Functions for Tropical Sri Lankan Soils. Water 2019, 11, 1940. [Google Scholar] [CrossRef]
  8. Myeni, L.; Mdlambuzi, T.; Paterson, D.G.; De Nysschen, G.; Moeletsi, M.E. Development and Evaluation of Pedotransfer Functions to Estimate Soil Moisture Content at Field Capacity and Permanent Wilting Point for South African Soils. Water 2021, 13, 2639. [Google Scholar] [CrossRef]
  9. Schindler, U.; Müller, L. Simplifying the evaporation method for quantifying soil hydraulic properties. J. Plant Nutr. Soil Sci. 2006, 169, 623–629. [Google Scholar] [CrossRef]
  10. Kutílek, M.; Nielsen, D.R. Soil Hydrology; Catena Verlag: Cremlingen, Germany, 1994. [Google Scholar]
  11. Vásquez-Nogal, I.; Hernández-Mendoza, C.E.; Cárdenas-Robles, A.I.; Rojas-González, E. Estimating the Soil-Water Retention Curve of Arsenic-Contaminated Soil by Fitting Fuentes’ Model and Their Comparison with the Filter Paper Method. Appl. Sci. 2022, 12, 7793. [Google Scholar] [CrossRef]
  12. Spasić, M.; Vacek, O.; Vejvodová, K.; Tejnecký, V.; Polák, F.; Borůvka, L.; Drábek, O. Determination of physical properties of undisturbed soil samples according to V. Novák. MethodsX 2023, 10, 102133. [Google Scholar] [CrossRef]
  13. Drbal, J. Practicum in Soil Amelioration Pedology, 1st ed.; State Pedagogical Publishing House: Prague, Czech Republic, 1971. (In Czech) [Google Scholar]
  14. Vopravil, J.; Formánek, P.; Khel, T. Comparison of the physical properties of soils belonging to different reference soil groups. Soil Water Res. 2021, 16, 29–38. [Google Scholar] [CrossRef]
  15. Wösten, J.H.M.; Lilly, A.; Nemes, A.; Le Bas, C. Development and use of a database of hydraulic properties of European soils. Geoderma 1999, 90, 169–185. [Google Scholar] [CrossRef]
  16. Nemes, A.; Roberts, R.T.; Rawls, W.J.; Pachepsky, Y.A.; van Genuchten, M.T. Software to estimate −33 and −1500 kPa soil water retention using the non-parametric k-Nearest Neighbor technique. Version 1.00.02. Environ. Model. Softw. 2008, 23, 254–255. [Google Scholar] [CrossRef]
  17. Miháliková, M.; Özyazici, M.; Dengiz, O. Mapping Soil Water Retention on Agricultural Lands in Central and Eastern Parts of the Black Sea Region in Turkey. J. Irrig. Drain. Eng. 2016, 142, 05016008. [Google Scholar] [CrossRef]
  18. Tunçay, T.; Alaboz, P.; Dengiz, O.; Başkan, O. Application of regression kriging and machine learning methods to estimate soil moisture constants in a semi-arid terrestrial area. Comput. Electron. Agric. 2023, 212, 108–118. [Google Scholar] [CrossRef]
  19. Vlček, V.; Hybler, V. Verification of Appropriateness of Selected Pedotransfer Functions for the Basic Use in Agriculture of the Czech Republic. Acta Univ. Agric. Silvic. Mendel. Brun. 2015, 63, 178. [Google Scholar] [CrossRef]
  20. Haberle, J.; Duffková, R.; Raimanová, I.; Fučík, P.; Svoboda, P.; Lukas, V.; Kurešová, G. The 13C discrimination of crops identifies soil spatial variability related to water shortage vulnerability. Agronomy 2020, 10, 1691. [Google Scholar] [CrossRef]
  21. Barradas, J.M.; Matula, S.; Dolezal, F. A decision support system-fertigation simulator (DSS-FS) for design and optimization of sprinkler and drip irrigation systems. Comput. Electron. Agric. 2012, 86, 111–119. [Google Scholar] [CrossRef]
  22. Miháliková, M.; Matula, S.; Doležal, F. HYPRESCZ—Database of Soil Hydrophysical Properties in the Czech Republic. Soil Water Res. 2013, 8, 34–41. [Google Scholar] [CrossRef]
  23. van Genuchten, M.T. A Closed-form Equation for Predicting the Hydraulic Conductivity of Unsaturated Soils. Soil Sci. Soc. Am. J. 1980, 44, 892–898. [Google Scholar] [CrossRef]
  24. van Genuchten, M.V.; Leij, F.J.; Yates, S.R. The RETC Code for Quantifying Hydraulic Functions of Unsaturated Soils; EPA/600/2-91/065, R.S.; U.S. Environmental Protection Agency: Ada, OK, USA, 1991; Volume 83.
  25. Brežný, O. Relationships between soil moisture constants and mechanical-physical properties of soil. Sci. Work. Res. Inst. Irrig. Manag. Bratisl. 1970, 8, 53–80. (In Slovak) [Google Scholar]
  26. Patil, N.G.; Singh, S.K. Pedotransfer functions for estimating soil hydraulic properties: A review. Pedosphere 2016, 26, 417–430. [Google Scholar] [CrossRef]
  27. Onyelowe, K.C.; Mojtahedi, F.F.; Azizi, S.; Mahdi, H.A.; Sujatha, E.R.; Ebid, A.M.; Aneke, F.I. Innovative overview of SWRC application in modeling geotechnical engineering problems. Designs 2022, 6, 69. [Google Scholar] [CrossRef]
  28. Pospíšilová, L.; Vlček, V.; Hybler, V.; Hábová, M.; Jandák, J. Standard analytical methods and evaluation criteria of soil physical, agrochemical, biological, and hygienic parameters. In Folia Universitatis Agriculturae et Silviculturae Mendelianae Brunensis; Mendelova univerzita v Brně: Brno-sever, Czech Republic, 2016; Volume 9. [Google Scholar]
  29. Marfo, D.T.; Datta, R.; Vranová, V.; Ekielski, A. Ecotone Dynamics and Stability from Soil Perspective: Forest-Agriculture Land Transition. Agriculture 2019, 9, 228. [Google Scholar] [CrossRef]
  30. Němeček, J.; Macků, J.; Vokoun, J.; Vavříček, D.; Novák, P. The Taxonomic Classification System of Soils in the Czech Republic; Czech University of Life Sciences Prague: Prague, Czech Republic, 2001; ISBN 80-238-8061-6. (In Czech) [Google Scholar]
  31. Sládková, J. Conversion of some soil types, subtypes, and varieties between the Taxonomic Classification System of Soils of the Czech Republic and the World Reference Base for Soil Resources. Soil Water Res. 2010, 5, 172–185. [Google Scholar] [CrossRef]
  32. Litschmann, T.; Doležal, P.; Hausvater, E. A New Approach to Evaluation of Moisture and Temperature Conditions in Potato Growing. In Půdní a Zemědělské Sucho. Sborník Abstraktů z Mezinárodní Konference; Rožnovský, J., Vopravil, J., Eds.; Výzkumný ústav meliorací a ochrany půdy: Kutná Hora, Czech Republic, 2016; pp. 582–592. ISBN 978-80-87361-55-9. [Google Scholar]
  33. Litschmann, T.; Rožnovský, J.; Salaš, P.; Burgová, J.; Lošák, M.; Vymyslický, T. Stanovení půdních hydrolimitů na písčitých půdách Hodonínska in situ. In Proceedings of the Sborník příspěvků z Conference Hospodaření s Vodou v Krajině, Třeboň, Czech Republic, 9–10 October 2020; pp. 10–17. [Google Scholar]
  34. Novák, P. Dried-up soils of the Czech Republic and their area assessment. In Proceedings of the Moisture Conditions of the Landscape: Collection of Peer-Reviewed Papers from an International Conference, Mikulov, Czech Republic, 4–5 April 2012; pp. 108–111, ISBN 978-80-86690-78-0. [Google Scholar]
  35. Haberle, J.; Svoboda, P.; Kohút, M.; Kurešová, G. The comparison of calculated and experimentally determined available water supply in the root zone of selected crops. In Proceedings of the Mendel and Bioclimatology International Conference, Brno, Czech Republic, 3–5 September 2014; Brzezina, J., Hálová, H., Litschmann, T., Rožnovský, J., Středa, T., Středová, H., Eds.; Mendel University in Brno: Brno, Czech Republic, 2016. 1st edition; 478p. ISBN 978-80-7509-397-4. [Google Scholar]
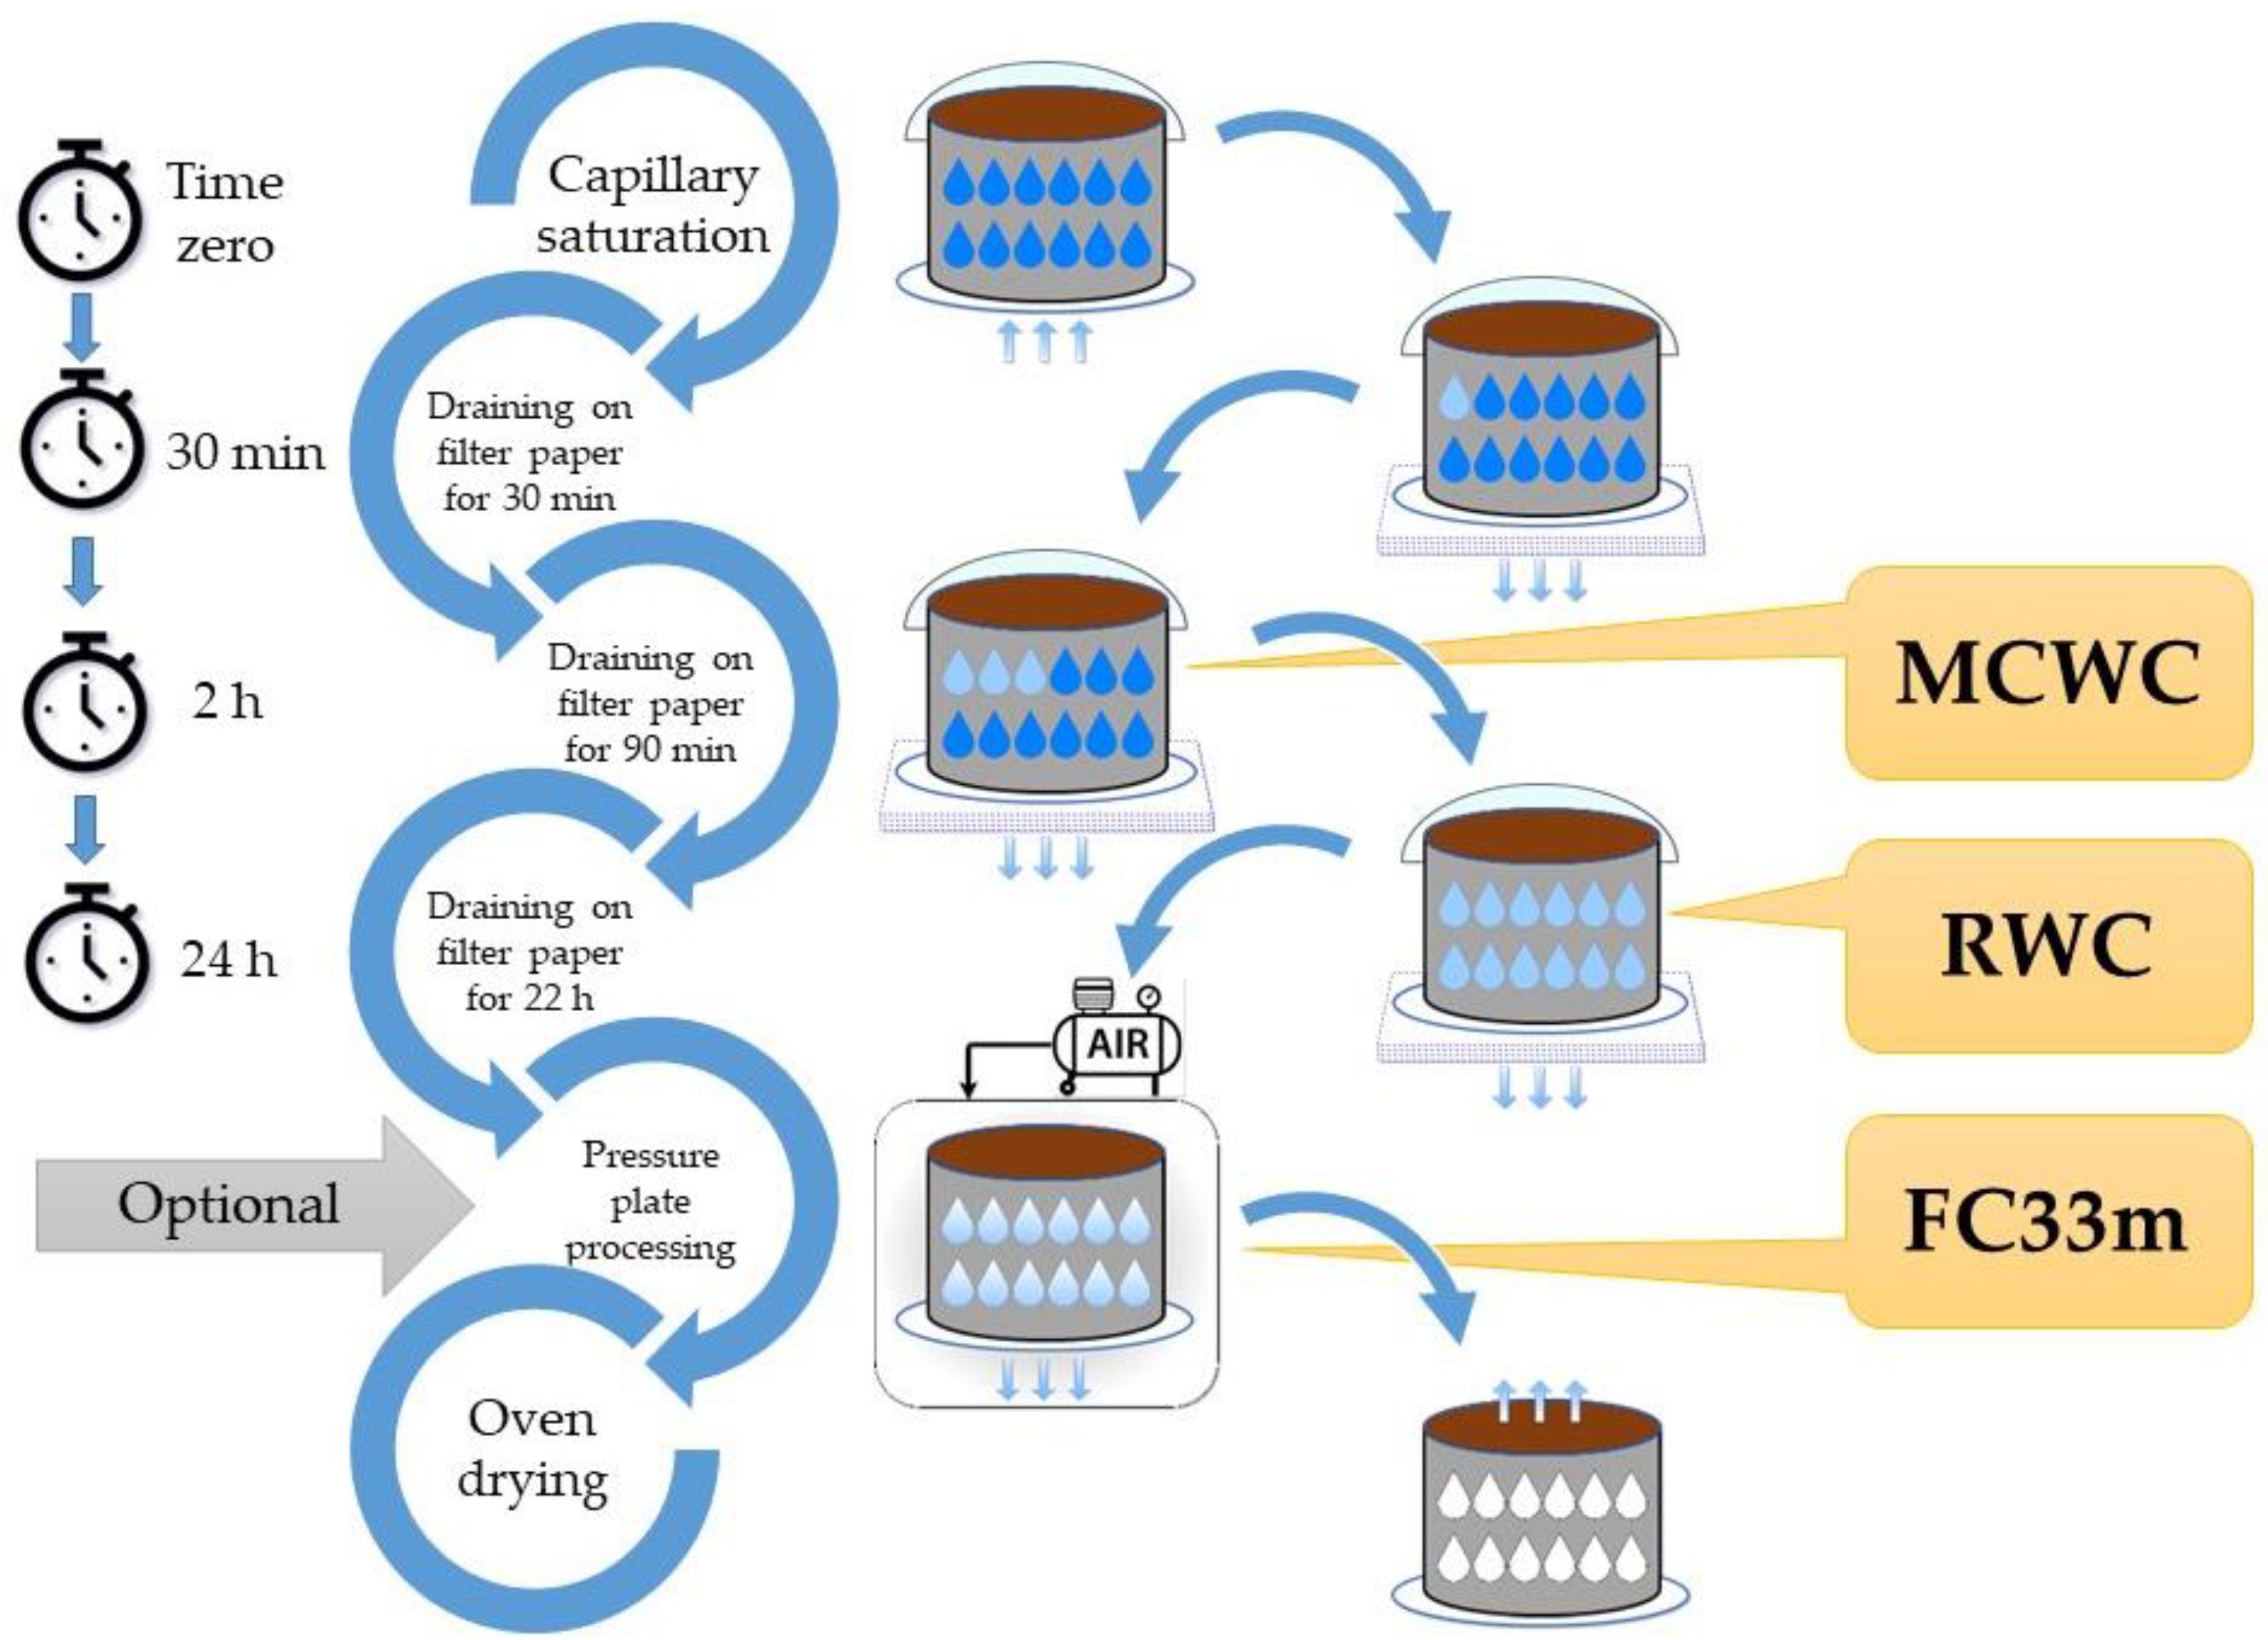
Figure 1. Schematic diagram of the workflow, including filter paper draining method followed by the pressure plate method. MCWC—maximum capillary water capacity, RWC—retention water capacity, FC33m—field capacity measured as water content at −33 kPa.
Hydrology 10 00202 g001
Figure 2. Soil moisture constants: (a) dataset one: data for MCWC investigation, (b) dataset two: data for RWC investigation. SWC—saturated water content; MCWC—maximum capillary water capacity; RWC—retention water capacity; FC—field capacity; 5, 10, 33, 50—suction pressure (kPa, in abs. value); f—fitted; m—measured; WP1500m—permanent wilting point measured as water content at −1500 kPa. The box—lower and upper quartiles; median—the line splitting the box into two parts; the cross—the mean value; whiskers—minimum and maximum (limited to a maximum of 1.5 times the interquartile range).
Hydrology 10 00202 g002
Figure 3. Measured soil moisture constant MCWC and fitted FC selected for several suction pressures, including −5 kPa (a), −10 kPa (b), −33 kPa (c) and −50 kPa (d). Confidence (red) and prediction (grey) intervals are provided (0.95).
Hydrology 10 00202 g003aHydrology 10 00202 g003b
Figure 4. Scatter plots of FC as volumetric water content determined at suction pressure of −33 kPa and soil moisture constants RVC (a) and MCWC (b). Confidence (red) and prediction (grey) intervals are provided (0.95).
Hydrology 10 00202 g004
Figure 5. Testing of relationships of Brežný (a) and Váša (b) for estimation of field capacity (determined as fitted value calculated using van Genuchten’s equation at suction pressure of −33 kPa). Confidence (red) and prediction (grey) intervals are provided (0.95).
Hydrology 10 00202 g005
Table 1. Summary of data availability within the three datasets.
Dataset OneDataset TwoDataset Three
Origin of dataHYPRESCZMeasuredHYPRESCZ
N. of data534207471
Purpose of useTo correlate MCWC with FC5f, FC10f, FC33f and FC50fTo correlate MCWC and RWC with FC33mTo test historical PTFs
Availability within the dataset
MCWCYesYesNot relevant
RWCNoYesNot relevant
FC fitted for −5, −10, −33 and −50 kPaYesNoYes
FC measured for −33 kPaNoYesNo
FPSFNot relevantNot relevantYes
MCWC—maximum capillary water capacity, RWC—retention water capacity, FC—field capacity, 5, 10, 33, 50—suction pressure (kPa, in abs. value), f—fitted, m—measured, FPSF—fine particle size fraction, PTFs—pedotransfer functions.
Table 2. Descriptive statistics of data from HYPRESCZ database for MCWC investigation (dataset one).
VariableMeanMinimumMaximumLower QuartileUpper QuartileSDCV
Clay (%)25.43.466.914.934.112.549.0
Silt (%)39.34.273.029.351.214.637.1
Sand (%)35.31.089.823.647.618.151.3
BD (g/cm3)1.4990.8001.9201.3801.6600.21514.4
OM (%)1.2260.00014.2100.3301.7001.441117.5
Porosity0.43560.25580.66560.38220.48180.077317.8
MCWC (cm3/cm3)0.38070.13700.63640.32900.43150.083622.0
FC5f (cm3/cm3)0.37000.08180.63680.31660.41980.088323.9
FC10f (cm3/cm3)0.35900.07330.62960.30290.40990.088624.7
FC33f (cm3/cm3)0.33710.05480.60490.28520.39070.087726.0
FC50f (cm3/cm3)0.32880.04890.60470.27380.38140.087326.6
BD—dry bulk density; OM—organic matter; MCWC—maximum capillary water capacity; FC—field capacity; 5, 10, 33, 50—suction pressure (kPa, in abs. value); f—fitted; SD—standard deviation; CV—coefficient of variation (%).
Table 3. Descriptive statistics of data measured for RWC investigation (dataset two).
VariableMeanMinimumMaximumLower QuartileUpper QuartileSDCV
Clay (%)18.13.950.511.123.58.748.1
Silt (%)39.64.770.127.351.515.138.3
Sand (%)42.34.691.426.159.120.548.6
BD (g/cm3)1.4801.0851.8061.3691.5990.15910.7
OM (%)1.8510.2075.2931.1552.4310.94150.9
SWC (cm3/cm3)0.41890.23300.61400.38140.45900.056013.4
MCWC (cm3/cm3)0.37150.20630.52780.33390.40220.052614.2
RWC (cm3/cm3)0.35250.17920.51130.31450.38500.054515.5
FC33m (cm3/cm3)0.31190.12510.48050.27330.35470.061719.8
WP1500m (cm3/cm3)0.17490.04990.41040.12650.21910.066738.1
BD—dry bulk density, OM—organic matter, SWC—saturated water content, MCWC—maximum capillary water capacity, RWC—retention water capacity, FC33m—field capacity measured as water content at −33 kPa, WP1500m—permanent wilting point measured as water content at −1500 kPa, BD—dry bulk density, SD—standard deviation, CV—coefficient of variation (%).
Table 4. Descriptive statistics of data from HYPRESCZ database for testing of historical PTFs (dataset three).
VariableMeanMinimumMaximumLower QuartileUpper QuartileSDCV
Clay (%)15.80.042.88.519.810.465.5
Silt (%)29.41.570.616.840.215.753.4
Sand (%)54.73.698.037.371.223.042.0
FPSF (%)27.20.466.016.836.214.151.9
BD (g/cm3)1.5040.9911.8701.4001.6200.16110.7
OM (%)1.4270.06912.7230.4142.3001.37296.1
SWC (cm3/cm3)0.40190.25300.59140.36310.43400.057814.4
FC33f (cm3/cm3)0.26610.05670.45370.21640.32427.9429.8
WP1500f (cm3/cm3)0.15130.01570.34720.09960.19566.8245.1
FPSF—fine particle size fraction, BD—bulk density, OM—organic matter, SWC—saturated water content, FC33f—field capacity fitted as water content at −33 kPa, WP1500f—permanent wilting point fitted as water content at −1500 kPa, SD—standard deviation, CV—coefficient of variation (%).
Table 5. Uncertainty analysis of observed and predicted data.
Correlated Soil Moisture ConstantsNRMSEMAERR2
MCWCFC5f5340.0270.0200.9610.923
FC10f5340.0330.0260.9580.917
FC33f5340.0530.0450.9370.878
FC50f5340.0620.0520.9220.850
FC33mRWC2070.0450.0410.9530.908
MCWC2070.0650.0600.9050.818
FC33fFC by Brežný4710.0650.0480.6690.447
FC by Váša4710.0670.0500.6730.453
MCWC—maximum capillary water capacity; RWC—retention water capacity; FC—field capacity; 5, 10, 33, 50—suction pressure (kPa, in abs. value); f—fitted; m—measured; N—number of pairs compared; RMSE—root mean squared error; MAE—mean absolute error; R—correlation coefficient; R2—coefficient of determination.
Disclaimer/Publisher’s Note: The statements, opinions and data contained in all publications are solely those of the individual author(s) and contributor(s) and not of MDPI and/or the editor(s). MDPI and/or the editor(s) disclaim responsibility for any injury to people or property resulting from any ideas, methods, instructions or products referred to in the content.