Article

The Integrated Use of Heavy-Metal Pollution Indices and the Assessment of Metallic Health Risks in the Phreatic Groundwater Aquifer—The Case of the Oued Souf Valley in Algeria

1
Department of Landscape Protection and Environmental Geography, University of Debrecen, 4032 Debrecen, Hungary
2
Laboratory of Geology and Environment, Université Constantine 1, Constantine 25020, Algeria
3
Department of Industrial Chemistry, Faculty of Science and Technology, University of Biskra, Biskra 07000, Algeria
4
Department of Inorganic and Analytical Chemistry, Institute of Chemistry, Faculty of Science and Technology, University of Debrecen, 4032 Debrecen, Hungary
5
Department of Data Science and Visualization, Faculty of Informatics, University of Debrecen, 4028 Debrecen, Hungary
6
Research Laboratory of Civil and Hydraulic Engineering, Sustainable Development and Environment, Université de Biskra, Biskra 07000, Algeria
*
Author to whom correspondence should be addressed.
Hydrology 2023, 10(10), 201; https://doi.org/10.3390/hydrology10100201
Submission received: 28 August 2023 / Revised: 23 September 2023 / Accepted: 13 October 2023 / Published: 15 October 2023
(This article belongs to the Section Surface Waters and Groundwaters)

Abstract

:
In this research, contamination levels and the spatial pattern identification, as well as human and environmental health risk assessments of the heavy metals in the phreatic groundwater aquifer of the Oued Souf Valley were investigated for the first time. The applied methodology comprised a combination of heavy-metal pollution indices, inverse distance weighting, and human health risk assessment through water ingestion on samples collected from (14) monitoring wells. The contamination trend in the phreatic aquifer showed Al > B > Sr > Mn > Fe > Pb > Ni > Cr > Ba > Cu > Zn. Similarly, the enrichment trend was Al > B > Sr > Mn > Ni > Pb > Cr > Ba > Cu > Zn. Ecologically, most of the analyzed metals reflected a low potential ecological risk, except for two wells, S13 and S14, which represented a considerable and high ecological risk in terms of Pb. According to the applied grouping method, the samples in the first group indicated a lower risk of contamination in terms of heavy metals due to their lower concentration compared to the second group. This makes the area containing the second group’s samples more vulnerable in terms of heavy metals, which could affect urban, preurban, and even agricultural areas. All of the samples (100%) indicated the possibility of potential health risks in the case of children. While six samples showed that the non-cancer toxicity risk is considered low, the rest of the samples had high Hazard Index (HI) values, indicating the possibility of health risks occurring in the case of adults. The constructed vertical drainage system is acting as a supporter and accelerator of the pollution levels in the shallow groundwater aquifer. This is due to its contribution to the penetration of different pollutants into this aquifer system, depending on the residence time of the water, which appears to be long within the drainage system.

1. Introduction

Groundwater serves as the primary natural water source for drinking and agricultural needs [1,2]. Presently, one of the crucial environmental concerns is the pollution of groundwater [3].
In regions with dense population and intensive human land utilization, groundwater becomes particularly susceptible to contamination [4,5]. Almost any activity that involves the release of chemicals or waste into the environment, whether intentional or accidental, poses a risk of polluting the groundwater. Once groundwater is contaminated, the process of remediation becomes challenging and costly [6].
Groundwater systems containing high concentrations of heavy metals pose a significant risk to human health, leading to various adverse effects [7]. Exposure to these harmful substances can lead to severe health complications, including respiratory issues and various forms of cancer [8]. Additionally, heavy metals’ non-metabolization and accumulation in soft tissues increase their toxicity, causing damage to organs, the nervous system, and, in extreme cases, even death [9]. The adverse impacts of heavy metals extend beyond humans; animals also undergo morphological, histological, and biochemical alterations when exposed to environmental pollutants like heavy metals, even at low concentrations, over prolonged periods [10].
Given these potential dangers, it is crucial to assess groundwater quality and contamination levels of heavy metals before making any decisions. To achieve this, various quantitative heavy-metal pollution indices have been utilized throughout the last few decades, such as the Contamination degree [11,12], the Geoaccumulation index (Igeo) [13,14], Enrichment factor (EF) [15,16], and Potential ecological risk index (PER) [17,18]. Furthermore, assessing human health risks associated with heavy-metal contamination is essential. Human health risk assessment techniques help predict the probability and extent of hazards posed by certain activities to both human and ecosystem health over time [19]. The primary routes of exposure to heavy metals for individuals are through direct ingestion, inhalation, and dermal absorption. However, the most common methods of exposure through water are cutaneous absorption and ingestion [20,21].
By integrating environmental and human health assessments, it is possible to understand the potential risks and make informed decisions to safeguard both our ecosystems and the well-being of human populations. The determination of the interrelationship in the groundwater dataset and the extraction of important factors influencing groundwater quality can be conducted, in order to infer the hypothetical sources of heavy metals using hierarchical cluster analysis, which can be used to identify and classify samples with similar heavy-metal contents [22,23].
On the other hand, estimation of spatial patterns of heavy-metal contaminations in groundwater is an important step in the health risk assessment. Several mapping approaches are applied to estimate heavy-metal values at unsampled locations, based on the collected data from sampling station wells [24]. As one of the deterministic techniques, inverse distance weighting (IDW) is one of the methods used for the interpolation of observed data at known locations for the estimation of unknown values. This method can be used for the spatial mapping of different hydrochemical parameters [25,26]. Furthermore, it is widely used for the estimation of spatial patterns of heavy-metal contamination in groundwater, which is important in terms of health risk assessment [27].
The phreatic aquifer of the Oued Souf Valley in Algeria has become a significant source of mineral and organic contamination due to the rising of groundwater levels observed since the 1980s [28]. Despite all the measures taken by the Oued Souf authorities, including the implementation of a plan consisting of several projects, one of which was the construction of a vertical drainage system aimed at halting the rise of the phreatic groundwater level and reducing pollution from it, the plan has ultimately failed for several reasons. As a result, negative and aggressive impacts have emerged in both the environmental and public spheres in the Oued Souf Valley [29].
In an effort to evaluate the situation, very few studies have been conducted to assess the physicochemical quality of the phreatic aquifer for drinking and irrigation use, and the impact of direct discharge of wastewater and drainage waters into the phreatic aquifer of Oued Souf, as well as its influence on the degradation of the phreatic groundwater quality using hydrogeochemical, geographic information system (GIS), and isotopic approaches [30,31,32,33,34]. No study has been conducted to assess heavy-metal contamination in the phreatic groundwater aquifer under its illegal utilization for irrigation and industry. Furthermore, as highlighted by [35], there is a possible communication between the shallow and deep aquifers represented by perforations on the casings in some wells that belong to the deep aquifers in the Oued Souf Valley, which are currently used for drinking and irrigation. All these factors may generate harmful consequences for humans and the environment by contaminating the deep aquifers of the region with heavy metals. For these reasons, it is important to assess the level of heavy metals in the phreatic aquifer of Oued Souf Valley since their level in this aquifer may reflect the level of metals in the deep aquifers.
The main aim of the present study is to identify the spatial pattern of heavy metals and the extent of their contamination in the phreatic aquifer of the Oued Souf Valley. A further objective of this research is to assess the human health and ecological risks posed by the existing heavy metals in the phreatic aquifer. The assessment methodology used in this work mainly consists of a combination of heavy-metal pollution indices, inverse distance weight, and human health risk assessment.
The conducted work has the potential to make a significant contribution to the scientific field concerning the problems of groundwater reservoirs in the Oued Souf Valley. It will inform policy decisions, advance knowledge, and promote sustainable environmental practices. Additionally, it can raise public awareness and inspire further research efforts in this critical area.

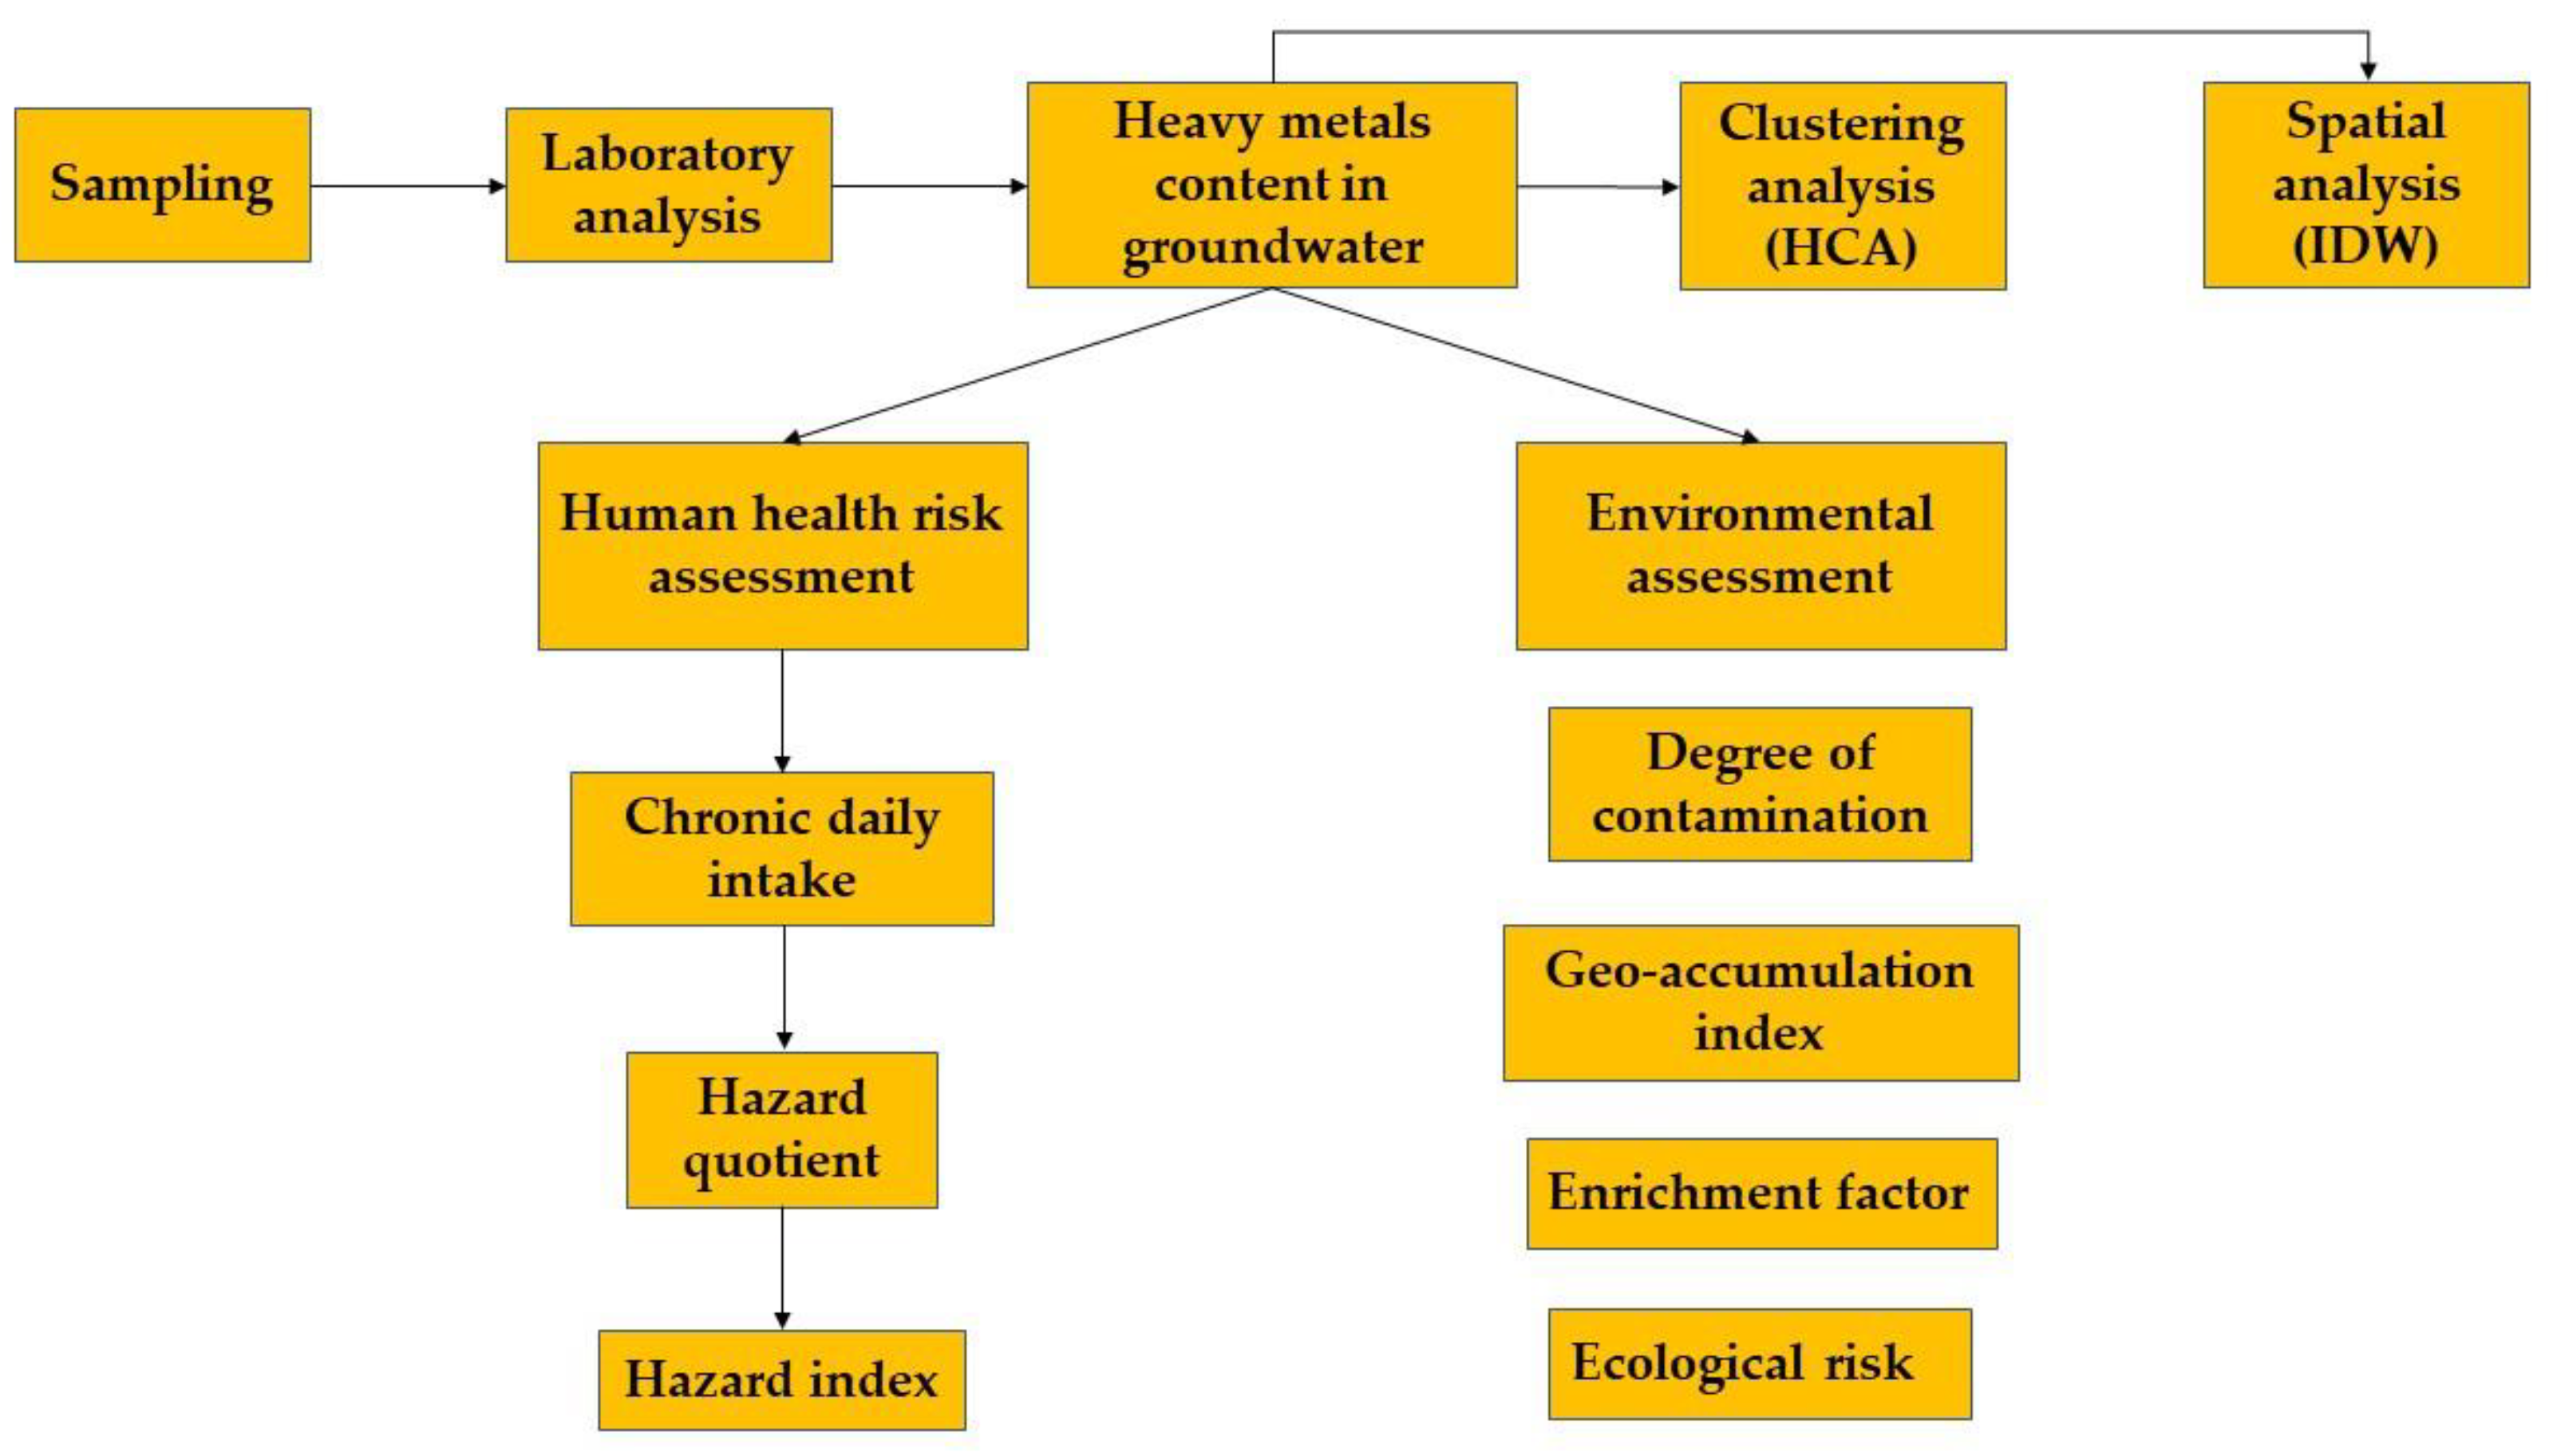
2. Materials and Methods

2.1. Background of the Study Area

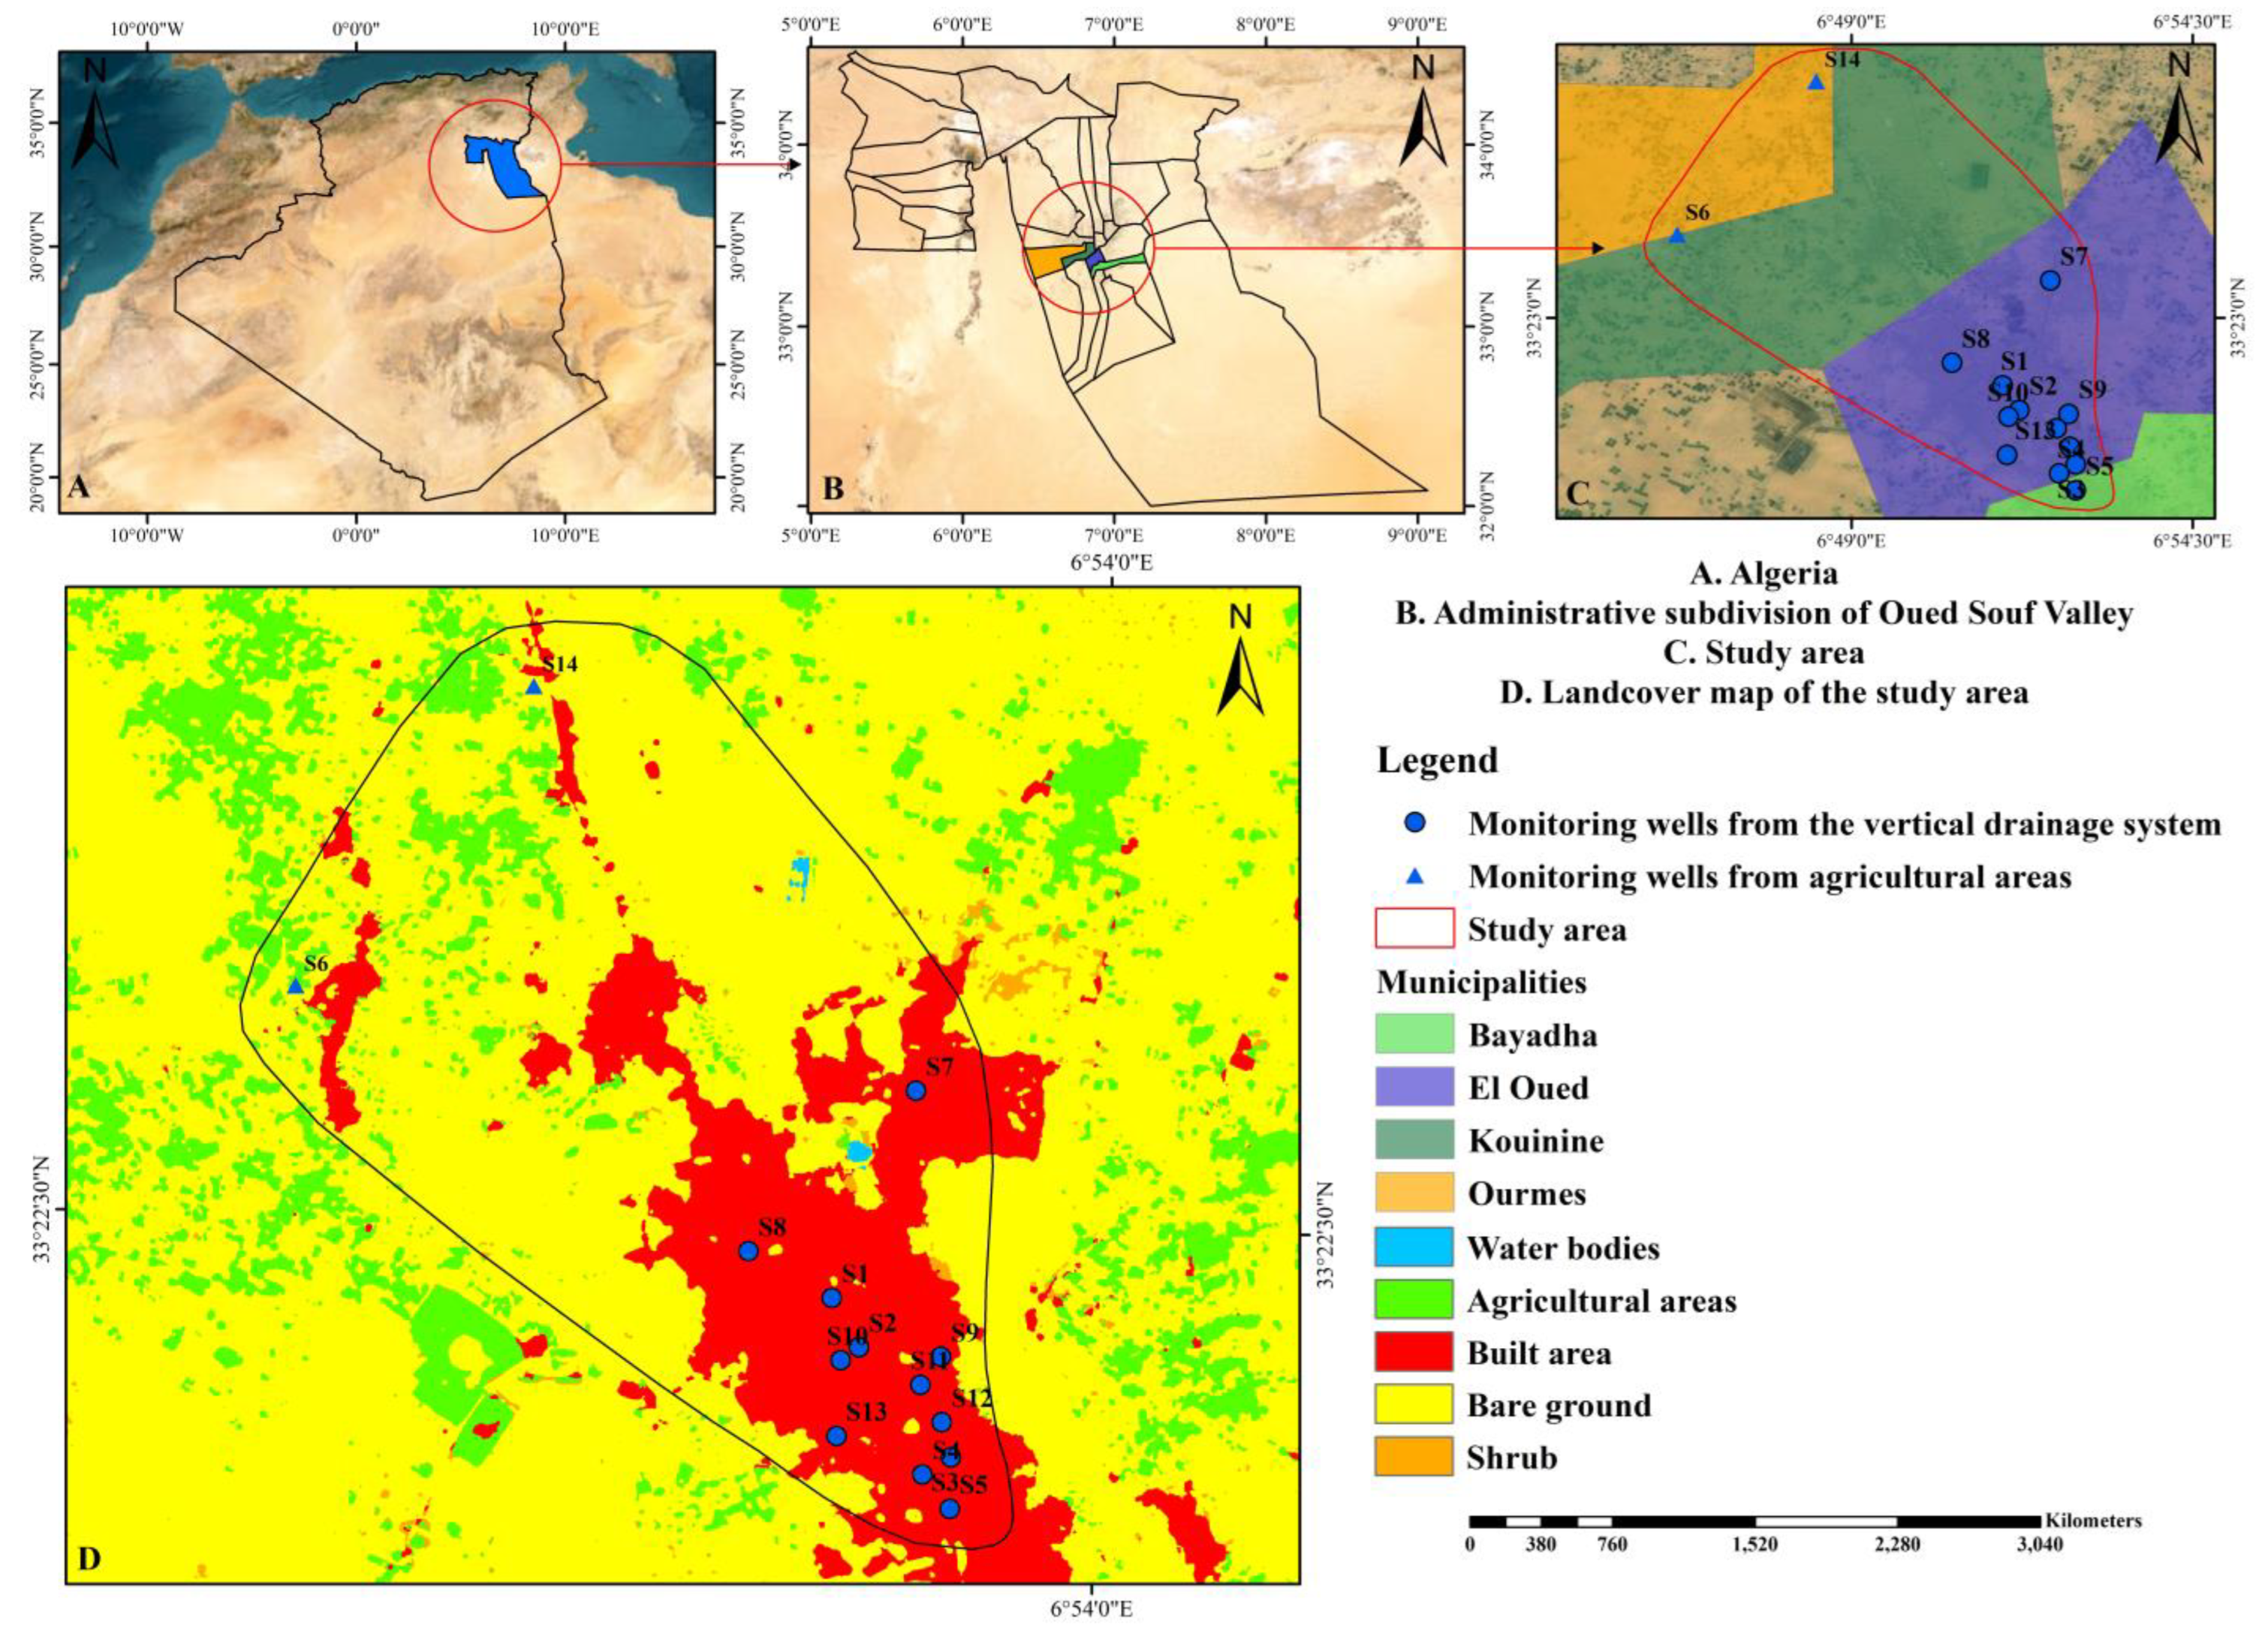
2.1.1. Geographical Location of the Study Area

The valley of Oued Souf, also known as the city of one thousand domes, is a significant unit of water resources in Algeria. It is situated in the southeastern part of the country within a huge synclinal basin. The Oued Souf is characterized by its low altitude, earning it the name ‘the low Sahara region’ (located between 32°30′00″ and 34°12’00″ North, and 6°15′00″ and 7°20′00″ East). As of today, the Oued Souf Valley covers 11,738 km2, which is divided into 18 municipalities with a population of half a million inhabitants, as estimated in 2015 [36].
The Oued Souf region is surrounded by various areas: it lies to the northeast of Tebessa, east of Tunisia, northwest of Biskra, north of Khenchla, and to the west and southwest, it shares boundaries with Djelfa and Ouargla, respectively. According to climatic research conducted by [37], which analyzed 42 years of data (1978–2020) collected from the Geumar meteorological station in Oued Souf, the study area is characterized by an extended dry period throughout the hydrological year and a bioclimatic stage of Saharan vegetation. The irregularity and scarcity of precipitation, coupled with high temperatures and extremely high evapotranspiration, have had a significant impact on surface run-off and infiltration, limiting the region’s ability to contribute to the natural recharging of underground reservoirs. This puts a significant strain on the socioeconomic situation and may also have an impact on drought and desertification phenomena.
Oued Souf, along with several other regions in the northern Algerian Sahara, has experienced the rising of the phreatic aquifer. This rise has exerted significant pressure on the environment and its resources, hastening changes that have profoundly transformed the landscape. These changes have included the deterioration of the Ghout system and the living conditions of the residents of Oued Souf [38]. Precisely, this is due to the nature of the topography, urbanization, and population growth, as well as leakage from the water supply system, the extensive extraction of water from deep reservoirs and its discharge without appropriate treatment, and the absence of drainage and sewage systems. Hence, the phreatic aquifer in Oued Souf has become entirely contaminated, becoming filled with dark and noxious water, intermingled with a wide array of waste materials [39]. Furthermore, the pollution has spread with its different sources such as bacterial contamination, nitrate (domestic, agricultural, and even industrial) pollution, and extremely high mineralization. Meanwhile, in some cases, the Ghout system has turned into a wild waste dump, promoting stagnant water that further proliferates mosquitoes and increases the population’s susceptibility to parasitic and waterborne diseases, skin problems, leishmaniasis, malaria, and typhoid fever [40].
In response to this crisis, local authorities have launched a large-scale project, primarily centered around the vertical drainage system, aimed at removing the contaminated phreatic groundwater. Nevertheless, this project is encountering numerous obstacles. Figure 1D illustrates the prevalence of agricultural activities in the region, mainly focused on the cultivation of palm trees, potatoes, and various vegetables. These crops rely on water sources from the Complex Terminal and Continental Intercalary aquifers, with the pivot irrigation method being the most commonly employed technique [41].
The research covers four municipalities (Bayadha, Kouinine, Ourmes, and El Oued) within the study area, as shown in Figure 1B,C. After treatment, the water from the phreatic aquifer will be divided into two parts. The major portion will be discharged into the environment (Chott Halloufa), while a smaller part will be reused for irrigating green spaces in the Oued Souf municipality [42].

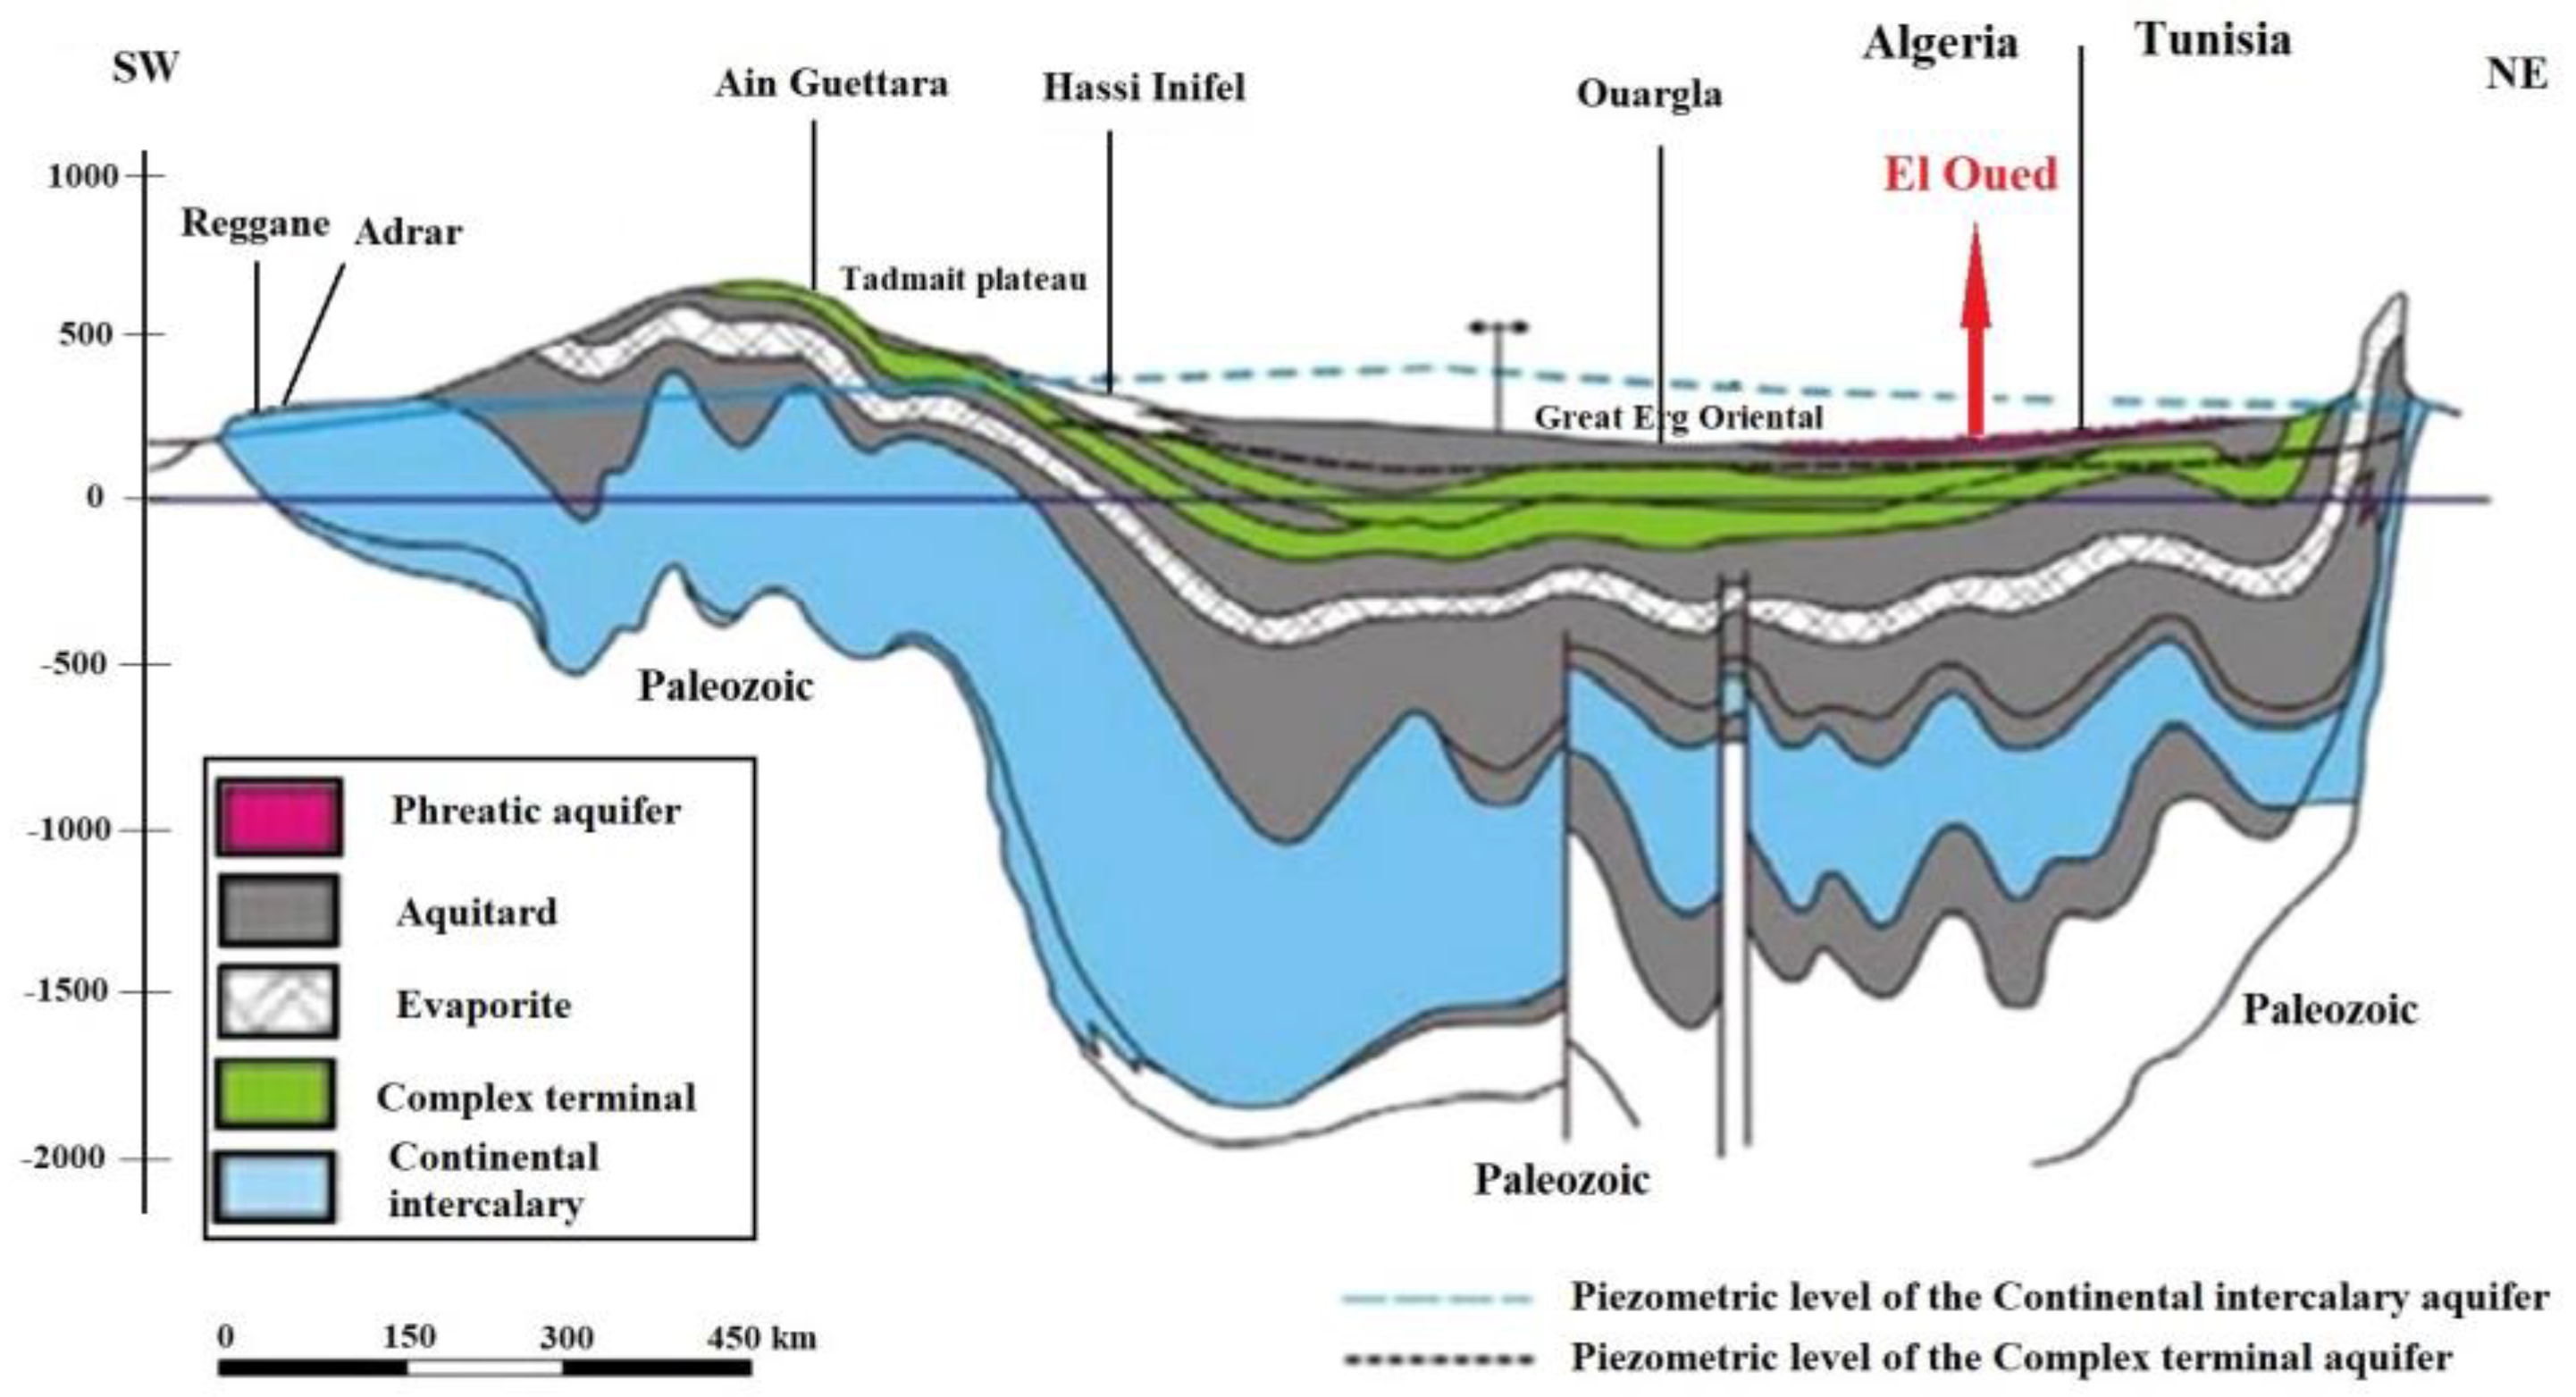
2.1.2. Geology and Hydrogeology

The Oued Souf Valley is a portion of the sedimentary basin of the Northern Sahara, covering an area of 780,000 km2. However, underneath this basin lies a structural basin in the form of an uneven syncline, which represents a significant topographic depression [43]. Furthermore, in the middle of the depression, significant subvertical tectonic faults define the sedimentary sequence. Except for the edge zone in the northeastern part of the basin, bank dips are typically shallow [44]. At the base of this sequence, there are Paleozoic marine formations, incongruously overlaid by secondary and tertiary continental formations that are several thousand meters thick. Finally, a Quaternary formation is present, consisting of dune sands that are several hundreds of meters thick [45]. Figure 2 shows the geologic map with the location of the cross section in the study area.
From the Hydrogeological point of view, there are three main aquifers in the research area’s aquifer system which vary in depth and physiochemical characteristics [46].
The Continental Intercalary aquifer, ranging in depth from 1800 to 2200 m and with a thickness of 200 to 400 m, is the deepest aquifer in the region. Comprising sandstones and clayey sandstones, it forms a part of continental deposits dating back from the Middle Jurassic to the Lower Cretaceous period. Water from this aquifer is harnessed for drinking purposes and is estimated to be at least 20,000 to 30,000 years old [47].
The next deep aquifer is referred to as the Complex Terminal. It contains fossilized water that dates back approximately 20,000 to 30,000 years. The Complex Terminal aquifer is found within the continental Cretaceous–Miocene formations and is situated at a depth ranging from 400 to 600 m, with a thickness of roughly 400 m [48].
The Phreatic aquifer is the shallowest one, with a depth fluctuating from 1 to 40 m, with a thickness of 100 m [49]. Fine sands, sandy clays, and gypsum lenses are locally interspersed in the composition of this aquifer. At the same time, this aquifer has an impermeable clay base. The aquifer’s permeability is classified as very fast, at 10−4 m/s, with a horizontal transmissivity of 10−2 m2/s. The retention coefficient in this aquifer is 0.2 [50,51,52]. Figure 3 depicts the geological and hydrogeological constitution of the North-Western Sahara Aquifer System reservoir (NWSAS).

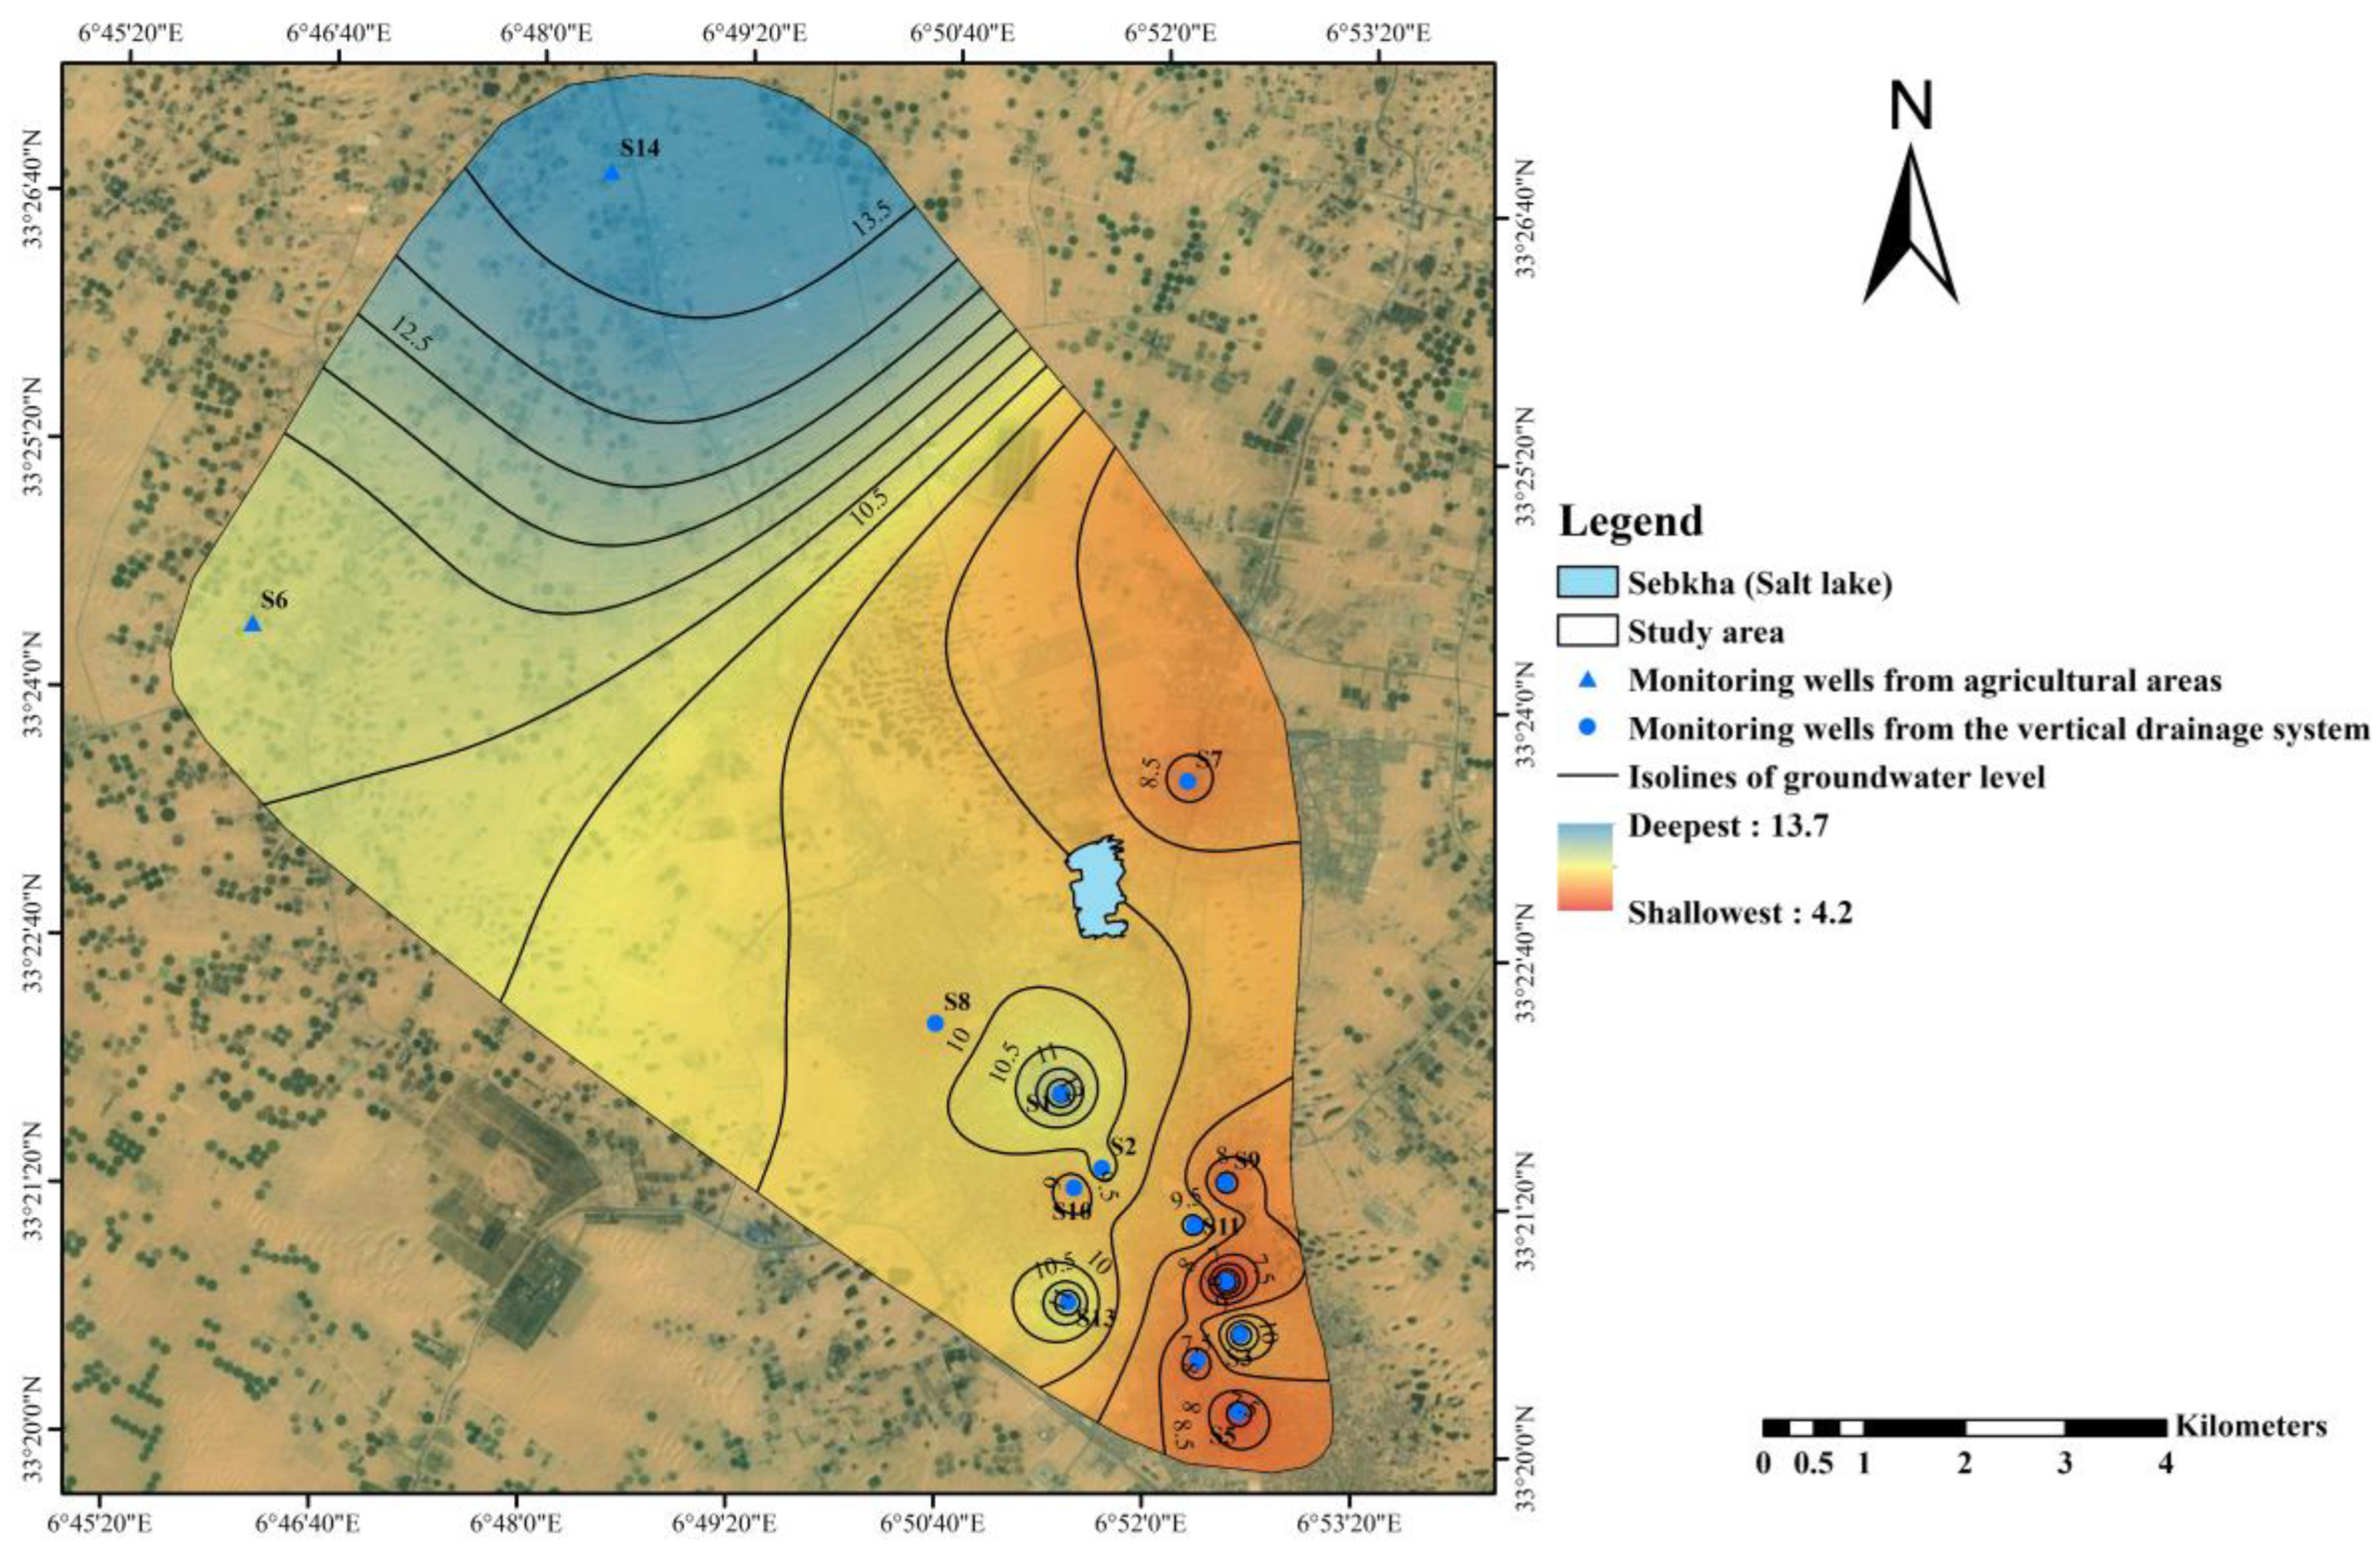
2.1.3. Phreatic Groundwater Static Level Fluctuation

After merging the phreatic groundwater levels of twelve monitoring wells from the vertical drainage system with two wells from agricultural areas, which were measured using level probes and piezometers in 2021, it was revealed that the water table is gradually declining from the south (El Oued municipality) to the north (Ouermes municipality). Among the wells, S12 had the shallowest level at 4.2 m below the groundwater level (mbgl), while S14 had the deepest level at 13.7 mbgl, as shown in Figure 4. The shallow depths observed in El Oued still provide some evidence of the possible rise of the phreatic groundwater level again, as scientifically discussed by [54] using a comprehensive six-year dataset of water table fluctuations from the vertical drainage system (data from 2008, 2009, 2014, 2016, 2018, and 2021).

2.2. Sampling and Measurements

In November 2022, a total of fourteen (14) groundwater samples were gathered from the phreatic aquifer. Among these, twelve samples were collected from the vertical drainage system, primarily located in the El Oued municipality (11 samples), and one sample was taken from Bayadha municipality. Additionally, two samples were collected from agricultural areas, mainly from Kouinine and Ourmes, as shown in Figure 1. On-site measurements of physical parameters including temperature, electrical conductivity, and pH were conducted using a Multi-350 i multi-parameters device. Furthermore, all the samples were acidified using 37% hydrochloric acid and transported to Hungary for quantitative analysis of heavy metals in the Laboratory of the Inorganic and Analytical Chemistry Department in Debrecen. The quantitative analysis of the elemental content of the samples was carried out by microwave plasma atomic emission spectrometry (MP-AES 4200, Agilent Technologies, Santa Clara, CA, USA). The plasma gas was continuously supplied during measurement by a nitrogen generator (Agilent Technologies 4107). The MP-AES instrument operates with a vertical torch alignment together with an axial observation position. Standards, as well as sample solutions, were introduced by autosampler (SPS, Agilent Technologies) with 30 sec of rinsing between each sample by 0.1 M HNO3 prepared in ultrapure water. The MP-AES operating conditions and measurement parameters are indicated in Table 1 and Table 2. Standard solutions of the macro elements (Al, Ca, Fe, K, Mg, Mn, and Na) were prepared from the mono-element spectroscopic standard of 1000 mg L−1 (Scharlau), while solutions of the micro elements (B, Ba, Bi, Cd, Co, Cu, Cr, Li, Ni, Pb, Sr, and Zn) were prepared from the multi-element spectroscopic standard solution of 1000 mg L−1 (ICP IV, Merck). In both cases, a 5-point calibration process was used, for which standard solutions were diluted with 0.1 M HNO3 prepared in ultrapure water.
Furthermore, the limit of detection (LoD) of the MP-AES method was determined using the method described in [55] since it was tested and found to be suitable.

2.3. Assessment of Environmental Hazards to Groundwater Vulnerability to Heavy Metals

The foundation of the environmental risk assessment was the examination of pollution levels, health threats, and ecological risks related to the possible presence of heavy metals in the phreatic groundwater aquifer, whether originating naturally or as a consequence of human activities. Various indices were applied to ascertain both the degree of contamination and potential origins of these heavy metals.

2.3.1. The Degree of Contamination (Cdeg)

The degree of contamination (Cdeg) is a combined reflection of numerous water quality parameters thought to be harmful to domestic water utilization [56]. It was calculated as follows:
C deg = i = 1 n C Fi
where
  C Fi = C Ai C Ni 1
Furthermore, CFi, CAi and CNi are the contamination factors, the analytical value and the maximum permissible concentration of the ith component, respectively, and N is the ‘normative value’. Based on [56], the contamination degree was classified as low when Cfi < 1, medium when 1< Cfi < 3 and high when Cfi > 3. On the other hand, the Cdeg results were classified with [57]’s classification, with low (Cdeg < 8), moderate (8 ≤ Cdeg < 16), considerable (16 ≤ Cdeg < 32), and high (Cdeg ≥ 32).

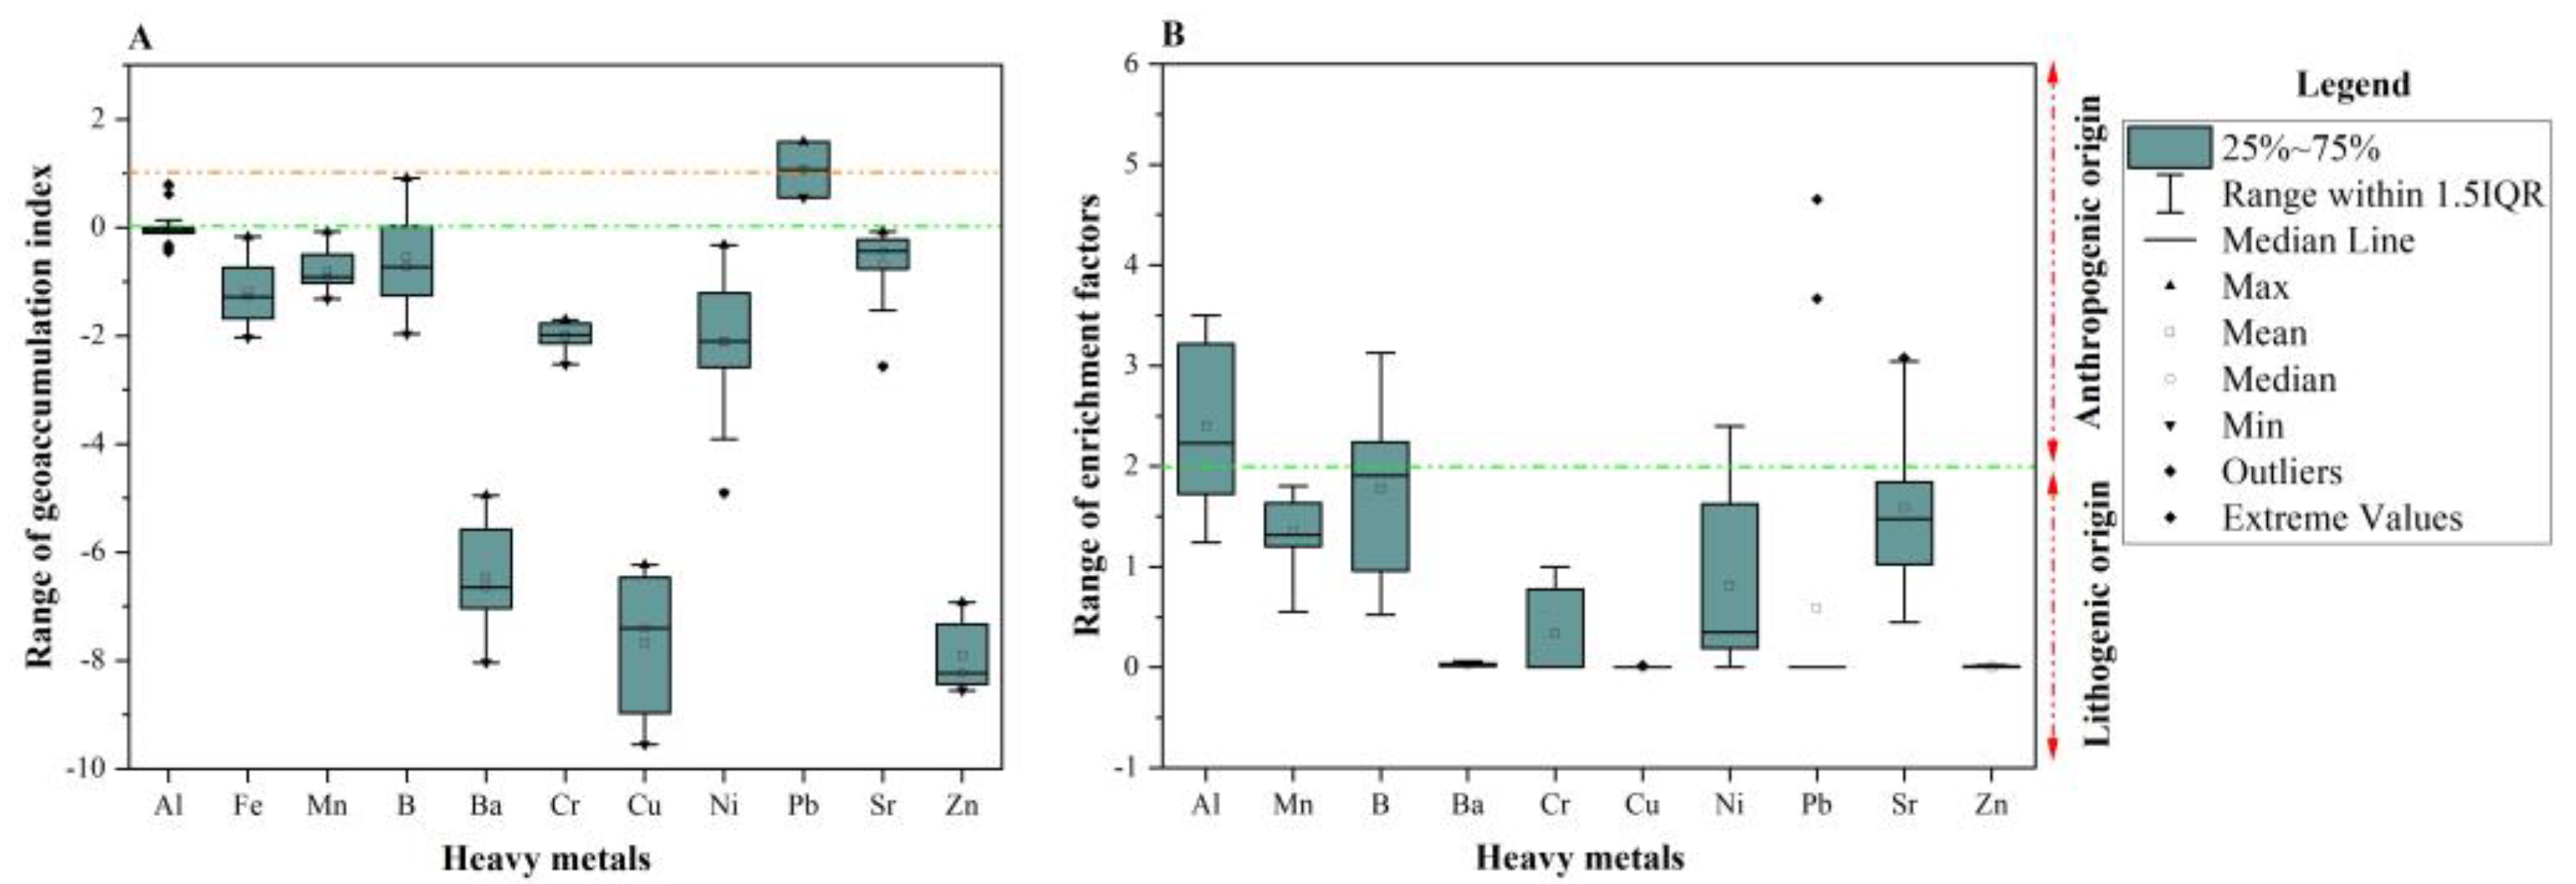
2.3.2. Geo-Accumulation Index (Igeo)

As was introduced by [58], the Geo-accumulation index (Igeo) is used for the quantification of the degree of the pollution load that may accumulate due to anthropogenic or geogenic origins. The importance of this index is that it can provide information through a quantitative assessment on the level of the dissolved metals in porous media (soil/sediments/water) [59]. The Igeo model is expressed by the following equation:
I geo = Log 2 C HMS 1.5 × GBV
CHMS refers to the concentration of the selected metals in the groundwater sample. The geochemical background is symbolized by GBV (the WHO was used in this research) [60]. Furthermore, 1.5 as a constant permits the examination of the natural fluctuation in the concentration of a particular substance existing in the environment. The Igeo indices were classified as uncontaminated (Igeo ≤ 0), uncontaminated to moderately contaminated (0 < Igeo < 1), moderately contaminated (from 1 to 2), moderately to strongly contaminated (from 2 to 3), strongly contaminated (3 to 4), strongly to extremely contaminated (4 to 5) and extremely contaminated when Igeo > 6 [58,61].

2.3.3. Enrichment Factor (EF)

In order to determine the sources of dissolved metals in water, soil, and sediment as well as the extent to which anthropogenic or geogenic sources of heavy metals contribute to the contamination of water systems, the enrichment factor is utilized. In this inquiry, Fe was used as the reference metal. To determine the EF, the following equation was used:
EF = Ci Sample Fe sample Ci reference Fe   reference
where (Cisample/Fesample) and (Cireference/Fereference) represent the metal-to-Fe ratio in the groundwater sample and the natural background, respectively [62].
According to [63] classification, EF can be divided into six classes: minor enrichment when the EF ranges between 1 and 2, moderate enrichment when EF is between 3 and 5, when the EF is confined between 5 and 10, severe enrichment between 10 and 25, very severe enrichment between 25 and 50, and extremely severe enrichment when the EF is more than 50. Based on the EF values, it is possible to identify the origin of the contamination due to the existing heavy metals in the aquatic system. Accordingly, EF values higher than 1.5 suggest anthropogenic sources [64], whereas those between 0.5 and 1.5 imply lithogenic sources [65].

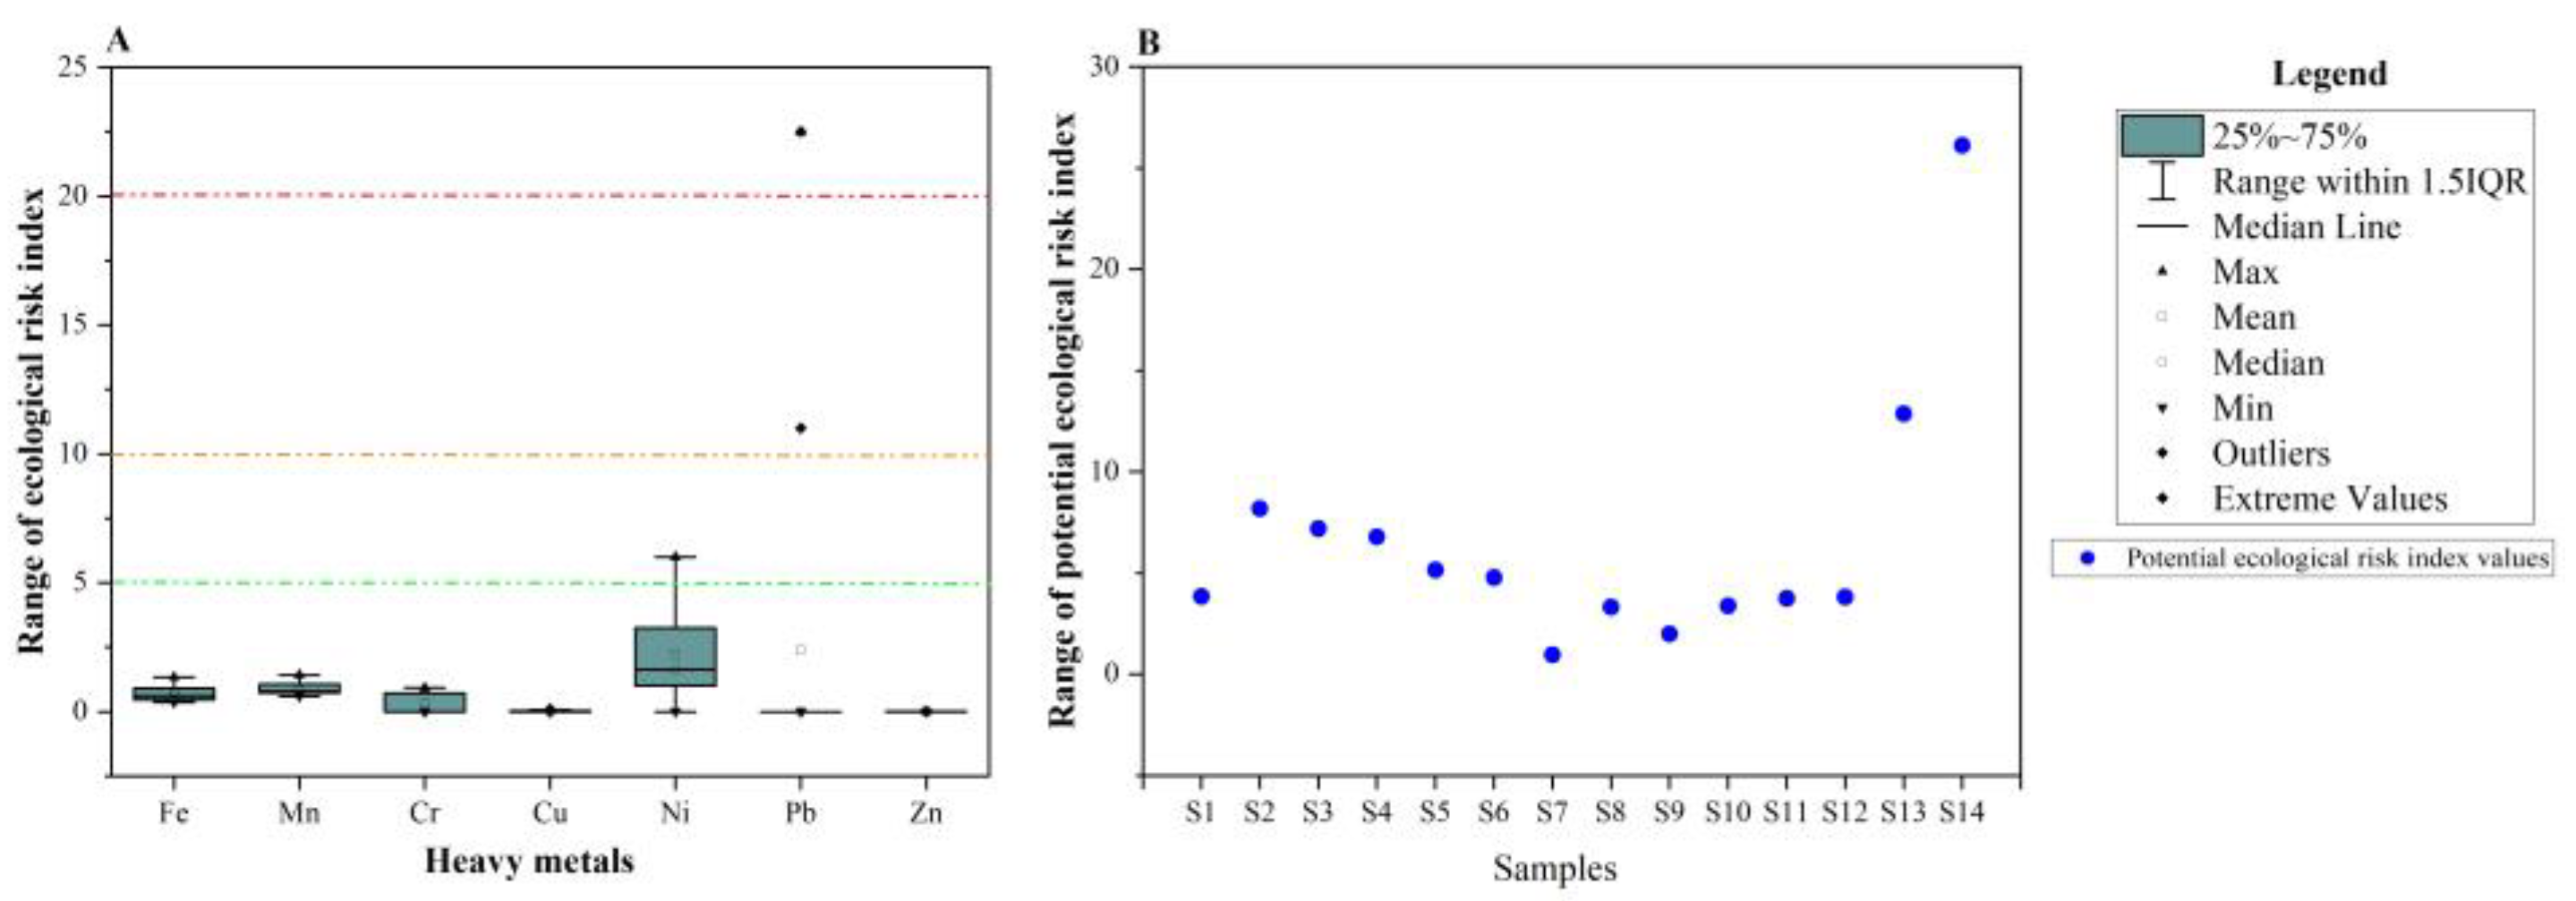
2.4. Ecological Risk (ER) and Potential Ecological Risk (PERI) Indices

The Ecological Risk Assessment (ER) and the Potential Ecological Risk Index (PRI) are two additional tools that can be employed to evaluate the degree of contamination in the samples. The Ecological Risk Index was developed by combining the Contamination Factor (CF) and the Toxic Reaction Factor (TR):
ER = TR i × CF i
TRi is the metal’s toxic reaction factor, while CFi is its contamination factor. The standardized TRi values suggested by [57] for Cu, Pb, Ni, Cr, Zn, Fe and Mn are 5, 5, 5, 2, 1, 1 and 1, respectively, while no toxic response value has been found for Al, B, Ba, Bi, and Sr from the literature.
The potential ecological risk index (PERI), on the other hand, was calculated using the total ERs of all heavy metals that are dissolved in the groundwater samples [66]:
PERI = i = 1 n ER i
According to [67], the categorization of ER and PERI is as follows: ER < 5 indicates low risk, 5 ≤ ER < 10 suggests moderate risk, 10 ≤ ER < 20 signifies a considerable risk, 20 ≤ ER < 40 indicates a high risk and ER> 40 a very high risk. PERI was categorized as low risk when PERI < 30, moderate when 30 ≤ PERI < 60, considerable when 60 ≤ PERI < 120 and a high risk when PERI is more or equal to 120.

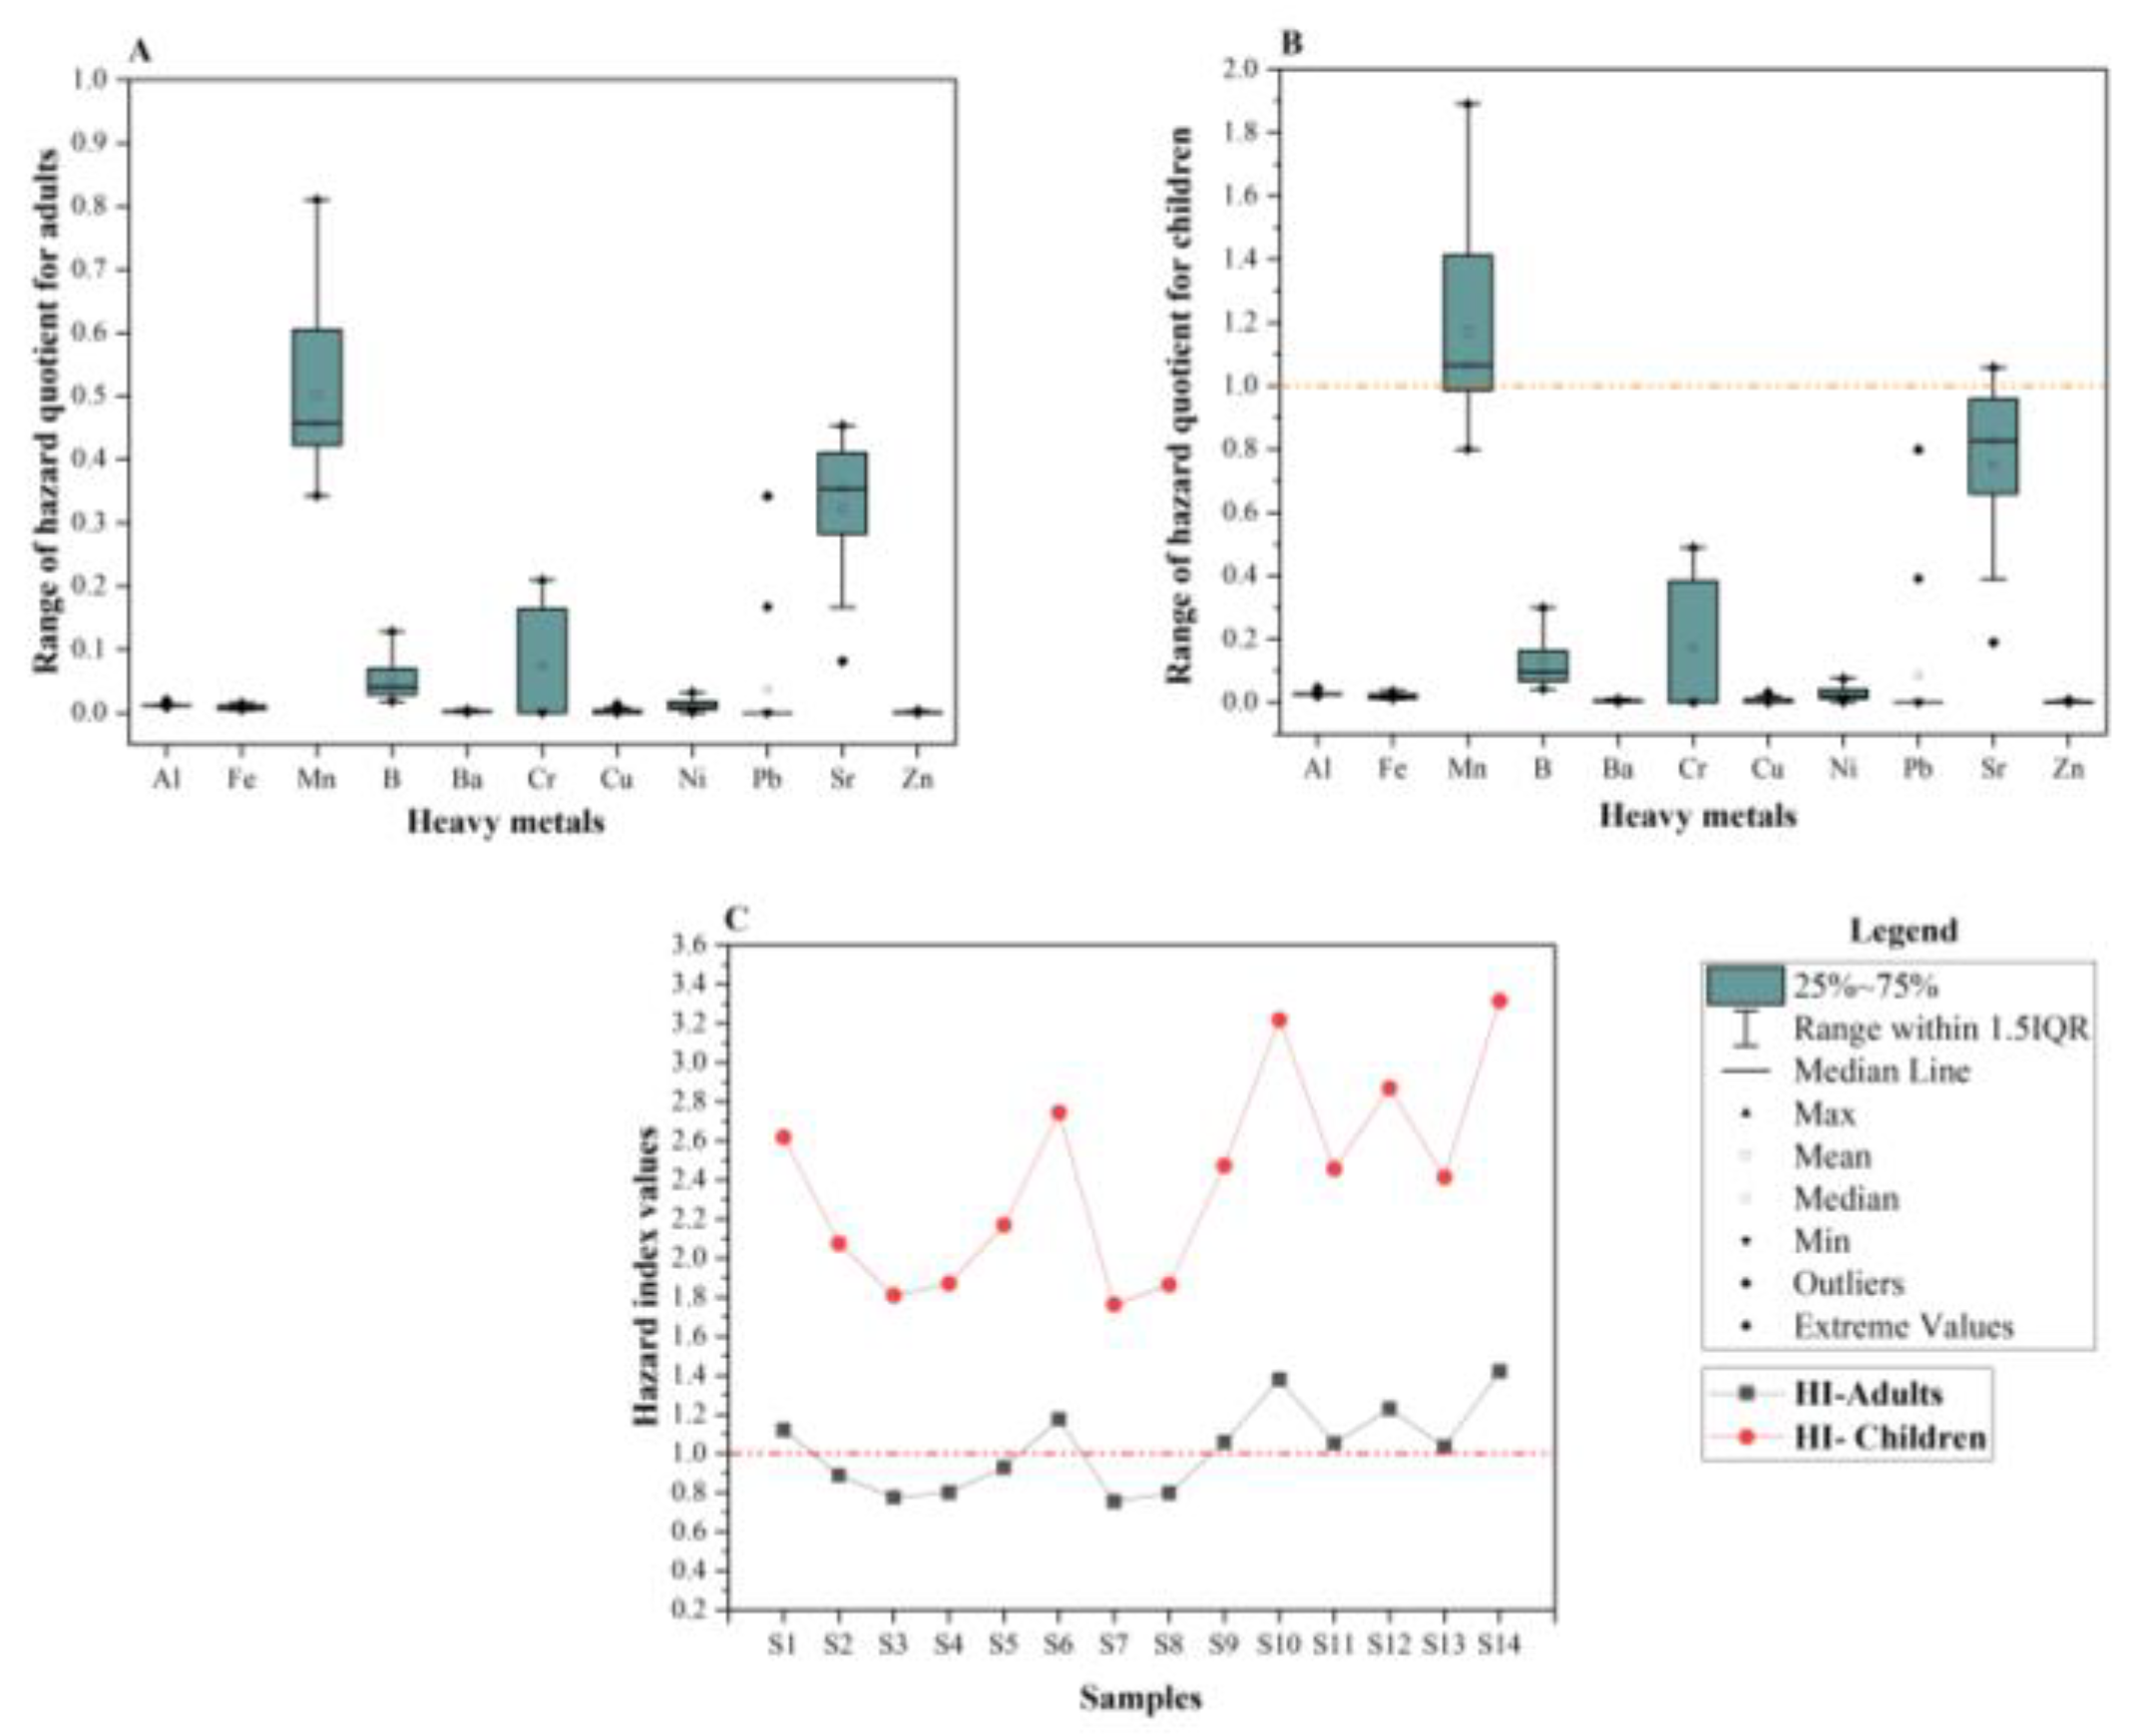
Human Health Risk Assessment from the Groundwater

According to the United States Environmental Protection Agency (USEPA), human health risk assessment involves the identification of potential adverse health effects and human exposure to chemicals in a polluted environment. There are three potential exposure routes: direct consumption of drinking water, inhalation of air, and absorption through the skin. These simulations were utilized to calculate the dosage [68]:
CDI = CW × IR × EF × ED BW × WT
The chronic daily intake to which a person may be exposed is known as the CDI in mg/kg/day. The concentration of the selected metals in (mg/L) in the groundwater samples is referred to as (CW). Furthermore, IR signifies the ingestion rate and is equivalent to 2 (L/day) for adults and 1 (L/day) for children. For adults, the exposure frequency (EF) is 350 days per year, which applies to both adults and children. ED refers to “Exposure Duration” and is equal to 30 years for adults and 6 years for children, respectively. Bodyweight (BW) is given in kilograms (kg), and in these two cases, it is 70 and 15, respectively. AT stands for “averaging time”, which for adults is 10950 (days) and for children is 2190 (days) [69,70].
The hazard quotient (HQ) was estimated for non-carcinogenic risk as follows [71]:
HQ = CDI RFD
The oral toxicity reference dose value (RFD), as a reference dose, represents the daily dosage that allows an individual to endure this level of exposure for an extended length of time without suffering any adverse effects. The RFD values in (μg/kg/day) for Cr, Cu, Ni, Pb, Sr, and Zn were 3, 40, 20, 3.6, 600, and 300, respectively [72]. For B, the considered RFD value was 300 (μg/kg/day) [73]. At the same time, the considered RFD value for Fe was 700 (μg/kg/day) [74]. On the other hand, for Mn and Ba, 24 and 200 (μg/kg/day) were considered as RFD values [75]. Subsequently, 700 (μg/kg/day) was the RDF value that was taking into consideration for Al (μg/kg/day) [76]. The interactions are taken into account since there are several toxicants occurring. It is assumed that the toxic risks connected to potentially hazardous substances discovered in the same media are cumulative. All of the HQs are added collectively to form the hazard index [77]:
HI = i = 1 n HQ i
The non-cancer toxicity risk is regarded as low if the Total HQ and HI value is less than 1. When it varies over 1, there is a chance that a potential health issue might arise.

2.5. Spatial Analysis

For the spatial visualization of the selected parameters, the inverse distance-weighted (IDW) technique was used for neighboring sites with similar values, and the linear interpolator weights the interpolated data at the unsampling point [26,78]. Additionally, to streamline the process, various simplifications and assumptions were applied. These included assuming a smooth neighborhood type, setting the smoothing factor to 1, assuming an angle of 0°, and considering the minor semi-axes as equal to the major semi-axes. The choice of the most suitable interpolation model was determined by assessing the minimum values of the root mean square prediction error (RMSPE) and the mean prediction error (MPE).

2.6. Hierarchical Clustering Analysis (HCA)

As a part of multivariate statistical methods, hierarchical clustering analysis (HCA) was used in this research for classifying samples based on their resemblance. It is a widely applicable method for hydrochemical invigilation to categorize the studied cases into separate groups based on their similarities in the hydrogeochemical sense. Additionally, the original clusters produced after grouping parameters using Euclidean distances were connected using Ward’s linkage technique [79,80].
Figure 5 illustrates the methodology utilized for identifying heavy metals in the phreatic aquifer of the Oued Souf Valley.

3. Results and Discussion

3.1. Physico-Chemical Data

Table 3 presents the results of the statistical analysis applied to temperature, pH, and electrical conductivity, as well as the concentrations of the fifteen analyzed heavy metals. These metals are categorized into potentially toxic elements (Pb, Cd, Al, Ba, and Li), elements of probable physiological importance (Mn, Ni, and B), and essential elements (Cr, Cu, Zn, and Co). Additionally, Fe, Bi, and Sr were also analyzed. Cd, Co, and Li were not detectable, so they are indicated in the table as “less than the detection limit”.
To assess the significance of these results, all examined data were compared against the World Health Organization (WHO) standards of 2008, as no other suitable background information was available from previous studies.
The temperature of the phreatic groundwater samples, which is an important factor in chemical reactions in the aquatic system [81], ranged from 25 to 31.4 °C, with an average of 27.85 °C. Although the electrical conductivity (EC) does not provide full information related to the ionic composition of the water, it is considered an important tool to indicate the salinity or the amount of total dissolved solids in the water. The EC results in the samples ranged from 3100 to 6200 µS/cm, with an average of 4035.71 µS/cm, exceeding WHO limits in all the samples. Therefore, based on [82] these waters can be classified as moderately saline waters. Nevertheless, it is crucial to emphasize that elevated Ec levels can impact the suitability of water for various purposes, including drinking and irrigation. In terms of pH values, which ranged from 6.78 to 8.57, with an average of 7.31, four samples (S3, S5, S11, and S12) exhibited acidic pH levels, which could potentially be attributed to the water’s ability to dissolve metals. However, this acidity is not known to directly pose any health risks [83]. One sample, (S4), had a neutral pH, while the remaining samples had a basic pH. All of the samples fell within the range of WHO limits for drinking water, ensuring they meet the standards for human consumption.

3.2. Variations in Heavy Metals in the Phreatic Aquifer

Without considering Cd, Co, and Li, the other twelve analyzed heavy metals from the phreatic groundwater aquifer exhibited a dominance order as follows: Sr > B > Mn > Al > Fe > Bi > Ba > Ni > Cr > Zn > Pb > Cu. The differences in standard deviations, as highlighted in Table 3, can be attributed to the variety of source strengths, and the geoenvironmental nature of the large and diverse sampling sites controlled by their physicochemical characteristics, larger variability, and human activities [84].
Fe concentrations ranged from 0.110 to 0.40 mg/L, with three samples (S1, S8, and S14) surpassing the permissible limit set by the World Health Organization (WHO), while the rest of the samples remained below the acceptable threshold. The increased concentrations of Fe in the study areas, particularly those that exceeded the WHO limits, can be attributed to several possible explanations related to natural and anthropogenic factors. However, the redox conditions of iron-bearing minerals in both rocks and soils may be the underlying cause of these variations [85]. At the same time, the corrosion of pump parts that equip the vertical drainage system of the study area might be listed as another reason for high Fe concentrations [86]. Additionally, the dissolution of Fe2CO3 at lower pH levels and the chemical reaction of oxidized Fe minerals with organic matter can also raise the Fe levels in aquatic systems [87]. The removal of dissolved oxygen by organic matter, which results in reduced conditions, may be another cause of high Fe content. Under reducing conditions, the solubility of Fe-bearing minerals increases, leading to the enrichment of dissolved iron in groundwater [88]. The obtained results indicated that the color of most samples changed from clear to red-brown, indicating the precipitation of FeO(OH). Several anthropogenic reasons might account for the elevated Fe concentrations in the groundwater. These include industrial waste leachates and activities from mechanic workshops [59]. Additionally, the oxidizing process of pipes in the water distribution system can also lead to the release of Fe [85]. As for Mn concentrations, they varied from 0.30 to 0.71 mg/L, with three samples (S1, S12, and S14) exceeding the limit, while the remaining samples had concentrations below the limits. Similar to Fe, Mn is also one of the most prevalent metals in the earth’s crust and is naturally present in the environment [86].
In the case of B, the results ranged from 0.192 to 1.408 mg/L, with six samples (S9, S10, S11, S12, S13, and S14) that surpassed WHO limits, while the rest of the samples were under the allowable standards. In soils with a pH of 8.5, boron (B) typically exists in the non-ionized form H3BO3, but at pH 8.5, it exists as the anion B(OH)4 [89]. Industrial and home effluents emitted boron compounds into the water. Through the use of fertilizer, it may also be spread throughout the ecosystem. As all of the samples had pH values below 8.5, it seems that B would appear as a non-ionized form. Long-term exposure to B causes mild gastrointestinal irritation. Ba concentrations from the analyzed samples did not exceed WHO limits since their range was from 0.004 to 0.034 mg/L. Ba occurs usually as a complex of compounds in the crust of the earth and it can be used in different industrial activities. However, its presence in groundwater systems comes mainly from geogenic sources [90]. Ni values ranged from 0 to 0.024 mg/L, and its concentration exceeded the WHO limit in S2, while S3, and S4 Ni concentrations were within the permissible limits.
Zn is a necessary trace element that may be found in almost every type of food and drink, either as salt or as organic complexes. However, metal smelters and mining operations are other environmental sources of zinc. When zinc is manufactured and utilized with other materials including brass, bronze, alloys, rubber, and paints, the metal may be ejected into the environment through several kinds of waste streams [91]. Zn concentrations were below WHO guidelines and varied from 0 to 0.037 mg/L. As a trace metal, Cu in high concentrations can have adverse effects on human health [92,93]. However, Cu concentrations in the analyzed samples were below WHO guidelines and they varied from 0 to 0.020 mg/L. Superphosphate has the greatest impurity amounts of Cu, with other metals such as Zn, when compared to other fertilizers used on farmland, and its heavy metals may accumulate in soils in areas that have been used for agriculture for long periods [94,95].
Cr had concentrations below the recommended limit, since their results ranged from 0 to 0.023 mg/L. The Pb content in natural streams rises mostly as a result of human activity [96]. Paint, batteries, leaded gasoline and farmland diesel fuel use are some potential sources of lead in groundwater and they were, and still are, used in the study area. Moreover, various insecticides include lead arsenate. In our study area, Pb varied from 0 to 0.045 mg/L, and two samples (S13 and S14) exceeded the recommended limit of the WHO.
In another vision, Sr has no limit since the WHO has not established a guideline for it. Based on the Federal-Provincial-Territorial Committee on Drinking Water [97], the allowable limit for drinking purposes was set to be 7 mg/L. However, Sr levels oscillated from 1.774 to 9.939 mg/L, with eight samples exceeding the recommended guidelines (S1, S6, S7, S9, S10, S11, S12, and S13), while the remaining samples were within the limits. Agricultural activity produces an input of Sr in huge amounts, suggesting that the source may be anthropogenic. To some extent, this is dependent on the amount of fertilizers, carbonate additions, and manure from animals such as cattle and poultry [98]. The presence of strontium in the soil may also be attributed to the disposal of waste materials and industrial effluents. Water dissolves strontium in soil, allowing it to penetrate the earth more deeply and reach groundwater.
On the contrary, Al concentrations in all fourteen samples ranged from 0.220 to 0.520 mg/L, surpassing the drinking water guidelines established by the WHO. Aluminum predominates in water with a neutral reaction as organic and hydroxide complexes, while fluoride and sulfate complexes are present in lesser amounts [99]. However, in relation with our results, aluminum and its organic complexes, as well as Al(OH)3, appear to be harmless [100]. Another reason that might explain the high concentration of Al is the six industrial factories processing aluminum in the Oued Souf region. In terms of Bi, there are no guidelines for the recommended Bi concentrations set by the WHO for drinking purposes. However, the Bi concentrations in the analyzed phreatic groundwater samples ranged from 0 to 0.282 mg/L [101].

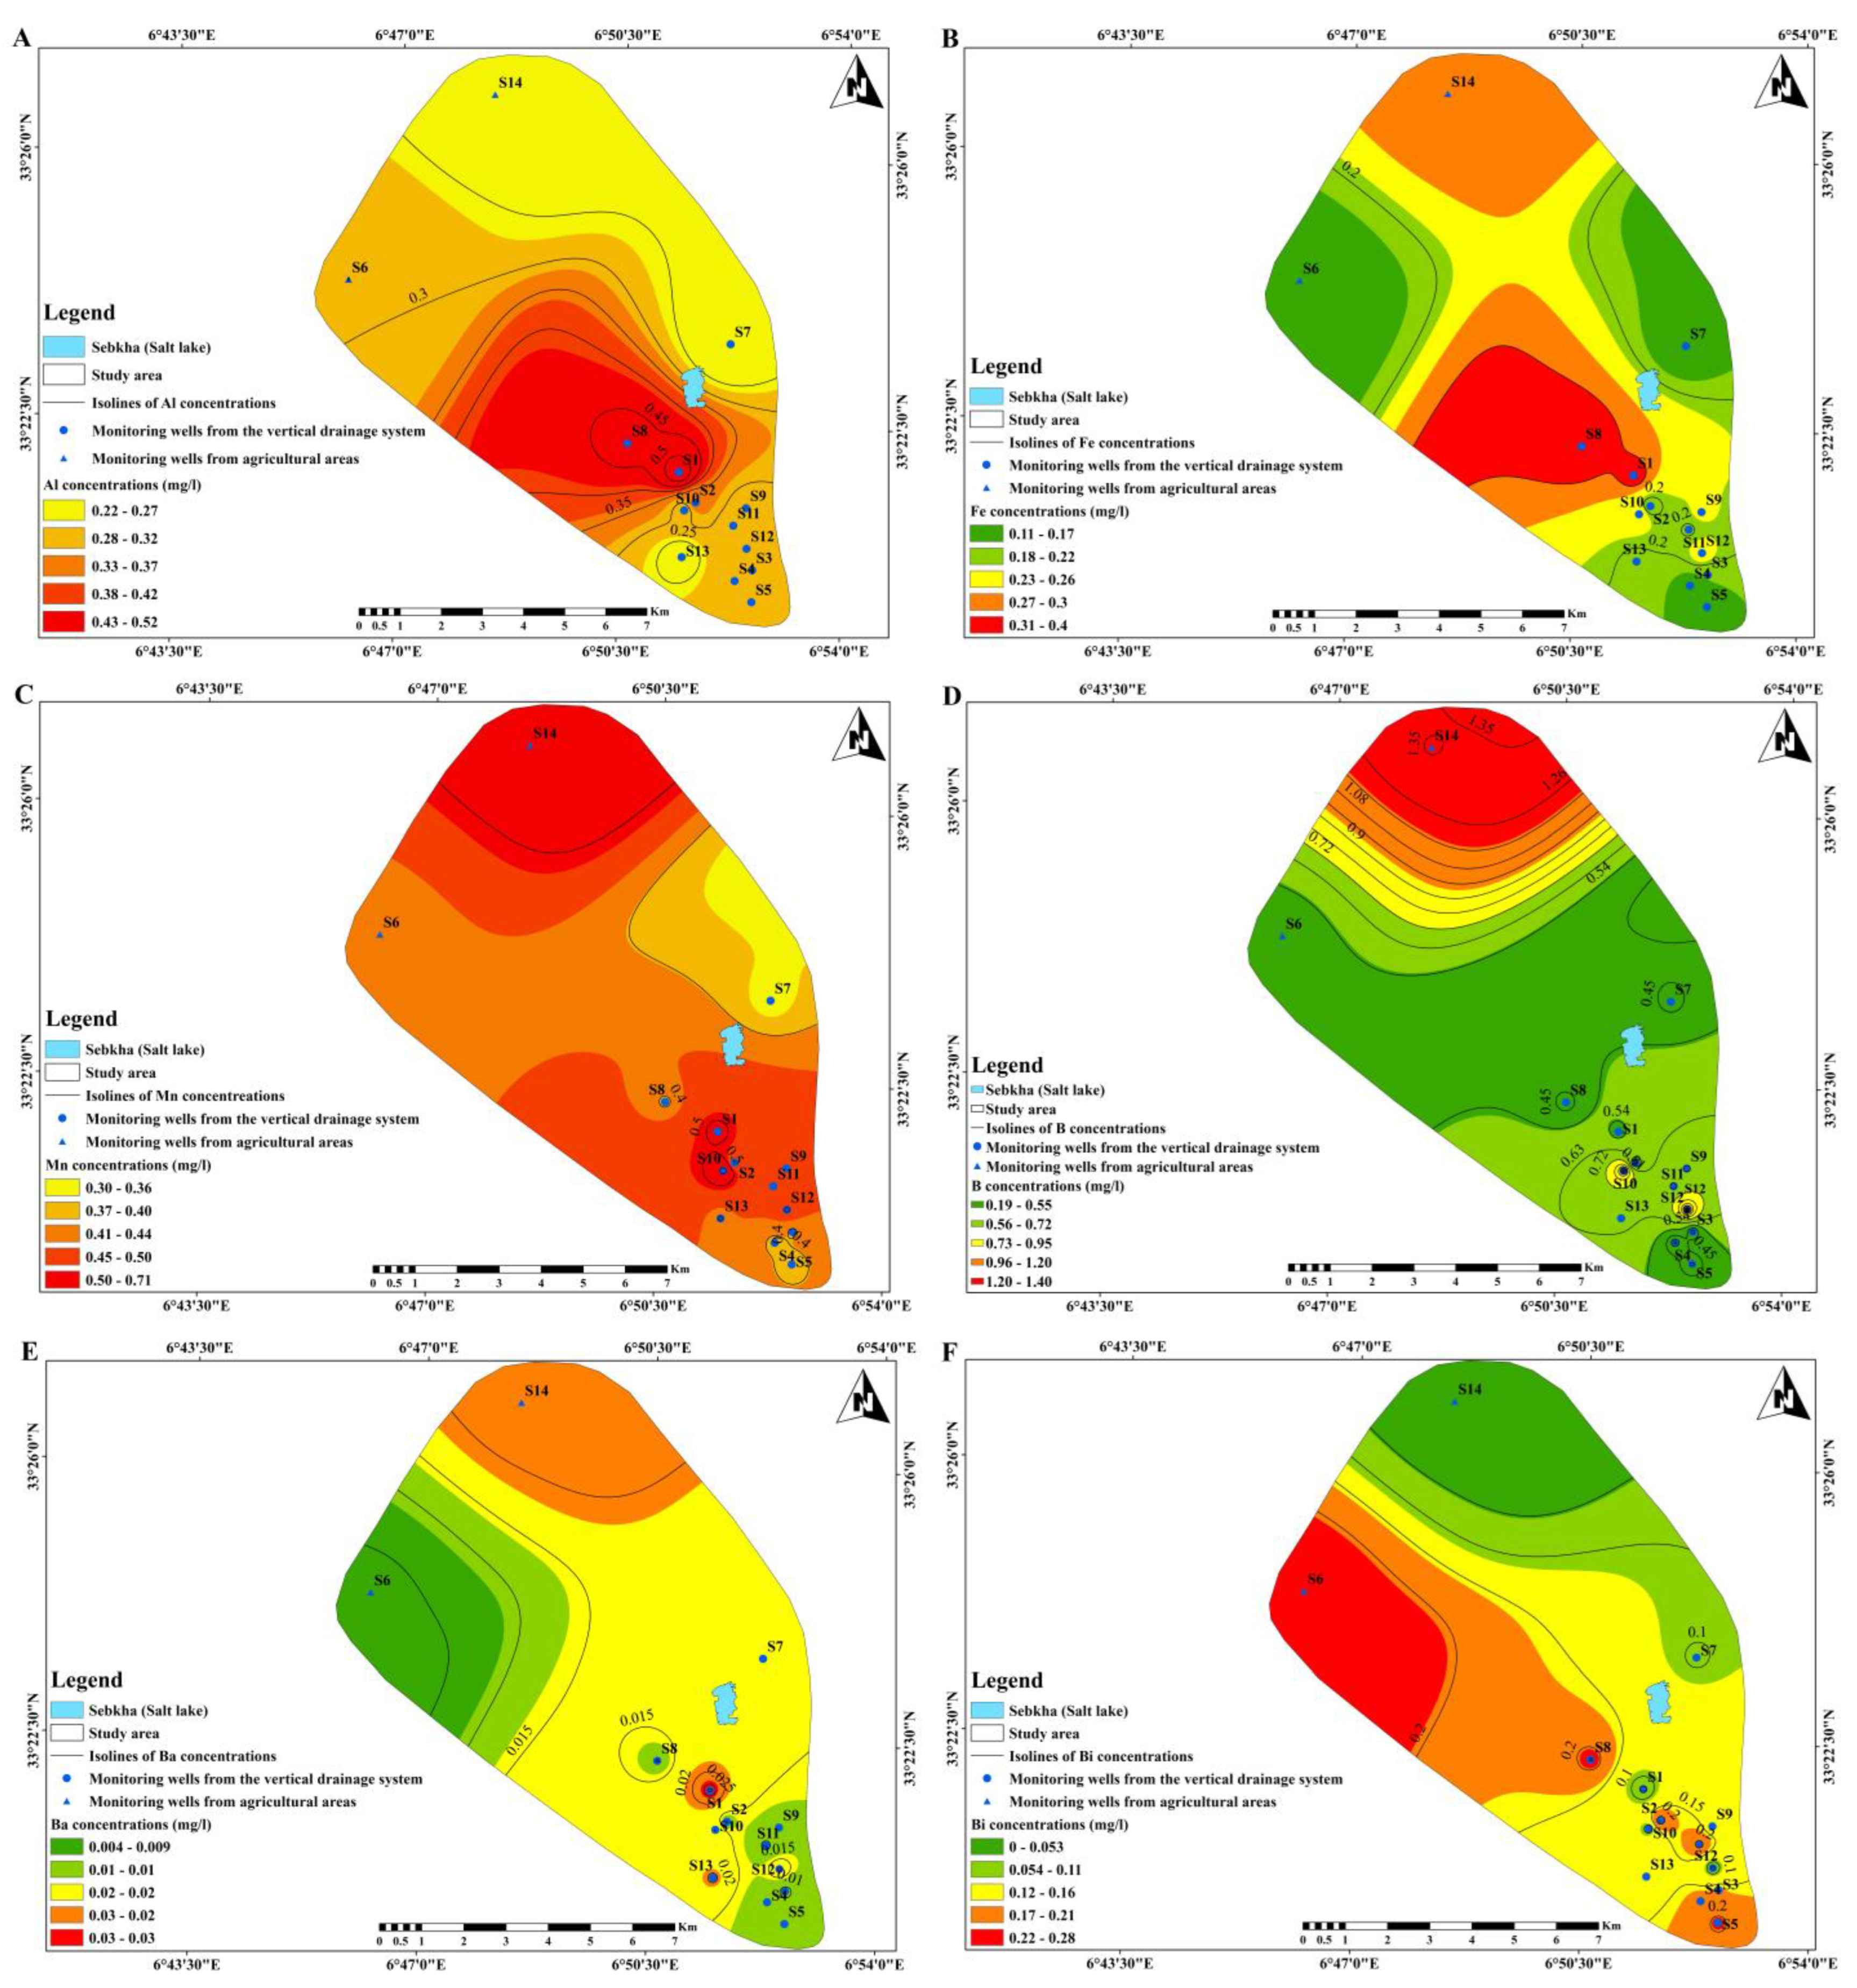
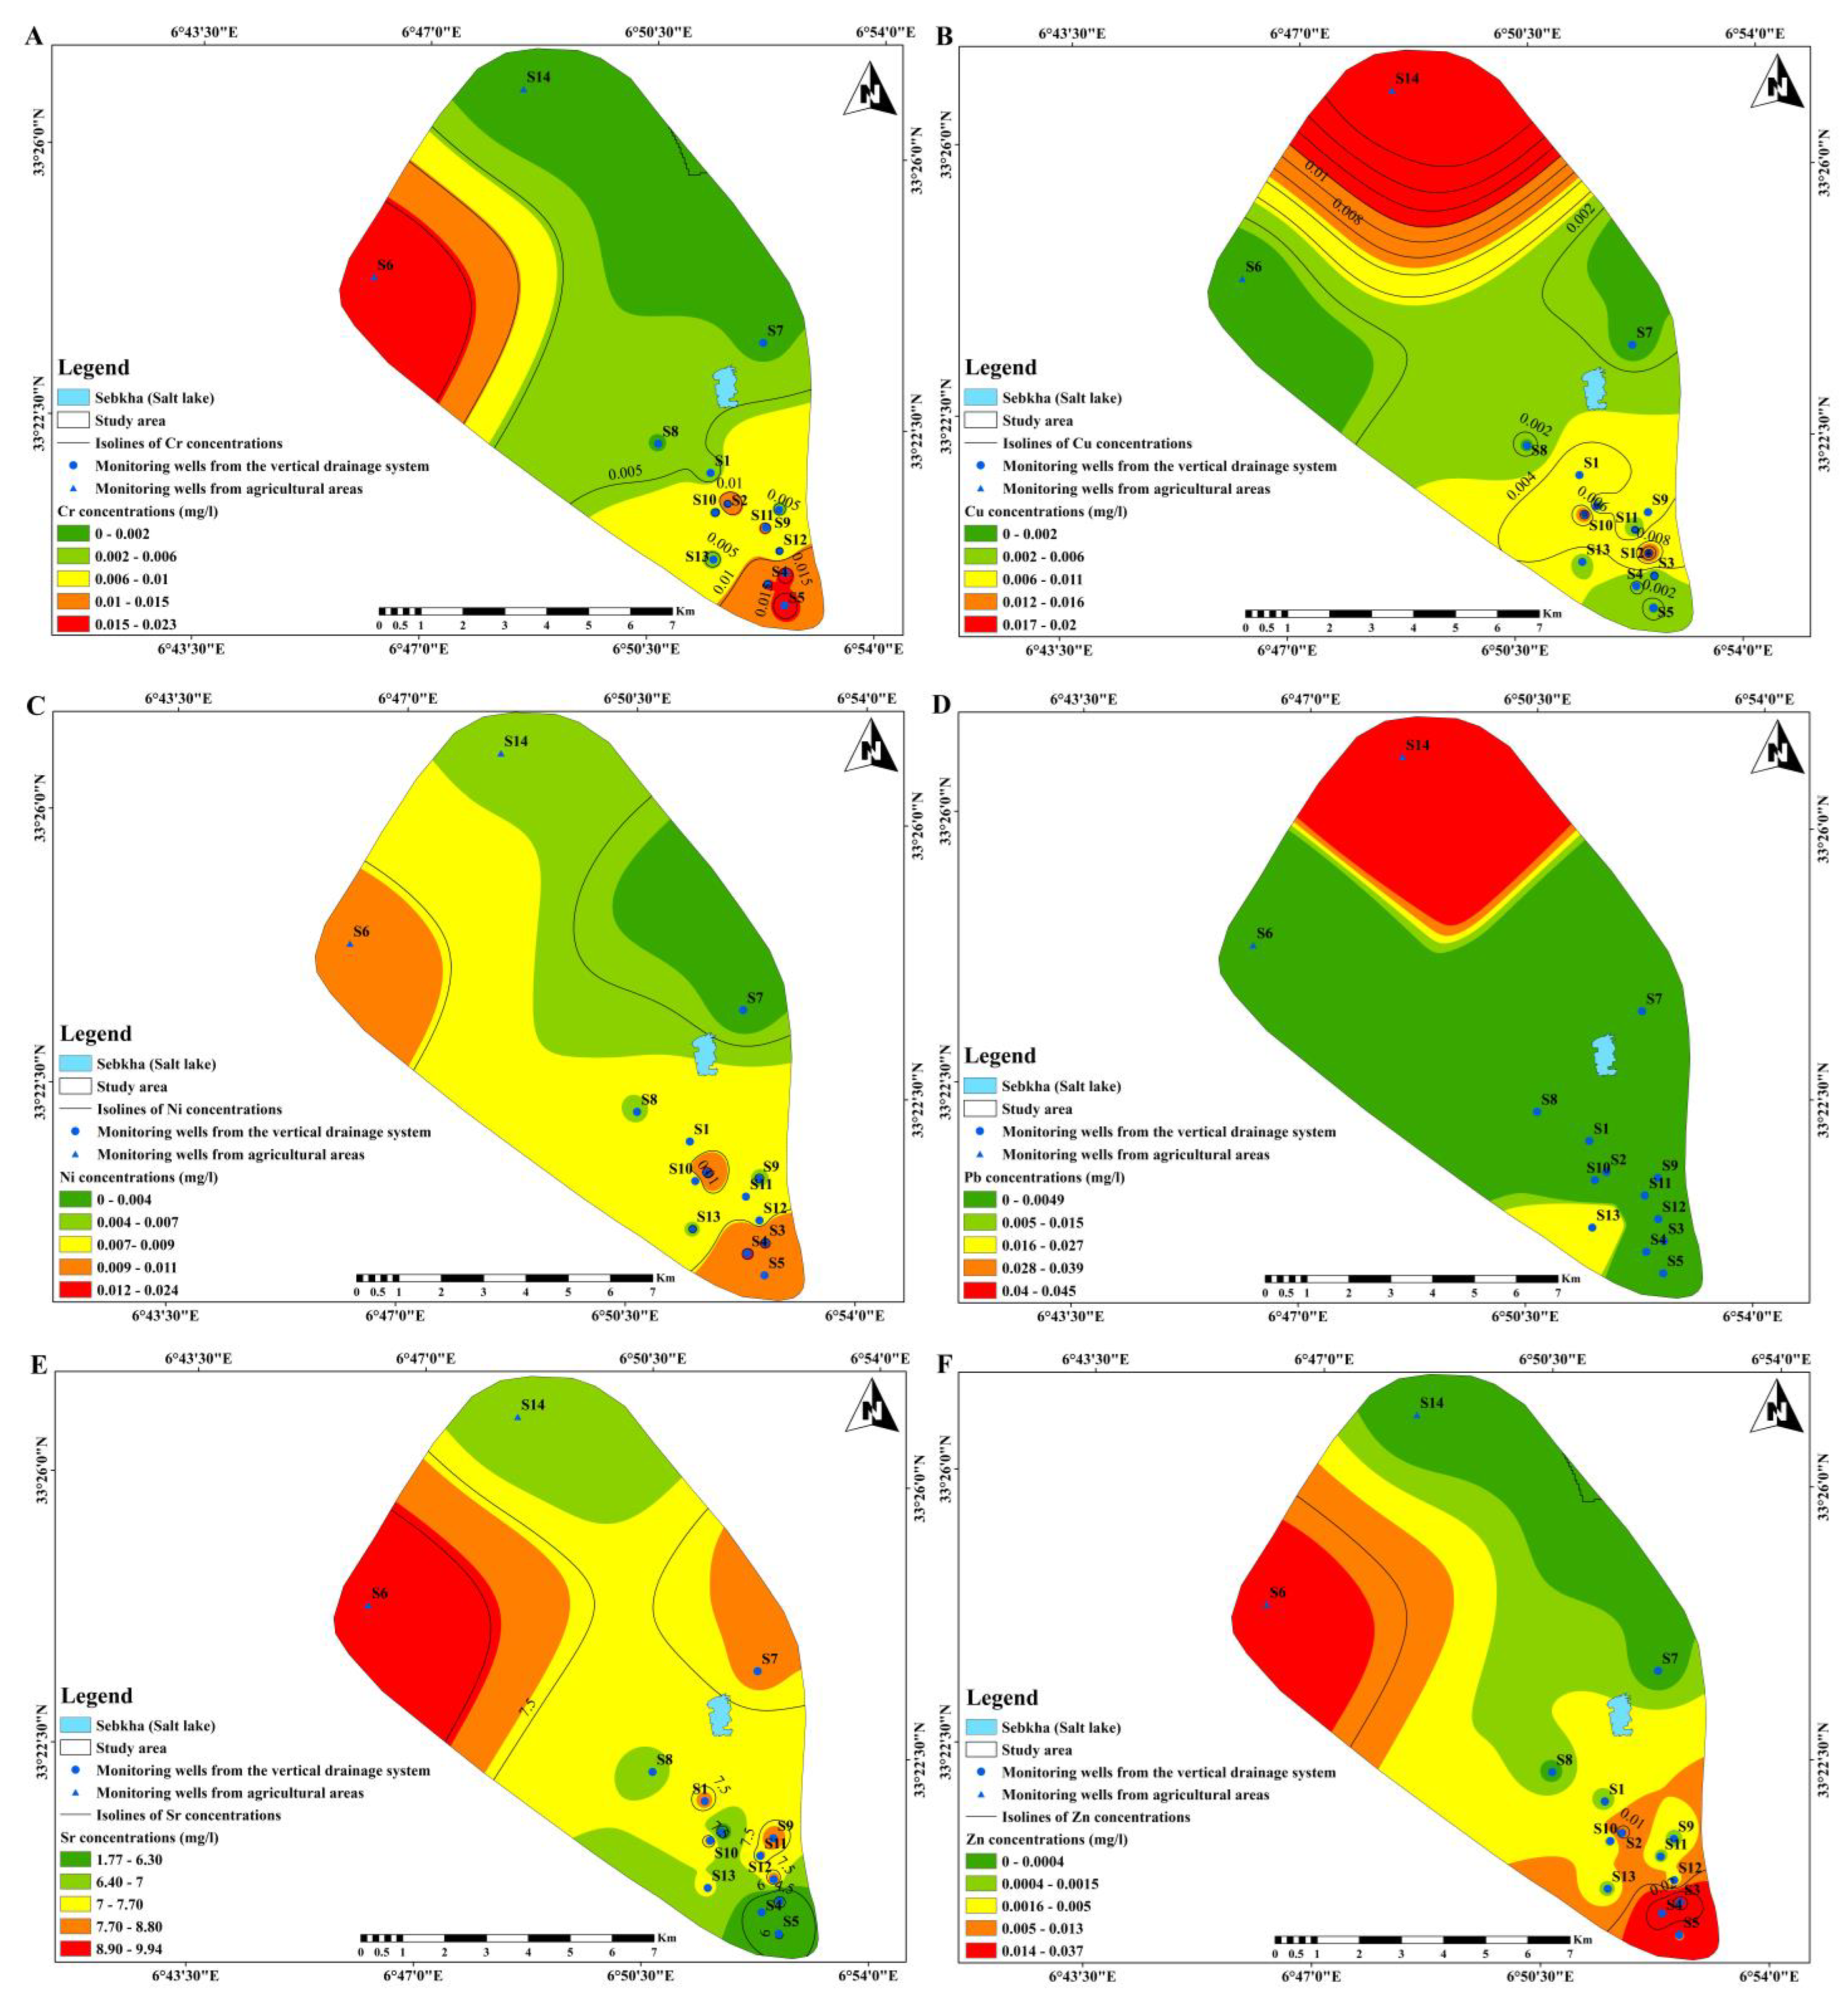
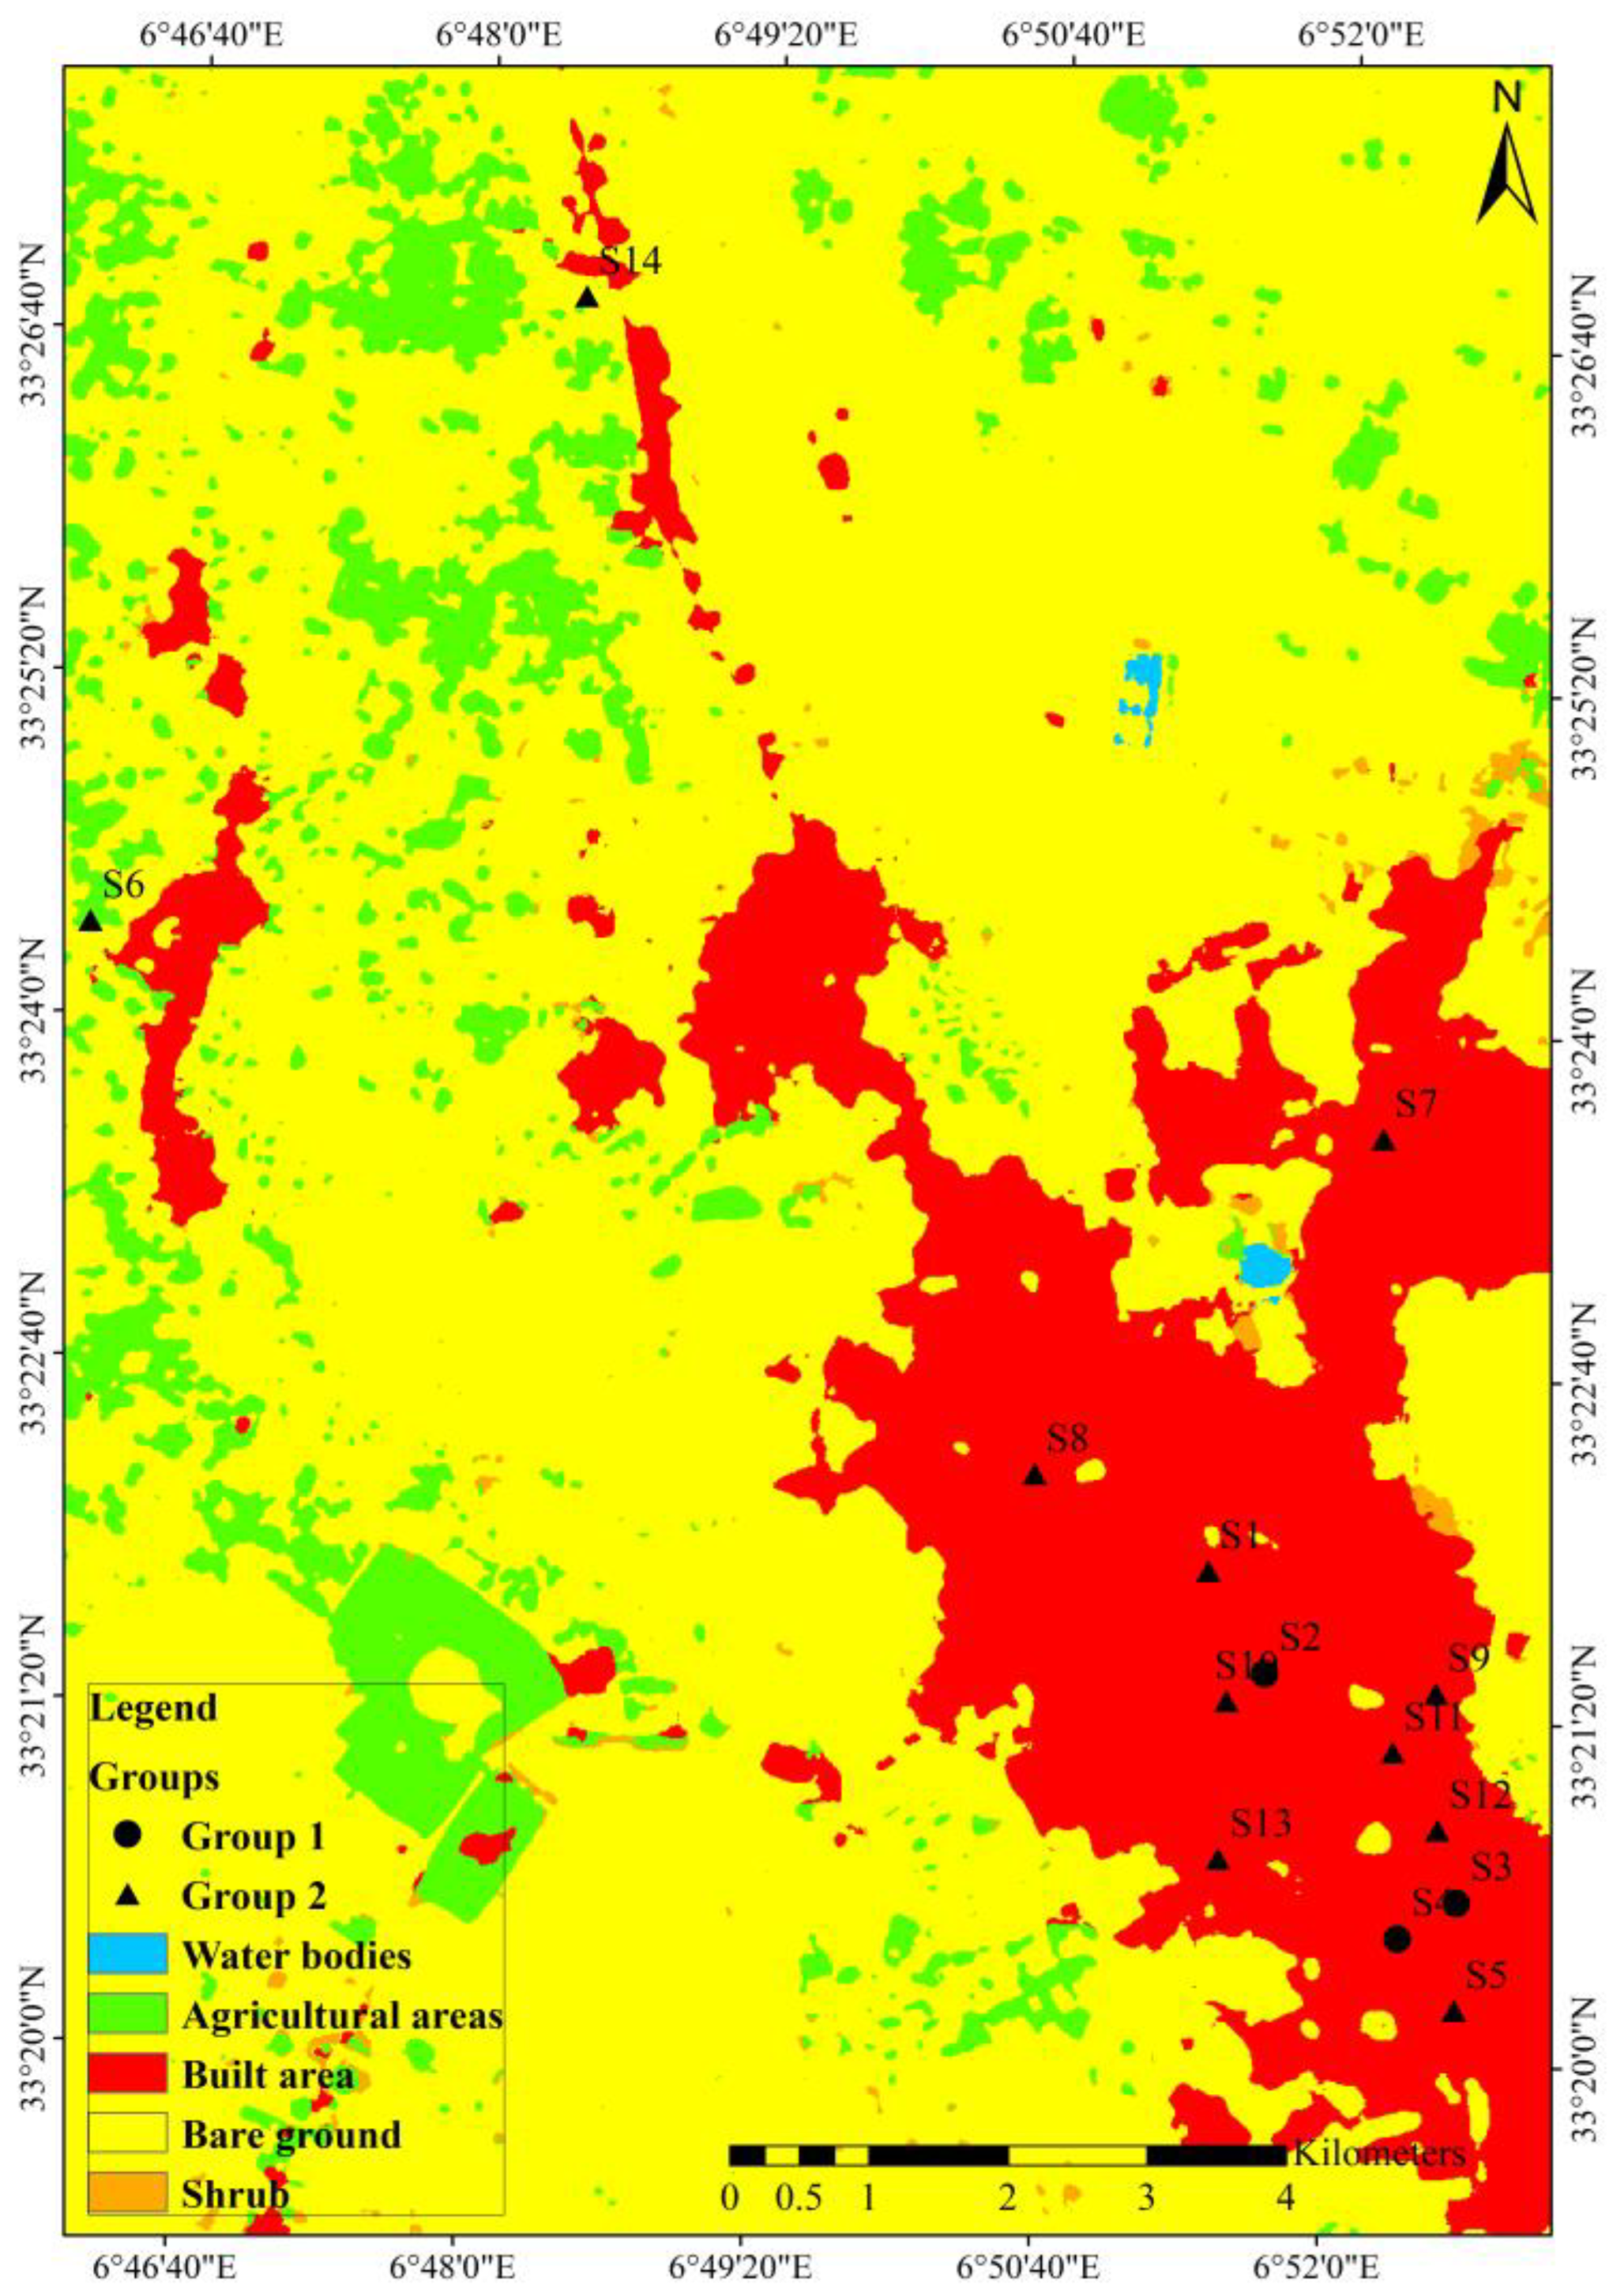
3.3. Spatial Patterns Detection

The accuracy evaluation of the IDW interpolation technique for the different examined heavy metals in the phreatic groundwater aquifer is summarized in Table 4. According to the goodness-of-fit criterion, the model with the lowest RMSPE was the best fit for comprehending the spatial distribution patterns of the selected heavy metals. Figure 6 and Figure 7 represent the spatial distribution maps processed by the IDW method.
In comparison to the other areas, where Al concentrations were high throughout the study area, there were low values represented by the first class (0.22–0.27 mg/L). These low values were observed from the north to the east of El Oued, covering S14 and S7 (Ourmes and El Oued) and even surrounding S13 in the south (El Oued). From these points, the concentrations gradually increased towards the north, east, and southwest, reaching almost the middle of the study site, encompassing the northern part of the investigated area.
Similarly, low concentrations of Fe that did not exceed the WHO limits were found in the west of the Oued Souf Valley, specifically in an agricultural site (Kouinine, S6), in the east in preurban areas (El Oued, S7), and even in the south (between El Oued and Bayadha, S4, and S5). A similar pattern of spatial behavior was observed between the distribution of Fe and Al values, where Fe values exceeded the limits in the north (Ouermes-S14), which is an agricultural site, and surrounded S8 and S1 in an area that approximately spreads from the middle west to the center of the study area, covering the northern part of El Oued municipality (see Figure 6).
As well as the other elements that are related to each other, Mn concentrations were increasing from the east of the study area toward the north and the south of the Oued Souf Valley. Furthermore, the high values that exceed the limits are located in the north (Ouermes municipality), which is an agricultural site, and S1 and S10 in El Oued (an urban area). Visually, it was also possible to observe a similar pattern between Mn, Cu, and Pb, where the highest levels were found in the northern part of the Valley, which included the agricultural site (S14).
In connection to Mn, low concentrations of B are situated in almost the center of Oued Souf and extend from the west to the east, including S6, S7, and S8, and also in a small area surrounding S1, and the south including S3, S4, and S5. Then, the concentrations gradually increase toward the north to S14. Although Ba and Cu did not exceed the limit, another spatial similarity between them has been detected, where the highest values of Cu and Ba are located north of the study area covering S14. In contrast, an almost analogous spatial behavior can be noticed between Sr, Bi, Cr, Ni, and almost in the case of Zn. However, the highest values are always found in the west of Oued Souf City, touching an agricultural site (S6), with some differences in the south (El Oued municipality) in various cases, such as Bi (S8, and S5), Cr (S3, S4, and S5), Ni (S2, S3, S4, and S5), and Zn (S3, and S4).
The consistent spatial patterns observed among the analyzed heavy metals in the study area are primarily governed by their respective origins and the direct and indirect interconnections they share with one another. These interrelationships are probably influenced by both natural (geogenic) and human-made (anthropogenic) sources. Geogenic sources include minerals and rocks susceptible to weathering, with heavy metals adsorbing onto specific mineral surface sites. Anthropogenic sources involve factors such as industrial discharge, household waste, and the use of various types of fertilizers. These combined factors contribute to the observed relationships among the heavy metals. [89]. The septic source of the majority of these heavy metals is closely related to the study area’s history, specifically when the phreatic groundwater aquifer rose to or was near the surface.

3.4. Cluster Analysis

The combined application of clustering analysis with Ward’s linkage approach and Euclidean distance considered all the examined metals (Pb, Al, Ba, Mn, Ni, B, Cr, Cu, Zn, Fe, Bi, and Sr) on the normalized data to construct prospective groups present in the phreatic groundwater samples. Consequently, two groups have been plotted on the dendrogram (Figure 8). Al, Fe, Mn, B, Ba, Cu, Pb, and Sr were considered key factors in the identification of the resulting groups through the HCA process, as shown in Table 5.
The samples in the first group reflected a lower risk of contamination in terms of heavy metals due to their lower concentrations compared to the second group. The area containing the second group samples was more vulnerable to heavy metals, which likely originated from urban, preurban, and even agricultural areas, as shown in Figure 9.

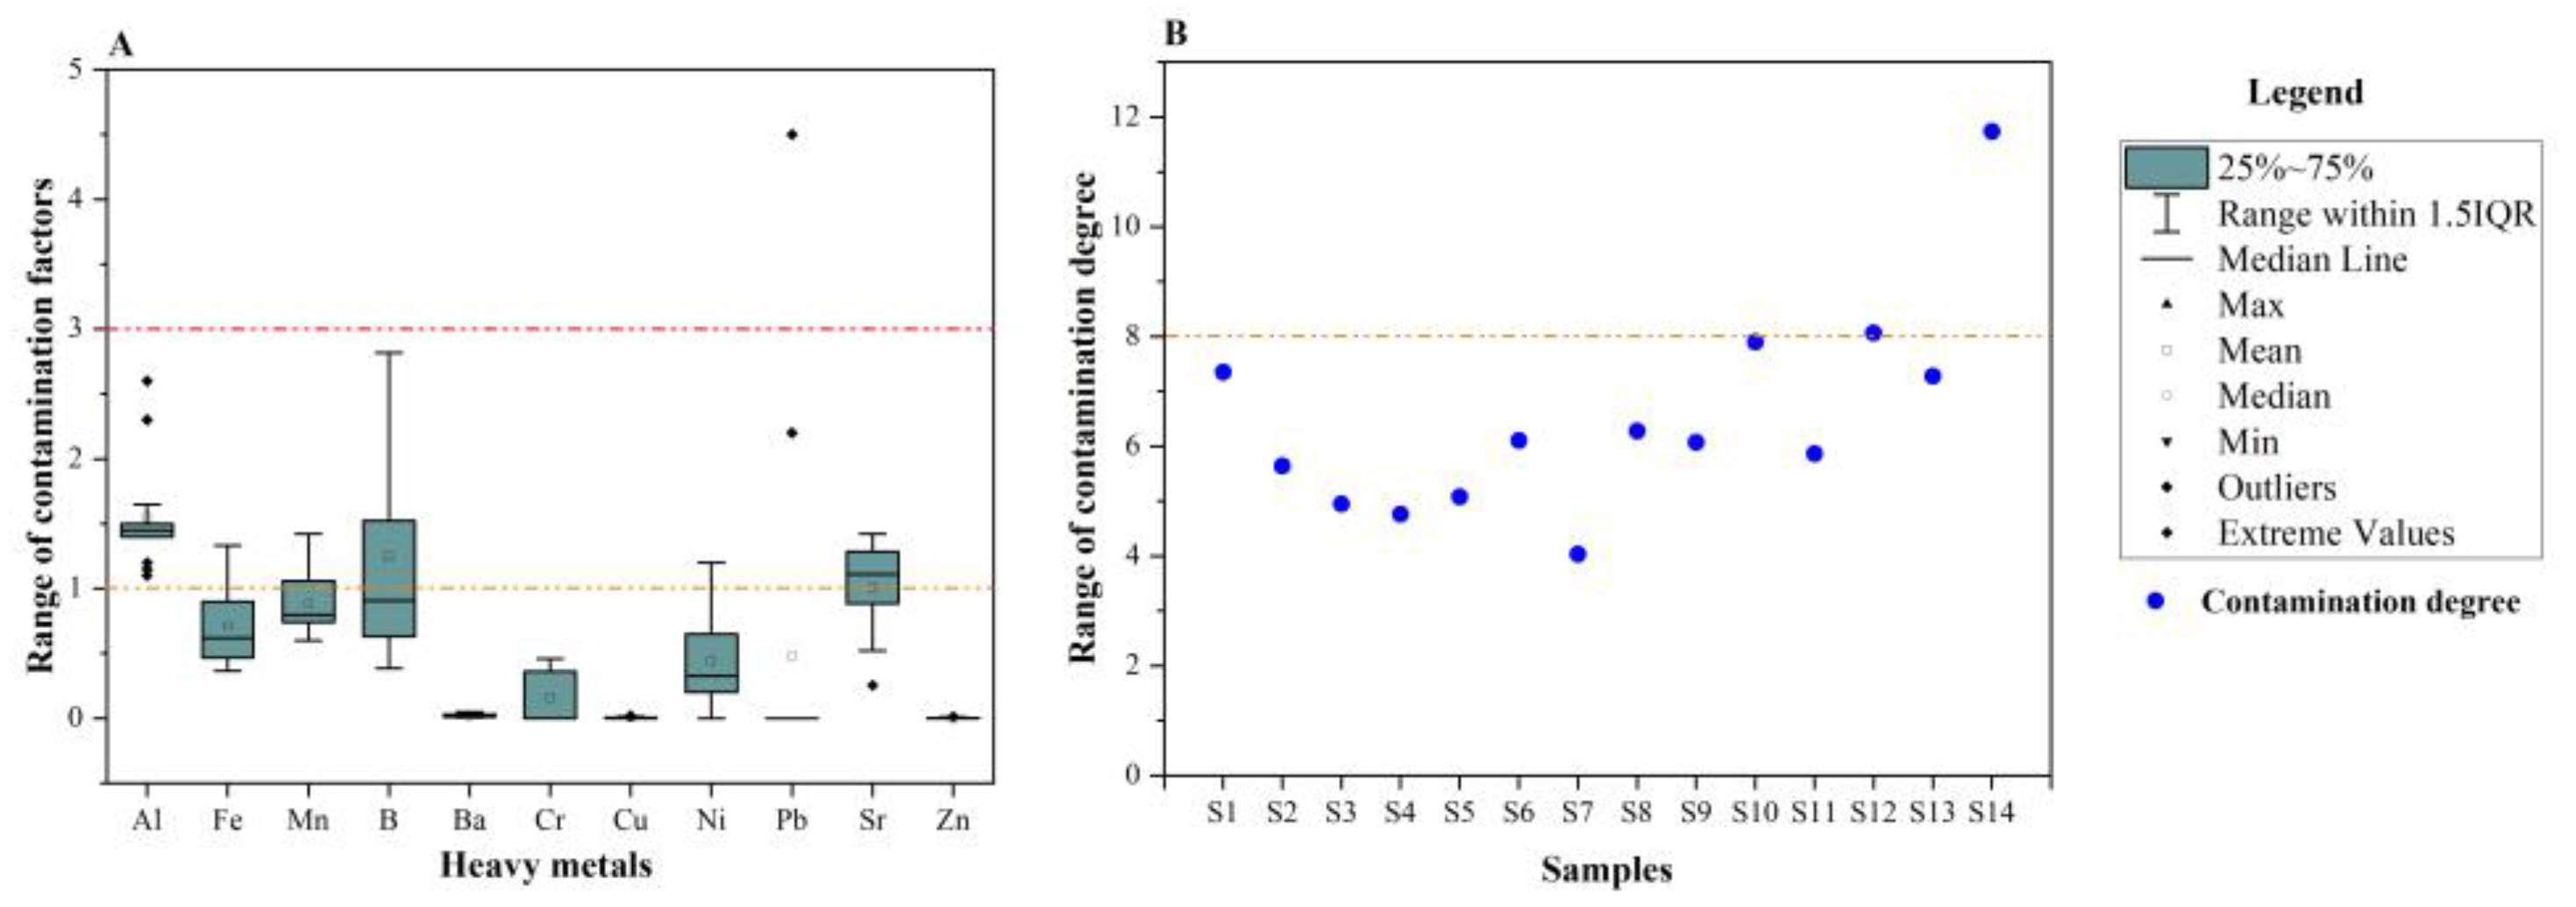
3.5. Evaluation of the Heavy-Metal pollution in the Phreatic Aquifer

Figure 10, Figure 11 and Figure 12 illustrate the range of computed pollution indices based on the analyzed heavy metals from the phreatic groundwater aquifer. The presence of outliers in the contamination factor results for Al and Pb can probably be associated with the historical pollution event, which might still be affecting the data, along with the small number of samples. However, among the samples, 100% showed medium contamination from Al, while 78% (eleven samples) exhibited low contamination, and 21.42% (three samples) had medium contamination of Fe. Additionally, 50% of the samples showed both low and medium contamination with B, whereas 100% of the samples were low in contamination with Ba. As for Mn, ten samples (71.43%) had a low contamination factor, and four samples (28.57%) were low in terms of Mn. All samples showed low contamination factors for Cr, Cu, and Zn. Regarding Sr, Ni, and Pb, 42.86%, 78.57%, and 85.71% of the samples had low contamination factors, respectively, while 57.14%, 21.43%, and 14.29% of the samples had medium contamination factors.
The overall degree of contamination of the studied metals revealed that the majority of analyzed phreatic groundwater samples had a low degree of contamination, accounting for 78.57% of the samples. Only three samples (S10, S12, and S14) were characterized by a moderate degree of contamination.
Regarding the accumulations of heavy metals, whether anthropogenic or geological in nature, it was observed that Fe, Mn, Ba, Cr, Cu, Ni, Sr, and Zn did not reach contamination levels, indicating lower accumulations. However, in the case of B, four samples (S9, S10, S12, and S14) showed values of the geoaccumulation index ranging from uncontaminated to moderately contaminated. The remaining samples were classified as uncontaminated in terms of B.
The geoaccumulation index results indicated that S13 was uncontaminated to moderately contaminated, and S14 was moderately contaminated in relation to Pb. Additionally, three samples (S1, S2, and S8) were classified as uncontaminated to moderately contaminated, while the rest of the samples did not reach the contamination level for the studied heavy metals.
In summary, the majority of the analyzed phreatic groundwater samples showed a low degree of contamination, with only a few samples exhibiting a moderate degree of contamination. The geoaccumulation index provided insights into the accumulations of different heavy metals, highlighting some samples with moderate contamination levels for certain elements.
Regarding the enrichment of the studied metals in the phreatic aquifer, the analyzed metals had an enrichment trend of Al > B > Sr > Mn > Ni > Pb > Cr > Ba > Cu > Zn. Furthermore, all of the samples had minor enrichment in terms of Ba, Cr, Cu, and Zn, suggesting their geogenic source. In accordance with Al, nine samples had a minor enrichment by Al (S1, S3, S11, S8, S9, S10, S12, S13, and S14), while the other five samples had a moderate enrichment by Al. Overall, the enrichment values of Al suggested the anthropogenic source of Al in the thirteen samples that cover almost all of the study area [21] Despite the minor enrichment by Mn in all of the analyzed samples, S2, S4, S5, S6, S7, and S10 had enrichment factor values above 1.5, suggesting their anthropogenic source, which was reinforced by their being located mainly in El Oued (urban areas) and Kouinine (agricultural area). The possible anthropogenic source of Mn in urban areas can be represented by wastewater, acid mine drainages [102], landfill leachates, and legal and illegal industries [103]. Meanwhile, the anthropogenic source of Mn in rural areas can result from manganese-containing fertilizers such as manganese sulfate (MnSO4), pesticides and herbicides, and livestock farming [104]. Furthermore, the enrichment by B was minor in eight samples (S1, S2, S3, S4, S5, S8, S9, and S11), while the rest of the other samples reflect a moderate enrichment by B. However, S6, S7, S10, S12, S13, and S14 had an enrichment suggesting the anthropogenic source of B. In terms of Ni, most of the phreatic groundwater samples showed minor enrichment, except for S2 and S4, which had moderate enrichment. Furthermore, four samples that were located in El Oued and Bayadha (S2, S3, S4, and S5) probably had an anthropogenic origin. In any case, S13 and S14 represented an anthropogenic moderate enrichment by Pb, while the rest of the other samples were of minor enrichment. Correspondingly, three samples (S5, S6, and S7) were characterized by moderate enrichment by Sr, while the rest of the sample had minor enrichment by Sr. Overall, six samples (S5, S6, S7, S11, S12, and S13) were of anthropogenic origin.
Ecologically, all of the studied heavy metals represented no ecological risk, since their results were below 5, except for two samples: S13, which represents a considerable ecological risk, and S14, which represents a high ecological risk in terms of Pb. Meanwhile, all of the samples reflected a low potential ecological risk concerning all of the metals.

3.6. Risk Evaluation of Human Health from the Heavy Metals of the Phreatic Aquifer

The presence of heavy metals with high concentrations in any groundwater system may generate a risk of adverse effects on human health, causing several serious effects that can vary from shortness of breath to several types of cancers in human beings (a significant threat to the normal performance of human body tissues) [68,105], reduced growth and development, organ damage, nervous system damage, and in extreme cases, death. The toxicity of heavy metals increases because of their non-metabolization and their accumulation in soft tissues [106,107]. Animal tissues have been found to have undergone morphological, histological, and biochemical changes after being exposed to environmental toxins such as heavy metals for an extended duration, even at very low concentrations [105]. Table 6 represents the results of the chronic daily intake (CDI) of the analyzed metals in this research.
In Figure 13, all of the obtained outcomes, including the hazard quotient (HQ) and hazard index (HI), are shown. For adults, the chronic daily intake (CDI) values with respect to all the analyzed metals were below the oral reference dose (RfD), leading to HQ values lower than 1 for all samples, indicating an acceptable level of non-concern. However, for eight samples (S1, S6, S9, S10, S11, S12, S13, and S14), the hazard index (HI) values were above 1, indicating a high long-term health risk and a non-negligible non-carcinogenic adverse effect in the case of adults. This high risk is attributed to the high presence of Al in most samples, and Fe, Mn, B, Ni, and Sr in other wells.
For children, the CDI values were below the RfD for Al, Fe, B, Ba, Cr, Cu, Ni, Pb, and Zn. However, the CDI was above the RfD for Sr in S6 (CDI = 0.63537) and Mn in S10 (CDI = 0.04538).
Most of the analyzed heavy metals had HQ values less than 1 for children, except Mn and Sr. HQ values of Mn exceeded 1 in nine samples (S1, S2, S6, S9, S10, S11, S12, S13, and S14), and the HQ of Sr was high in two samples (S6 and S12).
The current level of Fe, Mn, B, Ni, Pb, Sr, and Al penetrating the digestive tract or causing skin contamination through the phreatic groundwater can have diverse effects on human health, since an excessive amount of iron in the body could raise concerns due to its potential link with various chronic illnesses such as heart disease [108,109] and diabetes [110,111]. High manganese exposure, often from contaminated drinking water, can cause neurotoxic effects, including tremors and cognitive impairment [112]. Furthermore, boron exposure may lead to gastrointestinal symptoms and, in chronic cases, kidney damage or developmental issues in children [113].
The buildup of nickel and its compounds within the body as a result of prolonged exposure could lead to a range of detrimental health effects in humans, including conditions such as lung fibrosis, kidney problems, cardiovascular diseases, and respiratory tract cancer [114,115]. Lead exposure, particularly in children, can result in developmental delays and cognitive problems, while adults may experience high blood pressure and fertility issues [116]. Strontium is less toxic than some other heavy metals, but excessive exposure can lead to bone problems, including changes in bone density [117]. Aluminum levels have been associated with neurological disorders such as Alzheimer’s disease [118].
Consequently, the Hazard Index (HI) scores registered exceedingly elevated levels concerning children, encompassing all the wells within the research area. This indicates a substantial and enduring health hazard, along with a noteworthy non-cancer-related adverse impact. Elevated HI scores not only imply immediate dangers but also project into the foreseeable future. Prolonged exposure to these contaminants may result in persistent health issues, with the potential to impede the growth and development of children. Furthermore, children are inherently more susceptible to environmental pollutants than adults, given their ongoing physical development and their tendency to consume or breathe in a higher proportion of pollutants relative to their body weight. Consequently, the elevated HI scores for children warrant special concern. Hence, it is imperative to involve pertinent authorities, including environmental agencies and public health departments, in formulating and executing strategies aimed at mitigating these risks and safeguarding the well-being of children in the affected region. Additionally, active community engagement and the dissemination of information about potential hazards and protective measures are essential steps to ensure the welfare of residents, particularly children.

4. Conclusions

This research has demonstrated that the phreatic aquifer in the study area is not seriously contaminated with Cd, Co, and Li, as they were not detectable in any of the analyzed samples. Ba, Cr, Cu, and Zn were found to be within WHO limits. However, Fe, Mn, B, Ni, and Pb showed varying concentrations, exceeding the limits in urban and agricultural areas. Additionally, Al concentrations were found to be high throughout the study area.
The elevated levels of some of the studied metals can be attributed to various anthropogenic activities, including mining and extraction, industrial chemistry, wastewater discharge, landfill and waste disposal, steel processing, metallurgy, and agricultural fertilizers. Furthermore, the study area’s history, mainly characterized by anthropogenic sources, plays a significant role in governing the relationship between the metals, affecting them along with geogenic sources. This explains the diversity in the obtained results, where different cases showed low, moderate, and high contamination indices.
The vertical drainage system is found to support and accelerate the pollution level in the shallow aquifer by facilitating the penetration of various pollutants into the system. The residence time of these waters in the drainage system seems to be long, contributing to the contamination of the shallow aquifer.
Despite the novelty of this work, it does have limitations and shortcomings, primarily due to the limited data available from the sampling process and analysis. Consequently, drawing a complete overview of contamination in the phreatic aquifer of the entire Oued Souf region remains challenging.
The exposure to heavy metals of the phreatic groundwater aquifer can create a serious health concern for people of all ages, leading to various health issues. In adults, chronic exposure can result in organ damage, cardiovascular problems, and an elevated risk of certain cancers. Children, being more susceptible due to their developing bodies, may experience cognitive impairments, developmental delays, and behavioral issues. At the same time, the presence of these metals raises concerns for the future regarding the potential contamination of the deep aquifers, which are currently used for drinking and irrigation purposes through direct and indirect contact.
Thus, a further large-scale investigation is highly recommended in the near future, with a focus on the currently analyzed metals in both the phreatic and deep aquifers used for drinking and irrigation purposes. Additionally, control measures should aim to reduce anthropogenic sources in the Oued Souf Valley to prevent human health hazards and long-term ecological problems. This can be achieved by improving and increasing the capacity to treat the discharged polluted phreatic waters transported via the vertical drainage system.

Author Contributions

Conceptualization, A.B.; methodology, A.B., G.S. and F.B.; software, A.B., D.B. and I.M.; validation, A.B., G.S., T.M., Z.S. and F.B.; formal analysis, A.B., Z.S. and S.Z.; investigation, A.B.; resources, A.B. and S.Z.; data curation, A.B., F.B., G.S. and T.M.; writing—original draft preparation, A.B.; writing—review and editing, A.B., F.B., G.S. and T.M.; visualization, A.B. and D.B.; supervision, G.S. and F.B. All authors have read and agreed to the published version of the manuscript.

Funding

Project no. TKP2021-NKTA-32 has been implemented with the support provided from the National Research, Development and Innovation Fund of Hungary, financed under the TKP2021-NKTA funding scheme.

Data Availability Statement

Not applicable.

Acknowledgments

The authors gratefully acknowledge the assistance of ONA company (l’office national d’assainissement) in the Oued Souf Valley to enter and make sampling from the vertical drainage system. At the same time, the work of Dániel Balla and Tamás Mester was supported by the Eötvös Scholarship of Hungary.

Conflicts of Interest

The authors declare no conflict of interest.

References

  1. Jasrotia, A.S.; Taloor, A.K.; Andotra, U.; Kumar, R. Monitoring and Assessment of Groundwater Quality and Its Suitability for Domestic and Agricultural Use in the Cenozoic Rocks of Jammu Himalaya, India: A Geospatial Technology Based Approach. Groundw. Sustain. Dev. 2019, 8, 554–566. [Google Scholar] [CrossRef]
  2. Adimalla, N.; Dhakate, R.; Kasarla, A.; Taloor, A.K. Appraisal of Groundwater Quality for Drinking and Irrigation Purposes in Central Telangana, India. Groundw. Sustain. Dev. 2020, 10, 100334. [Google Scholar] [CrossRef]
  3. Momodu, M.A.; Anyakora, C.A. Heavy Metal Contamination of Ground Water: The Surulere Case Study. Res. J. Environ. Earth Sci. 2010, 2, 39–43. [Google Scholar]
  4. UNESCO; UN-Water; World Water Assessment Programme. WWAP (The United Nations World Water Development Report 3): Water in a Changing World; UNESCO: Paris, France, 2009. [Google Scholar]
  5. UNESCO; UN-Water; World Water Assessment Programme. WWAP (The United Nations World Water Development Report 6): Water for a Sustainable World; UNESCO: Paris, France, 2015. [Google Scholar]
  6. Brassington, R. Field Hydrogeology; The Geological Field Guide Series; John Wiley & Sons, Ltd.: Hoboken, NJ, USA, 2007. [Google Scholar]
  7. Kavcar, P.; Sofuoglu, A.; Sofuoglu, S.C. A Health Risk Assessment for Exposure to Trace Metals via Drinking Water Ingestion Pathway. Int. J. Hyg. Environ. Health 2009, 212, 216–227. [Google Scholar] [CrossRef] [PubMed]
  8. Suvarapu, L.N.; Baek, S.-O. Determination of Heavy Metals in the Ambient Atmosphere: A Review. Toxicol. Ind. Health 2017, 33, 79–96. [Google Scholar] [CrossRef]
  9. Visnjic-Jeftic, Z.; Jaric, I.; Jovanovic, L.; Skoric, S.; Smederevac-Lalic, M.; Nikcevic, M.; Lenhardt, M. Heavy Metal and Trace Element Accumulation in Muscle, Liver and Gills of the Pontic Shad (Alosa Immaculata Bennet 1835) from the Danube River (Serbia). Microchem. J. 2010, 95, 341–344. [Google Scholar] [CrossRef]
  10. Cabral-Pinto, M.M.S.; Inácio, M.; Neves, O.; Almeida, A.A.; Pinto, E.; Oliveiros, B.; Ferreira da Silva, E.A. Human Health Risk Assessment Due to Agricultural Activities and Crop Consumption in the Surroundings of an Industrial Area. Expo. Health 2020, 12, 629–640. [Google Scholar] [CrossRef]
  11. Rahman, M.A.T.M.T.; Paul, M.; Bhoumik, N.; Hassan, M.; Alam, M.K.; Aktar, Z. Heavy Metal Pollution Assessment in the Groundwater of the Meghna Ghat Industrial Area, Bangladesh, by Using Water Pollution Indices Approach. Appl. Water Sci. 2020, 10, 186. [Google Scholar] [CrossRef]
  12. Wagh, V.M.; Panaskar, D.B.; Mukate, S.V.; Gaikwad, S.K.; Muley, A.A.; Varade, A.M. Health Risk Assessment of Heavy Metal Contamination in Groundwater of Kadava River Basin, Nashik, India. Model. Earth Syst. Environ. 2018, 4, 969–980. [Google Scholar] [CrossRef]
  13. Singh, K.P.; Malik, A.; Sinha, S.; Singh, V.K.; Murthy, R.C. Estimation of Source of Heavy Metal Contamination in Sediments of Gomti River (India) Using Principal Component Analysis. Water. Air Soil Pollut. 2005, 166, 321–341. [Google Scholar] [CrossRef]
  14. Ahmed, S.; Khurshid, S.; Qureshi, F.; Hussain, A.; Bhattacharya, A. Heavy Metals and Geo-Accumulation Index Development for Groundwater of Mathura City, Uttar Pradesh. Desalin. Water Treat. 2019, 138, 291–300. [Google Scholar] [CrossRef]
  15. Loska, K.; Wiechulła, D.; Korus, I. Metal Contamination of Farming Soils Affected by Industry. Environ. Int. 2004, 30, 159–165. [Google Scholar] [CrossRef] [PubMed]
  16. Olivares-Rieumont, S.; De La Rosa, D.; Lima, L.; Graham, D.W.; D’Alessandro, K.; Borroto, J.; Martínez, F.; Sánchez, J. Assessment of Heavy Metal Levels in Almendares River Sediments—Havana City, Cuba. Water Res. 2005, 39, 3945–3953. [Google Scholar] [CrossRef] [PubMed]
  17. Egbueri, J.C. Groundwater Quality Assessment Using Pollution Index of Groundwater (PIG), Ecological Risk Index (ERI) and Hierarchical Cluster Analysis (HCA): A Case Study. Groundw. Sustain. Dev. 2020, 10, 100292. [Google Scholar] [CrossRef]
  18. Fei, J.C.; Min, X.B.; Wang, Z.X.; Pang, Z.H.; Liang, Y.J.; Ke, Y. Health and Ecological Risk Assessment of Heavy Metals Pollution in an Antimony Mining Region: A Case Study from South China. Environ. Sci. Pollut. Res. 2017, 24, 27573–27586. [Google Scholar] [CrossRef]
  19. Lim, H.S.; Lee, J.S.; Chon, H.T.; Sager, M. Heavy Metal Contamination and Health Risk Assessment in the Vicinity of the Abandoned Songcheon Au-Ag Mine in Korea. J. Geochem. Explor. 2008, 96, 223–230. [Google Scholar] [CrossRef]
  20. Wu, B.; Zhang, Y.; Zhang, X.; Cheng, S. Health Risk from Exposure of Organic Pollutants through Drinking Water Consumption in Nanjing, China. Bull. Environ. Contam. Toxicol. 2010, 84, 46–50. [Google Scholar] [CrossRef] [PubMed]
  21. Eyankware, M.O.; Akakuru, O.C. Appraisal of Groundwater to Risk Contamination near an Abandoned Limestone Quarry Pit in Nkalagu, Nigeria, Using Enrichment Factor and Statistical Approaches. Int. J. Energy Water Resour. 2022, 7, 1–19. [Google Scholar] [CrossRef]
  22. Yang, Q.; Zhang, J.; Wang, Y.; Fang, Y.; Martín, J.D. Multivariate Statistical Analysis of Hydrochemical Data for Shallow Ground Water Quality Factor Identification in a Coastal Aquifer. Pol. J. Environ. Stud. 2016, 24, 769–776. [Google Scholar] [CrossRef] [PubMed]
  23. Helstrup, T.; Jørgensen, N.O.; Banoeng-Yakubo, B. Investigation of Hydrochemical Characteristics of Groundwater from the Cretaceous-Eocene Limestone Aquifer in Southern Ghana and Southern Togo Using Hierarchical Cluster Analysis. Hydrogeol. J. 2007, 15, 977–989. [Google Scholar] [CrossRef]
  24. Arslan, H.; Ayyildiz Turan, N. Estimation of Spatial Distribution of Heavy Metals in Groundwater Using Interpolation Methods and Multivariate Statistical Techniques; Its Suitability for Drinking and Irrigation Purposes in the Middle Black Sea Region of Turkey. Environ. Monit. Assess. 2015, 187, 516. [Google Scholar] [CrossRef]
  25. Khalid, S.; Shahid, M.; Natasha; Shah, A.H.; Saeed, F.; Ali, M.; Qaisrani, S.A.; Dumat, C. Heavy Metal Contamination and Exposure Risk Assessment via Drinking Groundwater in Vehari, Pakistan. Environ. Sci. Pollut. Res. 2020, 27, 39852–39864. [Google Scholar] [CrossRef]
  26. Long, X.; Liu, F.; Zhou, X.; Pi, J.; Yin, W.; Li, F.; Huang, S. Chemosphere Estimation of Spatial Distribution and Health Risk by Arsenic and Heavy Metals in Shallow Groundwater around Dongting Lake Plain Using GIS Mapping. Chemosphere 2021, 269, 128698. [Google Scholar] [CrossRef]
  27. Mehrjardi, R.T.; Jahromi, M.Z.; Heidari, A. Spatial Distribution of Groundwater Quality with Geostatistics (Case Study: Yazd-Ardakan Plain). Appl. Sci. 2008, 4, 9–17. [Google Scholar]
  28. Bataillon, C. Le Souf, Étude de Géographie Humaine; Université d’Alger: Alger Ctre, Aljeria, 1955. [Google Scholar]
  29. Côte, M. Si Le Souf m’était Conté: Comment Se Fait et Se Défait Un Paysage; Hannachi, S., Ed.; Média-Plus: Constantine, Algeria, 2006; ISBN 9961-922-42-5. [Google Scholar]
  30. Guendouz, A.; Moulla, A.S.; Edmunds, W.M.; Zouari, K.; Shand, P.; Mamou, A. Hydrogeochemical and Isotopic Evolution of Water in the Complexe Terminal Aquifer in the Algerian Sahara. Hydrogeol. J. 2003, 11, 483–495. [Google Scholar] [CrossRef]
  31. Slimani, R.; Guendouz, A.; Trolard, F.; Souffi Moulla, A.; Hamdi-Aïssa, B.; Bourrié, G. Identification of Dominant Hydrogeochemical Processes for Groundwaters in the Algerian Sahara Supported by Inverse Modeling of Chemical and Isotopic Data. Hydrol. Earth Syst. Sci. 2017, 21, 1669–1691. [Google Scholar] [CrossRef]
  32. Bouchahm, N.; Achour, S. Hydrochimie Des Eaux Souterraines de La Région Orientale Du Sahara Septentrional Algérien—Identification d’un Risque de Fluorose Endémique. La Houille Blanche 2008, 94, 76–82. [Google Scholar] [CrossRef]
  33. Kholladi, M. SIG Pour Le Suivi de La Remontée Des Eaux de La Wilaya d’El Oued Souf. In Proceedings of the Congrès Internationale en Informatique Appliquée CiiA, Bordj Bou Arréridj, Algerie, 19–21 November 2005. [Google Scholar]
  34. Drouiche, A.; Chaab, S.; Khechana, S. Impact Du Deversement Direct Des Eaux Usees et de Drainage Dans La Nappe Libre de l’Oued Souf et Son Influence Sur La Qualite Des Eaux Souterraines. Synthèse Rev. Des Sci. La Technol. 2013, 27, 50–62. [Google Scholar]
  35. Barkat, A.; Bouaicha, F.; Bouteraa, O.; Ata, B.; Balla, D.; Rahal, Z.; Szabó, G. Assessment of Complex Terminal Groundwater Aquifer for Different Use of Oued Souf Valley (Algeria) Using Multivariate Statistical Methods, Geostatistical Modeling, and Water Quality Index. Water 2021, 13, 1609. [Google Scholar] [CrossRef]
  36. Khezzani, B.; Bouchemal, S. Variations in Groundwater Levels and Quality Due to Agricultural Over-Exploitation in an Arid Environment: The Phreatic Aquifer of the Souf Oasis (Algerian Sahara). Environ. Earth Sci. 2018, 77, 142. [Google Scholar] [CrossRef]
  37. Barkat, A.; Bouaicha, F.; Rahal, Z.; Mester, T.; Szabó, G. Evaluation of Climatic Conditions from 1978 to 2020 of Oued Souf Valley (Southern East of Algeria). Landsc. Environ. 2023, 17, 1–10. [Google Scholar]
  38. Messekher, I.; Chabour, N.; Menani, R. Remontée de La Nappe Phréatique Du Souf. Conséquences et Solutions Envisagées. Ann. Univ. Buchar. Geogr. Ser. 2012, LXI, 179–197. [Google Scholar]
  39. Kadri, S.R.; Chaouche, S. La Remontée Des Eaux Dans La Région Du Souf: Une Menace Sur Un Écosystème Oasien. Les Cah. D’emam 2018, 30, 1–20. [Google Scholar] [CrossRef]
  40. Côte, M. Dynamique Urbaine Au Sahara. Rev. Algérienne D’anthropologie Sci. Soc. 1998, 5, 85–92. [Google Scholar] [CrossRef]
  41. Djennane, A. Constat de Situation Dans Des Zones Sud Des Oasis Algériennes. In Les systèmes Agric. Oasiens; Dollé, V., Toutain, G., Eds.; CIHEAM: Montpellier, France, 1990; Volume 11, pp. 29–40. [Google Scholar]
  42. Burri, J.; Burri, J. Vallée Du Souf: Etudes d’assainissement Des Eaux Résiduaires, Pluviales et d’irrigation. In Mesures Complémentaires de Lutte Contre La Remontée de La Nappe Phréatique, Mission II, Rapport; Ministere Des Ressources En Eau Office National De L’assainissement (ONA): Tunis, Tunisia, 2004. [Google Scholar]
  43. Ballais, J.; Côte, M.; Bensaad, A. L’influence de La Géomorphologie Sur Le Comportement de La Nappe Phréatique Du Souf. Ph.D. Thesis, Université de Provence, Marseille, France, 2002. [Google Scholar]
  44. Fabre, J. Introduction à La Géologie Du Sahara Algérien et Des Régions Voisines: La Couverture Phanérozoïque. Vol. 1; Société Nationale d’Édition et de Diffusion: Algiers, Algeria, 1976; ISBN 84-499-2264-X. [Google Scholar]
  45. Nesson, C. L’évolution Des Ressources Hydrauliques Dans Les Oasis Du Bas-Sahara Algérien. GéoProdig Portail D’information Géographique 1975, 17, 7–99. [Google Scholar]
  46. Meziani, A.; Dridi, H. The Aquifer System of the Souf Valley: Algerian Northern Sahara. Eur. J. Sci. Res. 2011, 65, 416–423. [Google Scholar]
  47. Cornet, A. Introduction à l’hydrogéologie Saharienne. Géorg. Phys. Géol. Dyn 1946, 6, 5–72. [Google Scholar]
  48. Gonçalvès, J.; Petersen, J.; Deschamps, P.; Hamelin, B.; Baba-Sy, O. Quantifying the Modern Recharge of the “Fossil” Sahara Aquifers. Geophys. Res. Lett. 2013, 40, 2673–2678. [Google Scholar] [CrossRef]
  49. Guendouz, A.; Michelot, J.L. Chlorine-36 Dating of Deep Groundwater from Northern Sahara. J. Hydrol. 2006, 328, 572–580. [Google Scholar] [CrossRef]
  50. Castany, G. Sedimentary Basin of the Northern Sahara (Algeria, Tunisia). Intercalary Continental and Terminal Complex Aquifers [Confined Groundwater, Multilevel System, Hydrodynamics, Management of Water Resources, and Environment. Bull. Du Bur. Rech. Geol. Min. Sect. 3 Hydrogeol. Geol. L’ingenieur 1982, 2, 127–147. [Google Scholar]
  51. Najah, A. Le Souf Des Oasis.; La Maison des Livres Alger, Ed.; La Maison des Livres Alger: Alger, Algeria, 1970. [Google Scholar]
  52. Dervierux, F. La Nappe Phréatique Du Souf (Région d’El Oued, Algérie)-Etude Du Renouvellement de La Nappe. Terres Eaux OCRS 3trim 1957, 56, 12–39. [Google Scholar]
  53. UNESCO. Etude Des Ressources En Eau de Sahara Septentrional; UNESCO: Paris, France, 1972. [Google Scholar]
  54. Barkat, A.; Bouaicha, F.; Mester, T.; Debabeche, M.; Szabó, G. Assessment of Spatial Distribution and Temporal Variations of the Phreatic Groundwater Level Using Geostatistical Modelling: The Case of Oued Souf Valley—Southern East of Algeria. Water 2022, 14, 1415. [Google Scholar] [CrossRef]
  55. Sajtos, Z.; Herman, P.; Harangi, S.; Baranyai, E. Elemental Analysis of Hungarian Honey Samples and Bee Products by MP-AES Method. Microchem. J. 2019, 149, 103968. [Google Scholar] [CrossRef]
  56. Backman, B.; Bodiš, D.; Lahermo, P.; Rapant, S.; Tarvainen, T. Application of a Groundwater Contamination Index in Finland and Slovakia. Environ. Geol. 1998, 36, 55–64. [Google Scholar] [CrossRef]
  57. Hakanson, L. An Ecological Risk Index for Aquatic Pollution Control.a Sedimentological Approach. Water Res. 1980, 14, 975–1001. [Google Scholar] [CrossRef]
  58. Muller, G. Index of Geoaccumulation in Sediments of the Rhine River. GeoJournal 1969, 2, 108–118. [Google Scholar]
  59. Egbueri, J.C.; Unigwe, C.O. Understanding the Extent of Heavy Metal Pollution in Drinking Water Supplies from Umunya, Nigeria: An Indexical and Statistical Assessment. Anal. Lett. 2020, 53, 2122–2144. [Google Scholar] [CrossRef]
  60. Ukah, B.U.; Ameh, P.D.; Egbueri, J.C.; Unigwe, C.O.; Ubido, O.E. Impact of Effluent-Derived Heavy Metals on the Groundwater Quality in Ajao Industrial Area, Nigeria: An Assessment Using Entropy Water Quality Index (EWQI). Int. J. Energy Water Resour. 2020, 4, 231–244. [Google Scholar] [CrossRef]
  61. Adimalla, N.; Wang, H. Distribution, Contamination, and Health Risk Assessment of Heavy Metals in Surface Soils from Northern Telangana, India. Arab. J. Geosci. 2018, 11, 684. [Google Scholar] [CrossRef]
  62. Sinex, S.A.; Helz, G.R. Regional Geochemistry of Trace Elements in Chesapeake Bay Sediments. Environ. Geol. 1981, 3, 315–323. [Google Scholar] [CrossRef]
  63. Bhutiani, R.; Kulkarni, D.B.; Khanna, D.R.; Gautam, A. Geochemical Distribution and Environmental Risk Assessment of Heavy Metals in Groundwater of an Industrial Area and Its Surroundings, Haridwar, India. Energy Ecol. Environ. 2017, 2, 155–167. [Google Scholar] [CrossRef]
  64. Hakima, Z.; Mohamed, M.; Aziza, M.; Mehdi, M.; Meryem, E.B.; Bendahhou, Z.; Jean-Francois, B. Environmental and Ecological Risk of Heavy Metals in the Marine Sediment from Dakhla Bay, Morocco. Environ. Sci. Pollut. Res. 2017, 24, 7970–7981. [Google Scholar] [CrossRef]
  65. Zhang, J.; Liu, C.L. Riverine Composition and Estuarine Geochemistry of Particulate Metals in China—Weathering Features, Anthropogenic Impact and Chemical Fluxes. Estuar. Coast. Shelf Sci. 2002, 54, 1051–1070. [Google Scholar] [CrossRef]
  66. Fang, H.; Wang, X.; Xia, D.; Zhu, J.; Yu, W.; Su, Y.; Zeng, J.; Zhang, Y.; Lin, X.; Lei, Y.; et al. Improvement of Ecological Risk Considering Heavy Metal in Soil and Groundwater Surrounding Electroplating Factories. Processes 2022, 10, 1267. [Google Scholar] [CrossRef]
  67. Tomlinson, D.L.; Wilson, J.G.; Harris, C.R.; Jeffrey, D.W. Problems in the Assessment of Heavy-Metal Levels in Estuaries and the Formation of a Pollution Index. Helgoländer Meeresunters. 1980, 33, 566–575. [Google Scholar] [CrossRef]
  68. Rezaei, H.; Zarei, A.; Kamarehie, B. Levels, Distributions and Health Risk Assessment of Lead, Cadmium and Arsenic Found in Drinking Groundwater of Dehgolan’ s Villages, Iran. Toxicol. Environ. Health Sci. 2019, 11, 54–62. [Google Scholar] [CrossRef]
  69. USEPA (US Environmental Protection Agency). Risk Assessment Guidance for Superfund Volume 1. Human Health Evaluation Manual (Part E, Supplemental Guidance for Dermal Risk Assessment); EPA/540/R/99/005; Office of Superfund Remediation and Technology Innovation: Washington, DC, USA, 2004. [Google Scholar]
  70. USEPA (US Environmental Protection Agency). Guidelines for Carcinogenic Risk Assessment; Risk Assessment Forum: Washington, DC, USA, 2006. [Google Scholar]
  71. USEPA (US Environmental Protection Agency). Guidance for Performing Aggregate Exposure and Risk Assessments; Office of Pesticide Programs: Washington, DC, USA, 1999. [Google Scholar]
  72. Qiu, H.; Gui, H. Human and Ecological Risk Assessment: An International Heavy Metals Contamination in Shallow Groundwater of a Coal-Mining District and a Probabilistic Assessment of Its Human Health Risk. Hum. Ecol. Risk Assess. Int. J. 2019, 25, 548–563. [Google Scholar] [CrossRef]
  73. Murray, F.J. A Human Health Risk Assessment of Boron (Boric Acid and Borax) in Drinking Water. Regul. Toxicol. Pharmacol. 1995, 22, 221–230. [Google Scholar] [CrossRef] [PubMed]
  74. Ganiyu, S.A.; Oyadeyi, A.T.; Adeyemi, A.A. Assessment of Heavy Metals Contamination and Associated Risks in Shallow Groundwater Sources from Three Different Residential Areas within Ibadan Metropolis, Southwest Nigeria. Appl. Water Sci. 2021, 11, 81. [Google Scholar] [CrossRef]
  75. Giri, S.; Singh, A.K. Human Health Risk Assessment via Drinking Water Pathway Due to Metal Contamination in the Groundwater of Subarnarekha River Basin, India. Environ. Monit. Assess. 2015, 187, 63. [Google Scholar] [CrossRef]
  76. Nematollahi, M.J.; Dehdaran, S.; Moore, F.; Keshavarzi, B. Potentially Toxic Elements and Polycyclic Aromatic Hydrocarbons in Street Dust of Yazd, a Central Capital City in Iran: Contamination Level, Source Identification, and Ecological—Health Risk Assessment; Springer: Dordrecht, The Netherlands, 2021; Volume 43, ISBN 0123456789. [Google Scholar]
  77. Paustenbach, D. Human and Ecological Risk Assessment: Theory and Practice (Wiley Classics Library); John Wiley and Sons: New York, NY, USA, 2015; ISBN 0-471-14747-8. [Google Scholar]
  78. Charizopoulos, N.; Zagana, E.; Psilovikos, A. Assessment of Natural and Anthropogenic Impacts in Groundwater, Utilizing Multivariate Statistical Analysis and Inverse Distance Weighted Interpolation Modeling: The Case of a Scopia Basin (Central Greece). Environ. Earth Sci. 2018, 77, 380. [Google Scholar] [CrossRef]
  79. Loh, Y.S.A.; Akurugu, B.A.; Manu, E.; Aliou, A.S. Assessment of Groundwater Quality and the Main Controls on Its Hydrochemistry in Some Voltaian and Basement Aquifers, Northern Ghana. Groundw. Sustain. Dev. 2020, 10, 100296. [Google Scholar] [CrossRef]
  80. Ren, X.; Li, P.; He, X.; Su, F.; Elumalai, V. Hydrogeochemical Processes Affecting Groundwater Chemistry in the Central Part of the Guanzhong Basin, China. Arch. Environ. Contam. Toxicol. 2021, 80, 74–91. [Google Scholar] [CrossRef]
  81. Carrera-Villacrés, D.; Guevara-García, P.; Hidalgo-Hidalgo, A.; Teresa-Vivero, M.; Maya-Carrillo, M. Removal of Physical Information Chemistry of Spa That Is Utilizing Geothermal Water in Ecuador. Procedia Earth Planet. Sci. 2015, 15, 367–373. [Google Scholar] [CrossRef]
  82. Rusydi, A.F. Correlation between Conductivity and Total Dissolved Solid in Various Type of Water: A Review. IOP Conf. Ser. Earth Environ. Sci. 2018, 118, 012019. [Google Scholar] [CrossRef]
  83. Ahmedat, C.; Dabi, S.; Zahraoui, M.; El Hassani, I.E.E.A. Spatial Distribution of Stream Sediment Pollution by Toxic Trace Elements at Tourtit and Ichoumellal Abandoned Mining Areas (Central Morocco). Arab. J. Geosci. 2018, 11, 55. [Google Scholar] [CrossRef]
  84. Batayneh, A.T. Toxic (Aluminum, Beryllium, Boron, Chromium and Zinc) in Groundwater: Health Risk Assessment. Int. J. Environ. Sci. Technol. 2012, 9, 153–162. [Google Scholar] [CrossRef]
  85. Mgbenu, C.N.; Egbueri, J.C. The Hydrogeochemical Signatures, Quality Indices and Health Risk Assessment of Water Resources in Umunya District, Southeast Nigeria. Appl. Water Sci. 2019, 9, 22. [Google Scholar] [CrossRef]
  86. Khan, M.M.A.; Umar, R.; Lateh, H. Study of Trace Elements in Groundwater of Western Uttar Pradesh, India. Sci. Res. Essays 2010, 5, 3175–3182. [Google Scholar]
  87. Mondal, N.C.; Singh, V.S.; Puranik, S.C.; Singh, V.P. Trace Element Concentration in Groundwater of Pesarlanka Island, Krishna Delta, India. Environ. Monit. Assess. 2010, 163, 215–227. [Google Scholar] [CrossRef]
  88. White, A.F.; Benson, S.M.; Yee, A.W.; Wollenberg, H.A., Jr.; Flexser, S. Groundwater Contamination at the Kesterson Reservoir, California 2. Geochemical Parameters Influencing Selenium Mobility. Water Resour. Res. 1991, 27, 1085–1098. [Google Scholar] [CrossRef]
  89. Miller, R.W.; Donahue, R.L. Soils in Our Environment; Prentice Hall: Upper Saddle River, NJ, USA, 1995. [Google Scholar]
  90. World Health Organization. Guidelines for Drinking-Water Quality: Volume 1: Recommendations; World Health Organization, Ed.; World Health Organization: Geneva, Switzerland, 1984. [Google Scholar]
  91. USEPA (US Environmental Protection Agency). Guidelines for Carcinogen Risk Assessment; Risk Assessment Forum: Washington, DC, USA, 2005. [Google Scholar]
  92. Jiang, Z.; Xu, N.; Liu, B.; Zhou, L.; Wang, J.; Wang, C.; Dai, B.; Xiong, W. Metal Concentrations and Risk Assessment in Water, Sediment and Economic Fish Species with Various Habitat Preferences and Trophic Guilds from Lake Caizi, Southeast China. Ecotoxicol. Environ. Saf. 2018, 157, 1–8. [Google Scholar] [CrossRef]
  93. Zhou, M.; Wu, Q.; Wu, H.; Liu, J.; Ning, Y.; Xie, S.; Huang, W.; Bi, X. Enrichment of Trace Elements in Red Swamp Crayfish: Influences of Region and Production Method, and Human Health Risk Assessment. Aquaculture 2021, 535, 736366. [Google Scholar] [CrossRef]
  94. Rattan, R.K.; Datta, S.P.; Chhonkar, P.K.; Suribabu, K.; Singh, A.K. Long-Term Impact of Irrigation with Sewage Effluents on Heavy Metal Content in Soils, Crops and Groundwater—A Case Study. Agric. Ecosyst. Environ. 2005, 109, 310–322. [Google Scholar] [CrossRef]
  95. Nouri, J.; Mahvi, A.H.; Jahed, G.R.; Babaei, A.A. Regional Distribution Pattern of Groundwater Heavy Metals Resulting from Agricultural Activities. Environ. Geol. 2008, 55, 1337–1343. [Google Scholar] [CrossRef]
  96. Goel, P.K. Water Pollution Causes Effect and Control; New Age International Publishers: Delhi, India, 2006. [Google Scholar]
  97. Government of Canada Water Talk—Strontium in Drinking Water. Available online: https://www.canada.ca/en/health-canada/services/publications/healthy-living/water-talk-strontium.html (accessed on 7 July 2023).
  98. Négrel, P.; Petelet-Giraud, E.; Widory, D. Strontium Isotope Geochemistry of Alluvial Groundwater: A Tracer for Groundwater Resources Characterisation. Hydrol. Earth Syst. Sci. 2004, 8, 959–972. [Google Scholar] [CrossRef]
  99. Frankowski, M.; Zioła-Frankowska, A.; Siepak, J. Speciation of Aluminium Fluoride Complexes and Al3+ in Soils from the Vicinity of an Aluminium Smelter Plant by Hyphenated High Performance Ion Chromatography Flame Atomic Absorption Spectrometry Technique. Microchem. J. 2010, 95, 366–372. [Google Scholar] [CrossRef]
  100. Frankowski, M. Simultaneous Determination of Aluminium, Aluminium Fluoride Complexes and Iron in Groundwater Samples by New HPLC-UVVIS Method. Microchem. J. 2012, 101, 80–86. [Google Scholar] [CrossRef]
  101. Fernández-Luqueño, F.; López-Valdez, F.; Gamero-Melo, P.; Luna-Suárez, S.; Aguilera-González, E.; Martínez, A.; García-Guillermo, M.; Hernández-Martínez, G.; Herrera-Mendoza, R.; Álvarez-Garza, M.; et al. Heavy Metal Pollution in Drinking Water—A Global Risk for Human Health: A Review. Afr. J. Environ. Sci. Technol. 2013, 7, 567–584. [Google Scholar]
  102. Shakerkhatibi, M.; Mosaferi, M.; Pourakbar, M.; Ahmadnejad, M.; Safavi, N.; Banitorab, F. Comprehensive Investigation of Groundwater Quality in the North-West of Iran: Physicochemical and Heavy Metal Analysis. Groundw. Sustain. Dev. 2019, 8, 156–168. [Google Scholar] [CrossRef]
  103. Devic, G.; Djordjevic, D.; Sakan, S. Natural and Anthropogenic Factors Affecting the Groundwater Quality in Serbia. Sci. Total Environ. 2014, 468–469, 933–942. [Google Scholar] [CrossRef]
  104. L.W. Diamond, R.E.S. Sources of Manganese in the Environment. Environ. Geochem. Health 1989, 11, 17–27. [Google Scholar]
  105. Kumar, A.; Cabral-Pinto, M.; Kumar, A.; Kumar, M.; Dinis, P.A. Estimation of Risk to the Eco-Environment and Human Health of Using Heavy Metals in the Uttarakhand Himalaya, India. Appl. Sci. 2020, 10, 7078. [Google Scholar] [CrossRef]
  106. Struzyńska, L. A Glutamatergic Component of Lead Toxicity in Adult Brain: The Role of Astrocytic Glutamate Transporters. Neurochem. Int. 2009, 55, 151–156. [Google Scholar] [CrossRef]
  107. Butterworth, R.F. Metal Toxicity, Liver Disease and Neurodegeneration. Neurotox. Res. 2010, 18, 100–105. [Google Scholar] [CrossRef]
  108. Salonen, J.T.; Nyyssönen, K.; Korpela, H.; Tuomilehto, J.; Seppänen, R.; Salonen, R. High Stored Iron Levels Are Associated with Excess Risk of Myocardial Infarction in Eastern Finnish Men. Circulation 1992, 86, 803–811. [Google Scholar] [CrossRef]
  109. Tuomainen, T.P.; Punnonen, K.; Nyyssönen, K.; Salonen, J.T. Association between Body Iron Stores and the Risk of Acute Myocardial Infarction in Men. Circulation 1998, 97, 1461–1466. [Google Scholar] [CrossRef]
  110. Salonen, J.T.; Tuomainen, T.P.; Nyyssönen, K.; Lakka, H.M.; Punnonen, K. Relation between Iron Stores and Non-Insulin Dependent Diabetes in Men: Case-Control Study. Br. Med. J. 1998, 317, 727. [Google Scholar] [CrossRef]
  111. Tuomainen, T.; Nyyssônen, K.; Salonen, R.; Tervahauta, A.; Korpela, H.; Lakka, T.; Kaplan, G.; Salonen, J. Body Iron Stores Are Associated with Serum Insulin and Blood Glucose Concentrations. Diabetes Care 1997, 20, 426–428. [Google Scholar] [CrossRef]
  112. Rahman, M.F.; Ali, M.A.; Chowdhury, A.I.A.; Ravenscroft, P. Manganese in Groundwater in South Asia Needs Attention. ACS ES T Water 2023, 3, 1425–1428. [Google Scholar] [CrossRef]
  113. Li, L.; Wang, Y.; Gu, H.; Lu, L.; Li, L.; Pang, J.; Chen, F. The Genesis Mechanism and Health Risk Assessment of High Boron Water in the Zhaxikang Geothermal Area, South Tibet. Water 2022, 14, 3243. [Google Scholar] [CrossRef]
  114. McGregor, D.B.; Baan, R.A.; Partensky, C.; Rice, J.M.; Wilbourn, J.D. Evaluation of the Carcinogenic Risks to Humans Associated with Surgical Implants and Other Foreign Bodies—A Report of an IARC Monographs Programme Meeting. Eur. J. Cancer 2000, 36, 307–313. [Google Scholar] [CrossRef]
  115. Seilkop, S.K.; Oller, A.R. Respiratory Cancer Risks Associated with Low-Level Nickel Exposure: An Integrated Assessment Based on Animal, Epidemiological, and Mechanistic Data. Regul. Toxicol. Pharmacol. 2003, 37, 173–190. [Google Scholar] [CrossRef] [PubMed]
  116. Ren, Y.S.; Ilyas, M.; Xu, R.Z.; Ahmad, W.; Wang, R. Concentrations of Lead in Groundwater and Human Blood in the Population of Palosai, a Rural Area in Pakistan: Human Exposure and Risk Assessment. Adsorpt. Sci. Technol. 2022, 2022, 8341279. [Google Scholar] [CrossRef]
  117. Khandare, A.L.; Validandi, V.; Rajendran, A.; Singh, T.G.; Thingnganing, L.; Kurella, S.; Nagaraju, R.; Dheeravath, S.; Vaddi, N.; Kommu, S.; et al. Health Risk Assessment of Heavy Metals and Strontium in Groundwater Used for Drinking and Cooking in 58 Villages of Prakasam District, Andhra Pradesh, India. Environ. Geochem. Health 2020, 42, 3675–3701. [Google Scholar] [CrossRef]
  118. Hart, K.A.; Kennedy, G.W.; Sterling, S.M. Distribution, Drivers, and Threats of Aluminum in Groundwater in Nova Scotia, Canada. Water 2021, 13, 1578. [Google Scholar] [CrossRef]
Figure 1. Map of the study area’s geography, land use/cover, and monitoring well distribution.
Hydrology 10 00201 g001
Figure 2. (A) Geological map of the study area. (B) Geological cross section of the study area.
Hydrology 10 00201 g002
Figure 3. An altered hydrogeological section that traverses the research region displays the three aquifers [53].
Hydrology 10 00201 g003
Figure 4. Spatial distribution map of the phreatic groundwater static level based on the data obtained in the campaign of 2021 [54].
Hydrology 10 00201 g004
Figure 5. Methodological flowchart for heavy metal analysis in the Phreatic aquifer of the Oued Souf Valley using various analytical approaches.
Hydrology 10 00201 g005
Figure 6. IDW spatial distribution maps: (A) aluminum—Al, (B) iron—Fe, (C) manganese—Mn, (D) boron—B, (E) barium—Ba, (F) bismuth—Bi.
Hydrology 10 00201 g006
Figure 7. IWD spatial distribution maps: (A) chromium—Cr, (B) copper—Cu, (C) nickel—Ni, (D) lead—Pb, (E) strontium—Sr, (F) zinc—Zn.
Hydrology 10 00201 g007
Figure 8. Dendrogram of hierarchical cluster analysis.
Hydrology 10 00201 g008
Figure 9. Cluster map of the clustered groups based on the phreatic groundwater samples.
Hydrology 10 00201 g009
Figure 10. (A) Box plot of contamination factors. (B) Scatter plot of contamination degree.
Hydrology 10 00201 g010
Figure 11. (A) Box plot of geoaccumulation index. (B) Box plot of enrichment factors.
Hydrology 10 00201 g011
Figure 12. (A) Box plot of ecological risk index. (B) Scatter plot of the potential ecological index.
Hydrology 10 00201 g012
Figure 13. The results of health risk assessment: (A) Box plot of Hazard Quotients (HQs) of eleven heavy metals through ingestion exposure of adults. (B) Box plot of Hazard Quotients (HQs) of eleven heavy metals through ingestion exposure of children. (C) Hazard Index (HI) values of eleven heavy metals for both cases.
Hydrology 10 00201 g013
Table 1. MP-AES conditions I.
Common Conditions
Replicates3
Pump speed15 rpm
Uptake time15 s
Rinse time30 s
Stabilization time10 s
Table 2. MP-AES conditions II.
ElementWavelength
(nm)
Read Time (s)Nebulizer Pressure (kPa)
Al394.4013240
B249.7723100
Ba455.4033240
Bi306.7723140
Ca430.2531140
Cd228.8023140
Co340.5123240
Cr425.4333240
Cu324.7541240
Fe371.9933120
K776.8971200
Li610.3651240
Mg383.8293240
Mn403.0763240
Na589.592180
Ni352.4543240
Pb405.7815240
Sr407.7711200
Zn213.8575140
Table 3. Statistical summary of the analyzed heavy metals from the phreatic groundwater aquifer of the Oued Souf Valley and its comparison with WHO standards.
VariablesMeanSDCVMinMedianMaxWHO 2008
T (°C) 27.8501.7200.06225.00027.80031.400-
pH7.3070.5150.0706.7807.1108.5706.5–8.5
EC (µS/cm)4035.714858.0180.2133100372562001000
Al (mg/L)0.3090.0830.2690.2200.2900.5200.2
Fe (mg/L)0.2140.0920.4290.1100.1850.4000.3
Mn (mg/L)0.4400.1110.2530.3000.4000.7100.5
B (mg/L)0.6260.4260.6810.1920.4541.4080.5
Ba (mg/L)0.0150.0090.6280.0040.0110.0340.7
Bi (mg/L)0.1440.1080.7530.0000.1460.282-
Cd (mg/L)<Lod<Lod<Lod<Lod<Lod<Lod0.003
Co (mg/L)<Lod<Lod<Lod<Lod<Lod<Lod-
Cr (mg/L)0.00810.0101.2310.0000.0000.0230.05
Cu (mg/L)0.0040.0071.6120.0000.0000.0201
Li (mg/L)<Lod<Lod<Lod<Lod<Lod<Lod-
Ni (mg/L)0.0090.0070.8320.0000.0070.0240.02
Pb (mg/L)0.0050.0132.7110.0000.0000.0450.01
Sr (mg/L)7.0602.4370.3451.7747.7629.939-
Zn (mg/L)0.00750.0121.6130.0000.0000.0373
Table 4. Best-fitted interpolation models and cross-validation for IDW of heavy metals of the phreatic groundwater aquifer.
ParametersCross-ValidationK = 1K = 2K = 3Optimized ErrorsOptimized K Value
AlMPE0.001480.001840.00310.00292.86922
RMSPE0.08350.080320.079480.07946
FeMPE0.00106−0.00089−0.0016−0.000171.567
RMSPE0.104170.103910.10480.10375
MnMPE0.017660.023160.026140.017661
RMSPE0.12780.14130.152720.1278
BMPE0.03560.03730.031020.03561
RMSPE0.53380.56670.591560.5338
BaMPE−0.00016−0.00058−0.00091−0.000161
RMSPE0.011520.012120.01270.01152
BiMPE−0.000320.001960.00393−0.000321
RMSPE0.146730.157960.166720.14673
CrMPE0.001040.001830.002340.001041
RMSPE0.011790.012610.013370.01179
CuMPE0.00060.000730.000720.00061
RMSPE0.009750.010150.010440.00975
NiMPE0.001090.001870.002350.001091
RMSPE0.00790.00850.009050.0079
PbMPE−0.00027−0.00083−0.00122−0.0015717.46576
RMSPE0.018060.018020.0180.018
SrMPE−0.09789−0.2642−0.39167−0.097891
RMSPE2.759492.928143.098372.75949
ZnMPE0.000920.001810.002470.001651.79839
RMSPE0.012260.012040.012270.01203
Table 5. Statistical summary of the generated groups from HCA based on the analyzed phreatic groundwater samples.
Heavy Metals Group 1 (n = 3) Group 2 (n = 11)
MeanMedianMinimumMaximumMeanMedianMinimumMaximum
Al0.300.30.280.330.310.290.220.52
Fe0.150.150.120.170.230.230.110.40
Mn0.370.370.350.380.460.420.300.71
B0.240.2460.190.270.730.5790.311.41
Ba0.010.0080.010.010.020.0160.000.03
Bi0.210.1880.170.280.120.10.000.27
Cr0.020.0220.020.020.0000.000.02
Cu0.0000.000.000.010.0020.000.02
Ni0.020.0190.020.020.010.0060.000.01
Pb0.0000.000.000.0100.000.05
Sr3.153.6421.774.028.138.1586.199.94
Zn0.030.030.010.040.000.000.000.02
Table 6. Statistical summary of the computed chronic daily intake (CDI) results for adults and children of Oued Souf.
Cases Adults Children
Chronic Daily IntakeMeanStandard DeviationMinimumMedianMaximumMeanStandard DeviationMinimumMedianMaximum
Al0.008470.002280.006030.007950.014250.019770.005310.014060.018540.03324
Fe0.005870.002520.003010.005070.010960.013700.005880.007030.011830.02557
Mn0.012050.003050.008220.010960.019450.028130.007110.019180.025570.04539
B0.017140.011680.005260.012420.038580.040000.027260.012270.028990.09001
Ba0.000400.000250.000110.000290.000930.000930.000580.000260.000670.00217
Cr0.000220.000270.000000.000000.000630.000520.000640.000000.000000.00147
Cu0.000120.000190.000000.000000.000550.000280.000450.000000.000000.00128
Ni0.000240.000200.000000.000180.000660.000570.000470.000000.000420.00153
Pb0.000130.000360.000000.000000.001230.000310.000830.000000.000000.00288
Sr0.193420.066760.048600.212660.272300.451310.155760.113410.496200.63537
Zn0.000210.000330.000000.000000.001010.000480.000770.000000.000000.00237
Disclaimer/Publisher’s Note: The statements, opinions and data contained in all publications are solely those of the individual author(s) and contributor(s) and not of MDPI and/or the editor(s). MDPI and/or the editor(s) disclaim responsibility for any injury to people or property resulting from any ideas, methods, instructions or products referred to in the content.

