Abstract
Coastal areas are dynamic and complex systems exposed to waves, high tides, and storm surges. Often, these areas are densely populated and have essential socio-economic values for the region and country. Any changes or disruptions can cause a tremendous social burden. Coastal Vulnerability Index (CVI) is one of the most used and straightforward methods to assess coastal vulnerability. This paper aims to analyse and summarise the current state of published coastal vulnerability indices. The analysis seeks to develop a regional vulnerability index for the eastern Adriatic coast, specifically for the Istrian peninsula. A total of 18 published papers were reviewed. A detailed survey was performed on three groups of variables that represent (a) the physical features of the coast, (b) the amount of influence of wave energy on the coast, and (c) exposed socio-economic factors. While choosing Physical and ecological variables is relatively straightforward, choosing Socio-economic variables is particularly challenging. The number of variables differs significantly from one author to another. As a result of the huge variety of global coastal characteristics and different research approaches, there is no universal CVI. Therefore, analysed indices are not suited for the calculation of the vulnerability of the Istrian coast without modification. A 5 × 5 m cell dimension was proposed as the most suitable for analysing the physical vulnerability of the Croatian coast of Istria.
1. Introduction
Coastal areas are dynamic and complex systems. Coasts and their ecosystems worldwide are exposed to waves under extreme events, high tides and storm surges [1], tsunamis, river flooding, frequent gullying [2], and shoreline erosion [3,4]. Lower coastal areas, river estuaries, and islands are the most endangered [5,6]. The sea-level change includes global [7], regional, and local effects, mainly related to the glacio-isostatic adjustment [8,9], and/or tectonic effects [9,10,11]. As a result of climate change and subsequent changes in sea level, people and critical infrastructure in coastal areas have become more exposed to coastal hazards [12]. According to Cazenave et al. [13], the global sea level has been changing at a mean rate of +3.1 ± 0.3 mm/year for the last 25 years, and it is showing signs of acceleration at a rate of 0.10 mm/yr.
Along with submerging of coastal areas, sea-level rise increases coastal erosion and causes seawater intrusion, which leads to the salinisation of soil [5,6] and coastal aquifers [14,15,16,17]. It can cause the loss of valuable land, and difficulties in maritime transport, representing a tremendous social burden. Moreover, coastal areas are often the most densely populated areas. These areas are essential for socio-economic valorisation, for which any change could have catastrophic consequences. Current estimations indicate that one billion people live in coastal areas located 10 m above the present height tides, out of which 630 million live in areas below projected flood levels for the end of the 21st century [18].
As part of the Mediterranean Basin, the Adriatic Sea was exposed to numerous changes in relative sea level (RSL) in the past. Certainly, the most significant impact on the Adriatic and, thus, the Istrian coast was induced by Pleistocene-Holocene transgression [19,20]. Nonetheless, numerous Holocene fluctuations, including the past 2000 years that influenced Northern Adriatic, have been proven on the basis of geomorphological, biological, and archaeological indicators [2,10,21,22,23].
Underwater archaeological sites are direct evidence that the coastal area of the Istrian peninsula has attracted human population for well over three thousand years [24] and has been influenced by sea-level rise. As can be observed in Figure 1, there are more than 25 partially or fully submerged archaeological sites and areas. Most of them are located along the western coast of Istria. Due to the favourable geographical location of Istria relative to the Top 5 Croatian tourist-generating revenues counties and its accommodation capacity, Istria is a significant generator of state budget revenues [25]. Sea-level rise could affect 85 Istrian municipalities within the coastal area, as well as tourism, transport, shipbuilding, fishing industry, and agriculture. There are numerous cities and settlements along the Croatian coast whose main economic activities are related to the exploitation of coastal resources [26], especially on the Istrian peninsula. As such, they are highly exposed and endangered to the potential sea-level rise. In the case of a 1 m sea-level rise 54,910 people in 302 coastal settlements of Croatia will be flooded [27]. According to Orlić and Pasarić [28], the maximum expected sea-level rise in the Adriatic by the end of the 21st century is 62 ± 14 cm. Although the Eastern Adriatic coast can be considered resilient to sea-level rise due to the prevalence of carbonate rocky coast and general steepness, certain areas are highly vulnerable to the influence of sea-level rise [26].
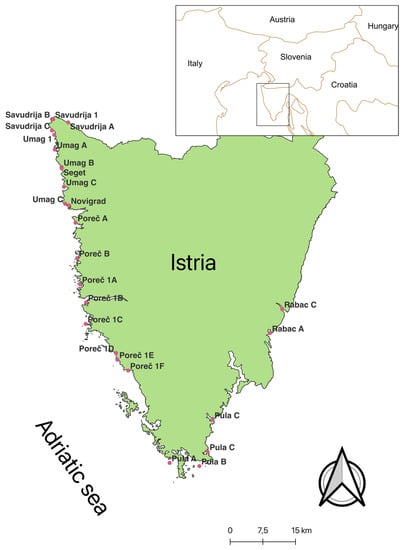
Figure 1.
Fully and partially submerged archaeological sites and zones—Istria peninsula. Source: Adapted from Cultural goods register (https://registar.kulturnadobra.hr/#/ accessed on 29 December 2023).
To create sustainable coastal management strategies and plans, vulnerable elements of both natural and human systems must be identified, defined, and described. Coastal vulnerability is considered as the ability of the coastal area to cope with the adverse effects of natural hazards [29]. The vulnerability of coastal areas is associated with both natural and social hazards, sometimes with a combination of both. Therefore, various hazard dimensions must be considered to effectively carry out a vulnerability assessment [30]. Coastal Vulnerability Index (CVI) is one of the most used and straightforward methods to assess coastal vulnerability to sea-level rise [5]. The majority of the studies using CVI have categorised the vulnerability of different coastal environments, using necessary information on coastal geomorphology, rate of sea-level rise, past shoreline evolution, coastal slope, and mean tidal range [5]. Over the years, a considerable number of methodologies have been developed, e.g., Kantamaneni [31] and Ramieri et al. [32].
Besides being one of the Climate Change Adjustment Strategy goals, no systematic vulnerability assessment has been developed for the Croatian coast so far. This paper aims to analyse and provide state of the art on coastal vulnerability indices. Furthermore, the 18 selected published indexes aim to help in the further selection of physical variables for the analysis of the regional vulnerability index, which could be applied to the eastern Adriatic coast, particularly to the Istrian peninsula.
2. Coastal Vulnerability Index (CVI) Methodology Overview
A considerable number of methodologies for assessing coastal vulnerability have been developed, which can be divided into four groups: 1. Dynamic computer models, 2. GIS-based decision support systems, 3. Indicator-based methodology, and 4. Index-based methodology [31,32].
Dynamic computer models are used to analyse and map the vulnerability and risk of coastal areas. GIS-based decision support systems are tools for the analysis of physical features, transforming huge sets of data into maps and creating risk maps. Measuring coastal vulnerability and intensity of exposure of coastal areas to hazards is conducted by Indicator based methodology [31,32].
Index-based methods are quantitative or semi-quantitative vulnerability assessments where indices classify different vulnerability variables. The process is not fully transparent because it is impossible to determine whether values/ranks are logarithmic or linear or to determine how variables should be combined or weighted. In addition, this method uses predefined values/ranks of variables, making it not fully transparent/clear [31]. The results are usually shown on a vulnerability map on multiple scales, which allows the identification of the most vulnerable regions and locations [31,33]. The coastal vulnerability index is easily understood by non-specialists [34].
Over the years, several coastal vulnerability indices have been developed to assess and quantify the interaction between humans and the sea [35] in a narrow coastal area. Coastal vulnerability is explained through three characteristics: physical, ecological, and human [34]. Coastal vulnerability indices generally are divided into three groups (1) Coastal characteristic, (2) Coastal forcing, and (3) Socio-economic [35]. Choosing the correct coastal variables is particularly challenging, and the number of variables differs significantly from one author to another. For example, to assess coastal dune vulnerability, Williams et al. [36] used around 54 variables, while Quelennec [37] used merely three variables for the European high-risk coastal areas [34]. Choosing physical and ecological variables is relatively straightforward, while choosing socio-economic variables tends to be culturally dependent [5].
To calculate the risk level that sea-level rise caused by greenhouse climate warming might have on the population, ports, cities, and wetlands in low-lying areas of the United States coastline, Gornitz [5] developed the first coastal vulnerability index using seven Physical coastal characteristics variables: 1. relief, 2. rock type (relative resistance to erosion), 3. landform, 4. mean tide range, 5. maximum wave height, 6. relative sea-level change, and 7. shoreline displacement. Coastal areas are not only defined by Physical coastal characteristics and Coastal forcing but also by Socio-economic characteristics. Including variables, such as storm frequencies, intensities, surges, and population as additional risk factors, in the coastal vulnerability index can significantly influence the outcome of vulnerability calculation [5]. According to Mclaughlin and Cooper’s [35] multidisciplinary approach to coastal vulnerability, the calculation of CVI provides insight into the complex correlation between Physical coastal characteristics, Coastal forcing, and Socio-economic characteristics.
Szlafsztein and Sterr [38] were among the first who included socio-economic characteristics alongside Physical coastal characteristics, bringing population and income data as additional risk factors into the formula as suggested by Gornitz [5]. Since not all characteristics are equally significant, weight coefficients were used to aggregate indicators. Additionally, McLaughlin et al. [39] explore the possibility of incorporating socio-economic variables into the coastal vulnerability index on the spatial multi-scale. Based on the previous findings, Mclaughlin and Cooper [35] developed a coastal vulnerability index with three equally represented variables: Physical coastal characteristics (resilience and susceptibility), Coastal forcing, and Socio-economic variables. Furthermore, Mclaughlin and Cooper [35] emphasise the importance of spatial scale (national, regional, local) in developing coastal vulnerability indices. While general index architecture is applicable, the selection of variables must be considered the scale of the application and, above all, data availability.
Remote sensing and GIS tools have often been used in CVI research. In order to create a vulnerability index of the KwaZulu-Natal Coast based on physical parameters [40], remote sensing data were used. The developed method is based on assessing physical vulnerability a priori, and social, economic, and ecological components were assessed a posteriori. Mani Murali et al. [41] calculated the coastal vulnerability index of the Pondicherry Coast using the hierarchical analytical process (AHP) where the Physical Vulnerability Index (PVI) and Socio-economic Vulnerability Index (SVI) have an equal impact. In contrast to Hamm-Klose and Thieler’s [42] methodology, Kantamaneni et al. [43] integrated two indices to develop the Combined Coastal Vulnerability Index (CCVI). CCVI comprises Physical Coastal Vulnerability Index (PCVI) based on Palmer et al. [40] methodology and the Fiscal Coastal Vulnerability Index (FCVI) based on Kantamaneni [31] methodology. Kantamaneni et al. [43] argue that the proposed CCVI provides a basis for coastal planning and can be used on local, regional, and international scales.
To assess the coastal vulnerability of the Peloponnese peninsula in Greece, Tragaki et al. [44], used two separate vulnerability indices, physical and social, similar to Kantamaneni et al. [43]. The Applied Coastal Vulnerability Index (CVI) used in that study is based on Hammar-Klose and Thieler’s [42] approach with seven variables. While six out of seven variables of CVI can be quantitatively expressed, Social Vulnerability Index (SVI) uses different units and scales, which must be standardised before multivariate analysis can be conducted. The most recent methodology by Pantusa et al. [45] proposed a modified Hammar-Klose and Thieler’s [42] approach, which represents conditions suitable for the Mediterranean coast and allows users to evaluate the ability of “natural systems” to dissipate the wave energy. Six Hammar-Klose and Thieler [42] variables were supplemented with four additional variables: emerged beach width, dune width, width of vegetation behind the beach, and Posidonia oceanica. All ten variables were divided into three typological groups: geological, physical process, and vegetation.
As previously mentioned, coastal vulnerability assessments for the Croatian coast are scarce. Early research on the coastal vulnerability of the Croatian coast mainly focused on physical vulnerability and erosion [46] or was extremely local [47,48]. Ružić et al. [47] developed/adapted a vulnerability assessment methodology for the Croatian Eastern Adriatic Coast (CEAC), which is characterised by quite complex geomorphology. The used methodology is index-based, as proposed by Gornitz [5]. Due to a relatively small part of the coastline (7720 m), Ružić et al. [47] used the segmentation of the coastline, like Kantamaneni et al. [43], Pantusa et al. [45] and Palmer et al. [40]. This method of graphical representation is acceptable for a small part of the coastline, but larger areas would require larger segmentations which would result in a lower precision of calculated CVI. The above-mentioned CVI has been calculated using the modified Gornitz [5] formula, where a total number of variables divides the square root of the sum of variable ranks. The weighing was used to emphasise the importance of geologic fabric in Ružić et al. [47] methodology. Furlan et al. [49] developed multi-dimensional CVI to assess spatial-temporal vulnerability. For this purpose, Furlan et al. [49] grouped variables into four groups: 1. Coastal forcing, 2. Environmental, 3. Social, and 4. Economic.
Five papers, Gornitz [5], Mclaughlin and Cooper [35], Faivre et al. [10], Hamid et al. [34], and Ružić et al. [47], were used as the basis for establishing parameters for research. In Scopus [50], Web of Science [51], and Google Scholar [52] following search terms were used: coastal vulnerability index and CVI, coastal vulnerability, vulnerability index, coastal physical factors, socio-economic factor, SLR, sea-level rise and SLR, relative sea-level rise and RSLR, coastal flooding, coastal erosion, and coastal zone. Croatian scientific databases were also browsed, Croatian Scientific Database (CROSBI) [53], Croatian Digital Dissertations Repository [54], and Digital Academic Archives and Repositories (DABAR) [55]. An additional search was conducted by reading referenced papers in previously found publications by the above-explained process. In the end, the Google search engine was used to browse web pages and other sources dealing with coastal vulnerability. This search yielded about 60 papers. To select 18 papers, the analysis started with Gornitz [5] and then turned to the most recent papers, choosing those that have contributed to the previous papers and have some new aspects that are important for the aim of this study: factors, calculation methods, weighting, and research scope. The general parameters of the selection process can be explained in terms of creating CVI suitable for Istria and the eastern Adriatic coast having in mind Physical coastal characteristics, Coastal forcing characteristics, and Socio-economic characteristics. For example, Boruff et al. [56] were one of the first to use social-economic variables to calculate CVI, but the used variables either are US-specific or are kind of variables that are not collected in Croatia. Therefore, we did not use it further in the overview.
Several papers provide an overview and comparison of different CVI models and approaches. Bukvić et al. [57], in an overview of Coastal Vulnerability Mapping, concluded that social data are rarely included. Hamid et al. [34] find that different authors often used available data rather than data that should yield the best results. Kantamaneni et al. [58] analysed different Coastal Vulnerability assessments along Andhra Pradesh coast in India and concluded that the majority of used data collected from either satellite or field observations are very low in resolution. Koroglu et al. [59] analysed and compared approaches proposed by Gornitz [5], Shaw, et al. [60], Thieler and Hammar-Klose [42], and Lopez et al. [61], along the Barcelona coastline. Koroglu et al. [59] concluded that variable data rankings are site-specific.
2.1. Coastal Vulnerability Variables
To fully understand the complexity of coastal vulnerability, it is not important how many variables are used but what kind of approach and variables are used [35]. Using only Physical coastal characteristics variables and Coastal forcing variables yields results that can significantly be changed if Socio-economic variables are included in the CVI calculation [5]. Like Mclaughlin and Cooper’s [35] proposed methodology, this paper reviews three groups of variables that represent (a) the physical features of the coast, (b) the amount of influence of wave energy on the coast, and (c) exposed socio-economic variables. All reviewed published papers use at least two out of three groups of variables (Table 1). Physical coastal characteristics variables appear in all reviewed papers, Coastal forcing in 83%, and Socio-economic variables appear in 61% of studies. Only Szlafsztein and Sterr [38], Palmer et al. [40], and Kantamaneni et al. [43] have not used Coastal forcing variables in their calculation of Coastal vulnerability.

Table 1.
Coastal Vulnerability Index overview (group variables and variables used).
2.1.1. Physical Coastal Characteristic Variables
Physical coastal characteristics are generally defined by variables contributing to natural hazard coastal vulnerability, such as coastal type, elevation, slope, and erosion. Gornitz [5] proposed four variables (Table 2): (1) relief, (2) rock type (relative resistance to erosion), (3) landform, and (4) shoreline displacement, which are applied differently by authors in their methodologies. In reviewed published papers, landform (geomorphology) was used in 84% of them, shoreline displacement (erosion in general) in 56%, relief (elevation) in 39%, and rock-type (relative resistance to erosion) in 17%. The coastal slope variable proposed by Hammar-Klose and Thieler [42] is used in 61% of published papers. The rationale behind using Physical coastal characteristic variables is to determine coastal susceptibility to erosion, flooding, and inundation.
Table 2.
Coastal Vulnerability Index—Physical coastal characteristics.
2.1.2. Coastal Forcing Variables
Coastal forcing variables are sea and ocean contributing factors to coastal vulnerability, such as waves, tides, storms, and currents. To explain how and to what extent the coast is exposed to wave impact, Gornitz [5] proposed three variables: (a) vertical movement (RSL change), (b) tidal ranges and (c) wave height. Tidal range and wave height are the most often used, with 72% of 18 reviewed papers, followed by relative sea-level change, with 56%. Mclaughlin and Cooper [35] propose the use of storm frequency on a national level, and the probability of storms in relation to the orientation of the coast on a regional and local level, due to their influences on wave generation. Mohamad et al. [64] introduce tide-induced current as a variable alongside the tidal range proposed by Gornitz [5]. An overview of coastal forcing elements chosen in this review is given in Table 3.
Table 3.
Coastal Vulnerability Index—Coastal forcing characteristics.
2.1.3. Socio-Economic Variables
Coastal regions and their characteristics can be considered as a result of interdependencies and relationships between natural and social environments [57]. Socio-economic variables are considered an indicator of the damaging effect of natural processes in the coastal area, although overpopulation can also cause damage. Natural processes in inhabited areas are usually considered low-risk natural processes, but in highly valued and densely populated areas, they are described as natural hazards. Although Gornitz [5] did not implement Socio-economic variables (Table 4) in the proposed CVI methodology, she recognised the importance of the incorporation of such data. Unlike Physical coastal variables and Coastal forcing variables, Socio-economic variables are even more strongly determined by location. The diversity of Socio-economic variables in the sense of type, rank, and detail for different spatial scales is best shown in Mclaughlin and Cooper [35]. Mclaughlin and Cooper [35] argue that transport is a vital variable in Northern Ireland but is also spatial scale-dependent. For example, for calculation at a national level, motorways, dual carriageways, and A-class roads were used; on a regional level, all road classes plus minor (access roads), and at a local level, even a footpath were included. “Non local” population, or people not born in the same place they live in, or “foreign-born” variables were used by both Szlafsztein and Sterr [38] and Tragaki et al. [44] but with different presumptions. Szlafsztein and Sterr [38] argue that “Non-locals” are not aware of local hazards, therefore, will settle in hazard-prone areas, while Tragaki et al. [44] argue that “Foreign-born” have language issues and they are generally both socially and economically marginalised. Socio-economic variables are generally divided into nine groups—Demographics, Land use—Land cover, Economic value and Commercial activities, Transport, Construction environment, Cultural heritage, Coastal protection and conservation, and Historical data. Education level is used only in one review paper. This is contradictory to the fact that creating disaster-resilient and sustainable communities heavily depends on successful education [66].
Table 4.
Coastal Vulnerability Index—Socio-economic characteristics.
2.2. Data and Rank Ranges
For representing values of all three groups of variables, researchers use both categorical (qualitative) and numerical (quantitative) data or a combination of both types (Table 5). Categorical data can be further divided into nominal data (geomorphology, land use, sea defences, land cover, cultural heritage) and ordinal data (type of aquifer and rivers). Both types of numerical data are used: discrete data (population, children population (0–4 years-old population), elderly population (population older than 70 years old), ‘non-local’ population or people born in a different place that they live now) and continuous data (population density, share of women in total population, share of persons above 65 in total population). Ranks and ranges depend on used data types and local conditions. Determining the range of ranks was performed in different ways, and it was not always transparent or clear. However, researcher knowledge and experience are important. For example, in defining Wave height ranges Gornitz [5] uses historical data. The ranks assigned are based on maximum wave heights. Pantusa et al. [45] use only two values, “present—absent” for variable Posidonia oceanica. Both close and open-ended ranges were used (Table 5). Equal rank ranges are rare. Some researchers, such as Szlafsztein and Sterr [38], use Jenks Natural Breaks Classification inside GIS to form rank ranges. Koroglu et al. [59] conclude that the ranking ranges are site-specific and that it would be useful to calculate overall CVI to predetermine local or region ranking ranges. Furthermore, rank values cannot always be interpreted in the same way because they often depend on local conditions.
Table 5.
Coastal Vulnerability Index—Examples Data types, Ranks, and Ranks ranges.
Data sources also vary from author to author. For the physical coastal features and coastal-related variables, the sources can be divided into three main groups: 1. historical data, 2. scientific publications and studies, and 3. direct measurements and observations. The socio-economic sources can be divided into two groups: 1. census and 2. direct observation and calculation.
2.3. Calculating Coastal Vulnerability Index
There are various methodologies and formulas that have been used in calculating Coastal Vulnerability Index (Table 6). In general, the calculation of the CVI consists of four steps, and the identification of coastal vulnerability variables is the first [5].
Table 6.
Coastal Vulnerability Index—Formula.
The second step relates to the quantification of variables. It is considered mostly a semi-quantitative scoring and usually ranges from 1 to 5 [5,42,44], where 1 represents low influence on coastal vulnerability while 5 represents high influence (Table 5). Some of the published papers use a range from 1 to 4 [40,41,63], one being low influence while 4 is high influence. Although Mclaughlin and Cooper [35] use value scoring from 1 to 5, for certain variables, they use a different number of values: (a) two for rivers, cultural heritages (“Absent—Present”), and inland buffer (“<500 m”—“500—1000 m”), (b) three for orientation, roads, railways, and conservation designation, and c) four (drift geology) (Table 6). Data types and rank ranges were discussed in the previous chapter.
The third step represents the integration of variables into a single index. Integration can be performed by multiplication or addition [67,68]. Although Gornitz et al. [67] argue that addition shows lower sensitivity to misclassification errors and missing data, the square root of the product means is widely used [32] (Table 6). Integration into a single index can be divided into the calculation of three general groups: 1. Equal variables—this group uses variables from one or all three groups of coastal variables equally. Integration does not differentiate variables during the calculation process. This type is used by Gornitz [5], Hammar-Klose and Thieler [42], Ružić et al. [47], Rizzo et al. [69], and others; 2. Separate variables—in this group, variables are divided into two (1. physical and coastal forcing variables and 2. Socio-economic variables) or three groups. Integration is performed in two steps. The first step is the calculation of the index of each group separately, while the second step is calculating the final (single) coastal vulnerability index. This method is used by Szlafsztein and Sterr [38], McLaughlin and Cooper [35], Mani Murali et al. [41], Kantamaneni et al. [43], and 3. Causal variables—in this method, researchers first define variables that define physical vulnerability and, in separate processes, calculate socio-economic vulnerability based on physical vulnerability calculation [40,44,58].
The final, fourth step, refers to the classification of calculated CVI values, which could be organised into different number of classes: (a) three—Low, Medium (Moderate), and High [67,70]; (b) four—Very Low (Low), Low (Moderate) High and Very High [33,36,41,42,43,71,72] and (c) five—Very low, Low, Moderate, High, Very high [44,47,73].
3. Physical Characteristics of the Coast in the Pilot Area
Three physical coastal characteristic variables, coastal type, elevation, and slope were used for testing at the pilot area located along the eastern coast of Istria. According to Bukvic et al. [57], scale determination and adjustment should be considered at an early stage in the analysis of the coastal vulnerability. This is especially the case when performing DEM-based analysis of physical variables. Therefore, our pilot area was divided into cells of eight different dimensions ranging from 5 × 5 up to 1000 × 1000 m (Figure 2). Due to particular coastal characteristics, high, steep, and very indented coastline, testing showed 5 × 5 m cell dimension as the most suitable dimension for analyses of physical vulnerability. Pilot area is similar to the major part of the eastern Adriatic coast, which makes variables and cells dimension analysed for Istria also applicable to other parts of the eastern Adriatic coast. Further research into different physical variables is in progress.
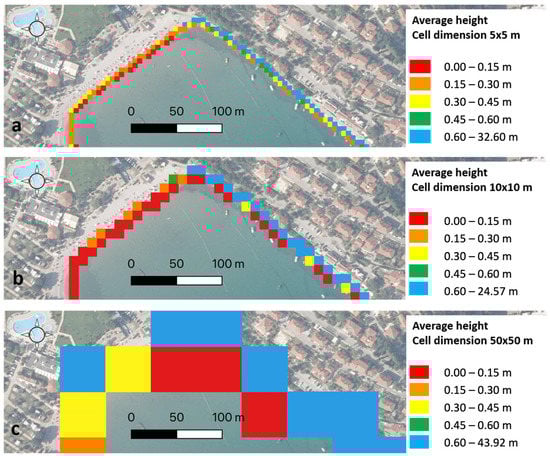
Figure 2.
Coastal elevation shown as single cell average height ((a)—cell dimension 5 × 5 m, (b)—cell dimension 10 × 10 m, (c)—cell dimension 50 × 50 m).
4. Discussion
Due to the great diversity of global coastal conditions and different research scopes, there is no universal CVI. Therefore, analysed indices are always adapted to local conditions. This is also the case with the Istrian coast.
Early papers on the coastal vulnerability index focused on physical vulnerability or how the relative sea-level change will influence coastal processes such as erosion, flooding, inundation, saltwater intrusion, or loss of valuable land. Although the purpose of establishing the level of coastal vulnerability is to determine the level of risk to social elements in coastal areas, Physical coastal characteristics and Coastal forcing take precedence over Socio-economic variables in many research studies.
The number of variables used for CVI calculation ranges from 5 in Ružić et al. [47] to 19 in Özyurt and Ergin [62]. In ten reviewed papers, at least two out of three variable groups were used. As seen in Table 1, there is no “standard” number of variables or mandatory group variables. The number and type of variables are defined by location, the purpose of analysis, and researchers’ knowledge and experience. In addition, relations between variables differ from index to index. The compound vulnerability index calculation method can be grouped into three calculation methods (Figure 3). 1. Equal variables —this group is characterised by equal importance of all physical and social variables. This calculation can significantly influence the final vulnerability outcome and give a false picture. Areas with high physical and social vulnerability and regions with low physical and high social vulnerability can have equal final vulnerability. The reason for calculating the coastal vulnerability index is to determine the level of risk to social elements in coastal areas so that this methodology would be suitable for physical vulnerability only. 2. Separate variables—this group distinguishes two or three groups of variables. This method classifies physical and social vulnerability separately before creating a single vulnerability index. In this manner, different vulnerability types are shown separately, and the non-expert quickly understands the dependency between physical and social vulnerability. 3. Causal variables—this method is based on establishing physical vulnerability as a stepping-stone for further vulnerability analysis. With this method, researchers can exclude, from the further process, areas of low vulnerability (area of no interest), which significantly speed up analysis, save money and focus on an area of high vulnerability.
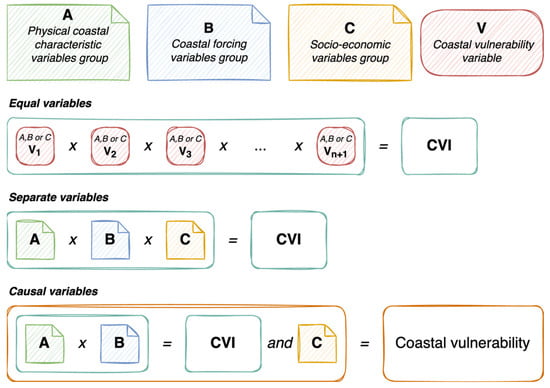
Figure 3.
Three groups of Coastal vulnerability assessment and coastal vulnerability index calculation methods based on the 18 reviewed papers (see Section 2.3. and “Discussion” section for more details).
The complexity of coastal areas requires the use of different data types to calculate coastal vulnerability. Although data type does not represent a problem, defining ranks might be an issue. Ranks (bins) should be equal and close-ended to avoid researcher influence on the result.
Calculating CVI can be performed by multiplication or addition. Most authors consider all variables equal and do not use weighted values. Using weighted values can allow one to emphasise variables with high rankings or relevant variables for a particular area. The choice of used variables or method of calculation depends on the analysed area and the author’s knowledge and background. The vulnerability classification is usually performed using from three to five vulnerability levels. Using a larger number of vulnerability levels provides greater precision. By using an even number of levels, the mean level or value of vulnerability is avoided making it easier for coastal managers to decide on further steps.
Considering the reviewed CVI methodology and our preliminary analyses, we propose the following physical variables to be considered for Istria: coastal elevation, coastal landform, coastal slope, storm frequencies, coastal orientation, and sea-level change. The Croatian as well as Istrian coast is generally rocky, composed mainly of limestone and dolomites [74], limiting the effects of erosion. The prediction of maximum sea-level rise in the Adriatic by the end of the century [28] and its regional dependency [9,10,11,75,76] combine with two prevailing winds, Bora (NE wind) and Jugo (SE wind—sirocco), shows that coastal slope, elevation, and landform should be considered as crucial variables.
5. Conclusions
Urban areas in low-lying coastal strips are social hotspots of coastal vulnerability where stress on natural elements interacts with low societal capacity and high exposure [6]. Based on various approaches and variables, CVI is one of the most used and straightforward methods to assess coastal vulnerability. Choosing variables and calculation methods and eliminating possible expert bias should be a priority. The need to calculate coastal physical vulnerability as a starting point for establishing a potential socio-economic impact must be a deciding factor for selecting the appropriate variables and variable numbers and determining their dependencies. Therefore, approaches with separate or causal variables shown in Figure 3 should be preferred.
The development of CVI for the eastern Adriatic area is valuable for further socio-economic development and sustainability of coastal areas. For a better understanding of the sea-level rise impact on social and economic variables and the eastern Adriatic area’s vulnerability, a CVI on a regional scale is needed. It is vital to select relevant variables that would be applicable to the whole of Istria and the eastern Adriatic. Our research presented 5 × 5 m cell dimension as the most suitable for analysing the physical vulnerability of the Istrian coast. Further development of CVI for the Croatian coast of Istria will focus on a complex interaction of physical and social vulnerability variables. A better understanding of the interaction and interdependence between physical and social variables and their integration into CVI will provide coastal disaster managers and spatial planners with a thorough basis for an effective spatial planning that will enable strengthening the resilience of coastal areas in Croatia and similar coastal areas worldwide.
Author Contributions
Conceptualisation and writing original draft preparation, Z.Š.; writing—review and editing, Z.Š, N.L. and S.F. All authors have read and agreed to the published version of the manuscript.
Funding
This research received no external funding.
Data Availability Statement
Data sharing is not applicable to this article.
Conflicts of Interest
The authors declare no conflict of interest.
References
- Kaniewski, D.; Marriner, N.; Morhange, C.; Faivre, S.; Otto, T.; Van Campo, E. Solar pacing of storm surges, coastal flooding and agricultural losses in the Central Mediterranean. Sci. Rep. 2016, 6, 25197. [Google Scholar] [CrossRef] [PubMed]
- Faivre, S.; Pahernik, M.; Maradin, M. The gully of Potovošća on the island of Krk—The effects of a short-term rainfall event. Geol. Cro. 2011, 64, 67–80. [Google Scholar] [CrossRef]
- Faivre, S.; Mićunović, M. Rekonstrukcija recentnih morfoloških promjena žala uz pomoć metode ponovljene fotografije–primjer žala Zogon na otoku Hvaru (Srednji Jadran). Geoadria 2018, 22, 165–192. [Google Scholar] [CrossRef]
- Mićunović, M.; Faivre, S.; Gašparović, M. Assessment of Remote Sensing Techniques Applicability for Beach Morphology Mapping: A Case Study of Hvar Island, Central Adriatic, Croatia. JMSE 2021, 9, 1407. [Google Scholar] [CrossRef]
- Gornitz, V. Global coastal hazards from future sea level rise. Palaeogeogr. Palaeoclimatol. Palaeoecol. (Glob. Planet. Change Sect.) 1991, 89, 379–398. [Google Scholar] [CrossRef]
- Nicholls, R.J.; Wong, P.; Burkett, V.; Codignotto, J.; Hay, J.; McLean, R.; Ragoonaden, S.; Woodroffe, C. Coastal systems and low-lying areas. Climate Change 2007: Impacts, Adaptation and Vulnerability. Contribution of Working Group II to the Fourth Assessment Report of the Intergovernmental Panel on Climate Change; Parry, M., Canziani, O., Palutikof, J., van der Linden, P., Hanson, C., Eds.; Cambridge University Press: Cambridge, UK, 2007; pp. 315–356. [Google Scholar]
- Hay, C.C.; Morrow, E.; Kopp, R.E.; Mitrovica, J.X. Probabilistic reanalysis of twentieth-century sea-level rise. Nature 2015, 517, 481–484. [Google Scholar] [CrossRef]
- Lambeck, K.; Antonioli, F.; Anzidei, M.; Ferranti, L.; Leoni, G.; Scicchitano, G.; Silenzi, S. Sea level change along the Italian coast during the Holocene and projections for the future. Quat. Int. 2011, 232, 250–257. [Google Scholar] [CrossRef]
- Faivre, S.; Bakran-Petricioli, T.; Barešić, J.; Horvatić, D. Lithophyllum rims as biological markers for constraining palaeoseismic events and relative sea-level variations during the last 3.3 ka on Lopud Island, southern Adriatic, Croatia. Glob. Planet. Change 2021, 202, 103517. [Google Scholar] [CrossRef]
- Faivre, S.; Bakran-Petricioli, T.; Barešić, J.; Horvatić, D.; Macario, K. Relative sea-level change and climate change in the Northeastern Adriatic during the last 1.5 ka (Istria, Croatia). Quat. Sci. Rev. 2019, 222, 105909. [Google Scholar] [CrossRef]
- Faivre, S.; Bakran-Petricioli, T.; Herak, M.; Barešić, J.; Borković, D. Late Holocene interplay between coseismic uplift events and interseismic subsidence at Koločep island and Grebeni islets in the Dubrovnik archipelago (southern Adriatic, Croatia). Quat. Sci. Rev. 2021, 274, 107284. [Google Scholar] [CrossRef]
- Le Cozannet, G.; Garcin, M.; Bulteau, T.; Mirgon, C.; Yates, M.L.; Méndez, M.; Baills, A.; Idier, D.; Oliveros, C. An AHP-derived method for mapping the physical vulnerability of coastal areas at regional scales. Nat. Hazards Earth Syst. Sci. 2013, 13, 1209–1227. [Google Scholar] [CrossRef]
- Cazenave, A.; Palanisamy, H.; Ablain, M. Contemporary sea level changes from satellite altimetry: What have we learned? What are the new challenges? Adv. Space Res. 2018, 62, 1639–1653. [Google Scholar] [CrossRef]
- Antonellini, M.; Mollema, P.; Giambastiani, B.; Bishop, K.; Caruso, L.; Minchio, A.; Pellegrini, L.; Sabia, M.; Ulazzi, E.; Gabbianelli, G. Salt water intrusion in the coastal aquifer of the southern Po Plain, Italy. Hydrogeol. J. 2008, 16, 1541–1556. [Google Scholar] [CrossRef]
- Chang, S.W.; Clement, T.P.; Simpson, M.J.; Lee, K.-K. Does sea-level rise have an impact on saltwater intrusion? Adv. Water Resour. 2011, 34, 1283–1291. [Google Scholar] [CrossRef]
- Terzić, J.; Marković, T.; Pekaš, Ž. Influence of sea-water intrusion and agricultural production on the Blato Aquifer, Island of Korčula, Croatia. Environ. Geol. 2008, 54, 719–729. [Google Scholar] [CrossRef]
- Brkić, Ž.; Kuhta, M.; Hunjak, T.; Larva, O. Regional Isotopic Signatures of Groundwater in Croatia. Water 2020, 12, 1983. [Google Scholar] [CrossRef]
- Kulp, S.A.; Strauss, B.H. New elevation data triple estimates of global vulnerability to sea-level rise and coastal flooding. Nat. Commun. 2019, 10, 4844. [Google Scholar] [CrossRef]
- Church, J.A.; White, N.J.; Coleman, R.; Lambeck, K.; Mitrovica, J.X. Estimates of the Regional Distribution of Sea Level Rise over the 1950–2000 Period. J. Clim. 2004, 17, 2609–2625. [Google Scholar] [CrossRef]
- Surić, M.; Juračić, M. Late Pleistocene–Holocene environmental changes–records from submerged speleothems along the Eastern Adriatic coast (Croatia). Geol. Cro. 2010, 63, 155–169. [Google Scholar] [CrossRef]
- Kaniewski, D.; Marriner, N.; Cheddadi, R.; Morhange, C.; Vacchi, M.; Rovere, A.; Faivre, S.; Otto, T.; Luce, F.; Carre, M.-B.; et al. Coastal submersions in the north-eastern Adriatic during the last 5200 years. Glob. Planet. Change 2021, 204, 103570. [Google Scholar] [CrossRef]
- Fouache, E.; Faivre, S.; Dufaure, J.J. Tassaux, Francis New observation on the evolution of the Croatian shoreline between Porec and Zadar over the past 2000 years. Z. Geomorphol. 2000, S122, 33–46. [Google Scholar]
- Fouache, E.; Faivre, S.; Dufaure, J.J.; Tassaux, F.; Tronche, P. Morska razina u rimsko doba na području Istre (Sea level in Roman times in Istria). Vjesn. Arheol. Muz. U Zagreb. 2004, 37, 173–190. [Google Scholar]
- Istarska Županija, Historic Overview-More Details. 2020. Available online: https://www.istra-istria.hr/index.php?id=860 (accessed on 17 March 2020).
- Državni Zavod za Statistiku. Available online: https://www.dzs.hr/ (accessed on 19 March 2020).
- Baric, A.; Grbec, B.; Bogner, D. Potential Implications of Sea-Level Rise for Croatia. J. Coast. Res. 2008, 242, 299–305. [Google Scholar] [CrossRef]
- Domazetović, F.; Lončar, N.; Šiljeg, A. Kvantitativna analiza utjecaja porasta razine Jadranskog mora na hrvatsku obalu: GIS pristup. Naše More 2017, 64, 33–43. [Google Scholar] [CrossRef]
- Orlić, M.; Pasarić, Z. Semi-empirical versus process-based sea-level projections for the twenty-first century. Nat. Clim. Change 2013, 3, 735–738. [Google Scholar] [CrossRef]
- Bevacqua, A.; Yu, D.; Zhang, Y. Coastal vulnerability: Evolving concepts in understanding vulnerable people and places. Environ. Sci. Policy 2018, 82, 19–29. [Google Scholar] [CrossRef]
- Parthasarathy, A.; Natesan, U. Coastal vulnerability assessment: A case study on erosion and coastal change along Tuticorin, Gulf of Mannar. Nat. Hazards 2015, 75, 1713–1729. [Google Scholar] [CrossRef]
- Kantamaneni, K. Coastal infrastructure vulnerability: An integrated assessment model. Nat. Hazards 2016, 84, 139–154. [Google Scholar] [CrossRef]
- Ramieri, E.; Hartley, A.; Barbanti, A.; Duarte Santos, F.; Gomes, A.; Hilden, M.; Laihonen, P.; Marinova, N.; Santini, M. Methods for assessing coastal vulnerability to climate change. ETC CCA Tech. Pap. 2011, 1, 1–93. [Google Scholar] [CrossRef]
- Pendleton, E.A. Coastal Vulnerability Assessment of the Northern Gulf of Mexico to Sea-Level Rise and Coastal Change; U.S. Geological Survey: Reston, VA, USA, 2010. [Google Scholar]
- Hamid, A.I.A.; Din, A.H.M.; Yusof, N.; Abdullah, N.M.; Omar, A.H.; Abdul Khanan, M.F. Coastal vulnerability index development: A review. Int. Arch. Photogramm. Remote Sens. Spatial Inf. Sci. 2019, XLII-4/W16, 229–235. [Google Scholar] [CrossRef]
- Mclaughlin, S.; Cooper, J.A.G. A multi-scale coastal vulnerability index: A tool for coastal managers? Environ. Hazards 2010, 9, 233–248. [Google Scholar] [CrossRef]
- Williams, A.T.; Davies, P.; Curr, R.; Koh, A.; Bodere, J.C.; Hallegouet, B.; Meur, C.; Yoni, C. A Checklist assessment of dune vulnerability and protection in Devon and Cornwall, UK. In Coastal Zone: Proceedings of the Symposium on Coastal and Ocean Management; ASCE: New York, NY, USA; New Orleans, LA, USA, 1993; Volume 3, pp. 3394–3408. Available online: https://www.scopus.com/inward/record.uri?eid=2-s2.0-0027261696&partnerID=40&md5=d5ed83e5b249f14b8d634e0f8b9059fc (accessed on 29 December 2023).
- Quelennec, R.-E. Corine “coastal erosion project”. Identification of coastal erosion problems and data base on the littoral environment of eleven European countries. In Coastal Zone: Proceedings of the Symposium on Coastal and Ocean Management; ASCE: New York, NY, USA; Charleston, SC, USA, 1989; Volume 5, pp. 4594–4601. Available online: https://www.scopus.com/inward/record.uri?eid=2-s2.0-0024861140&partnerID=40&md5=1d81e33c7bafe3ed98e3bf3c676de856 (accessed on 29 December 2023).
- Szlafsztein, C.; Sterr, H. A GIS-based vulnerability assessment of coastal natural hazards, state of Pará, Brazil. J. Coast Conserv. 2007, 11, 53–66. [Google Scholar] [CrossRef]
- McLaughlin, S.; McKenna, J.; Cooper, J.A.G. Socio-economic data in coastal vulnerability indices: Constraints and opportunities. J. Coast. Res. 2002, 36, 487–497. [Google Scholar] [CrossRef]
- Palmer, B.J.; Van der Elst, R.; Mackay, F.; Mather, A.; Smith, A.; Bundy, S.; Thackeray, Z.; Leuci, R.; Parak, O. Preliminary coastal vulnerability assessment for KwaZulu-Natal, South Africa. J. Coast. Res. 2011, 7, 1390–1395. [Google Scholar]
- Mani Murali, R.; Ankita, M.; Amrita, S.; Vethamony, P. Coastal vulnerability assessment of Puducherry coast, India, using the analytical hierarchical process. Nat. Hazards Earth Syst. Sci. 2013, 13, 3291–3311. [Google Scholar] [CrossRef]
- Hammar-Klose, E.S.; Thieler, R.E. Coastal Vulnerability to Sea-Level Rise: A Preliminary Database for the US Atlantic Coast; US Geological Survey, Coastal and Marine Geology Program; Open-File Report 99-593, 1 shee 1; U.S. Geological Survey: Reston, VA, USA, 1999. [Google Scholar]
- Kantamaneni, K.; Phillips, M.; Thomas, T.; Jenkins, R. Assessing coastal vulnerability: Development of a combined physical and economic index. Ocean. Coast. Manag. 2018, 158, 164–175. [Google Scholar] [CrossRef]
- Tragaki, A.; Gallousi, C.; Karymbalis, E. Coastal Hazard Vulnerability Assessment Based on Geomorphic, Oceanographic and Demographic Parameters: The Case of the Peloponnese (Southern Greece). Land 2018, 7, 56. [Google Scholar] [CrossRef]
- Pantusa, D.; D’Alessandro, F.; Riefolo, L.; Principato, F.; Tomasicchio, G. Application of a Coastal Vulnerability Index. A Case Study along the Apulian Coastline, Italy. Water 2018, 10, 1218. [Google Scholar] [CrossRef]
- Juračić, M.; Benac, Č.; Pikelj, K.; Ilić, S. Comparison of the vulnerability of limestone (karst) and siliciclastic coasts (example from the Kvarner area, NE Adriatic, Croatia). Geomorphology 2009, 107, 90–99. [Google Scholar] [CrossRef]
- Ružić, I.; Dugonjić Jovančević, S.; Benac, Č.; Krvavica, N. Assessment of the Coastal Vulnerability Index in an Area of Complex Geological Conditions on the Krk Island, Northeast Adriatic Sea. Geosciences 2019, 9, 219. [Google Scholar] [CrossRef]
- Ružić, I.; Benac, Č. RanJivost obala otoka Raba zbog rasta razine mora. Hrvat. Vode 2016, 24, 203–214. [Google Scholar]
- Furlan, E.; Pozza, P.D.; Michetti, M.; Torresan, S.; Critto, A.; Marcomini, A. Development of a Multi-Dimensional Coastal Vulnerability Index: Assessing vulnerability to inundation scenarios in the Italian coast. Sci. Total Environ. 2021, 772, 144650. [Google Scholar] [CrossRef]
- Scopus-Document Search|Signed in. Available online: https://www.scopus.com/search/form.uri?display=basic#basic (accessed on 17 December 2022).
- Clarivate. Available online: https://access.clarivate.com/login?app=wos&alternative=true&shibShireURL=https:%2F%2Fwww.webofknowledge.com%2F%3Fauth%3DShibboleth&shibReturnURL=https:%2F%2Fwww.webofknowledge.com%2F&roaming=true (accessed on 17 December 2022).
- Google Znalac. Available online: https://scholar.google.com/ (accessed on 17 December 2022).
- Početna-CROSBI. Available online: https://www.bib.irb.hr/ (accessed on 17 December 2022).
- Croatian Digital Dissertations Repository|National and University Library in Zagreb. Available online: https://dr.nsk.hr/en (accessed on 17 December 2022).
- Digital Academic Archives and Repositories|Dabar. Available online: https://dabar.srce.hr/en (accessed on 17 December 2022).
- Boruff, B.J.; Emrich, C.; Cutter, S.L. Erosion Hazard Vulnerability of US Coastal Counties. J. Coast. Res. 2005, 215, 932–942. [Google Scholar] [CrossRef]
- Bukvic, A.; Rohat, G.; Apotsos, A.; de Sherbinin, A. A Systematic Review of Coastal Vulnerability Mapping. Sustainability 2020, 12, 2822. [Google Scholar] [CrossRef]
- Kantamaneni, K.; Sudha Rani, N.N.V.; Rice, L.; Sur, K.; Thayaparan, M.; Kulatunga, U.; Rege, R.; Yenneti, K.; Campos, L. A Systematic Review of Coastal Vulnerability Assessment Studies along Andhra Pradesh, India: A Critical Evaluation of Data Gathering, Risk Levels and Mitigation Strategies. Water 2019, 11, 393. [Google Scholar] [CrossRef]
- Koroglu, A.; Ranasinghe, R.; Jiménez, J.A.; Dastgheib, A. Comparison of Coastal Vulnerability Index applications for Barcelona Province. Ocean. Coast. Manag. 2019, 178, 104799. [Google Scholar] [CrossRef]
- Shaw, J.; Taylor, R.B.; Forbes, D.L.; Ruz, M.H.; Solomon, S. Sensitivity of the Coasts of Canada to Sea-Level Rise; Geological Survey of Canada: Ottawa, ON, Canada, 1998; p. 505. [Google Scholar] [CrossRef]
- López Royo, M.; Ranasinghe, R.; Jiménez, J.A. A Rapid, Low-Cost Approach to Coastal Vulnerability Assessment at a National Level. J. Coast. Res. 2016, 320, 932–945. [Google Scholar] [CrossRef]
- Özyurt, G.; Ergin, A. Improving Coastal Vulnerability Assessments to Sea-Level Rise: A New Indicator-Based Methodology for Decision Makers. J. Coast. Res. 2010, 262, 265–273. [Google Scholar] [CrossRef]
- Yin, J.; Yin, Z.; Wang, J.; Xu, S. National assessment of coastal vulnerability to sea-level rise for the Chinese coast. J. Coast Conserv. 2012, 16, 123–133. [Google Scholar] [CrossRef]
- Mohamad, M.F.; Lee, L.H.; Samion, M.K.H. Coastal Vulnerability Assessment towards Sustainable Management of Peninsular Malaysia Coastline. IJESD 2014, 5, 533–538. [Google Scholar] [CrossRef]
- Loinenak, F.A.; Hartoko, A.; Muskananfola, M.R. Mapping of Coastal Vulnerability using the Coastal Vulnerability Index and Geographic Information System. IJTech 2015, 6, 819. [Google Scholar] [CrossRef]
- Petal, M.A.; Izadkhah, Y.O. Concept Note: Formal and Informal Education for Disaster Risk Reduction. In A Contribution from Risk RED; 2008; p. 5. Available online: https://www.academia.edu/1083253/Concept_note_Formal_and_informal_education_for_disaster_risk_reduction (accessed on 29 December 2023).
- Gornitz, V.; Beaty, T.; Daniels, R. A Coastal Hazards Data Base for the U.S. West Coast; NDP-043C; Oak Ridge National Laboratory: Oak Ridge, TN, USA, 1997. [CrossRef]
- Gornitz, V.; White, T.W. A Coastal Hazards Data Base for the U.S. East Coast; Oak Ridge National Laboratory: Oak Ridge, TN, USA, 1992.
- Rizzo, A.; Vandelli, V.; Buhagiar, G.; Micallef, A.S.; Soldati, M. Coastal Vulnerability Assessment along the North-Eastern Sector of Gozo Island (Malta, Mediterranean Sea). Water 2020, 12, 1405. [Google Scholar] [CrossRef]
- Addo, K.A. Assessing Coastal Vulnerability Index to Climate Change: The Case of Accra–Ghana. J. Coast. Res. 2013, 165, 1892–1897. [Google Scholar] [CrossRef]
- Doukakis, E. Coastal Vulnerability and Risk Parameters. Eur. Water 2005, 11, 3–7. [Google Scholar]
- Wu, S.; Yarnal, B.; Fisher, A. Vulnerability of coastal communities to sea-level rise: A case study of Cape May County, New Jersey, USA. Clim. Res. 2002, 22, 255–270. [Google Scholar] [CrossRef]
- Gaki-Papanastassiou, K.; Karymbalis, E.; Poulos, S.E.; Seni, A.; Zouva, C. Coastal vulnerability assessment to sea-level rise bαsed on geomorphological and oceanographical parameters: The case of Argolikos Gulf, Peloponnese, Greece. Hell. J. Geosci. 2010, 45, 109–122. [Google Scholar]
- Pikelj, K.; Juračić, M. Eastern Adriatic Coast (EAC): Geomorphology and Coastal Vulnerability of a Karstic Coast. J. Coast. Res. 2013, 289, 944–957. [Google Scholar] [CrossRef]
- Faivre, S.; Bakran-Petricioli, T.; Horvatinčić, N.; Sironić, A. Distinct phases of relative sea level changes in the central Adriatic during the last 1500 years—Influence of climatic variations? Palaeogeogr. Palaeoclimatol. Palaeoecol. 2013, 369, 163–174. [Google Scholar] [CrossRef]
- Faivre, S.; Butorac, V. Recently submerged tidal notches in the wider Makarska area (Central Adriatic, Croatia). Quat. Int. 2018, 494, 225–235. [Google Scholar] [CrossRef]


Disclaimer/Publisher’s Note: The statements, opinions and data contained in all publications are solely those of the individual author(s) and contributor(s) and not of MDPI and/or the editor(s). MDPI and/or the editor(s) disclaim responsibility for any injury to people or property resulting from any ideas, methods, instructions or products referred to in the content. |
© 2023 by the authors. Licensee MDPI, Basel, Switzerland. This article is an open access article distributed under the terms and conditions of the Creative Commons Attribution (CC BY) license (https://creativecommons.org/licenses/by/4.0/).