Article

Numerical Simulation of the Isoparaffins Dehydrogenation Process in Fluidized Bed Reactor: From Laboratory to Industry

by
Sergei A. Solovev
1,* and
Olga V. Soloveva
2
1
Institute of Digital Technologies and Economics, Kazan State Power Engineering University, 420066 Kazan, Russia
2
Institute of Heat Power Engineering, Kazan State Power Engineering University, 420066 Kazan, Russia
*
Author to whom correspondence should be addressed.
ChemEngineering 2025, 9(6), 129; https://doi.org/10.3390/chemengineering9060129
Submission received: 11 September 2025 / Revised: 15 October 2025 / Accepted: 3 November 2025 / Published: 12 November 2025

Abstract

A numerical model was developed to simulate a fluidized bed reactor for isobutane dehydrogenation. First, we constructed a hydrodynamic model of catalyst particle fluidization and a kinetic model for three chemical reactions in a simple lab-scale reactor (H = 70 cm, D = 2.8 cm). Experimental studies and numerical simulation of the laboratory reactor were carried out at four temperatures: 550, 575, 600, and 625 °C. The product yield results from the computational fluid dynamics simulation show a close match to the experimental data. The optimal process temperature in the laboratory reactor is 575 °C, at which the isobutylene yield is ~46.03 wt%. With decreasing temperature, the isobutylene yield decreases, and it rises as temperature increases. However, with rising temperature, the total yield of by-products increases on average to 20 wt%. We compared the CFD simulation results for two laboratory reactor models: a 3D model and a 2D axisymmetric model. For gas phase fractions, absolute deviations ranged from 0.01 to 1.12%, while relative deviations were between 0.006% and 0.114%. However, there are differences in the solid-phase particle dynamics. Second, we applied the constructed CFD model to simulate an industrial-scale reactor (H = 23.81 m, D = 4.6 m). In addition to its size, the industrial reactor differs from the laboratory reactor in its heating principle. In this configuration, the gas, preheated to 550 °C, and the catalyst particles, at 650 °C, are fed into the entire volume. The objective of this study is to test the performance of the model, which was verified on a laboratory reactor, for simulating an industrial reactor. Temperature fields and zones of reaction product formation are analyzed. The average isobutylene yield is ~31.88 wt%, which is consistent with the operation of real reactors but lower than the results for the laboratory reactor at all temperatures. The industrial reactor is more challenging to heat uniformly. It contains many internal elements that affect the movement of the gas–solid system. Overall, the model developed for the laboratory reactor has proven to be suitable for CFD modeling of an industrial reactor.

1. Introduction

The industrial use of fluidized bed reactors is well-established, spanning many decades [1,2]. Their main applications include oil refining (primarily catalytic cracking [3]), petrochemistry [4], and gasification [5]. The contact between gas and solid particles in these systems allows for highly efficient heat and mass transfer.
The fluid catalytic cracking (FCC) process was initially developed for the conversion of oil into fuel [6]. Beyond fuel production, FCC is also used to produce chemicals such as ethylene, propylene, and butenes. Fluidized bed reactors are employed in oil refining, coal combustion, and biomass combustion. Currently, a significant amount of research is devoted to biomass gasification [7,8,9], driven by challenges in global energy and environmental protection.
Due to the wide application of fluidized bed reactors, substantial knowledge about their operation has been accumulated over the years, and various approximate models have been developed to describe these processes. However, this knowledge was typically based on experimental observations of external data without a deep understanding of the internal behavior of all phases [10]. For characterizing large-scale fluidized beds, tomographic scanning ranks among the most reliable techniques [11,12,13,14,15,16,17,18,19]. The primary value of X-ray digital radiography and computed tomography lies in process understanding rather than real-time monitoring. These techniques are exceptionally useful for characterizing porosity distribution and macrostructures, including bubbles and jets.
A modern approach to obtaining data and knowledge about complex technological processes is numerical modeling [20]. A key technique for simulating fluidized bed behavior is computational fluid dynamics (CFD), which effectively models system hydrodynamics and associated heat and mass transfer. Numerical simulations of fluidization are typically based on two main approaches: the Eulerian-Lagrangian method (CFD-DEM, where DEM denotes the Discrete Element Method) [21] and the Eulerian-Eulerian method, also known as the Two-Fluid Model (TFM) [22]. The Eulerian-Eulerian model treats both the solid and gas phases as interpenetrating continua. Particle-particle interactions are governed by the kinetic theory of granular flow [23]. The Eulerian-Lagrangian framework simulates the gas phase as a continuum and models solid particle behavior based on Newton’s laws of motion [24]. CFD modeling methods for fluidized bed reactors are continuously evolving. Many modified approaches have been developed, focusing on gains in either predictive accuracy or computational performance [25,26,27]. TFMs are commonly applied to model the flow of reacting particles in fluidized bed reactors [28]. The performance of fluidized bed reactors is affected by a large number of parameters [29]. The authors also note that due to high computational costs, the application of CFD to real reactors is limited when detailed descriptions of mass and heat transfer and reaction mechanisms are required. The study presented in [30] introduces a new microchannel shape in a liquid cooling plate designed to address heat dissipation challenges. The authors investigate the effects of channel location, conventional design, mass flow rate, and a uniformly varying width on thermal performance.
The application of artificial intelligence to address complex problems has grown significantly in recent years. For instance, article [31] proposes a two-layer structure for a distributed Internet-based energy management strategy that addresses two major challenges in global real-time optimization processes. Fluidized bed reactors are characterized by high complexity and strong interdependence among their parameters. Recently, artificial intelligence technologies have been increasingly applied for the in-depth analysis of such systems [32]. For example, the authors of [33] present a study on optimization and modeling of the dry methane reforming process in an industrial-scale fluidized bed reactor. Machine learning models, trained on CFD data, provide precise predictions of process outcomes and facilitate reactor performance analysis. These models employ a multi-criteria genetic algorithm to identify operating strategies that maximize hydrogen production and minimize coke formation.
Over the past decade, researchers have actively employed CFD simulations to model large-scale industrial reactors or their key components. A two-fluid model was developed in [34] to simulate an industrial fluidized-bed olefin polymerization reactor with a height of 5 m and a diameter of 1 m. The calculated average voidage of the layer shows strong correlation with experimental results. However, this model only accounted for particle motion without considering heat and mass transfer. Significant attention was devoted to simulating polydisperse particles. In their subsequent work [35], the authors employed an Eulerian-Lagrangian approach to simulate polydisperse particle motion in a fluidized bed reactor with greater accuracy. The study in [36] simulated a large-scale circulating fluidized bed furnace with various gas–solid drag models and validated the simulation results against experimental measurements. Although the model shows a significant difference from measured data in predicting the riser’s vertical solids distribution, it successfully represents the annulus flow structure. The velocities of the downdraft and updraft are qualitatively realistic. These results were achieved using subgrid-scale models that were derived to modify the interphase momentum exchange coefficient solely based on volume fraction.
In these studies [37,38], the authors demonstrate how the internal design of a large-scale industrial reactor affects catalyst particle motion and overall reactor heating. The industrial reactor model is a 2D axisymmetric representation. In [37] two different designs of valve timing devices are investigated, namely false bottom and toroidal rings. The authors use dehydrogenation reaction product (isobutylene) yield data from two industrial units: 35.65 and 32.88% of the gas phase mass. The numerical simulation considered phase movement and heat transfer. To evaluate reactor performance, an efficiency coefficient was calculated based on an analysis of catalyst volume and gas temperature at each reactor point. The obtained results, 49.467 and 46.062, are higher than industrial observations, but their ratios are closer: 1.07392 versus 1.083. In [38] three design options for a heated catalyst particle feeder are considered. Numerical simulations were also conducted for various fine particle volume fractions (0–35%). An efficiency coefficient was also used to evaluate reactor performance, which was used to estimate the reactor heating rate. Thus, by installing additional partitions, the reactor heating rate can be increased almost twofold. In [39], a CFD study of an industrial continuous fluidized bed calciner was conducted using a Eulerian-Eulerian framework that modeled four granular phases and one gas phase, analyzing its performance across various operating conditions. The study investigates reactor performance across various operating conditions, aiming to maintain product sulfide and sulfur contents below 0.4% at the design feed rate of 39.75 dm3/h. The conversion of ZnS to ZnO across roaster sections was modeled using reaction kinetics at an isothermal temperature of 1203 K. Predictions of the heat released and the resultant temperature rise in each section were derived from the reaction enthalpy and the sensible heat of the product streams. Model simulations indicated that at a design feed rate of 39.75 dm3/h, an increase in the inlet air O2 content to 25% would produce a product with 0.4% sulfide and sulfur. A three-dimensional numerical model for an industrial catalytic biomass pyrolysis reactor was developed in [40] by employing the multiphase particle-in-cell method in conjunction with catalytic pyrolysis kinetics. Peak catalytic efficiency (71.3%) was achieved at an optimal primary gas flow rate of 4 kg/s. Using the highest-quality liquid fuel and a dispersed intake mode that injected biomass and catalyst from opposite sides achieved uniform particle distribution and thermal homogeneity in the dense phase zone. This increased the catalytic efficiency to 75.6%.
In recent years, researchers have increasingly integrated chemical reactions directly into CFD simulations. While initially possible only on small scales, publications now exist for industrial reactor simulations that incorporate chemical reactions. One study [41] presents CFD modeling of an industrial fluidized bed methanol-to-olefin process by incorporating a coke fraction balance model. Modeling shows that it is possible to account for the wide, uneven coke content distribution caused by the continuous supply of fresh catalyst, flow heterogeneity, and reaction characteristics. The predicted ethylene and propylene percentages (42.57% and 35.43%, respectively) align more closely with experimental values when the model accounts for coke content distribution. The ethylene to propylene ratio is less than 1.2, also demonstrating better agreement with experiment. Another study [42] investigates the iso-paraffin maximization process, comparing two industrial reactor modeling approaches in terms of solid and liquid concentrations, temperature, coke fraction, gas velocity, and product yield. Another group [43] employed numerical simulation to model biomass steam gasification in a double fluidized bed. Using the multiphase particle-in-cell method, they analyzed the interdependencies among key parameters, including volume fraction, Reynolds number, solid temperature, heat transfer and slip velocity. The most vigorous reactions occur in the upper regions of both reactors, leading to the highest heat transfer coefficients for large particles. This is evidenced in the industrial setup by the combustor sand’s time-averaged heat transfer coefficient, which is approximately 40 W/(m2·K) greater than that of the gasifier sand. Relationships between key variables—including volume fraction, heat transfer coefficient, slip velocity, Reynolds number, and solid phase temperature—are investigated. A key finding is that a lower particle volume fraction correlates with higher heat transfer coefficients and greater slip velocities. In a follow-up study, the same authors [44] focus on simulating biomass steam gasification in an industrial double fluidized bed gasifier with submerged tube bundles, again using the particle-in-cell method. The use of submerged tubes can improve solids entrainment and prevent excess particle leakage from the gasifier. Due to the gasifier’s asymmetric structure, the temperature and gas composition both exhibit an asymmetric distribution. The particle temperature near the loop seal outlet increases slightly with the number of submerged tubes. Adding more submerged tubes raises the particle temperature slightly near the loop seal outlet. Increasing the number of submerged tubes from three to nine reduces the radial biomass dispersion coefficient by approximately 40.9% and the axial sand dispersion coefficient by 28.9%. Another study [45] develops a mathematical model for an industrial circulating fluidized bed boiler co-firing a 90:10 coal-to-sawdust blend. The simulations employed an Eulerian-Eulerian multifluid model with four distinct Eulerian phases: coal, sawdust, sand, and a gas mixture, while user-defined functions were implemented to model heterogeneous reaction kinetics. Compared to burning coal alone, a 10% sawdust/90% coal mixture significantly alters the combustion profile at the boiler outlet. The mixed fuel reduces the pressure drop by 11.42% and increases the O2 mass fraction by 13.17%, while also lowering the mass fractions of key pollutants: carbon monoxide (10.63%), sulfur dioxide (16.26%), and nitrogen oxide (7.17%). The application of a novel turbulent ring for the enhancement of flue gas desulfurization performance in an industrial-scale circulating fluidized bed is explored in [46]. According to the findings, the turbulent ring increases desulfurization efficiency without elevating the pressure drop, and concurrently mitigates wall erosion by structuring the flow. This work presents an original turbulent ring configuration engineered to improve the hydrodynamic behavior inside a desulfurization tower. Data from the investigation showed that the device served to anchor vortex formation, dampen flow fluctuations, and achieve a more homogeneous spread of the reagent in the reaction chamber, consequently boosting the rate of desulfurization. Under a gas load of 1.74 million m3/h, the modified system exhibited a 5.9% gain in removal efficiency relative to the unmodified tower, with no penalty in energy consumption from added pressure loss. A secondary benefit was a decrease in abrasive wear on the containment walls from solid particles, which served to improve the structural integrity and operational dependability of the entire unit.
Dehydrogenation is a common industrial method for large-scale olefin production. As the chemical kinetics of such processes are highly temperature-dependent, catalysts are employed. However, these catalysts require constant regeneration. To address these challenges, industrial fluidized bed technology was developed for the production of isobutylene from isobutane [47,48] and propylene from propane [49]. The fundamental configuration for isobutane dehydrogenation involves a fluidized bed reactor operating in conjunction with a regenerator. The employment of specific catalysts, primarily those based on chromia-alumina, is essential for attaining high reaction rates and selectivity [50,51]. The critical importance of the catalyst in dehydrogenation has driven considerable research into optimizing its activity and selectivity. Authors of [52] performed experiments to optimize a PtSnK/Al2O3 catalyst for isobutane dehydrogenation, investigating the effects of parameters such as the platinum-to-tin mass ratio, calcination temperature, and potassium mass fraction on the dehydrogenation characteristics. The findings revealed that the Pt/Sn mass ratio exerted the strongest influence on dehydrogenation performance, while the concentration of H2PtCl6 had the weakest. An optimal catalyst formulation—achieved with a Pt/Sn ratio of 1:1 and a potassium content of 0.8%—yielded an average isobutane conversion of 46.59%. In studies [53,54], the authors experimentally investigated a laboratory-scale fixed-bed reactor for isobutane dehydrogenation using a Ga2O3/Al2O3 catalyst at atmospheric pressure. The isobutane dehydrogenation process was also analyzed by [55] in a fluidized bed reactor, focusing on how different gallium loadings on a Ga2O3/Al2O3 catalyst affected the reaction. Experimental data revealed that raising the gallium content from 3% to 9% boosted isobutylene yield from 27 wt.% to 32 wt.% and enhanced isobutane conversion from 42 wt.% to 55 wt%. Furthermore, the catalyst maintained high activity and selectivity throughout 60 reaction cycles. The authors of [56] assessed innovative methods for incorporating turboexpanders into the heating systems of gas-feedstock mixtures. They conducted theoretical analyses to determine the energy requirements for each configuration across different light alkane dehydrogenation processes. A combined numerical and experimental investigation was conducted in [57] to evaluate the role of propane co-feeding on the productivity of an isobutane dehydrogenation fluidized bed reactor utilizing a Cr2O3/Al2O3 catalyst. The study found that progressively adding propane to the feedstock—up to 60 wt.%—enhanced the fluidized bed reactor’s performance, increasing isobutylene selectivity over the Cr2O3/Al2O3 catalyst from 86% to 89%. A numerical simulation in [58] examined the dehydrogenation of isobutane within a bubbling fluidized bed reactor, with a specific focus on the impact of operating parameters on energy usage. This research analyzed the impact of reactor operating conditions on energy consumption. The results, derived from a three-phase model used to calculate isobutane conversion, demonstrated that energy consumption is inversely proportional to the conversion level. Operating parameters influence conversion by shifting the reaction equilibrium or altering the gas residence time. Among these, the volumetric flow rate of the feed stream was identified as the predominant factor affecting energy demand.
In this study, the process of isobutane dehydrogenation to isobutylene in a fluidized catalytic bed was investigated via numerical simulation. Based on experimental data, a model of a simple lab-scale reactor was developed. The model accounts for the main isobutane dehydrogenation reaction and two side reactions. The primary goal was to adapt the CFD model of isoparaffin dehydrogenation, originally developed for a laboratory fluidized bed reactor, for application to an industrial reactor. Industrial reactors differ significantly from their laboratory counterparts. Nevertheless, multiparameter studies are primarily feasible in simplified laboratory reactors, where parameters such as temperature, catalyst mass, and gas velocity can be systematically varied. This allows for the investigation of different parameter combinations, even those anticipated to yield low product output. The laboratory reactor responds rapidly to parameter changes, which facilitates the calibration of the CFD model, specifically the parameters of the chemical reaction kinetics. The central aim of the present study is to evaluate the results obtained from simulating an industrial reactor using a model calibrated on laboratory reactor data. This concept embodies the essence of the “from laboratory to industry” approach. We performed calculations for an industrial reactor, analyzing temperature fields and reaction product formation zones. A comparison of simulation results for laboratory and industrial reactors was conducted, highlighting key differences. This methodology can significantly reduce the time required for parameter setup in large-scale industrial reactor simulations. The CFD model settings from the laboratory reactor serve as an initial approximation, which requires further refinement through validation against extensive operational data from the industrial unit.

2. Materials and Methods

This study aims to perform CFD simulation of an industrial-scale reactor for isobutane dehydrogenation to isobutylene, accounting for multiple chemical reactions. The simulation approach will be validated against a laboratory-scale reactor. Consequently, this paper presents detailed descriptions of both the laboratory and industrial reactor configurations, along with the fluidized bed model implementation.

2.1. Laboratory Reactor

We describe a laboratory reactor with fluidized bed od of catalyst particles. The main reaction in this reactor is dehydrogenation of isobutane to isobutylene. The laboratory reactor is a vertical steel pipe measuring 70 cm in height with an inner diameter of 2.8 cm (Figure 1a). The reactor contains a central channel (65 cm high, 0.6 cm diameter) for a temperature sensor, which is secured to the reactor walls by three horizontal struts. At the top, an outlet opening (0.3 cm diameter) is provided for gas exhaust, equipped with a miniature cyclone for catalyst particle recovery. An electric heating system surrounds the reactor to maintain the desired temperature, while thermal insulation minimizes heat loss to the environment. Temperature control is automated to ensure stable operating conditions.
Preheated isobutane is introduced into the lower section via a multilayer porous distributor, which ensures uniform flow distribution and prevents catalyst particles from entering the gas supply pipe. The process employs a granulated chromia/alumina catalyst [59,60,61,62,63]. Experimental data were obtained under the following conditions: solid particles mass of 100 g, gas temperatures of 550–625 °C, gas velocity of 0.016 m/s.
Previous work [64] provides detailed analysis of this process and develops a mathematical model for the simple cylindrical 3D geometry. The current study utilizes this process model for CFD simulations of both the laboratory reactor in 3D and 2D axisymmetric configurations, as well as for an industrial reactor. Unlike the simple cylindrical model without internal elements used in [64], our model incorporates the temperature sensor channel with its three supporting struts (Figure 1b). Additionally, the gas outlet is modeled as an eccentric tube rather than a central opening.
Given the large-scale dimensions of the industrial reactor, a 2D axisymmetric model was employed for CFD simulation. For consistency, a corresponding 2D axisymmetric model of the laboratory reactor was developed (Figure 1c) to enable comparison of the isobutane dehydrogenation process between the 2D and 3D simulations. In the axisymmetric model, the temperature sensor channel was represented along the symmetry axis, while the outlet was positioned near the peripheral boundary. The outlet surface area was determined to maintain equivalence with the corresponding area in the 3D model.

2.2. Industrial Reactor

A model of an industrial reactor with a fluidized catalytic bed is presented. Previous studies [37,38] analyzed an industrial reactor model based on parameters from an operational unit. This work extends this approach by developing a reactor model with different geometric parameters and incorporating additional internal components. Figure 2 shows the schematic of the industrial reactor model, including its main dimensions and design elements.
The industrial reactor comprises various internal components with both large-scale and detailed structural features. However, constructing a full three-dimensional model that accounts for all geometric details would require prohibitively high computational resources and time. A comparative analysis of simplified cylindrical models was conducted. The parameters N3D and N2D represent the number of mesh elements for the 3D and 2D-axisymmetric models, respectively. Approximately 20 different mesh resolutions were evaluated, revealing the following relationship: N3D ≈ 3.77 × N2D × N2D. For instance, if a mesh with N2D = 106 elements is used for the meridional cross-section of an industrial reactor, the corresponding full 3D model would require approximately N3D ≈ 3.77 × 10¹² elements. While the 2D case can be simulated on a modern workstation, the 3D case would necessitate specialized high-performance computing resources. Therefore, this study employs a 2D-axisymmetric model to maintain computational feasibility.
Given the cylindrical geometry of the reactor, a 2D-axisymmetric model was adopted for simulations. This approach assumes that any vertical cross-section fully represents the internal processes. Unlike a simple 2D plane model, the axisymmetric formulation is constructed by rotating the cross-sectional geometry around its central axis.
The reactor column stands 23.81 m high with a diameter of 4.6 m in its reaction zone. The gas distribution system (Gas Inlet 1) is located at the reactor base, comprising five concentric toroidal manifolds with nozzles. Isobutane at 550 °C is supplied with a feed rate of 8.05 kg/s through these nozzles. The middle section contains perforated baffles to suppress the formation of large gas bubbles. Catalyst is introduced through a central vertical pipe (Catalyst Inlet 1) at 650 °C with a feed rate of 33.3348 kg/s. Above this inlet, heat exchanger tubes are positioned to remove heat and reduce the risk of isobutane thermal cracking side reactions. Gas exits through cyclones (Outlet 1), whose significant volume in the actual reactor is accounted for in the model. Captured catalyst is returned to the reaction zone (Catalyst Inlet 2). At the base, a discharge channel removes spent catalyst to the regenerator (Outlet 2), with the mass flow rate balanced to match the fresh catalyst input. To prevent hydrocarbon leakage into the regenerator, nitrogen purge nozzles are incorporated in the lower section (Gas Inlet 2).
The use of a 2D axisymmetric model for the large-scale industrial reactor simplifies geometry construction, reduces mesh complexity, and accelerates computation. However, this approach imposes limitations on motion patterns and requires simplification of internal structural elements. In contrast, a 3D model accommodates gas and particle movement in all radial directions, such as spiral motion. Additionally, ascending gas bubbles in axisymmetric simulations manifest as rising toroidal voids, which may affect residence times and velocity distributions of both phases. Generally, the reactor column and numerous internal components exhibit axial symmetry or can be reasonably approximated as such. For instance, the gas supply manifolds are axisymmetric, though the nozzle representations constitute a simplification. The internal baffles, while not axisymmetric, span nearly the entire cross-section and are modeled by preserving their flow obstruction area. Similarly, other internal elements are simplified; the cyclone assembly, for example, lacks axial symmetry. Consequently, the upper reactor section is expected to exhibit the most significant deviations in gas and particle behavior from a 3D simulation.

2.3. CFD-Simulation Model

This study requires the development of a comprehensive model that accurately describes all key processes in the considered reactors. This includes defining the phase flow models, heat transfer mechanisms, and chemical reaction kinetics. The final equations were solved with ANSYS Fluent software (version 19.2). Furthermore, the numerical solution parameters, initial conditions, and boundary conditions must be specified.

2.3.1. Fluidize Bed Hydrodynamic Model

A two-fluid model was used for numerical simulation in this study. Each phase occupies a part of the total volume and is characterized by a volume fraction value   α . For each phase, the equations of conservation of mass, momentum, and energy are satisfied [23]. Let us consider these equations in detail.
The mass balance equation for the gas phase:
α g ρ g t + α g ρ g v g = 0
where v g is the gas phase velocity, ρ g is the gas phase density.
The equation governing the conservation of mass for the solid phase:
α s ρ s t + α s ρ s v s = 0
where v s is the solid phase velocity, ρ s is the solid phase density.
The equation governing the conservation of momentum for the gas phase:
α g ρ g v g t + α g ρ g v g v g = α g p + τ ¯ ¯ g + α g ρ g g + i = 1 N K g s v g v s
where K g s is the coefficient of interaction between gas and solid phases, τ ¯ ¯ g is the stress tensor in gas phase, p is the pressure. The stress tensor:
τ ¯ ¯ g = α g μ g v g + v g T + α g 2 3 μ g v g I ¯ ¯
where I ¯ ¯ is the unit tensor, μ g is the shear viscosity.
The momentum conservation equation for the solid phase:
α s ρ s v s t + α s ρ s v s v s = α s p p s + τ ¯ ¯ s + α s ρ s g + K s g v s v g
where K s g is the coefficient of interaction between solid phases and gas, τ ¯ ¯ s is the stress tensor in solid phase, p s is the pressure of solid phase granules. For the interaction of gas and solid phases, we have K g s = K s g . In Equation (5), the stress tensor:
τ ¯ ¯ s = α s μ s v s + v s T + α s λ s 2 3 μ s v s I ¯ ¯
where λ s , μ s are bulk viscosity and shear of the solid phase.
The balance equation for solid particle phase fluctuating energy [65]:
3 2 t α s ρ s Θ s + α s ρ s v s Θ s = p s I ¯ ¯ + τ ¯ ¯ s : v s + k Θ s Θ s γ Θ s + ϕ g s
where ϕ g s is the energy exchange between solid and gas phases, γ Θ s is the particle collisions energy dissipation, Θ s is the solid granule temperature, k Θ s is the granule energy diffusion coefficient.
The above system of equations is not mathematically closed. To close the equations, we will consider additional constitutional relations. For the interphase interaction coefficient, the model [23] is used:
K s g = 3 4 C D α s α g ρ g v s v g d s α g 2 / 65 , α g > 0.8 150 α s 1 α g μ g α g μ s 2 + 1.75 ρ g α s v s v g d s , α g 0.8
where drag coefficient:
C D = 24 α g R e s 1 + 0.15 α g R e s 0.687
Reynolds number
R e s = α g ρ g d s v s v g μ g
Standard models [23,65,66,67] were employed to calculate the solid phase’s shear viscosity, bulk viscosity, granule pressure, diffusion, and energy dissipation.
Models of solid phase parameters, such as granule pressure, viscosity, energy dissipation, were selected according to [23,65,66,67].
The interphase interaction for the two solid phases is defined by the model in [68]:
K i j = 3 1 + e i j π 2 + C f r , i j π 2 8 α i ρ i α j ρ j d i + d j 2 g 0 , i j 2 π ρ i d i 3 + ρ j d j 3 v j v i
where g 0 , i j is the radial distribution coefficient, C f r , i j is the friction coefficient between the i-th and j-th solid phases (can be set equal to 0), e i j is the coefficient of recovery of solid phase particles after a collision. While the default value e i j is typically set at 0.9, it can be adjusted to match the specific particle type.
The presence of solid particles contributes to the swirling of the gas phase flows. Therefore, the phase movement will be turbulent. To account for turbulence, we used a k ε dispersed model, the movement of the “secondary” phases is generated due to the turbulent movement of the “primary” gas phase.

2.3.2. Fluidize Bed Heat Transfer Model

The gas phase energy conservation equation:
α g ρ g h g t + α g ρ g v g h g = α g p t + τ ¯ ¯ g : v g + h g s A T g T s
where A is the heat exchange surface area, h g s is the heat transfer coefficient between gas and solid phase, h g is the gas enthalpy.
The solid phase energy balance equation:
α s ρ s h s t + α s ρ s v s h s = α s p t + τ ¯ ¯ s : v s + h s g A T s T g
where h s g is the heat transfer coefficient between solid and gas phase, h s is the solid phase enthalpy.
In the energy conservation equation, the heat transfer coefficient is:
h s g = κ g Nu s d s
where κ g in Expression (14) denotes the thermal conductivity coefficient, the Nusselt number governing heat exchange between a gaseous phase and a granulated solid phase is given by the following relation [69]:
Nu s = 7 10 α g + 5 α g 2 1 + 0.7 R e s 1 5 P r 1 3 + 1.33 2.4 α g + 1.2 α g 2 R e s 7 10 P r 1 3
Prandtl number:
P r = C p g μ g κ g

2.3.3. Chemical Reaction Model

The gas multicomponent mixture conservation equation:
ρ g Y i t + ρ g v g Y i = J i + R i
where J i is the diffusion flux arising from concentration and temperature gradients, R i is the component formation source arising from chemical reactions, Y i is the mass fraction of the i-th component. For turbulent flux:
J i = ρ D m , i + μ t Sc t Y i D T , i T T
where D m , i and D T , i are mass and thermal diffusion coefficients, μ t is the turbulent viscosity, Sc t is the turbulent Schmidt number.
Besides the primary reaction of isobutane dehydrogenation to isobutylene, several side reactions may occur, including cracking, isomerization, alkylation, aromatization, and subsequent coking. Temperature plays a critical role in this process; elevated temperatures can promote isobutane cracking. For the dehydrogenation process using a chromia/alumina catalyst at 550–580 °C, typical yields are 35–50% isobutylene, 3–7% cracking products, and 0.2–0.5% isomerization products, with coke formation ranging from 0.2 to 2.0 wt%.
Experimental data were generated using the setup described in [61,63]. The dehydrogenation cycle comprised the following steps: 40 min of dehydrogenation, 5 min of nitrogen purging, 30 min of air regeneration at 650 °C, and another 5 min of nitrogen purging. This cycle was repeated continuously for 16 cycles. During dehydrogenation, gas samples were collected at 20 and 40 min intervals. Two distinct gas chromatography (GC) methods were employed for compositional analysis. Hydrocarbon species in the feedstock and products were separated using a GH-1000 instrument (Khromos, Dzerzhinsk, Russia) featuring a VP-Alumina/KCl capillary column (VICI Valco, Houston, TX, USA) and detected with a flame ionization detector. Conversely, the levels of H2, CH4, and CO were measured on a separate GH-1000 system fitted with a thermal conductivity detector and a 13X molecular sieves packed column. The averaged experimental data are summarized in Table 1.
Table 1 demonstrates that numerous species are formed in the gas phase during the process. Simulating all of these species would require accounting for numerous chemical reactions. Therefore, this study focuses only on reactions producing species with mass fractions exceeding 2% in the gas phase. Three key reactions were selected: dehydrogenation of isobutane to isobutylene, thermal cracking of isobutane, and hydrogenation of propylene to propane.
i - C 4 H 10 i - C 4 H 8 + H 2
i - C 4 H 10 CH 4 + C 3 H 6
C 3 H 6 + H 2 C 3 H 8
In Equation (17), R i determines the formation rate by chemical reactions from:
R i = M w , i r = 1 N R R ˙ i , r
where N R is the number of reactions involving the i-th component of the mixture, M w , i is the molecular weight.
R ˙ i , r = k f , r A c a t j = 1 N C j , r η i , r
where k f , r is the reaction rate constant, η i , r is the exponent for the reactant j-th component in the reaction, C j , r is the concentration of the j-th component of the mixture, A c a t is the coefficient of gas–solid contact area for catalytic reaction.
The reaction rate constant is calculated using the Arrhenius equation:
k f , r = A r e E r R T
where E r is the activation energy, A r is the pre-exponential factor. From the analysis of a series of experiments, the values of the pre-exponential factor and activation energy can be calculated [64]. For the selected Equations (19) and (20), the results obtained are presented in Table 2.

2.3.4. Particle Mean Diameter

When simulating a fluidized bed with a two-fluid model, it is important to correctly select the average particle diameter for the case of a polydisperse solid phase. Laboratory experiments were conducted on polydisperse particles ranging from 20 to 250 μm in diameter. A catalyst, which initially has a similar particle size distribution, is loaded into an industrial reactor. Of course, during long-term operation of the reactor, the particles are destroyed and abraded. This will lead to a change in the particle distribution. However, in this study, we do not consider such changes.
A Mastersizer 2000 analyzer (Malvern Instruments, Malvern, UK) was used to determine the particle size distribution, with data processed using the instrument’s native software (version 5.60). The Sauter mean diameter, defined by the following expression using the particle size distribution density function f ( D ) was used in the simulation of the experiments [70]:
D 32 = 0 f ( D ) D 3 d D 0 f ( D ) D 2 d D
The distribution density function fulfills the following condition:
0 f ( D ) d D = 1
In studies [71,72,73,74], the authors examined the behavior of the particle bed upon the addition of fine granules with a diameter of less than 45 µm. An expansion of the particle bed and a decrease in the average volume fraction of the solid phase were observed. In other cases, the addition of these particles results in a decrease in solid phase voidage [75,76]. The authors of [77] found that the addition of fine particles only slightly reduces the effective viscosity. The authors of the study [78] experimentally studied the behavior of a fluidized bed using X-ray tomography. The addition of fine particles resulted in a decrease in the size of gas bubbles. Numerical simulation was used to evaluate the effect of fine particles on the fluidized bed in the study [79]. The authors showed that the addition of fine particles contributed to a decrease in the size and number of bubbles. This led to more stable reactor operation.
The terminal velocity was employed to evaluate the necessity of implementing multiple solid particle fractions, enabling identification of particles susceptible to entrainment at the specified gas velocity. The terminal velocity is defined according to [4] as:
v t = 4 g D ( ρ s ρ g ) 3 ρ g C D 0.5
where coefficient CD is from the Equation (9). By setting the velocity value v t and solving Equation (27) relative to the particle diameter D, we find the diameter value Dt that will separate the particles into “heavy” and “light” for a given velocity.
For a laboratory reactor operating in the gas velocity range of 0.008–0.016 m/s, the value of Dt is significantly small. So for a gas velocity of 0.016 m/s, Dt = 11 µm. That is, here we will use one fraction of the solid granular phase with a mean diameter of D32 = 84 µm.
In an industrial reactor, the gas velocity is significantly higher. Consequently, a substantial amount of catalyst particles is entrained from the reactor. These particles are returned to the middle zone via multiple cyclones. The terminal velocity analysis yielded a value of Dt = 57.3 μm. Particles with diameters smaller than 57 μm will rise to the top of the reactor, where they may be entrained and returned via cyclones. In contrast, particles larger than 57 μm can form a height-limited bed, depending on the reactor dimensions and total particle inventory. For industrial reactors, separating particles into fine and coarse fractions enables simulations to more accurately represent actual fluidized bed behavior. As demonstrated in [38], incorporating 30% fine particles in numerical simulations improved fluidized bed reactor performance predictions compared to using a single mean particle size. In this study, catalyst polydispersity was accounted for by employing two mean diameters: fine particles (30% by volume) and coarse particles (70% by volume). The experimental polydisperse catalyst contained 30% by volume of particles up to 48.7 μm in size. Using Equation (25), two mean diameters are determined for each of the two sections of the particle distribution function: for fine and coarse particles. The results obtained are: D32 = 40.38 μm for fine particles, D32 = 99.53 μm for coarse particles. For ease of use in the numerical simulation, we round the values to D32 = 40 μm for fine particles and D32 = 100 μm for coarse particles.
Developing more accurate particle classification models for industrial reactors requires comprehensive analysis of operational data, which represents a focus for future research.

2.3.5. Boundary and Initial Conditions

The gas phase in the reactor comprises multiple chemical species, each treated as a standard substance with defined properties including density, viscosity, thermal conductivity, and heat capacity. The gas mixture is modeled as an ideal gas. For the solid phase, the following properties were assigned: density of 2400 kg/m3, heat capacity of 1047 J/(kg·K), and thermal conductivity of 37 W/(m·K).
Boundary conditions were defined based on actual operating parameters of both laboratory and industrial reactors. All impermeable surfaces were modeled as walls. In the laboratory reactor, temperature was specified at the side walls, while a small section of the top wall was treated as thermally insulated—a simplifying assumption reflecting the presence of insulating material in the experimental setup.
For the industrial reactor, the fresh catalyst feed pipe wall temperature was set equal to the incoming catalyst temperature (650 °C), while all other walls were considered thermally insulated. This insulation assumption represents a greater simplification than in the laboratory case, as industrial reactors operate continuously for months with complex multilayer insulation (concrete, metal, and mineral wool) to minimize heat loss. However, given the short average gas residence time of ~36.2 s and high flow rates, the energy transfer to the external walls is negligible. Therefore, neglecting heat losses through the reactor walls represents a justified simplification for this study.
For the 2D axisymmetric models, the axis boundary condition was applied. The “pressure-outlet” boundary condition is at the top gas outlet section in all reactor configurations. In the industrial reactor model, this condition was also applied at the bottom section to simulate catalyst outflow to the regenerator. The industrial reactor model also simulated the operation of cyclones.
Particles that entered the outlet surface at the top of the reactor are returned to the working area through the cyclones, where the “mass-flow inlet” condition was specified. In the constructed model, the “mass-flow inlet” conditions were specified in the cyclone outlet channels in accordance with the catalyst flow through the outlet channel at the top of the reactor. This cyclone model is a simplification. Here, particles entering the “outlet 1” boundary are immediately returned to the reactor above the upper baffle. In a real cyclone, the catalyst particle will move for some time. During this time, even the smallest particles may be carried out of the cyclone. The model implemented in this study greatly idealizes cyclone operation. However, constructing a more accurate cyclone simulation model requires a separate study examining cyclone operation under different gas and particle loads. If these studies can yield relationships between particle entry into the cyclone and their injection, this model can be used in further studies for more accurate simulation.
The “mass-flow inlet” conditions were set for the gas feed in the laboratory and industrial reactor models. In the laboratory reactor model, we often talk about the gas velocity. This is due to the fluidized bed hydrodynamics, where many parameters depend on the gas velocity. In the CFD simulation, we used the gas mass-flow condition. From the gas mass-flow, we can calculate the gas velocity for the fluidized bed hydrodynamics analysis. In the industrial reactor, a continuous catalyst feed from the regenerator is also set. There, the “mass-flow” inlet condition is also set. More detailed information about the gas and solid phases at the reactor feed boundary is presented in Table 3.
For the initial conditions, a fixed catalyst bed was defined at the bottom of the reactor based on a given catalyst mass. In the laboratory reactor configuration, the catalyst mass is 100 g with an initial solid phase volume fraction of 0.5. The selected initial volume fraction does not significantly influence the final solution but affects the time required to achieve the fluidized state and the numerical stability during initial iterations. From these parameters, the initial bed height was calculated as 13.53 cm.
For the industrial reactor, a fixed catalyst bed was similarly established at the bottom. The total catalyst mass is 103.77 tons, with an initial total solid phase volume fraction of 0.5. But to simulate the industrial reactor, we use two fractions of the solid phase: 30% of fine particles and 70% of coarse particles. Therefore, we will set the initial volume fraction of the solid phase for fine particles to 0.15, and for coarse particles to 0.35. Here, the reactor shape is complex, so we will select the height of the initial bed until we reach the total mass of the solid phase of 103.77 tons. We obtained an initial bed height of 12.06 m. This approximately corresponds to the bed of the middle baffle.
Following initialization of the catalyst distribution, the numerical simulation was initiated. The flow field subsequently attained a quasi-steady state, representative of the reactor’s hydrodynamic and thermal behavior within the modeling framework. The duration required to achieve this quasi-steady state varied with specific computational parameters, as discussed in the Results section (Section 3).

2.3.6. Mesh and Time Step

The implementation of numerical simulation methods requires discretizing each reactor model into finite volumes using a computational mesh. In this study, all models were discretized using structured quadrilateral cells.
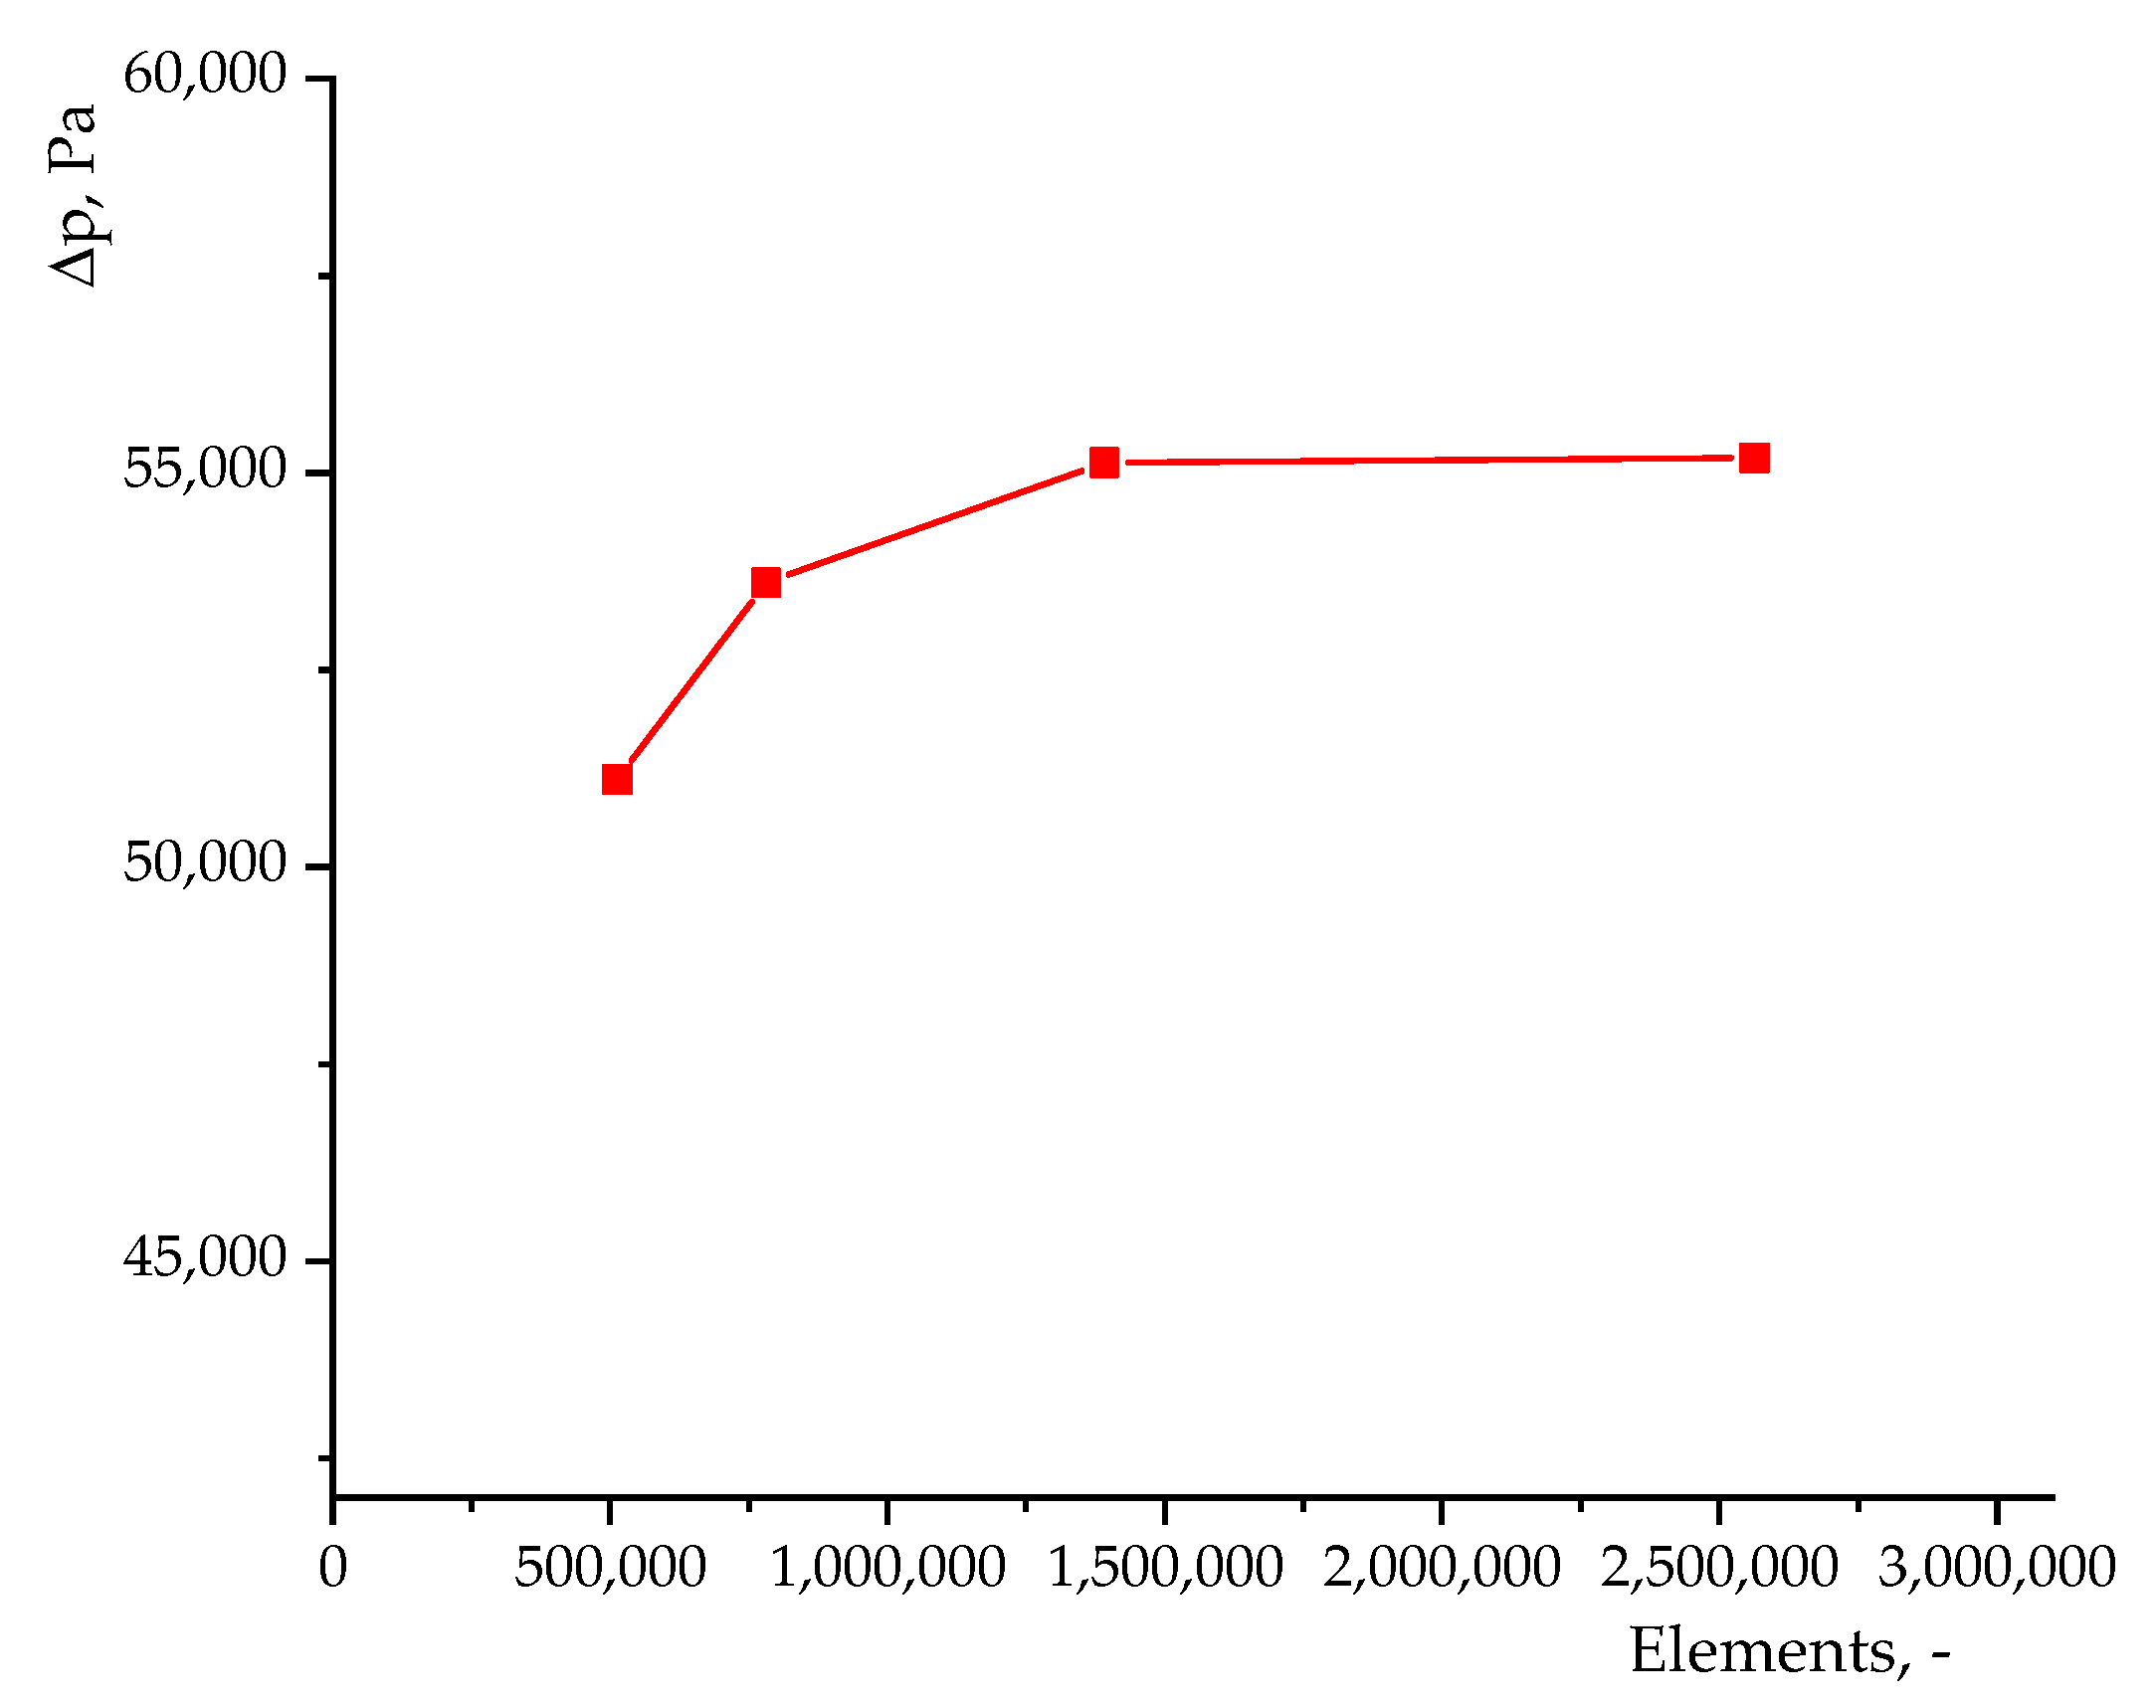
Several meshes were tested for a laboratory reactor with cell sizes Δ x = 0.005 m, 0.0025 m, 0.001 m, 0.0005 m. To assess the optimal size, the parameter of the average value of the solid phase volume fraction over the entire height of the reactor was considered (Figure 3a). The results are presented for the average values of the volume fraction of the numerical simulation from the 50th to the 150th second of calculation. It can be seen that reducing the mesh size has no effect on the profile of the solid phase volume fraction after the value Δ x = 0.001. The averaged values of the pressure drop between the inlet and outlet surfaces are also considered (Figure 3b). A significant difference is observed for the value Δ x = 0.005 m. With a further reduction in the mesh size, the pressure drop values reach a constant value. There are differences between the average pressure drop values for the Δ x = 0.0025 m and Δ x = 0.001 m cases. For the Δ x = 0.001 m and Δ x = 0.0005 m cases, the differences between the average pressure drop values are less than 0.5 Pa. A more detailed study of the mesh for a model of a simple cylindrical laboratory reactor was carried out in [64,80]. An example mesh for a laboratory reactor model is shown in Figure 4a.
The entire region of the large-scale reactor where the gas and solid phases move is also divided into quadrangular elements, the sizes of which are sufficient to determine the characteristic factors of the process under study. A hybrid mesh with different cell sizes is used here. For example, thickening is required in the region near the walls, baffles, and nozzles. In the free zone of the reactor, the cell size is larger. Therefore, for an industrial reactor, we will use the number of mesh elements rather than the average cell size. It is difficult to use the volume fraction of the solid phase to evaluate the mesh quality, since particles are located throughout the entire volume of an industrial reactor. Here, only the pressure drop between the gas inlet boundary and the reactor outlet boundary through the cyclones is used. The results are shown in Figure 5. A mesh with a cell size of 1,391,747 was chosen as the optimal option. A further increase in the number of cells does not lead to a significant change in the pressure drop, but requires greater computational costs. In this case, the mesh consists of elements of size Δ x = 0.005 m in the region near the walls and nozzles, and a cell size of Δ x = 0.01 m in the free zone of the reactor. An example of a mesh for an industrial reactor model is shown in Figure 4b.
Another important task is to determine the optimal time step size Δ t . We used the Courant criterion:
N C = v Δ t Δ x .
Scientific studies have limits for the Courant number for a fluidized bed that differ from standard limits for gas or liquid flow. For example, the study [81] proposed a maximum limit of 0.3. t task is to determine the optimal time step size. For monodisperse suspensions fluidized by a liquid, the authors of [82] proposed to set a limit on the Courant number in the range from 0.03 to 0.3. Then, for the laboratory reactor model, the time step should be in the range from 0.001875 s to 0.01875 s. We chose Δ t = 0.005 s. In an industrial reactor, we have a higher gas velocity and a larger mesh size. Here, the time step should be in the range from 0.000399 s to 0.007979 s. We chose Δ t = 0.001 s.
Final values Δ x and Δ t . For laboratory reactor models Δ x = 0.001 m and Δ t = 0.005 s. For industrial reactor model Δ x = 0.005 − 0.01 m and Δ t = 0.001 s.
In the process of solving a discretized system of equations, at each time iteration, an additional 40 space iterations are performed. This ensures solution convergence at each time step and the overall accuracy of the constructed model. A sufficient condition for terminating iterations over space at a time step is the condition of achieving residuals of 10–6. If the specified accuracy is not achieved, in any case after 40 iterations in space, the solution moves to the next iteration in time. In the initial iterations, when the particle bed begins to move, an accuracy of approximately 10−3 was achieved. Subsequently, when developed fluidization was simulated, an accuracy of 10−6 was achieved.

3. Results

Here we will consider the results of the numerical simulation. First, we will set up the calculation to simulate a laboratory reactor in 3D and in the 2D axial symmetry approximation. We will apply the resulting settings to simulate a large-scale industrial reactor.

3.1. Laboratory Reactor Simulation

For the laboratory reactor model, we have experimental results for the following conditions: mass of solid catalyst particles 100 g; gas velocity 0.016 m/s; reactor temperature 550 °C, 575 °C, 600 °C and 625 °C. We need to compare the CFD simulation results of 3D and 2D axisymmetric models.

3.1.1. 3D Simulation

At the initial time (t = 0 s), a stationary particles bed is located at the bottom of the reactor. After gas is supplied, the bed begins to fluidize and chemical reactions begin. In the calculation, we measure the mass fractions of gas species at the outlet section of the reactor. At first, the mass fractions of species are non-stationary and can increase and decrease. After about 200 s of the calculated time, the observed changes cease to exceed 2%. We believe that the process has reached a stationary mode and can evaluate the simulation results.
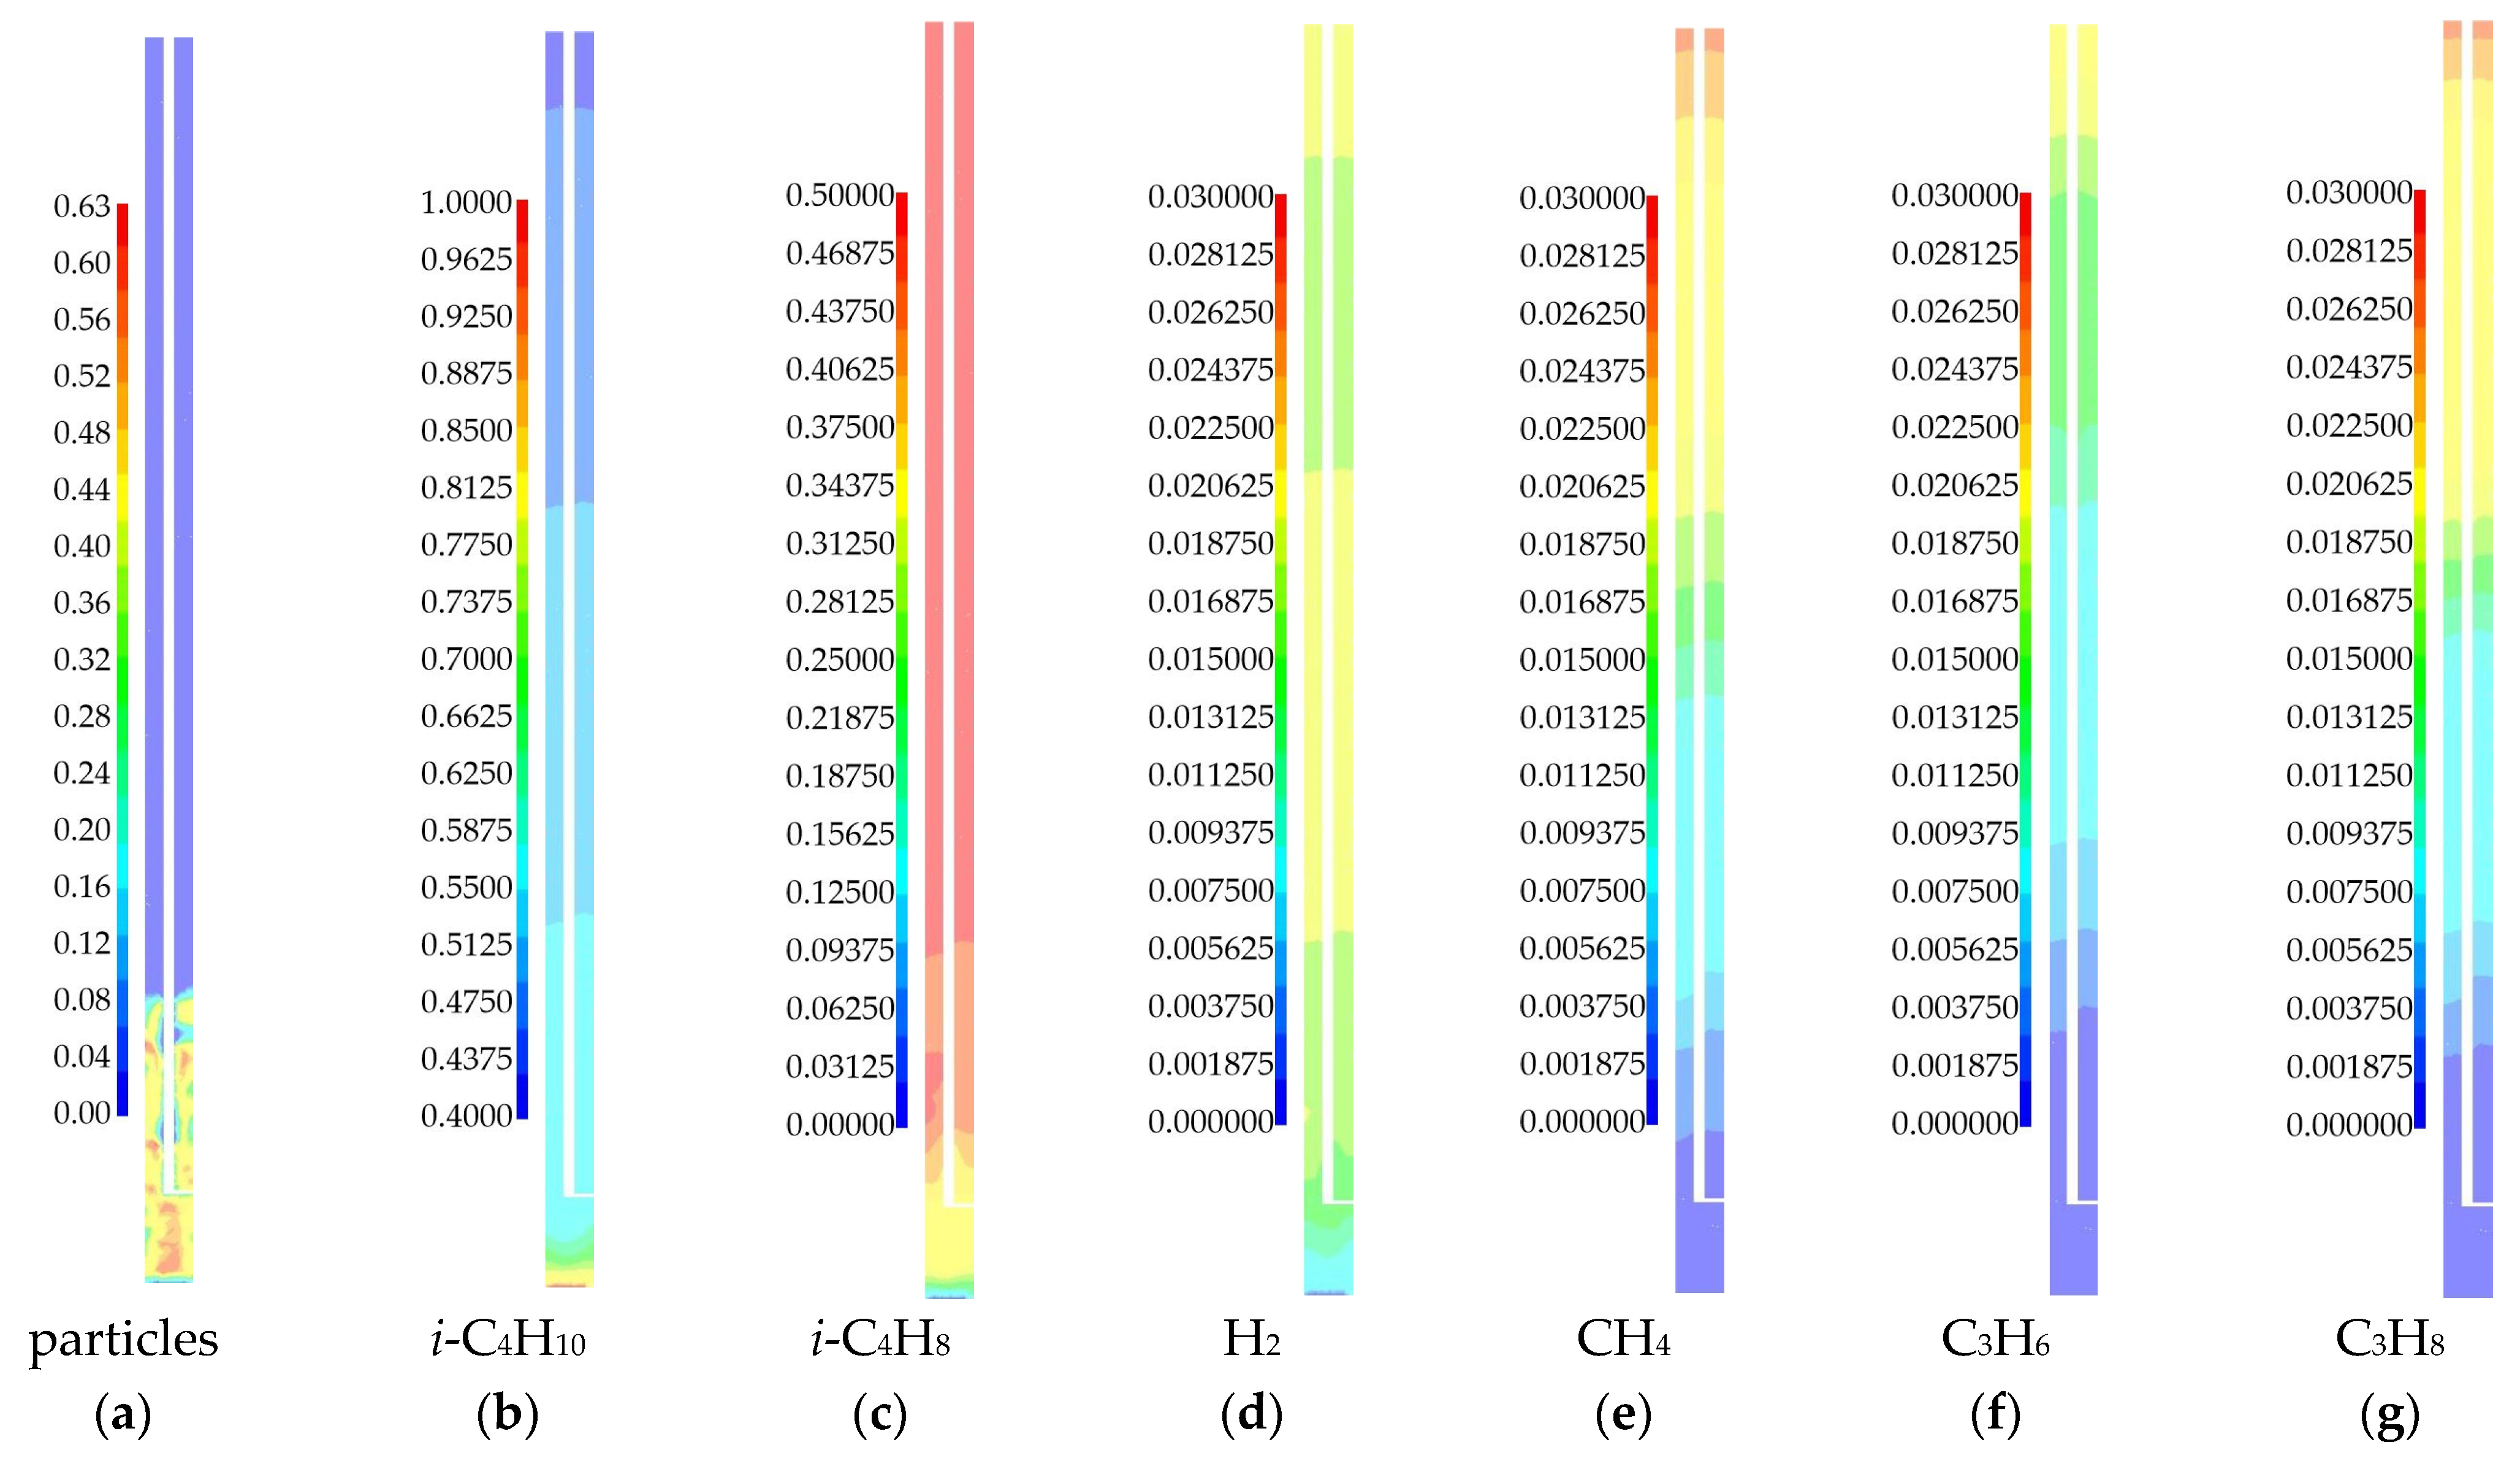
Figure 6 shows the calculated fields of solid phase volume fraction and mass fractions of gas phase species at time t = 240 s for the case of a temperature of 575 °C.
The particle bed has a limited height (Figure 6a). There are zones with a dense bed (red) and zones with no particles (blue). This fluidization regime can be considered as a bubbling, when individual gas bubbles rise through the bed. It can also be seen that there is non-uniformity in the particle distribution along the reactor height. Thus, considering the channel for the temperature sensor affects the average particle concentration in the bed and the height of the particle bed.
Isobutylene formation occurs in the catalyst particle bed. Above the bed, the change in the concentration of this product is not noticeable. The appearance of by-products can be observed along the entire height of the laboratory reactor. But we see their greatest formation above the particle bed. This can be explained by the fact that in the absence of a part, there is no isobutylene formation. There, all the isobutane can be used to form by-products. In the lower part of the reactor, the gas volume is limited by the presence of a large amount of the solid phase. Here, the mass of isobutane goes to the formation of isobutylene as the main product of the dehydrogenation reaction. Hydrogen is primarily formed as a result of the main reaction. In the upper part of the reactor, the mass fraction of hydrogen can decrease due to the reaction of hydrogenation of propylene to propane.
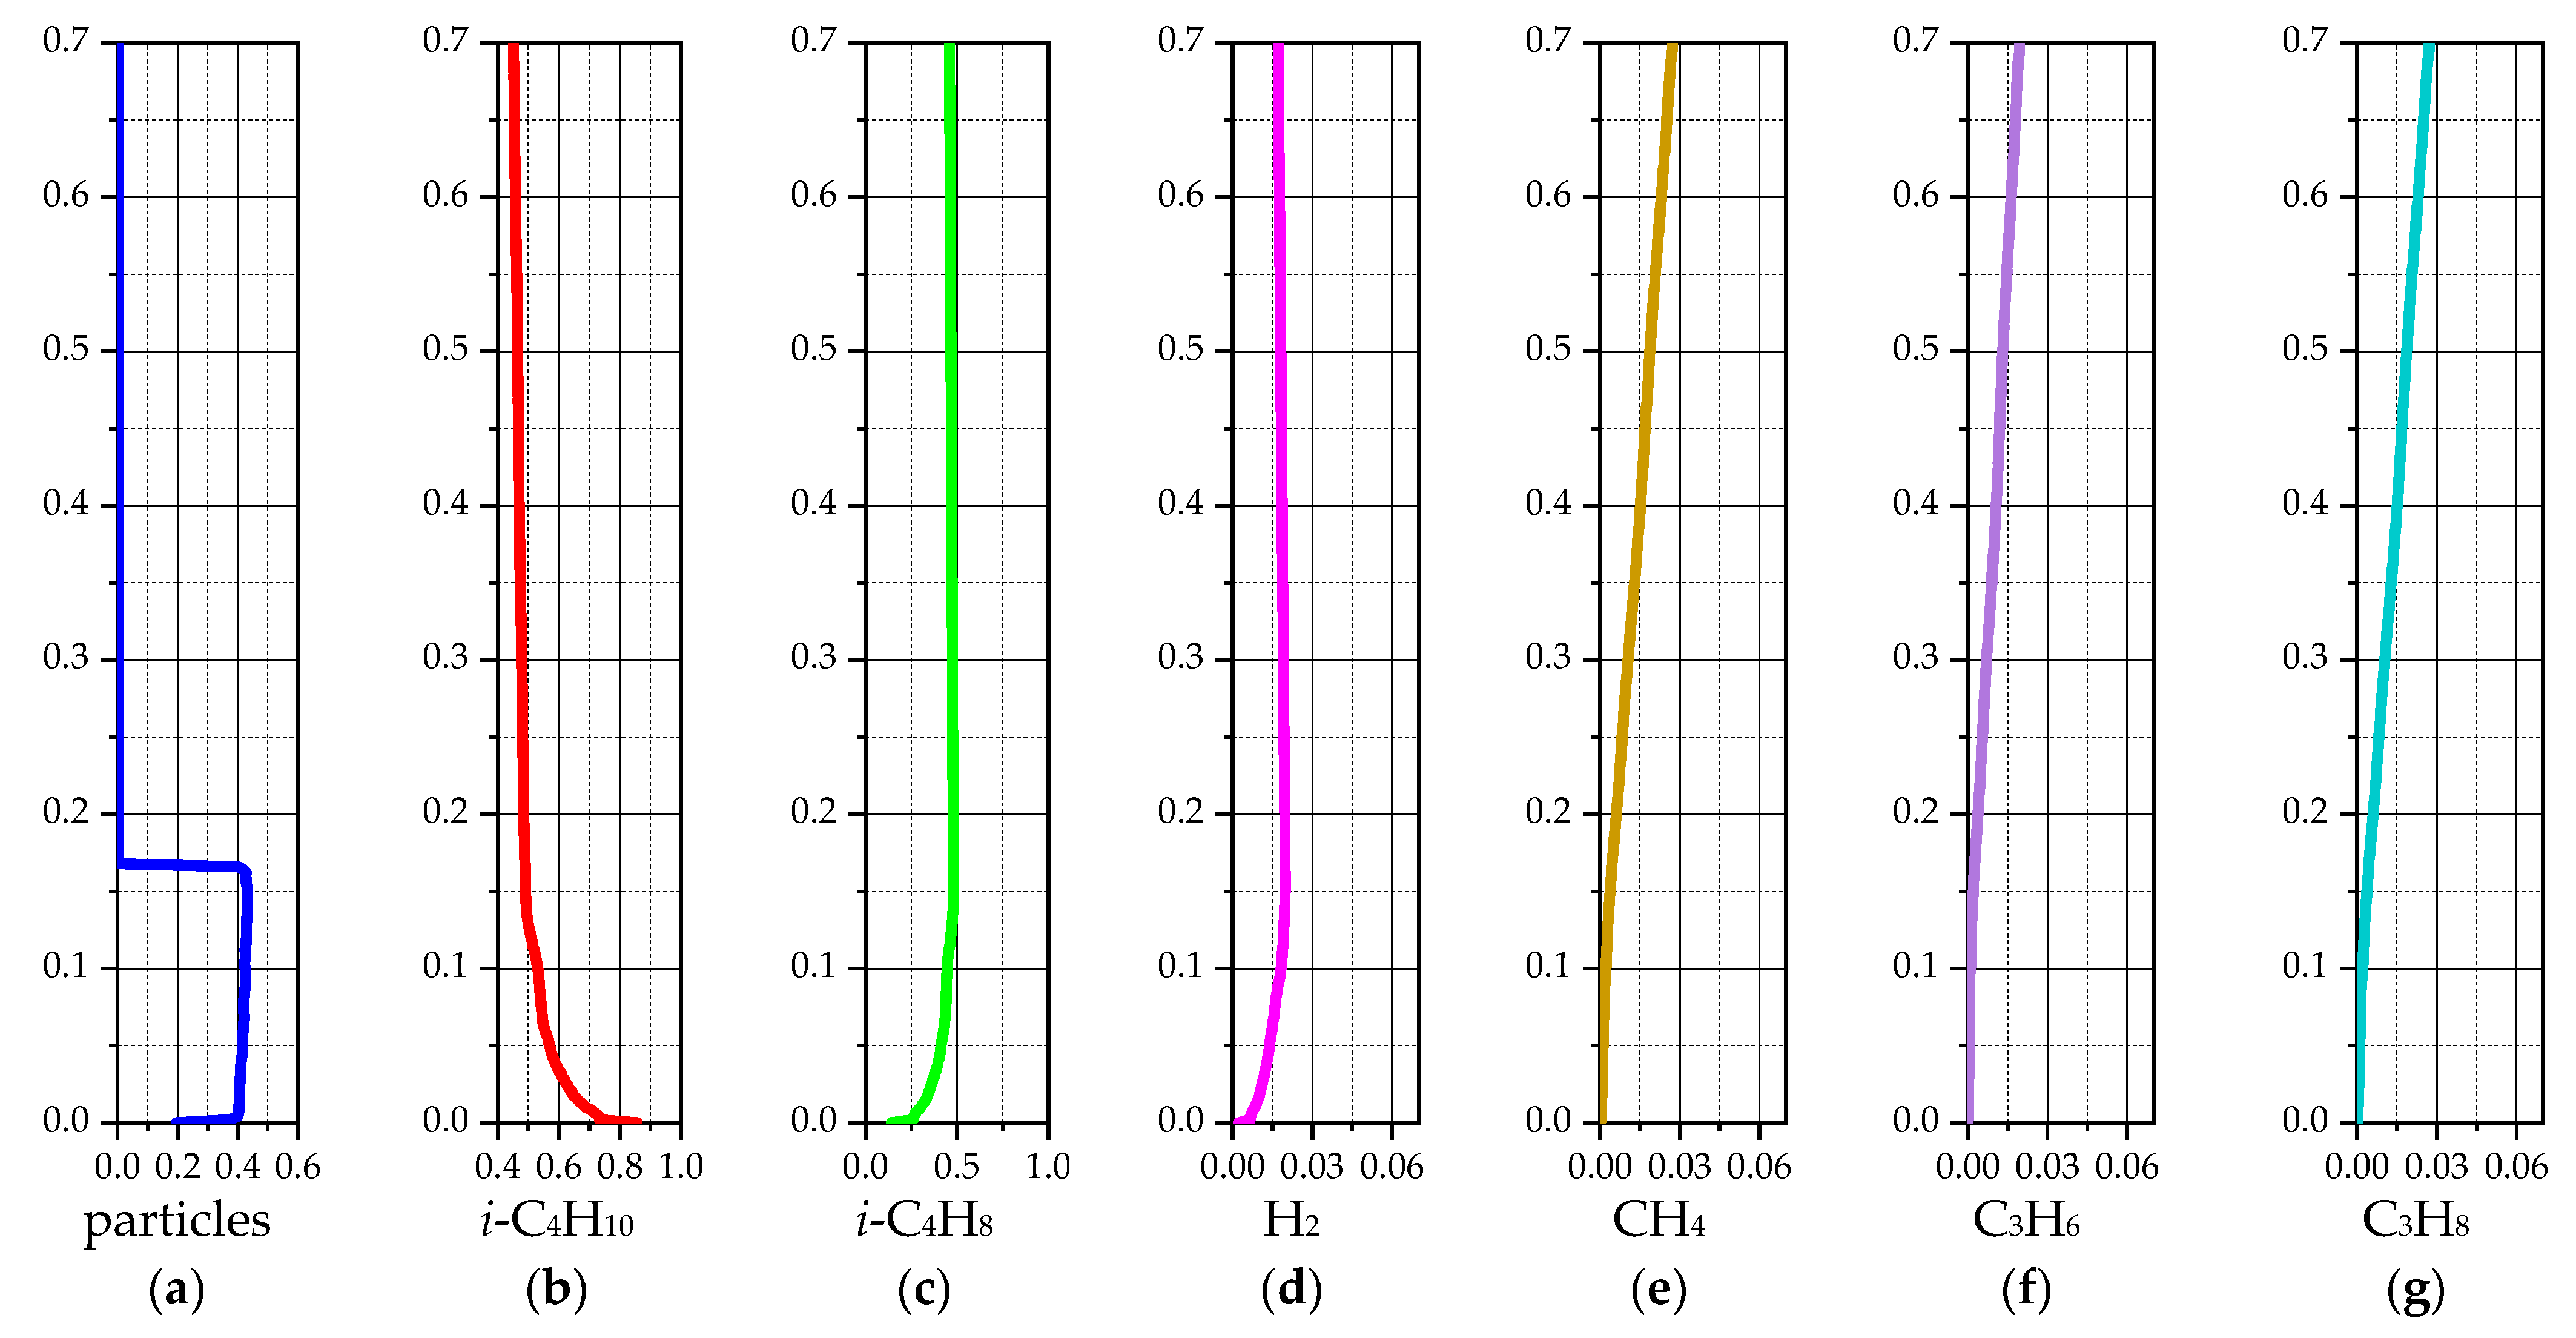
Figure 7 shows the average values of the simulation results for the case of a temperature of 575 °C. These graphs are obtained by averaging the results from 240 s to 420 s of the reactor simulation and are presented according to the height of the laboratory reactor.
The average values of the gas phase species are almost identical to the instantaneous fields shown in Figure 6b–g. This is due to the simple shape and small size of the laboratory reactor, the gas flow from the lower to the upper section, and the constant temperature maintenance system. From Figure 7a, it is possible to estimate the average volume fraction of the solid phase as ~0.419 and the average height of the particle bed as ~0.167 m. This may allow one to estimate the average area and contact time of the gas with the solid particles when passing through the fluidized catalyst bed.
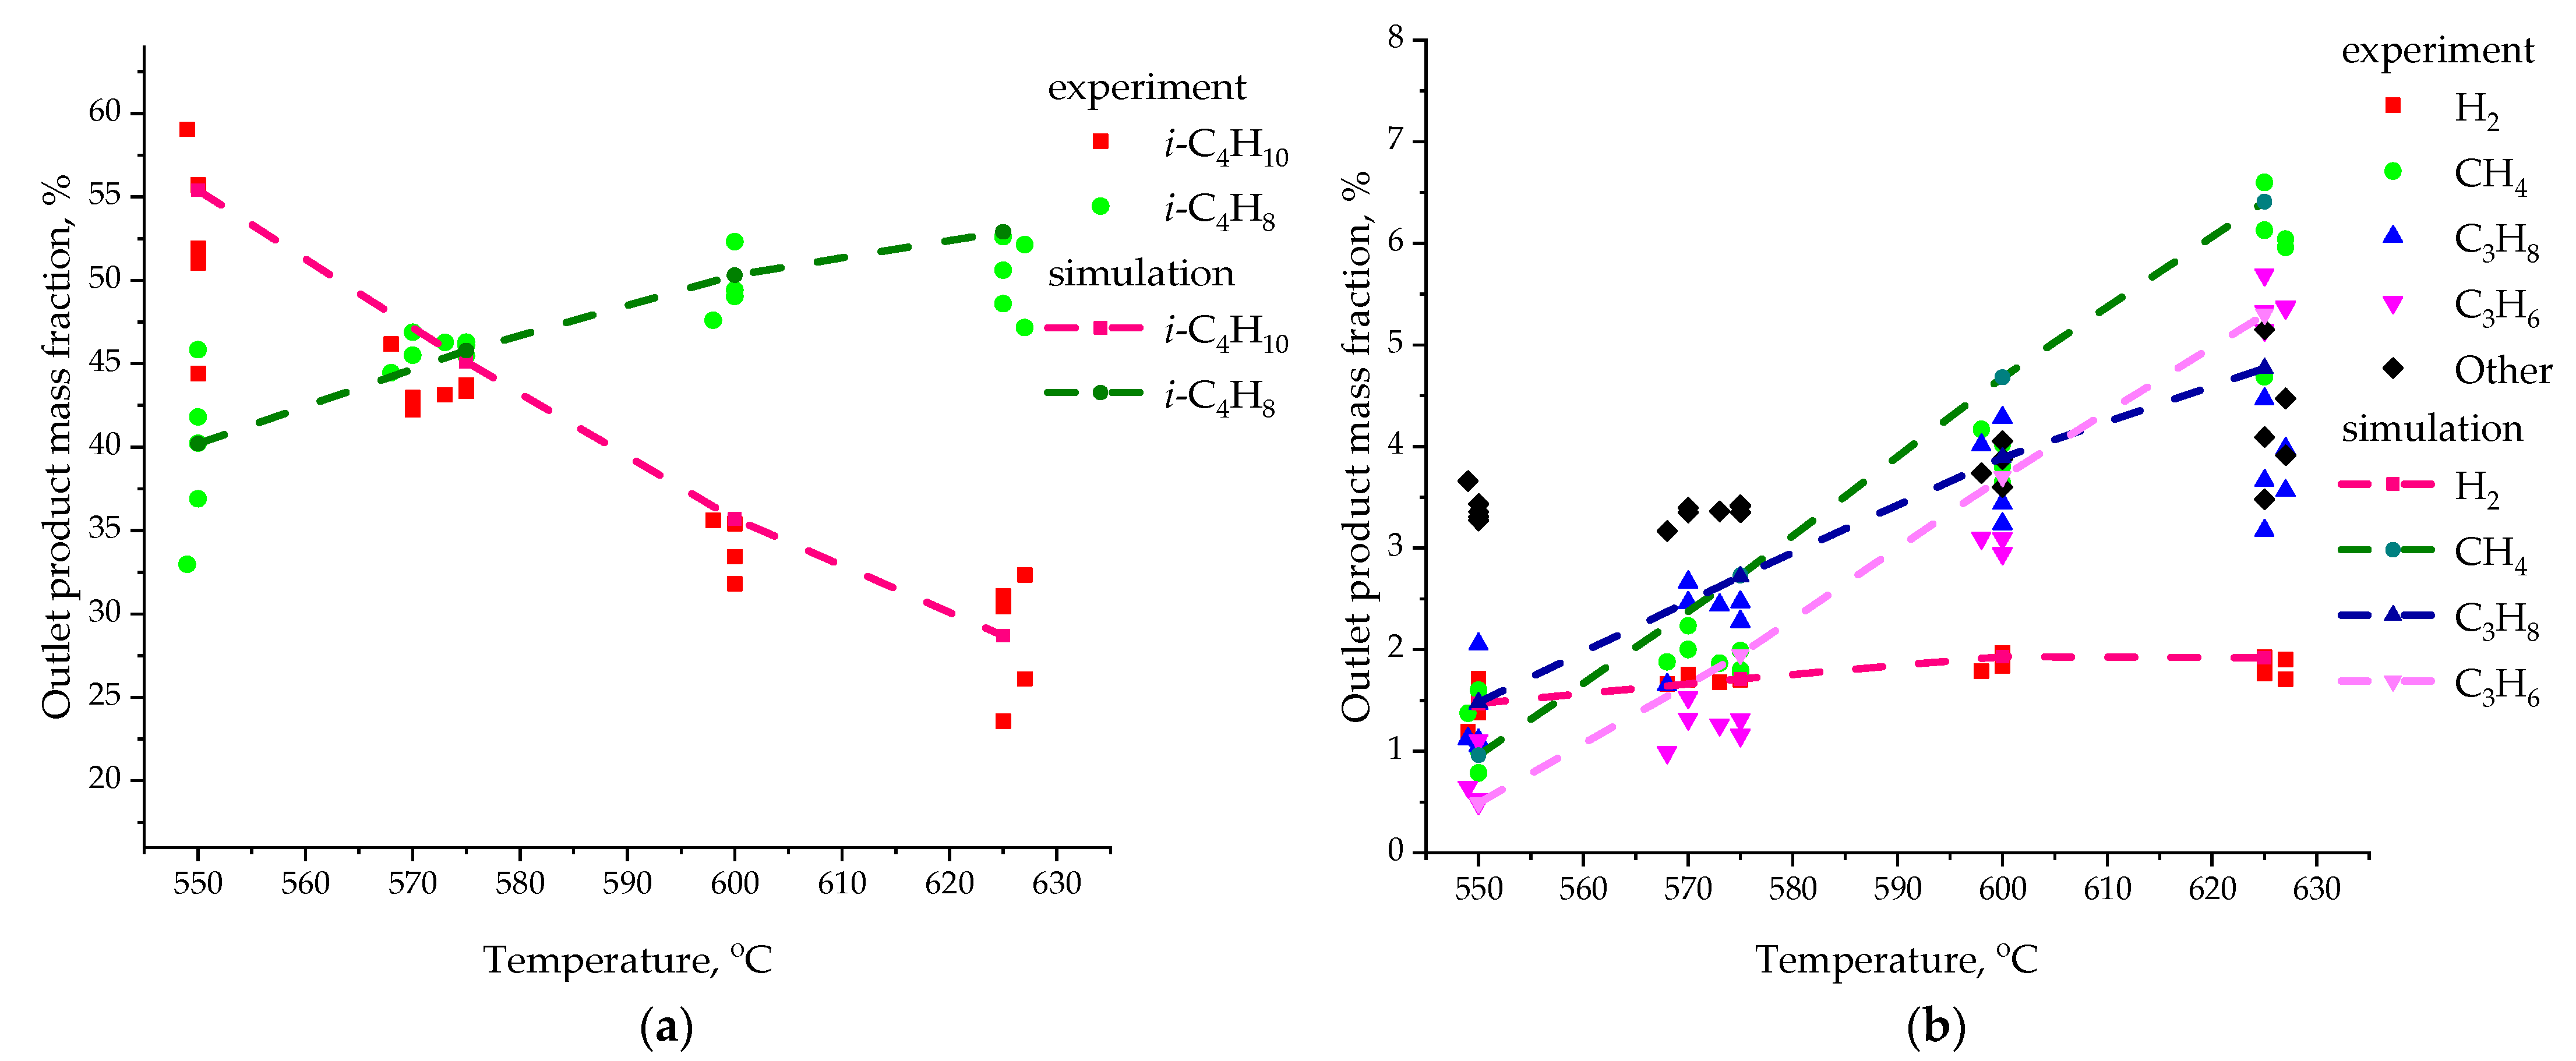
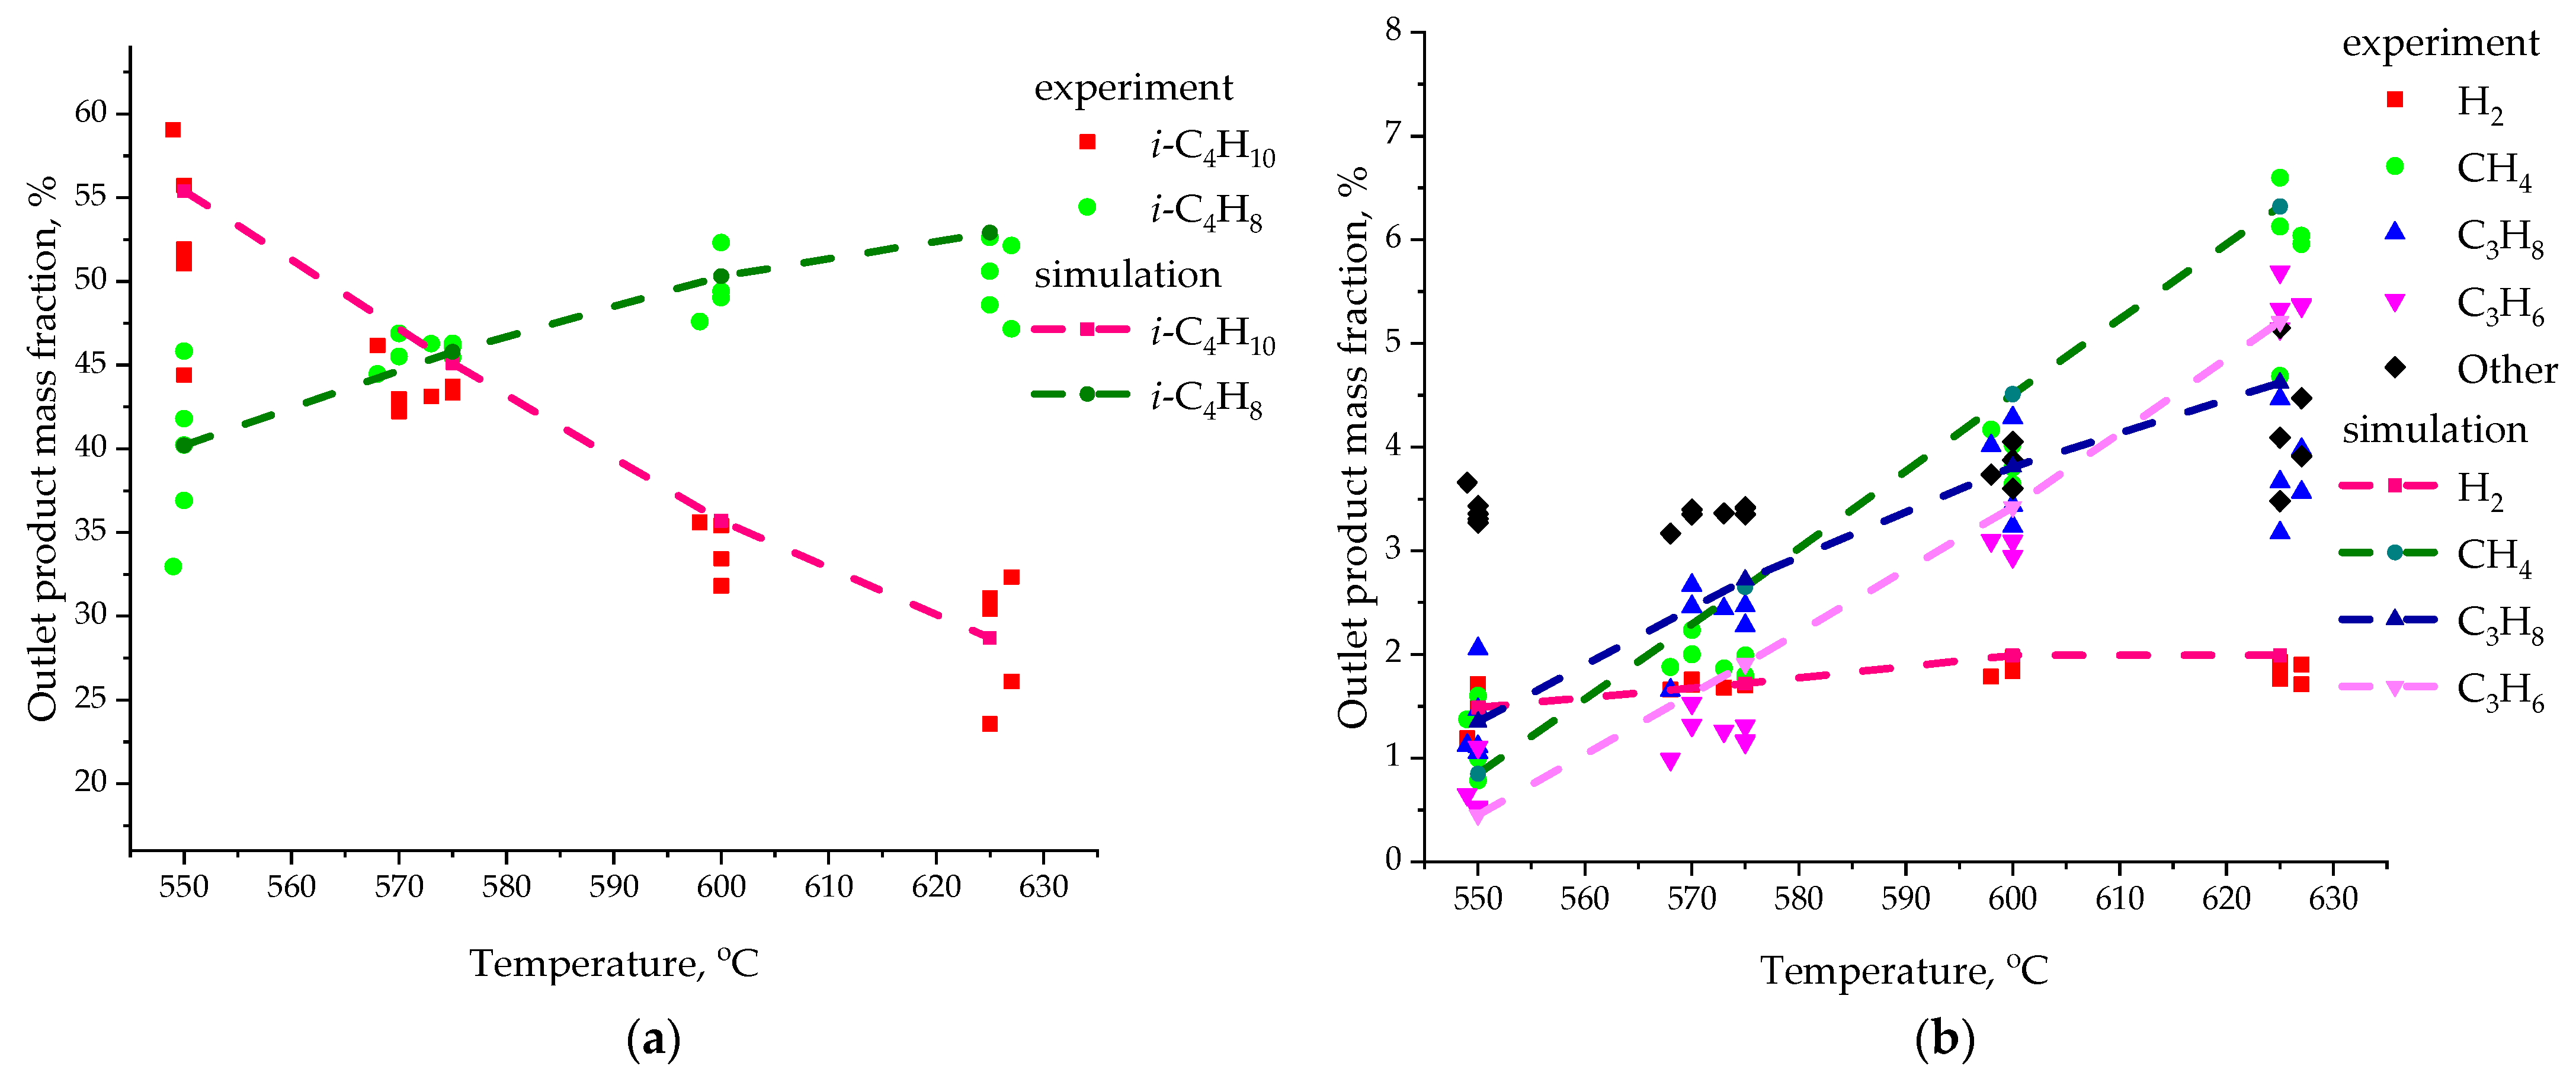
Figure 8 shows the final results of the calculated values of the mass fraction of species in the gas phase at the outlet of the laboratory reactor (dashed lines). It also shows the experimental data (points) from the work [64] for comparison. These CFD modeling results are an average of 10 calculations performed for each point. The experimental data are presented for each experiment separately. Sixteen experiments were conducted for each temperature value. Only a few points are shown in the figure to demonstrate the spread of experimental results.
The results of numerical simulation are in good agreement with the experimental data on the values of the mass fraction of isobutane and isobutylene (Figure 8a). At the same time, other species are also present in the gas phase in the experiment (black dots in Figure 8b). They occupy 3–6% of the total mass. Therefore, in our model we cannot exactly match the experiment. In our model, only the species described above make up the complete mixture for the gas phase. It should also be noted that the experimental data can differ by almost 10% for the same temperature value. This may be due to a change in the properties of the catalyst. In an industrial reactor, the catalyst is regularly transferred to the regenerator for recovery.
In general, it can be considered that the constructed model for the numerical simulation of the process of dehydrogenation of isobutane to isobutylene describes well the operation of a laboratory reactor.

3.1.2. 2D-Axisymmetric Simulation

Next, we will conduct a numerical simulation for a 2D-axisymmetric geometric model. Here, too, at the initial time (t = 0 s), the stationary bed of particles is located in the lower part of the reactor. After gas is supplied, the bed begins to fluidize and chemical reactions begin. We observe the onset of the stationary regime after approximately 180 s of the calculated time. This is faster than for the 3D model. Figure 9 shows the calculated fields of the volume fraction of solid phase and mass fractions of gas phase species at the time t = 240 s for the case of a temperature of 575 °C. These parameters are the same as those presented for the 3D model in the previous section.
Figure 9a shows a significant difference from the 3D model calculations. In the 2D axisymmetric model, the bed height is slightly higher. But the volume fraction of the solid phase has a more uniform distribution. There are no compactions or isolated bubbles. This may be a feature of the axisymmetric model and the small size of the reactor. If for the 3D model a gas bubble can be represented as a spherical object, then for the 2D axisymmetric model a bubble in the meridional section should be interpreted as a gas ring in a real reactor. The fields of mass fractions of gas phase species have similar patterns to the results of the 3D model.
Figure 10 shows the average values of the simulation results for the case of a temperature of 575 °C for the 2D axisymmetric reactor model. These graphs are obtained by averaging the results from 240 s to 420 s of the reactor simulation and are presented according to the height of the laboratory reactor, as in the case of the 3D model.
It is evident from Figure 10b–g that the average values of gas phase species are almost the same as the results presented in Figure 7b–g. That is, the gas movement and chemical kinetics are almost the same for the 3D and 2D models. This is primarily due to the simple form of the laboratory reactor with the bubbling regime of fluidization of the catalyst particle bed. We will also estimate the average solid phase volume fraction ~0.41 and the average height of the particle bed ~0.171 m (Figure 10a). In this case, the average height of the particle bed is slightly higher, and the average volume fraction of the solid phase is slightly lower.
Figure 11 presents the mass fractions of gas-phase species at the outlet of the laboratory reactor obtained from CFD simulations at temperatures of 550–625 °C.
We also see good agreement between the results of numerical simulation and experimental data. Here we can also assume that the constructed 2D axisymmetric model for numerical simulation of the process under study describes well the operation of a laboratory reactor.
To assess the differences in the numerical simulation results between the 3D model and the 2D-axisymmetric model. To do this, we consider the absolute difference between average values for the corresponding mass fractions of the gas phase for all the calculations performed. The results are presented in Table 4. For example, for the isobutane fraction, an absolute difference between average values of 0.1% can be considered small. At the same time, an absolute difference between average values of 0.1% for the methane fraction for a temperature of 550 °C will already be more significant. Therefore, we will also consider the relative difference between average values. To do this, we divide the absolute difference by the average value of the species mass fraction obtained in the numerical simulation of the 3D model.
Table 4 shows that the absolute difference between average values are in the range of 0.01–1.12%. At the same time, the relative difference between average values are in the range of 0.006–0.1146%. The species of the main reaction (isobutane and isobutylene) show the highest values for absolute difference between average values (0.34–1.12%) and small values for relative difference between average values (0.065–0.02446%). This is due to the large values of % mass of these products.
In general, the comparison of the numerical simulation results for two models with different dimensions shows good agreement in the values of the mass fraction of gas phase species at the outlet section of the laboratory reactor. But there are differences in the behavior of solid phase particles. For a small laboratory reactor with a limited-height bubbling bed of particles, both models can be successfully used. At the same time, the use of a 3D model does not cause great difficulties and does not require large computational resources due to the small size of the real reactor.

3.2. Industrial Reactor Simulation

Let us turn to the results of the numerical simulation of a 2D-axisymmetric model of an industrial reactor. At the initial time (t = 0 s), the fixed bed of particles is located at the bottom of the reactor, with a mass calculated for each fraction. Following the initiation of the gas supply (isobutane and nitrogen), we monitor the mass fractions of gas species at the reactor outlet, defined as the cyclone inlet section. The industrial reactor is about 34 times taller than the laboratory reactor. However, the gas velocity in the industrial reactor is about 80 times greater than that in the laboratory reactor. Therefore, the characteristic time scales are not expected to differ significantly.
In the laboratory reactor model, a steady-state regime was defined as the point where the variation in species mass fractions at the reactor outlet fell below 2%. However, for the industrial reactor simulation, a clear steady-state condition could not be established. The mass fractions of isobutane and isobutylene exhibited fluctuations of up to 10%, while the yields of by-products showed significant temporal variability, differing by a factor of two to three. In the various simulations of the industrial reactor, stable operation was only achieved for the first 30 min of real operating time. In practice, an industrial reactor operates continuously for several months, and reaching a steady-state condition typically requires about a day or more. Therefore, a clear quasi-steady-state regime was not established in the numerical simulations conducted in this study.
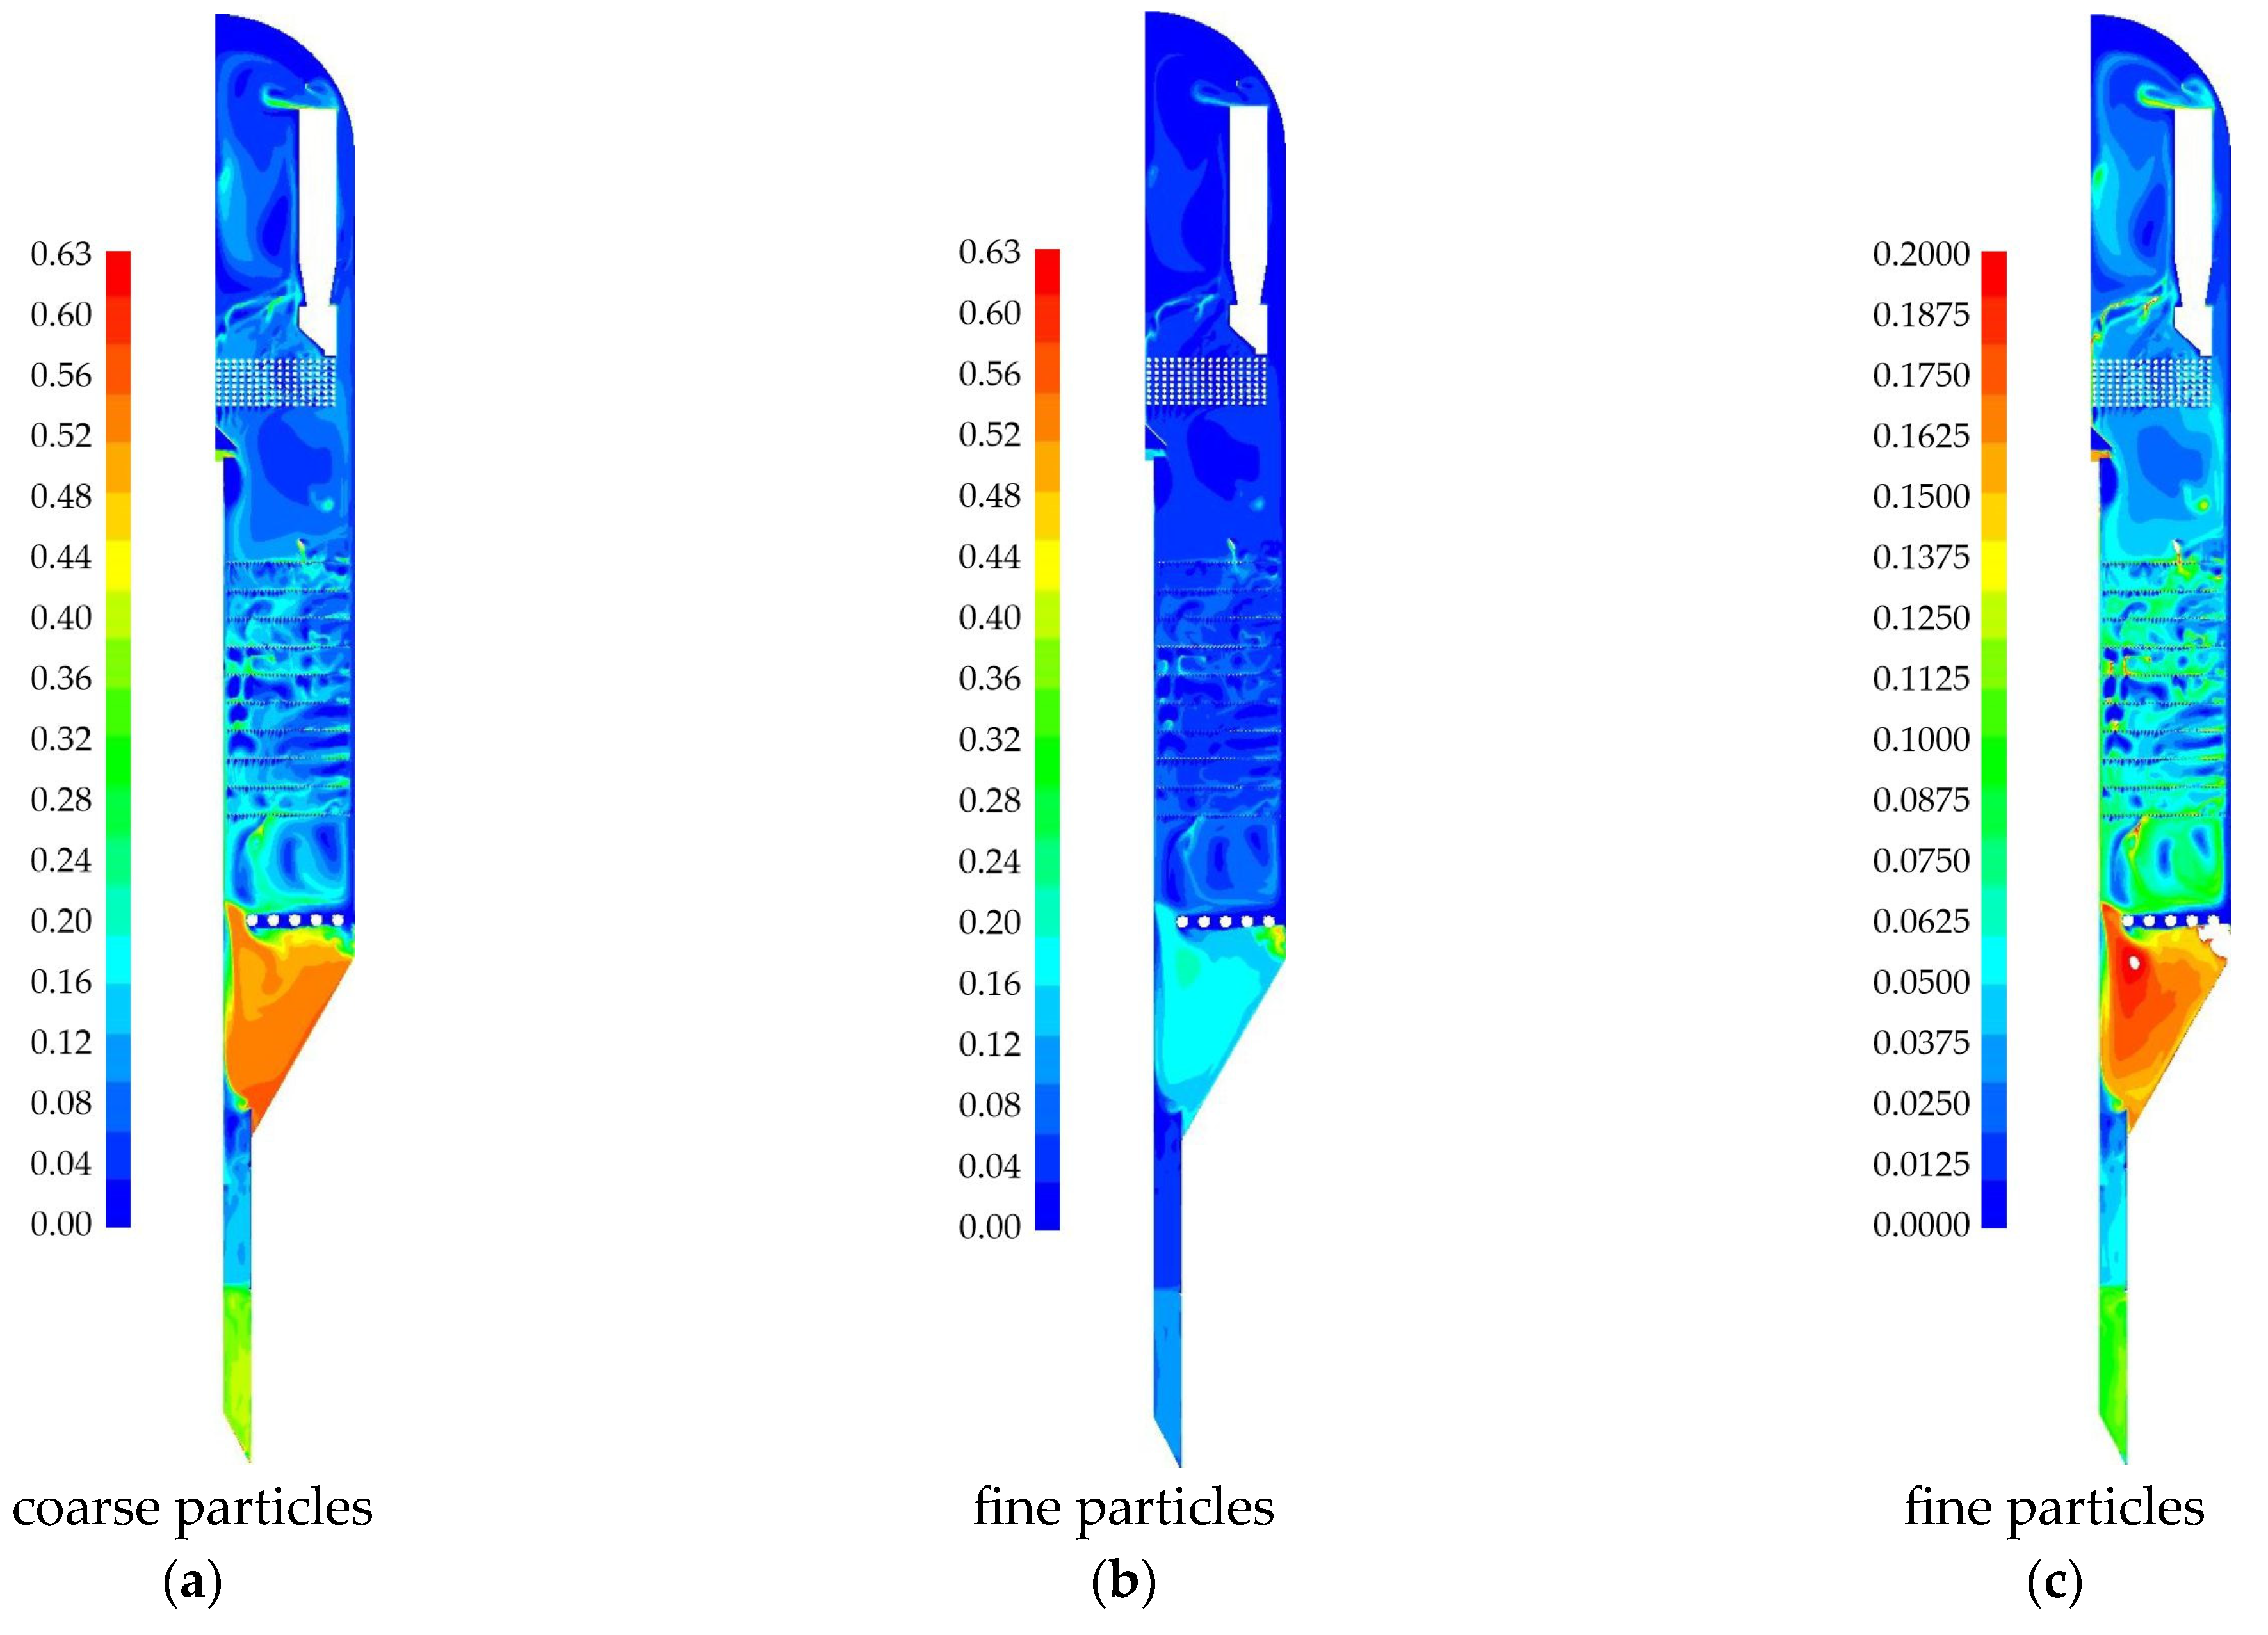
The distribution of the solid phase in the reactor is considered first. The model incorporates two fractions of solid particles: coarse and fine. Figure 10 presents the calculated volume fraction fields for the solid phase. All subsequent figures correspond to a simulation time of t = 360 s. The coarse particle distribution is shown on a scale up to 0.63 of the maximum permissible volume fraction (Figure 12a). The fine particle distribution is presented in two views: on a scale up to 0.63 of the maximum permissible volume fraction (Figure 12b), and on a scale up to 0.2 of the volume fraction (Figure 12c).
For a given gas flow rate and a given total mass of the granulated solid phase, it is evident that the catalyst particles are present throughout the entire volume of the reactor. Figure 12 shows that particles of both solid-phase fractions are distributed throughout the reactor. There is no separation of particles by size, indicating that coarse and fine particles are very well mixed. Since the initial quantity of fine particles was approximately half that of the coarse particles, a 0–0.2 scale is used to visualize their location in the reactor. A fluidized bed is observed above the isobutane gas feeder, with a slight compaction in the baffle region. Below the gas feeder, a dense bed is formed. This region is subject to almost no influence from the incoming isobutane and is primarily affected by the incoming nitrogen from the channel leading to the regenerator. Thus, the numerical simulation of the industrial reactor demonstrates a fast-fluidized bed of catalyst particles above the gas feeder and a dense, low-mobility bed of catalyst particles below it.
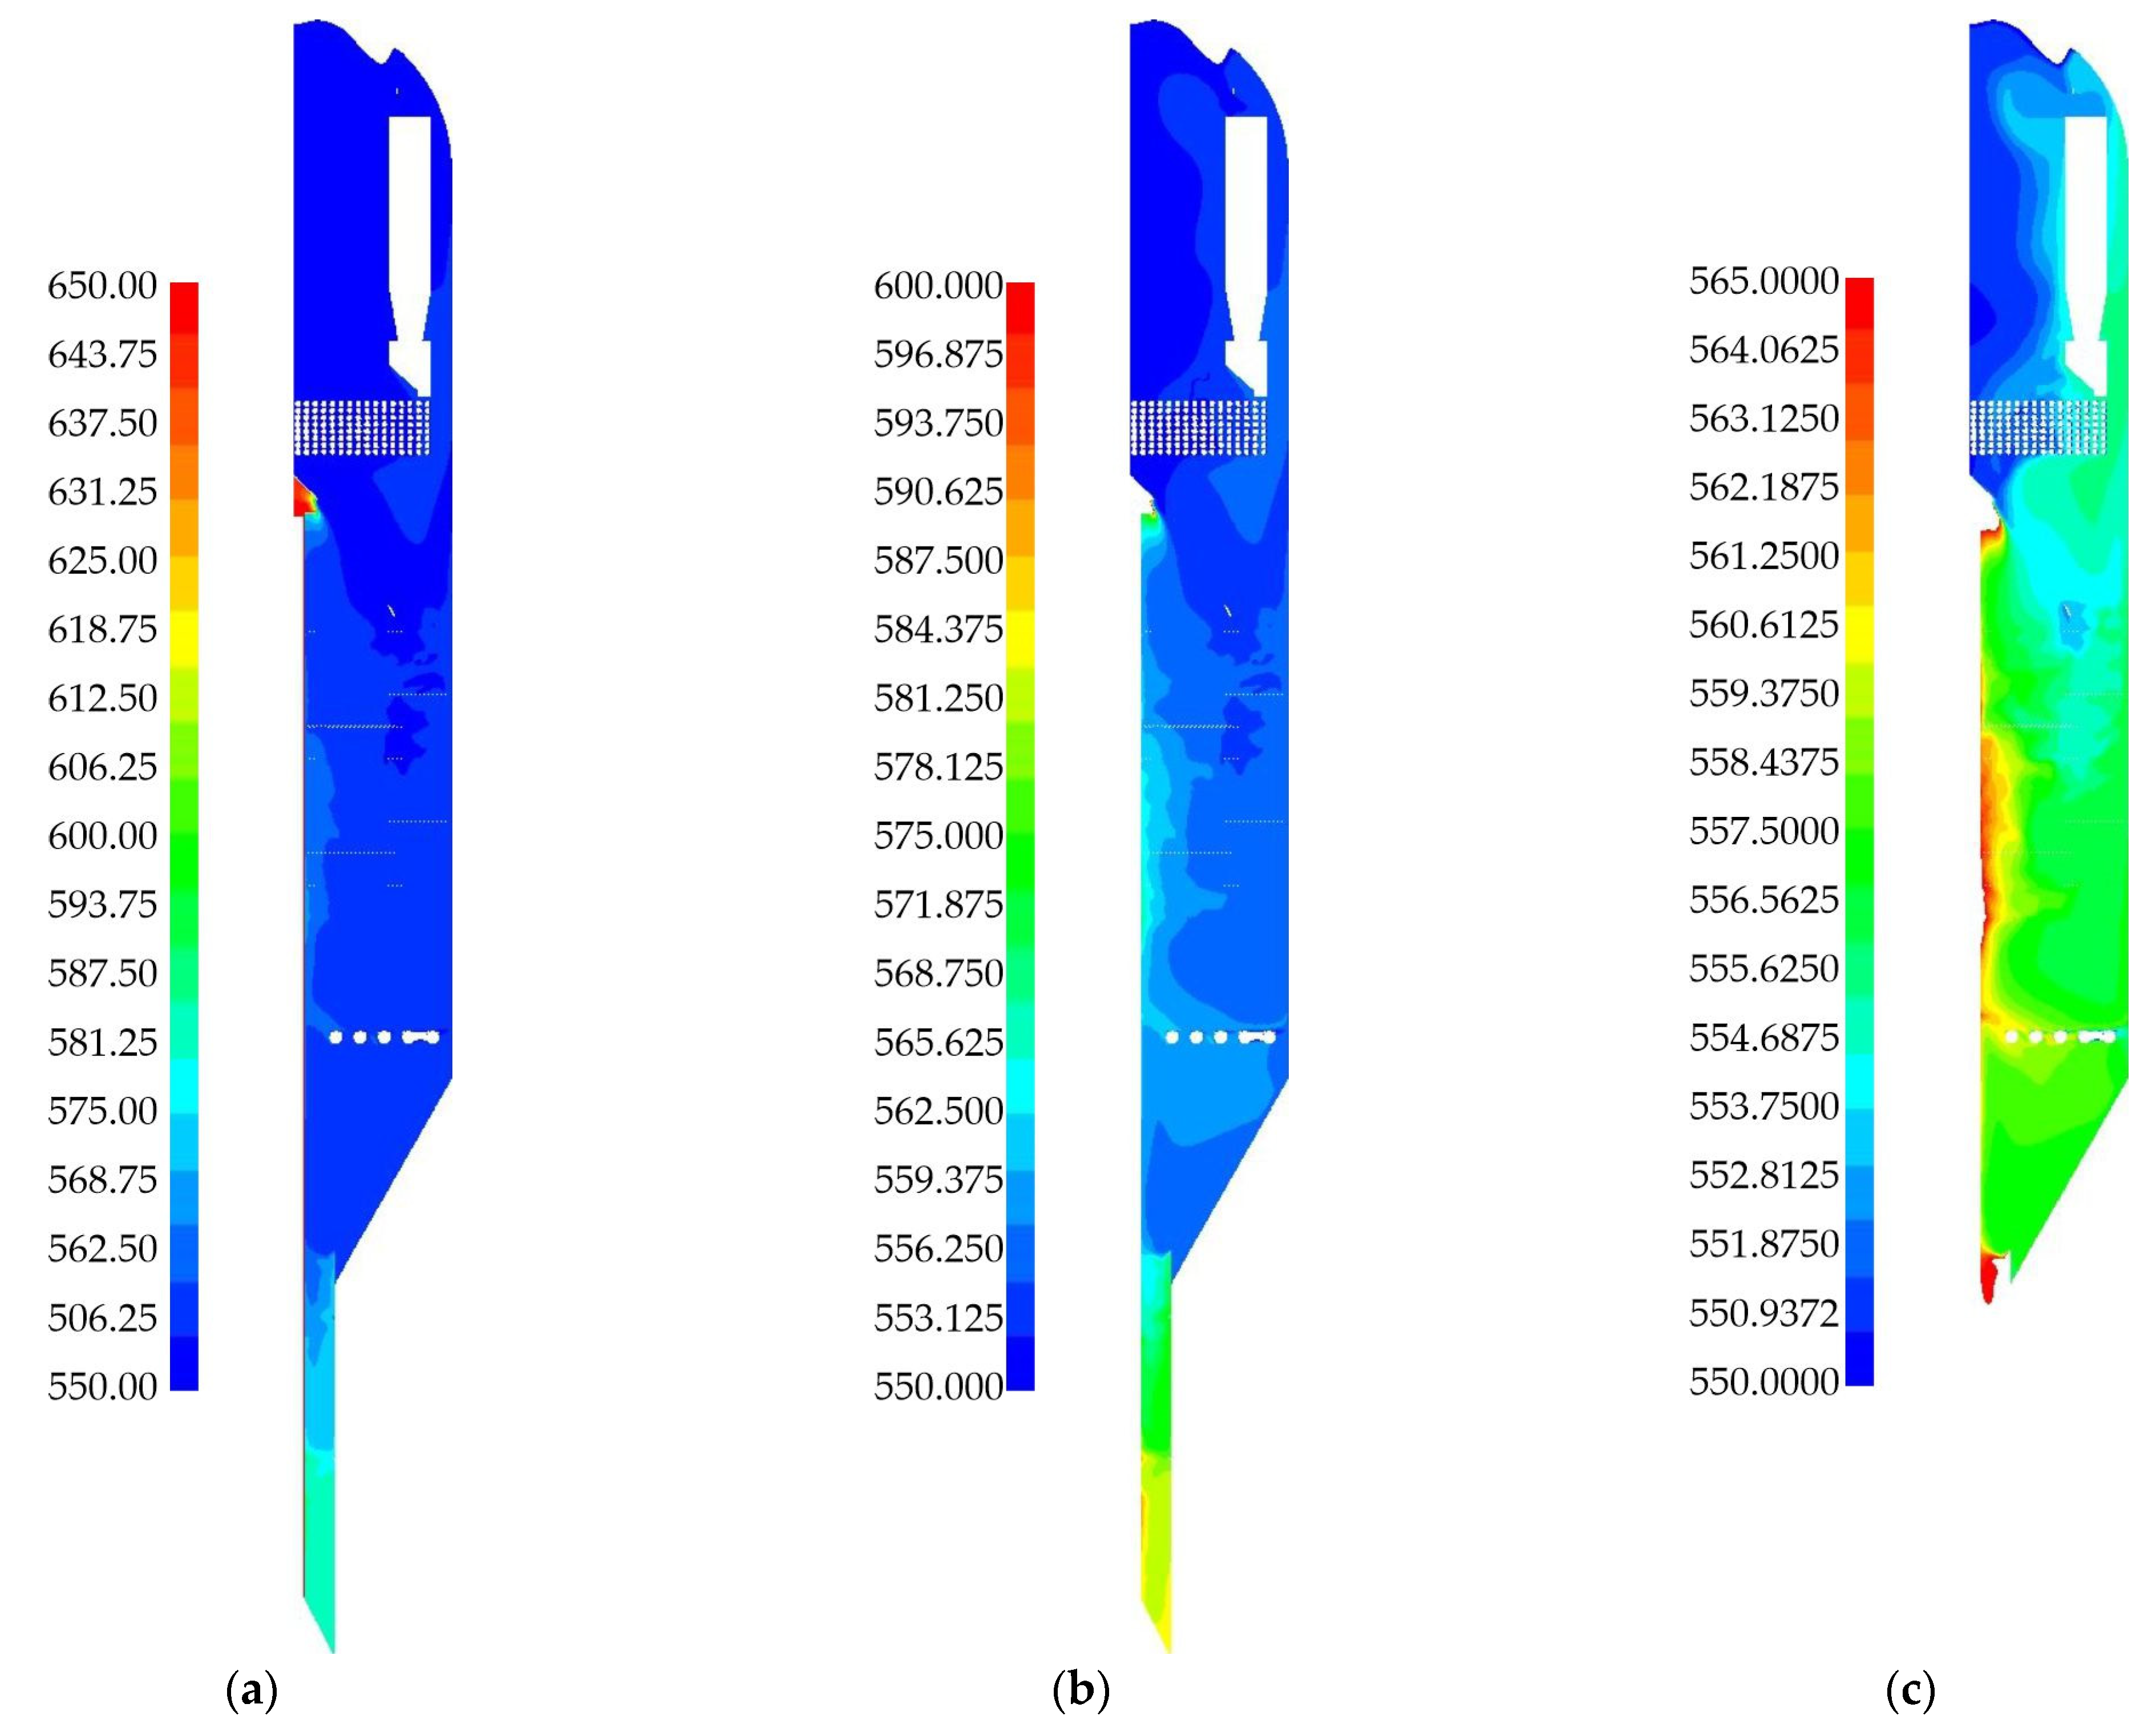
The temperature distribution in the reactor plays a key role in the formation of the process products. The system involves a gas feed at 550 °C and a regenerated catalyst feed at 650 °C, resulting in a temperature difference of 100 °C between these two inlets. Figure 11a shows the temperature field in the reactor cross-section on a scale from 550 °C to 650 °C. A heated spot (red) is visible in the catalyst feed section. Almost the entire reactor cross-section is colored blue, corresponding to the temperature range of 550–560 °C. A more heated zone is also observed at the very bottom of the reactor, where the outlet to the regenerator is located. This area has a small volume and includes a pipe with a set temperature of 650 °C.
For a more detailed assessment of the reactor’s cross-sectional heating, the temperature field is examined on a reduced scale of 550–600 °C (Figure 13b). However, this scale remains too broad for a detailed analysis of the temperature distribution. Therefore, several temperature scales were evaluated, and the range of 550–565 °C was selected (Figure 13c). This scale reveals significant heating in the middle part of the reactor. The zone near the central pipe is heated to 565 °C, while the central reactor volume reaches about 557 °C. The upper part of the reactor is cooler, at approximately 552 °C, with a small zone at the very top having a temperature below 550 °C.
The main source of additional heat in the reactor is catalyst granules with a temperature of 650 °C, which enter from the regenerator through the central pipe. The pipes located under the cyclones remove some heat from the gas and solid phases. The detailed mechanism of reactor heating by particle movement will not be examined here. The study of heating options for a similar reactor can be found in [37,38,83,84]. It should be noted that temperature plays an important role in the rate of both the main and side reactions, and directly affects the mass fractions of the gas components at the reactor outlet.
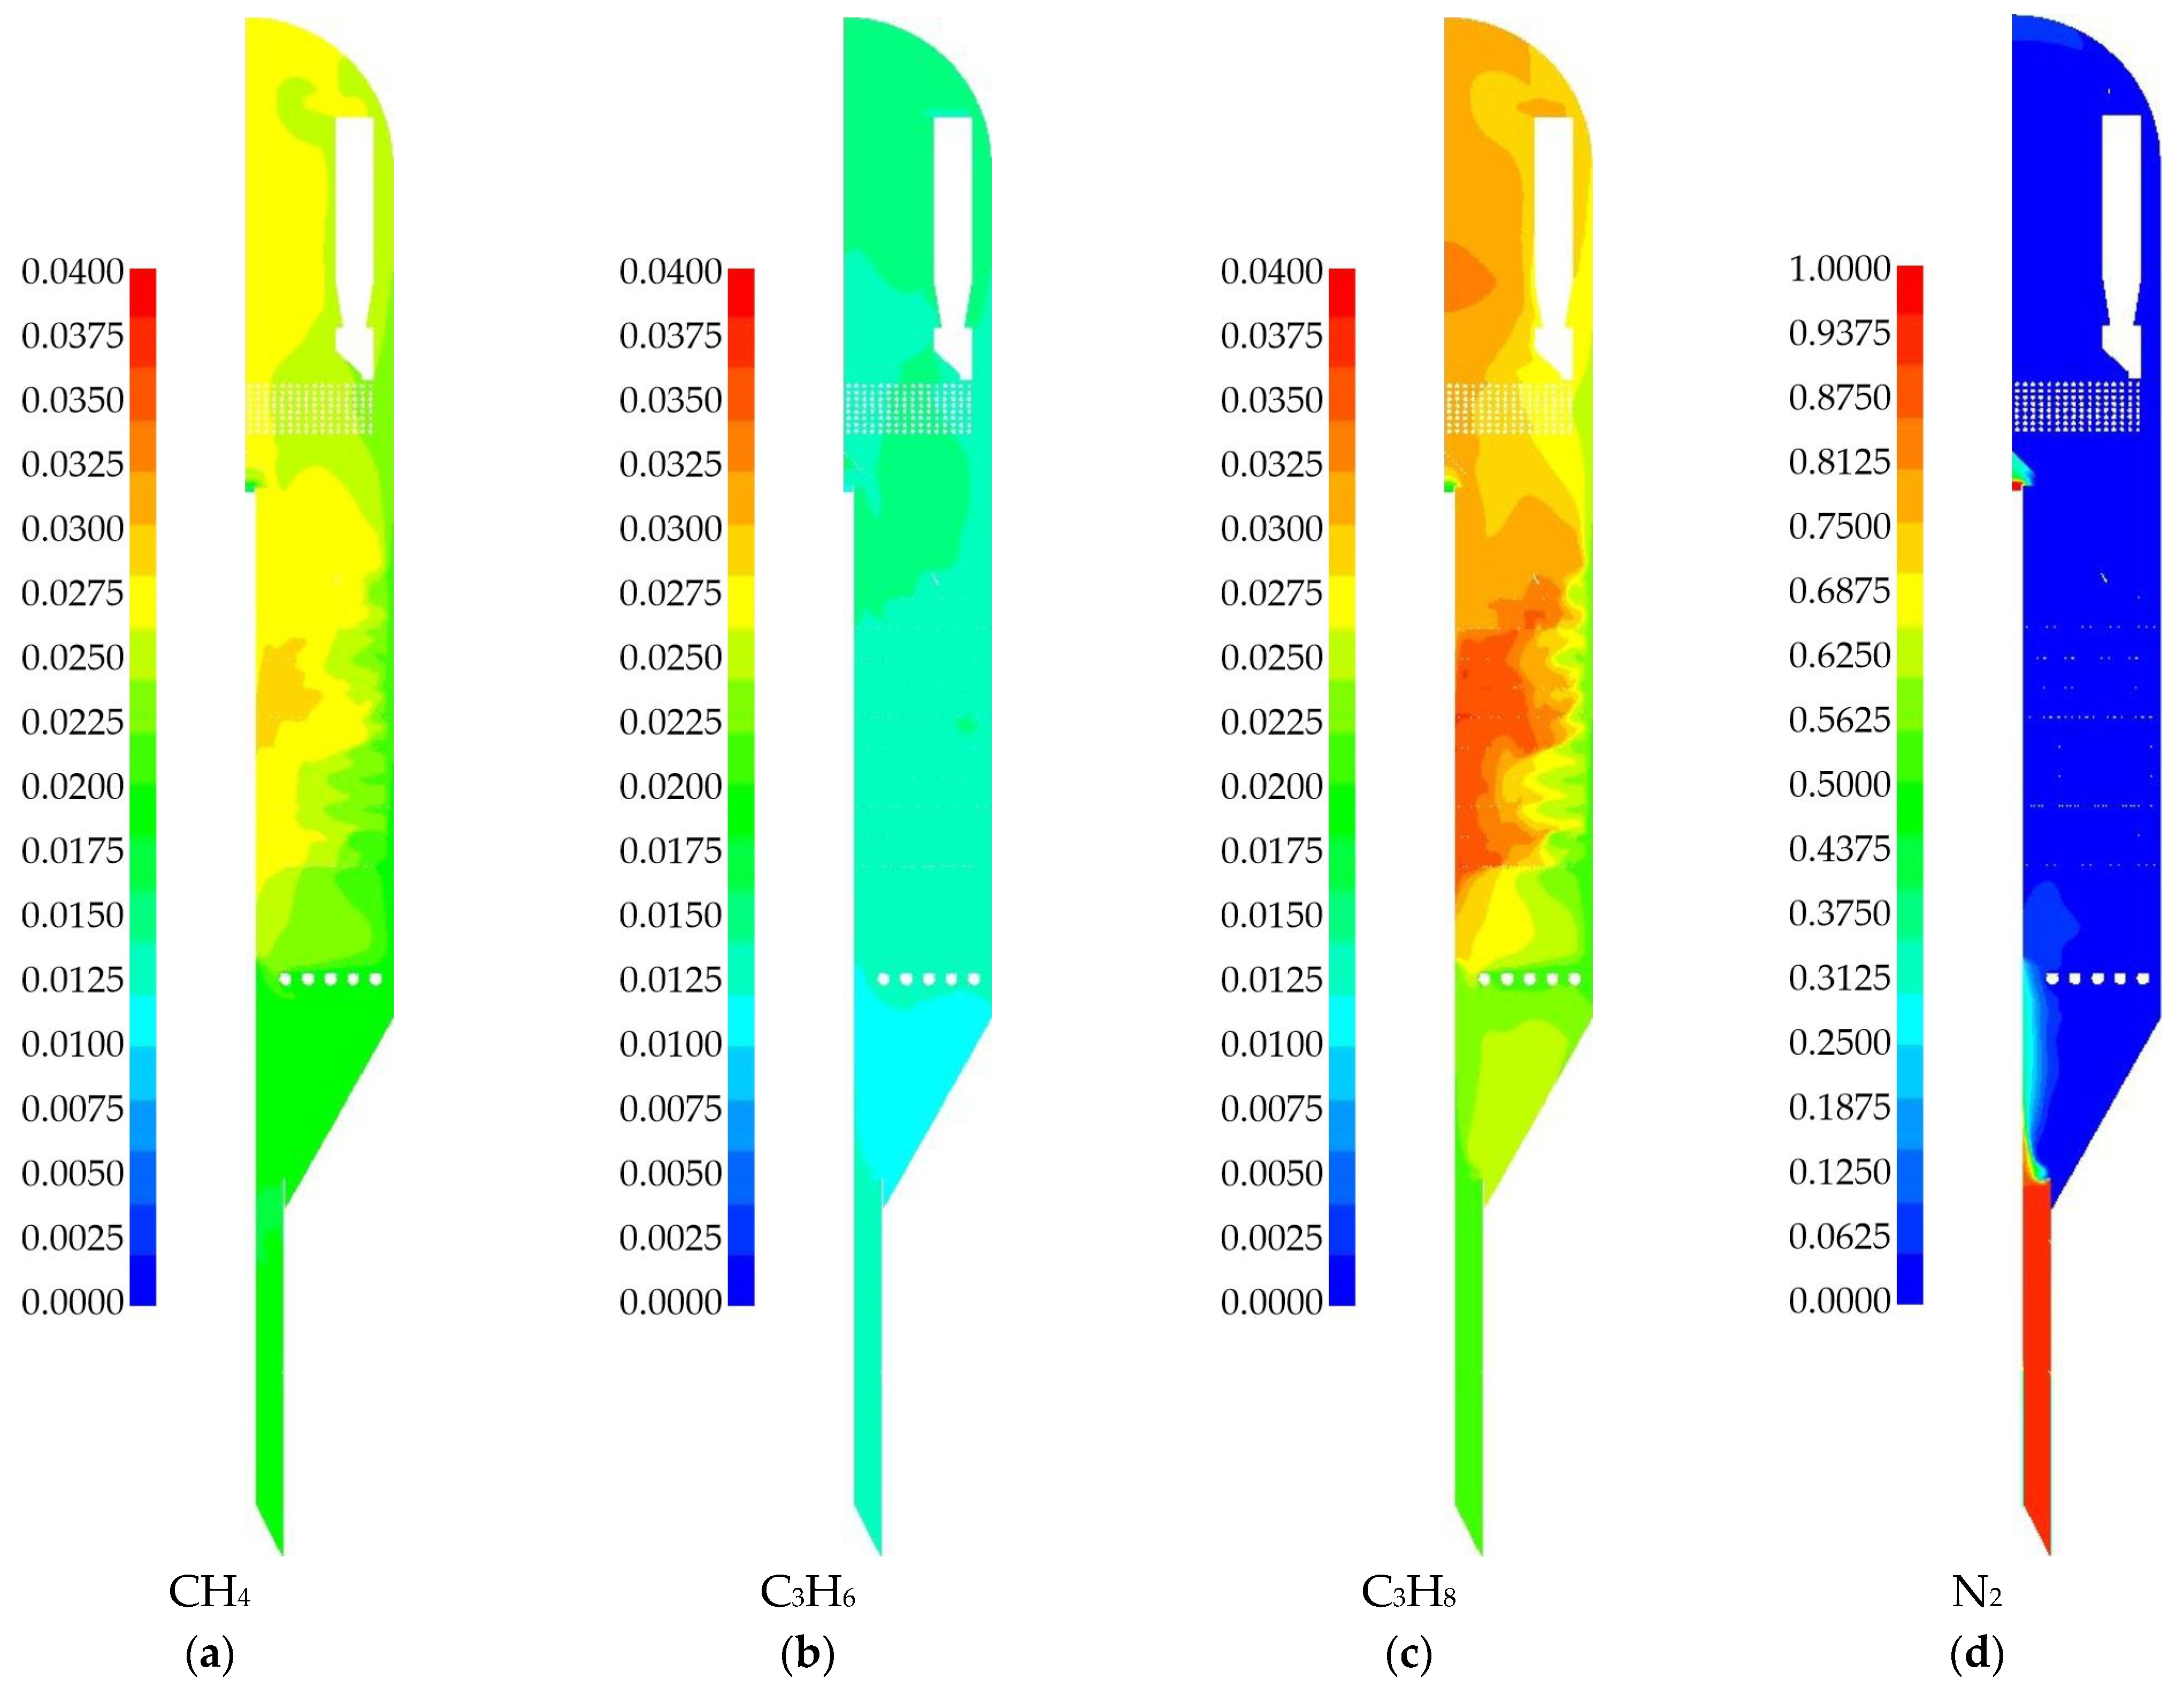
The mass fraction distributions of gas-phase species are analyzed below. The reactor feed consists initially of isobutane and nitrogen, while all other species are formed via chemical reactions. Figure 14 shows the species involved in the main reaction: isobutane, isobutylene, and hydrogen. The mass fraction of isobutane (Figure 14a) decreases from 1 at the gas inlet to approximately 0.6 in the upper part of the reactor. Almost no isobutane is present in the lower part of the reactor due to dilution by other species and the formation of reaction products. In the middle part of the reactor, a high concentration of isobutane occurs near the outer wall, while there is significantly less near the central pipe. This observation agrees well with the temperature field distribution (Figure 13), where both the main and side reactions are accelerated at higher temperatures. Comparison with Figure 12 also indicates that the highest concentration of isobutane corresponds to regions with a low volume fraction of solid catalyst particles.
The production of isobutylene (Figure 14b) occurs in zones where the amount of isobutane decreases. Specifically, this is the heated middle zone near the central pipe. Another notable area is the lower part of the reactor, where there is a large volume of slow-moving catalyst. In the middle zone of the reactor, where the baffles are located, the distribution of isobutylene is uneven from the center to the outer wall. As it moves further to the upper part of the reactor, it becomes more uniform and reaches about 0.3. The mass fraction of hydrogen (Figure 14c) generally follows the distribution pattern of isobutylene production. However, hydrogen also participates in the side reaction for the hydrogenation of propylene to propane. Hydrogen constitutes a small fraction of the total mass of the gas phase, so its distribution is presented on a scale of 0–0.02.
Next, we consider the mass fractions of the products of side reactions, as well as nitrogen (Figure 15). For side products, the distributions are presented on the same scale of 0–0.04. Thermal cracking products are most concentrated in the zones with the highest temperature. A significant amount of propane produced by the hydrogenation of propylene is also evident. This reaction contributes to the final distribution of the hydrogen species.
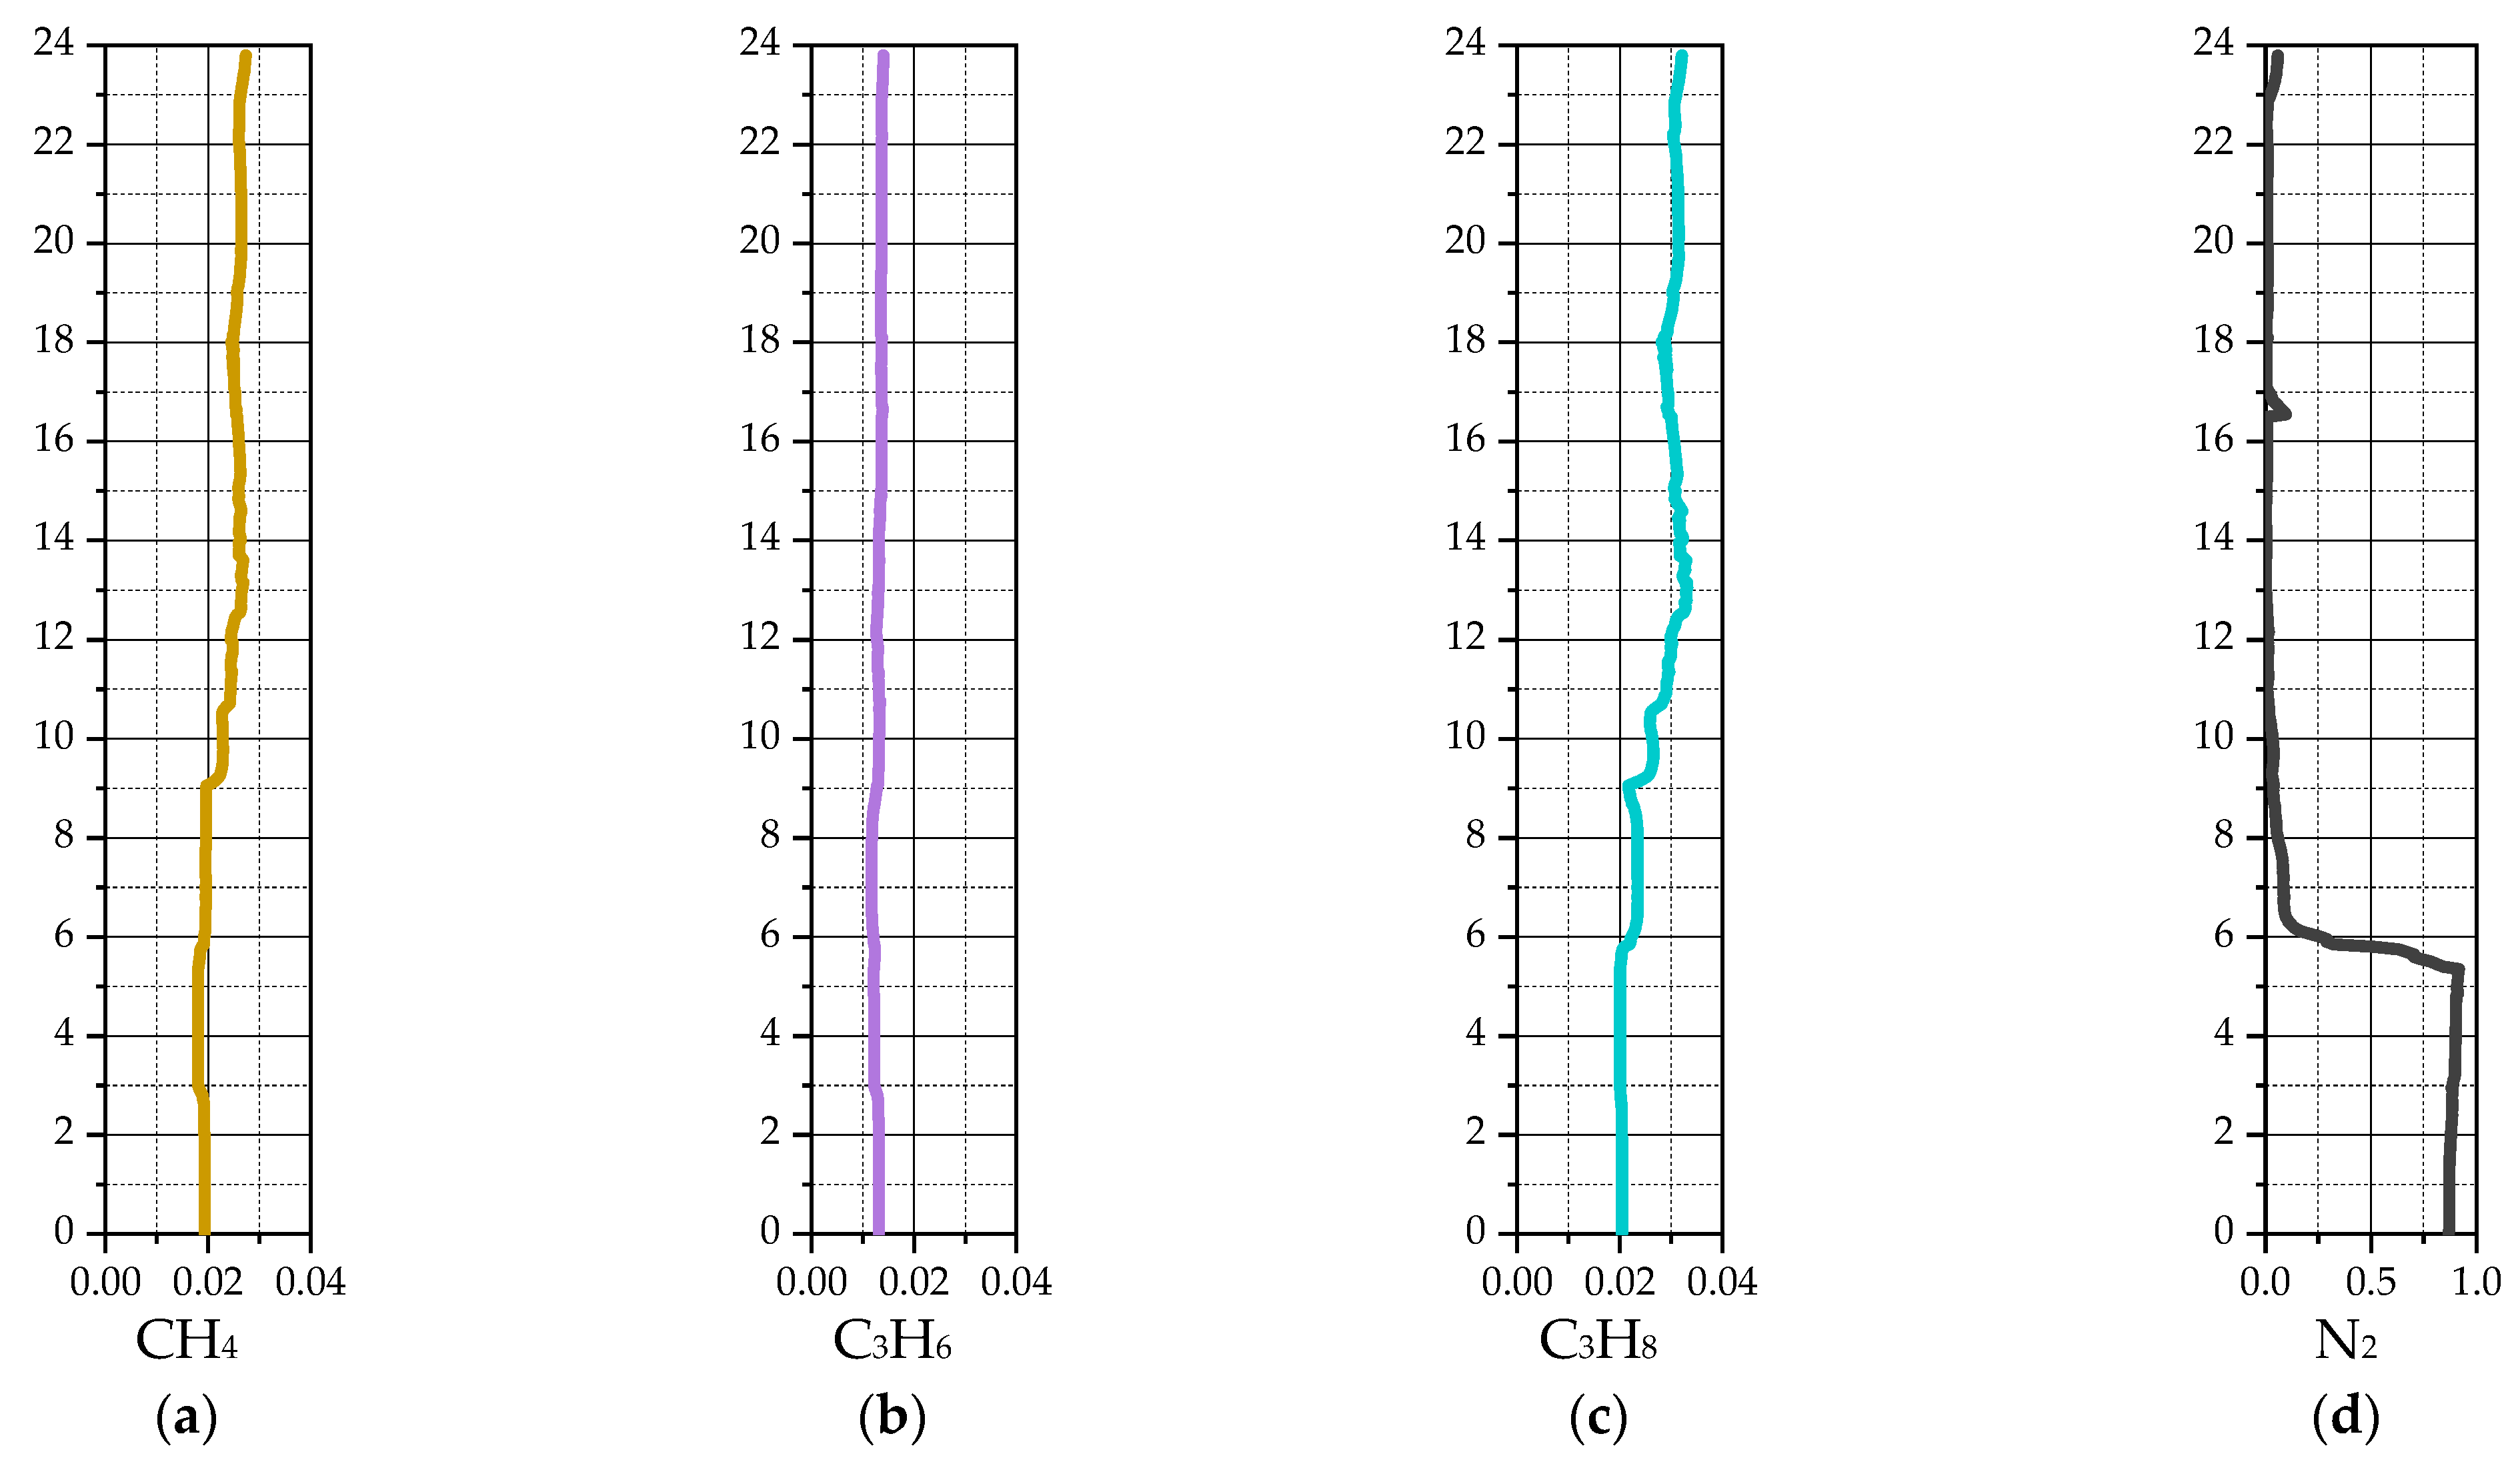
The mass fraction of the nitrogen species (Figure 15d) is presented on a scale of 0 to 1. Nitrogen is negligible throughout most of the reactor volume. It is present primarily in the inlet zone of the heated catalyst, from where it rapidly disperses. A high nitrogen concentration is observed at the bottom of the reactor in the overflow section to the regenerator. This is the location of nitrogen feed nozzles, which are designed to prevent reaction products from entering the regenerator; the model accurately represents this purging mechanism. In the overflow section, nitrogen reaches a mass fraction of approximately 0.9 in the gas phase.
The analysis was performed using instantaneous field images at t = 360 s. Subsequently, the data were processed using a two-step averaging procedure. First, spatial averaging was conducted from the center to the wall of the reactor to construct vertical profiles of the parameters along the reactor height. An identical procedure was applied to the laboratory reactor model. Second, temporal averaging was performed over multiple data points within the time interval of 360–720 s. The resulting profiles are less smooth than those obtained for the laboratory reactor.
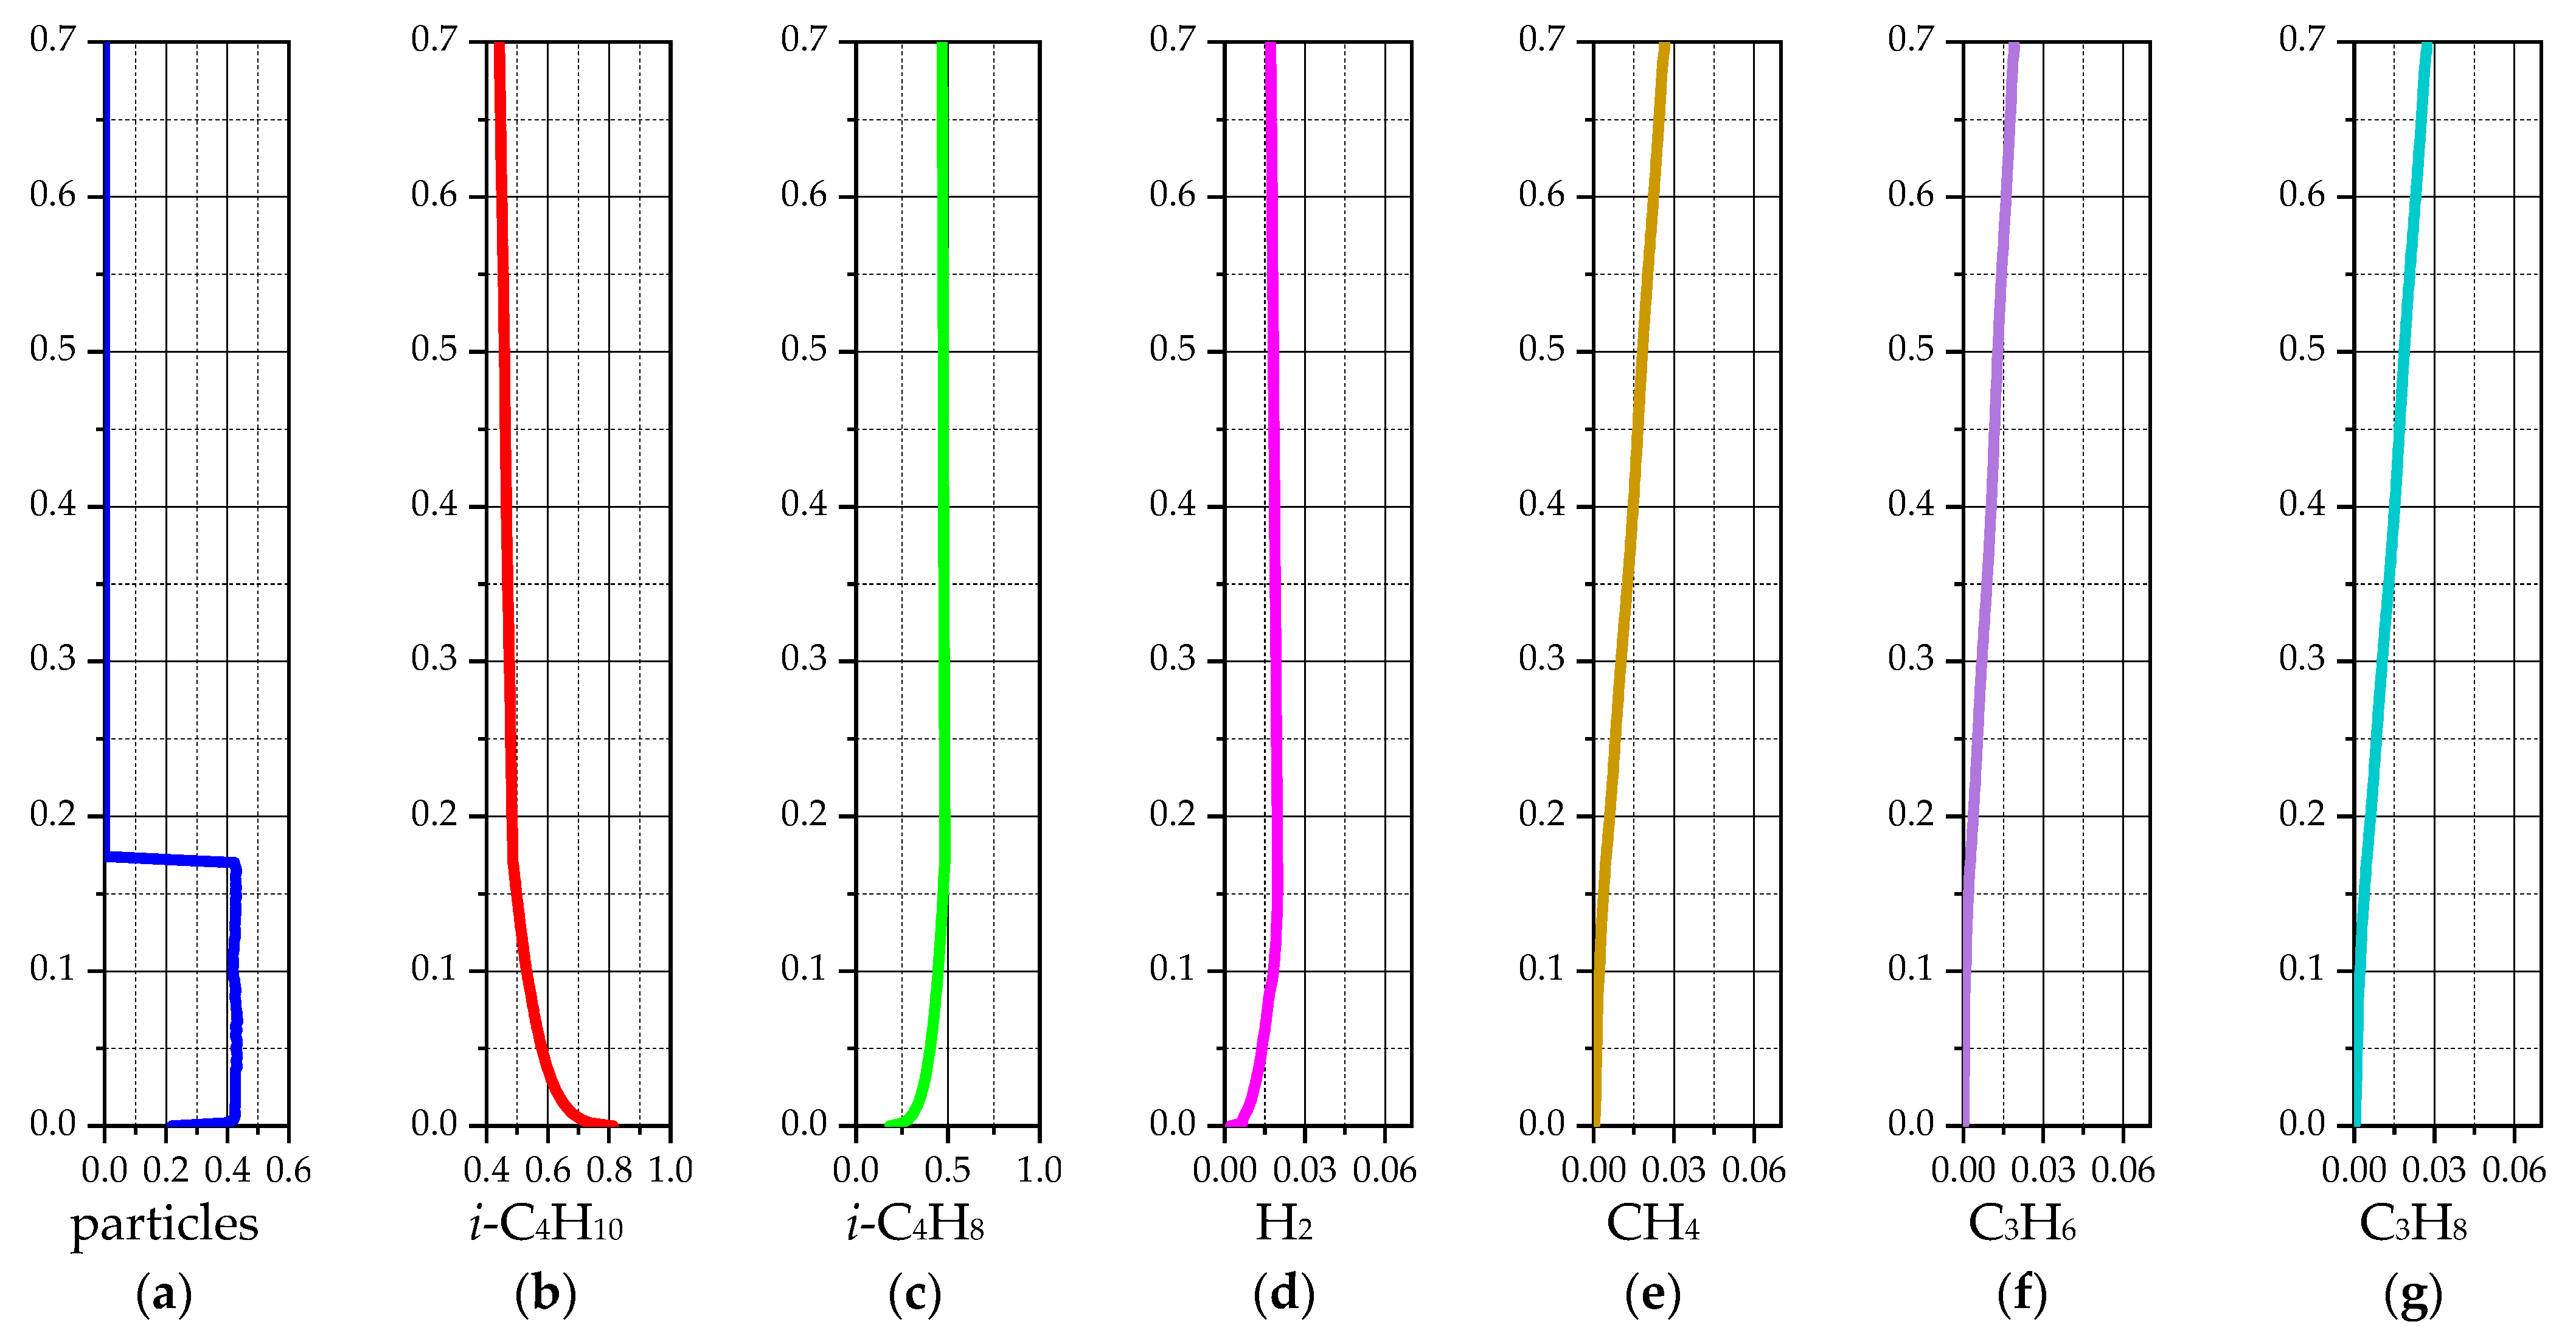
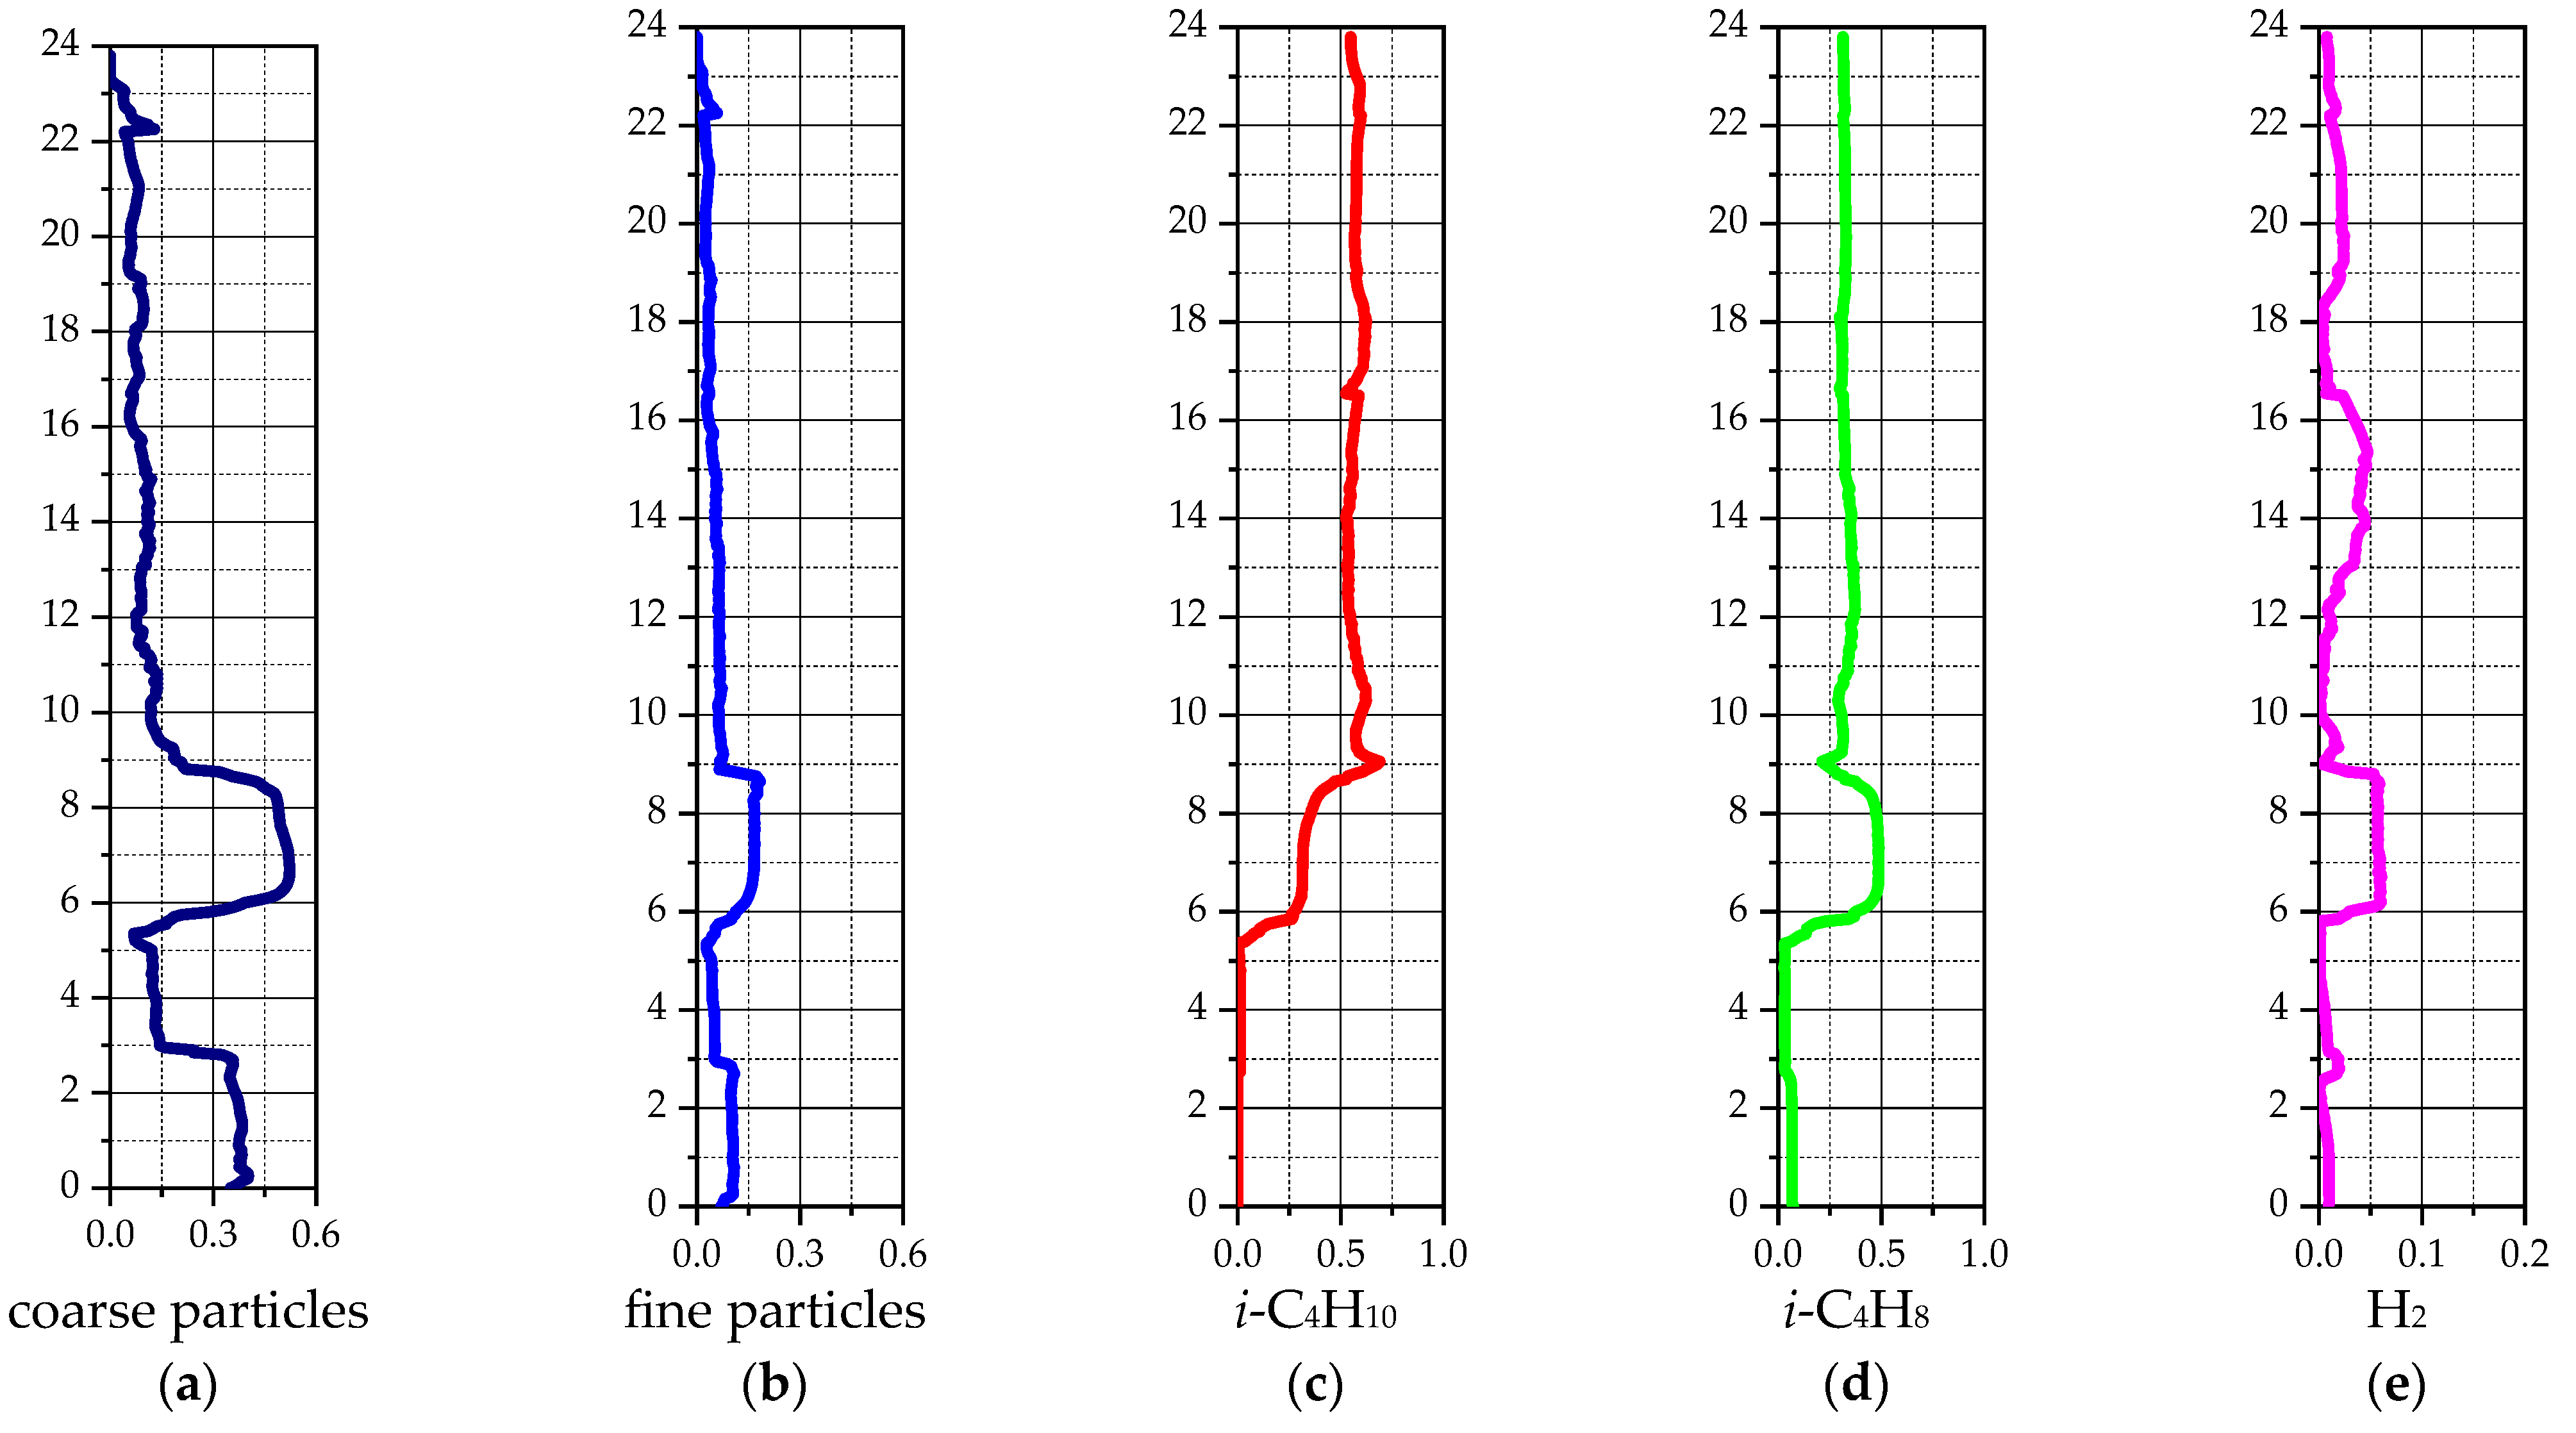
Figure 16 presents the average volume fractions for the two solid phases and the mass fractions for the main reaction of isobutane dehydrogenation to isobutylene. The key elevations along the reactor height are as follows: 2.85 m and 4.85 m correspond to the nitrogen injection points; 5.35 m marks the outlet to the regenerator; 8.8–9 m is the isobutane gas supply device; 10.65–14.8 m is the baffle section; 15.1 m indicates the particle return from the cyclone; 16.5 m is the inlet for the heated catalyst from the regenerator; 17.34–18.15 m contains the heat-exchanging tubes; and 22.61 m defines the cyclone inlet surface.
Figure 16a,b show a high catalyst particles volume fraction in the lower part of the reactor, below the gas inlet. Above this inlet, the particle volume fraction becomes more uniform, decreasing smoothly toward the upper part of the reactor. In the middle zone, the average solid phase volume fraction (coarse and fine particles combined) is approximately 0.178.
The average concentrations of the main reaction components, isobutane and isobutylene, are presented in Figure 16c,d. Above the gas feeder level, the concentration profiles for both components exhibit minimal deviation. A sharp decrease in isobutane concentration is observed at the location of the heated catalyst feed, although the deviation from the average profile remains moderate. Below the gas feeder level, a sharp decrease in isobutane coincides with an increase in isobutylene concentration. This behavior is attributed in the model to the presence of a dense catalyst bed. At the reactor outlet (cyclone entrance), the average isobutane mass fraction is 59.15%, and the average isobutylene mass fraction is 31.88%.
The profile of the average hydrogen mass fraction along the reactor height is non-uniform and exhibits significant fluctuations (Figure 16e). The hydrogen concentration is affected by both the main reaction, which increases it, and side reactions, which lead to a decrease.
The average mass fractions of species from the side reactions, as well as nitrogen, are shown in Figure 17. The profiles for the thermal cracking products correlate with both the isobutane mass fraction and the temperature field. The methane concentration generally increases with reactor height, while the propylene concentration fluctuates. This behavior is due to the second side reaction, the hydrogenation of propylene to propane. The propane concentration generally increases with height in the reactor. At the reactor outlet (cyclone inlet), the average mass fractions are 2.61% for methane, 1.24% for propylene, and 3.07% for propane.
Figure 17d shows that the average nitrogen concentration in the reactor is low. The highest nitrogen concentration is located in the lower part of the reactor, in the outlet zone to the regenerator.
In general, the results of the numerical simulation for the industrial reactor can be assessed as satisfactory. A real industrial reactor for the dehydrogenation of isobutane to isobutylene in a fluidized catalyst bed typically produces isobutylene at 25–35% by mass at the outlet. In this study, the average result of 31.88% is within the typical operating range of a real industrial reactor.

4. Discussion

We have obtained the results of numerical simulation of the laboratory reactor model and the industrial reactor model for the process of isobutane dehydrogenation to isobutylene in a fluidized catalyst bed. Here we will try to compare the obtained results, find common points and significant differences. Obviously, the laboratory and industrial reactors have many differences: size, shape, internal structures, gas velocity, etc. But before entering industrial use, the process is studied in small laboratory reactors. In a real industrial reactor, it is difficult to conduct a full-fledged scientific study of the process. As a rule, temperature data at several points of the reactor and periodic analysis of mass fractions of gas species at the outlet of the reactor can be available there.
First, we will compare the results for the mass fraction of species in the gas phase at the reactor outlet (Table 5). The data correspond to the average values at the reactor outlet and may not coincide with the species concentration at a specific point in the reactor, for example, in the middle or at the bottom.
Table 5 indicates that the yield of the main reaction product in the industrial reactor is lower than the values obtained in laboratory tests. Although the temperature in the industrial reactor reaches 650 °C at the catalyst inlet from the regenerator, the isobutylene yield in the industrial reactor is lower than that in the laboratory reactor at 550 °C. Therefore, it is difficult to evaluate the catalyst’s efficiency and the ongoing reactions based solely on laboratory experiments. Furthermore, our calculations involve several assumptions that simplify the process. In practice, the differences between the laboratory and industrial reactors are expected to be even greater. A comparison of key parameters such as temperature and velocity is presented; the temperature data from the simulations of both reactor types are provided in Table 6.
We see that for the laboratory reactor the average temperature is maintained at the level of the set value in the experiment. Temperature deviations are associated with the occurrence of chemical reactions with the absorption and release of heat. The minimum and maximum temperature values can be observed briefly in individual zones of the reactor. The average temperature value can be observed in almost the entire volume of the laboratory reactor. Here, maintaining the set temperature is simple. The laboratory reactor has a small diameter, and the heat source is the outer wall, where an electric heater is installed.
The average temperature in the industrial reactor in our numerical simulation is slightly higher than the gas feed temperature. Despite the heat source with a temperature of 650 °C, this is not enough to heat the entire internal volume to a high temperature. We have already seen the temperature field in the industrial reactor in Figure 13. Heating the reactor zones with a high catalyst particles volume fraction is an important task for the efficient operation of an industrial reactor. We investigated some options for controlling the reactor heating in our previous works [37,38,83,84]. In particular, there we determined the relationship between the reactor heating and the circulation flows of gas and catalyst particles.
Let us consider the gas velocity fields in reactor models. Figure 18a,b show the velocity fields for a laboratory reactor. Figure 18c shows the axial velocity field for a laboratory reactor. Figure 18d,e show the velocity fields for an industrial reactor. Figure 18f shows the axial velocity field for an industrial reactor.
In the laboratory reactor model, the greatest velocity fluctuations are observed in the catalyst bed zone. The axial velocity field also reveals downward gas movements, which result from the downward movement of particles in the height-limited bed. The circulating particles entrain some of the gas with their motion. In most of the reactor, few particles are present, with only the finest fractions transportable there. In this region, the gas flow is uniformly ascending. Here, the main reaction scarcely occurs, while side reactions proceed independently of the catalyst.
In the industrial reactor model, catalyst movement occurs throughout the entire reactor volume. Some regions exhibit both rapidly ascending flows and downward gas flows. The gas and catalyst feed points, grate, cyclones, and other structural elements promote gas-phase movement and generate large-scale circulation patterns. These flow patterns of gas and catalyst particles ultimately determine both the heating distribution throughout the reactor and the progression of chemical reactions. A comprehensive study would be required to fully characterize gas movement in an industrial reactor with numerous internal elements. Therefore, the current analysis is limited to observational assessment of gas-phase movement.
Table 7 summarizes the gas movement parameters, including values calculated from the total gas flow rate and results derived from the CFD solution. Additionally, estimates are provided for the average gas–catalyst contact time and the average gas residence time in the reactor.
Table 7 indicates that the average gas velocity in the industrial reactor, calculated from the flow rate, is significantly higher than in the laboratory reactor. Despite the industrial reactor’s greater height, the gas residence time is shorter. However, whereas the catalyst bed in the laboratory reactor is confined to the bottom section, in the industrial reactor, catalyst circulates throughout the entire volume. Consequently, according to this estimate, the gas interacts with the catalyst bed in the industrial reactor for more than three times longer than in the laboratory reactor.
Table 7 presents the results obtained from the CFD simulations of the reactor models. In the CFD results, the average velocity calculated over the reactor volume differs from that derived from the mass flow rate, being higher in one case and lower in the other. It should be noted that these values are estimates requiring further verification. The mesh resolution significantly influences these results, and using a finer mesh would alter the values. Therefore, they should be considered as preliminary estimates. The CFD simulations indicate gas–catalyst contact times of 67.71 s in the industrial reactor and 5.615 s in the laboratory reactor. However, this longer contact time does not correspond to an increased yield of the main product.
Therefore, a large-scale industrial reactor cannot be analyzed solely based on average parameters and directly compared with a laboratory reactor. Industrial reactors can be divided into zones characterized by various features, such as catalyst concentration, gas velocity, and particle movement. In contrast, a laboratory reactor typically comprises only two zones: a catalyst bed and a freeboard. Comprehensive catalyst and process studies are essential in both cases. However, CFD simulation enables the visualization of internal reactor dynamics, allowing researchers to identify gas and catalyst flow patterns, temperature distributions, and model reaction product formation. The combination of laboratory studies and CFD simulations provides a robust approach for effectively scaling up processes from laboratory to industrial reactors.

5. Conclusions

A mathematical model is developed herein for simulating the dehydrogenation of isobutane within a lab-scale fluidized-bed catalytic reactor. The model was then applied to simulate a large-scale industrial reactor. The main results are as follows:
(1) A lab-scale reactor model (H = 70 cm, D = 2.8 cm) was constructed in both 3D and 2D axisymmetric configurations. The CFD model includes the reaction kinetics for the primary dehydrogenation of isobutane to isobutylene and hydrogen. In addition to the primary reaction, the model incorporates two secondary pathways: the thermal cracking of isobutane to form methane and propylene, and the hydrogenation of this propylene into propane, consuming hydrogen generated from the main dehydrogenation process. Experimental studies and numerical simulations of the laboratory reactor were performed for four temperature values: 550, 575, 600, and 625 °C. The product yield results from the CFD simulations show good agreement with the experimental data. The optimal process temperature in the laboratory reactor is 575 °C, at which the isobutylene yield is ~46.03 wt%. A decrease in temperature leads to a lower isobutylene yield, while an increase in temperature results in a higher yield. However, as the temperature increases, the total yield of side reaction products rises, reaching on average up to 20 wt%. A comparison of the CFD simulation results for the two laboratory reactor models—the 3D model and the 2D axisymmetric model—was conducted. For the gas phase fractions, the differences in average values range from 0.01% to 1.12%. Furthermore, the differences in average values relative to the results of the 3D model range from 0.006% to 0.1146%. The main distinctions are observed in the behavior of the solid phase particles.
(2) The CFD model developed for the laboratory reactor was applied to numerically simulate a 2D-axisymmetric model of a large-scale industrial reactor. The reactor is 23.81 m in height and 4.6 m in diameter and features a fluidized catalyst bed for the isobutane dehydrogenation process. Temperature fields and reaction product formation zones were analyzed. The average isobutylene yield is ~31.88 wt%, which aligns with the performance of actual industrial reactors but is lower than the results obtained for the laboratory reactor at all temperature values. The total yield of side reaction products averages ~6.92 wt%. The reactor exhibits distinct zones: a dense catalyst particle bed in the lower section and areas with a lower volumetric fraction of the solid phase in the upper section. The highest temperature of 650 °C is observed near the central pipe for supplying regenerated catalyst. The temperature decreases to ~557 °C near the outer wall in the central zone of the reactor. In the upper part of the reactor, the temperature is the lowest due to the absence of heat sources and endothermic chemical reactions. A number of factors influencing the formation of reaction products were identified. The main factors are the non-uniform flow of the gas and solid phases, as well as uneven heating of the reactor volume.
(3) The aim of this study is to validate the performance of a model, previously verified on a laboratory reactor, for simulating an industrial-scale reactor. A comparison of operating parameters and simulation results for the laboratory and industrial reactors was conducted. The reactors differ significantly in size and fluidization regime. The gas–catalyst contact time, obtained from numerical simulations, averages 5.615 s for the laboratory reactor and 67.71 s for the industrial reactor. Apart from its size, the industrial reactor also differs from the laboratory reactor in its heating principle. In the industrial unit, the gas is fed into the overall volume at a temperature of 550 °C, while the catalyst particles are supplied at 650 °C. Heating the industrial reactor is more complex due to its numerous internal elements, which influence the flow of both the gas and solid phases. Overall, the model developed for the laboratory reactor proved effective in the CFD modeling of the industrial reactor. This model can serve as a first approximation for building a more accurate model of the industrial reactor, which can be further refined through verification with a larger set of industrial data.
For the numerical simulation of the laboratory reactor, a 3D model is suitable, as it accurately describes the geometry and boundary conditions. For the industrial reactor model, however, it is necessary to outline the key assumptions and limitations:
(1) We must particularly note the use of a two-dimensional axisymmetric model. A comprehensive investigation of the reactor’s operation requires the development of a three-dimensional model. The use of a 3D model allows the gas and particles to move in an additional direction within the reactor’s cross-section. This can affect the flow patterns of the phases inside the internal partitions. However, as noted above, employing a three-dimensional model demands significant computational resources.
(2) The use of thermally insulated boundary conditions on the reactor’s outer wall. To specify the correct heat flux at the outer wall boundary, it is necessary to understand the structure of this multi-layered wall. Heat transfer from the gas to the wall, through the wall, and from the wall to the environment takes time. Given the high gas flow rate in the reactor, the calculated average residence time of a gas molecule in the reactor is ~36.2 s. In this study, we adopt a simplification whereby the gas remains in the reactor for a short time and does not have sufficient time to transfer a significant amount of thermal energy to the outer wall. With this simplification, we neglect heat losses through the outer wall, meaning we consider the reactor’s outer wall to be thermally insulated.
(3) The use of a simplified cyclone model, where particles entering the cyclone are immediately returned to the reactor above the upper baffle. The model implemented in this study significantly idealizes the cyclone’s operation. However, developing a more accurate simulation model of the cyclone requires a separate investigation into its performance under varying gas and particle loads.
The results of applying the developed model for the numerical simulation of the industrial reactor are reasonably good, yet they still do not account for many specific features of the real reactor. This study has outlined new tasks for our future work.
(1) Investigation into the feasibility of using a full three-dimensional model for the numerical simulation of a real industrial reactor. This includes employing more accurate thermal boundary conditions for the outer wall and verification of the models against operational data from actual industrial reactors.
(2) Implementation of more accurate models to simulate the performance of the cyclones. If these studies reveal the relationships between particle entry into the cyclone and their subsequent injection back into the reactor, this model can be used in further research for more precise simulation.
(3) CFD modeling of the reactor’s long-term operation. A real reactor operates continuously for several months. We require a mathematical model capable of demonstrating the stable operation of an industrial reactor over a period of several days. This extended simulation would allow for a more accurate determination of the average values of the reactor model’s operating parameters. However, this will require significant computational time.
(4) Development of an integrated reactor–regenerator model. The regenerator plays a crucial role in conjunction with the reactor. It also operates as a fluidized bed apparatus but is designed to restore catalyst activity. Furthermore, it is necessary to develop a model that can account for changes in the properties of catalyst particles during their residence time in the reactor and their restoration during their stay in the regenerator.
All this will contribute to the creation of a digital twin for a reactor–regenerator system used in the fluidized-bed dehydrogenation of isoparaffins.

Author Contributions

Conceptualization, S.A.S. and O.V.S.; methodology, S.A.S.; software, S.A.S.; validation, O.V.S.; formal analysis, O.V.S.; investigation, S.A.S.; resources, O.V.S.; data curation, O.V.S.; writing—original draft preparation, O.V.S.; writing—review and editing, S.A.S.; visualization, S.A.S.; supervision, S.A.S.; project administration, S.A.S.; funding acquisition, S.A.S. All authors have read and agreed to the published version of the manuscript.

Funding

This study was conducted within the scientific program of the National Center for Physics and Mathematics, section #2 “Mathematical Modeling on Zetta-scale and Exa-scale Supercomputers. Stage 2023–2025”.

Data Availability Statement

The original contributions presented in this study are included in the article. Further inquiries can be directed to the corresponding author.

Conflicts of Interest

The authors declare no conflicts of interest.

Nomenclature

Symbols
Aheat exchange surface area
A c a t coefficient of the gas–solid contact area
A r pre-exponential factor
CDdrag coefficient
Cfrfriction coefficient
C j , r species concentration in the mixture
Cpheat capacity
Dparticle diameter
dparticle diameter
D32Sauter mean diameter
D m , i mass diffusion coefficients
D T , i thermal diffusion coefficients
E r activation energy
escoefficient of recovery
f ( D ) distribution density function
ggravitation
henthalpy
hgsheat transfer coefficient
I ¯ ¯ unit tensor
J i diffusion flux
Kcoefficient of interaction between phases
k f , r reaction rate constant
k Θ s granule energy diffusion coefficient
M w , i molecular weight
N R number of reactions
NCCourant number
NuNusselt number
PrPrandtl number
p pressure
pspressure of solid phase granules
R i species formation source
ReReynolds number
Sc t Schmidt number
Ttemperature
ttime
v velocity
Y i species mass fraction
Greek symbols
α i volume fraction
γ Θ s particle collisions energy dissipation
η i , r exponent for the reactant
Θ s solid granule temperature
ϑ 0 s radial distribution coefficient
κ the thermal conductivity coefficient
λ bulk viscosity
μ shear viscosity
ρ density
τ ¯ ¯ stress tensor
ϕ g s energy exchange
Subscripts
ggas phase
ssolid phase

References

  1. Kunii, D.; Levenspiel, O. Fluidization engineering. In Butterworth-Heinemann; Butterworth-Heinemann: Oxford, UK, 1991; p. 491. [Google Scholar]
  2. Grace, J.R.; Bi, X.; Ellis, N. Essentials of Fluidization Technology; Grace, J.R., Bi, X., Ellis, N., Eds.; John Wiley and Sons: Hoboken, NJ, USA, 2020; p. 611. [Google Scholar]
  3. Sadeghbeigi, R. Fluid Catalytic Cracking Handbook: An Expert Guide to the Practical Operation, Design, and Optimization of FCC Units; Butterworth-Heinemann: Oxford, UK, 2020; p. 352. [Google Scholar]
  4. de Lasa, H. Chemical Reactor Design and Technology: Overview of the New Developments of Energy and Petrochemical Reactor Technologies. Projections for the 90’s; de Lasa, H., Ed.; University of Porto: Porto, Portugal, 2012; p. 850. [Google Scholar]
  5. Basu, P. Combustion and Gasification in Fluidized Beds; CRC Press: Boca Raton, FL, USA, 2006; p. 496. [Google Scholar]
  6. Bai, P.; Etim, U.J.; Yan, Z.; Mintova, S.; Zhang, Z.; Zhong, Z.; Gao, X. Fluid catalytic cracking technology: Current status and recent discoveries on catalyst contamination. Catal. Rev. 2019, 61, 333–405. [Google Scholar] [CrossRef]
  7. Özkaya, B.; Kaksonen, A.H.; Sahinkaya, E.; Puhakka, J.A. Fluidized bed bioreactor for multiple environmental engineering solutions. Water Res. 2019, 150, 452–465. [Google Scholar] [CrossRef]
  8. Hanchate, N.; Ramani, S.; Mathpati, C.S.; Dalvi, V.H. Biomass gasification using dual fluidized bed gasification systems: A review. J. Clean. Prod. 2021, 280, 123148. [Google Scholar] [CrossRef]
  9. Wang, L.; Zhou, T.; Hou, B.; Yang, H.; Hu, N.; Zhang, M. A comprehensive review of biomass gasification characteristics in fluidized bed reactors: Progress, challenges, and future directions. Fluids 2025, 10, 147. [Google Scholar] [CrossRef]
  10. Menéndez, M.; Herguido, J.; Bérard, A.; Patience, G.S. Experimental methods in chemical engineering: Reactors-fluidized beds. Can. J. Chem. Eng. 2019, 97, 2383–2394. [Google Scholar] [CrossRef]
  11. Chen, J.; Kemoun, A.; Al-Dahhan, M.H.; Dudukovi´c, M.P.; Lee, D.J.; Fan, L.-S. Comparative hydrodynamics study in a bubble column using computer-automated radioactive particle tracking (CARPT)/computed tomography (CT) and particle image velocimetry (PIV). Chem. Eng. Sci. 1999, 54, 2199–2207. [Google Scholar] [CrossRef]
  12. Jin, H.; Yang, S.; Guo, Z.; Guangxiang, H.; Tong, Z. The axial distribution of holdups in an industrial-scale bubble column with evaluated pressure using gamma ray attenuation approach. Chem. Eng. J. 2005, 115, 45–50. [Google Scholar] [CrossRef]
  13. Patel, A.K.; Waje, S.S.; Thorat, B.N.; Mujumdar, A.S. Tomographic diagnosis of gas maldistribution in gas–solid fluidized beds. Powder Technol. 2008, 185, 239–250. [Google Scholar] [CrossRef]
  14. Heindel, T.J.; Gray, J.N.; Jensen, T.C. An X-ray system for visualizing fluid flows. Flow Meas. Instrum. 2008, 19, 67–78. [Google Scholar] [CrossRef]
  15. Wang, F.; Marashdeh, Q.; Wang, A.; Fan, L.-S. Electrical capacitance volume tomography imaging of three-dimensional flow structures and solids concentration distributions in a riser and a bend of a gas–solid circulating fluidized bed. Ind. Eng. Chem. Res. 2012, 51, 10968–10976. [Google Scholar] [CrossRef]
  16. Mandal, D.; Sharma, V.K.; Pant, H.J.; Sathiyamoorthy, D.; Vinjamur, M. Quality of fluidization in gas–solid unary and packed fluidized beds: An experimental study using gamma ray transmission technique. Powder Technol. 2012, 226, 91–98. [Google Scholar] [CrossRef]
  17. Escudero, D.R.; Heindel, T.J. Acoustic fluidized bed hydrodynamics characterization using X-ray computed tomography. Chem. Eng. J. 2014, 243, 411–420. [Google Scholar] [CrossRef]
  18. Kingston, T.A.; Geick, T.A.; Robinson, T.R.; Heindel, T.J. Characterizing 3D granular flow structures in a double screw mixer using X-ray particle tracking velocimetry. Powder Technol. 2015, 278, 211–222. [Google Scholar] [CrossRef]
  19. Errigo, M.; Lettieri, P.; Materazzi, M. X-ray imaging techniques for gas–solid fluidized beds: A technical review. Particuology 2005, 101, 67–89. [Google Scholar] [CrossRef]
  20. Tu, J.; Yeoh, G.H.; Liu, C.; Tao, Y. Computational Fluid Dynamics: A Practical Approach; Elsevier: Amsterdam, The Netherlands, 2023. [Google Scholar]
  21. Zhao, Z.; Zhou, L.; Bai, L.; Wang, B.; Agarwal, R. Recent advances and perspectives of CFD–DEM simulation in fluidized bed. Arch. Comput. Methods Eng. 2024, 31, 871–918. [Google Scholar] [CrossRef]
  22. Chen, X.; Wang, J. A comparison of two-fluid model, dense discrete particle model and CFD-DEM method for modeling impinging gas–solid flows. Powder Technol. 2014, 254, 94–102. [Google Scholar] [CrossRef]
  23. Gidaspow, D. Multiphase Flow and Fluidization; Academic Press: Cambridge, MA, USA, 1994. [Google Scholar]
  24. Wu, Y.; Liu, D.; Hu, J.; Ma, J.; Chen, X. Comparative study of two fluid model and dense discrete phase model for simulations of gas–solid hydrodynamics in circulating fluidized beds. Particuology 2021, 55, 108–117. [Google Scholar] [CrossRef]
  25. Wang, J. Continuum theory for dense gas-solid flow: A state-of-the-art review. Chem. Eng. Sci. 2020, 215, 115428. [Google Scholar] [CrossRef]
  26. Alobaid, F.; Almohammed, N.; Farid, M.M.; May, J.; Rößger, P.; Richter, A.; Epple, B. Progress in CFD simulations of fluidized beds for chemical and energy process engineering. Prog. Energy Combust. Sci. 2022, 91, 100930. [Google Scholar] [CrossRef]
  27. Wang, S.; Hu, C.; Luo, K.; Yu, J.; Fan, J. Multi-scale numerical simulation of fluidized beds: Model applicability assessment. Particuology 2023, 80, 11–41. [Google Scholar] [CrossRef]
  28. Zhong, W.; Yu, A.; Zhou, G.; Xie, J.; Zhang, H. CFD simulation of dense particulate reaction system: Approaches, recent advances and applications. Chem. Eng. Sci. 2016, 140, 16–43. [Google Scholar] [CrossRef]
  29. Akbari, V.; Borhani, T.N.G.; Shamiri, A.; Shafeeyan, M.S. Computational fluid dynamics modeling of gas-solid fluidized bed reactor: Influence of numerical and operating parameters. Exp. Comput. Multiph. Flow 2024, 6, 85–125. [Google Scholar] [CrossRef]
  30. Qi, W.; Lan, P.; Yang, J.; Chen, Y.; Zhang, Y.; Wang, G.; Peng, F.; Hong, J. Multi-U-Style micro-channel in liquid cooling plate for thermal management of power batteries. Appl. Therm. Eng. 2024, 256, 123984. [Google Scholar] [CrossRef]
  31. Zhang, Y.; Xu, S.; Song, Y.; Qi, W.; Guo, Q.; Li, X.; Kong, L.; Chen, J. Real-time global optimal energy management strategy for connected PHEVs based on traffic flow information. IEEE Trans. Intell. Transp. Syst. 2024, 25, 20032–20042. [Google Scholar] [CrossRef]
  32. Gosavi, A.A.; Nandgude, T.D.; Mishra, R.K.; Puri, D.B. Exploring the Potential of Artificial Intelligence as a Facilitating Tool for Formulation Development in Fluidized Bed Processor: A Comprehensive Review. AAPS PharmSciTech 2024, 25, 111. [Google Scholar] [CrossRef]
  33. Alotaibi, F.N.; Berrouk, A.S.; Salim, I.M. Scaling up dry methane reforming: Integrating computational fluid dynamics and machine learning for enhanced hydrogen production in industrial-scale fluidized bed reactors. Fuel 2024, 376, 132673. [Google Scholar] [CrossRef]
  34. Schneiderbauer, S.; Puttinger, S.; Pirker, S.; Aguayo, P.; Kanellopoulos, V. CFD modeling and simulation of industrial scale olefin polymerization fluidized bed reactors. Chem. Eng. J. 2015, 264, 99–112. [Google Scholar] [CrossRef]
  35. Schneiderbauer, S.; Pirker, S.; Puttinger, S.; Aguayo, P.; Touloupidis, V.; Joaristi, A.M. A Lagrangian-Eulerian hybrid model for the simulation of poly-disperse fluidized beds: Application to industrial-scale olefin polymerization. Powder Technol. 2017, 316, 697–710. [Google Scholar] [CrossRef]
  36. Shah, S.; Myöhänen, K.; Kallio, S.; Hyppänen, T. CFD simulations of gas–solid flow in an industrial-scale circulating fluidized bed furnace using subgrid-scale drag models. Particuology 2015, 18, 66–75. [Google Scholar] [CrossRef]
  37. Solov’ev, S.A.; Egorov, A.G.; Lamberov, A.A.; Egorova, S.R.; Kataev, A.N. Effect of the design of a feedstock injection device in a fluidized bed reactor on the efficiency of the reaction, using the dehydrogenation of iso-paraffins in a fluidized chromia-alumina catalyst bed as an example. Catal. Ind. 2016, 8, 48–55. [Google Scholar] [CrossRef]
  38. Soloveva, O.V.; Solovev, S.A.; Egorova, S.R.; Lamberov, A.A.; Antipin, A.V.; Shamsutdinov, E.V. CFD modeling a fluidized bed large scale reactor with various internal elements near the heated particles feeder. Chem. Eng. Res. Des. 2018, 138, 212–228. [Google Scholar] [CrossRef]
  39. Dash, S.; Mohanty, S.; Mishra, B.K. CFD modelling and simulation of an industrial scale continuous fluidized bed roaster. Adv. Powder Technol. 2020, 31, 658–669. [Google Scholar] [CrossRef]
  40. Lin, R.; Wang, S.; Tao, Y.; Feng, X.; Zhang, H. Numerical Simulation and Optimization of Industrial-Scale Fluidized Bed Reactor Coupling Biomass Catalytic Pyrolysis Kinetics. Energies 2025, 18, 3601. [Google Scholar] [CrossRef]
  41. Zhang, C.; Lu, B.; Wang, W.; Liu, M.; Lu, C.; Ye, M. CFD simulation of an industrial MTO fluidized bed by coupling a population balance model of coke content. Chem. Eng. J. 2022, 446, 136849. [Google Scholar] [CrossRef]
  42. Han, C.; Xu, Y.; Lu, B.; Wang, W. Two-Phase and Three-Phase Modeling of an Industrial Fluidized Bed for Maximizing Iso-Paraffins. Chem. Ing. Tech. 2023, 95, 97–106. [Google Scholar] [CrossRef]
  43. Sun, H.; Yang, S.; Bao, G.; Luo, K.; Hu, J.; Wang, H. CFD investigation of the complex multiphase flow of biomass gasification in industrial-scale dual fluidized bed reactor. Chem. Eng. J. 2023, 457, 141312. [Google Scholar] [CrossRef]
  44. Sun, H.; Bao, G.; Yang, S.; Hu, J.; Wang, H. Numerical investigation on the influence of immersed tube bundles on biomass gasification in industrial-scale dual fluidized bed gasifier. Fuel 2024, 357, 129742. [Google Scholar] [CrossRef]
  45. Singh, V.; Nemalipuri, P.; Das, H.C.; Vitankar, V. An Eulerian-Eulerian multifluid simulation for co-combustion of coal and sawdust in industrial scale circulating fluidized bed boiler. Clean. Energy Syst. 2025, 10, 100169. [Google Scholar] [CrossRef]
  46. Zhang, S.; Fan, W.; Du, X.; Pan, M.; Yu, H.; Gao, F.; Wu, F.; Hong, Y.; Wang, Y.; Zhou, M.; et al. Enhancing the desulfurization performance of industrial scale circulating fluidized bed flue gas desulfurization process using turbulent ring. Appl. Therm. Eng. 2025, 272, 126339. [Google Scholar] [CrossRef]
  47. Sanfilippo, D.; Miracca, I. Dehydrogenation of paraffins: Synergies between catalyst design and reactor engineering. Catal. Today 2006, 111, 133–139. [Google Scholar] [CrossRef]
  48. Sanfilippo, D. Dehydrogenations in fluidized bed: Catalysis and reactor engineering. Catal. Today 2011, 178, 142–150. [Google Scholar] [CrossRef]
  49. Du, Y.; Zhang, L.; Berrouk, A.S. Exergy analysis of propane dehydrogenation in a fluidized bed reactor: Experiment and MP-PIC simulation. Energy Convers. Manag. 2019, 202, 112213. [Google Scholar] [CrossRef]
  50. Airaksinen, S.M.; Harlin, M.E.; Krause, A.O.I. Kinetic modeling of dehydrogenation of isobutane on chromia/alumina catalyst. Ind. Eng. Chem. Res. 2002, 41, 5619–5626. [Google Scholar] [CrossRef]
  51. Pakhomov, N.A.; Parakhin, O.A.; Nemykina, E.I.; Danilevich, V.V.; Chernov, M.P.; Pecherichenko, V.A. Microspherical chromium oxide/alumina catalyst KDM for fluidized-bed isobutane dehydrogenation: Development and industrial application experience. Catal. Ind. 2012, 4, 298–307. [Google Scholar] [CrossRef]
  52. Ma, Z.; Mo, Y.; Li, J.; An, C.; Liu, X. Optimization of PtSnK/Al2O3 isobutane dehydrogenation catalyst prepared by an impregnation-reduction method. J. Nat. Gas Sci. Eng. 2015, 27, 1035–1042. [Google Scholar] [CrossRef]
  53. Matveyeva, A.N.; Omarov, S.O.; Sladkovskiy, D.A.; Murzin, D.Y. Experimental studies and kinetic regularities of isobutane dehydrogenation over Ga2O3/Al2O3. Chem. Eng. J. 2019, 372, 1194–1204. [Google Scholar] [CrossRef]
  54. Matveyeva, A.N.; Wärnå, J.; Pakhomov, N.A.; Murzin, D.Y. Kinetic modeling of isobutane dehydrogenation over Ga2O3/Al2O3 catalyst. Chem. Eng. J. 2020, 381, 122741. [Google Scholar] [CrossRef]
  55. Matveyeva, A.N.; Zaitseva, N.A.; Mäki-Arvela, P.; Aho, A.; Bachina, A.K.; Fedorov, S.P.; Murzin, D.Y.; Pakhomov, N.A. Fluidized-bed isobutane dehydrogenation over alumina-supported Ga2O3 and Ga2O3/Al2O3 catalysts. Ind. Eng. Chem. Res. 2018, 57, 927–938. [Google Scholar] [CrossRef]
  56. Utemov, A.V.; Matveeva, A.N.; Sladkovskaya, E.V.; Murzin, D.Y.; Sladkovskii, D.A. Integration of Turboexpanders into Reactor Blocks of the Dehydrogenation of Processes of Light Alkanes. Theor. Found. Chem. Eng. 2024, 58, 1619–1629. [Google Scholar] [CrossRef]
  57. Vernikovskaya, N.V.; Savin, I.G.; Kashkin, V.N.; Pakhomov, N.A.; Ermakova, A.; Molchanov, V.V.; Nemykina, E.L.; Parahin, O.A. Dehydrogenation of propane-isobutane mixture in a fluidized bed reactor over Cr2O3/Al2O3 catalyst: Experimental studies and mathematical modelling. Chem. Eng. J. 2011, 176, 158–164. [Google Scholar] [CrossRef]
  58. Azimi, S.S.; Kalbasi, M. Three-phase modeling of dehydrogenation of isobutane to isobutene in a fluidized bed reactor: Effect of operating conditions on the energy consumption. Energy 2018, 149, 250–261. [Google Scholar] [CrossRef]
  59. Egorova, S.R.; Bekmukhamedov, G.E.; Lamberov, A.A. Effect of High-Temperature Treatment on the Properties of an Alumina–Chromium Catalyst for the Dehydrogenation of Lower Paraffins. Kinet. Catal. 2013, 54, 49–58. [Google Scholar] [CrossRef]
  60. Bekmukhamedov, G.E.; Egorova, S.R.; Lamberov, A.A. Effect of the Nature of Silicon Oxide Structures on the Activity of an Alumina–Chromium Catalyst in the Reaction of iso-Butane Dehydrogenation. Catal. Ind. 2014, 6, 44–52. [Google Scholar] [CrossRef]
  61. Bekmukhamedov, G.E.; Mukhamed’yarova, A.N.; Egorova, S.R.; Lamberov, A.A. Modification by SiO2 of Alumina Support for Light Alkane Dehydrogenation Catalysts. Catalysts 2016, 6, 162. [Google Scholar] [CrossRef]
  62. Lamberov, A.A.; Egorova, S.R.; Gilmanov KhKh Kataev, A.N.; Bekmukhamedov, G.E. Pilot Tests of the Microspherical Aluminochromium KDI-M Catalyst for iso-Butane Dehydrogenation. Catal. Ind. 2017, 9, 17–22. [Google Scholar] [CrossRef]
  63. Egorova, S.R.; Tuktarov, R.R.; Boretskaya, A.V.; Laskin, A.I.; Gizyatullov, R.N.; Lamberov, A.A. Stabilizing effect of α-Cr2O3 on highly active phases and catalytic performance of a chromium alumina catalyst in the process of isobutane dehydrogenation. Mol. Catal. 2021, 509, 111610. [Google Scholar] [CrossRef]
  64. Solovev, S.A.; Soloveva, O.V.; Bekmukhamedov, G.E.; Egorova, S.R.; Lamberov, A.A. CFD-Simulation of isobutane dehydrogenation for a fluidized bed reactor. ChemEngineering 2022, 6, 98. [Google Scholar] [CrossRef]
  65. Ding, J.; Gidaspow, D. A bubbling fluidization model using kinetic theory of granular flow. AIChE J. 1990, 36, 523–538. [Google Scholar] [CrossRef]
  66. Ogawa, S.; Umemura, A.; Oshima, N. On the equation of fully fluidized granular materials. J. Appl. Math. Phys. 1980, 31, 483–493. [Google Scholar] [CrossRef]
  67. Lun, C.K.K.; Savage, S.B.; Jeffrey, D.J. Kinetic theories for granular flow: Inelastic particles in couette flow and slightlyinelastic particles in a general flow field. J. Fluid Mech. 1984, 140, 223–256. [Google Scholar] [CrossRef]
  68. Syamlal, M. The Particle-Particle Drag Term in a Multiparticle Model of Fluidization; DOE/MC/21353-2373, NTIS/DE87006500; National Technical Information Service: Springfield, VA, USA, 1987.
  69. Gunn, D.J. Transfer of heat or mass to particles in fixed and fluidized beds. Int. J. Heat Mass Transf. 1978, 21, 467–476. [Google Scholar] [CrossRef]
  70. Wang, D.; Fan, L.-S. Particle characterization and behavior relevant to fluidized bed combustion and gasification systems. In Fluidized Bed Technologies for Near-Zero Emission Combustion and Gasification; Elsevier: Cambridge, UK, 2013; pp. 42–76. [Google Scholar]
  71. Yates, J.G.; Newton, D. Fine particle effects in a fluidized-bed reactor. Chem. Eng. Sci. 1986, 41, 801–806. [Google Scholar] [CrossRef]
  72. Kono, H.O.; Ells, T.S.; Chiba, S.; Suzuki, M.; Morimoto, E. Quantitative criteria for emulsion phase characterization and for the transition between particulate and bubbling fluidization. Powder Technol. 1987, 52, 69–76. [Google Scholar] [CrossRef]
  73. Grace, J.R.; Sun, G. Influence of particle size distribution on the performance of fluidized bed reactors. Can. J. Chem. Eng. 1991, 69, 1126–1134. [Google Scholar] [CrossRef]
  74. van Ommen, J.R.; Nijenhuis, J.; van den Bleek, C.M.; Coppens, M. Four ways to introduce structure in fluidized bed reactors. Ind. Eng. Chem. Res. 2007, 46, 4236–4244. [Google Scholar] [CrossRef]
  75. Khoe, G.K.; Ip, T.L.; Grace, J.R. Rheological and fluidization behavior of powders of different particle size distribution. Powder Technol. 1991, 66, 127–141. [Google Scholar] [CrossRef]
  76. Saayman, J.; Ellis, N.; Nicol, W. Fluidization of high-density particles: The influence of fines on reactor performance. Powder Technol. 2013, 245, 48–55. [Google Scholar] [CrossRef]
  77. Beetstra, R.; Nijenhuis, J.; Ellis, N.; van Ommen, J.R. The influence of the particle size distribution on fluidized bed hydrodynamics using high throughput experimentation. AIChE J. 2009, 55, 2013–2023. [Google Scholar] [CrossRef]
  78. Brouwer, G.C.; Wagner, E.C.; van Ommen, J.R.; Mudde, R.F. Effects of pressure and fines content on bubble diameter in a fluidized bed studied using fast X-ray tomography. Chem. Eng. J. 2012, 207–208, 711–717. [Google Scholar] [CrossRef]
  79. Gu, Y.; Ozel, A.; Sundaresan, S. Numerical studies of the effects of fines on fluidization. AIChE J. 2016, 62, 2271–2281. [Google Scholar] [CrossRef]
  80. Solovev, S.A.; Soloveva, O.V. Study of the influence of the mean particle diameter choice and the fractions number on the quality of fluidized bed numerical simulation. Processes 2024, 12, 2528. [Google Scholar] [CrossRef]
  81. Gobin, A.; Neau, H.; Simonin, O.; Llinas, J.; Reiling, V.; Selo, J. Numerical simulations of a gas-phase polymerization reactor. In Proceedings of European Congress on Computational Methods in Applied Sciences and Engineering, Wales, UK, 4–7 September 2001. [Google Scholar]
  82. Cornelissen, J.T.; Taghipour, F.; Escudie, R.; Ellis, N.; Grace, J.R. CFD modelling of a liquid–solid fluidized bed. Chem. Eng. Sci. 2007, 62, 6334–6348. [Google Scholar] [CrossRef]
  83. Soloveva, O.V.; Solovyev, S.A. Investigation of the influence of heated catalyst feeding system on the intensity of temperature-dependent chemical reaction in the fluidized bed apparatus. IOP Conf. Ser. Mater. Sci. Eng. 2016, 158, 012086. [Google Scholar] [CrossRef]
  84. Solovev, S.A.; Soloveva, O.V.; Antipin, A.V.; Shamsutdinov, E.V. Investigation of internal elements impaction on particles circulation in a fluidized bed reactor. IOP Conf. Ser. J. Phys. 2018, 944, 012114. [Google Scholar] [CrossRef]
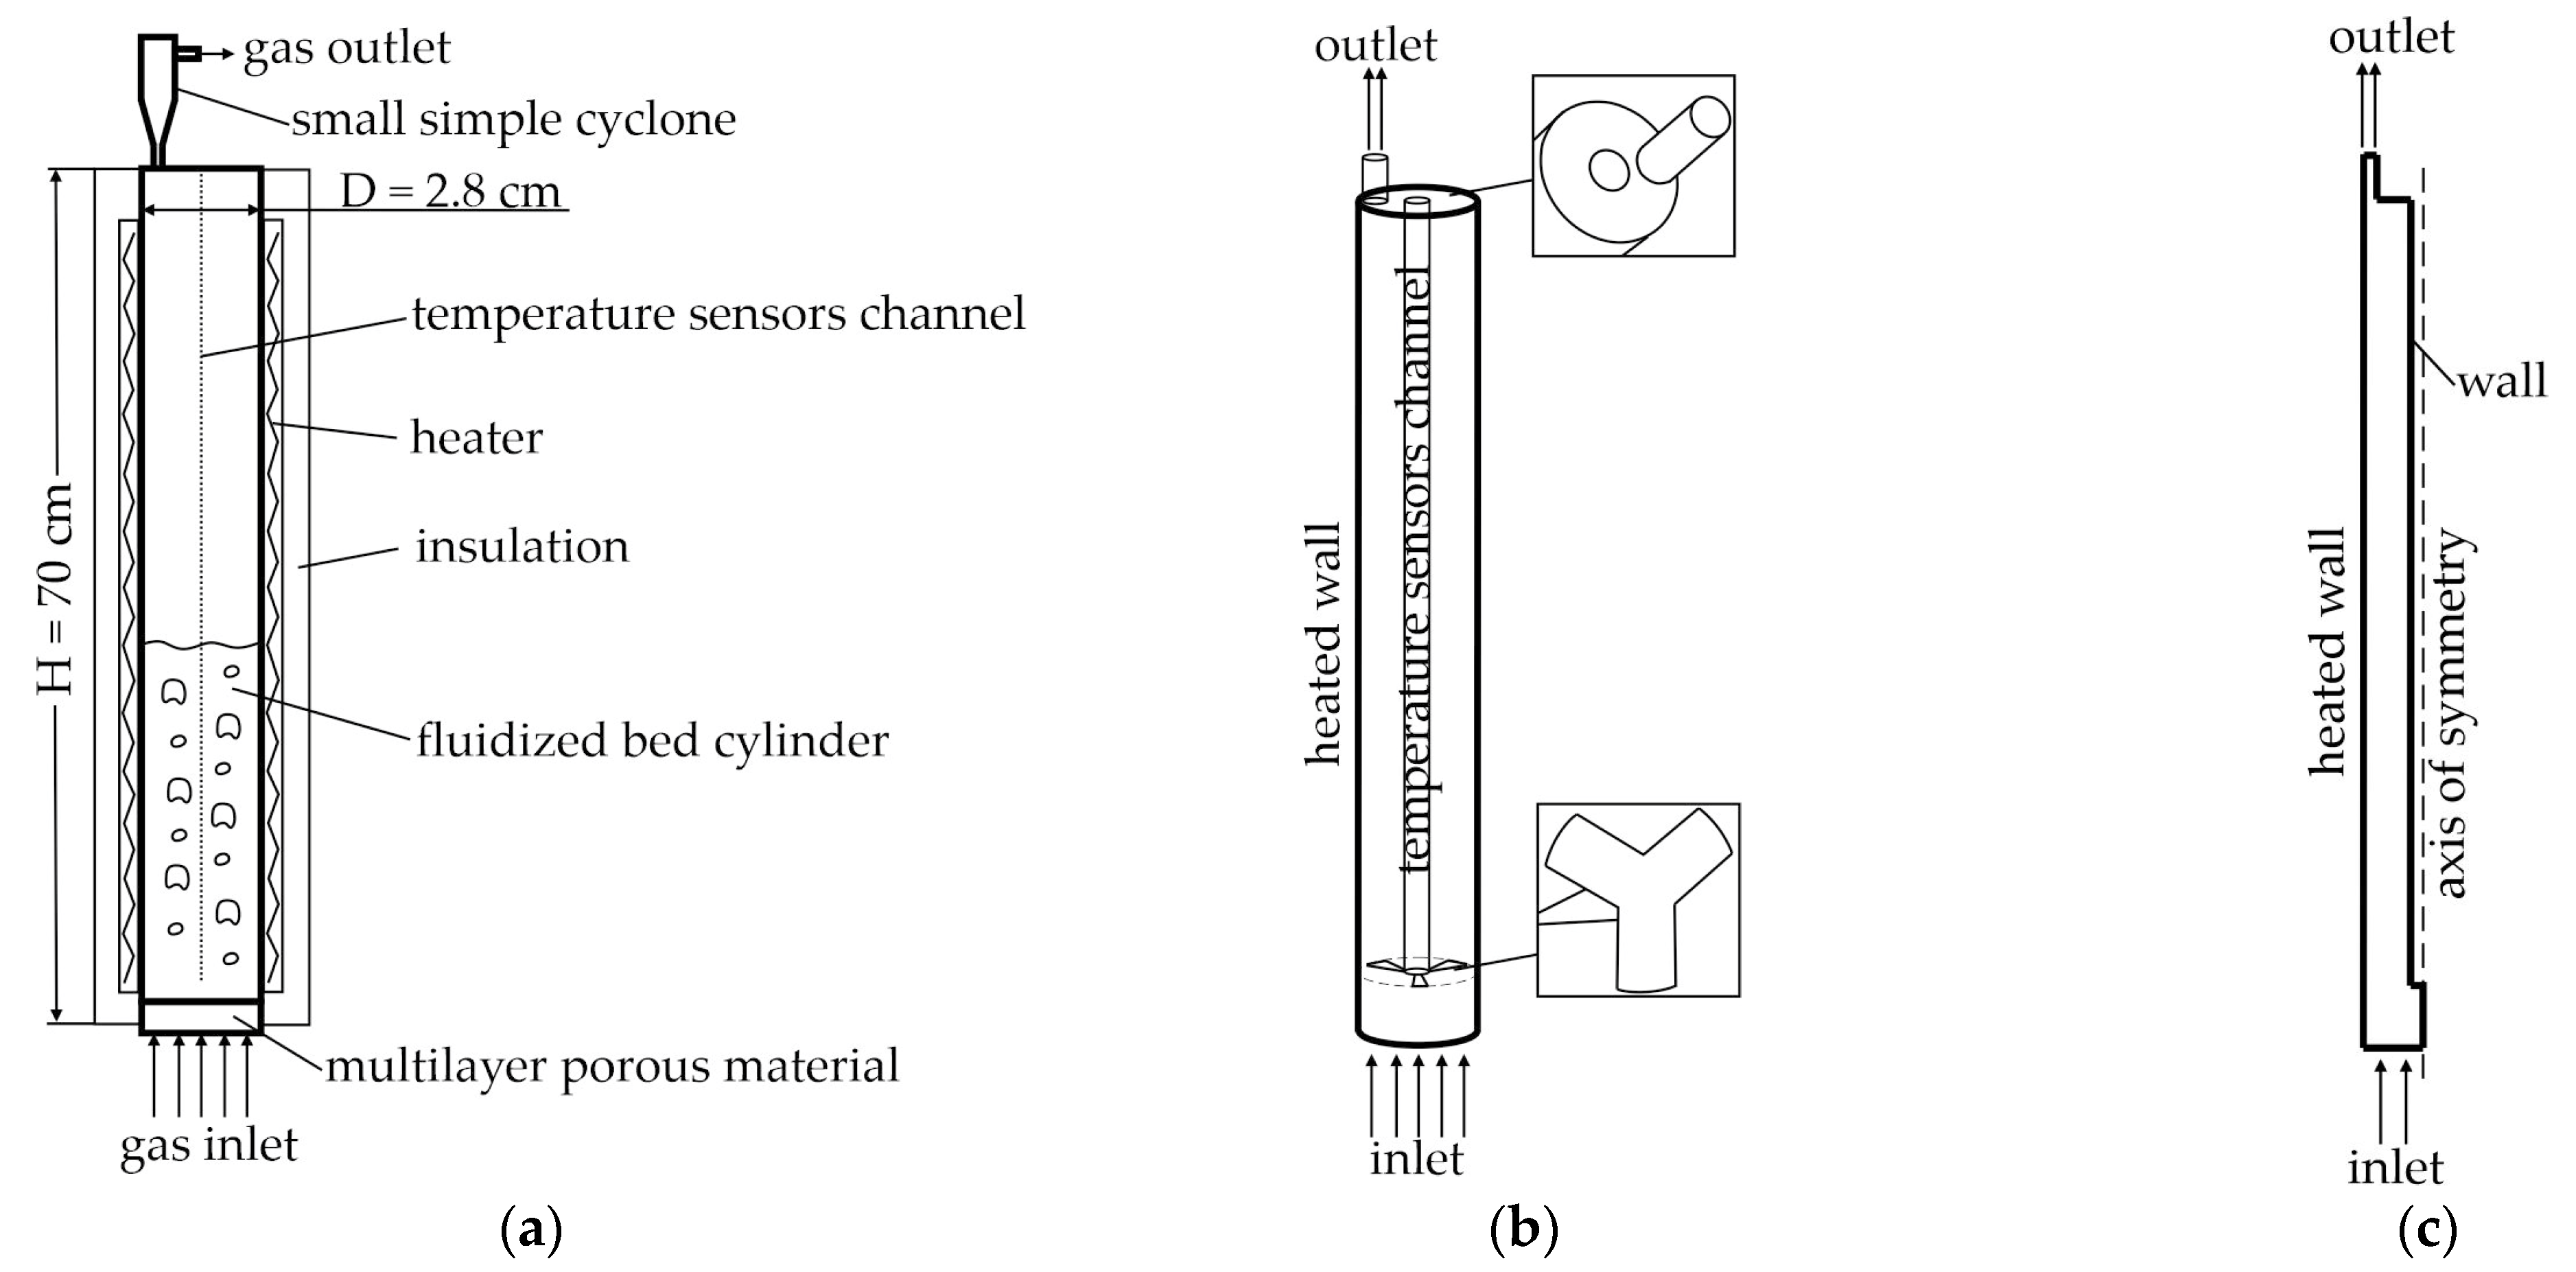
Figure 1. Lab-scale reactor: (a) experimental reactor scheme; (b) 3D model of computational domain; (c) 2D axisymmetric model of computational domain.
Chemengineering 09 00129 g001
Figure 2. Industrial reactor scheme.
Chemengineering 09 00129 g002
Figure 3. Results of mesh size testing for numerical simulation for laboratory reactor: (a) average profile of solid phase volume fraction for different values Δ x ; (b) average pressure drop for different values Δ x .
Chemengineering 09 00129 g003
Figure 4. Mesh examples: (a) laboratory reactor; (b) industrial reactor.
Chemengineering 09 00129 g004
Figure 5. Results of mesh size testing for numerical simulation for industrial reactor.
Chemengineering 09 00129 g005
Figure 6. Fields of solid and gas phase components obtained as a result of numerical modeling for a 3D model of a laboratory reactor at a temperature of 575 °C: (a) volume fraction of the solid phase; (b) mass fraction of i-C4H10; (c) mass fraction of i-C4H8; (d) mass fraction of H2; (e) mass fraction of CH4; (f) mass fraction of C3H6; (g) mass fraction of C3H8.
Chemengineering 09 00129 g006
Figure 7. Average values of solid and gas phase components for a 3D model of a laboratory reactor at 575 °C: (a) volume fraction of the solid phase; (b) mass fraction of i-C4H10; (c) mass fraction of i-C4H8; (d) mass fraction of H2; (e) mass fraction of CH4; (f) mass fraction of C3H6; (g) mass fraction of C3H8.
Chemengineering 09 00129 g007
Figure 8. Mass fraction of reaction products for 3D model in comparison with experimental data [64]: (a) i-C4H10 and i-C4H8; (b) H2, CH4, C3H8, C3H6.
Chemengineering 09 00129 g008
Figure 9. Fields of solid and gas phase components obtained as a result of numerical modeling for a 2D-axisymmetric model of a laboratory reactor at a temperature of 575 °C: (a) volume fraction of the solid phase; (b) mass fraction of i-C4H10; (c) mass fraction of i-C4H8; (d) mass fraction of H2; (e) mass fraction of CH4; (f) mass fraction of C3H6; (g) mass fraction of C3H8.
Chemengineering 09 00129 g009
Figure 10. Average values of solid and gas phase components for a 2D-axisymmetric model of a laboratory reactor at 575 °C: (a) volume fraction of the solid phase; (b) mass fraction of i-C4H10; (c) mass fraction of i-C4H8; (d) mass fraction of H2; (e) mass fraction of CH4; (f) mass fraction of C3H6; (g) mass fraction of C3H8.
Chemengineering 09 00129 g010
Figure 11. Mass fraction of reaction products for the case of 100 g catalyst mass for 2D-axisymmetric model in comparison with experimental data [64]: (a) i-C4H10 and i-C4H8; (b) H2, CH4, C3H8, C3H6.
Chemengineering 09 00129 g011
Figure 12. Fields of volume solids fraction obtained as a result of numerical modeling for a 2D-axisymmetric model of an industrial reactor: (a) volume fraction of coarse particles; (b) volume fraction of fine particles; (c) volume fraction of fine particles on a scale of 0–0.2.
Chemengineering 09 00129 g012
Figure 13. Temperature fields obtained as a result of numerical simulation for a 2D-axisymmetric model of an industrial reactor: (a) 550–650 °C scale; (b) 550–600 °C scale; (c) 550–565 °C scale.
Chemengineering 09 00129 g013
Figure 14. Gas phase species fields obtained from numerical simulations for a 2D-axisymmetric model of an industrial reactor: (a) mass fraction of i-C4H10; (b) mass fraction of i-C4H8; (c) mass fraction of H2.
Chemengineering 09 00129 g014
Figure 15. Gas phase species fields obtained from numerical simulations for a 2D-axisymmetric model of an industrial reactor: (a) mass fraction of CH4; (b) mass fraction of C3H6; (c) mass fraction of C3H8; (d) mass fraction of N2.
Chemengineering 09 00129 g015
Figure 16. Average values of solid and gas phase components for a 2D-axisymmetric model of an industrial reactor: (a) volume fraction of coarse particles; (b) volume fraction of fine particles; (c) mass fraction of i-C4H10; (d) mass fraction of i-C4H8; (e) mass fraction of H2.
Chemengineering 09 00129 g016
Figure 17. Average values of gas phase species for a 2D-axisymmetric model of an industrial reactor: (a) mass fraction of CH4; (b) mass fraction of C3H6; (c) mass fraction of C3H8; (d) mass fraction of N2.
Chemengineering 09 00129 g017
Figure 18. Gas phase velocity fields obtained from numerical simulations for a 2D axisymmetric model of a laboratory reactor and a 2D axisymmetric model of an industrial reactor: (a) laboratory reactor, 0.0–0.4 scale; (b) laboratory reactor, 0.0–0.1 scale; (c) laboratory reactor, axial velocity component, −0.1–0.4 scale; (d) industrial reactor, 0.0–8.0 scale; (e) industrial reactor, 0.0–1.0 scale; (f) industrial reactor, axial velocity component, −3.0–8.0 scale.
Chemengineering 09 00129 g018
Table 1. Average gas species mass fractions in the experiment.
Speciesi-C4H10i-C4H8H2CH4C3H6C3H8-
wt.%40.32946.1041.7073.0642.7082.428-
SpeciesCO + CO2n-C4H10C2H6C4H8n-C4H8C5 fractionsC2H4
wt.%1.3650.6560.6120.5810.1970.1610.084
Table 2. Pre-exponential factor and activation energy for used chemical reactions [64].
Reaction Pre - Exponential   Factor   A r Activation   Energy E r , kJ/mol
Isobutane dehydrogenation (19)1.5 × 109117
Thermal cracking (20)2.0 × 109120
Propylene hydrogenation (21)1.8 × 109121
Table 3. Boundary inlet conditions for gas and solid phases.
Laboratory ReactorIndustrial Reactor
Gasspecies mixture:species mixture:
i-C4H10i-C4H10
i-C4H8i-C4H8
H2H2
CH4CH4
C3H6C3H6
C3H8C3H8
-N2
Mass-flow rate i-C4H10, kg/s1.32 × 10−58.05
Mass-flow rate N2, kg/s-0.11
Supply gas temperature, °C550
575
600
625
550
Catalystspherical particle model,
one fraction
spherical particle model,
two fractions
Mean diameter, µm8440 (30%)
100 (70%)
Mass-flow rate of particles, kg/s-33.3348
Supply particles temperature, °C-650
Table 4. Comparison of numerical simulation average results for a 3D model and a 2D-axisymmetric model of a laboratory reactor.
Temperature, °CSpecies,
Name
Average Value
Y3D, wt.%
Average Value
Y2D, wt.%
|Y3DY3D|,
wt.%
|Y3DY3D|/Y3D,
wt.%/wt.%
550i-C4H1055.4055.040.360.006498
i-C4H840.2040.820.620.015423
H21.471.490.020.013605
CH40.960.850.110.114583
C3H60.490.450.040.081633
C3H81.481.350.130.087838
575i-C4H1045.1044.101.000.022173
i-C4H845.7946.911.120.024459
H21.711.720.010.005848
CH42.732.650.080.029304
C3H61.951.910.040.020513
C3H82.722.710.010.003676
600i-C4H1035.7034.980.720.020168
i-C4H850.3051.290.990.019682
H21.931.990.060.031088
CH44.684.510.170.036325
C3H63.503.420.080.022857
C3H83.893.810.080.020566
625i-C4H1028.7028.360.340.011847
i-C4H852.9053.500.600.011342
H21.921.990.070.036458
CH46.416.320.090.014041
C3H65.305.210.090.016981
C3H84.774.620.150.031447
Table 5. Comparison of numerical simulation results for laboratory and industrial reactor models. Mass fractions of gas phase species.
-Temperature, °C
-550575600625550–650
Species, NameLaboratory Reactor, wt.%Industrial Reactor, wt.%
i-C4H1055.0444.1034.9828.3659.15
i-C4H840.8246.9151.2953.5031.88
H21.491.721.991.991.35
CH40.852.654.516.322.61
C3H60.451.913.425.211.24
C3H81.352.713.814.623.07
N2----0.7
Table 6. Comparison of numerical simulation results for laboratory and industrial reactor models. Temperature.
-Temperature, °C
-550575600625550–650
-Laboratory ReactorIndustrial Reactor
Average temperature, °C549.92574.86599.80624.76557.13
Maximum
temperature, °C
552.72578.46605.57631.53650.00
Minimum
temperature, °C
548.79573.04596.94619.48549.34
Maximum
temperature
difference, °C
3.935.428.6312.05100.66
Heat sourceReactor wallSupply of heated catalyst
Table 7. Comparison of numerical simulation results for laboratory and industrial reactor models. Gas flow.
-Laboratory ReactorIndustrial Reactor
Calculated average velocity based on
determined gas flow rate, m/s
0.0160.376
Calculated average time of gas
movement in a reactor, s
43.7536.197
Fluidization regimebubblingturbulent
Average height of catalyst particle bed, m0.169the whole reactor
Calculated average time of gas
movement in the catalyst bed, s
10.56336.197
Average velocity from CFD solution, m/s0.03010.201
Maximum velocity from CFD solution, m/s0.3677.157
Minimum velocity from CFD solution, m/s0.0000650.00024
Average time of gas movement in a
catalyst bed from a CFD solution, s
5.61567.71
Disclaimer/Publisher’s Note: The statements, opinions and data contained in all publications are solely those of the individual author(s) and contributor(s) and not of MDPI and/or the editor(s). MDPI and/or the editor(s) disclaim responsibility for any injury to people or property resulting from any ideas, methods, instructions or products referred to in the content.