Article

Parametric CFD Study of Spray Drying Chamber Geometry: Part II—Effects on Particle Histories

by
Jairo Andrés Gutiérrez Suárez
1,*,†,
Carlos Humberto Galeano Urueña
2,† and
Alexánder Gómez Mejía
1,†
1
Grupo de Investigación en Biomasa y Optimización Térmica de Procesos, Departamento de Ingeniería Mecánica y Mecatrónica, Facultad de Ingeniería, Universidad Nacional de Colombia-Sede Bogotá, Cra 45 #26-85, Bogotá 111321, Colombia
2
Grupo de Modelado y Métodos Numéricos en Ingeniería, Departamento de Ingeniería Mecánica y Mecatrónica, Facultad de Ingeniería, Universidad Nacional de Colombia-Sede Bogotá, Cra 45 #26-85, Bogotá 111321, Colombia
*
Author to whom correspondence should be addressed.
These authors contributed equally to this work.
ChemEngineering 2025, 9(6), 121; https://doi.org/10.3390/chemengineering9060121
Submission received: 6 July 2025 / Revised: 7 October 2025 / Accepted: 10 October 2025 / Published: 1 November 2025

Abstract

Particle histories critically influence product quality in spray drying processes, encompassing statistical data on particle dynamics and behavior inside the chamber, including temperatures, moisture levels, wall impacts, and residence times. This study presents the first systematic parametric assessment of how chamber geometry influences particle histories in spray drying, extending previous work on airflow dynamics. A design of experiments (DOE) methodology combined with cost-efficient CFD simulations was employed to establish quantitative parameter–response relationships. The results reveal two distinct classes of particle responses: (i) residence time, moisture content, and wall temperature, which are primarily governed by chamber aspect ratio and drying air flow rate, and (ii) particle–wall impact behavior, which is dominated by chamber topology. Inlet swirl modulates all particle histories, differentially impacting final product quality and energy efficiency. These findings provide predictive guidelines for chamber design and operation, while the methodology offers a general framework for scale-up analyses and parametric CFD studies of particle-laden multiphase processes.

Graphical Abstract

1. Introduction

The companion paper [1] studied the influence of key geometric design parameters of a drying chamber on internal airflow dynamics. The geometry parameters were related to the topology and shape-form of the drying chamber. The study was a cold-flow simulation, focused on airflow dynamics. Response variables describing both short- and long-timescale transient phenomena were proposed and analyzed from a parametric framework using three-dimensional, transient cost-efficient CFD simulations. The proposed methodology allowed a quantitative, systematic assessment of geometry–airflow interactions in spray drying processes, providing an evaluation not previously available in the literature.
The present study builds on the same methodology used in the companion paper, but increases its potential impact by incorporating the particle phase into the modeling framework. Responses associated with the particle phase, defined in this study as particle histories, represent statistical properties such as residence time, temperature, moisture content, and interactions with chamber walls or other particles, inherently involving heat and mass transfer between the gas and particle phases. While previous work established quantitative relations between geometry and airflow [2,3,4,5], which implied potential effects on particles, direct quantitative assessment of the particle phase, including their trajectories and drying kinetics, is required to achieve a comprehensive understanding of the influence of chamber geometry on particle behavior and drying performance. This extension enables integral analyses of chamber design parameters with particle histories, addressing the main research objective: to advance understanding of spray drying processes and support improved chamber design and product quality control.
Previous studies have explored the effects of some geometric parameters on particle-related responses. For example, Langrish and Zbicinski [6] examined the influence of inlet and spray cone angles on wall deposition, Huang et al. [7] investigated the impact of chamber geometry on particle residence times, Anandharamakrishnan et al. [2] studied the effects of chamber form (tall vs. short) on residence times, and Keshani et al. [8] assessed the impact of chamber shape on wall shear stress. While informative, these studies lacked a parametric modeling framework to establish clear factor–response relationships. A comprehensive understanding requires parametric CFD analyses combined with design of experiments (DOE) methodologies to systematically vary input parameters and identify statistically robust design–response relationships [9]. By utilizing DOE techniques, the number of geometries to be simulated can be strategically reduced while capturing critical interaction effects among geometric factors.
Incorporating particle histories into parametric CFD simulations adds complexity to the already intensive modeling of airflow dynamics. The computational cost of capturing transient airflow is further increased by introducing a particle phase via a multiphase flow approach. Particle-phase modeling is complex, with several models described in the literature [10,11,12,13,14]. Key modeling choices—such as particle treatment, drying model selection, and representation of particle interactions—significantly affect both simulation cost and accuracy. Particles can be modeled individually or as parcels, with each parcel representing a group of particles sharing identical thermophysical properties. While individual particle tracking is necessary in some combustion simulations [15], the computational demands of simulating spray drying processes typically require a parcel-based approach [12,16]. This method must balance computational efficiency, statistical significance, and numerical stability [17,18].
The drying process begins when parcels are injected into the computational domain. Because these particles contain dissolved or suspended solids, moisture removal is complicated by internal gradients, crust formation, and changes in rheology and topology [14]. Lumped-parameter models, such as the Characteristic Drying Curve (CDC) and Reaction Engineering Approach (REA) [19], are preferred for their computational efficiency, relying on algebraic rather than differential equations. The choice of model depends on available calibration data and the properties of the dried solids; for example, the REA model has been shown to better fit experimental data for Maltodextrin [14].
Turbulence and unsteady flows can cause particle collisions with other particles or chamber walls, significantly influencing particle histories. Most CFD spray drying simulations simplify these interactions to wall impacts, modeling either particle removal or rebound [20,21,22]. While more detailed models for agglomeration, fouling, and detachment could improve predictions, their implementation remains complex and is an ongoing research area.
This study evaluates the influence of key geometric design parameters on particle histories using the previously developed and validated cost-effective CFD model [23,24] and the DOE methodology from the companion paper [1]. A targeted selection of particle-phase models is employed to maintain computational efficiency, including calibration of the particle drying model.
This paper is organized as follows: Section 2 describes the application of the DOE methodology to the CFD problem; Section 3 details the computational implementation, including governing equations, numerical models, and CFD configurations; Section 4 addresses the implementation and calibration of the droplet drying model; and Section 5 presents and discusses the results of the parametric study, concluding with a summary of the main findings.

2. Design of Experiments Methodology (DOE)

The design of experiments (DOE) methodology employed in this study follows the guidelines provided by Coleman and Montgomery [25] for industrial experimentation and by Rhew and Parker [9] for parametric CFD modeling.

2.1. Objectives of the Numerical Experiment

This study utilizes CFD to evaluate the influence of various geometric design parameters of the spray chamber (factors) on the histories of atomized particles (responses). The analysis quantifies both main effects and interactions among the factor variables with respect to the selected responses. A prior study [1] identified that the Reynolds number at the jet discharge modulates the influence of other geometrical parameters; therefore, this operational factor is included in the current set of factor variables. The response variables represent quantitative statistical measures related to particle trajectories, which are pertinent to product quality and drying efficiency.
The primary objectives of this investigation are: (1) to inform the design of co-current spray drying chambers by elucidating the quantitative effects of key design parameters on particle behavior, and (2) to establish a methodological benchmark for future parametric CFD investigations involving spray chambers and comparable particle-laden flow systems.

2.2. Parametrized Geometry of a Spray Drying Chamber

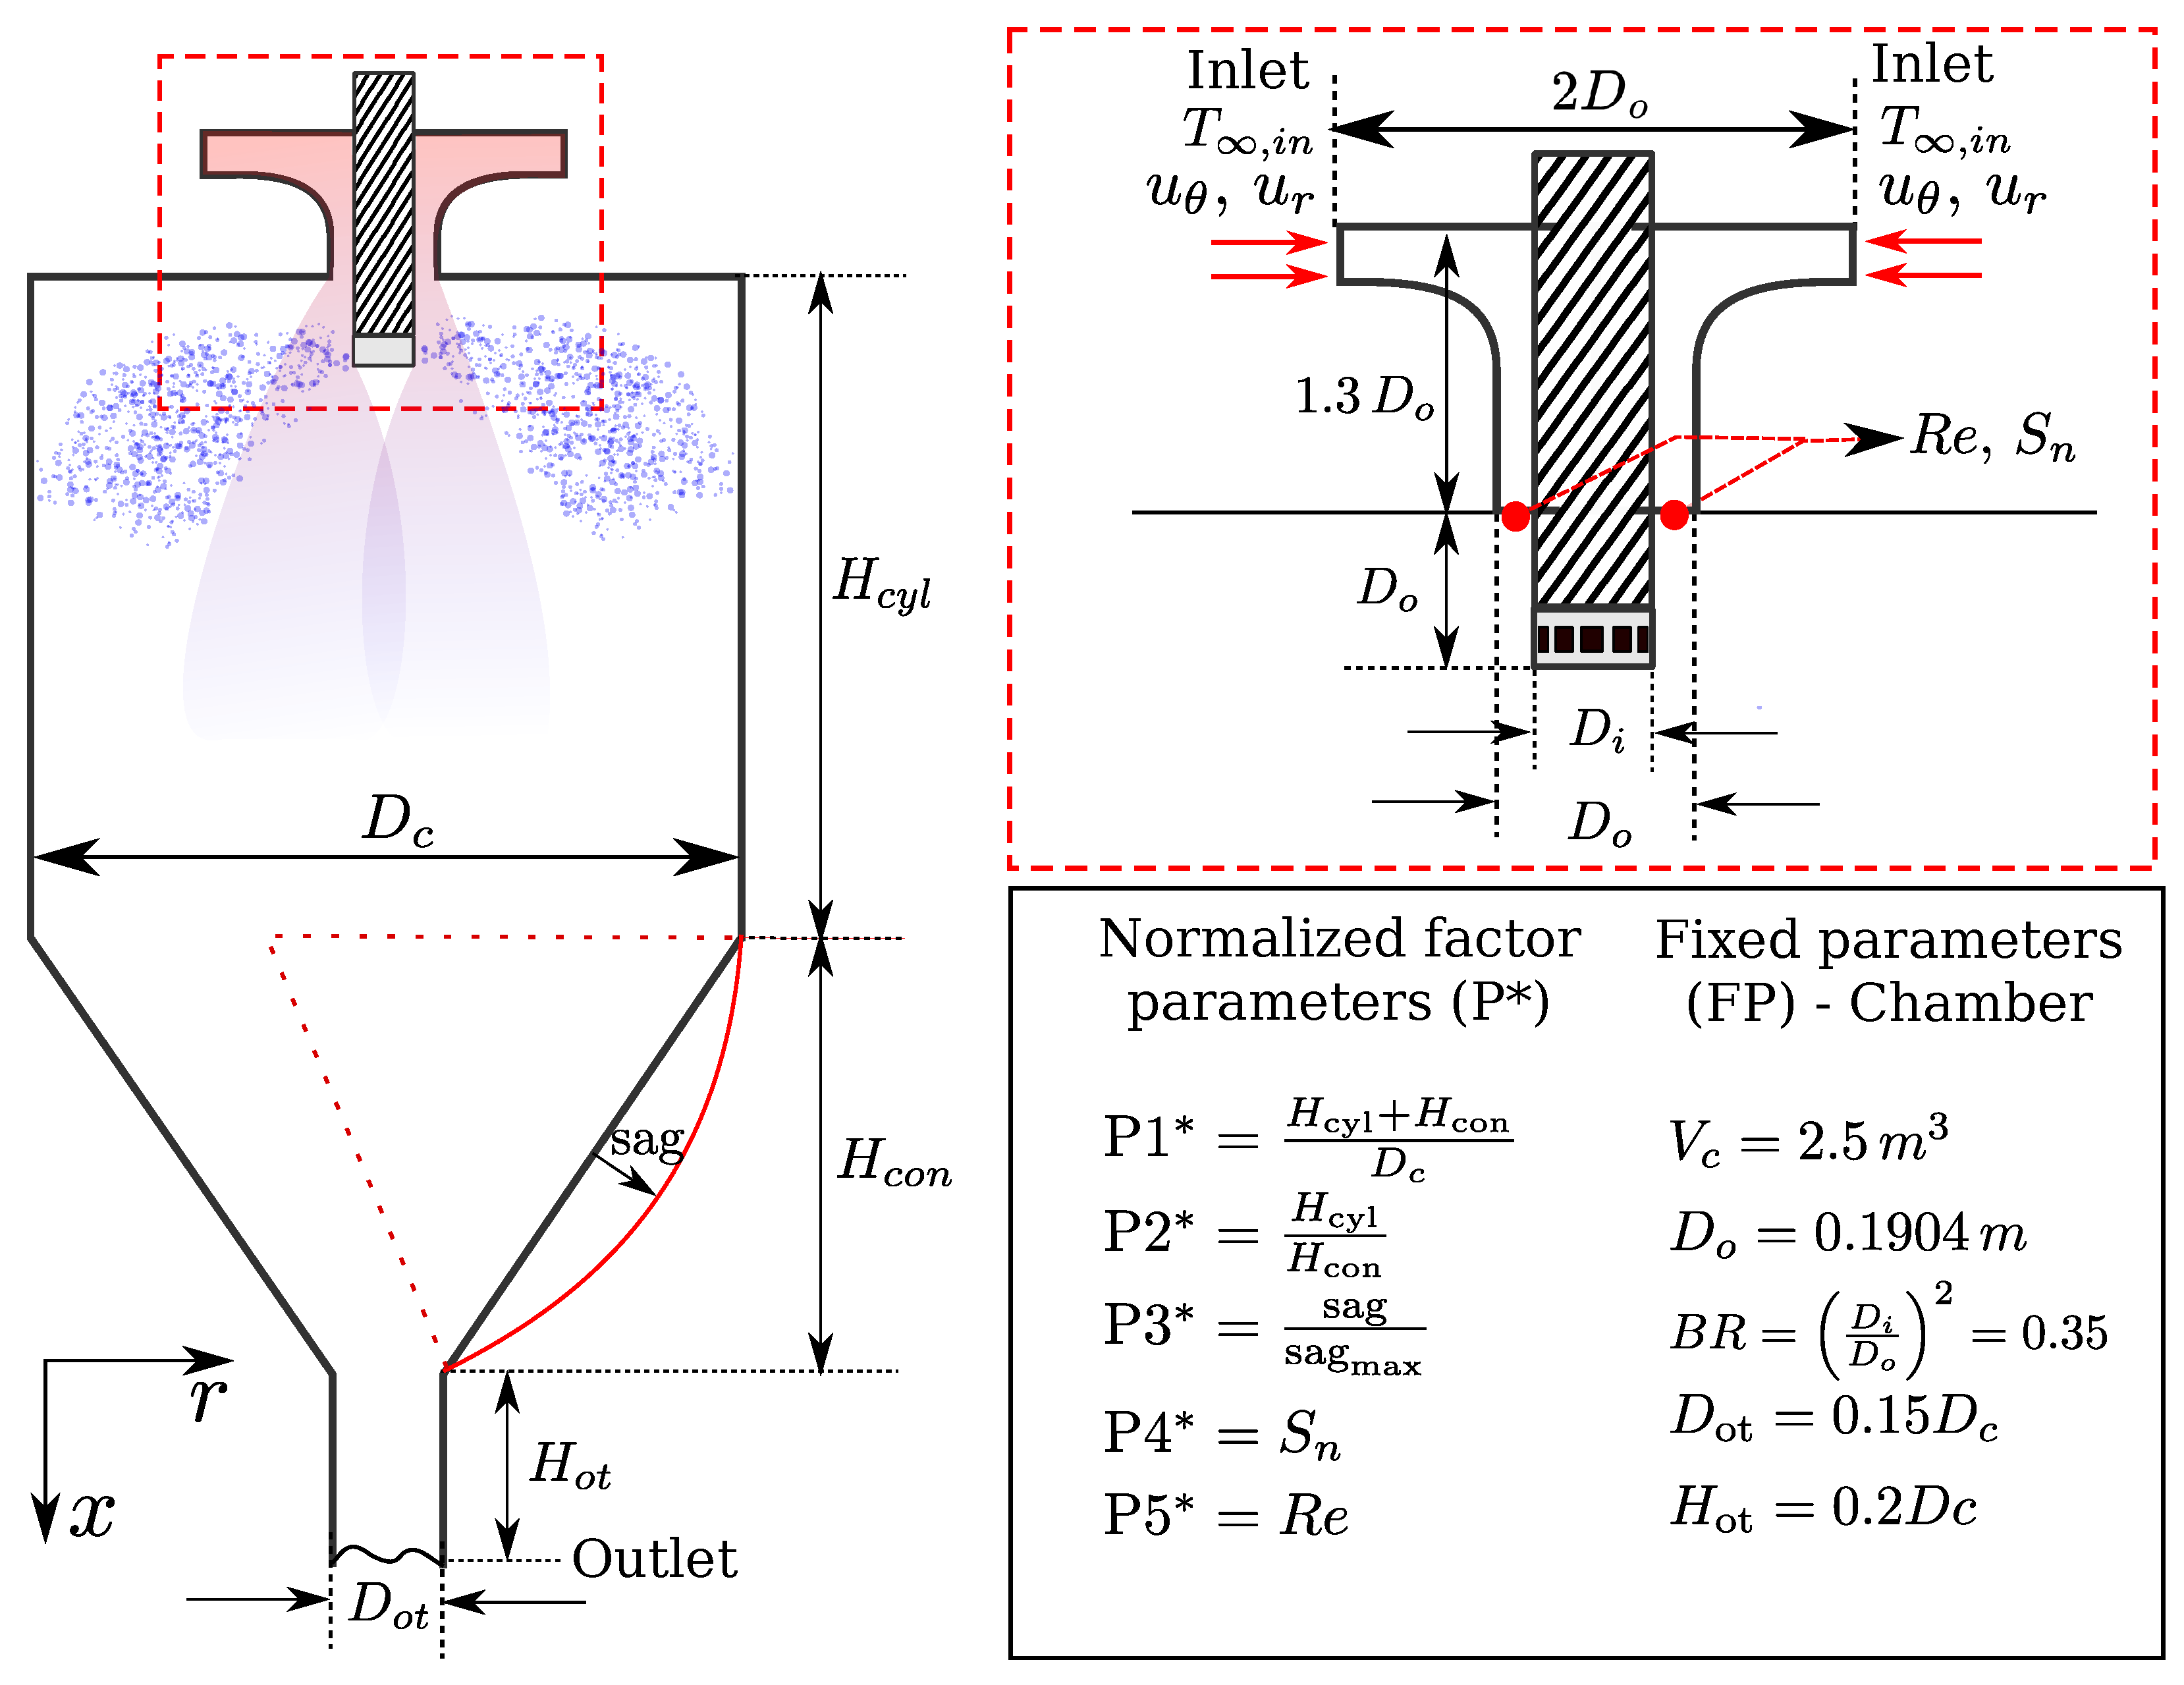
The parametric construction of the drying chamber geometry is based on the methodology developed in a previous study [1], and is illustrated in Figure 1. Drying air enters the chamber through an air disperser that imparts both radial ( u r ) and tangential ( u θ ) velocity components, and exits axially ( x + ). The air disperser is a simplified design that excludes physical swirl vanes; the desired swirl number at discharge is achieved by adjusting the tangential velocity component ( U θ ). At the end of the annular inlet, a rotary atomizer injects the feed in the form of liquid particles. Air and dried product are discharged through a bottom outlet duct.
Key geometric parameters include the chamber diameter ( D c ), the heights of the cylindrical ( H cyl ) and conical ( H con ) sections, and the curvature of the chamber described by the sagitta (sag) of the air formed between the cylindrical and conical sections. The swirl number, which is functionally dependent on the design and configuration of the air disperser, is also considered. Together, the air disperser and atomizer form a co-current annular jet. The air disperser is defined by its external and internal diameters ( D o , D i ), while the atomizer geometry is characterized by its diameter, orifice size, and orifice count.

2.3. Factor Parameters and Ranges

The parameters of the geometric factors and their respective ranges are consistent with those defined in the previous study [1], are illustrated in Figure 1, and are summarized in Table 1. These parameters were selected based on previous design experience, operational data, and established literature on spray dryer geometries, as discussed in the reference work. The operational factor (P5*), representing the Reynolds number at the jet discharge, was recalculated to ensure consistent chamber fill times. This adjustment maintains balance between chamber volume and drying air flow rate, as detailed in Section 2.4.4.
Figure 1. Normalized factor and fixed parameters used in the DOE study.
Chemengineering 09 00121 g001

2.4. Fixed (Held Constant) Parameters

The fixed parameters, summarized in Table 2, include chamber design, operational conditions (heat losses, process, and atomization), and feed-product properties. Details are provided below.

2.4.1. Geometrical Design

Geometrical design parameters encompass the size and shape of the air disperser and the volume of the drying chamber ( V c = 2.5 m 3 ). The only modification from the previous study is the reduction of the outlet pipe length ( H o t ) from 0.45 to 0.2, effectively shortening the outlet duct. This change was made to improve computational efficiency and numerical stability, as discussed in Section 3.6.2.

2.4.2. External Heat Losses

External heat losses are estimated by calculating the heat flux through the thin chamber walls, using the external temperature ( T amb ), free convection coefficient ( h amb ), wall thermal conductivity ( k wall ), and wall thickness ( t wall ) as reference parameters. The value of h amb is consistent with that used by Huang et al. [21] under similar conditions and aligns with values reported in previous studies [22,26].
Table 2. Description and values of the fixed factors used in the DOE Study.
CategoryParameterValue
Geometrical DesignChamber volume ( m 3 )2.5
Blockage ratio of the jet ( D i 2 / D o 2 )0.35
External diameter of the jet D o (m)0.1904
Diameter of the outlet pipe D o , t 0.15 D c
External Heat LossesOutside air temperature T amb (°C)26.85
Convective heat coefficient—walls to exterior h amb ( W / m 2 K )3.5
Wall thickness t wall (m)0.015
Wall heat conductivity k wall (W/mK)45
Feed Product CharacteristicsWet-basis humidity0.5
Solids productMaltodextrin
Solids density ρ s ( kg / m 3 )1410
Solids heat capacity C p , s (J/kgK)1410
Feed temperature (°C)22
Process Operational ParametersARL (air-to-liquid ratio) (kg/kg)85
Inlet air temperature T i (°C)170
Inlet air moisture content (kg/kg)0.014
Atomization Parameters—DropletAtomization velocity u p , 0 (m/s)70
Atomizer disk RPM ( RPMs disk )11,950
Mean diameter d p , 10 (micron)70.5
Minimum diameter d p , min (micron)15
Maximum diameter d p , max (micron)138
Spread parameter ( s p )2.05

2.4.3. Feed Product Characteristics

The feed product is a maltodextrin (DE10) solution with a solids content of 50%. Maltodextrin is a commonly used carrier agent that improves the drying rate and end-product quality by controlling thickness and enhancing powder flowability  [27]. While the assumed solids content falls within the upper range of commonly used values for spray drying applications (see [20]), its selection is well justified for the following reasons:
  • Few experimental studies on the drying kinetics of Maltodextrin solutions and their mixtures are available in the literature, especially at lower solid contents. To address this, the measurements performed by Adhikari et al. [28], one of the most comprehensive studies available, were used as reference. That study used droplets with 40% and 50% dissolved solids content.
  • The experimental data from Adhikari et al. [28] have already been used in subsequent studies to develop and calibrate the REA drying model for Maltodextrin [19,29]. This facilitates the implementation and calibration of the model for CFD simulations.
  • Previous experimental and CFD studies of spray drying processes have used similar initial solids contents for Maltodextrin and Maltodextrin/Sucrose mixtures, providing a basis for comparison. Examples include 40% in Gianfrancesco [30], 42.5% in Kieviet and Kerkhof [31] and Huang et al. [21], Kieviet and Kerkhof [31], and 50% in  Huang et al. [32] (see Table 3).
  • The adjusted coefficients of the REA model for droplet drying are valid only for the initial conditions (solids content) under which they were calibrated, as reported in previous studies [14,29]. This limitation, confirmed during preliminary simulations in the present study, prevents variation of the initial solids content.
  • While some studies report drying kinetics for specific feed products (e.g., Guava juice [20]), the experimental design objectives of this study are better addressed by focusing on a drying agent used for various feed products rather than a specific one.

2.4.4. Process Operational Parameters

The main fixed operating parameters are the ARL (air-to-liquid ratio) and the inlet air temperature T , i n (°C). The ARL is a key parameter from the operational perspective since, under fixed drying gas inlet temperatures and mass flow rates, its variation significantly impacts the properties of the resulting product. As presented in Table 3, the selected value ARL = 85 falls within the range of experimental values reported in Benavides-Morán et al. [33] and Woo et al. [22], which have similar process operational parameters. This ARL value results in an outlet temperature close to 100 °C, as confirmed by preliminary simulations. Lower ARL values mentioned in some studies correspond to pure water droplets, without any solids content.
For the inlet temperature T , i n , several factors play a role in its selection, among them the heat sensitivity of the feed product and the effect of heat on chemical degradation/decomposition, and the drying chamber capacities [34]. The selected value T , i n = 170 °C represents an intermediate value in the ranges commonly used in spray drying, where inlet temperatures vary significantly according to the atomized product and conditions of the experiment (e.g., 150 °C to 220 °C in Phisut [35]). Previous studies using CFD simulations have also used comparable inlet temperatures values [21,26,31,32,33], as presented in Table 3.

2.4.5. Atomization Parameters

The atomization parameters include atomizer RPMs, the size distribution of liquid particles, and their atomization velocity. In spray drying applications, these parameters may vary with different operating configurations; however, in this study, they are considered constant due to the experimental design requirements. The selected operating parameters of the atomizer ( RPMs disk , u p , 0 ) are comparable to those presented by Huang and Mujumdar [36] for a semi-industrial drying chamber (see Table 3) and are within the range of those reported in other similar studies. A detailed description of the equations and the methodology for selecting these parameters is presented in Section 3.6.3.

2.5. Response Variables

2.5.1. Limitations in the Selection of the Response Variables

The feed material used in this study is a Maltodextrin-water solution, a versatile drying agent suitable for various products. While specific responses related to particular drying products can be measured—such as stickiness or thermal degradation of compounds like α -amylase [37] or lysine [38]—the primary objective of this study is to generate response variables applicable to a broad range of drying products. Analyzing these variables provides valuable insights into the quality attributes of such products.
The selection of response variables also considers the limitations of the available computational models for the particle phase, which is treated using a Lagrangian framework. Resolved properties for the particle phase relate to fundamental thermophysical and kinematic characteristics such as position, diameter, temperature, and water content. However, more complex behaviors—such as porosity, particle inflation and bubble formation, agglomeration, coalescence, and fouling—cannot be directly simulated. Although models for some of these phenomena have been proposed and evaluated in specific drying scenarios (e.g., Li et al. [39] and Eijkelboom et al. [40]), their practical integration into CFD spray drying simulations remains under active development [20].

2.5.2. Description of the Response Variables

Table 4 provides a summary of the selected response variables for this analysis. Two global response groups have been considered: the first relates to drying gas characteristics at the outlet (R-0), and the second is associated with particle histories (R-1 to R-4). Each response variable is associated with specific measurement zones, which can be the outlet of the drying chamber and its walls. Moreover, the measurements can be performed using either bulk-based or particle-based approaches (see Equations (1) and (2)). For some responses, the standard deviation of the sample is also analyzed. A detailed description of each response variable is presented next.
R-0 (Outlet Gas Characteristics)
The response variables for this group consist of the average outlet gas temperature (R-0.1) and humidity (R-0.2). These parameters are monitored to evaluate transient simulation behavior and their relationship to particle-related responses (e.g., particle and gas temperatures at the outlet).
R-1—Particle Residence Time (PRT)
PRT is a crucial parameter in spray drying technology, with significant implications for product quality. It plays a key role in balancing the drying rate of atomized products while ensuring they meet desired specifications. Achieving this balance requires effective control of particle temperature to minimize aroma loss and prevent the thermal degradation of heat-sensitive materials [41]. While excessively short PRTs can result in insufficient drying, leading to higher moisture content and reduced shelf stability, longer PRTs can cause particle overheating. In such cases, dried particles recirculate into the hot central air jet, potentially compromising the product’s functional properties. For instance, Schmitz-Schug et al. [38] reported lysine loss—an essential amino acid—during the drying of infant milk due to prolonged PRTs. Additionally, extended PRTs may contribute to particle agglomeration, negatively affecting flowability and other handling properties.
In spray drying processing, two types of PRTs can be identified. Primary PRT refers to the physical time that any particle spends inside the drying chamber until it impacts a wall or exits the domain. Secondary PRT is the physical time taken by a wall-impacting particle to detach itself until exiting the drying chamber, potentially undergoing additional interactions along the way. As discussed before, due to inherent complexities in these models, detailed particle-to-particle and particle-to-wall interactions were not considered; thus, only primary PRTs were analyzed. However, given the significant correlation between secondary PRTs and other particle-related responses (e.g., particle temperature and moisture) during wall-impacting events [42], their statistical analysis provides valuable insights into this phenomenon.
In the present DOE study, primary PRTs (R-1) are measured at both the outlet and chamber walls. These PRTs are calculated on a bulk basis (R-1.1), particle basis (R-1.2), and by particle size (R-1.3). The detailed response descriptions are presented in Table 4.
R-2—Moisture Content
The particle moisture content X p is a key indicator of end-product quality [34]. It influences stability, bulk density, and shelf-life characteristics. Additionally, it can impact stickiness by altering the glass transition temperature of the multi-component particles [41]. This study measures the wet basis moisture content for all the particles crossing the outlet or impacting the chamber walls. The specific responses are similar to those used for the PRT (R-1), being the wet basis moisture content of the particles calculated as a bulk-quantity (R-2.1), on a particle basis (R-2.2), and as a function of different particle sizes (R-2.3).
R-3—Temperature
Monitoring particle temperatures is a valuable complement to the particle moisture data, as it provides insights into the stickiness behavior of atomized particles, especially in the event of collisions with walls [43]. Stickiness presents a significant challenge in spray drying, leading to product agglomeration [41], fouling, and increased secondary particle residence times (PRTs), as sticky particles are more likely to adhere to the walls rather than rebounding. The stickiness behavior in various drying products can be estimated by establishing a relationship between the glass transition temperature and the particle temperature [29].
R-4—Particle-to-Wall Collisions
The analysis of particle-wall impact statistics complements the results of other particle responses (PRT, moisture, and temperature) to comprehensively evaluate their combined effects on product quality. In this study, three primary responses related to impact statistics are evaluated: the impact ratio (R-4.1), which compares the number of particles hitting the walls to those exiting the chamber through the outlet; the average impact position (R-4.2), which is normalized to the chamber height and identifies preferred impact zones and their dispersion; and the impact ratio between cylindrical and conical sections (R-4.3), which compares the number of impacts in each section.

2.5.3. Data Processing

The responses can be measured using two approaches: bulk-based, which provides an overall measurement of the response over the total mass of the sample, and particle-based, which measures the magnitude of the response in individual particles within the sample. For any studied response R, the mean bulk-based response R ¯ b is computed as
R ¯ b = 1 n m p c n n R n m p c n ,
while the mean particle-based response R ¯ p is calculated as
R ¯ p = 1 n PPP n n R n PPP n .
In these expressions, n is the number of parcels in the sample and m p c is the mass of a single parcel. The term PPP n is the number of particles per parcel in the n-simal parcel (see Section 3.3). The standard deviation of the particle-based response R sd , p is calculated as
R sd , p = 1 n PPP n n ( R n R ¯ ) 2 PPP n .
These responses can be filtered by particle size for the total particle sample or specific particle size ranges. By filtering the response data for different particle sizes, it is possible to gain insights into the distribution of the response variable across the sample (e.g., PRT, as presented in previous studies [2,44]).

2.5.4. Nuisance Factors and Modeling Limitations

In contrast to the previous study [1], in this case the CFD model is not entirely deterministic because it has stochastic components. These are mainly found in the particle injection model. The first relates to the diameter and number of particles injected at each time step, which depend on a probability distribution function (PDF). The second is the modeling approach used for the rotary atomizer, where a random function is used to select the orifices injecting particles. This is required because the number of rotary atomizer orifices is significantly greater than the number of parcels injected at each time step. These possible nuisance factors are controlled by statistical means since a large number of parcels (on the order of 10 6 ) are injected during the course of each experiment. The mathematical models behind these and other particle-related models are explained in detail in Section 3.4.

2.5.5. Spreadsheet of Experiments

The same experimental design proposed in the previous study Gutiérrez Suárez et al. [1] is used. This design is a 2 5 1 + 1 , 2-level, with four main parameters (factorials), which are related to the geometry of the chamber and the inlet (P1*, P2*, P3, and P4*). The fractioned factor represents an operational factor (P5*), while the additional experiment (+1) uses intermediate values to evaluate curvature in the response. The spreadsheet of experiments is presented in Table 5.

3. Computational Implementation

3.1. Assumptions

Mass and energy transport between the gas and particle phases characterizes the drying process. It starts when the liquid particles are atomized inside the domain and interact with the drying gas. First, the free water is quickly evaporated from the particle. Then, a more gradual drying process starts as water bound to the solute (Maltodrextin) is removed. This process is also limited by the water diffusion rate from the particle core to the surface [45]. The drying of the particle continues until equilibrium moisture is reached or the particle exits the drying chamber. The following assumptions are used for this process:
  • The particles are small enough to have constant temperature and moisture profiles inside them, their Biot ( B i ) and mass-Biot ( B i m ) numbers being less than 0.12. This is generally accepted for small-size droplets [28,29] and has been verified during preliminary simulations.
  • Moisture loss from the particles occurs due to convective effects. A semi-empirical model with lumped parameters (REA) is used to perform this calculation [29].
  • The particle diameter change is not strictly related to the moisture lost. A shrinkage model is included to adjust the change in particle diameter.
  • The thermodynamic properties of the continuous phase are obtained from the mean value in the cell containing the particle. This reduces coupling problems that could arise as soon as the parcel is atomized into a small cell.

3.2. Gas-Phase Models

The governing equations of the continuous phase to simulate particle drying processes in spray dryers are multi-component, turbulent, and time-dependent. They are solved for compressible flow using a hybrid RANS/LES approach. Although the internal airflow in a spray dryer can be represented by an incompressible flow model, a compressible flow approach was employed due to constraints in the CFD software and solver (OpenFOAM V2012 - sprayFoam). The general transport equations for continuity, momentum, energy, and species have the following form (see Sanchez-Rocha and Menon [46]):
ρ t + ρ u j x j = 0 ,
ρ u i t + ρ u i u j x j = p δ i j x j + τ i j x j + F g , i + S M ,
ρ E t + ρ u j E x j = u i p δ i j x j + u i τ i j x j x j k T x j + S E ,
ρ Y k t + ρ Y k u j x j = J j , k x j + S Y k .
In these equations u i is the velocity, p is pressure, δ i j is the Kronecker delta, E is the total energy, F g , i is the gravitational force acting over the fluid, T is the fluid temperature, Y represents the species, J is the diffusive flux of species and k is the heat conductivity. The S-terms ( S M , S E , S Y k ) represents sources of momentum, energy and species. The term τ i j is the viscous stress tensor, which is associated with the molecular viscosity μ and the strain-rate tensor S i j as
τ i j = 2 μ S i j 1 3 S k k δ i j .
The transported properties ϕ x , t may be represented using a statistical ensemble average (in RANS mode) or using a filtering operator to perform scale separation (LES mode). Details on this procedure for hybrid RANS/LES turbulence formulations can be consulted in Germano [47] and in Sánchez-Rocha and Menon [46]).
The thermophysical model is similar to that reported in other liquid particle evaporation/drying studies based on OpenFOAM’s solver sprayFoam. This core solver was initially developed for modeling spray combustion problems but can be configured to deactivate chemical reaction and combustion source terms, along with their associated conservation equations. As a result, it has been widely used in non-reactive spray studies employing an Eulerian-Lagrangian formulation. The main features of the thermophysical model are:
  • The equation of state for perfect gases is used to relate thermodynamic properties P , ρ , R , T :
P = ρ R T .
  • Partial pressures are used to extend the definition of the equation of state to a mixture of species.
  • For all species Y k , the heat capacities c p , Y k and enthalpies H Y k are evaluated by polynomial functions obtained from the JANAF thermophysical tables [48].
  • For all species Y k , the dynamic viscosities μ Y k are modeled as a function of the carrier temperature using Sutherland’s formula.

3.3. Coupling with the Particle Phase

A Lagrangian framework is employed to represent the particle phase. This approach is commonly used in spray drying simulations due to the relatively dilute particle loading conditions typically encountered [11,13]. Atomized particles are treated using a parcel approach. In this approach, a number of particles with the same thermophysical characteristics are represented as a single dispersed element. This approach makes the simulation computationally feasible, given the high costs associated with fully representing the millions of atomized particles.
The source terms ( S M , S E , S Y k ) in the transport equations (Equations (5)–(7)) represent a two-way coupling with the discrete phase (particles). For any transported property ϕ and using a parcel approach, the source terms are related to the change of that property in the particle phase, such as
S ϕ = f 1 V n n p c d ϕ p n d t PPP n .
In this expression, n p c is the number of parcels inside an elementary control volume V and PPP n is the number of particles per parcel in the n-simal parcel. Particle to particle effects (4-way coupling) such as coalescence, agglomeration, wall deposition, abrasion, and break-up were not considered. This decision was made to avoid composite effects in particle statistics (as discussed in Jubaer et al. [49]), reduce the number of stochastic components for the DOE study, and simplify the implementation process.

3.4. Particle-Phase Models

3.4.1. Particle Motion and Momentum Balances

The change of particle momentum determines their motion through the domain and is calculated by integrating the balance of forces on each particle. This balance only considers gravity and drag forces, in agreement with previous studies of particle dispersion in confined jets (e.g., [15]). The transport equations for particle motion and momentum using a Lagrangian framework are:
d x p d t = u p m p · d u p d t = F p = F D + F g .
Here x p is the particle position vector, u p is the particle velocity, m p is the particle mass, and the term F p represents the sum of all forces acting over the particle, which are the drag force F D and the gravitational force F g . The force of gravity acts in the axial direction of the domain and is calculated as F g = m p g , not including buoyancy effects, and the drag force is calculated as
F D = 1 2 ρ ( u u p ) 2 A p C d .
In this expression, ρ is the density of the gas phase in the particle-containing cell, A r e f is the cross-sectional area of the particle, which in this case is assumed to be completely spherical and non-deformable. The term ( u u p ) is the relative velocity seen by the particle u p , r , where u is the instantaneous flow velocity interpolated to the particle position within the cell-containing, and u p is the particle velocity. Hence, particle dispersion is fluctuation-driven, and unlike in RANS modeling, the calculation of u p , r does not require a stochastic model or other methods to reconstruct that velocity. The last term C D is the particle drag coefficient, which is calculated as a function of the Reynolds number of the particle using the Schiller-Naumann model [50], which is valid for spherical particles:
C D = 0.44 R e R e 1000 C D = 24 ( 1 + 0.15 R e 0.687 ) R e < 1000

3.4.2. Mass and Energy Balances

The following expression describes the energy balance for liquid particles with uniform temperature distribution:
m p c p d T p d t = h A p T T p Δ H evap d m p d t .
Here, the accumulation of thermal energy m p c p d T p d t in the particle represents a balance between the heat exchanged with the gas phase due to convection h A p T T p and the heat lost due to evaporation of the liquids/moisture in the particle Δ H e v a p d m p d t . These right-hand terms (convection and evaporation heat transfer) represent the energy sources/sinks in the gas phase and were presented as S E in Equation (6), while the term d m p d t is a source term of water S Y H 2 O in the species equation (Equation (7)).
Because the liquid particle is multi-component, its thermophysical properties are calculated at each time step according to the mass fractions of its components ( H 2 O , Maltodextrin). For the water fraction, the heat capacity c p and the enthalpy of vaporization H evap are calculated using the JANAF tables. For the Maltodextrin, the heat capacity is assumed as fixed. The change of mass in the particle d m p / d t is obtained from the following balance:
d m p d t = h m A p ρ v , s T p ρ v , .
In this expression d m p is the change in mass in the particle, h m (m/s) is the mass-transfer coefficient, and A p is the surface area of the particle. The term ρ v , s T d ρ v , represents a difference in vapor concentration ρ v ( kg / m 3 ) at the particle surface ρ v , s calculated at the particle temperature T p , and the vapor concentration in the bulk-air ρ v , . The convective heat and mass transfer coefficients (h, h m ) in Equations (14) and (15) are calculated from the Nusselt and Sherwood numbers, which are obtained using the following modified Ranz-Marshall correlations [29,51]:
N u = h d p k p = 2.04 + 0.62 R e p 1 / 2 P r 1 / 3 ,
S h = h m d p D a , b = 1.63 + 0.54 R e p 1 / 2 S c 1 / 3 .
In these expressions, R e p is the Reynolds number of the spherical particle calculated in terms of the relative velocity of the particle, its diameter, and the kinematic viscosity of the gas ν as
R e p = | u u p | d p ν .

3.4.3. Particle Drying Model

Particle drying is modelled using the REA model, described in detail by Chen and Xie [19], Woo et al. [22], Patel et al. [29]. This model is semi-empirical, uses lumped parameters, and allows the calculation of the vapor concentration at the particle surface, ρ v , s , at any stage of the drying process. The returned value is used in the term ρ v , s T p ρ v , , presented in Equation (15), to compute the change in particle mass due to evaporation. In the REA model, ρ v , s is expressed in terms of the saturation concentration as
ρ v , s = RH s ρ v , sat ( T p ) ,
where RH s is the relative humidity (0 to 1) at the particle surface, which is calculated as
RH s = e x p Δ E V R g T p .
In this expression, R g is the universal gas constant (J/mol K), and Δ E V is the apparent activation energy (J/mol), which describes the extent of difficulty when removing moisture from a particle during drying [29]. Solving for Δ E V in Equation (20) and replacing RH s with ρ v , s / ρ v , sat (Equation (19)), the following expression is obtained:
Δ E V = R g T p l n ( ρ v , s / ρ v , sat ) .
This expression indicates that the activation energy varies through drying as moisture is removed from the particle and ρ v , s decreases. This makes it feasible to relate the change in Δ E V to the change in particle moisture X p (kg/kg—dry basis). In the literature, this relationship is normalized to the equilibrium condition and is presented as a relative activation energy
Δ E V Δ E V , = f X p X .
Here Δ E V , is the equilibrium activation energy and X (kg/kg—dry basis) the equilibrium moisture, both referenced to the conditions of the drying medium. This relationship is unique for each drying product and the initial moisture conditions and can be obtained by experimental means. For liquid particles of water with Maltodextrin (DE6), Patel et al. [29] proposed a correlation to approximate the relative activation energy (Equation (22)) as
Δ E V Δ E V , = a REA b REA X p X c REA exp d REA ( X p X ) e REA .
For an initial solids content of 50% ( X p = 1.0 dry-basis), the correlation uses the following calibration coefficients: a REA = 1.0 , b REA = 0.9438 , c REA = 8.8240 , d REA = 0.6030 , e REA = 2.0240 .
The equilibrium activation energy E V is calculated from known properties of the drying gas, as
Δ E V , = R T log ( RH ) .

3.4.4. Particle Shrinkage Model

Particle shrinkage describes the change in particle diameter due to evaporation. For pure substances (e.g., water droplets), this relationship can be directly determined from the evaporated mass. However, for liquid solutions or suspensions containing solids, shrinkage behavior is more complex and does not always correlate directly with moisture removal. Therefore, in spray drying simulations, incorporating a shrinkage model is crucial to avoid underestimating particle drying rates [49].
In this study, a linear shrinkage model is incorporated within the REA drying model by introducing modifications to the particle diameter in Equations (15)–(17). The linear shrinkage model has been used in previous studies (e.g., Jubaer et al. [49], Lin and Chen [52]) and establishes a relationship between the current and initial particle diameters, d p / d p , 0 , and the current and initial moisture content content ( X p / X p , 0 ) . Specifically, the relationship is defined as follows:
d p d p , 0 = β + ( 1 β ) X p X p , 0 .
Here β is an empirical fit parameter, which must be determined for each drying substance and initial particle moisture content. In this study, a value of β = 0.91 was obtained and used, with details provided in Section 4.

3.5. Numerical Schemes and Methods

The governing equations (Equations (4)–(7)) were discretized and resolved using the open-source CFD software OpenFOAM V2012. The numerical schemes and methods employed were already described in previous studies [1,24]. These include the use of the PIMPLE algorithm for the pressure-velocity coupling and a DES-hybrid scheme Travin et al. [53] for the discretization of advective terms. The temporal term was discretized using an implicit second-order Euler scheme upwind (SOUE), as detailed in Moukalled et al. [54]. The maximum particle and flow Courant numbers C o max , p and C o max were set to 0.5.

3.6. Computational Configuration

3.6.1. Boundary Conditions

The boundary conditions are based on those used in the previous study [1], but extended for use in multiphase flow. For additional details and region assignments, refer to Figure 1.
  • Drying air velocity ( U ) is prescribed at the inlet boundary using a fixed-value vector in cylindrical coordinates, with axial ( U x ), tangential ( U θ ), and radial ( U r ) velocity components. The radial velocity is set according to the value of the Reynolds number (P5*), using the corresponding air density and kinematic viscosity at the inlet temperature. The tangential velocity U θ is adjusted to produce a swirl number equal to P4* at the jet discharge ( ± 1.5 % P4*). No-slip conditions are applied at the walls. Although, in real spray dryers, the rotary atomizer could potentially increase the rotational component of the jet, this factor was not considered in order to avoid uncertainties in the response due to the unknown impact magnitude.
  • Pressure (p) is prescribed at the outlet with a fixed-value condition of p = 98.54 kPa , which matches the experimentally measured value from Gutiérrez Suárez [26].
  • Temperature (T) is prescribed at the inlet with a fixed value of T = 443.15 K and zero-gradient conditions at the outlet. Heat-flux conditions are applied at the walls, defined in terms of a fixed convective coefficient, the material and thickness of the wall, and an external air temperature (see Table 2).
  • Turbulent variables ( k , ω ) are prescribed at the inlet using fixed-value conditions. These initial values are close to zero ( 1 × 10 6 ), as turbulence is expected to develop along the inlet duct. Standard wall functions are applied at the chamber walls.
  • Transported species ( O 2 , N 2 , H 2 O ) are adjusted to represent an inlet flow with a specific humidity of X = 0.014 kg H 2 O / kg dry . This value is similar to the one reported by Huang et al. [21]. Zero-gradient conditions are prescribed at the walls and the outlet.
  • All particles that impact the walls of the domain were removed from the simulation.

3.6.2. Mesh Configuration and Adaptive Mesh Refinement (AMR)

This study uses the same grids and mesh adaptation methods detailed in Gutiérrez Suárez et al. [1], with only minor adjustments. Refer to that study for further details. For all experiments, the grids are three-dimensional and fully structured. As adaptive mesh refinement (AMR) is employed, the initial grids are relatively coarse. Fixed pre-refined regions (level 1 refinement) were created, as shown in Figure 2, fully covering the inlet duct up to the atomizer region and the outlet duct. The inclusion of these fixed-refinement zones is motivated by previous studies [1,55] and aims to improve solution stability by reducing potential artificial fluctuations in the inlet, outlet, and spray-jet contact zones. Additionally, the pre-refinement in the outlet enhances the AMR behavior in other regions of greater interest within the chamber. Preliminary simulations using these modifications have demonstrated their benefits. The AMR method is based on the relative error of the gradient of the velocity field. The configuration parameters of the AMR are within the ranges recommended in the previous study [24] for spray drying simulations. These parameters include a maximum refinement level of 1, two buffer elements around newly refined cells, and a refinement coverage of 24%. The refinement coverage represents the relationship between the effective number of grid elements and the number of elements that would be obtained if the entire grid were refined.

3.6.3. Particle Injection

Particle Size Distribution
A mass-based Rosin–Rammler distribution is used to determine the initial size of the parcels introduced into the domain. This distribution improves the stability of source terms during the initial interaction between the injected particles and the gas phase, as the mass of each parcel is kept constant (see Yoon et al. [56] for details). This is achieved by increasing the number of particles per parcel (PPP) in small-diameter parcels while reducing it in large-diameter ones.
In the mass-based Rosin-Rammler distribution, the diameter (m) of each injected parcel is obtained from the following expression
d p = d p , MRR ln 1 RN 1 1 n .
Here RN represents a uniformly distributed random number, n is a dimensionless constant representing the spread parameter of the distribution, and d p , MRR is a characteristic particle size.
Atomization Configuration
As discussed in previous work [11,37], defining particle velocity and size parameters is not straightforward, as it depends on several factors such as the type of atomizer, operating conditions, and feed properties. The following procedure is proposed for a rotary atomizer spraying maltodextrin (50% solids), considering the fixed geometrical, operational, and feed parameters defined previously:
  • It is assumed that the disk diameter of the atomizer is the same as the annular inlet D disk = D i = 0.1126 m . D i is calculated from the blockage ratio relation, which is a fixed parameter (see Figure 1).
  • The rotary atomizer’s RPM is determined based on operational data reported for small-scale spray dryers [21,26]. A linear interpolation is performed based on the disk diameter D disk .
  • The particle ejection velocity is assumed to be equivalent to the tangential velocity of the disk [57]; giving
    u p , 0 u p , θ = π d disk RPMs disk / 60 .
    Selecting this velocity is particularly relevant under the constraints of the DOE study, as high u p , 0 values in experiments where P 1 * = 2.5 (narrow, tall-form drying chamber) may lead to excessive particle accumulation on the walls. Therefore, it was ensured that the obtained u p , 0 value remained consistent with typical values used in drying chambers of similar diameters.
  • The Sauter mean diameter ( d p , 32 ) was calculated using the following expression, which considers some geometrical and operational parameters of the atomizer [34,36]
    d p , 32 = 1.4 × 10 4 m ˙ l 0.24 RPMs disk D disk 0.83 ( n disk h disk ) 0.12 .
    In this expression, n disk is the number of vanes, and h disk is the height of each vane (m). The feed product mass flow, denoted as m ˙ l (kg/s), is determined by the air-to-liquid ratio (ARL) and the parameter P5*. As P5* is a factor parameter, varying it yields different values of m ˙ l and d p , 32 . However, to ensure a fair comparison in all study cases, d p , 32 is kept constant and calculated based on the most extreme case (P5* = 3.95 × 10 4 ) .
  • From the obtained value of d p , 32 , and using the correlations for the mass Rosin-Rammler distribution presented in Yoon et al. [56], the remaining parameters ( d p , 10 , d p , MRR ) are calculated.

3.7. Running Setup and Sampling of Data

3.7.1. Running Setup

The simulation times were defined in terms of a non-dimensional characteristic time t c = t s / t f , being t s the physical simulated time and t f = Q ˙ / V c is the time required to fill the drying chamber. The running setup is similar to that used in the companion paper [1]; however, the initial running time without AMR was reduced by 30% due to the fixed pre-refinement performed along the duct, jet discharge, and atomizer, which should reduce the development time of the internal airflow [24]. The detailed running order is as follows:
  • All experiments were started at t c = 0 and were run until t c = 3 using the base grid with a fixed refinement along the annular entrance. This pre-refinement is presented in Figure 2.
  • At t c = 3 , AMR is activated and simulations are run until a converging trend is observed in the response variables (e.g., PRT, X p ). This trend was observed around t c 6 , but variations were observed from case to case.

3.7.2. Data Collection and Post-Processing

Particle history data were collected by storing the information of the parcels during two main events: when they impact the walls or when they leave the domain. The information collected at each event includes (1) position ( x , y , z ), (2) current d p and initial d p , 0 diameters, (3) temperature T p , (4) time elapsed since injection, which represents its residence time (PRT), (5) the number of particles per parcel (PPP), and (6) current density ρ p , which is used along the diameter to calculate the moisture content. The stored information is post-processed using a Python 3.10 script written for this purpose. The script is capable of post-processing all the parcels at different time intervals and particle size ranges. The script returns a spreadsheet with the post-processed data in the form of the response variables described in Table 4. This spreadsheet is then read under a Matlab R2020 script which uses functions for DOE analysis (DOE-Plots).

3.8. Solver and Code Modifications

For this study, several improvements and modifications were made to the solvers and libraries of the standard OpenFOAM v2012 release:
  • A new OpenFOAM solver, relErrorSprayDyMFoam,
    based on the standard solver sprayFoam. This solver incorporates adaptive mesh refinement and the use of refinement-protected regions.
  • A new phase change model, DropletEvaporationREA, to implement the REA drying model, along with a new drying material model, Maltodextrin.
  • Bug fixes in the manualInjection, coneInjection, and particle classes of OpenFOAM. These are detailed in issues 2096, 2199, and 2289 on the OpenFOAM developers portal (OpenCFD).

4. Verification and Calibration of the Drying Model for CFD Simulations

4.1. Domain, Grid, and Flow Conditions

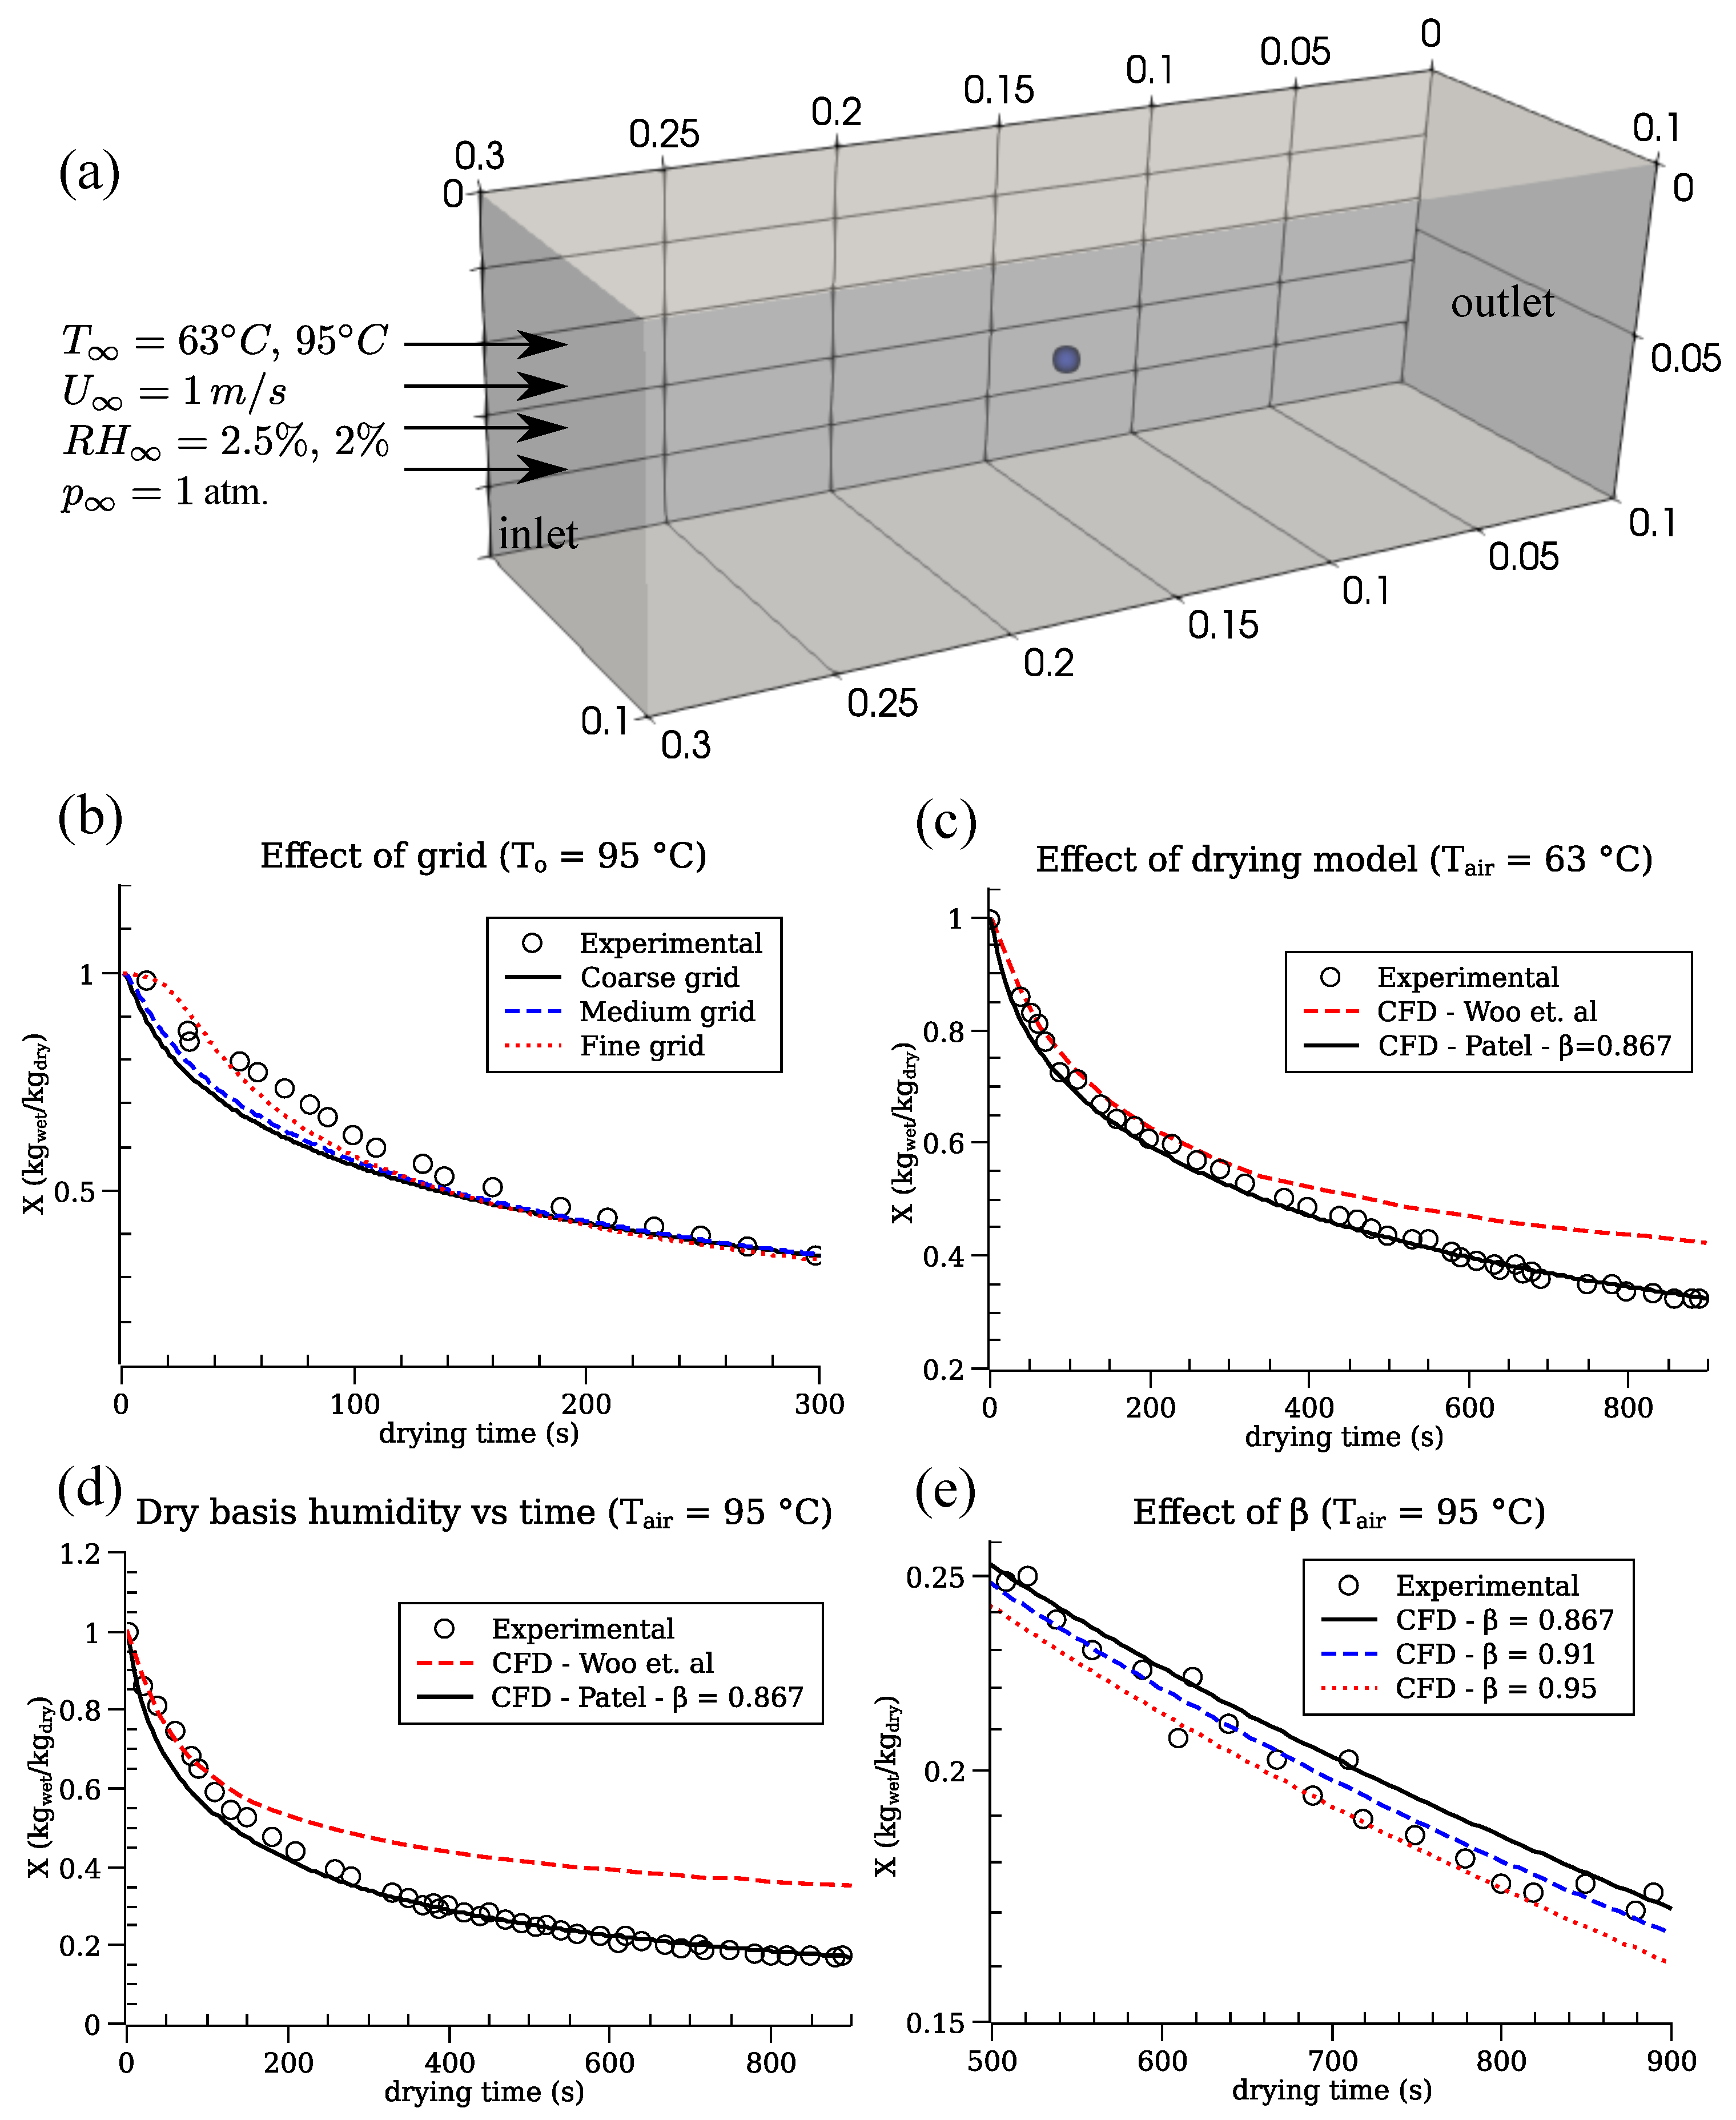
A CFD case was created to replicate the experiments conducted by Adhikari et al. [28] to investigate the drying kinetics of individual droplets with maltodextrin. This setup incorporates all thermophysical models and transport equations described previously. The computational domain, shown in Figure 3a, consists of a 0.3 × 0.1 × 0.1-m box, simulating a wind tunnel environment. A droplet ( d p , 0 = 2300 μ m ) is suspended at the center of the domain. Two experimental conditions from Adhikari et al. [28] for Maltodextrin droplets with an initial wet-basis moisture ( X 0 = 1 kg wet / kg dry ) were modeled: the first with T = 63   ° C and RH = 2.5%, and the second with T = 95   ° C and RH = 2%. In both cases, the drying air velocity is set to u = 1 m / s . The grid is fully structured and composed of non-orthogonal elements. Grid independence was verified using three grid resolutions (coarse, medium, and fine), ranging from 2600 to 50,000 elements. The main objective is to evaluate the implementation of the REA model in 3D CFD simulations and to calibrate the droplet shrinkage factor.

4.2. Results and Discussion

Figure 3b presents the effect of grid resolution on the drying kinetics of a droplet at T = 95   ° C . In the early stages, the finer grid produces a delayed drying response compared to the coarser grids. This delay is attributed to the two-way coupling between the gas and particle phases, since rapid evaporation modifies the bulk flow properties of the particle-containing cell (increasing the moisture and reducing the temperature). Such effects do not occur in 1D modeling approaches (such as those used by Patel et al. [29] and Woo et al. [14]), where bulk flow properties remain constant. Therefore, this potential effect must be considered in CFD simulations of spray drying, particularly near the droplet–air interface region, where finer grids are typically used.
Figure 3c,d compare the modeled drying kinetics for two drying air temperatures, using the fine grid and two different correlations to calculate the relative activation energy (Equation (23)) in the REA model. The five-term correlation proposed by Patel et al. [29] is compared with the three-term correlation of Woo et al. [14]. For both drying temperatures, the Patel et al. [29] approach yields better predictions of droplet moisture content, particularly in the later drying stages ( t > 200 s ). The Woo et al. [14] model provides a slightly better fit during the initial drying phase but significantly overpredicts the moisture at later times. Therefore, the five-term correlation of Patel et al. [29] was selected for this study.
Figure 3e shows the impact of the empirical shrinkage model parameter β on drying kinetics at T = 95   ° C during the later stages of drying ( t = 600 s to 900 s ). This interval is particularly relevant for spray drying, where the final product moisture is typically lower than the lowest values reported by Adhikari et al. [28]. As expected, higher β values result in faster drying due to reduced shrinkage and a larger surface area.
To calibrate β against the experimental data of Adhikari et al. [28], the moisture values at t = 900 s predicted by CFD with different β values were compared with the corresponding experimental value. The reference case was T = 95   ° C , which is closer to the expected outlet-air temperature. The experimental value at t = 900 s was obtained from a polynomial curve fitted to the reported interval ( t = 500 900 s ). The calibration of β was performed by minimizing the simple error | X p , CFD , β X p , exp | , evaluated for β values in the range 0.75–1.0. This yielded a calibrated shrinkage coefficient of β 0.91 .
While the differences in predicted moisture between β values appear small within the experimental interval, they are expected to increase at longer drying times and lower moisture levels. Even slight inaccuracies in the modeled particle diameter affect heat transfer and, in turn, mass transfer, with the error accumulating over time. This shows that the choice of β becomes increasingly important at late drying stages and highlights the need for careful calibration in the present modeling approach.

5. Results of the Parametric Study and Discussion

5.1. Computational Costs

For the proposed numerical experiments and parameters used, at each time step, the computational cost is distributed as follows: 60–70% for solving the continuous phase, 25–35% for solving discrete phase and the two-way coupling, and 5–7% for running the grid adaptation algorithm, which is activated every 10 time steps. Computational costs are measured in PH/s (processor hours per second of simulated time). During the start-up phase, where an initially limited pre-refined grid was used without adaptive mesh refinement (AMR), the costs were approximately 45 PH/s. Subsequently, the costs increased to approximately 85 PH/s upon activating the grid adaptation. Cases with higher Reynolds numbers (P5* = 3.95 × 10 4 ) had shorter fill times ( t f ), and converged significantly faster than those with lower P5* values. The approximate total computational costs for conducting these experiments, which includes preliminary runs and tests, was approximately 195,000 processor-hours (PH). This is equivalent to the continuous usage of a 48-processor Dell 7920 workstation for around 5.7 months.

5.2. Flow and Particle Statistics Development

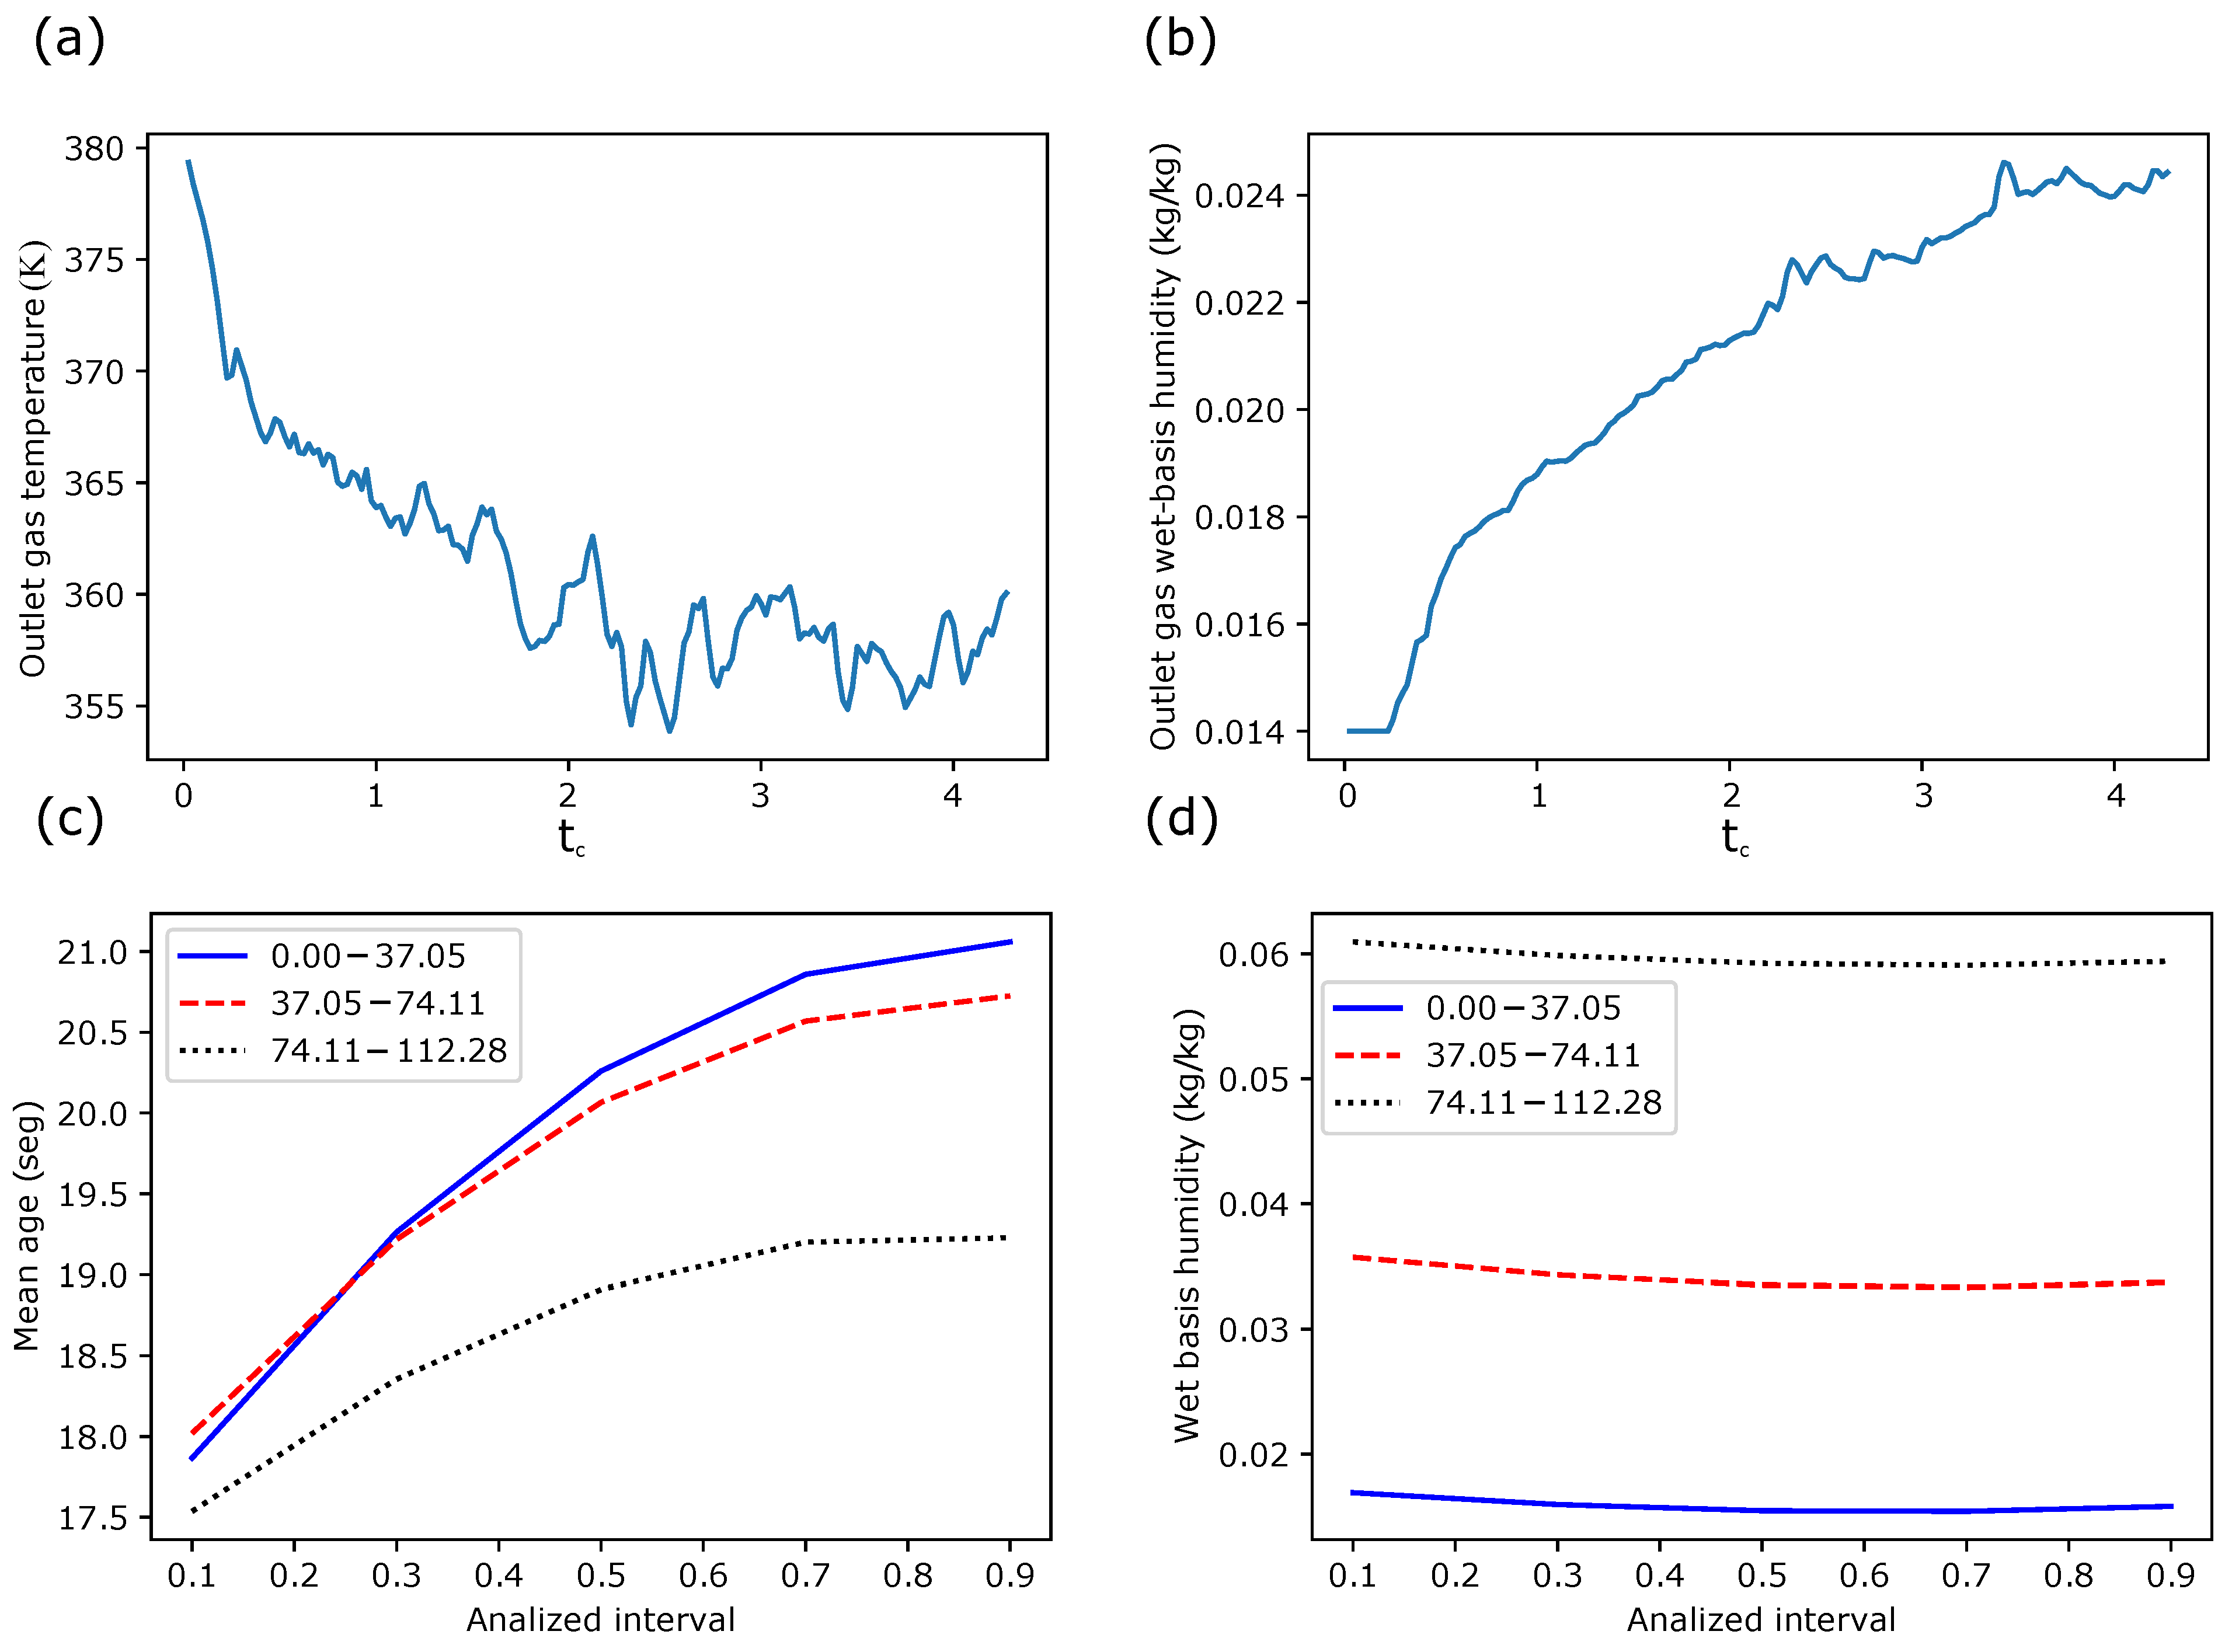
Figure 4 presents interval-averaged results for selected response variables, illustrating the progression of the numerical solution for Experiment 14 (tall-form spray chamber with moderate swirl, P4* = 0.5). Figure 4a shows the outlet temperature of the drying gas. The outlet temperature departs rapidly from its initial value and converges by t c = 2.5 to a quasi-steady state. In contrast, the outlet gas moisture content (kg/kg), shown in Figure 4b, requires up to t c = 4.5 to converge, likely reflecting the variability in particle residence times.
Figure 4c displays the mean particle age (PRT) by interval for three different particle size ranges ( μ m ) measured at the outlet. In all cases, the PRT begins to converge around t c = 4.0 . Additionally, larger particles exhibit shorter residence times compared to smaller ones. Figure 4d presents the interval-averaged particle wet-basis humidity at the outlet. Unlike the mean PRT values, the wet-basis humidity converges quickly in this case. It is important to note that these results, which show the evolution of gas and particle-related responses, are specific to Experiment 14 and are not consistent across all cases. Therefore, the convergence behavior of each response variable must be verified individually for all cases.
These findings confirm the necessity of extending computational times sufficiently to allow for the development of the internal airflow, as highlighted in previous studies [1,24]. They also indicate that the particle field likely requires a longer development time than the flow field, emphasizing the need to use multiple indicators (responses) to verify field development. This verification is essential for effective data collection and statistical analysis.

5.3. Velocity, Humidity, and Particle-Related Fields

Effect of the Particle Phase on the Velocity Field

Figure 5a presents a 2D cross-section of the air velocity contours in the upper section of the drying chamber for Experiments 12 and 16. Near the atomizer, the injection of particles and the associated momentum transfer to the gas phase induce a significant increase in turbulence, breaking the jet flow into large detached eddies. This heightened turbulence leads to short-time scale velocity changes in the atomization region, affecting the probability of an injected particle crossing the jet or being entrained downward. Consequently, the initial trajectories of the particles are expected to display greater variability compared to those predicted using a RANS model. These coupling effects are more pronounced in Experiment 12, which is characterized by a lower airflow velocity at the discharge, making it more sensitive to momentum transfer from the particle phase.

Air Moisture Field

Figure 5b shows an instantaneous 2D cross-sectional view of the drying chamber for Experiments 5, 12, and 16, displaying moisture contours of the gas phase. The contours, taken at t c = 5.14 , use highly contrasting colors to aid visualization. In the central jet, moisture rapidly increases from the discharge toward the middle of the chamber, indicating intense mixing and rapid particle evaporation. For Experiments 5 and 12, a pronounced asymmetry in the moisture field is observed at the jet periphery. This asymmetry, highlighted by the high-contrast color scheme, evidences the complexity of internal airflow and particle dynamics within the chamber. In this case, the observed asymmetry may be attributed to particle clustering caused by large, unstable eddies forming in the recirculation region under low inlet swirl (P4* = 0.05) and Reynolds number (P5*) conditions. These findings underscore the importance of conducting fully three-dimensional simulations of the spray chamber to capture the complex phenomena involved. For the high-inlet swirl, high-Reynolds number case (Experiment 16), strong symmetry was observed (and confirmed at multiple simulation times), indicating greater stability in the external recirculation regions, consistent with the findings of our previous study [1].

Particle Fields

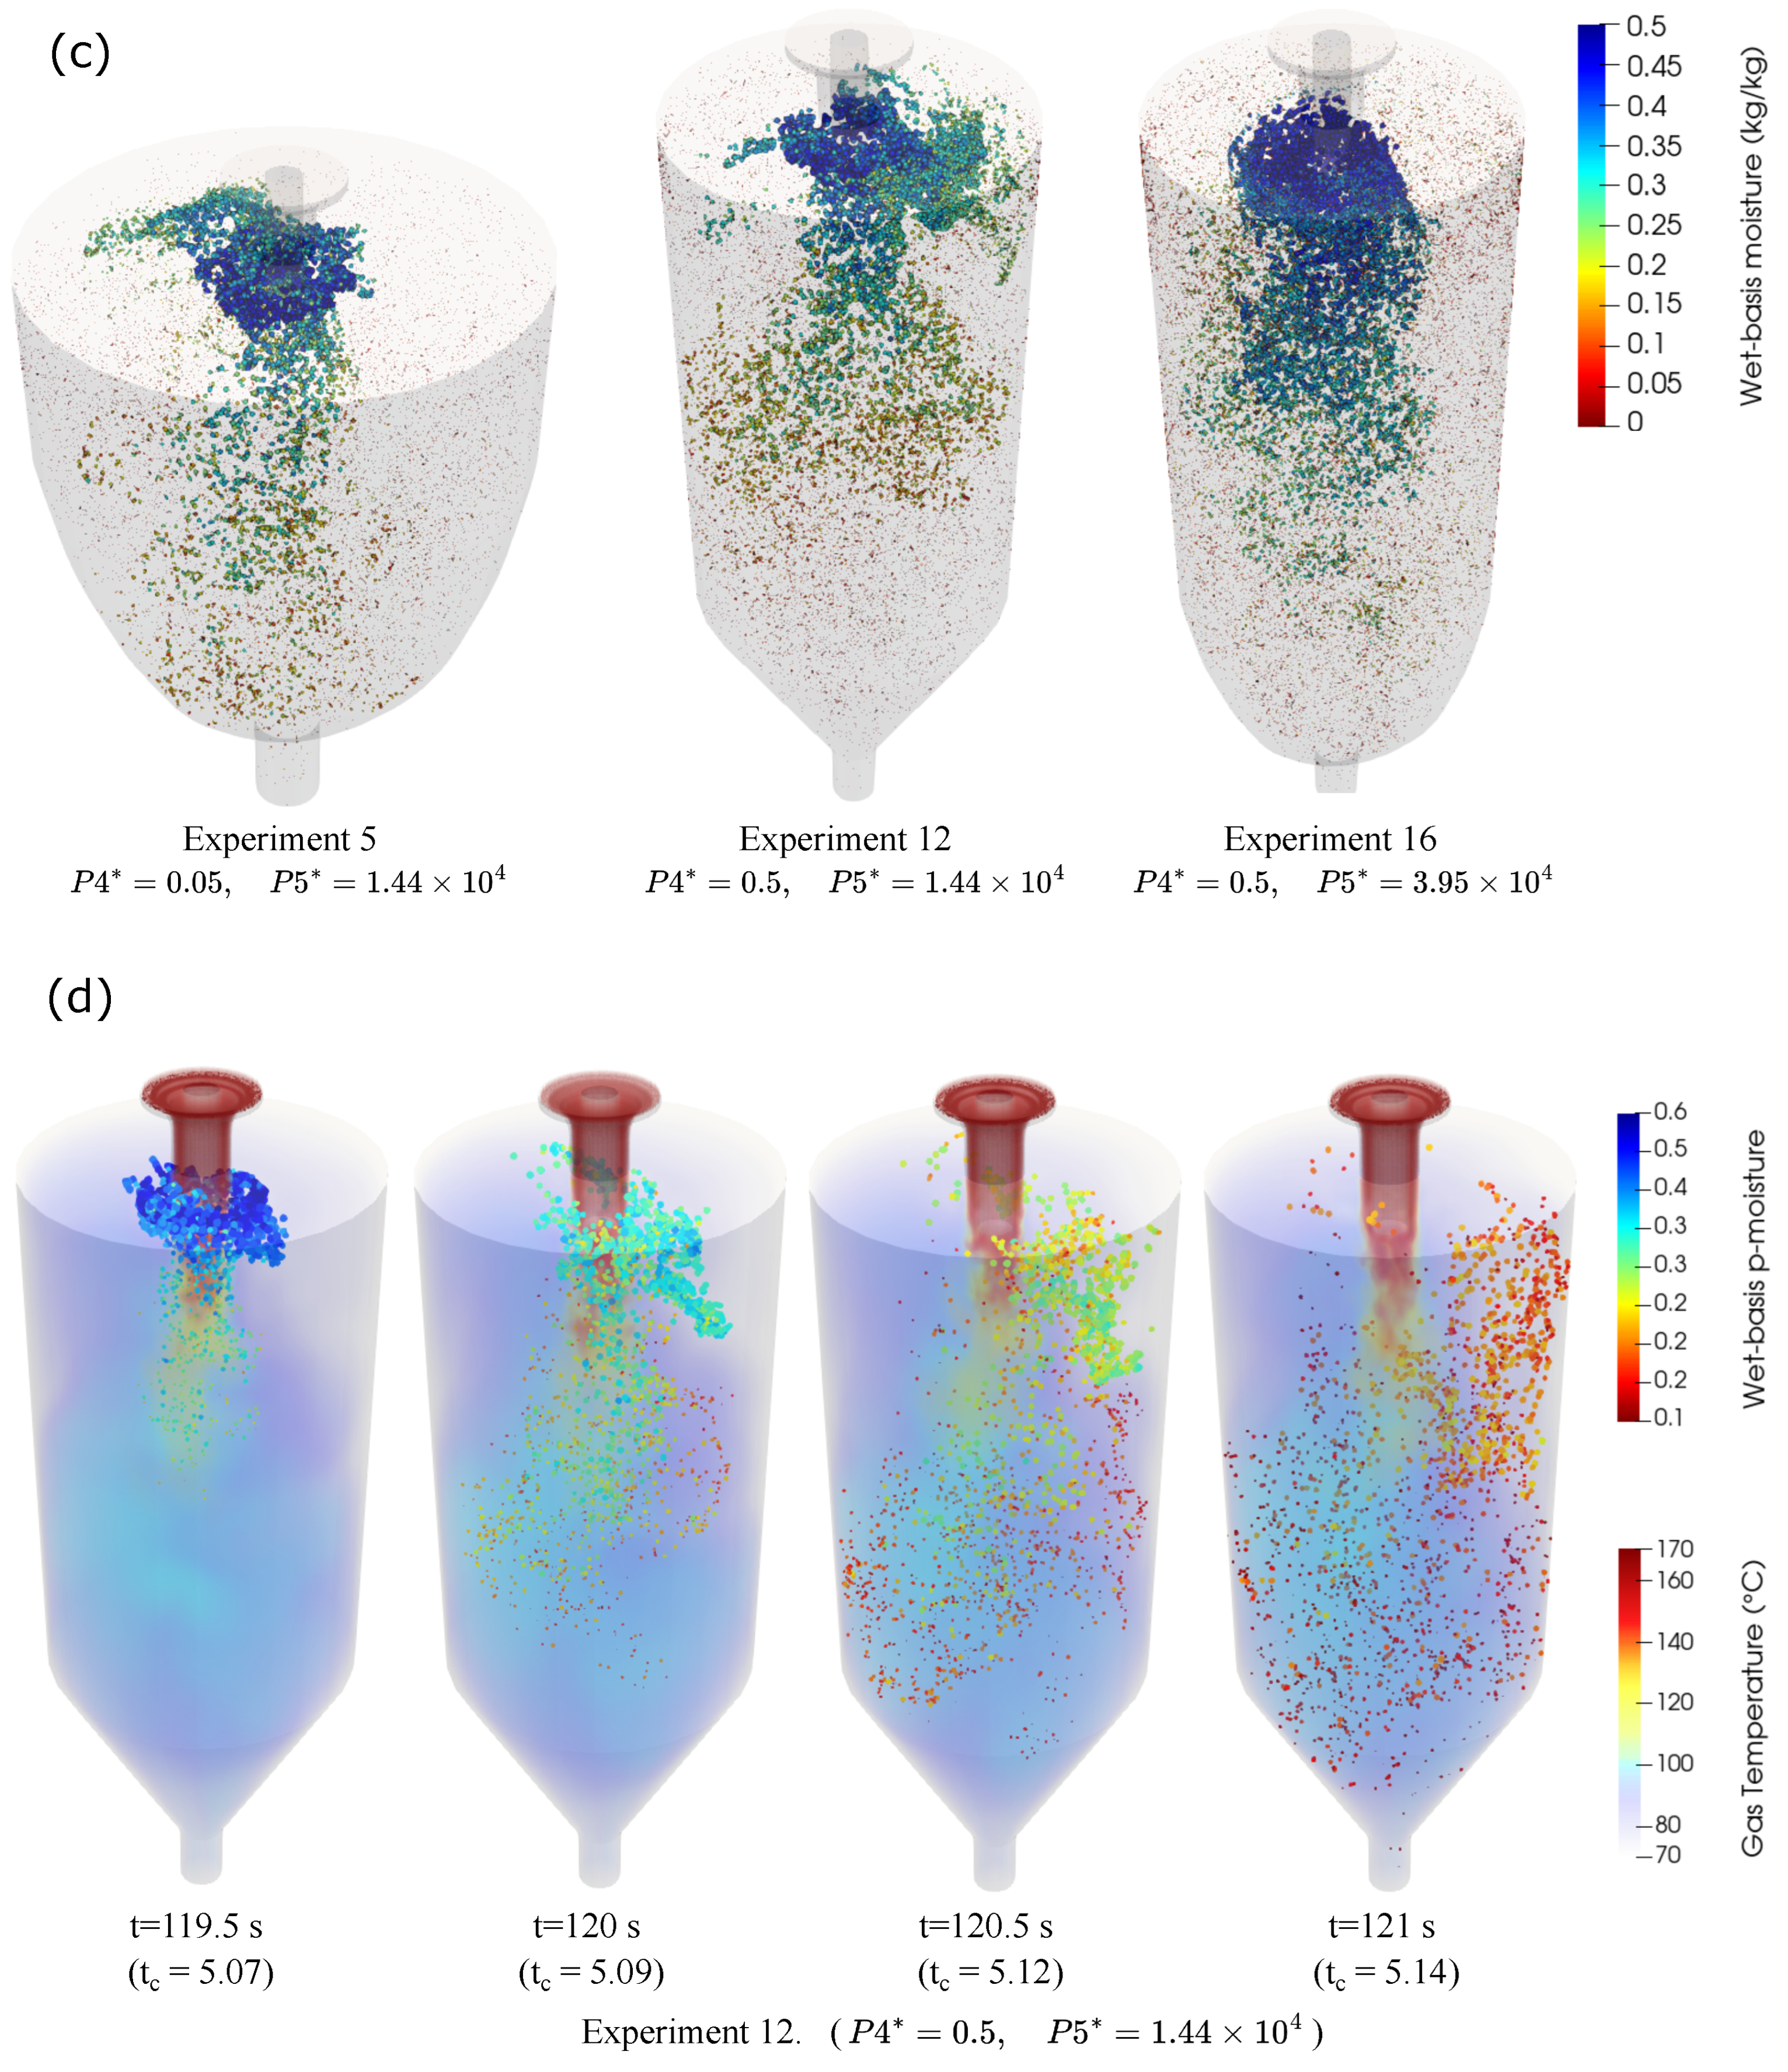
Figure 5c displays particle positions colored by moisture content (kg/kg) for Experiments 5, 12, and 16 at t c = 5.14 . Only particles with Particle Residence Times (PRTs) less than 2 s are shown for visualization. The size of the particles is adjusted inversely proportional to their PRT, making recently atomized particles appear larger. As expected, newly atomized particles form a homogeneous annular shape around the atomizer. However, for Experiments 12 and 16, this annular shape is not maintained radially, and a preferential accumulation region appears at the atomizer periphery. This zone corresponds to the asymmetry in the moisture field shown in Figure 5b. In contrast, Experiment 16 exhibits a more homogeneous pattern, and the annular shape of particles around the atomizer retains some tangential symmetry. This behavior is likely due to the stabilizing effect of swirl at high P5* values on the flow patterns (P3* = 0.5 for Experiment 16) in the recirculation region. Regardless of the case, all particles occupy the entire drying chamber by the time their PRT reaches 2 s.
Figure 5d shows a time-dependent particle position field with moisture content (kg/kg) coloring for particles in Experiments 5, 12, and 16. The position field displays 2000 parcels atomized over approximately 0.2 s ( t c = 0.0084 ), illustrating their dispersion and drying evolution during a 1.5-s interval. Unlike the previous figure, here the apparent sizes of the particles correspond to their actual diameters. The smallest particles are directly entrained into the central jet, while larger ones pass into the recirculation zone at the periphery. In the initial time interval, particles lose moisture rapidly, but this process is non-uniform. Larger particles at the periphery lose moisture more slowly than those entrained in the jet stream. As a result, significant dispersion in particle moisture statistics is expected at the outlet. Additionally, there is considerable spacial dispersion of particles in the central zone, allowing for rapid occupation of the drying chamber.

5.4. Main Effects and Pareto Plots

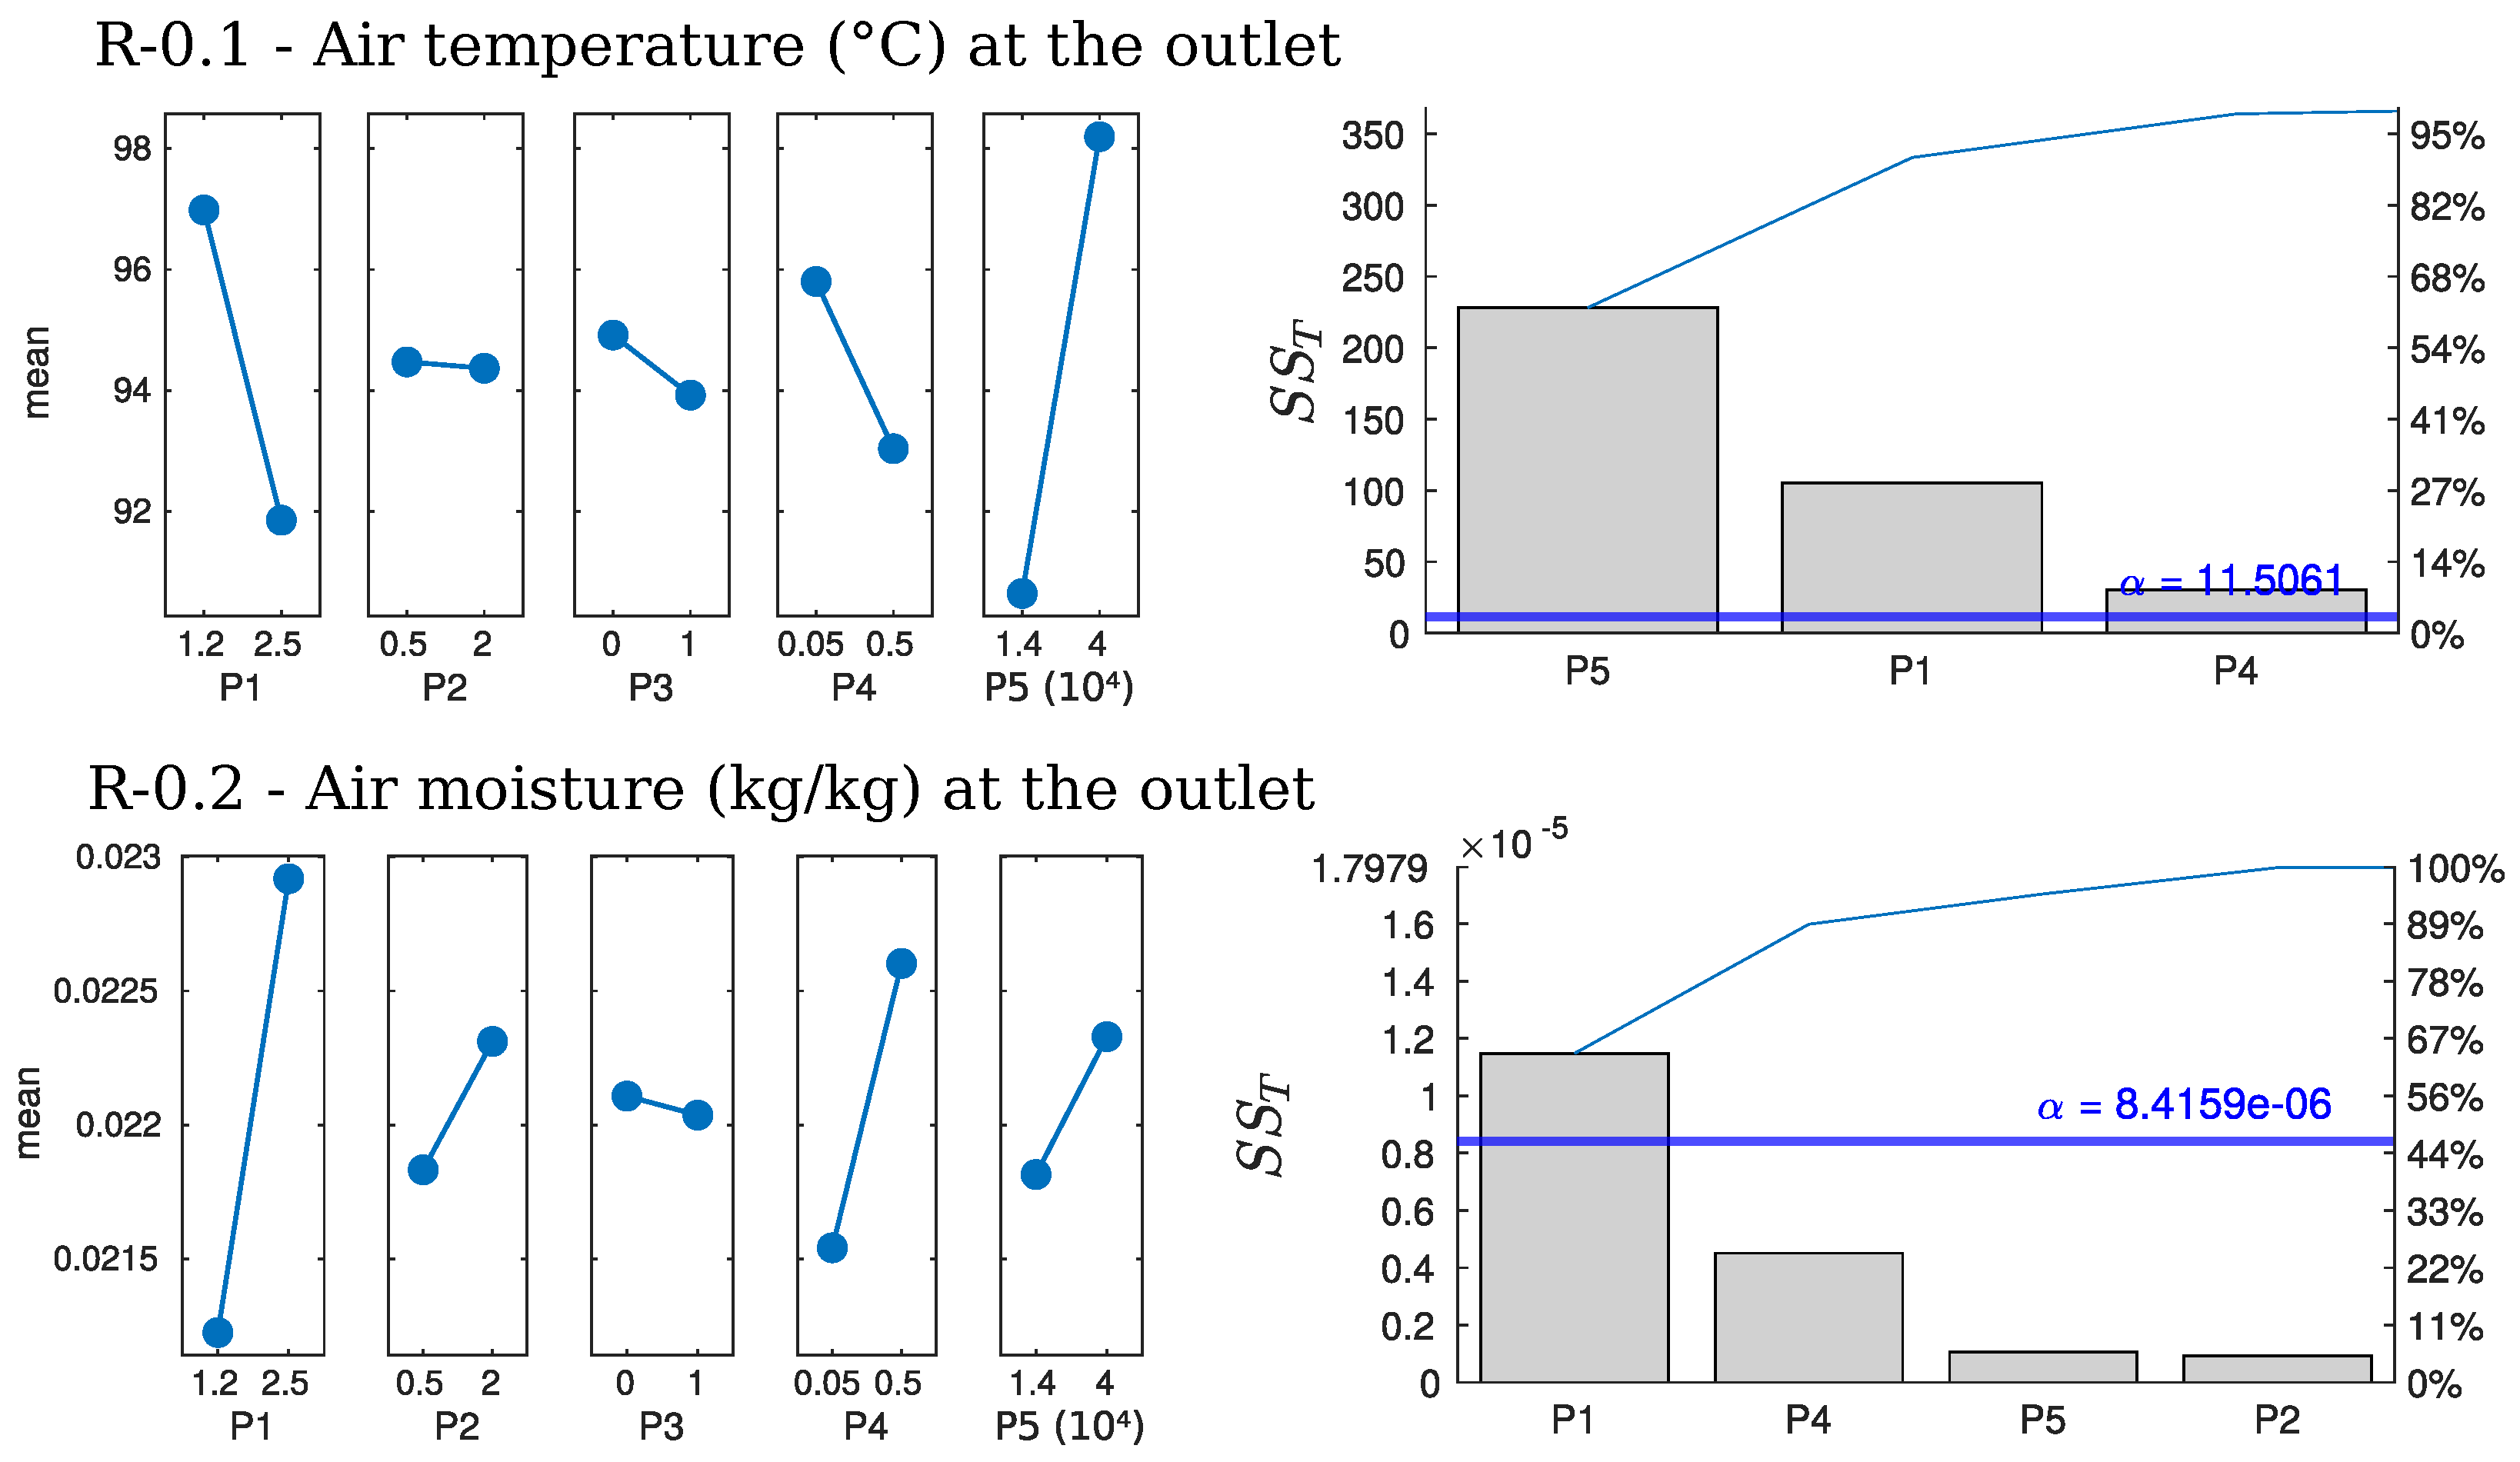
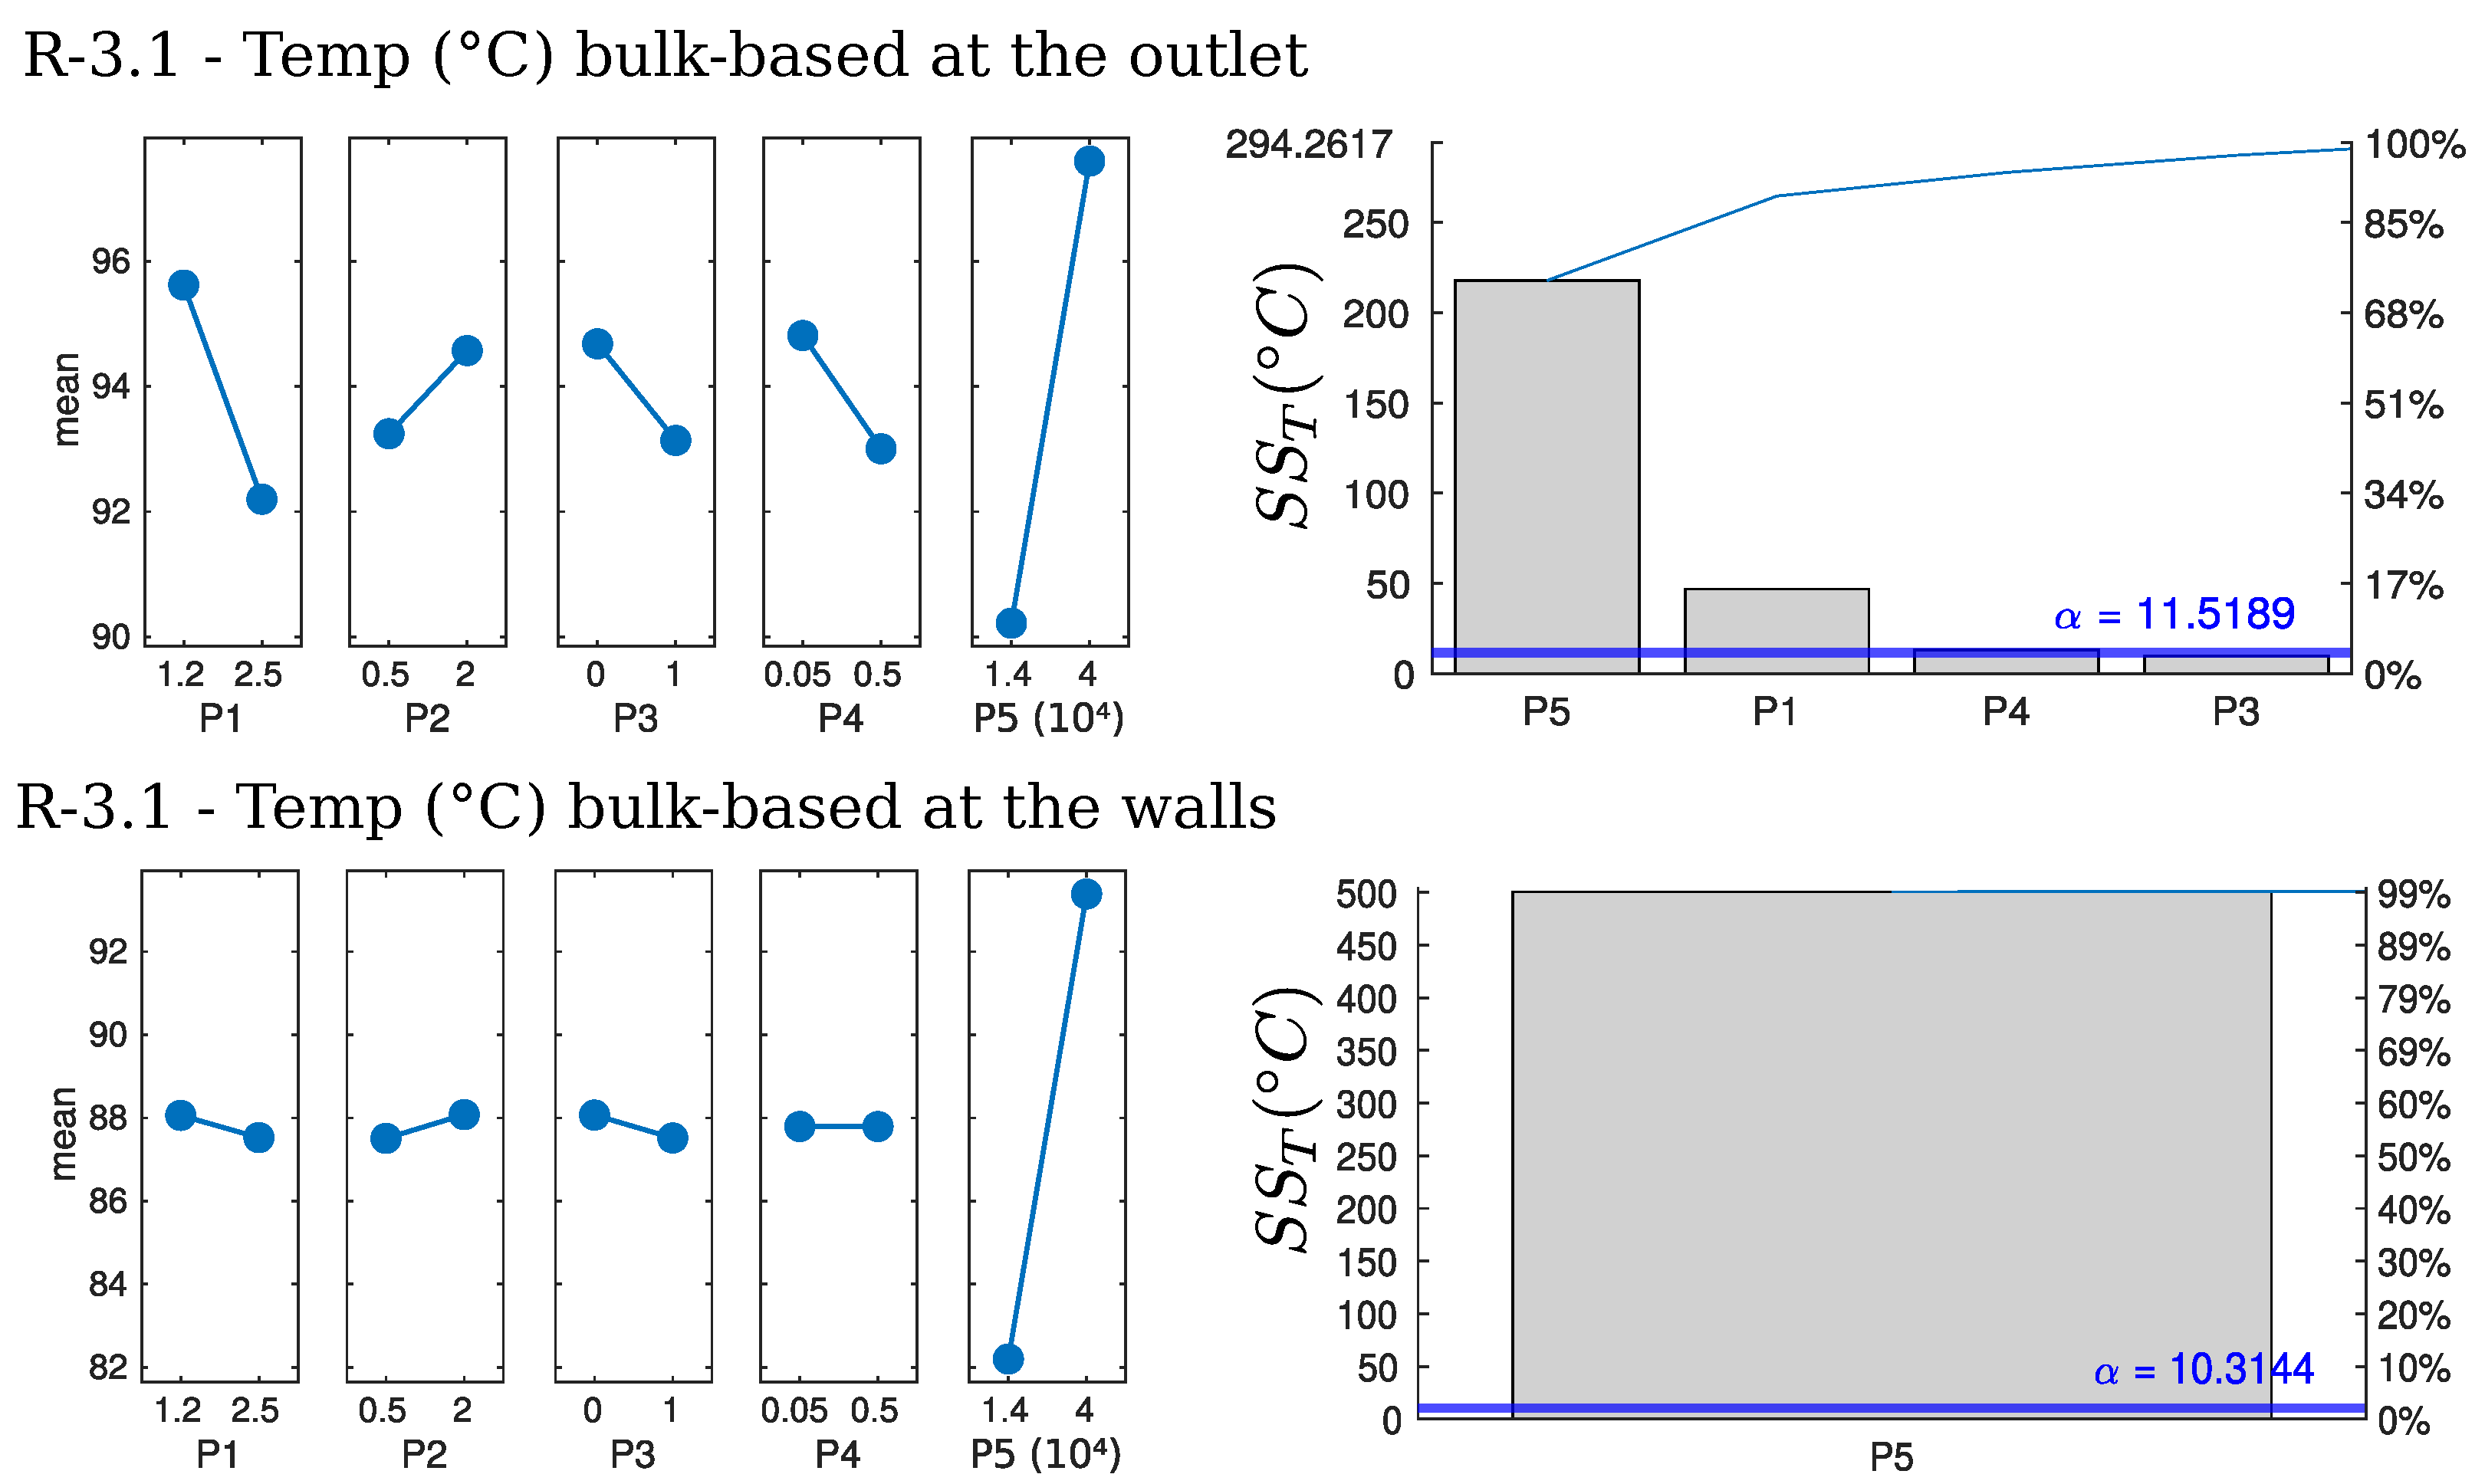
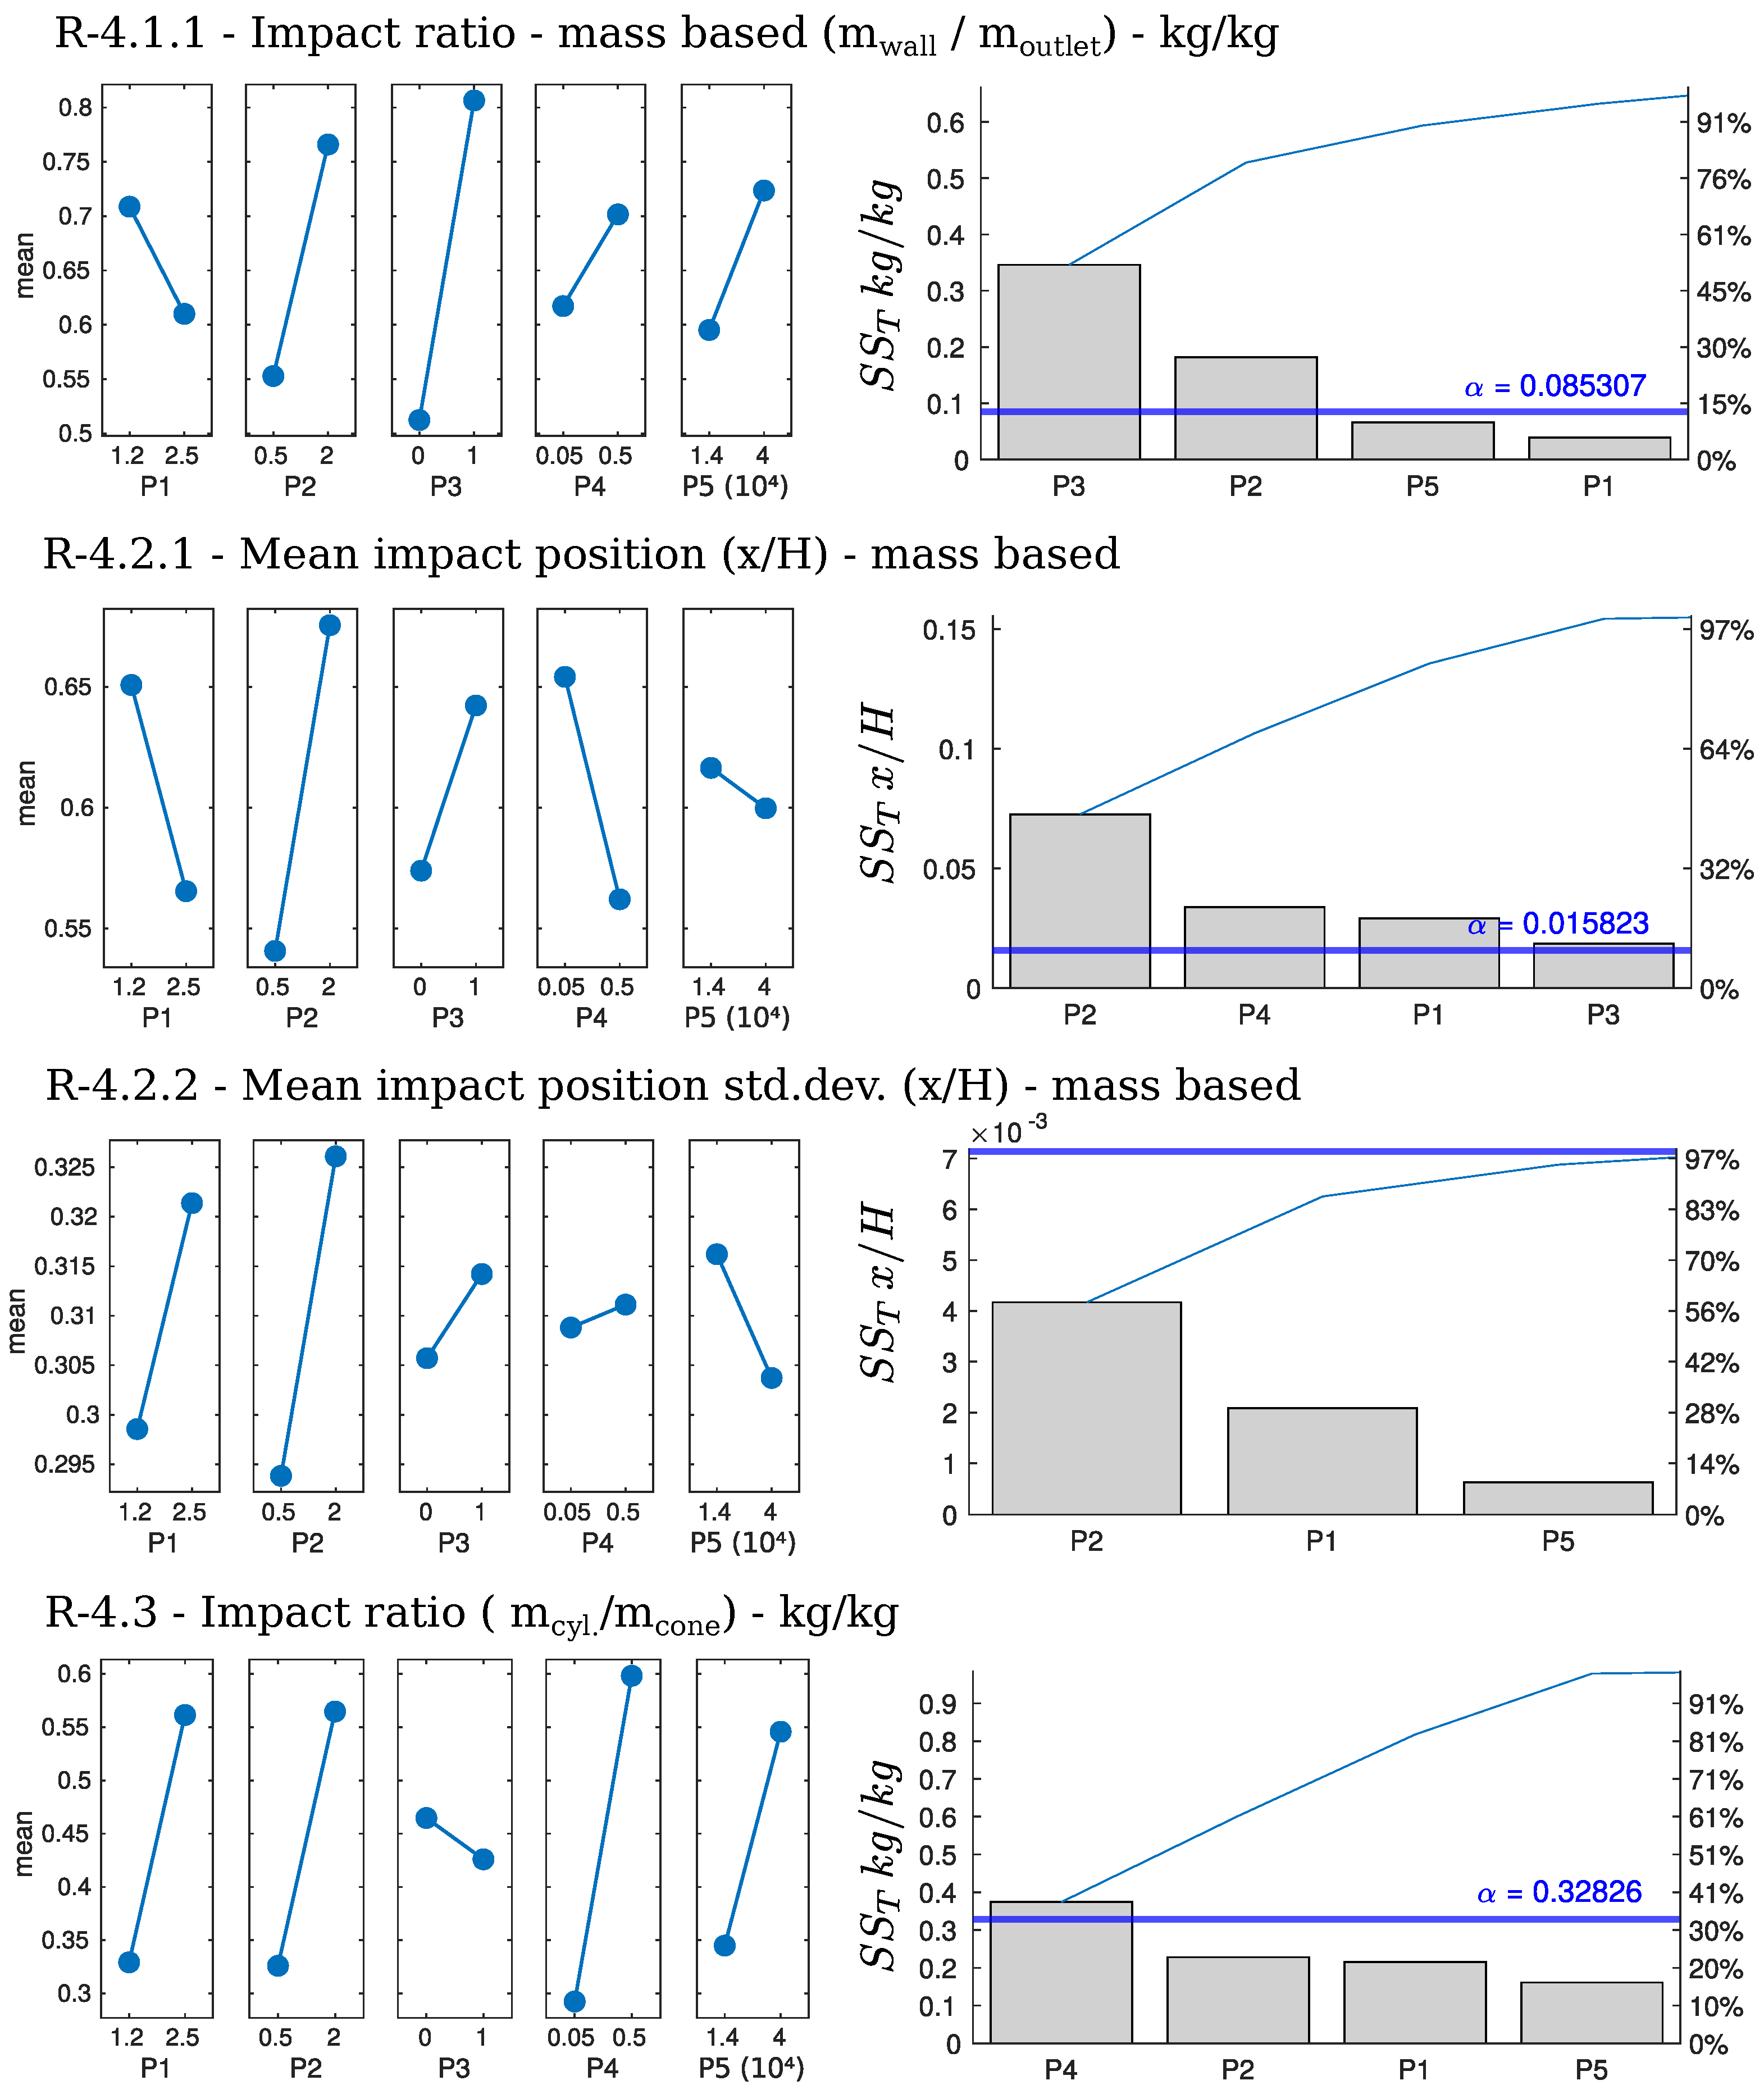
The figures in this section present DOE plots for various response variables. The left column shows the main effects plot, while the right column displays the Pareto chart. In the Pareto chart, a horizontal line marks the 95% confidence interval ( p = 0.05 ). The threshold value, denoted as α , represents the physical threshold in terms of the response variable for this confidence interval, and the sum of squares is presented as S S T .

5.4.1. Global Responses (R-0)

R-0.1—Outlet Air Temperature (°C)
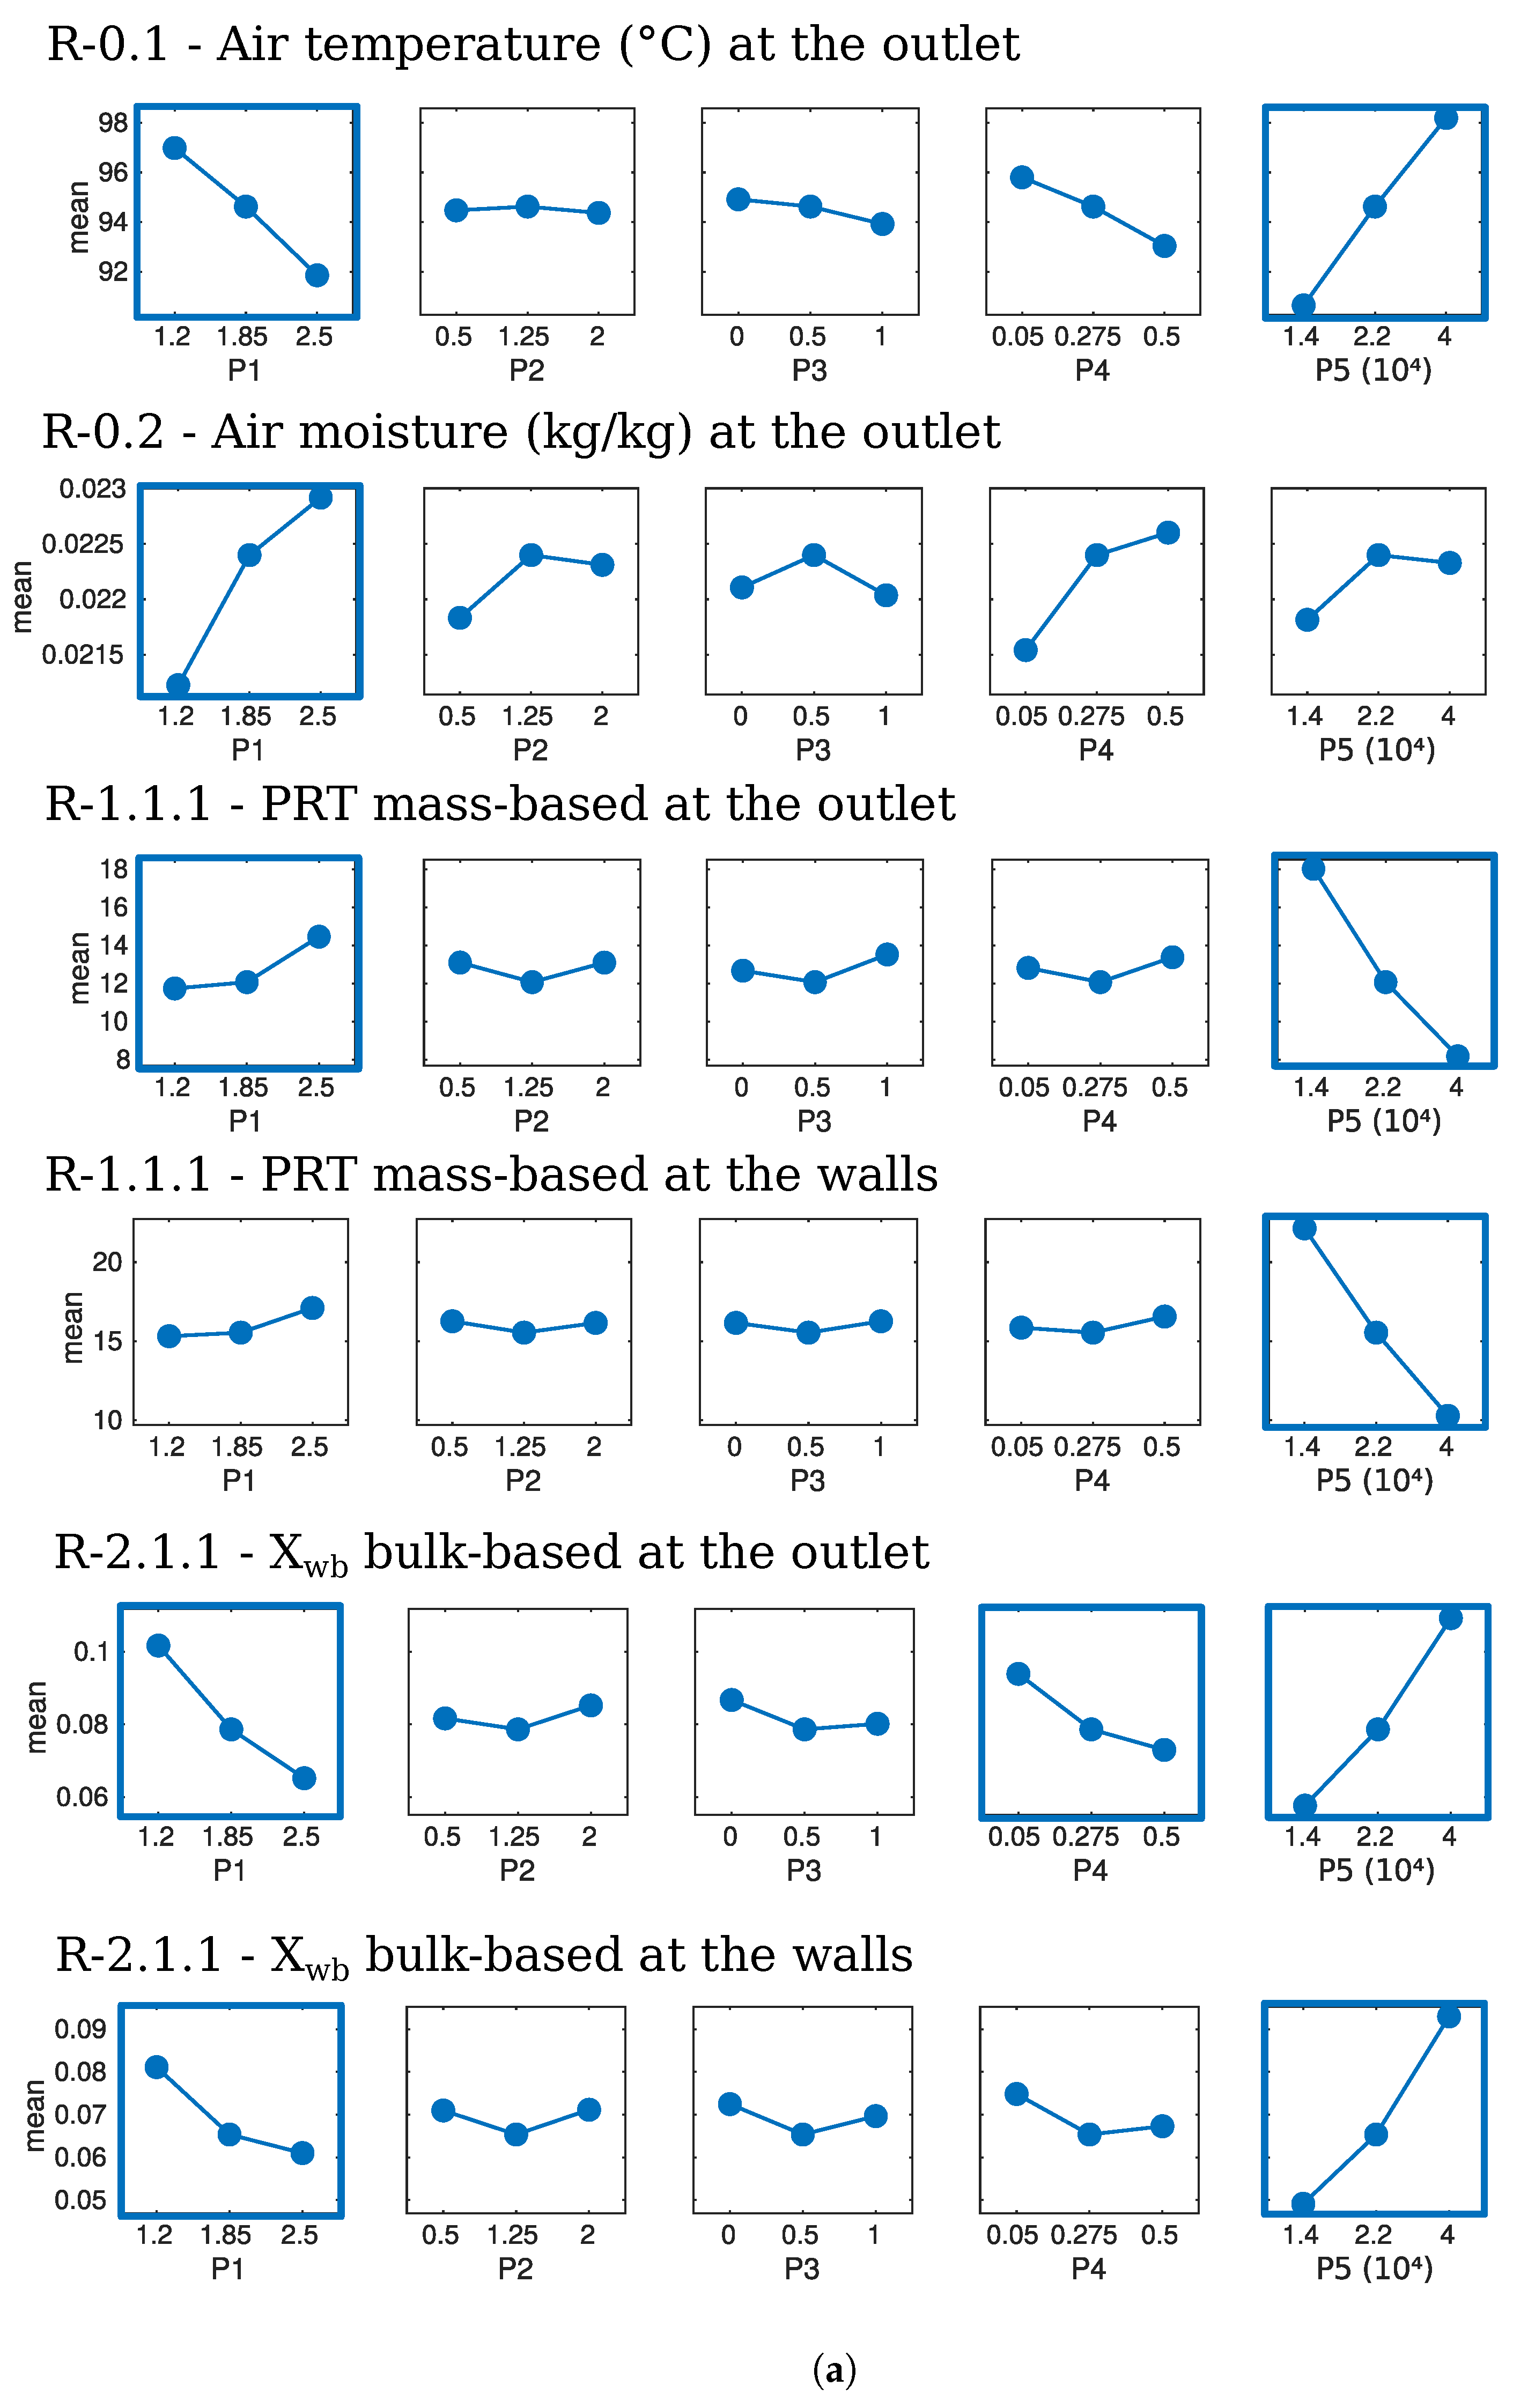
The gas outlet temperature, as shown in Figure 6, is primarily influenced by three parameters: P5* (Reynolds number), P1* (chamber height-to-width ratio), and P4* (swirl number). Among these, P5* has the most significant statistical impact, causing a substantial increase in outlet temperature when increased. Conversely, P1* and P4* have the opposite effect on outlet temperature.
R-0.2—Outlet Air Moisture Content (kg/kg)
This response variable, also shown in Figure 6, is mainly affected by P1* (chamber height-to-width ratio). The response is in the same direction, and doubling P1* results in an increase of about 10% in outlet air moisture content. Other parameters with weaker effects are P4*, P5*, and P2*, all generating a response increase in the same direction.
Discussion on Global Responses
These results indicate that the global variables are mainly influenced by operational (P5*) and geometrical (P1*) parameters. Although the maximum variation in the mean low and high values of R-0.1 and R-0.2 is around 10%, this is significant given that all other operating parameters are held constant (e.g., ARL, T , inlet ). The considerable variation in outlet gas temperature and moisture content must be explained by the histories of the atomized particles, which are analyzed in terms of the specific particle responses (R-1 to R-4) below.
Figure 6. ANOVA analysis of the influence of factor parameters on the global variables (R-0). Left column: main effects plot; right column: Pareto chart of the standardized main effects. The horizontal blue line defines the 95% confidence interval ( p = 0.05 ). The value of α represents the threshold value in the response variable for this confidence interval. S S T represents the sum of the squares.
Chemengineering 09 00121 g006

5.4.2. Particle Residence Times (R-1)

Primary Residence Times (Measured at the Outlet)
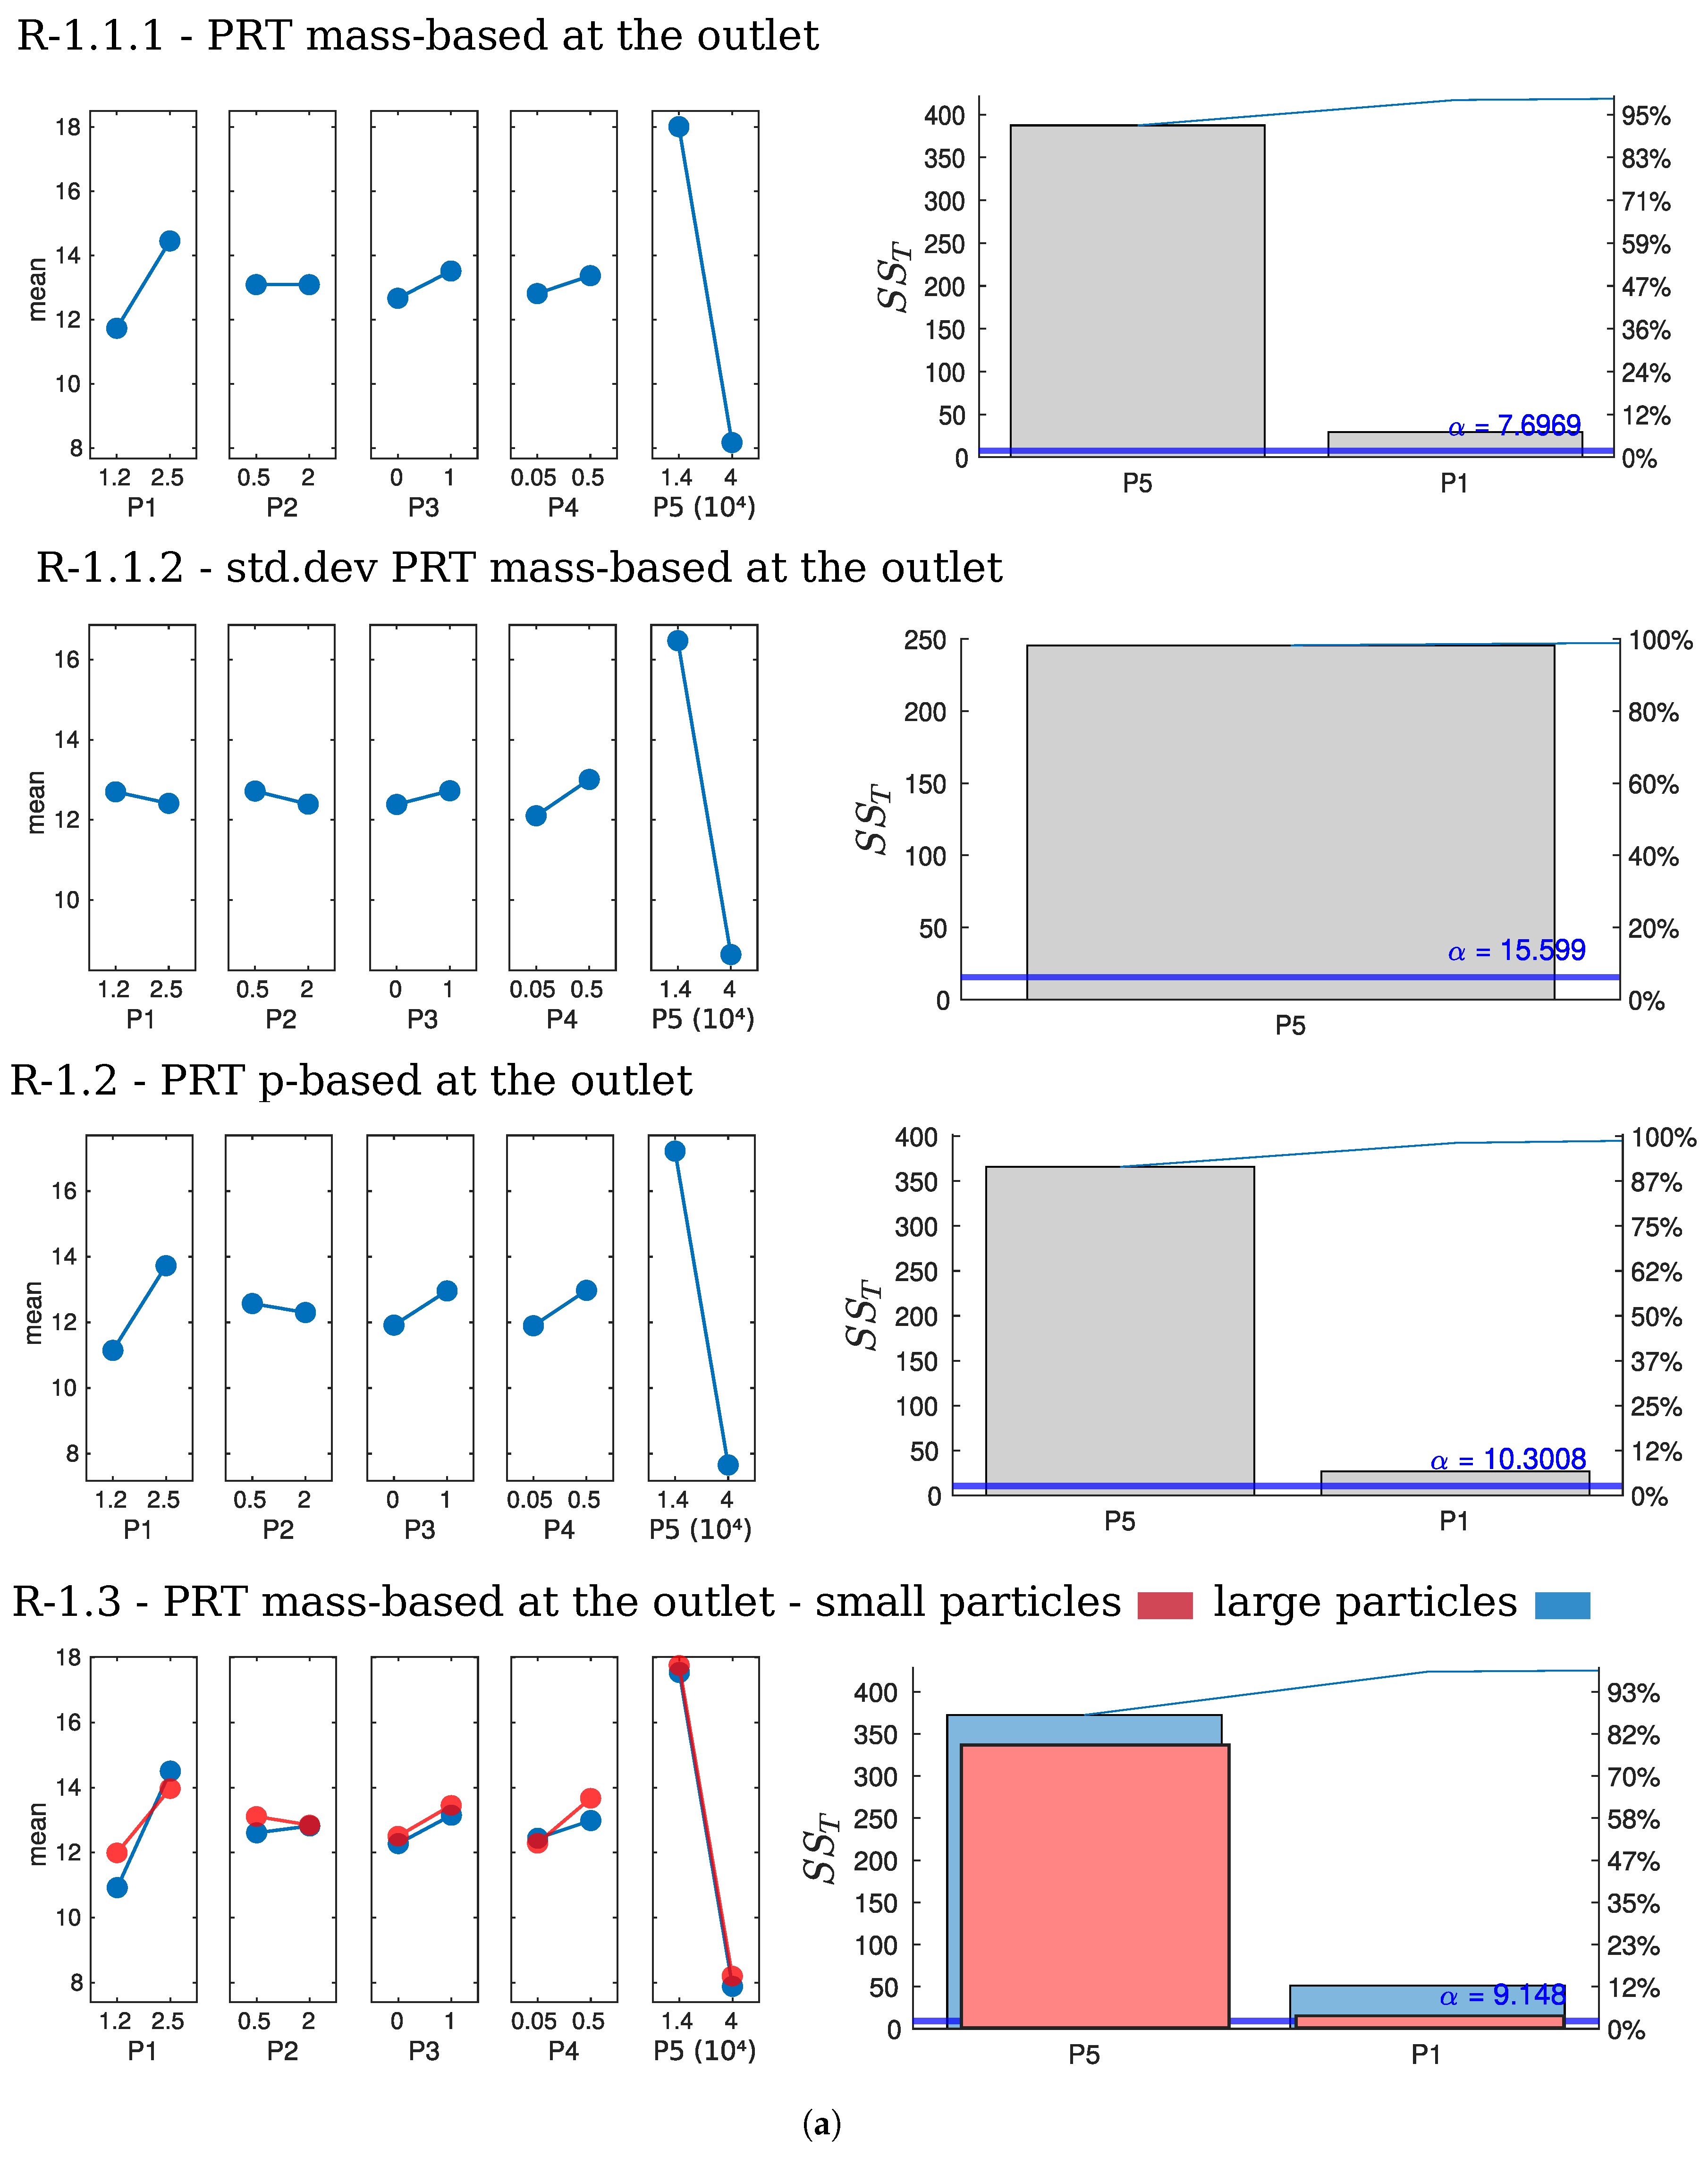
Figure 7a presents the results for particle residence time (PRT) measured at the chamber outlet. For all PRT responses, P5* has a statistically significant impact, with the highest P5* yielding the lowest PRT values. The only geometrical parameter with statistical impact is P1*, which for R-1.1.1, R-1.2, and R-1.3 results in a 25–40% increase in PRTs. The statistical analysis of PRT in terms of bulk quantities or on a particle basis (R-1.1 and R-1.2) did not show significant differences. This is illustrated in R-1.3, where the change in PRT with particle size is negligible. For the standard deviation of individual particle residence data (R-1.1.2), P5* is the only parameter with a statistically significant impact. Here, the variation of P1* has minimal effect, indicating that long-form drying chambers present similar dispersion among the PRT values of non-wall-impacting particles as short-form chambers, though with longer average PRTs.
Particle Residence Times at the Chamber Walls
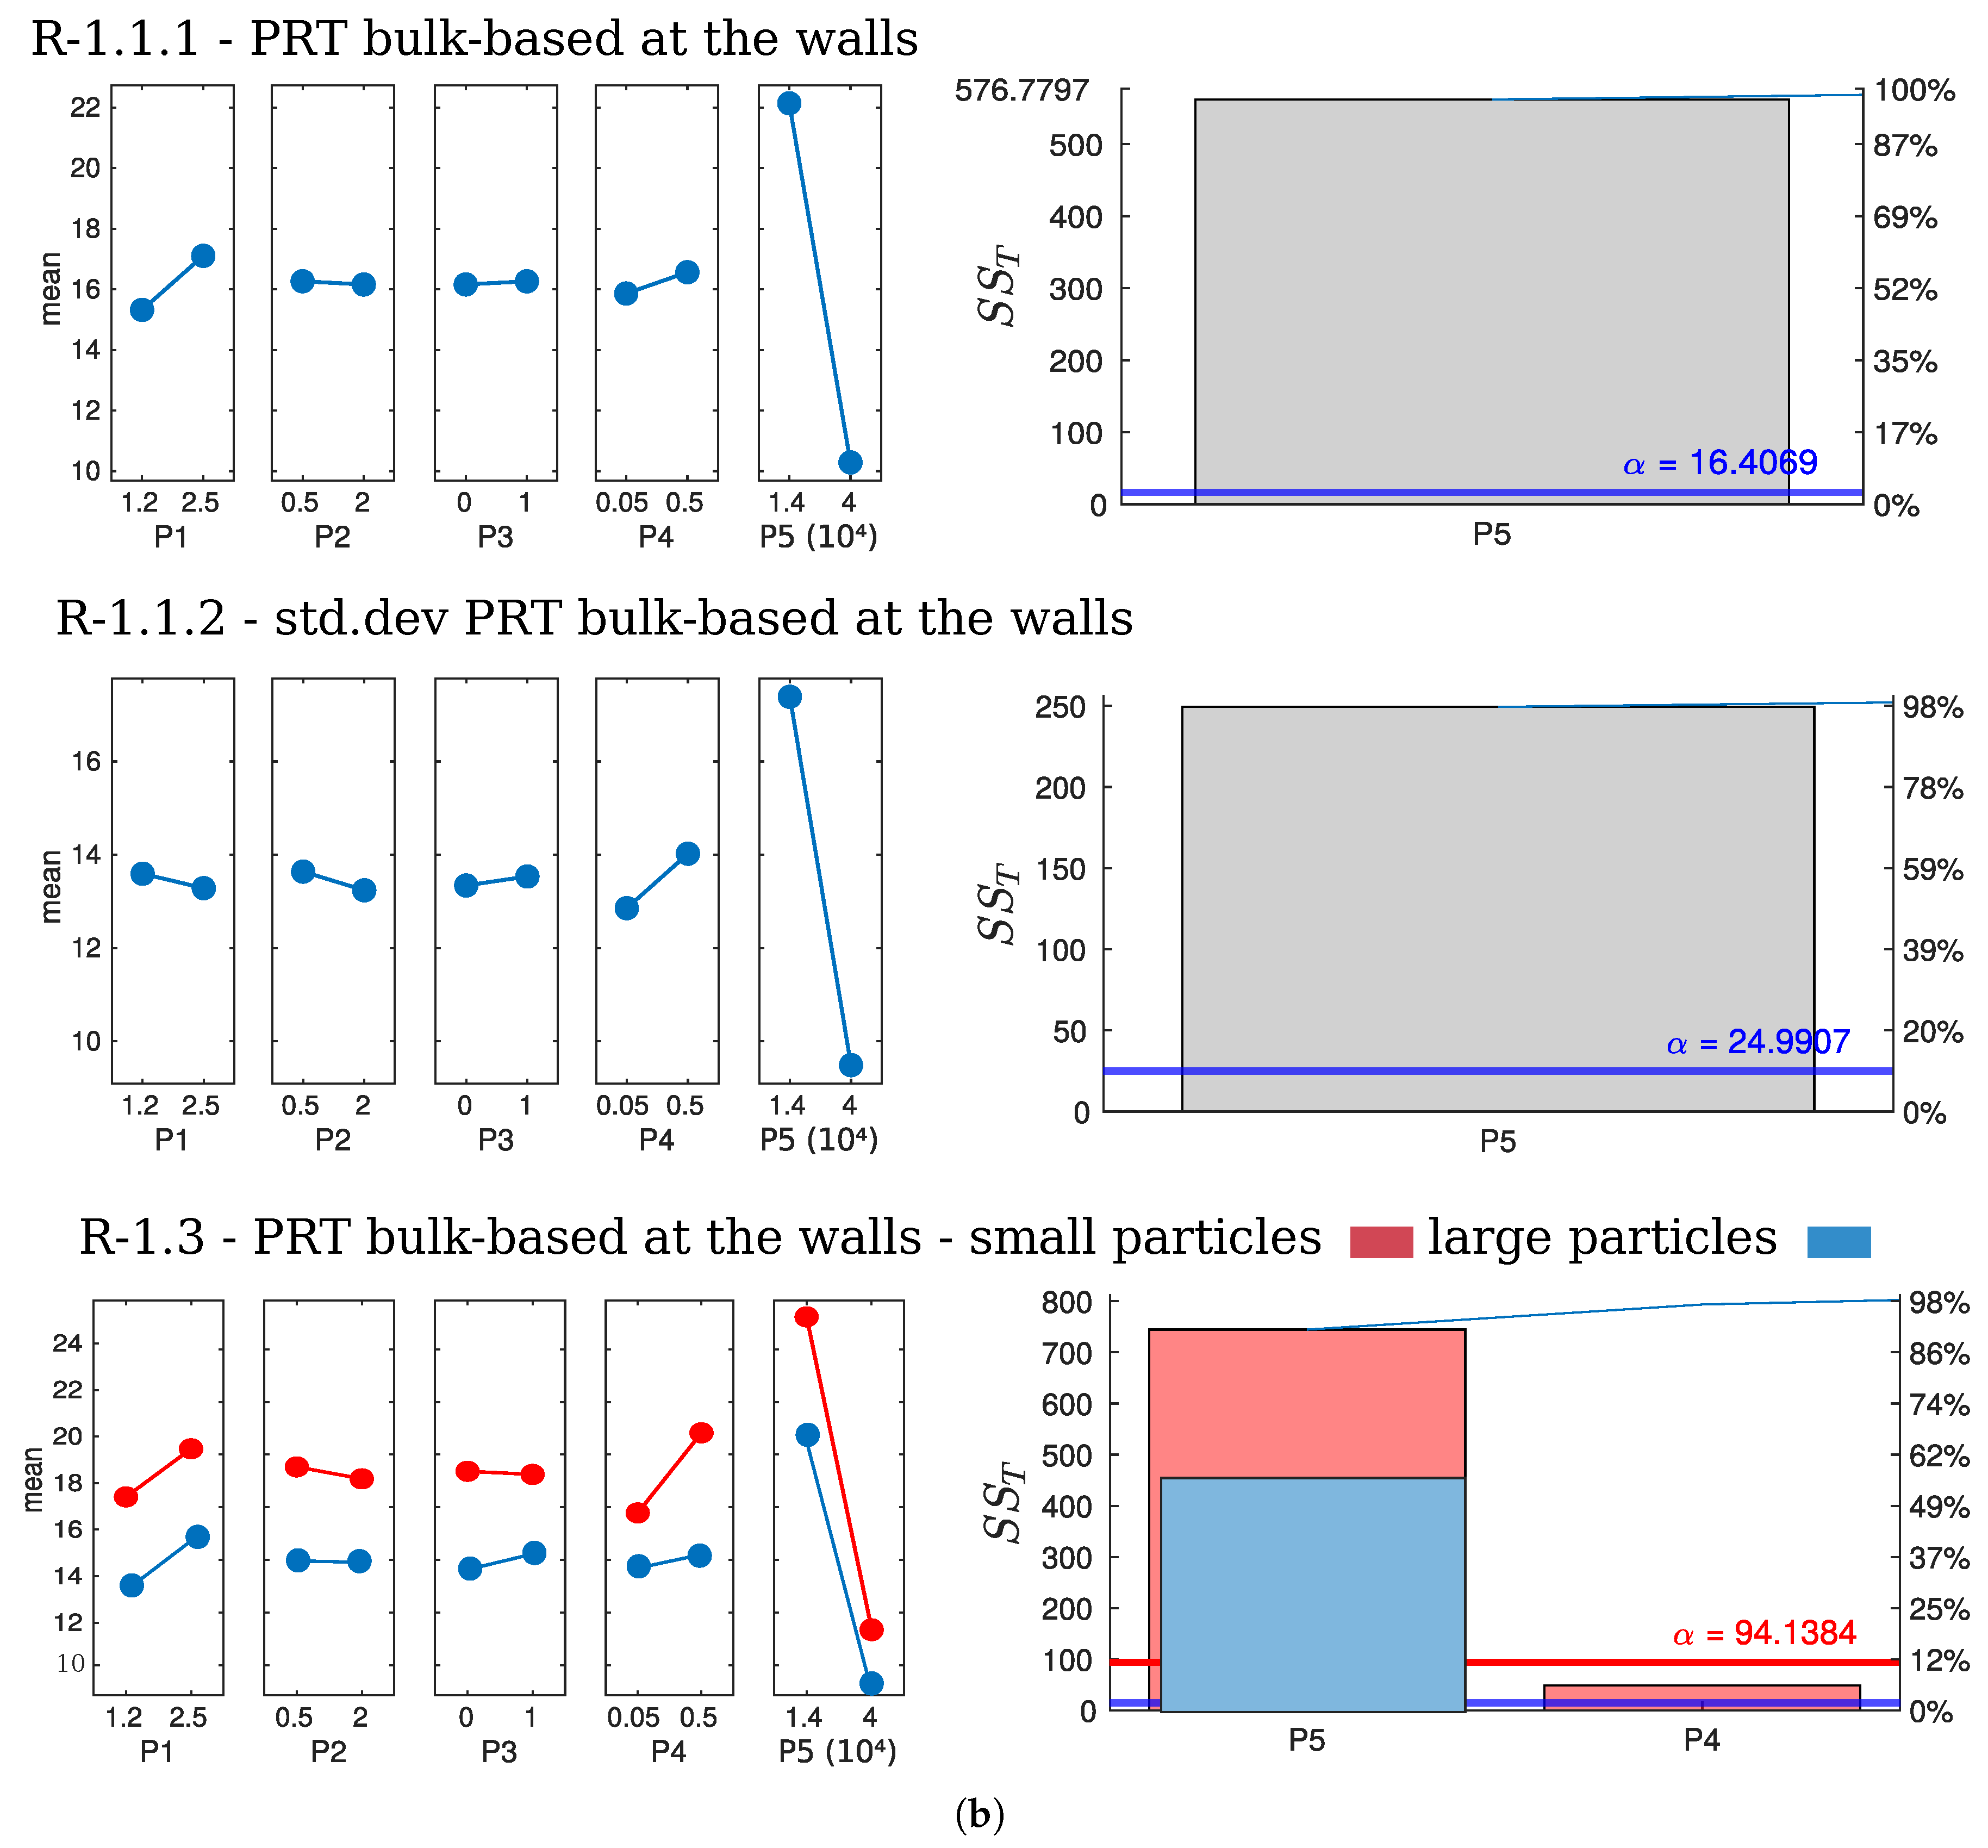
Figure 7b shows PRT-related responses for particles impacting the walls. In contrast to the PRT data at the outlet, P1* was not statistically significant for any PRT response, leaving P5* as the sole dominant factor. Additionally, when analyzed by particle size, more significant differences were observed in PRT values, with smaller particles having longer residence times. Since mean PRT values at the walls are higher than at the outlet, most of these particles likely recirculate inside the chamber before colliding with the walls. Lastly, P4* (swirl) shows some statistical significance in the PRT response for small particles (R1-3), increasing PRT with higher swirl values. This is likely related to internal flow dynamics, as increased swirl widens the jet and induces precessing behavior while reducing recirculation strength, resulting in more non-inertial particles being drawn into weaker recirculation regions and increasing their residence times before they impact the walls.
Discussion on Particle Residence Times
The results for particle residence time (PRT) responses at the outlet indicate that average residence times are comparable to the filling times ( t f ) of the drying chamber, as shown in Table 1. This suggests that the paths taken by these particles are similar to the average flow streamlines. Since P5* is directly associated with t f , in practical terms, controlling PRT could be achieved by adjusting the volumetric flow rate of the drying air if particle-to-wall statistics are disregarded. However, the mean PRTs of particles colliding with the walls are significantly higher than the primary PRTs measured at the outlet. Thus, this assumption only holds for non-colliding particles. To fully understand the impact of particle collisions on global PRTs, it is necessary to study the statistics of particle impacts (numbers and zones), as well as their stickiness behavior determined by particle moisture and temperature. The ranges of mean PRTs obtained at the outlet and at the walls are comparable to those reported by Huang et al. [7] in a slightly smaller drying chamber, but are higher than those reported by Anandharamakrishnan et al. [2], likely due to the use of a nozzle atomizer instead of a rotary atomizer.

5.4.3. Particle Moisture Content

Particle Moisture Content at the Outlet
Figure 8a presents various response variables related to the moisture content of particles at the outlet. The parameters with statistically significant effects on this response are P5*, P1*, and P4*. For P5* (Reynolds number), higher values consistently result in a substantial increase in the moisture content of particles at the outlet. This behavior can be explained by the previously discussed relationship between the particle residence time (PRT) at the outlet and the chamber fill time, t f . Increasing P5* reduces the PRT, thereby shortening the overall drying time. Although higher P5* values lead to greater bulk velocity at the jet discharge and thus more intense evaporation during the initial particle-gas contact, their influence on the overall drying process is limited. As drying progresses, it becomes increasingly difficult to remove additional moisture from the particles. Therefore, the total drying time, governed by the PRT, plays a dominant role in determining the final moisture content.
For the geometry-related parameters, P1* (chamber height-to-width ratio) and P4* (swirl number), increasing either parameter results in a lower moisture content of particles at the outlet. In the case of P1*, this is attributed to longer PRTs, as previously discussed, which lead to lower outlet gas temperatures and higher moisture contents (R-0). For the response R-2.1.2 (standard deviation of X wb , p ), P1* emerges as the most statistically significant factor. This is likely due to a weaker recirculation region formed in tall-form chambers [1], which reduces the number of recirculated particles and leads to lower dispersion in humidity values. Regarding P4* (swirl number), while it is not statistically significant for the PRT (R-1), it does contribute to reducing the moisture content ( X wb , p ) of the particles by enhancing the mixing rate and accelerating the drying process. This is reflected in R-0, where higher P4* values correspond to lower outlet gas temperatures and increased moisture contents.
When comparing the bulk-based results (R-2.1.1) with the particle-based analysis (R-2.2), the trends are largely consistent. However, the particle-based approach yields substantially lower moisture content. This occurs because particle-based statistics do not account for mass, and while they provide insight into individual particle characteristics, they are not suitable for determining the bulk properties of the final product. The separate analysis of small and large particles (R-2.3) reveals a notable disparity: larger particles exhibit significantly higher moisture content compared to smaller ones. This difference is not solely due to the particle residence time (PRT), as shown in R-1.3 at the outlet, where both cases have similar residence times. Instead, it is primarily attributed to the lower surface-area-to-volume ratio of larger particles, which means they require more time to dry under similar process conditions [40].
Particle Moisture Content at the Walls
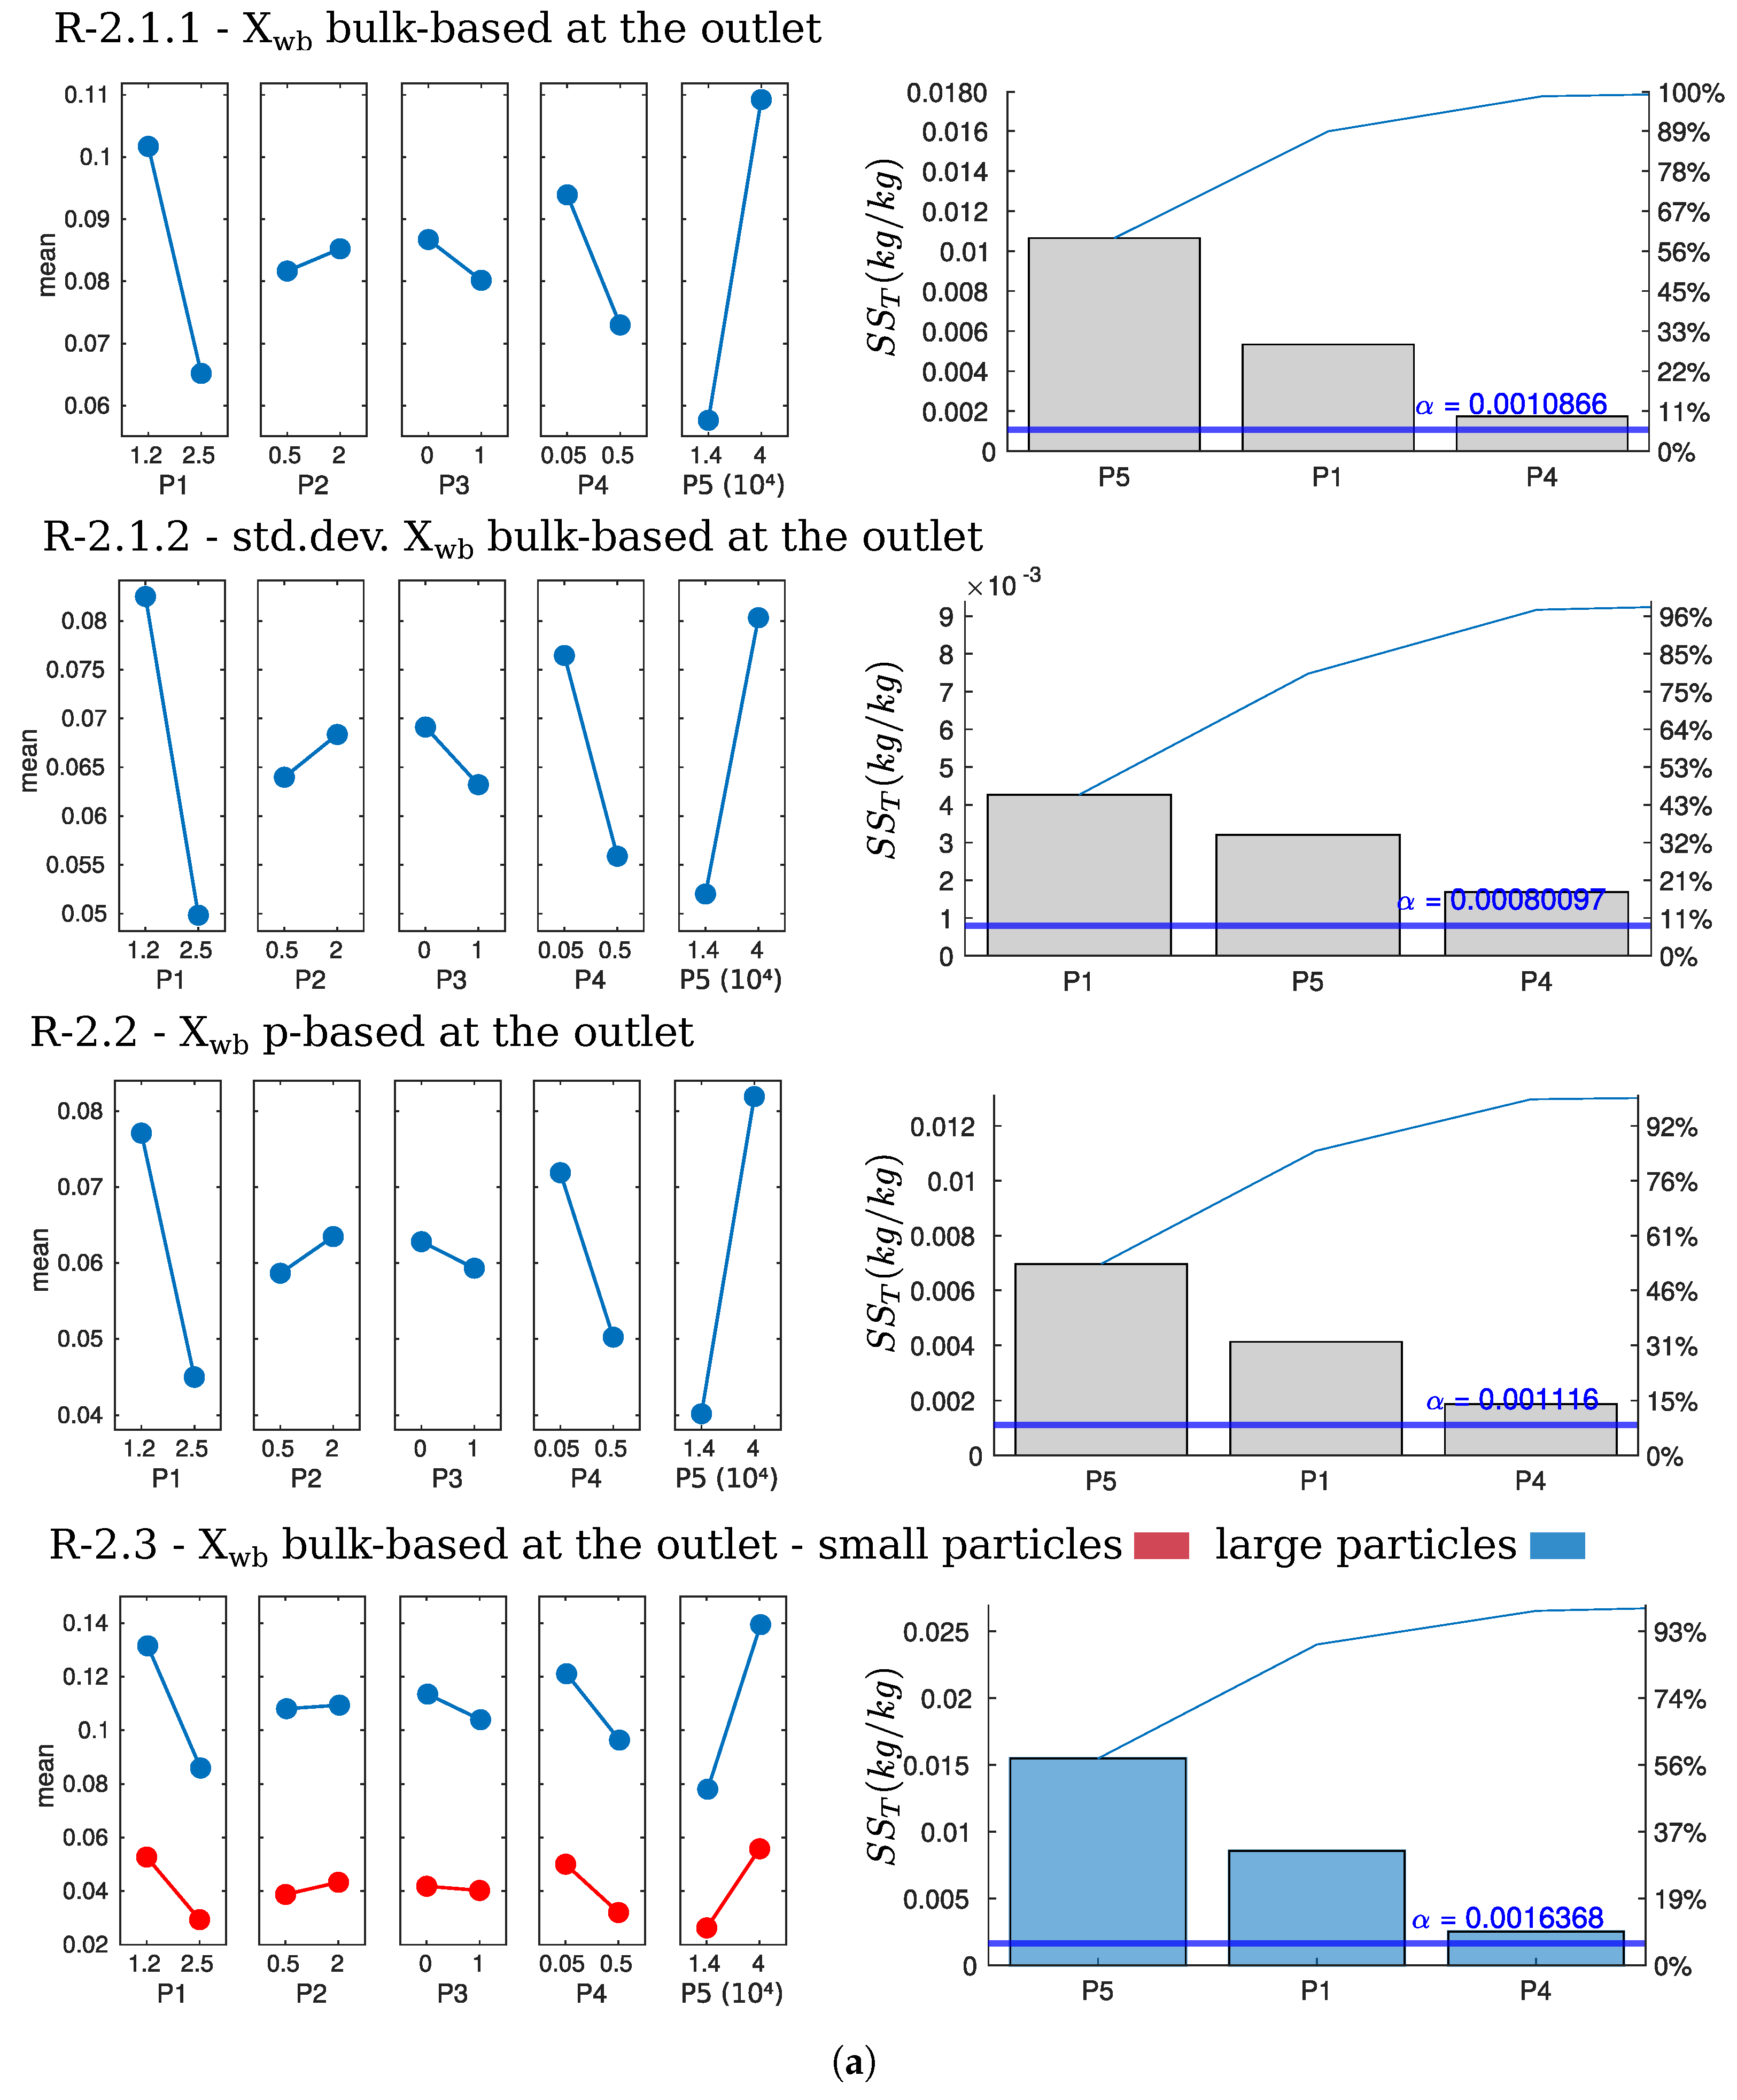
Figure 8b displays the moisture content of particles impacting the chamber walls. In general, the trends and directions of these responses are consistent with those observed at the outlet (Figure 8a). However, the effect of P4* (swirl number) on some responses falls below the threshold for statistical significance. This is attributed to the higher particle residence times (PRT) for particles that impact the walls, resulting in longer drying periods. As a result, the influence of increased mixing within the central jet becomes less statistically significant for these particles. The higher PRT values contribute to a reduction in moisture content, typically ranging from approximately 0.015 to 0.02 kg/kg ( X wb , p ). This reduction is observed consistently across different particle sizes (R-2.3).
Figure 8. ANOVA analysis of the influence of factor parameters on R-2 (Particle wet-basis humidity). Left column: main effects plot; right column: Pareto chart of the standardized main effects. The horizontal line defines the 95% confidence interval ( p = 0.05 ). The value of α represents the threshold value in the response variable for this confidence interval. S S T represents the sum of the squares. (a) Particle moisture content responses (kg/kg) at the outlet of the drying chamber. (b) Particle moisture content responses (kg/kg) at the walls of the drying chamber.
Chemengineering 09 00121 g008aChemengineering 09 00121 g008b
Discussion on Particle Moisture Content
The results for moisture content ( X wb , p ) emphasize its consistent relationship with particle residence times (R-1), reinforcing the importance of managing PRTs to control moisture levels. Controlling particle size is particularly important for thermally sensitive products and high-quality powders, as larger particles tend to retain significantly higher moisture content than smaller ones. Large particles with elevated moisture content can increase the likelihood of agglomeration [45] and wall fouling. The subsequent analysis of particle temperature and impact statistics further explores these implications.

5.4.4. Particle Temperature

Figure 9 illustrates the influence of the different parameters on the mass-based particle temperatures at the outlet and walls. Particle-based statistics are omitted, as they closely mirror the mass-based results. Overall, the measured particle temperatures closely follow the outlet gas temperatures. At the outlet, P5* and P1* are the only statistically significant parameters, with P5* producing a consistent effect and P1* exhibiting an opposite trend. Increasing P1* does not raise particle temperatures, despite longer residence times in the chamber (as shown in R-1). Instead, it enhances evaporation, which reduces outlet gas temperatures, as observed for R-0 and R-2.
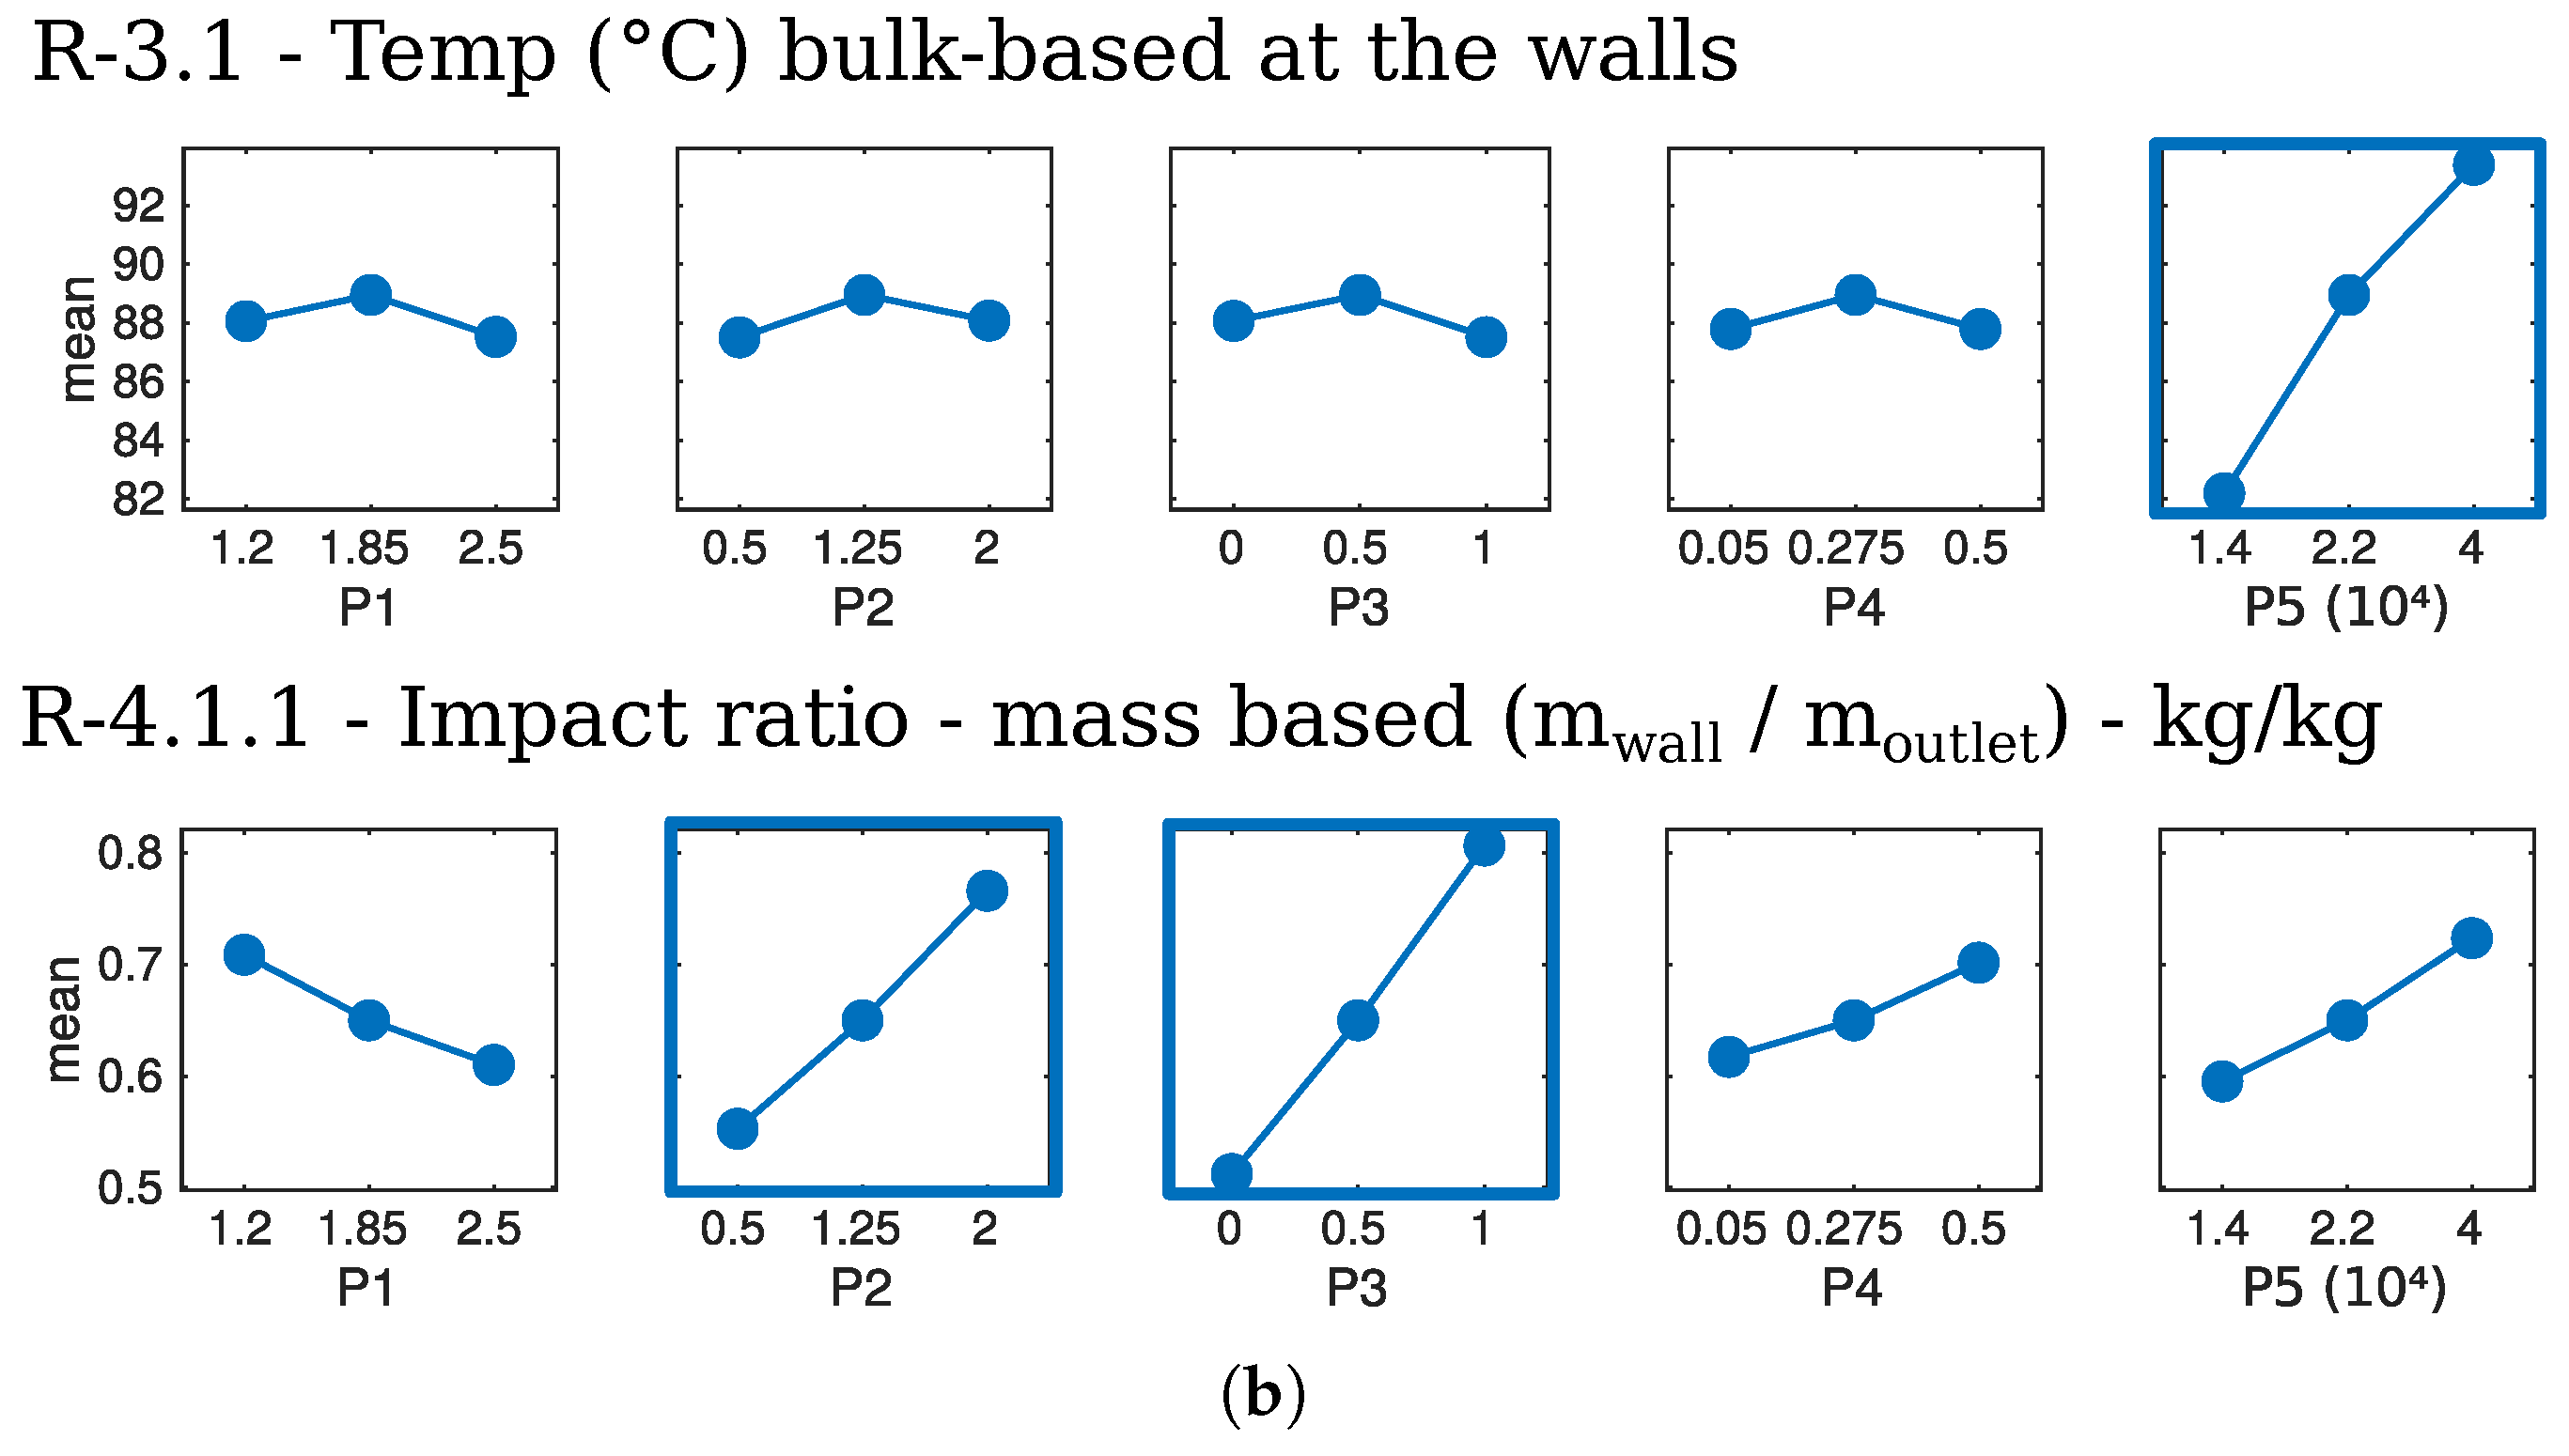
Conversely, P5* demonstrates an inverse relationship: higher values decrease PRTs (R-1), limit particle evaporation (increasing R-2), and raise both outlet gas (R-0) and particle temperatures. For particle-wall impacts, P5* emerges as the only statistically significant parameter, resulting in an approximate 11 °C difference in mean particle temperature across its range. This variation is substantial and, depending on the feed product, can affect the glass transition temperature and promote accumulation on the chamber walls.
Figure 9. ANOVA analysis of the influence of factor parameters on R-3 (Particle temperature). Left column: main effects plot; right column: Pareto chart of the standardized main effects. The horizontal line defines the 95% confidence interval ( p = 0.05 ). The value of α represents the threshold value in the response variable for this confidence interval. S S T represents the sum of the squares.
Chemengineering 09 00121 g009

5.4.5. Particle-Wall Impacts (R-4)

Impact Ratio (R-4.1)—Walls vs. Outlet
Figure 10 presents the results for various studied particle-impact related responses. For the impact ratio (R-4.1), responses P3* (curvature) and P2* (conical-to-cylindrical section size ratio) are statistically significant, while P5* and P1* are considered weak factors. Increasing P2*, P3*, and P5* increases the mass of particles impacting the walls, whereas, for P1*, the response follows an opposite trend. The response associated with P3* contradicts the initial expectation derived from Keshani et al. [8], where a parabolic bottom was argued to stabilize near-wall flow and thus reduce wall impacts. However, because that study did not explicitly resolve particle trajectories, it is plausible that additional transport mechanisms govern particle accumulation when Lagrangian particle histories are considered.
A plausible explanation, consistent with the previously reported flow-field results [1], is that P2* and P3* modulate the formation of the recirculation region by altering the available radial clearance and the axial location at which the jet turns. These geometric effects shift the impingement point and weaken near-wall recirculating velocities, thereby modifying jet deflection and promoting particle deposition. This interpretation aligns with the axial impact position (R-4.2) and the impact ratio (R-4.3), where the same geometric dependencies are observed and further discussed.
Impact Position (R-4.2)
The mean impact position in the axial direction, R-4.2.1 ( x / H ), is influenced by several parameters that statistically affect the response. P2* and P3* contribute to a shift in the same direction, while P1* and P4* have the opposite effect. The average impact position is approximately x / H 0.62 , which is lower than the mean position of the maximum recirculation flow in the axial direction, around x / H 0.42 , as presented in the previous study [1]. This suggests that particle impacts are likely influenced by the initial shape and stability of the recirculation vortex. The standard deviation of the mean impact position, R-4.2.2 ( x / H ), further supports this observation, with an average value close to x / H 0.31 . Therefore, most impacts appear to occur at the same axial position where the jet changes direction and generates the recirculation zone.
Impact Ratio (R-4.3)—Conical vs. Cylindrical Section
The impact ratio between the cylindrical and conical sections of the chamber ( m cyl / m cone ) is influenced by several parameters (P1*, P2*, P4*, P5*), which either meet or approach statistical significance. In these cases, the response follows the trend of the corresponding parameter. For P4*, a higher swirl number leads to more impacts in the cylindrical section, as increased swirl strength accelerates jet decay and promotes earlier formation of the recirculation region. For P2*, the shift towards the cylindrical section is directly related to its increased size. Similarly, for P1*, taller chambers (higher P1*) feature a longer cylindrical section, which results in a greater number of impacts. Although increasing P1* also reduces jet decay—delaying the formation of the recirculation region—this effect is not proportional to the enlargement of the conical section.
Discussion on Particle-Wall Impacts
The results of particle impact statistics (R-4) highlight the importance of analyzing and studying these statistics together with the other response variables examined. In particular, geometric design parameters (P2* and P3*), which have discrete effects on other response variables (R-1, R-2 and R-3), emerge as the most relevant. On average, across all parameter configurations, it is found that approximately 40% of the atomized product impacts the walls at least once, contributing significantly to the overall product quality. This result is comparable to the 45–50% predicted by Huang et al. [44] and to the 34–38% reported in Woo et al. [22]. Notably, the mean residence time of particles hitting the walls is generally higher than that of particles leaving through the outlet. This suggests that for practical purposes, there would likely be substantial differences in PRTs and, consequently, in other responses related to product quality and thermal degradation. Moreover, these differences would be further accentuated if fouling (particle accumulation over the walls) was considered.
Figure 10. ANOVA analysis of the influence of factor parameters on the particle-wall impact statistics (R-4). Left column: main effects plot; right column: Pareto chart of the standardized main effects. The horizontal blue line defines the 95% confidence interval ( p = 0.05 ). The value of α represents the threshold value in the response variable for this confidence interval. S S T represents the sum of the squares.
Chemengineering 09 00121 g010

5.5. Curvature in the Response

Figure 11 presents the main effect plots for some of the most representative responses in an experiment with midpoint parameter values (Experiment 17). This allows observing a curvature behavior in the response. Parameters previously found to be statistically significant are highlighted within a blue box.
For all statistically significant parameters, the response at the midpoint falls within the ranges of the maximum and minimum responses. This observation suggests that no abnormal or distinct behaviors lead to entirely different responses within the established parameter ranges. These findings further support the previously discussed parameter-response relationship. Moreover, for most responses, it is observed that most of the individual responses can be approximated through a linear function. Keeping the fixed parameters constant makes it possible to obtain approximate responses for any given design point possible.
Figure 11. Main effects plot including center point results (Experiment 17) for some of the responses. Statistically significant parameters are highlighted within a thick blue box. (a) Responses R-0 to R-2. (b) Responses R-3 and R-4.
Chemengineering 09 00121 g011aChemengineering 09 00121 g011b

5.6. Possible Effects on Particle Accumulation in Walls

As discussed earlier, secondary particle residence times, which govern wall deposition and detachment, were not directly studied. However, by analyzing the impact ratio (R-4.1.1) alongside other response variables (R-2.1 and R-3.1), the combined effect of the studied parameters on the glass transition of wall-impacting particles and their deposition behavior can be inferred. The results indicate that higher P2* and P3* values increase the number of particle-to-wall impacts but do not necessarily enhance the likelihood of wall deposition. This is because P2* and P3* have minimal effect on the humidity and temperature of wall-impacting particles, leaving the glass transition temperature ( t g ) unchanged. In contrast, increasing P5* not only increases the number of wall impacts (R-4.1) but also raises the moisture and temperature of wall-impacting particles (R-2.1.1, R-3.1). Since higher moisture reduces the glass transition temperature, increasing P5* should enhance the probability of wall-impacting particles remaining attached. Practically, this suggests that processing larger product quantities while maintaining a constant ARL may not always be optimal.
The effect of P1* on wall deposition is more complex. Results indicate that as P1* increases (taller chambers), the humidity of wall-impacting particles decreases (R-2.1.1). With constant particle temperature (R-3.1), this would increase the glass transition temperature, lowering the likelihood of wall deposition. However, two additional behaviors must be considered. First, particle moisture (R-2.1) shows a concave upward response (see Figure 11), indicating a more pronounced decrease at the midpoint and less at higher P1* values. Second, increasing P1* is constrained by the use of a rotary atomizer. The radial and tangential velocity components of atomized particles cause them to impact the walls if the chamber is too narrow (very high P1*) or if atomizer RPMs are too high. In this study, both RPM values and the upper limit of P1* were controlled to exclude this behavior, as it could cause abrupt changes in particle-wall impacts.

6. Conclusions

This study applied a cost-effective computational fluid dynamics (CFD) methodology, combined with a design of experiments (DOE) framework, to investigate the influence of geometrical design parameters on particle histories in spray drying. By explicitly incorporating the particle phase into the modeling framework, it provides the first systematic parametric assessment of geometry–particle interactions in CFD simulations of spray drying chambers.
In addition to the specific results, this study provides a methodological framework that can be replicated in future studies to explore different scenarios in spray drying. In particular, it enables scale-up analyses, such as evaluating the transition from pilot-scale to industrial-size equipment, as well as the systematic assessment of novel chamber designs and operating configurations. Furthermore, the methodology can be applied to similar industrial processes involving complex multiphase flows with heat and mass transfer, such as spray freeze drying.
The specific results show that all studied parameters significantly influence particle histories, although their effects vary depending on the response variable. Two distinct behaviors were identified. Particle residence time (R-1), moisture content (R-2), and wall temperature (R-3) were primarily governed by P1 (the width-to-height ratio of the chamber) and P5* (the Reynolds number of the jet at discharge). P1* represents a geometrical parameter, while P5* corresponds to an operational parameter related to the fill time ( t f ). In contrast, particle-to-wall impact statistics (R-4) were dominated by shape-related parameters (P2*, P3*), which exerted only a minor influence on the airflow responses examined in the companion paper.
Regarding P4 (swirl number), previous studies have identified this parameter as one of the most influential on flow-related responses. In the present parametric study it was not as dominant for the particle history responses examined. Higher P4* values enhanced mixing and improved drying efficiency by reducing particle moisture and outlet air temperature, but its effect consistently ranked secondary to other statistically significant parameters. Overall, increasing P4* can be considered beneficial for spray-drying processes within the investigated ranges ( S n 0.5 ), as it improves drying without inducing a substantial increase in particle–wall impacts. However, previous studies [58,59] have reported that excessive swirl values ( S n > 0.5 ), or the use of alternative atomization systems such as nozzle atomizers, may lead to adverse effects. Therefore, increases in this parameter should be carefully evaluated in relation to operating conditions.
The introduction of a curvature factor reduced uncertainties regarding responses at intermediate parameter values in this study. Consequently, several parameter-response relationships were identified, which can be reasonably approximated by linear functions for spray dryer designs with similar configurations. Utilizing these functions is expected to aid in designing new spray dryers and enhance understanding of the coupled phenomena governing particle transport and drying.

Author Contributions

Conceptualization, J.A.G.S. and C.H.G.U.; Methodology J.A.G.S., A.G.M. and C.H.G.U.; Resources, A.G.M.; Supervision, A.G.M. and C.H.G.U.; Software, J.A.G.S. and C.H.G.U.; Validation J.A.G.S.; Writing, J.A.G.S., A.G.M. and C.H.G.U.; Review & Editing, A.G.M. and C.H.G.U. All authors have read and agreed to the published version of the manuscript.

Funding

J.A. Gutiérrez acknowledges PhD Scholarship from COLCIENCIAS (PDBCNal, COLDOC—Convocatoria 647).

Data Availability Statement

The raw data supporting the conclusions of this article, including results from the statistical analysis and the OpenFOAM solver, will be made available by the authors upon reasonable request.

Acknowledgments

The authors wish to thank the CTTC—Centre Tecnològic de Transferència de Calor—Universitat Politècnica de Catalunya and Assensi Oliva, for their support in economic, computational, and physical resources for the initial development of this study.

Conflicts of Interest

The authors declare no conflict of interest.

References

  1. Gutiérrez Suárez, J.A.; Galeano Urueña, C.H.; Gómez Mejía, A. Parametric CFD Study of Spray Drying Chamber Geometry: Part I—Effects on Airflow Dynamics. ChemEngineering 2025, 9, 5. [Google Scholar] [CrossRef]
  2. Anandharamakrishnan, C.; Gimbun, J.; Stapley, A.G.F.; Rielly, C.D. A study of particle histories during spray drying using computational fluid dynamic simulations. Dry. Technol. 2010, 28, 566–576. [Google Scholar] [CrossRef]
  3. Woo, M.; Che, L.; Daud, W.R.W.; Mujumdar, A.; Chen, X. Highly swirling transient flows in spray dryers and consequent effect on modeling of particle deposition. Chem. Eng. Res. Des. 2012, 90, 336–345. [Google Scholar] [CrossRef]
  4. Pawar, S.K.; Abrahams, R.H.; Deen, N.G.; Padding, J.T.; van der Gulik, G.J.; Jongsma, A.; Innings, F.; Kuipers, J. An experimental study of dynamic jet behaviour in a scaled cold flow spray dryer model using PIV. Can. J. Chem. Eng. 2014, 92, 2013–2020. [Google Scholar] [CrossRef]
  5. Fletcher, D.; Langrish, T. Scale-adaptive simulation (SAS) modelling of a pilot-scale spray dryer. Chem. Eng. Res. Des. 2009, 87, 1371–1378. [Google Scholar] [CrossRef]
  6. Langrish, T.; Zbicinski, I. The effects of air inlet geometry and spray cone angle on the wall deposition rate in spray dryers. Chem. Eng. Res. Des. 1994, 72, 420–430. [Google Scholar]
  7. Huang, L.; Kumar, K.; Mujumdar, A. Use of computational fluid dynamics to evaluate alternative spray dryer chamber configurations. Dry. Technol. 2003, 21, 385–412. [Google Scholar] [CrossRef]
  8. Keshani, S.; Montazeri, M.H.; Daud, W.R.W.; Nourouzi, M.M. CFD modeling of air flow on wall deposition in different spray dryer geometries. Dry. Technol. 2015, 33, 784–795. [Google Scholar] [CrossRef]
  9. Rhew, R.D.; Parker, P.A. A parametric geometry computational fluid dynamics (CFD) study utilizing design of experiments (DOE). Am. Insitute Aeronaut. Astronaut. (AIAA) 2007, 1615, 2007. [Google Scholar]
  10. Fletcher, D.; Guo, B.; Harvie, D.; Langrish, T.; Nijdam, J.; Williams, J. What is important in the simulation of spray dryer performance and how do current CFD models perform? Appl. Math. Model. 2006, 30, 1281–1292. [Google Scholar] [CrossRef]
  11. Woo, M.W.; Huang, L.X.; Mujumdar, A.S.; Daud, W.R.W. CFD Simulation of Spray Dryers; Volume 1; National University of Singapore: Singapore, 2010; Chapter 1; pp. 1–36. Available online: https://www.yumpu.com/en/document/view/32880341/spray-drying-technologypdf-national-university-of-singapore (accessed on 19 October 2025).
  12. Sommerfeld, M. Modelling requirements for CFD calculations of spray dryers. In Proceedings of the Jornada em Escoamentos Multifásicos 2015, Campinas, Brazil, 23–27 March 2015. [Google Scholar]
  13. Yoon, S.S. Lagrangian-based stochastic dilute spray modelling for drying applications. In Spray Drying Technology, Volume 1; Woo, M.W., Mujumdar, A.S., Daud, W.R.W., Eds.; World Scientific Publishing: Singapore, 2010; pp. 77–112. ISBN 978-981-08-6270-1. [Google Scholar]
  14. Woo, M.W.; Daud, W.R.W.; Mujumdar, A.S.; Talib, M.Z.M.; Hua, W.Z.; Tasirin, S.M. Comparative study of droplet drying models for CFD modelling. Chem. Eng. Res. Des. 2008, 86, 1038–1048. [Google Scholar] [CrossRef]
  15. Apte, S.V.; Mahesh, K.; Moin, P.; Oefelein, J.C. Large-eddy simulation of swirling particle-laden flows in a coaxial-jet combustor. Int. J. Multiph. Flow 2003, 29, 1311–1331. [Google Scholar] [CrossRef]
  16. Woo, M.W. Computational Fluid Dynamics Simulation of Spray Dryers: An Engineer’s Guide; CRC Press: Boca Raton, FL, USA, 2016. [Google Scholar]
  17. Ebrahim Zadeh, S. Extensive Study of the Interaction of a Hot Air Plume with a Water Spray by Means of CFD Simulations. Ph.D. Thesis, Ghent University, Ghent, Belgium, 2016. [Google Scholar]
  18. Iannantuoni, L.; Ettorre, D.; Manzini, G.; Araneo, L. Validation and assessment of a water mist multi-hole nozzle model for fire simulations. Fire Technol. 2014, 50, 505–524. [Google Scholar] [CrossRef]
  19. Chen, X.; Xie, G. Fingerprints of the drying behaviour of particulate or thin layer food materials established using a reaction engineering model. Food Bioprod. Process. 1997, 75, 213–222. [Google Scholar] [CrossRef]
  20. Cubillos Varela, A. Modelación del Proceso de Deshidratación por Espray de Jugo de Guayaba. Ph.D. Thesis, Universidad Nacional de Colombia (UNAL), Bogota, Colombia, 2017. [Google Scholar]
  21. Huang, L.; Kumar, K.; Mujumdar, A. A comparative study of a spray dryer with rotary disc atomizer and pressure nozzle using computational fluid dynamic simulations. Chem. Eng. Process. Process Intensif. 2006, 45, 461–470. [Google Scholar] [CrossRef]
  22. Woo, M.; Daud, W.; Mujumdar, A.; Wu, Z.; Meor Talib, M.; Tasirin, S. CFD evaluation of droplet drying models in a spray dryer fitted with a rotary atomizer. Dry. Technol. 2008, 26, 1180–1198. [Google Scholar] [CrossRef]
  23. Gutiérrez Suárez, J.A.; Galeano-Urueña, C.H.; Gómez-Mejía, A. Low-Cost Eddy-Resolving Simulation in the Near-Field of an Annular Swirling Jet for Spray Drying Applications. ChemEngineering 2021, 5, 80. [Google Scholar] [CrossRef]
  24. Gutiérrez Suárez, J.A.; Galeano-Urueña, C.H.; Gómez-Mejía, A. Adaptive Mesh Refinement Strategies for Cost-Effective Eddy-Resolving Transient Simulations of Spray Dryers. ChemEngineering 2023, 7, 100. [Google Scholar] [CrossRef]
  25. Coleman, D.E.; Montgomery, D.C. A systematic approach to planning for a designed industrial experiment. Technometrics 1993, 35, 1–12. [Google Scholar]
  26. Gutiérrez Suárez, J.A. Modelación CFD y Validación Experimental del Proceso de Evaporación de Agua en un Secador por Aspersión. Master’s Thesis, Universidad Nacional de Colombia, Bogota, Colombia, 2015. [Google Scholar]
  27. Sidlagatta, V.; Chilukuri, S.V.V.; Devana, B.R.; Dasi, S.D.; Rangaswamy, L. Effect of maltodextrin concentration and inlet air temperature on properties of spray dried powder from reverse osmosis concentrated sweet orange juice. Braz. Arch. Biol. Technol. 2020, 63, e20190538. [Google Scholar] [CrossRef]
  28. Adhikari, B.; Howes, T.; Bhandari, B.R.; Troung, V. Effect of addition of maltodextrin on drying kinetics and stickiness of sugar and acid-rich foods during convective drying: Experiments and modelling. J. Food Eng. 2004, 62, 53–68. [Google Scholar] [CrossRef]
  29. Patel, K.C.; Chen, X.D.; Lin, S.X.; Adhikari, B. A composite reaction engineering approach to drying of aqueous droplets containing sucrose, maltodextrin (DE6) and their mixtures. AIChE J. 2009, 55, 217–231. [Google Scholar] [CrossRef]
  30. Gianfrancesco, A. Spray Drying Engineering: Particle Stickiness in Relation with Agglomeration. Ph.D. Thesis, AgroParisTech, Paris, France, 2009. [Google Scholar]
  31. Kieviet, F.; Kerkhof, P. Air flow, temperature and humidity patterns in a co-current spray dryer: Modelling and measurements. Dry. Technol. 1997, 15, 1763–1773. [Google Scholar] [CrossRef]
  32. Huang, L.; Kumar, K.; Mujumdar, A. Simulation of a spray dryer fitted with a rotary disk atomizer using a three-dimensional computional fluid dynamic model. Dry. Technol. 2004, 22, 1489–1515. [Google Scholar] [CrossRef]
  33. Benavides-Morán, A.; Cubillos, A.; Gómez, A. Spray drying experiments and CFD simulation of guava juice formulation. Dry. Technol. 2020, 39, 450–465. [Google Scholar] [CrossRef]
  34. Masters, K. Spray Drying Handbook; Longman Scientific & Technical: London, UK, 1991; ISBN 978-0-470-21743-6. [Google Scholar]
  35. Phisut, N. Spray drying technique of fruit juice powder: Some factors influencing the properties of product. Int. Food Res. J. 2012, 19, 1297–1306. [Google Scholar]
  36. Huang, L.; Mujumdar, A. The effect of rotary disk atomizer RPM on particle size distribution in a semi-industrial spray dryer. Dry. Technol. 2008, 26, 1319–1325. [Google Scholar] [CrossRef]
  37. Kieviet, F. Modelling Quality in Spray Drying. Ph.D. Thesis, Eindhoven University of Technology, Eindhoven, The Netherlands, 1997. [Google Scholar]
  38. Schmitz-Schug, I.; Foerst, P.; Kulozik, U. Impact of the spray drying conditions and residence time distribution on lysine loss in spray dried infant formula. Dairy Sci. Technol. 2013, 93, 443–462. [Google Scholar] [CrossRef]
  39. Li, H.; Kuschel, M.; Sommerfeld, M. Experimental investigation and modeling of coalescence and agglomeration for spray drying of solutions. In Process-Spray: Functional Particles Produced in Spray Processes; Springer: Berlin/Heidelberg, Germany, 2016; pp. 205–233. [Google Scholar]
  40. Eijkelboom, N.M.; van Boven, A.P.; Siemons, I.; Wilms, P.F.; Boom, R.M.; Kohlus, R.; Schutyser, M.A. Particle structure development during spray drying from a single droplet to pilot-scale perspective. J. Food Eng. 2022, 337, 111222. [Google Scholar] [CrossRef]
  41. Anandharamakrishnan, C.; Ishwarya, P. Spray Drying Techniques for Food Ingredient Encapsulation; Wiley: Hoboken, NJ, USA, 2015. [Google Scholar]
  42. Keshani, S.; Daud, W.R.W.; Nourouzi, M.; Namvar, F.; Ghasemi, M. Spray drying: An overview on wall deposition, process and modeling. J. Food Eng. 2015, 146, 152–162. [Google Scholar] [CrossRef]
  43. Gianfrancesco, A.; Turchiuli, C.; Flick, D.; Dumoulin, E. CFD modeling and simulation of maltodextrin solutions spray drying to control stickiness. Food Bioprocess Technol. 2010, 3, 946–955. [Google Scholar] [CrossRef]
  44. Huang, L.; Kumar, K.; Mujumdar, A. A parametric study of the gas flow patterns and drying performance of co-current spray dryer: Results of a computational fluid dynamics study. Dry. Technol. 2003, 21, 957–978. [Google Scholar] [CrossRef]
  45. Gianfrancesco, A.; Turchiuli, C.; Dumoulin, E. Powder agglomeration during the spray-drying process: Measurements of air properties. Dairy Sci. Technol. 2008, 88, 53–64. [Google Scholar] [CrossRef]
  46. Sánchez-Rocha, M.; Menon, S. The compressible hybrid RANS/LES formulation using an additive operator. J. Comput. Phys. 2009, 228, 2037–2062. [Google Scholar] [CrossRef]
  47. Germano, M. On the Hybrid RANS-LES of Compressible Flows. In Progress in Hybrid RANS-LES Modelling; Springer: Berlin/Heidelberg, Germany, 2015; pp. 253–263. [Google Scholar]
  48. Chase, M.W. NIST-JANAF Thermochemical Tables 4th ed. J. Phys. Chem. Reffernce Data 1998, 1529–1564. [Google Scholar]
  49. Jubaer, H.; Afshar, S.; Xiao, J.; Chen, X.D.; Selomulya, C.; Woo, M.W. On the importance of droplet shrinkage in CFD-modeling of spray drying. Dry. Technol. 2018, 36, 1785–1801. [Google Scholar] [CrossRef]
  50. Schiller, L. A drag coefficient correlation. Zeit. Ver. Deutsch. Ing. 1933, 77, 318–320. [Google Scholar]
  51. Chen, X.D.; Lin, S.X.Q. Air drying of milk droplet under constant and time-dependent conditions. AIChE J. 2005, 51, 1790–1799. [Google Scholar] [CrossRef]
  52. Lin, S.X.Q.; Chen, X.D. A model for drying of an aqueous lactose droplet using the reaction engineering approach. Dry. Technol. 2006, 24, 1329–1334. [Google Scholar] [CrossRef]
  53. Travin, A.; Shur, M.; Strelets, M.; Spalart, P. Physical and numerical upgrades in the detached-eddy simulation of complex turbulent flows. In Advances in LES of Complex Flows; Springer: Berlin/Heidelberg, Germany, 2002; pp. 239–254. [Google Scholar] [CrossRef]
  54. Moukalled, F.; Mangani, L.; Darwish, M. Temporal Discretization: The Transient Term. In The Finite Volume Method in Computational Fluid Dynamics; Springer: Berlin/Heidelberg, Germany, 2016; pp. 489–533. [Google Scholar] [CrossRef]
  55. Mozaffari, S.; Visonneau, M.; Wackers, J. Average-based Adaptive Grid Refinement in Hybrid LES. Direct Large Eddy Simul. XII 2020, 27, 449. [Google Scholar]
  56. Yoon, S.; Hewson, J.; DesJardin, P.; Glaze, D.; Black, A.; Skaggs, R. Numerical modeling and experimental measurements of a high speed solid-cone water spray for use in fire suppression applications. Int. J. Multiph. Flow 2004, 30, 1369–1388. [Google Scholar] [CrossRef]
  57. Westergaard, V. Milk Powder Technology: Evaporation and Spray Drying; Niro A/S: Copenhagen, Denmark, 2004; ISBN 87-981972-1-3. [Google Scholar]
  58. Lebarbier, C.; Kockel, T.; Fletcher, D.; Langrish, T. Experimental measurement and numerical simulation of the effect of swirl on flow stability in spray dryers. Chem. Eng. Res. Des. 2001, 79, 260–268. [Google Scholar] [CrossRef]
  59. Langrish, T.; Williams, J.; Fletcher, D. Simulation of the effects of inlet swirl on gas flow patterns in a pilot-scale spray dryer. Chem. Eng. Res. Des. 2004, 82, 821–833. [Google Scholar] [CrossRef]
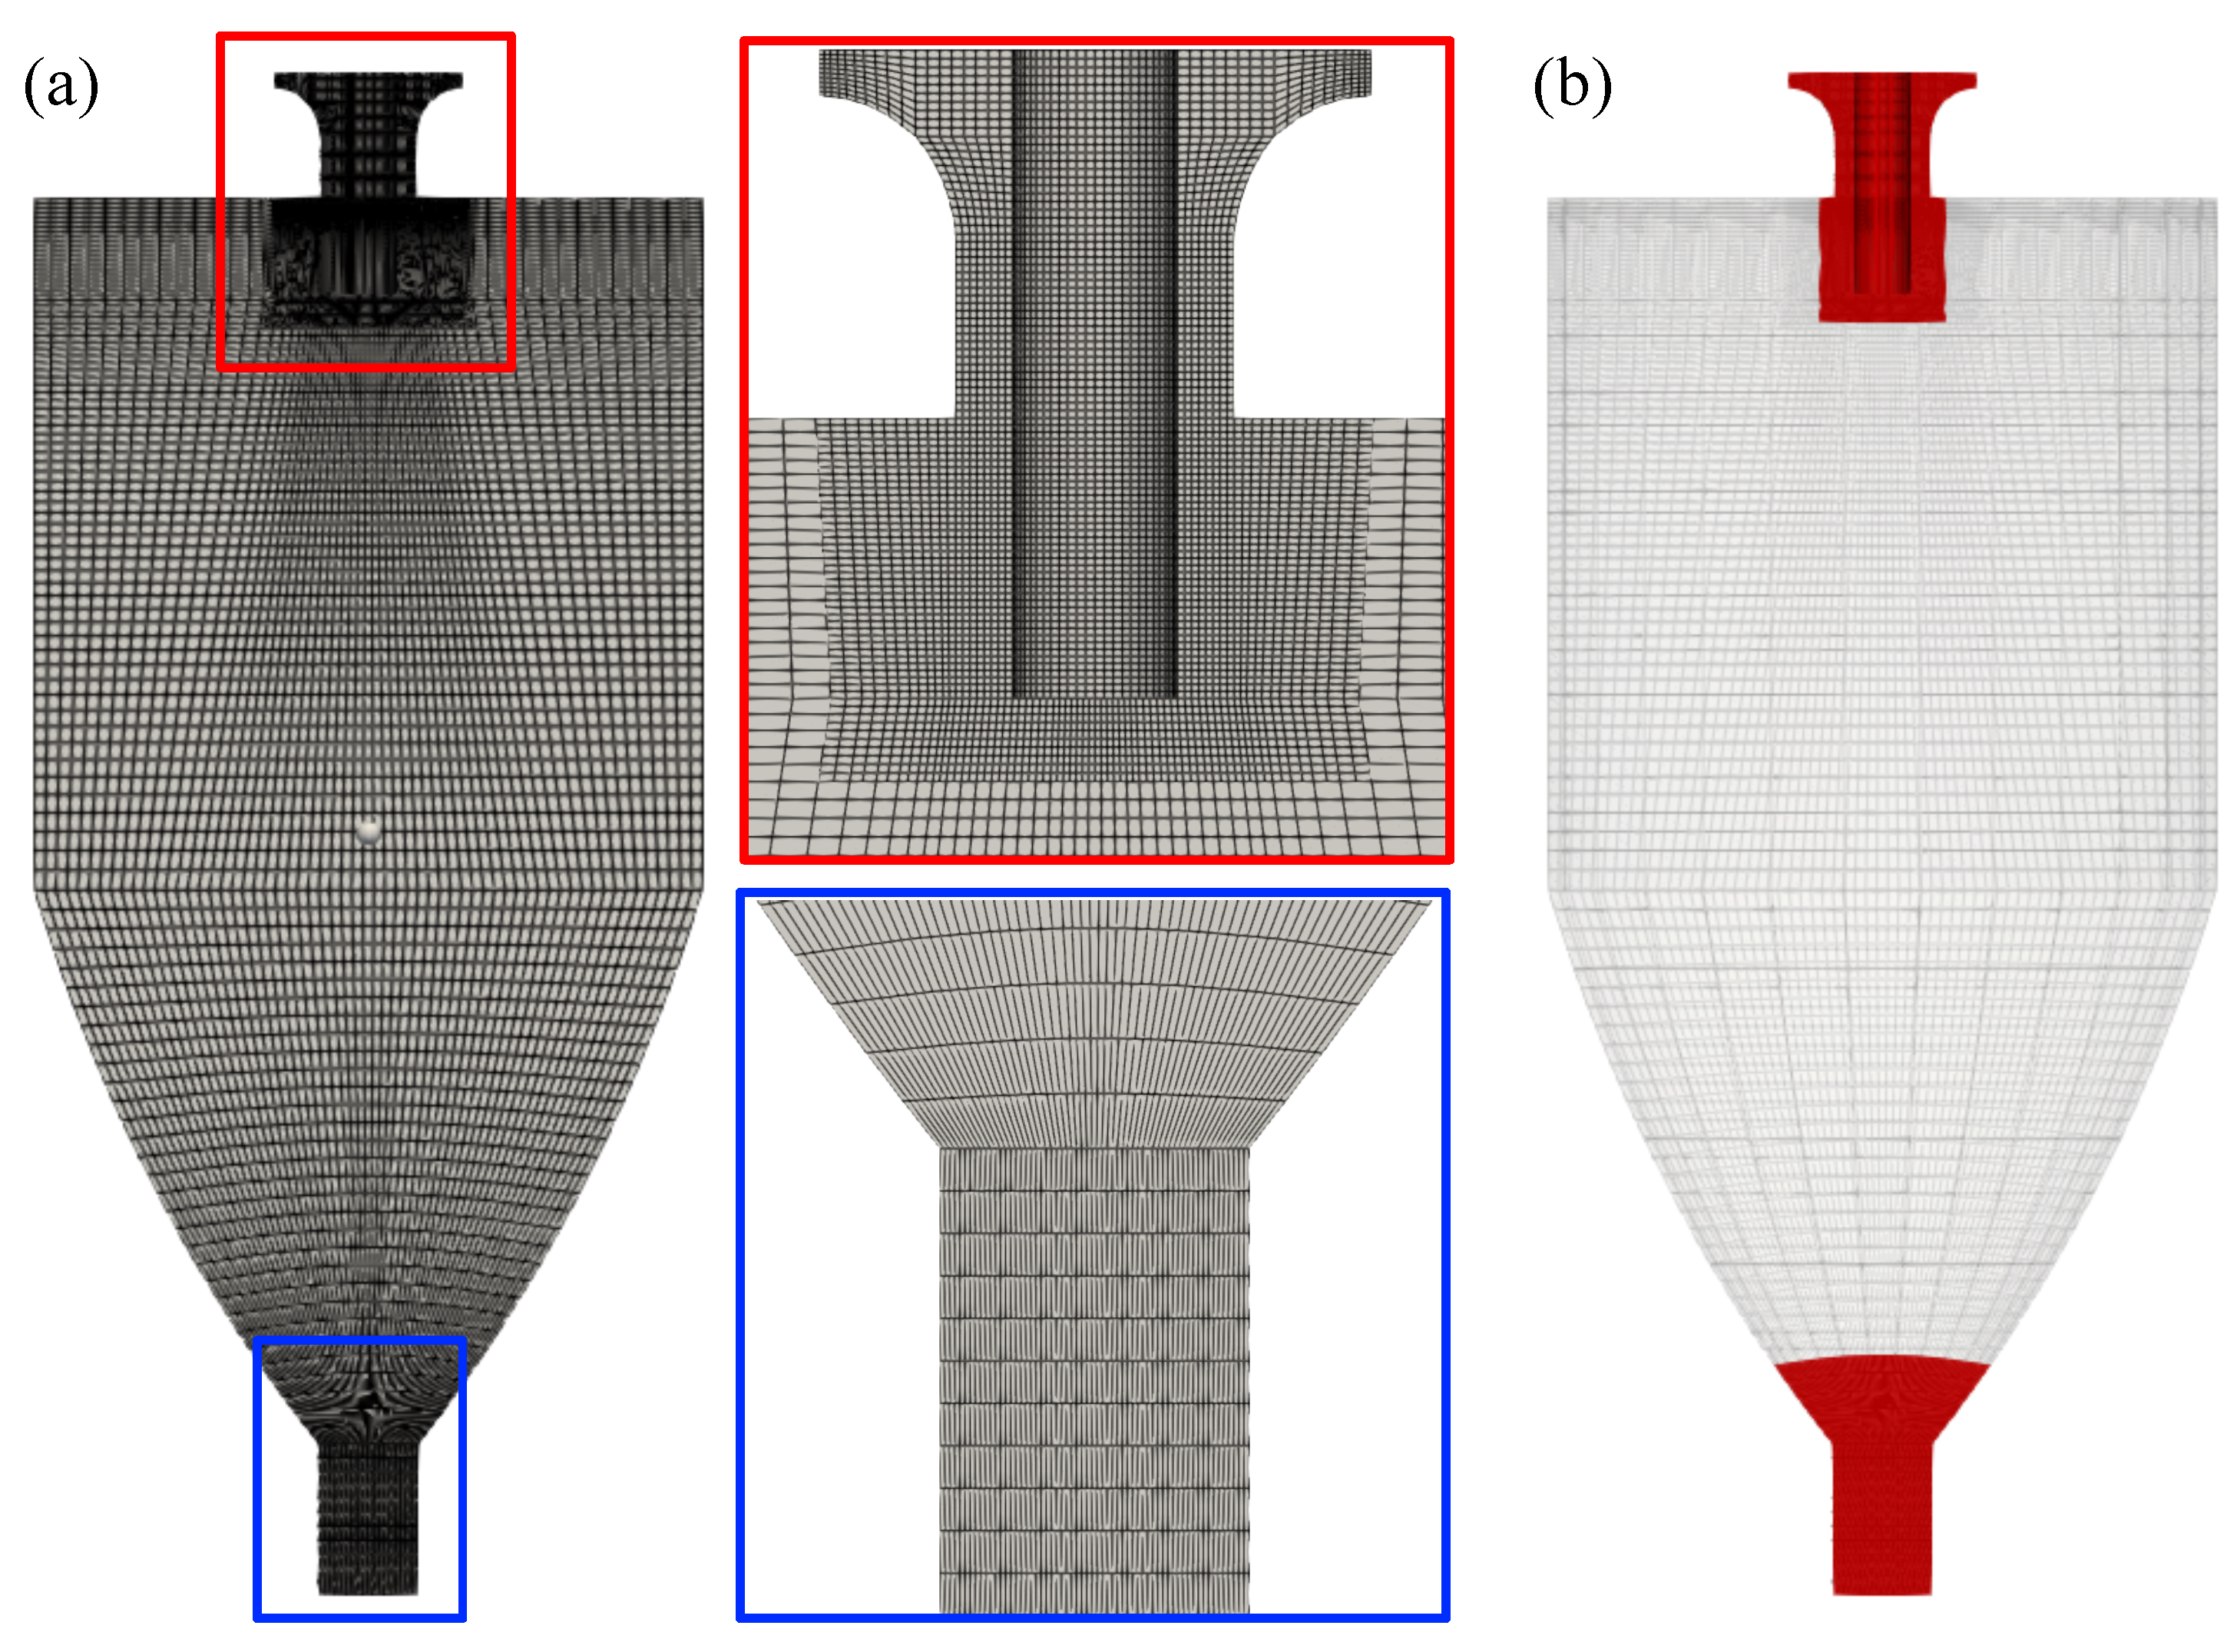
Figure 2. Base grid and protected areas for Experiment 17. (a) Base grid, including details of the jet discharge zone (red box) and the outlet duct (blue box). The pre-refinement performed in the discharge zone is evident; (b) Zones protected from refinement (highlighted in red), representing the pre-refined jet discharge and the outlet duct regions.
Chemengineering 09 00121 g002
Figure 3. Validation of the REA drying model: (a) Computational domain and inlet conditions of the drying air; (b,c), Comparison of the results using the REA models for Maltodextrin droplets presented by Patel et al. [29] and by Woo et al. [14], including the experimental measurements of Adhikari et al. [28]; (d) Effect of the grid on the drying kinetics within the first 300 s; (e) Effect of the shrinkage coefficient β on the drying kinetics within the last 400 s.
Chemengineering 09 00121 g003
Figure 4. Flow and particle statistics development for Experiment 14 measured up to t c = 4.5 . (a) Mean outlet gas temperature; (b) Mean outlet gas moisture content; (c) Interval-averaged mean particle residence time (PRT) at the outlet; (d) Interval-averaged mean particle moisture content (kg/kg) at the outlet. For figures (c,d), three different particle size ranges (micron) are depicted.
Chemengineering 09 00121 g004
Figure 5. Air and particle-related fields for selected numerical experiments at t c = 5.14 . (a) 2D cross-section of the air velocity field ( m / s ) for Experiments 12 and 16; (b) 2D cross-section of the air humidity field ( kg / kg ) for Experiments 5, 12, and 16, shown with a high-contrast color scheme; (c) Position fields for recently atomized particles (PRT < 2 s), colored by wet-basis particle moisture ( kg / kg ). For visualization purposes, the rendered particle size is inversely related to PRT; (d) Time-dependent particle position fields for a 2000-parcel sample. For visualization purposes, the rendered particle size is proportional to the actual particle diameter.
Chemengineering 09 00121 g005aChemengineering 09 00121 g005b
Figure 7. ANOVA analysis of the influence of factor parameters on R-1 (Particle residence times). Left column: main effects plot; right column: Pareto chart of the standardized main effects. The horizontal line defines the 95% confidence interval ( p = 0.05 ). The value of α represents the threshold value in the response variable for this confidence interval. S S T represents the sum of the squares. (a) PRT-responses at the outlet of the drying chamber. (b) PRT-responses of particles impacting the walls of the drying chamber.
Chemengineering 09 00121 g007aChemengineering 09 00121 g007b
Table 1. Ranges of the non-dimensional factor parameters. The filling time t f (s) of the drying chamber represents the ratio of the chamber volume to the volumetric flow rate ( V c / v ˙ ) and is included as a reference.
ParameterDescriptionMiddle ValueMaxMin
P1* ( H cyl + H con ) D c 1.682.51.2
P2* H cyl H con 1.602.00.5
P3* sag sag max 0.51.00.0
P4* S n 0.250.50.05
P5* ( × 10 4 ) R e 2.223.951.44
t f (s) V c / v ˙ 15.3023.548.60
Table 3. Values of some of the most relevant fixed parameters reported in different studies on spray dryers involving numerical simulations and experimental measurements.
ReferenceARL (kg/kg) T , in (°C) u p , 0 (m/s)n d 10 (µm)Feed Product
Kieviet and Kerkhof [31]36.09195492.4568.6H2O
52.71–65.32154–209592.0970.5MD
Huang et al. [32]27.14170622.0570.5MD + SC
13.57170622.0570.5H2O
Huang et al. [21]42.041951052.0570.5MD
Woo et al. [22]108.41120–15089.21.7347MD + SC
Gutiérrez Suárez [26]39.71–67.91140–20068.072.0559H2O
Benavides-Morán et al. [33]78.0817068.07 *1.964GJ + MD
Present study8517070.52.0561.3MD
Observations: MD = Maltodextrin, SC = Sucrose, GJ = Guava Juice. * Assumed from the reported RPMs of the disk and its diameter.
Table 4. Description of the response variables used in the study.
Response Variables
Main Associate Response Name Description Response Form Location
Global responses (R-0)R-0.1Air temperature ( T ) T ¯ (°C)Outlet
R-0.2Air humidity ( X ) X ¯ (kg/kg)
Particle residence times—PRT (R-1)R-1.1Bulk-based PRT ¯ b , PRT ¯ sd , b (s)Outlet and walls
R-1.2Particle-based PRT ¯ p (s)
R-1.3Bulk-based per particle size PRT ¯ b (s)
Particle moisture (wet-basis) (R-2)R-2.1 X wb —bulk-based X ¯ wb , b , X ¯ wb , sd (kg/kg)Outlet and walls
R-2.2 X wb —particle-based X ¯ wb , p (kg/kg)
R-2.3 X wb —bulk-based per particle size X ¯ wb , b (kg/kg)
Particle temperature (R-3)R-3.1 T p - bulk-based T ¯ p , std . dev T ¯ p (°C)Walls
Particle—wall impacts (R-4)R-4.1.1Impact ratio (mass based)Impacted mass (kg)/atomized mass (kg)Walls
R-4.1.2Impact ratio (particle based)Impacted particles/atomized particles ( N i p / N a p )
R-4.2Mean impact position (mass and particle based)Mean x / H position and std. dev.
R-4.3Impact location (mass and particle based)Impacts in cylindrical section/conical section (( N i con / N i cyl ) and kg/kg)
Table 5. Spreadsheet of experiments.
ExperimentP1*P2*P3*P4*P5* ( 10 4 )
11.20.500.053.95
22.50.500.051.44
31.2200.051.44
42.5200.053.95
51.20.510.051.44
62.50.510.053.95
71.2210.053.95
82.5210.051.44
91.20.500.51.44
102.50.500.53.95
111.2200.53.95
122.5200.51.44
131.20.510.53.95
142.50.510.51.44
151.2210.51.44
162.5210.53.95
171.851.250.50.2752.22
Disclaimer/Publisher’s Note: The statements, opinions and data contained in all publications are solely those of the individual author(s) and contributor(s) and not of MDPI and/or the editor(s). MDPI and/or the editor(s) disclaim responsibility for any injury to people or property resulting from any ideas, methods, instructions or products referred to in the content.