1. Introduction
Currently, coal tar and oil shale play a dual role: on the one hand, they continue to contribute significantly to global energy consumption; on the other, they are regarded as promising unconventional sources of strategically important elements, including germanium, gallium, uranium, vanadium, and selenium, as well as rare earth elements (REEs) such as yttrium, scandium, niobium, rhenium, gold, and silver.
According to analytical data [
1,
2,
3], the development of the global economy and technological progress will drive increased demand for these metals—particularly rare and dispersed trace elements—in the coming decades.
The accumulation of trace elements in coal tar and oil shale represents an urgent scientific and practical challenge. From the standpoint of industrial raw materials, evaluating the metal content of these carbon-rich substances is of particular interest, as the concentrations of certain trace elements may exceed those found in traditional ores [
4,
5]. This opens up opportunities for the commercial recovery of valuable components from by-products of coal tar and oil shale processing, aligning with the principles of rational resource use and sustainability.
In recent years, special attention has been paid not only to the extraction of microelements, but also to increasing the value of heavy fractions of coal tar by isolating functional compounds. Thus, in [
6], a reagent-free method for dephenolization of heavy fractions is proposed, which ensures effective extraction of phenols from coal tar. These data emphasize the need for a comprehensive approach to the processing of HFCT, combining demetallization with the extraction of valuable chemical products.
Numerous studies have investigated the distribution of trace elements in these materials and developed individual extraction approaches [
1,
7]. In recent years, growing attention has been paid to the search for alternative sources of rare and dispersed elements (RDEs), with unconventional feedstocks such as heavy fractions of primary coal tar and oil shale emerging as promising candidates.
There are known examples of the successful use of oil shale in the thermolysis of heavy oil residues, aimed at increasing the yield of motor fuels. It has been observed that co-cracking of oil residues with oil shale enhances the breakdown of high molecular weight components, thereby improving the yield of target hydrocarbon fractions [
8].
However, the influence of oil shale on hydrodemetallization processes involving heavy oil residues, heavy oils, and coal tar—and its effect on the accumulation and extraction of rare earth elements in the solid phase—has not yet been fully explored. Given the hydrogen-donating properties of the organic matter in oil shale [
9,
10,
11] and its catalytic potential, its application as both a catalyst and a hydrogen source in co-hydrodemetallization with the heavy fraction of coal tar appears to be a promising direction.
The organic matter in oil shale contains significantly more hydrogen than coal, making it highly reactive in thermocatalytic conversion processes, where it yields liquid and gaseous products [
12,
13]. Among the most promising approaches for processing kerogen-containing feedstocks are supercritical fluid extraction and hydrogenation. In these processes, oil shale can serve as both a natural catalyst and a hydrogen donor, thereby significantly improving the yield and quality of the resulting liquid products [
14].
A number of studies show the catalytic role of the mineral matrix and organic matter of shales in hydroprocesses [
15,
16,
17,
18], as well as their potential for use as natural hydrogen donors [
19]. Recent work on in situ catalysis [
20] confirms the relevance of searching for new mineral-organic systems capable of simultaneously improving the fuel characteristics of products and concentrating strategic elements.
Thermogravimetric analysis (TGA) enables detailed investigation of the staged thermal decomposition kinetics of solid fossil fuels, heavy oils, and coal tar fractions. Several studies have demonstrated that both model and non-model approaches to TG data interpretation can yield kinetic parameters across varying conversion degrees, which is essential for optimizing process conditions [
21,
22].
However, the application of thermogravimetric and kinetic methods to multicomponent systems, including mixtures in various aggregate states (liquid and solid phases), remains insufficiently studied. This is especially true for the study of the kinetics of demetallization processes in the “heavy coal tar–oil shale” system. In addition, the issues of accumulation of rare and dispersed elements (RDE) in the solid residue and the possibility of their targeted extraction using modern sorption technologies remain open.
Thus, the key research problem is the lack of comprehensive information on the effect of oil shale on the processes of hydrodemetallization of the heavy fraction of coal tar, as well as on the mechanisms of distribution of rare and dispersed elements between liquid and solid reaction products.
The purpose of this study is to comprehensively investigate the effect of oil shale on the kinetics of thermal destruction of heavy coal tar fractions with a boiling point above 300 °C; the peculiarities of joint hydrometallization of a mixture of heavy coal tar fraction and oil shale (Shubakol Komir JSC); the development of a technological scheme for the selective extraction of individual rare earth elements from solid residue.
2. Materials and Methods
For the study, we used a heavy fraction of coal tar (HFCT) with a boiling point above 300 °C, obtained by fractionating low-temperature coal tar of Shubarkol Komir JSC at atmospheric pressure, as well as oil shale (OS) of the same enterprise with a particle size less than 0.1 and 0.1 mm. The coal shale was crushed in a jaw breaker and fractionated on Sieve Shaker OBRK-SA (Changzhou Oubeiruike Instrument and Equipment Co., Ltd., Xian, China, 2022), collecting particles smaller than 0.1 mm and 0.1 mm.
The elemental composition of the raw materials is shown in
Table 1. The data on elemental analysis and ash content for oil shale, HFCT, and their mixture are presented. The note includes the mineralogical composition of ash, reflecting the mineral matrix of shale.
To study thermal degradation processes, three mixtures were prepared containing HFCT and OS in different ratios: 1:0.1; 1:0.13 and 1: 0.16 (hereinafter referred to as HFCT + 10% OS, HFCT + 13% OS and HFCT + 16% HS, respectively). Based on the results of TG/DTG analysis and kinetic calculations, a mixture of HFCT + 13% OS was subsequently used for hydrodemetallization as the most optimal in terms of thermal destruction.
Experiments on thermal decomposition were carried out using a Labsys Evo TGA-DTA/DSC derivatograph (Setaram Instrumentation, Caluire-et-Cuire, France, 2012) with corundum crucibles. The temperature range was from 30 to 600 °C under argon flow: the carrier gas flow rate was 20 mL/min, and the purge flow rate was 50 mL/min.
The initial processing and visualization of the thermogram were performed using the OriginLab 9.0 software package. Additional data processing and statistical analysis were conducted in Python distribution version 3.11.15 using built-in NumPy and SciPy (scipy.stats) libraries. All calculations were carried out in the Jupyter Notebook (version 7.2.2 (July 2024) environment.
Kinetic parameters of the thermal decomposition stages were determined using the model-free Ozawa–Flynn–Wall (OFW) and Friedman methods, as well as the model-based approach based on the Šesták–Berggren (S–B) kinetic equation. To quantitatively assess the agreement between approaches, one-way analysis of variance (ANOVA) and the paired Student’s t-test were applied. The statistical significance threshold was set at α = 0.05. All results are presented as mean ± standard deviation, based on three independent experiments.
The Friedman and Ozava–Flynn–Wall (OFW) methods were chosen as complementary isoconversion approaches (differential and integral, respectively) that allow the apparent activation energy values to be determined without prior assumptions about the reaction mechanism. The combined use of these methods provides both high sensitivity to local changes in reaction rate (Friedman) and statistical stability when heating rates vary (OFW). To obtain a mechanistic interpretation, the Shestak–Bergren (S–B) method was additionally used. Its flexible form—f(α) = αm(1 − α)n—allows use to take into account the mixed reaction- and diffusion-controlled nature of the stages. Other integral methods (KAS, Starink) were considered as alternatives, which largely duplicate OFW in terms of data processing and accuracy. More complex isoconversion techniques (e.g., Vyazovkin) and the distributed activation energy model (DAEM) were not applied due to the limited range of heating rates and the risk of overparameterization for multicomponent HFCT–OS systems.
Univariate analysis of variance (One-way ANOVA) and paired t-test (Paired Student’s t-test) were used to assess the validity of the results. ANOVA was used to test for differences between the mean activation energy (Ea) values calculated by the Friedman, Ozawa-Flynn-Wall (OFW) and Shestak-Bergren (S-B) methods in the conversion range α = 0.1–0.9, while the paired t-test was used to compare these values in pairs at the same conversion rates. Each Ea value is presented as an average ± standard deviation (SD), calculated from the results of three independent thermogravimetric experiments, which ensured accounting for measurement errors and checking the reproducibility of thermograms. Before applying statistical criteria, normal data distribution and homogeneity of variances were assumed; significance level is taken equal p < 0.05. Both tests showed no statistically significant differences (p > 0.05), which confirms the consistency of model and non-model approaches and the reliability of the obtained kinetic parameters.
Hydrodemetallization of the mixture was carried out in a high-pressure stirred reactor with a volume of 0.3 L. The initial hydrogen pressure was 4 MPa; the feed mixture mass ranged from 35 to 45 g; the reaction time varied from 15 to 75 min; the heating temperature ranged from 380 to 420 °C; and the oil shale to HFCT ratio was 0.10–0.16:1.
During the hydrodemetallization of the HFCT and oil shale mixture, a hydrogenate (liquid product) and a solid residue were obtained, in which valuable rare and dispersed trace elements were concentrated. To separate the liquid and solid phases, the hydrogenate with the residue was extracted with benzene, followed by filtration and phase separation. The process flow diagram of the hydrodemetallization of the HFCT and oil shale mixture is shown in
Figure 1. The scheme includes the stages of hydrodemetallization, separation of products into solid residue and liquid fractions, as well as their further analytical analysis (ash analysis, alkali alloy, extraction, sorption).
As shown in the process flow diagram, the obtained hydrogenate was subjected to fractionation to isolate the light fraction (initial boiling point 100–200 °C), middle fraction (initial boiling point 200–300 °C), and residue (boiling point > 300 °C).
To study the individual and group composition of hydrocarbons in the gasoline and diesel fractions, analysis was performed using an Agilent 7890A (Santa Clara, CA, USA, MSD ChemStation E.2.00.493) gas chromatograph equipped with an Agilent 5975C (Santa Clara, CA, USA) mass-selective detector. Column parameters (Rxi-5ms): length—30 m, inner diameter—0.25 mm, film thickness—0.25 μm; column heating rate—8 °C/min; carrier gas—helium; column pressure—1.38 × 10⁵ Pa; sample volume—2 × 10⁻⁴ cm3; injection mode—split; library—NIST08. The composition of the fractions was determined semi-quantitatively based on peak areas. Data processing was performed using the GSMSD Data Analysis software
In the fractionation residue with a boiling point above 300 °C and in the solid residue of hydrodemetallization, the content of rare and scattered trace elements was determined. The analysis was carried out using Inductively Coupled Plasma Atomic Emission Spectrometry (ICP-AES) on an Optima 8300 DV spectrometer (Perkin Elmer, Shelton, CT, USA).
To determine the content of rare and dispersed trace elements, the solid residue of hydrodemetallization and the residue of fractionation with a boiling point above 300 °C were ash at a temperature of 650 °C for 120 min. To dissolve the resulting ash, samples ground to 200 mesh (mass 0.08–0.1 g) were mixed with lithium metaborate in a 1:3 ratio and fused for 15 min at 1050 °C in platinum crucibles using a muffle furnace. The resulting melts were dissolved in diluted HNO3 with trace amounts of HF in polypropylene beakers with magnetic stirring (no heating), and quantitatively transferred into 100–250 mL volumetric glass flasks.
Immediately before ICP-AES measurements, the solutions were diluted 10–25 times in disposable polypropylene tubes with the addition of an internal standard. The required acidity level for melt dissolution and all dilution stages was determined experimentally and maintained at 2% HNO3. Calibration solutions based on multi-element standards from Perkin Elmer were used to quantify the rare and dispersed elements.
To recalculate the results relative to the original raw materials, the following ratio was applied [
23]:
where
—concentration of trace element in hydrodemetallization product (g/t),
—element concentration in ash (g/t), and
A—ash content (%).
The degree of hydrodemetallization of the mixture was determined by the following formula:
where
—the concentration of the trace element in the initial HFCT and oil shale mixture (g/t), as presented in Table 4;
—the concentration of the element in the hydrodemetallization product of the HFCT and oil shale mixture (g/t).
The “solid residue” refers to the combination of the mineral matrix of oil shale and carbonaceous coking products released after separation of the liquid and gas phases. Its content was determined gravimetrically as the difference between the weight of the charge and the sum of the yields of liquid and gaseous products.
In addition, the germanium content was determined spectrophotometrically using phenylfluorone [
24,
25]. The absorbance was measured at λ = 490 nm in a 1 cm cuvette. Absorption spectra of the analyzed solutions were recorded using a Shimadzu UV-1800 (Kyoto, Japan) double-beam scanning spectrophotometer.
To isolate rare and dispersed trace elements, in particular germanium, from the filtrate of the solid residue, a sorption method was applied using the ion-exchange resin PYROLITE S100 (a sulfonated polystyrene-divinylbenzene copolymer). The column was packed with the resin, taking care to avoid voids. After packing, the column was washed with distilled water. The prepared solution (filtrate) was then slowly passed through the column under controlled flow conditions [
26]. The concentrations of rare and dispersed trace elements were subsequently determined.
All analytical data were processed using mathematical statistics methods [
27]. All hydrometallization experiments were performed in three parallel experiments (
n = 3). The results are presented as mean values ± standard deviation (SD). The differences between parallel experiments did not exceed the instrumental error (<2–5%). In all tables and figures, values are given in the format mean ± SD (
n = 3).
3. Results and Discussions
Methods of kinetic analysis of the thermal decomposition of heavy hydrocarbon systems have traditionally evolved through the integration of model-based and model-free approaches in order to improve the reliability of calculations. The classical works of Friedman [
28], Flynn and Wall [
29], and Ozawa [
30] laid the foundation for model-free determination of activation energy (
Ea), based on the dependence of the decomposition rate on temperature at varying heating rates. These methods remain relevant for processing TG/DTG data from complex organo-mineral systems, including coal tar and oil shale.
Modern developments in model-free approaches are exemplified by Serra et al. [
31], who proposed the non-parametric kinetics (NPK) method to describe real kinetic behavior without strict adherence to a specific model. Vlase et al. [
32] compared the effectiveness of NPK and classical methods in analyzing multicomponent and heterogeneous systems.
Practical applications of both integral and numerical methods have been demonstrated by Burkeev et al. [
33] and Zhumanazarov et al. [
34], where they were successfully used to calculate kinetic parameters of copolymers and hydrocarbon resins. This highlights the need to combine multiple approaches to minimize errors in the description of multistage processes.
For mechanistic interpretation, the Šesták–Berggren (S–B) model, developed by Šesták and Kratochvíl [
35] and further refined by Šesták [
36], is of particular importance as it accounts for both reaction and diffusion control. These models have proven effective in describing the degradation of oil shale and its mixtures.
Smith et al. [
37] emphasized the significance of studying inclusion complexes, which is essential for understanding the interactions between coal tar components and the mineral matrix of oil shale, thereby improving the efficiency of rare and rare-earth element extraction.
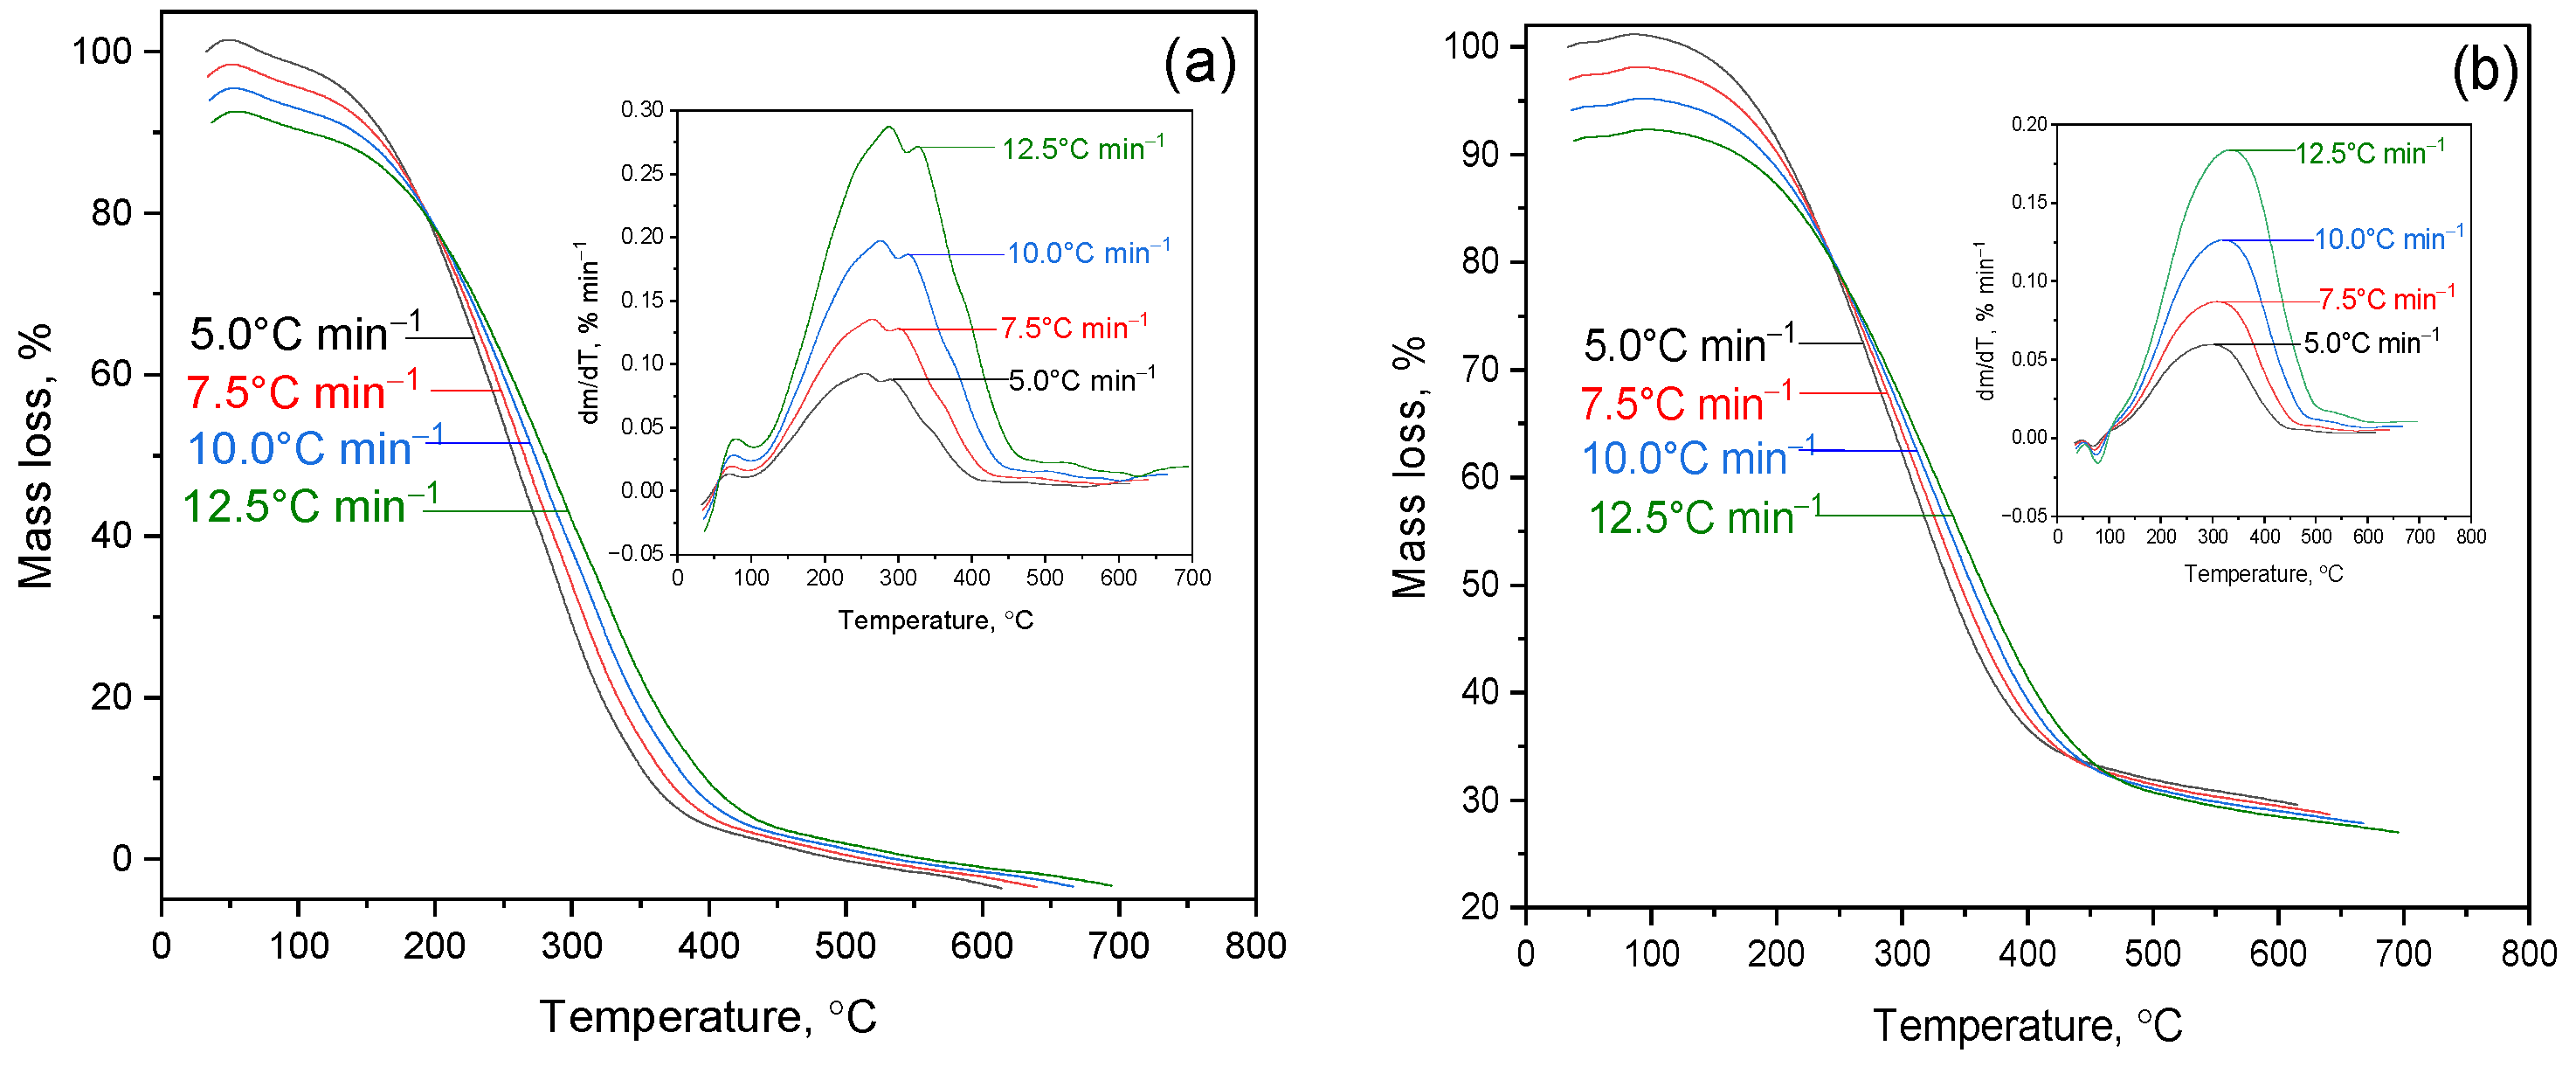
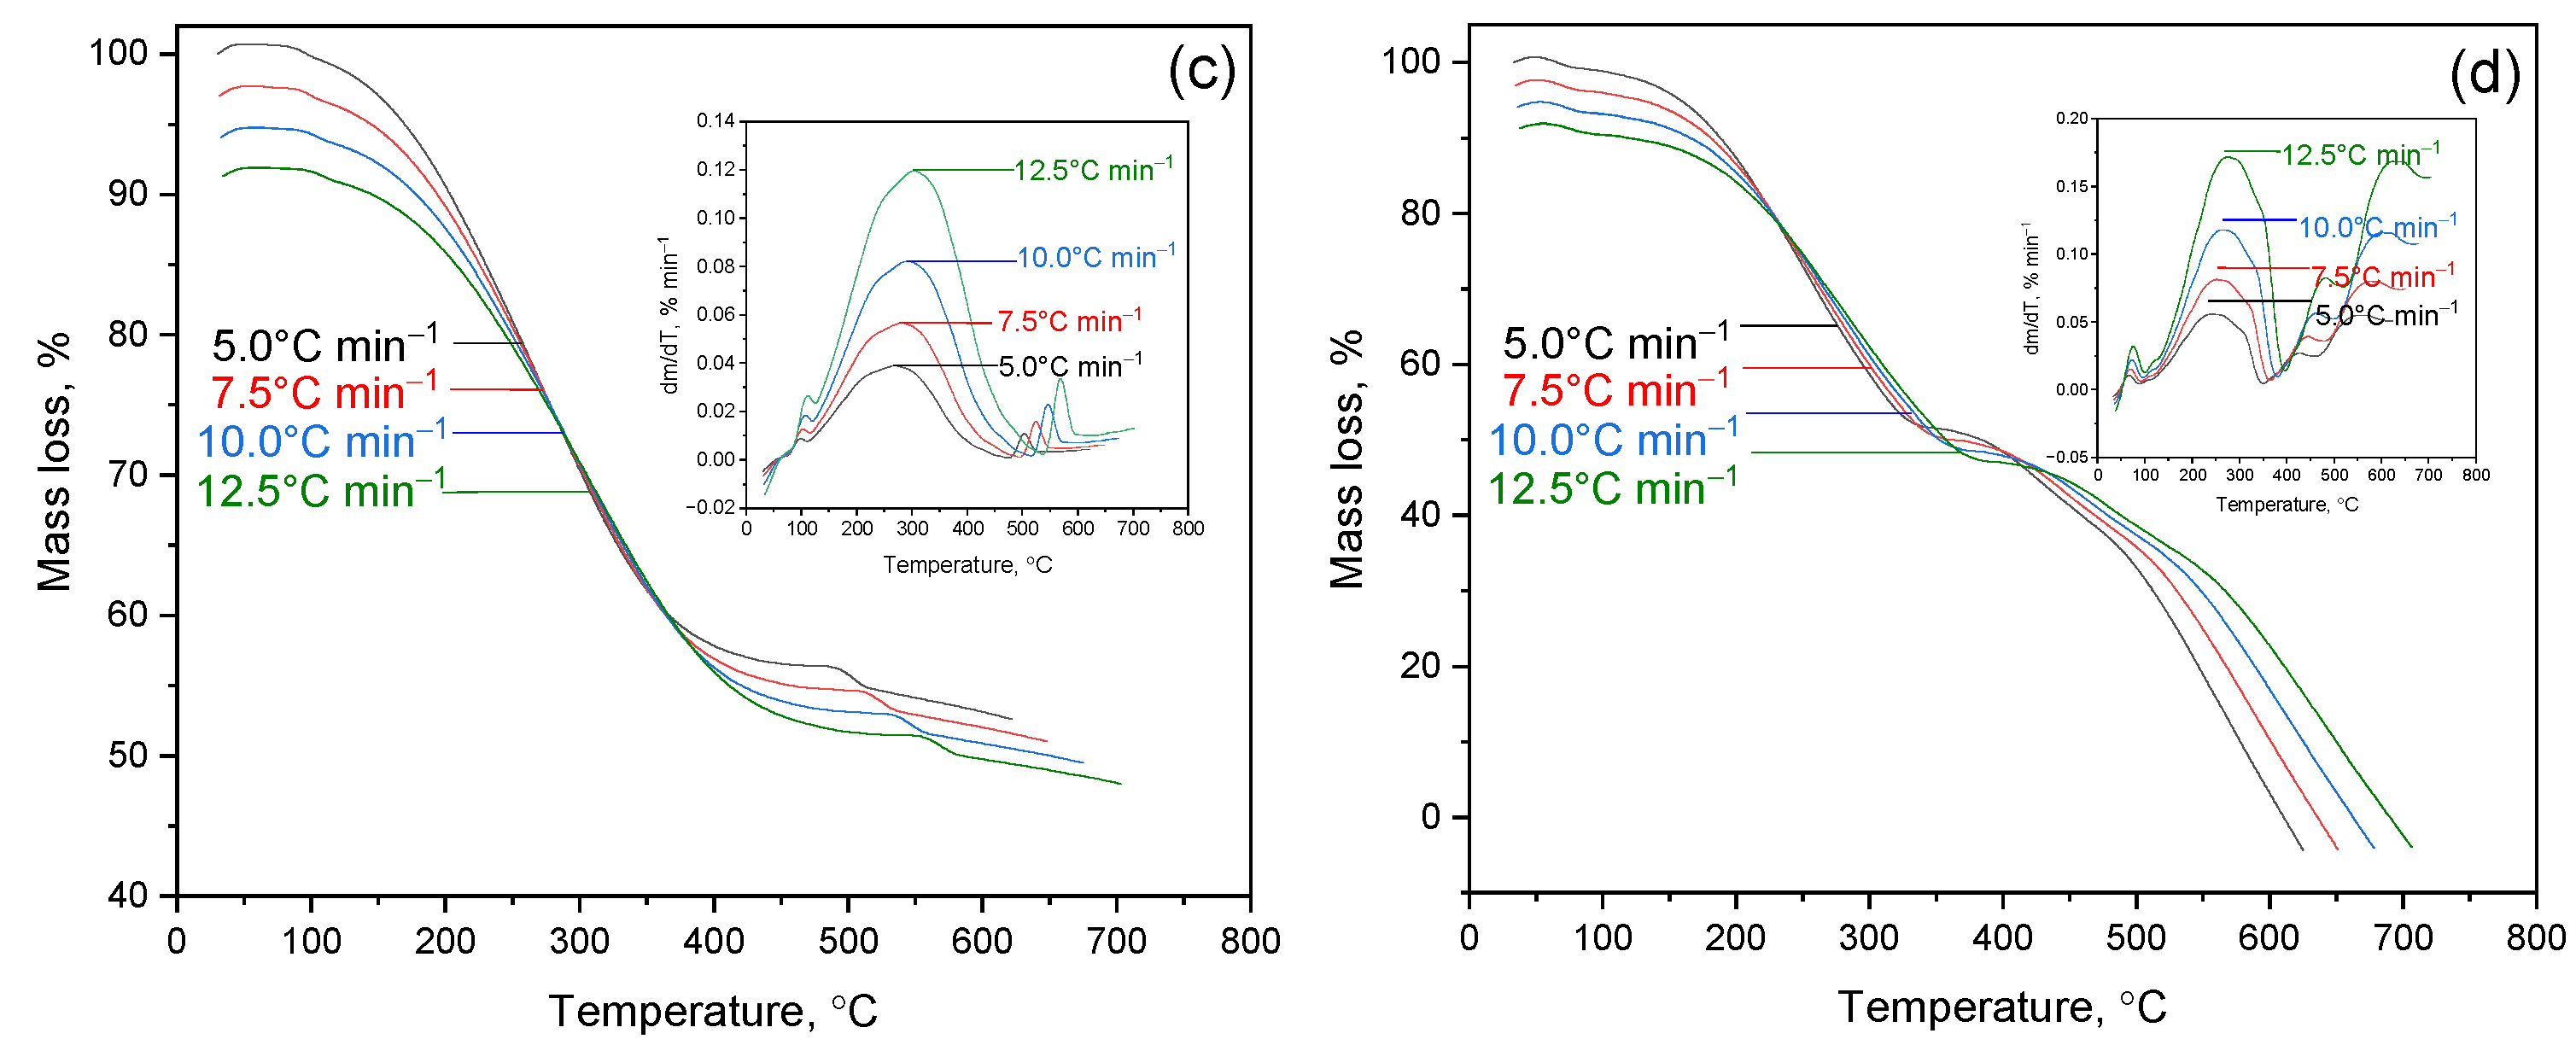
Figure 2a–d show the thermogravimetric (TG) and differential thermogravimetric (DTG) curves for oil shale (OS) and its mixtures with the heavy fraction of coal tar (HFCT), containing 10%, 13%, and 16% OS, respectively. The experiments were conducted at heating rates of 5.0, 7.5, 10.0, and 12.5 °C/min under an inert atmosphere.
Analysis of the TG curves reveals a consistent mass loss with increasing temperature. For pure oil shale, decomposition occurs within a relatively narrow temperature range. In contrast, the addition of HFCT broadens the thermal decomposition range and slightly reduces the overall thermal stability of the system. This may indicate interactions between the organic components of the resin and the inorganic matrix of the shale, which promote an earlier onset of pyrolysis processes.
The DTG curves show a shift in the peak decomposition rate toward lower temperatures with increasing HFCT content, confirming the catalytic effect of the resin on the decomposition of the mineral components in OS. The mixture containing HFCT + 13% OS exhibits a broad temperature range of active decomposition with a pronounced peak rate, creating favorable conditions for the deep degradation of the organic matrix and exposure of mineral phases.
As shown in
Table 1, the organic part of oil shale contains carbon and hydrogen (C
daf = 63.08%, H
daf = 7.79%), as well as nitrogen, sulfur, and oxygen, while the ash content reaches 64.58%. The mineral matrix is mainly represented by SiO
2 (42.3%), Al
2O
3 (15.4%), CaO (18.4%), Fe
2O
3 (6.2%), TiO
2 (1.4%) and MgO (2.4%). This composition determines the resistance of shale to thermal decomposition and explains the low mass loss in sample (a) and mixtures with a high OS content (d). In contrast, mixtures (b) and (c) are dominated by the organic part of HFCT, which leads to significant mass loss (73% and 55% at 700 °C). These data confirm that the mineral matrix of OS plays a stabilizing role, limiting thermal destruction and preserving the solid residue.
According to
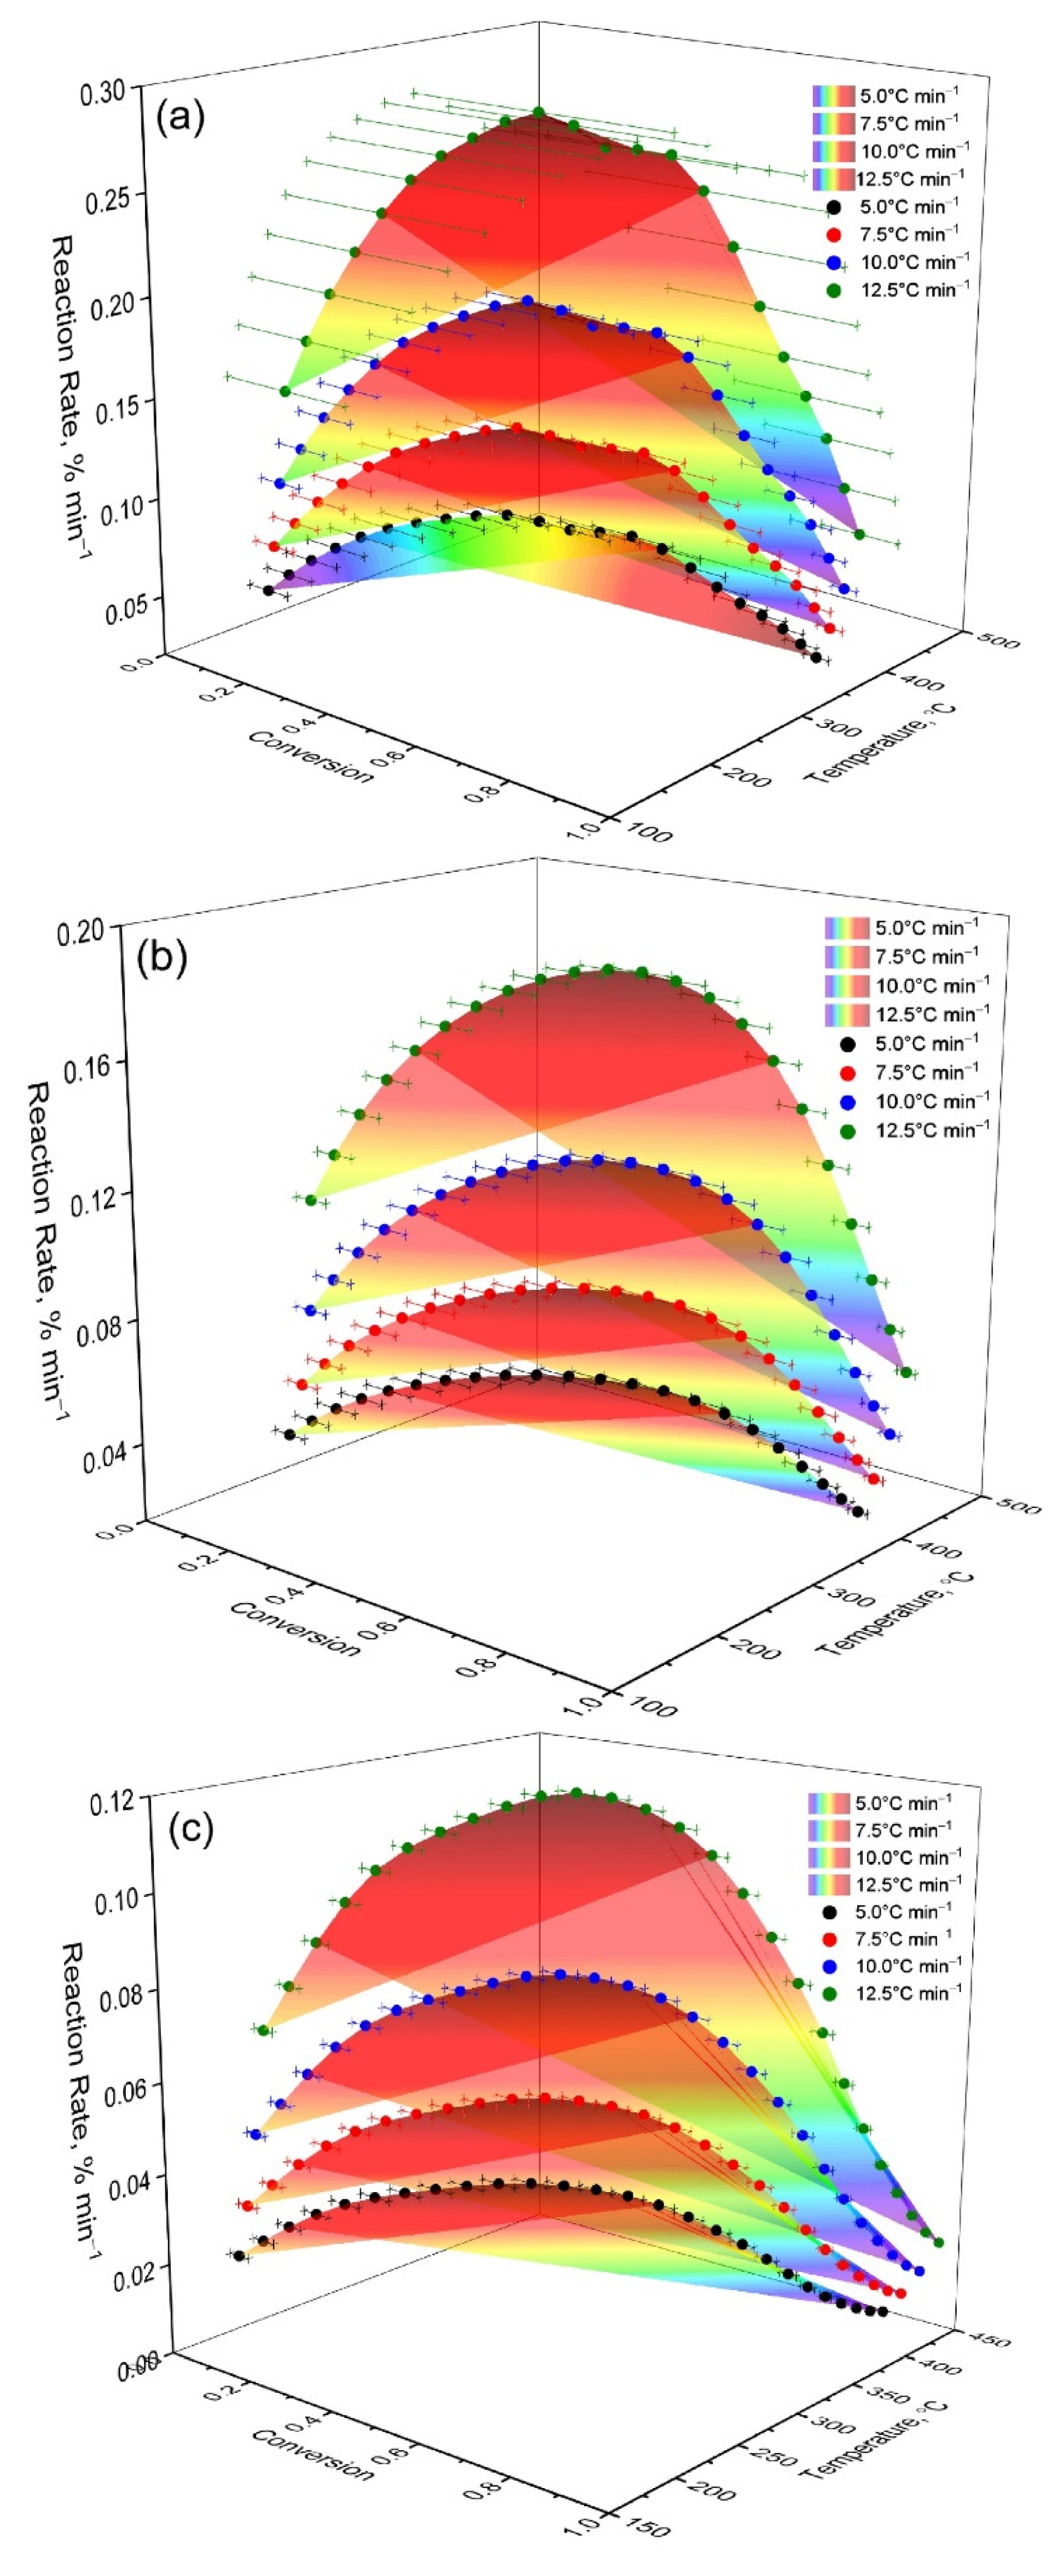
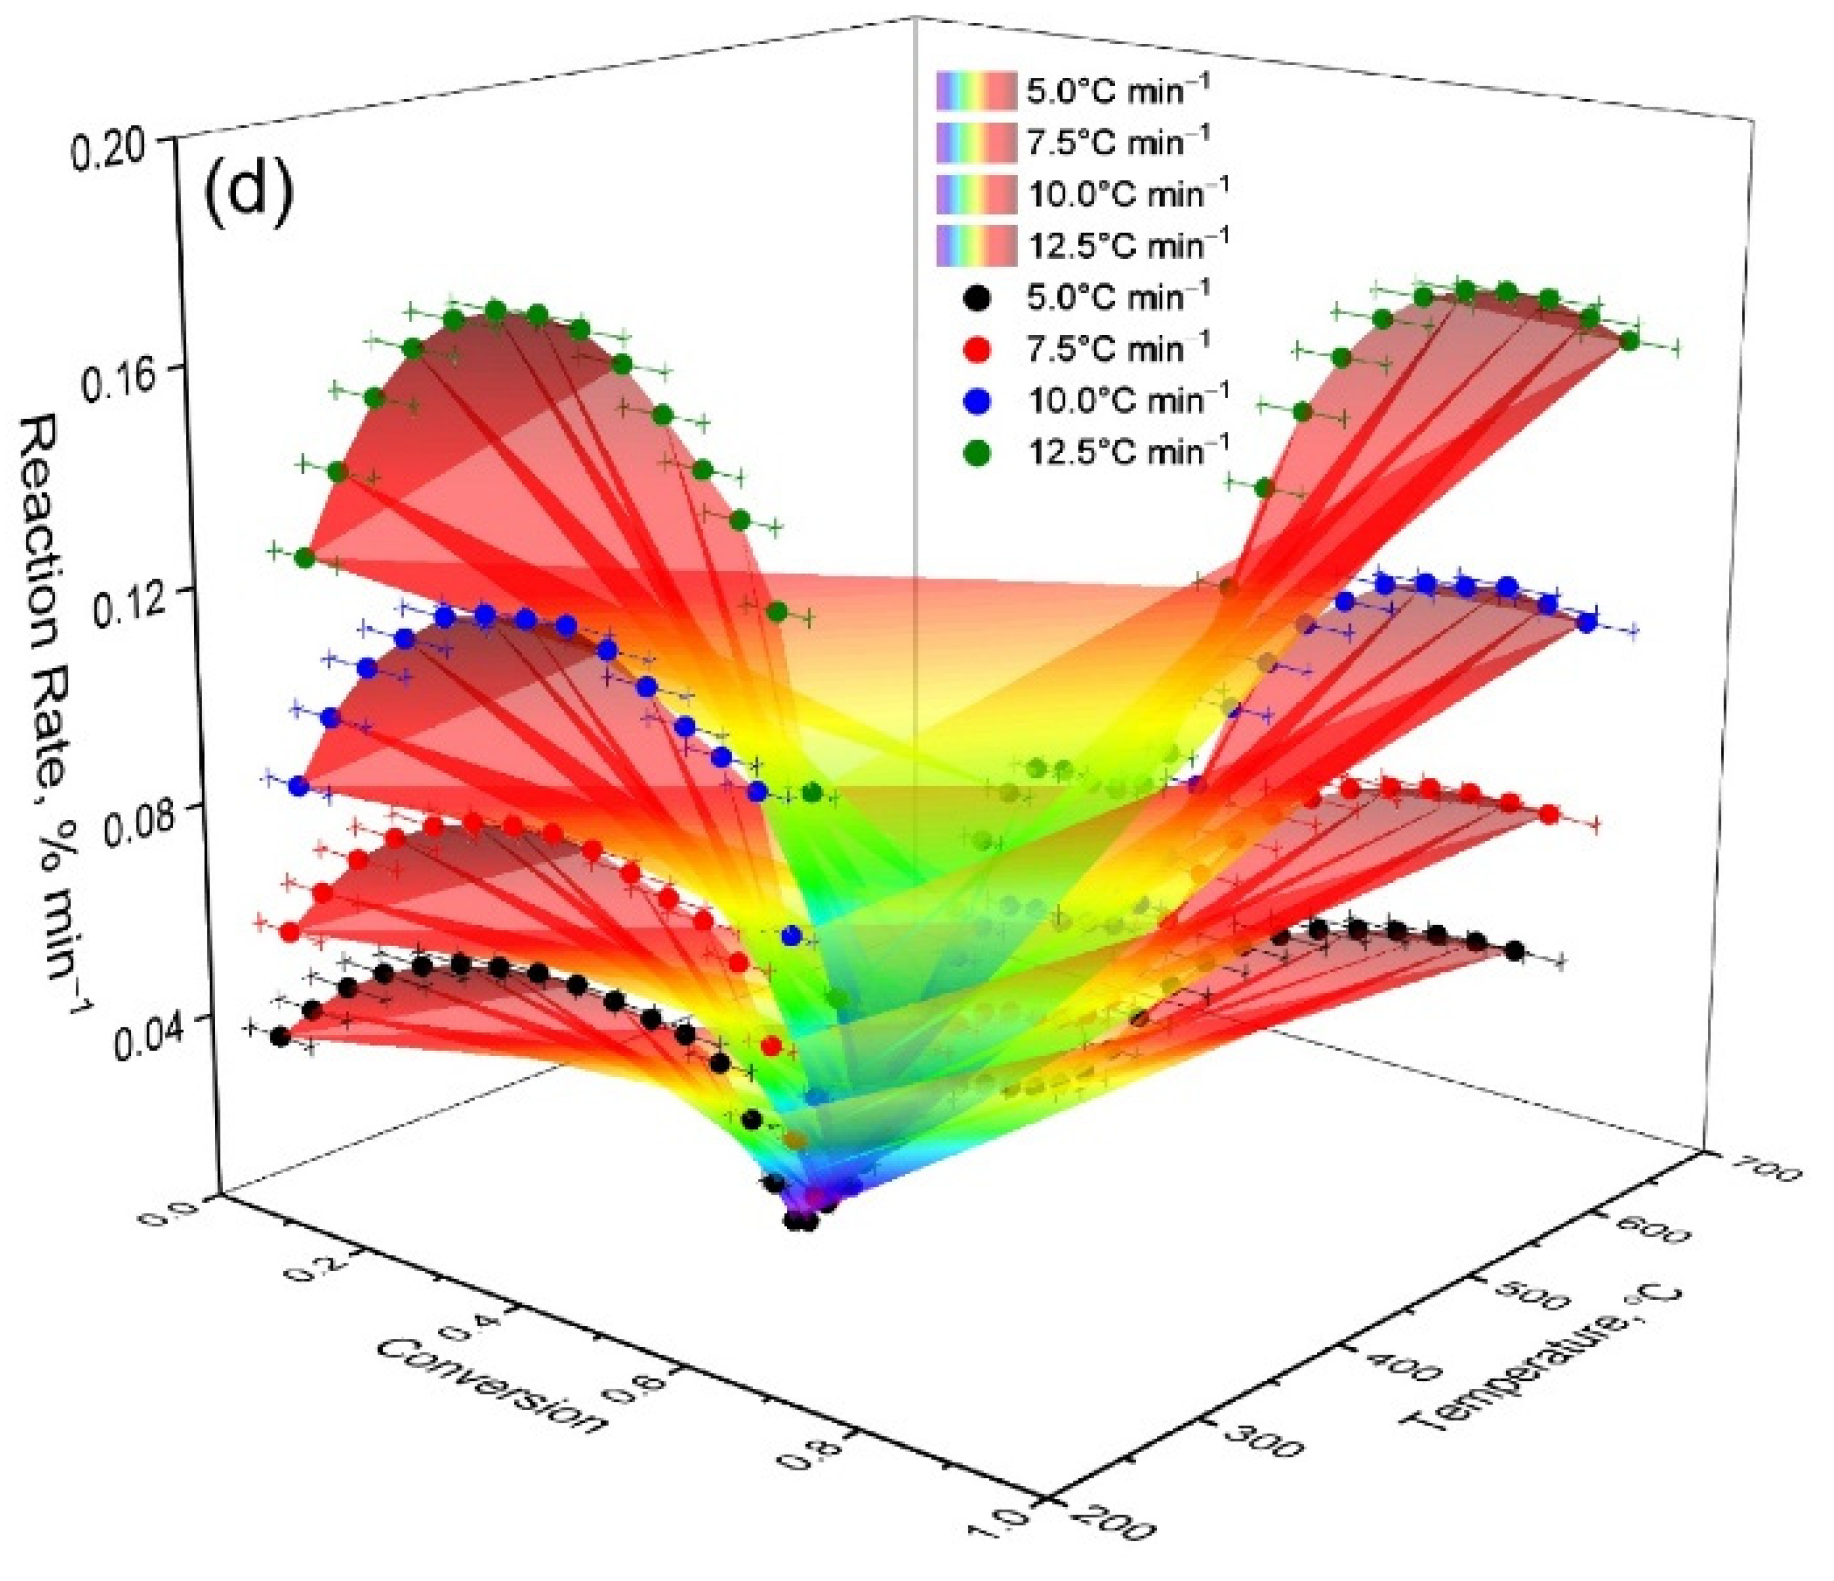
Figure 2, additional thermal effects are observed in the high-temperature region for mixtures with OS. In the HFCT + 13% OS sample (c), a maximum of ≈500–600 °C is recorded; and in the HFCT + 16% OS sample (d), an extended band of ≈400–700 °C is recorded. These features are due to the superposition of dihydroxylation of clay phases and decarbonization of Ca-containing components of the mineral matrix of shale, as well as secondary condensation/carbonization reactions of organic tar residue. The intensification and broadening of the high-temperature region with an increase in the OS fraction is consistent with the dα/dT data (
Figure 3 and
Figure 4) and reflects the multistage nature of the decomposition of the organic-mineral system under an inert atmosphere.
To quantitatively describe the kinetics of thermal decomposition, the activation energy (
Ea) dependencies over a wide range of conversion degrees (α = 0.1–0.9) were calculated using the Friedman and Ozawa–Flynn–Wall (OFW) methods. The results are presented in
Figure 5 and
Table 2.
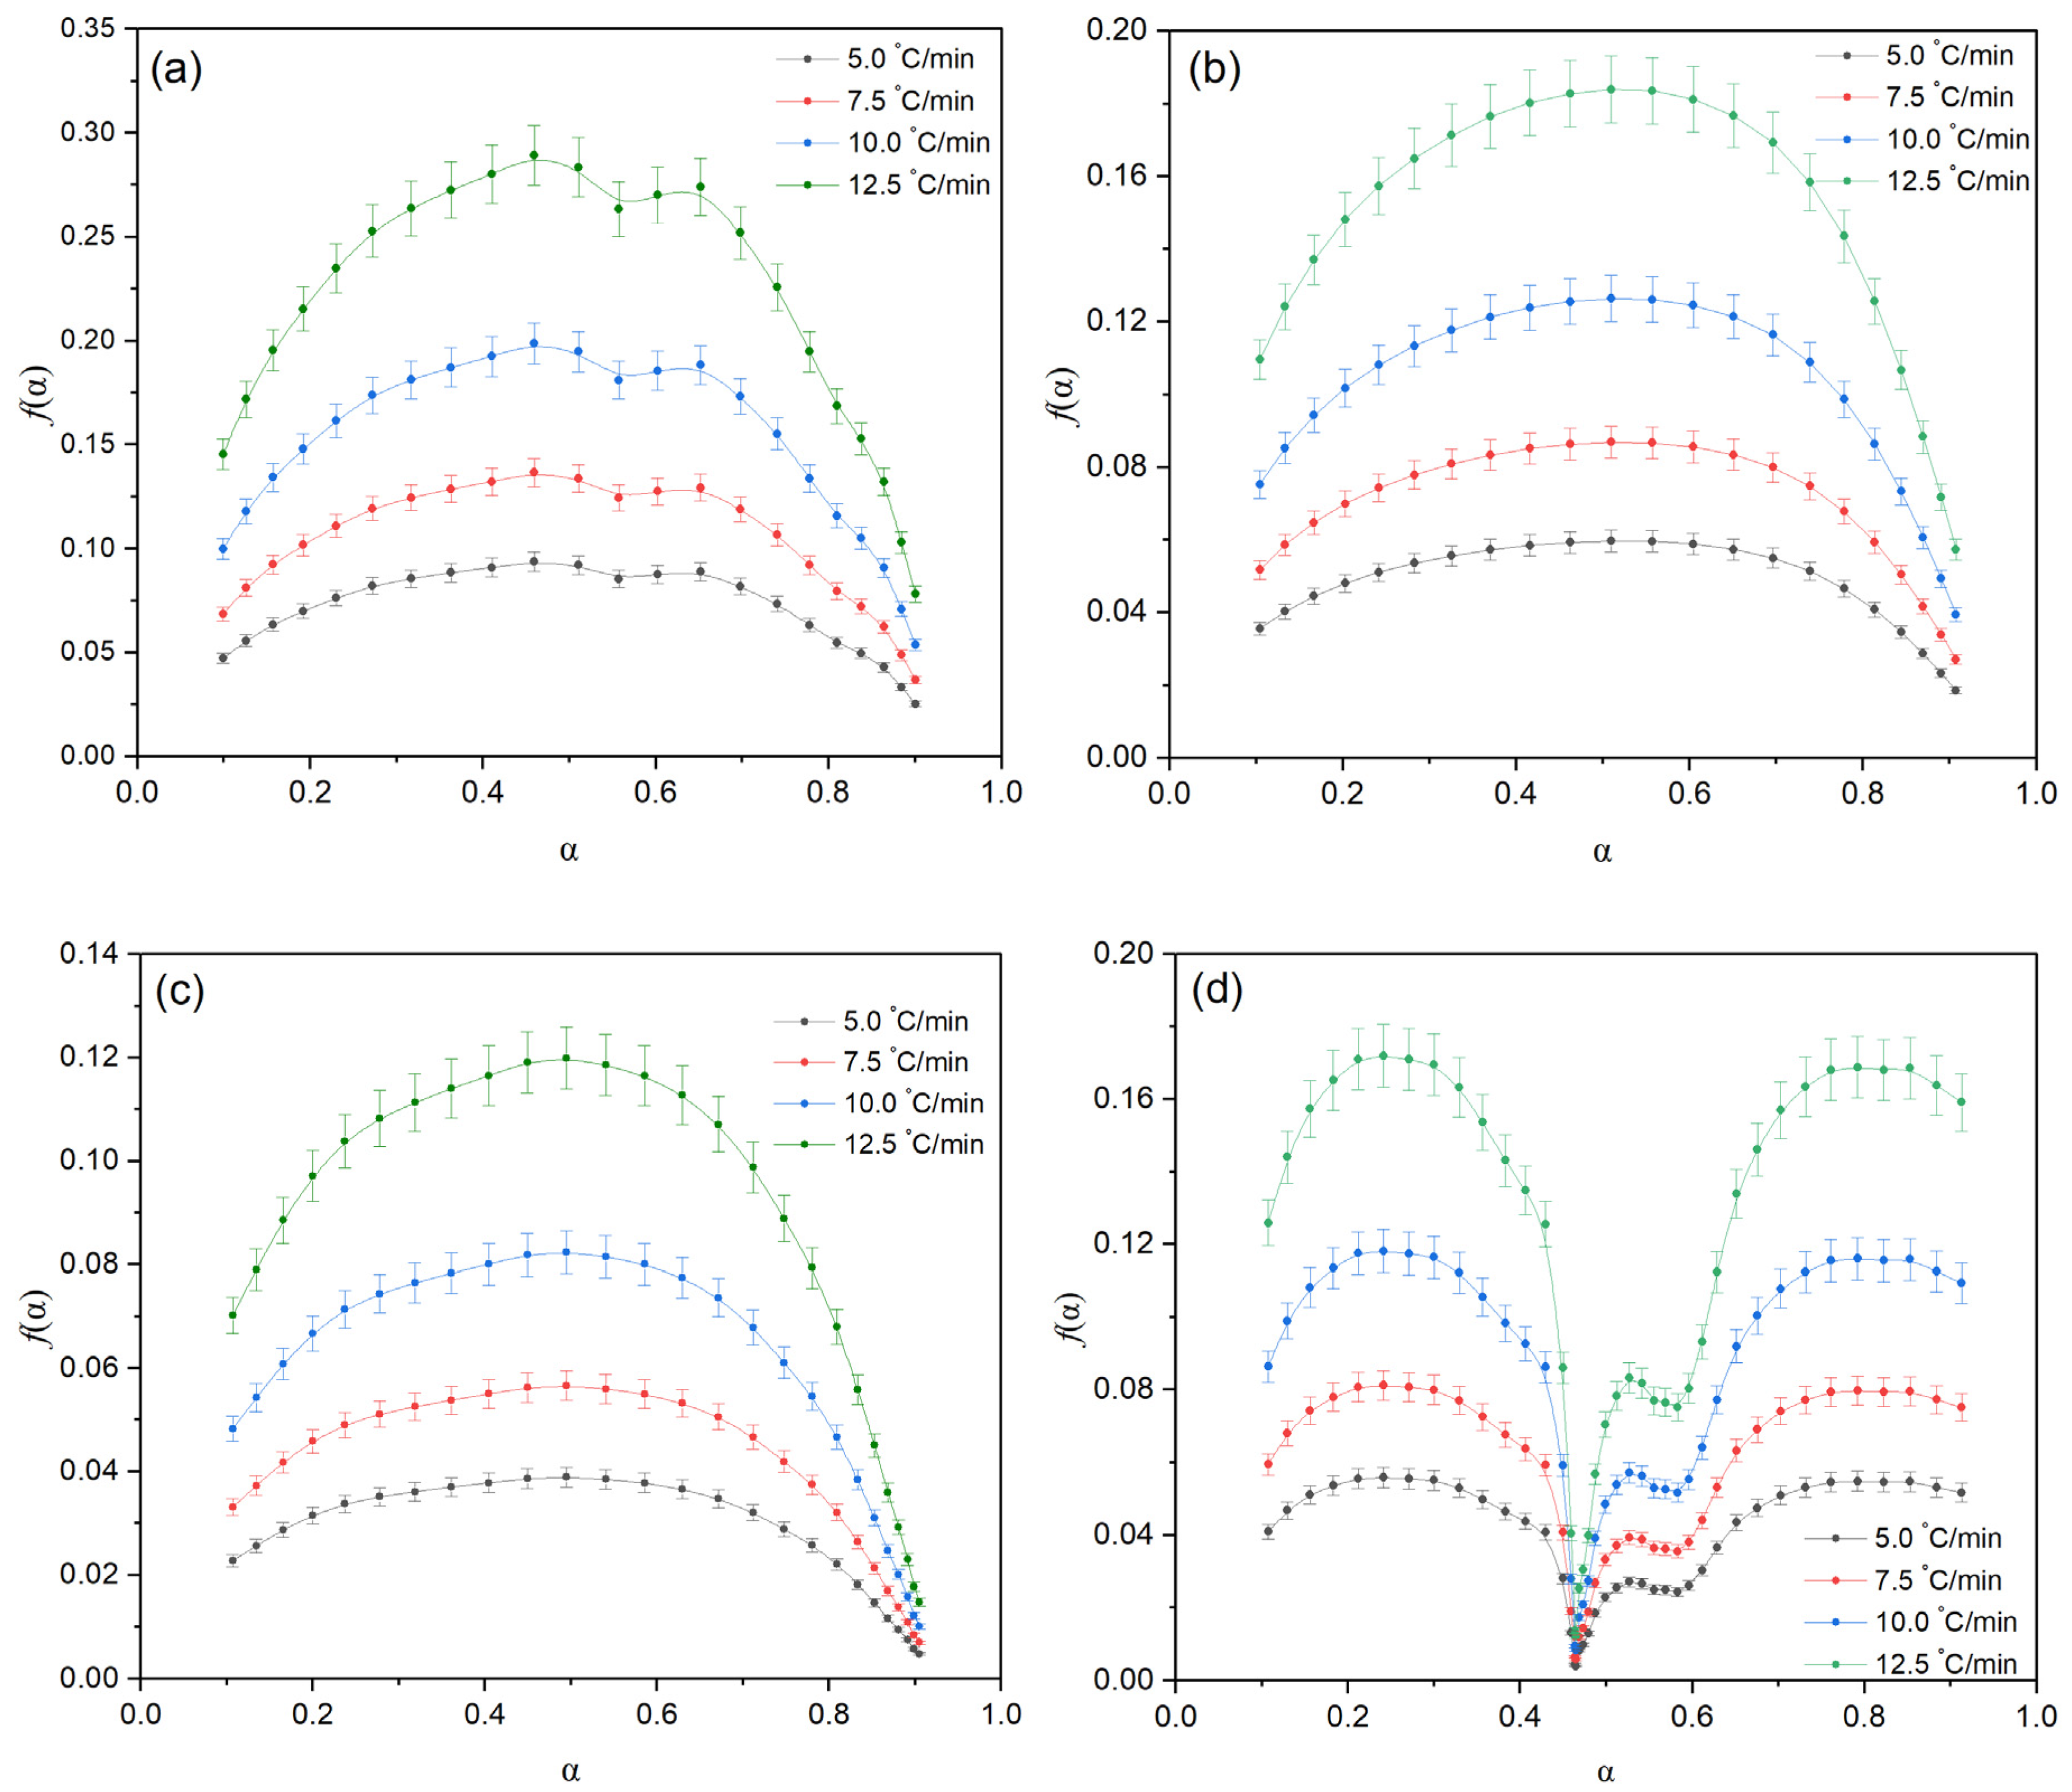
Figure 5 shows the results of processing experimental data by the Friedman method for oil shale (a) and mixtures of HFCT with the addition of 10, 13 and 16% shale (b–d). It can be seen that for the original shale, the ln(dα/dt)–1/T have a steeper slope, which corresponds to high activation energy values. When shale is added to the HFCT, the curves become flatter, especially in the case of 13% OS (
Figure 5c), which indicates the facilitation of thermal decomposition and the manifestation of the catalytic effect of the mineral matrix.
The numerical values of activation energy calculated using the Friedman and Ozawa–Flynn–Wall methods are given in
Table 2. For oil shale,
Ea is ≈107–114 kJ·mol
−1 across the entire range of α = 0.1–0.9, reflecting its high thermal stability. In mixtures with 10% OS, the values decrease to ≈84–88 kJ·mol
−1, and at 13% OS, they reach a minimum (≈83–86 kJ·mol
−1), which is consistent with the trends in
Figure 3 and confirms the optimality of this composition. When the shale content is increased to 16%,
Ea increases (to 94–101 kJ·mol
−1 at α ≥ 0.7), which is also evident from the change in the slope of the curves in
Figure 3d and indicates a more complex decomposition mechanism. Thus, the graphical data (
Figure 5) and numerical values (
Table 2) complement each other, showing that the most pronounced donor–catalytic effect is achieved at a content of 13% OS.
The activation energy values obtained (83–86 kJ·mol
−1) for the HFCT + 13% OS mixture are comparable to the data [
15] for the hydrometallization of heavy oil fractions and [
21] for the oxidation processes of heavy oils. However, unlike the works of [
38,
39], where the reduction in
Ea was achieved by using NiMo catalysts at high hydrogen pressures, in our case, the effect is due to the natural donor–catalytic properties of oil shale.
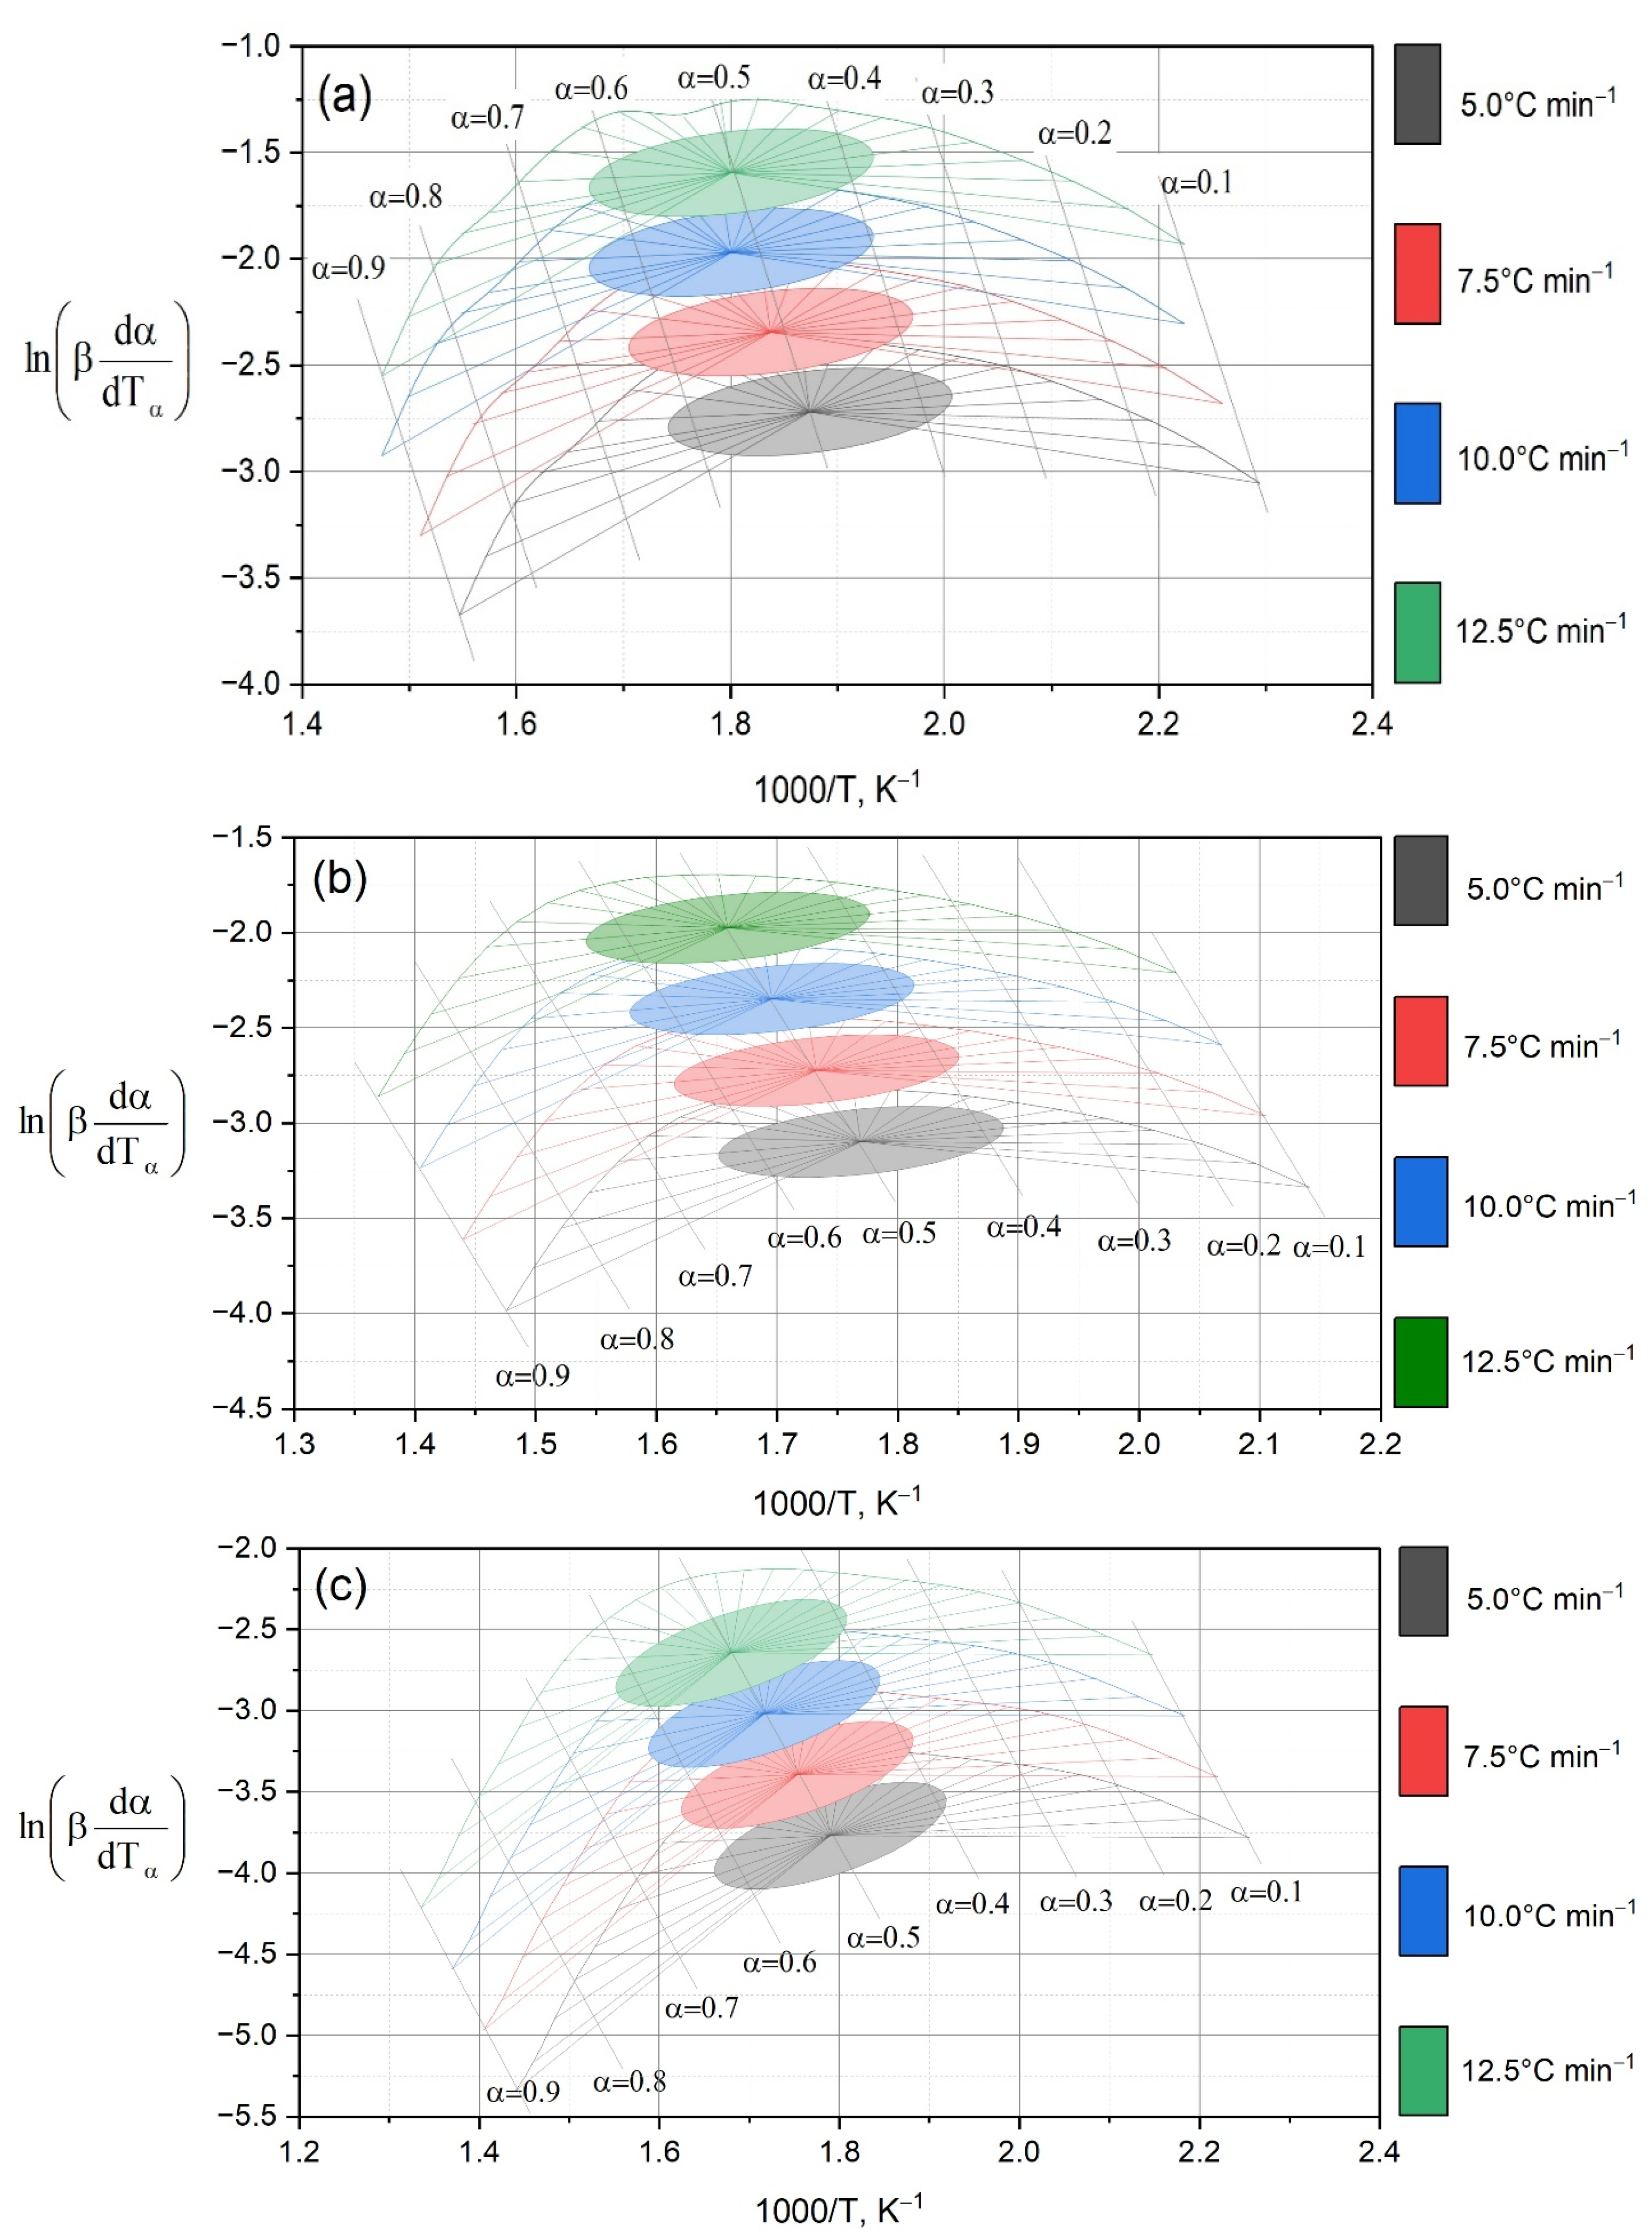
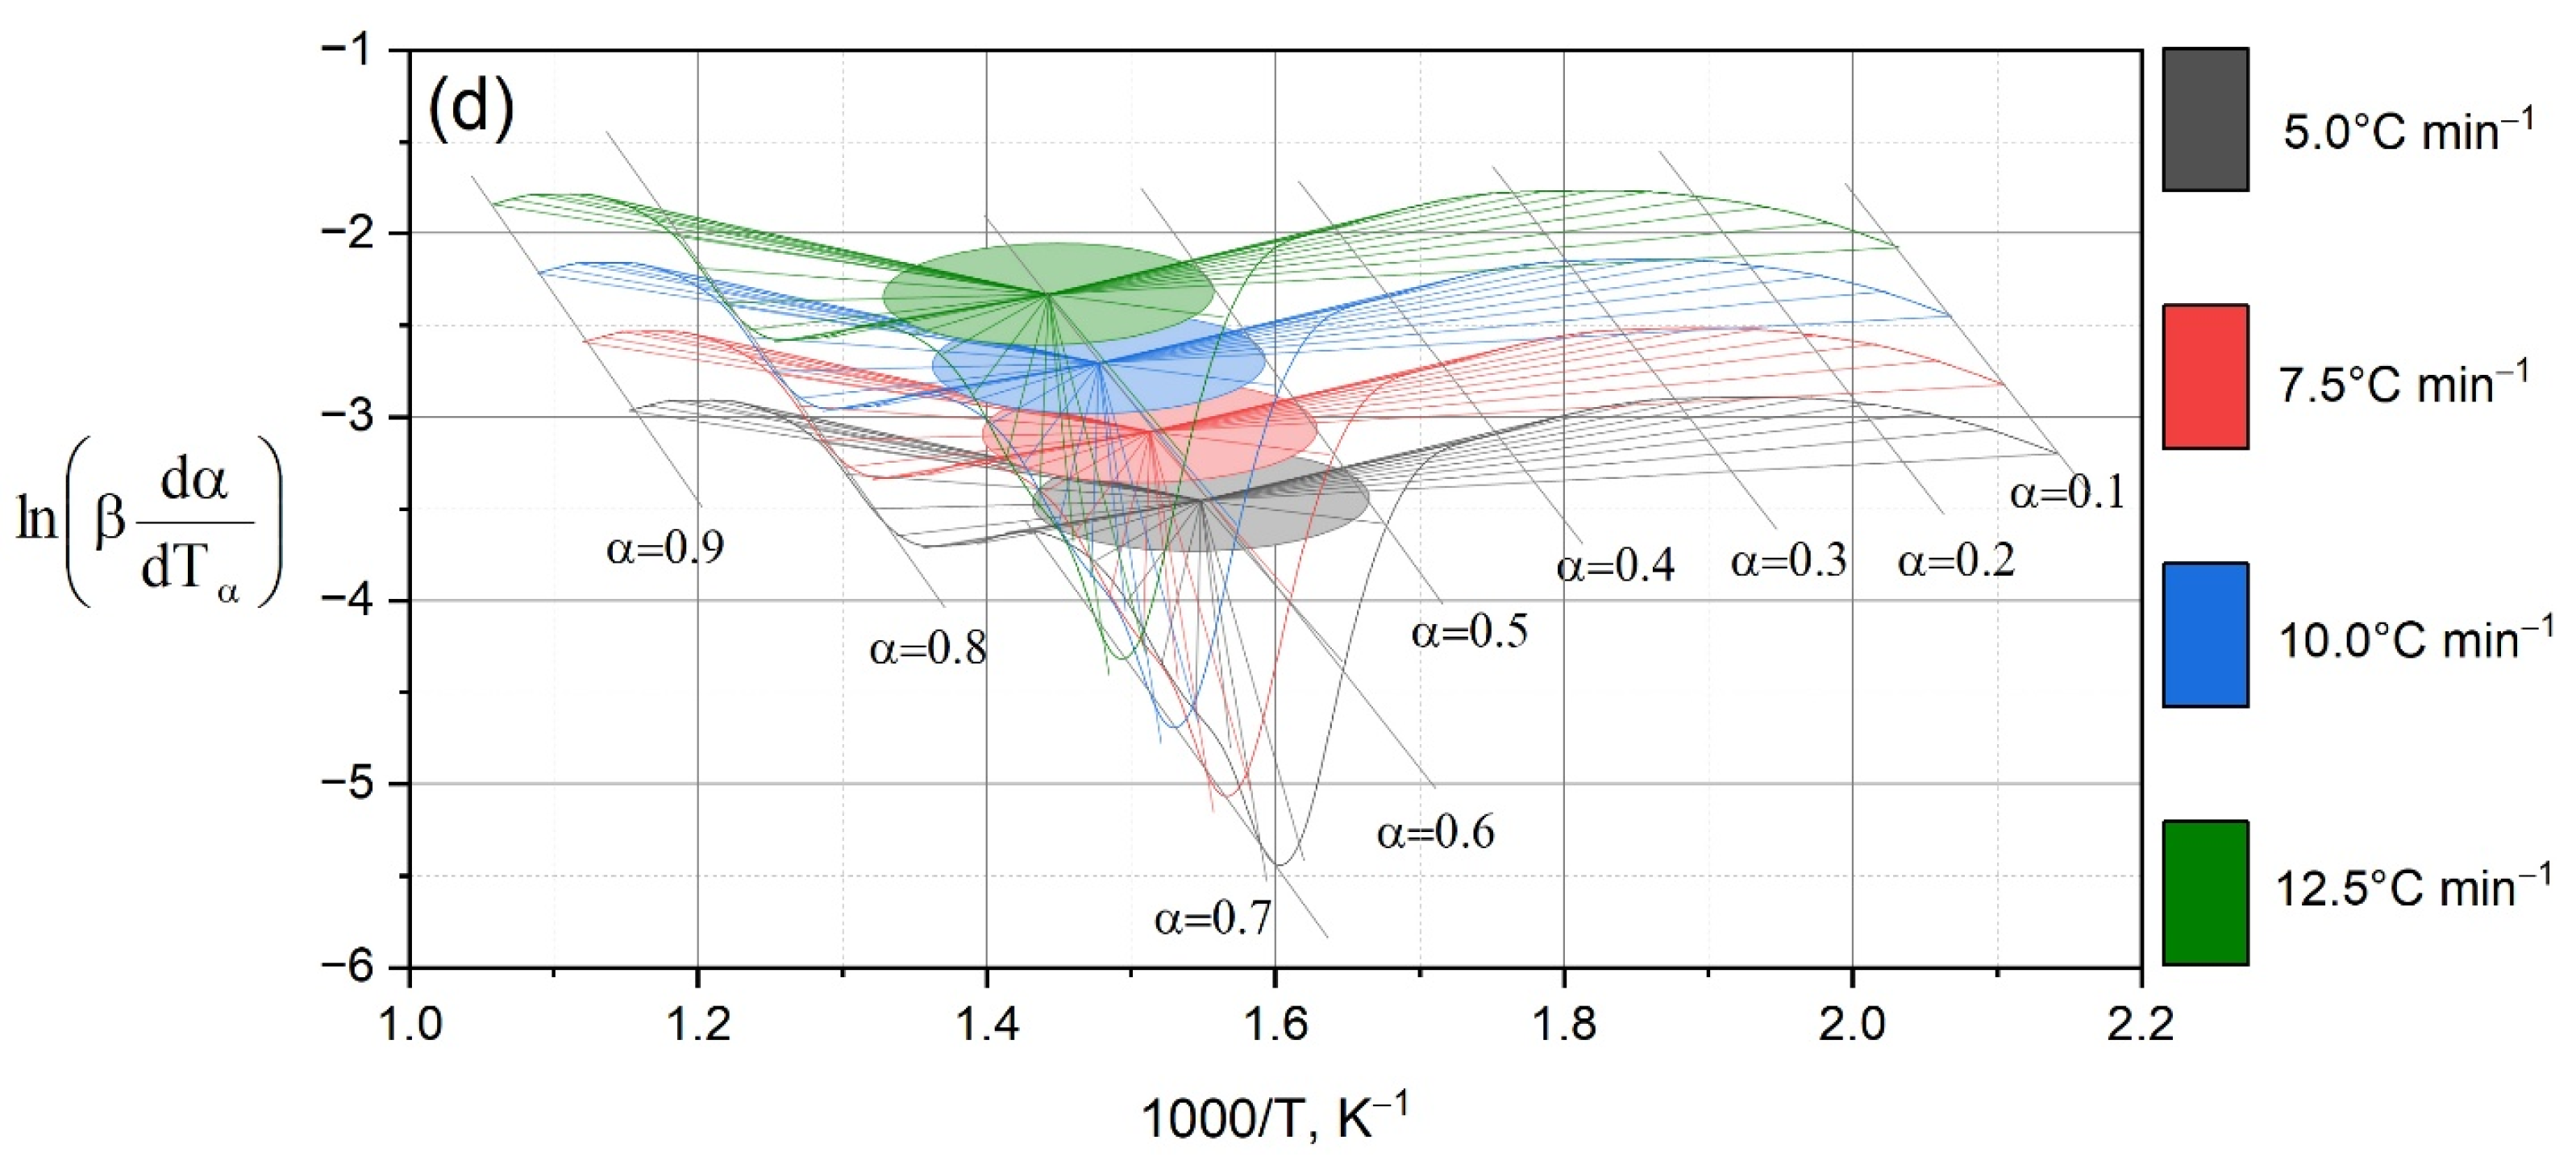
Three-dimensional dependencies (
Figure 3) and dα/dT curves (
Figure 4) demonstrate that the maximum conversion rate for OS is achieved at a higher temperature than for mixtures. At the same time, as the proportion of OS in the mixture increases, the reaction rate peak shifts to higher temperatures and the peak width increases. These data indicate the multistage nature of the processes and partial stabilization of the residue due to the mineral matrix of the shale.
It should be noted that a slight increase in the content of oil shale from 13 to 16% leads to radical changes in the shape of the dα/dT curves (
Figure 4). If the degradation rate profile remains relatively symmetrical for the mixture of HFCT + 13% OS, then at 16% OS there is a shift and broadening of the peaks, which indicates the overlap of additional steps. This effect is confirmed by kinematic data: the activation energy in the sample with 13% OS remains stable (≈85–86 kJ·mol
−1), while at 16% OS, at high degrees of conversion,
Ea increases to 99–101 kJ·mol
−1 (
Table 2,
Figure 5). Thus, with an increase in OS content of only 3%, the system transitions to the region of mineral dominance: the processes of dihydroxylation of clay phases and decarbonization of calcium-containing components of the mineral matrix begin to determine the thermal behavior of the system, intensified by the superposition of secondary coking reactions of the organic part.
Calculations according to the Šesták–Berggren model approach (
Table 3) show that the decomposition of OS obeys a mixed mechanism with a predominance of diffusion and reaction stages (m ≈ 0.54;
n ≈ 0.64). For mixtures of HFCT + OS, a decrease in the parameters m and
n is observed, which indicates the dominance of the destruction and hydrogenation reaction with less influence of diffusion restrictions. The pre-exponential factor A is also reduced for mixtures, which indirectly reflects the facilitation of the hydrogen transfer mechanism.
Comparison of model-free (Friedman, OFW) and model (S-B) methods (
Table 2 and
Table 3) showed good agreement: ANOVA (F = 0.0021,
p = 0.9638) and paired
t-test (t = 0.9268,
p = 0.3811) showed no statistically significant differences. This confirms the reliability and reproducibility of the obtained kinetic parameters. It should be noted that isoconversion methods (Friedman, OFW) have certain limitations: they are sensitive to experimental noise at low and high degrees of transformation and assume a quasi-step nature of the process with a fixed α value. The Shestak-Bergren (S-B) method, in turn, depends on the choice of a set of a priori kinetic functions and in some cases can give non-unique solutions when describing multi-stage processes. Despite these limitations, statistical analysis (ANOVA and paired
t-test) showed no significant differences between the results of model and non-model approaches (
p > 0.05), which confirms the consistency of the methods and the reliability of the calculated parameters.
Thus, the combined use of Friedman, OFW, and S–B provides a balance between non-model and model analysis, increases the reliability of the obtained kinetic parameters, and enables their mechanistic interpretation when studying the thermal destruction of HFCT–OS systems.
The combined use of TG/DTG, isoconversion, and model methods showed that the addition of shale to HFCT reduces the activation energy and facilitates thermal destruction, with the optimal ratio being achieved at 13% OS. With a further increase in the proportion of shale, the decomposition kinetics are determined by the mineral matrix, which is accompanied by a complication of the mechanism and an increase in Ea. This balance between the organic and mineral phases opens up opportunities for intensifying hydrometallization and the subsequent selective extraction of rare earth elements from the solid residue.
At the next stage of work, the content of rare and dispersed trace elements in the initial oil shale and in the heavy fraction of coal tar was determined. Based on the data of TG/DTG analysis and calculations of kinetic parameters, it was established that a mixture of HFCT with the addition of 13 wt% of OS is optimal for hydrodemetallization. In this regard, this mixture (HFCT + 13% OS), prepared by mechanical mixing of components, that was chosen for further experiments. The general logic of the study and the sequence of experimental procedures, including the stages of hydrodemetallization, separation of products and analytical determination of the composition, are presented in the flow chart (
Figure 1), which serves as the methodological basis for the work. Results of determination of rare and scattered trace elements content in samples of OS, HFCT and HFCT + 13% OS are given in
Table 4.
To determine the optimal conditions for the hydrodemetallization of the HFCT + 13% OS mixture, a series of experiments was conducted over a temperature range of 380–420 °C and reaction durations from 15 to 75 min.
The optimal process duration was established by comparing the dynamics of rare and dispersed trace element accumulation in the solid hydrodemetallization residue with the yield of the target hydrocarbon fractions. As shown in
Figure 6, the maximum total content of rare and dispersed microelements elements, reaching 66,000 g/t, was achieved after 75 min of treatment at 420 °C and 4 MPa.
However, the results shown in
Table 5 indicate that increasing the duration beyond 60 min has virtually no effect on the yield of light fractions (60.5 → 60.8%), but is accompanied by an increase in the amount of solid residue (19.9 → 25.8%). A similar dependence is observed with changes in temperature: at 420 °C, the maximum yield of liquid products is achieved (62.6%), while at 380–400 °C, this figure is only 50–59.6%. Thus, the optimal process conditions are determined as follows: OS: HFCT ratio = 0.13:1, temperature 420 °C, reaction time 60 min, and initial hydrogen pressure 4 MPa.
The initial hydrogen pressure was set at 4 MPa, which corresponds to the recommended range for hydroprocessing of heavy hydrocarbon systems. Thus, hydrogenation of distillates at 4 MPa and 350 °C showed high efficiency [
38]. A comparative analysis of hydrotreating at 4 MPa and 8 MPa [
39] revealed only a slight advantage of higher pressure, which confirms the feasibility of using 4 MPa as optimal. Additionally, studies [
40] have shown that above a certain pressure, efficiency does not increase, but only gas consumption increases and equipment becomes more complex.
It should be noted that the dynamics of solid residue yield is nonlinear (
Table 5). When the reaction time is increased from 15 to 30 min, its amount decreases (from 12 to 5.7%), which is associated with the intensive destruction and hydrogenation of the organic phase, ensuring the maximum yield of liquid products. However, with a further increase in time to 45 min, the solid residue yield increases to 14.9%, which indicates the development of secondary processes of polycondensation and coking of heavy compounds, catalyzed by the mineral part of the shale. This behavior is consistent with the literature data on the mechanisms of carbon residue formation in the processing of heavy hydrocarbons [
41,
42].
As shown in
Table 5, the optimal duration of the hydrodemetallization process is about 60 min, at which the maximum yield of light fractions is achieved with moderate formation of a solid residue. Another important factor determining the depth of processing of the HFCT + OS mixture is the process temperature. The yield of light fractions increases from 400 to 420 °C to 62.3%. Increasing the temperature increases the solids yield from 12.0% to 16%.
The nonlinear dynamics of the solid residue yield (
Table 5) is consistent with the results of the authors [
41], which also noted the development of polycondensation processes with an increase in the reaction time, but the relationship we observed is enhanced due to the catalytic activity of shale minerals.
For a more detailed assessment of the quality of the fractions obtained, an analysis of their group composition was carried out.
Table 6 shows the distribution of the main hydrocarbon classes in the light and middle fractions. The group composition of the hydrocarbon fractions shows a significant proportion of paraffinic hydrocarbons and phenols. For the light fraction, paraffins make up 39.5%, phenols—24.7%. The middle fraction is dominated by polycyclic hydrocarbons (27.3%) and phenols (25.1%).
The data obtained show that light and medium fractions require additional post-treatment—hydrotreating to remove sulfur and phenol-containing compounds as motor fuel.
Thus, analysis of the effect of time and temperature (
Table 5) on the distribution of products, as well as determination of the group composition of hydrocarbon fractions (
Table 6) made it possible to establish the optimal conditions for hydrodemetallization of the HFCT + 13% OS mixture: temperature 420 °C, duration 60 min.
However, in addition to the yield of hydrocarbon products, an important indicator is the accumulation of rare and dispersed elements in the solid residue. To evaluate this parameter, an analysis of the solid phase obtained after hydrodemetallization by atomic emission spectroscopy was carried out.
Figure 7 shows the experimentally obtained dependence of the total RDE content in the solid residue when the hydrodemetallization temperature changes in the range of 380–420 °C (60 min, 4 MPa).
Analysis of the data shows that at low temperatures (380–400 °C) the degree of accumulation of trace elements in the solid phase remains relatively low and even shows a slight decrease, which is associated with the partial removal of volatile compounds or their decomposition into the gas phase. However, with a further increase in temperature above 400 °C, there is a sharp increase in the content of trace elements in the solid residue, reaching a maximum value at 420 °C.
This pattern indicates active fixation of residual organometallic compounds in the mineral matrix of oil shale at high temperature, which is consistent with the conclusions of the TG/DTG analysis on the multi-stage decomposition mechanism. At high temperatures, the process of fixing hardly volatile and stable compounds—mainly rare-earth and transition elements—is activated, which additionally forms favorable conditions for their subsequent selective extraction.
The obtained results emphasize the importance of the temperature factor for the formation of the phase composition of the solid residue and create the basis for optimizing the parameters of hydrodemetallization in order to maximize the extraction of rare-earth elements at the final stages of processing.
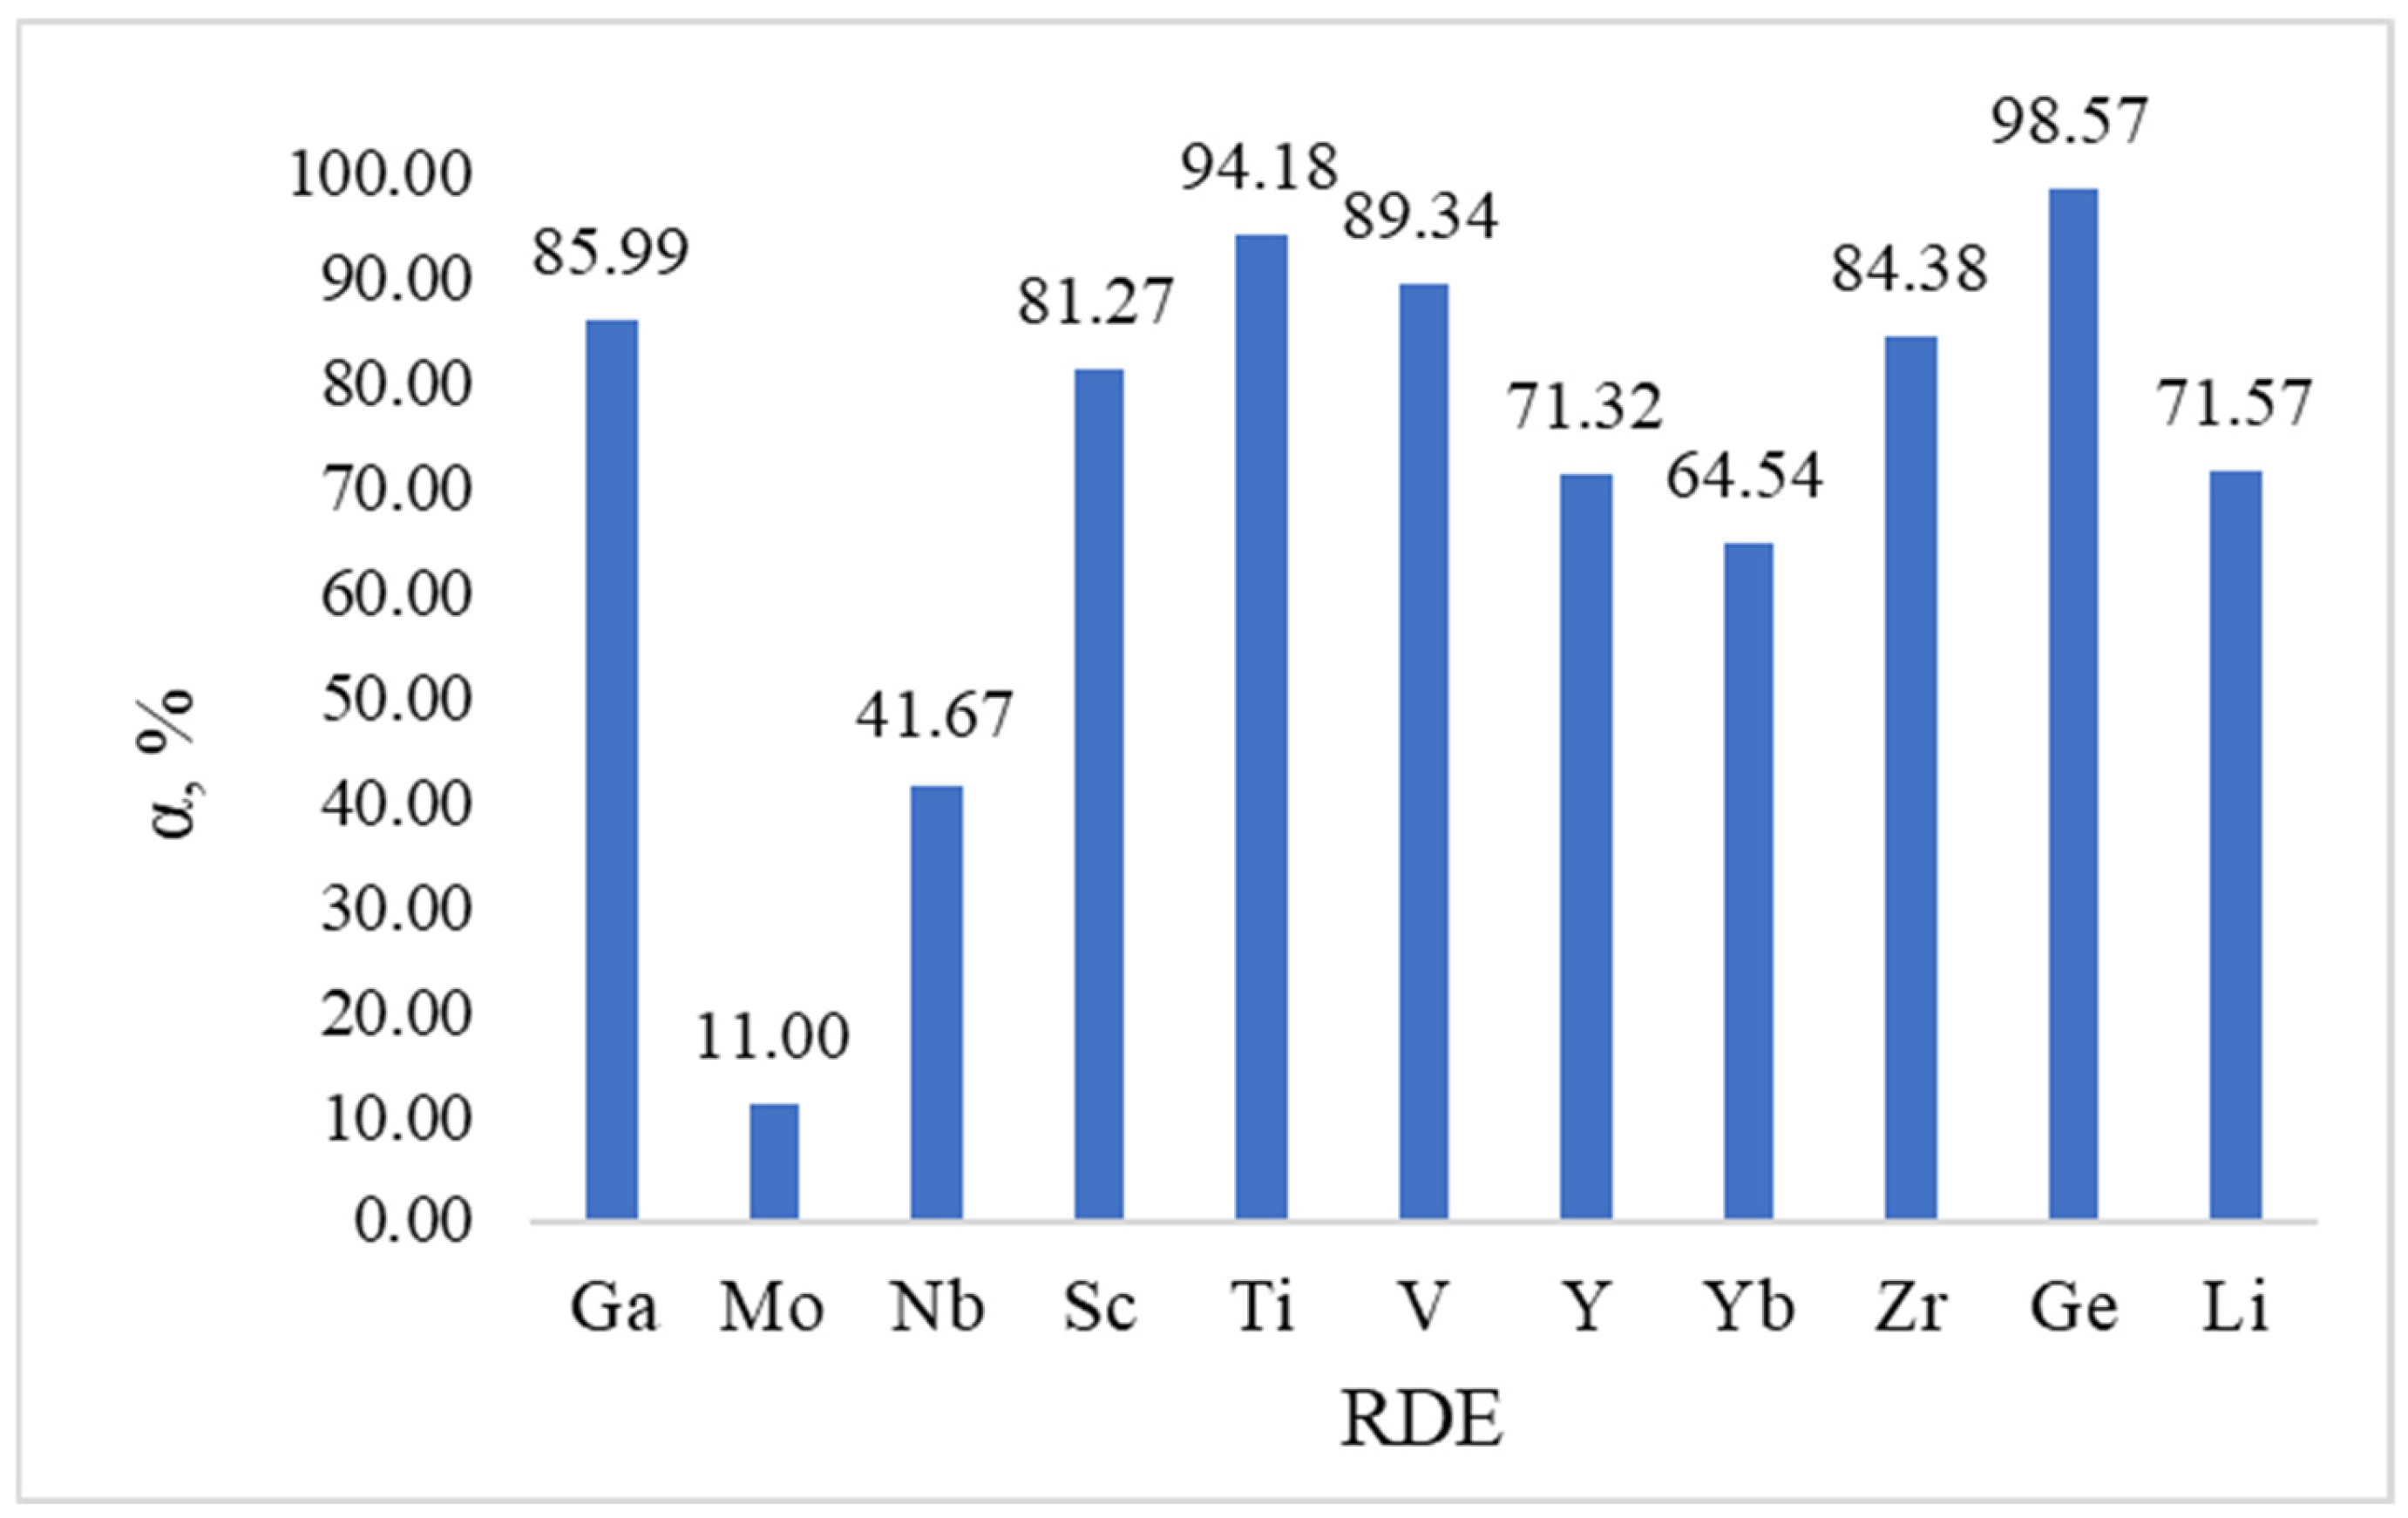
Figure 8 shows data on the degree of demetallization of individual elements from a mixture of a heavy fraction of coal tar (HFCT) with 13% oil shale (OS) of Shubarkol Komir JSC at a temperature of 420 °C, a pressure of 4 MPa and a holding time of 60 min. The data for
Figure 8 were obtained based on atomic emission analysis of the solid residue and liquid fractions after hydrometallization of the HFCT + 13% OS mixture (420 °C, 4 MPa, 60 min). The degree of removal of individual elements was calculated based on the difference between their initial content in the raw material (
Table 4) and the residual content after the process, expressed as a percentage of the initial value.
Analysis of the results shows that a high degree of removal is characteristic of elements Ti, Ge, V and Ga, where the demetallization index exceeds 85–98%. This indicates the high reactivity of the compounds of these elements to hydrogenolysis and their availability for interaction with donor fragments of the hydrocarbon matrix.
At the same time, elements of the group of rare and rare earth metals, such as Y, Yb, Zr and Sc, show an average degree of removal (about 65–85%), which may be due to a stronger association with the OS mineral matrix and the limited availability of these fractions for reaction interaction.
It should be noted that the minimum degree of removal is characteristic of molybdenum (11%). This may be due to its presence in stable compounds, mainly dispersed MoS
2 and organometallic complexes with high thermal stability. Under conditions of 420 °C and 4 MPa, in the absence of an external catalyst, such compounds are practically indestructible. For effective removal of molybdenum, the literature [
41] indicates the need to use Co–Mo or Ni–Mo catalysts and increased hydrogen pressure (≥7–10 MPa). Thus, the low degree of molybdenum removal under our conditions confirms its specific chemical form in the raw material and is consistent with the data of other authors.
The general trend emphasizes that the use of oil shale in the HFCT composition contributes to the formation of a residue with an open porous structure and partial dissociation of complex compounds, which facilitates the removal of most target metals. These data logically complement the results of TG/DTG and kinetic analyses, demonstrating consistency in the mechanism of thermal decomposition and subsequent hydrodemetallization.
The obtained parameters have important practical significance for substantiating the subsequent process flow diagram presented in
Figure 1 for the selective extraction of rare-earth elements from the solid residue, aligning with the research objectives.
Table 7 presents the results of determining the content of individual rare and dispersed trace elements (RDEs) in the hydrodemetallization products of a mixture of the heavy fraction of coal tar with 13% oil shale at 420 °C and a processing time of 60 min. The analysis was performed using inductively coupled plasma atomic emission spectroscopy (ICP-AES).
For a more detailed quantitative assessment of the distribution of trace elements, their concentrations in the hydrometallization products were calculated, and the results are presented in
Table 8. As seen from the data, the majority of rare-earth elements are concentrated in the solid residue, confirming the effectiveness of hydrodemetallization for the subsequent selective extraction of metals. The highest concentrations are observed for titanium (29,094.57 g/t), molybdenum (944.31 g/t), and germanium (59.68 g/t).
The next stage, in accordance with the technological scheme (
Figure 1), was selective adsorption of microelements from the solid residue obtained during hydrometallization of the HFCT + 13% OS mixture at a temperature of 420 °C, with an experiment duration of 60 min and an initial hydrogen pressure of 4 MPa.
Table 9 presents the results of the sorption-based extraction of rare and dispersed trace elements. Following treatment of the solution with ion-exchange resin, the concentrations of most elements decreased significantly. The highest extraction efficiency was observed for germanium, which was completely removed to below the detection limit, as well as for titanium and vanadium, whose concentrations decreased by more than an order of magnitude. Significant reductions were also recorded for gallium, lithium, and molybdenum, confirming the effectiveness of the sorption method in the selective extraction of rare and dispersed trace elements from complex multicomponent systems.
As shown in
Table 8 and further supported by the data in
Figure 8, the highest degree of demetallization is observed for germanium, which is attributed to its high reactivity and strong affinity for sorption. After ashing and fusion of the solid residue, an aqueous filtrate was obtained containing 0.1539 mg/dm
3 of Ge. Following sorption treatment, the concentration decreased to below the detection limit, corresponding to a removal efficiency of 99.99%.
To further assess the residual germanium content, the same filtrate was also analyzed spectrophotometrically using phenylfluorone, as presented in
Table 9.
Based on the results of spectrophotometric determination, the residual mass fraction of Ge was (1.1 ± 0.4) × 10−4% of the ash mass, corresponding to a recovery rate of approximately 45%. The discrepancy between the recovery values obtained via ICP-AES and spectrophotometry is attributed to differences in method sensitivity and the possibility that a portion of the germanium is present in the form of complex or colloidal compounds, which are not directly detected in solution by the spectrophotometric method.
Thus, the use of two independent analytical methods allowed for a more comprehensive assessment of sorption efficiency and confirmed the advantages of the sorption approach for concentrating germanium from dilute multicomponent systems.

