
Extending the Recovery Ratio of Brackish Water Desalination to Zero Liquid Discharge (>95%) Through Combination of Nanofiltration, 2-Stage Reverse-Osmosis, Silica Precipitation, and Mechanical Vapor Recompression


Abstract
1. Introduction
2. Materials and Methods
2.1. Description of the NF and RO Apparatuses and of the Experimental Procedure
2.2. Iron Electro-Dissolution Experiments
2.2.1. Experimental Setup
2.2.2. Jar Test SiO2 Removal Experiments
2.2.3. Fe Electro-Dissolution Treatment of the Real NF-BWRO Brine
2.3. PHREEQC Simulation for Water Characterization
2.4. Retentate Evaporation Simulations
3. Results and Discussion
3.1. Generation of the NF/RO Retentate
3.1.1. Results from the NF Step
3.1.2. Results Derived from Operating the 1st RO Step on the NF Permeate (SW30HRLE)
3.2. Silica Co-Precipitation via Iron Electro-Dissolution
3.2.1. Determination of the Required Iron Dose
3.2.2. Treating the NF/RO Retentate to Attain at Least 50% Reduction in the Silica Concentration
3.3. Results from Operating the 2nd RO Pass on the Treated NF/RO Retentate
3.4. MVR-Based Evaporation/Condensation Stage
3.5. Cost Analysis
4. Conclusions
Supplementary Materials
Author Contributions
Funding
Data Availability Statement
Conflicts of Interest
References
- Qiu, T.; Davies, P.A. Comparison of Configurations for High-Recovery Inland Desalination Systems. Water 2012, 4, 690–706. [Google Scholar] [CrossRef]
- Dilaver, M.; Çelebi, M.D.; Ağtaş, M.; Koyuncu, İ. Brackish water RO concentrate treatment and water recovery using cost lowering integrated technology. J. Environ. Chem. Eng. 2022, 10, 108463. [Google Scholar] [CrossRef]
- Altaee, A.; Hilal, N. High recovery rate NF–FO–RO hybrid system for inland brackish water treatment. Desalination 2015, 363, 19–25. [Google Scholar] [CrossRef]
- Gabelich, C.J.; Rahardianto, A.; Northrup, C.R.; Yun, T.I.; Cohen, Y. Process evaluation of intermediate chemical demineralization for water recovery enhancement in production-scale brackish water desalting. Desalination 2011, 272, 36–45. [Google Scholar] [CrossRef]
- Nativ, P.; Leifman, O.; Lahav, O.; Epsztein, R. Desalinated brackish water with improved mineral composition using monovalent-selective nanofiltration followed by reverse osmosis. Desalination 2021, 520, 115364. [Google Scholar] [CrossRef]
- Gräber, Y.; Nativ, P.; Lahav, O. A pre-treatment concept for increasing the recovery ratio of coastline BWRO plants, while providing Mg2+ in the product water. Desalination 2021, 515, 115202. [Google Scholar] [CrossRef]
- Rahardianto, A.; Gao, J.; Gabelich, C.J.; Williams, M.D.; Cohen, Y. High recovery membrane desalting of low-salinity brackish water: Integration of accelerated precipitation softening with membrane RO. J. Membr. Sci. 2007, 289, 123–137. [Google Scholar] [CrossRef]
- Park, K.; Davies, P.A. A compact hybrid batch/semi-batch reverse osmosis (HBSRO) system for high-recovery, low-energy desalination. Desalination 2021, 504, 114976. [Google Scholar] [CrossRef]
- Rioyo, J.; Aravinthan, V.; Bundschuh, J.; Lynch, M. A review of strategies for RO brine minimization in inland desalination plants. Desalination Water Treat. 2017, 90, 110–123. [Google Scholar] [CrossRef]
- Duke, M.C.; Dow, N. Membrane Distillation for Industrial Water Treatment. In Membrane Distillation, 1st ed.; Lu, K.-J., Chung, T.-S., Eds.; CRC Press: Boca Raton, FL, USA, 2019; pp. 371–396. [Google Scholar] [CrossRef]
- Wang, Z.; Deshmukh, A.; Du, Y.; Elimelech, M. Minimal and zero liquid discharge with reverse osmosis using low-salt-rejection membranes. Water Res. 2020, 170, 115317. [Google Scholar] [CrossRef]
- Den, W.; Wang, C.-J. Removal of silica from brackish water by electrocoagulation pretreatment to prevent fouling of reverse osmosis membranes. Sep. Purif. Technol. 2008, 59, 318–325. [Google Scholar] [CrossRef]
- Badruzzaman, M.; Subramani, A.; DeCarolis, J.; Pearce, W.; Jacangelo, J.G. Impacts of silica on the sustainable productivity of reverse osmosis membranes treating low-salinity brackish groundwater. Desalination 2011, 279, 210–218. [Google Scholar] [CrossRef]
- Rathinam, K.; Abraham, S.; Oren, Y.; Schwahn, D.; Petry, W.; Kaufman, Y.; Kasher, R. Surface-Induced Silica Scaling during Brackish Water Desalination: The Role of Surface Charge and Specific Chemical Groups. Environ. Sci. Technol. 2019, 53, 5202–5211. [Google Scholar] [CrossRef] [PubMed]
- Elazhar, F.; Elazhar, M.; El-Ghzizel, S.; Tahaikt, M.; Zait, M.; Dhiba, D.; Elmidaoui, A.; Taky, M. Nanofiltration-reverse osmosis hybrid process for hardness removal in brackish water with higher recovery rate and minimization of brine discharges. Process Saf. Environ. Prot. 2021, 153, 376–383. [Google Scholar] [CrossRef]
- Panagopoulos, A.; Haralambous, K.-J.; Loizidou, M. Desalination brine disposal methods and treatment technologies—A review. Sci. Total Environ. 2019, 693, 133545. [Google Scholar] [CrossRef]
- Cuartas-Uribe, B.; Alcaina-Miranda, M.I.; Soriano-Costa, E.; Bes-Piá, A. Comparison of the behavior of two nanofiltration membranes for sweet whey demineralization. J. Dairy Sci. 2007, 90, 1094–1101. [Google Scholar] [CrossRef]
- Guastalli, A.R.; Labanda, J.; Llorens, J. Separation of phosphoric acid from an industrial rinsing water by means of nanofiltration. Desalination 2009, 243, 218–228. [Google Scholar] [CrossRef]
- Al-Amoudi, A.; Williams, P.; Al-Hobaib, A.S.; Lovitt, R.W. Cleaning results of new and fouled nanofiltration membrane characterized by contact angle, updated DSPM, flux and salts rejection. Appl. Surf. Sci. 2008, 254, 3983–3992. [Google Scholar] [CrossRef]
- Cissé, M.; Vaillant, F.; Pallet, D.; Dornier, M. Selecting ultrafiltration and nanofiltration membranes to concentrate anthocyanins from roselle extract (Hibiscus sabdariffa L.). Food Res. Int. 2011, 44, 2607–2614. [Google Scholar] [CrossRef]
- Ecker, J.; Raab, T.; Harasek, M. Nanofiltration as key technology for the separation of LA and AA. J. Membr. Sci. 2012, 389, 389–398. [Google Scholar] [CrossRef]
- Diawara, C.K.; Paugam, L.; Pontié, M.; Schlumpf, J.P.; Jaouen, P.; Quéméneur, F. Influence of chloride, nitrate, and sulphate on the removal of fluoride ions by using nanofiltration membranes. Sep. Sci. Technol. 2005, 40, 3339–3347. [Google Scholar] [CrossRef]
- Hofs, B.; Schurer, R.; Harmsen, D.J.H.; Ceccarelli, C.; Beerendonk, E.F.; Cornelissen, E.R. Characterization and performance of a commercial thin film nanocomposite seawater reverse osmosis membrane and comparison with a thin film composite. J. Membr. Sci. 2013, 446, 68–78. [Google Scholar] [CrossRef]
- Favre-Réguillon, A.; Lebuzit, G.; Murat, D.; Foos, J.; Mansour, C.; Draye, M. Selective removal of dissolved uranium in drinking water by nanofiltration. Water Res. 2008, 42, 1160–1166. [Google Scholar] [CrossRef]
- Epsztein, R.; Nir, O.; Lahav, O.; Green, M. Selective nitrate removal from groundwater using a hybrid nanofiltration–reverse osmosis filtration scheme. Chem. Eng. J. 2015, 279, 372–378. [Google Scholar] [CrossRef]
- Petrinić; Pušić, T.; Mijatović, I.; Simončič, B.; Turk, S.Š. Characterization of polymeric nanofiltration membranes. Kem. U Ind. /J. Chem. Chem. Eng. 2007, 56, 561–567. [Google Scholar]
- Al-Amoudi, A.; Williams, P.; Mandale, S.; Lovitt, R.W. Cleaning results of new and fouled nanofiltration membrane characterized by zeta potential and permeability. Sep. Purif. Technol. 2007, 54, 234–240. [Google Scholar] [CrossRef]
- Hu, K.; Dickson, J.M. Nanofiltration membrane performance on fluoride removal from water. J. Membr. Sci. 2006, 279, 529–538. [Google Scholar] [CrossRef]
- Rice, E.W.; Eaton, A.D.; Baird, R.B. Standard Methods for the Examination of Water and Wastewater; American Public Health Association, American Water Works Association and Water Environmental Federation: Washington, DC, USA, 2017. [Google Scholar]
- W.T. & S. SUEZ, Winflows 4.03—Membrane System Design Software. 2021. Available online: https://www.suezwatertechnologies.com/resources/winflows (accessed on 1 January 2025).
- Morgan, B.; Lahav, O. The effect of pH on the kinetics of spontaneous Fe(II) oxidation by O2 in aqueous solution—Basic principles and a simple heuristic description. Chemosphere 2007, 68, 2080–2084. [Google Scholar] [CrossRef]
- Charlton, S.R.; Parkhurst, D.L. Modules based on the geochemical model PHREEQC for use in scripting and programming languages. Comput. Geosci. 2011, 37, 1653–1663. [Google Scholar] [CrossRef]
- Nativ, P.; Birnhack, L.; Lahav, O. DiaNanofiltration-based method for inexpensive and selective separation of Mg2+ and Ca2+ ions from seawater, for improving the quality of soft and desalinated waters. Sep. Purif. Technol. 2016, 166, 83–91. [Google Scholar] [CrossRef]
- VitecTM 4000, Mining Antiscalants—AvistaTM, Avista Membrane Treatment Solutions. Available online: https://avistamembranesolutions.com/products/vitec-4000/ (accessed on 7 November 2024).
- Wang, N.; Jiang, W.; Fang, L. Cleaning Process Research of MVR High Concentration Salty Wastewater Treatment System. MATEC Web Conf. 2015, 25, 04008. [Google Scholar] [CrossRef]
- Shen, J.; Tan, N.; Li, Z.; Zhang, J. Analysis of a novel double-effect split mechanical vapor recompression systems for wastewater concentration. Appl. Therm. Eng. 2022, 216, 119019. [Google Scholar] [CrossRef]
- Mahmood, M.; Yasri, N.; Fuladpanjeh-Hojaghan, B.; Roberts, E.P.L. Influence of operating conditions on the removal of silica and hardness by continuous electrocoagulation. J. Environ. Chem. Eng. 2022, 10, 108899. [Google Scholar] [CrossRef]
- Den, W.; Huang, C.; Ke, H.-C. Mechanistic Study on the Continuous Flow Electrocoagulation of Silica Nanoparticles from Polishing Wastewater. Ind. Eng. Chem. Res. 2006, 45, 3644–3651. [Google Scholar] [CrossRef]
- Georgaki; Dudeney, A.W.L.; Monhemius, A.J. Characterisation of iron-rich sludge: Correlations between reactivity; density; structure. Miner. Eng. 2004, 17, 305–316. [Google Scholar] [CrossRef]
- Filter Press, Filter Press Plate, Filter Cloth, Filter Press Pump, Pneumatic Diaphragm Pump Manufacturers and Factory China—SINO, (n.d.). Available online: https://www.sinofilterpresses.com/ (accessed on 27 February 2025).
- Peters, M.; Timmerhaus, T.; West, R. Plant Design and Economics for Chemical Engineers, 5th ed.; McGraw Hill: New York, NY, USA, 2002. [Google Scholar]
- Couper, J.R.; Penney, W.R.; Fair, J.R.; Walas, S.M. Chemical Process Equipment: Selection and Design; Elsevier: Amsterdam, The Netherlands, 2005. [Google Scholar]
- United States Effective Federal Funds Rate (n.d.). Available online: https://tradingeconomics.com/united-states/effective-federal-funds-rate (accessed on 27 February 2025).
- Interest Rates, Department of the Environment (n.d.). Available online: https://mde.maryland.gov/programs/water/WQFA/Pages/default.aspx (accessed on 27 February 2025).
- Interest Rates|Clean Water Fund Program and Safe Drinking Water Loan Program|Wisconsin DNR (n.d.). Available online: https://dnr.wisconsin.gov/aid/documents/EIF/Guide/Interest.html (accessed on 27 February 2025).
- Statista Inc. 2022. Available online: https://www.statista.com/statistics/916733/us-salt-prices-by-type/ (accessed on 10 April 2025).
- U.S. Energy Information Administration. Electric Power Monthly: With Data for April 2023, Independent Statistics & Analysis; U.S. Department of Energy: Washington, DC, USA, 2023. [CrossRef]
- Kurita Vitec 4000 Antiscalant—Heydkamp Online-Shop, (n.d.). Available online: https://shop.heydkamp.de/en/p/kurita-vitec-4000-antiscalant (accessed on 27 February 2025).
- Ruiz-García, A.; Feo-García, J. Operating and Maintenance Cost in Seawater Reverse Osmosis Desalination Plants. Artificial Neural Network Based Model. Desalination Water Treat. 2017, 73, 73–79. [Google Scholar] [CrossRef]
- Ucevli; Kaya, Y. A comparative study of membrane filtration, electrocoagulation, chemical coagulation and their hybrid processes for greywater treatment. J. Environ. Chem. Eng. 2021, 9, 104946. [Google Scholar] [CrossRef]
- Anderson, S.T.; Jahediesfanjani, H. Estimating the net costs of brine production and disposal to expand pressure-limited dynamic capacity for basin-scale CO2 storage in a saline formation. Int. J. Greenh. Gas Control 2020, 102, 103161. [Google Scholar] [CrossRef]
- Dysert, L.R. Sharpen your cost estimating skills. Chem. Eng. 2001, 8, 70–74+76+78. [Google Scholar]


| Treatment Train | Description | Final RR |
|---|---|---|
| >NF-FO-BWRO [1] | >A hybrid system combining nanofiltration (NF), forward osmosis (FO), and brackish water reverse osmosis (BWRO). This system utilizes the high rejection rate of NF for salt removal and the efficiency of FO for water extraction, improving the overall recovery of the RO system. | >~90% |
| >HBSRO [8] | >A hybrid batch/semi-batch reverse osmosis (HBSRO) system for high-recovery desalination. It involves three phases—semi-batch pressurization, batch pressurization, and purge-and-refill—resulting in a compact system size and lower energy consumption at high recovery rates. | >>90% |
| >CIX + RO (with seawater regeneration of CIX resin) [6] | >This process involves a cation exchange (CIX) unit to remove calcium and magnesium ions from the brackish water before it enters the RO unit. The CIX resin is regenerated using seawater, reducing the need for fresh water and increasing cost-effectiveness. This approach can increase the recovery ratio from 78% to 89%. | >89% |
| >NF-RO + blending [15] | >This process utilizes NF to pre-treat the brackish water and remove a portion of the salts. The NF permeate is then blended with the RO permeate to adjust the final salinity and mineral content of the product water, while achieving a high overall recovery ratio. | >95% |
| >Two-stage RO [9] | >This process is based on two RO units in series. The first stage operates at a lower recovery ratio, producing a permeate stream and a concentrate stream. The concentrate stream from the first stage is then fed to the second stage, which operates at a higher recovery ratio, further increasing the overall recovery. | >80% |
| >Closed circuit desalination [10] | >This process involves recirculating the RO concentrate back to the feed water, minimizing the volume of brine that needs to be discharged. It often involves using additional treatment methods, such as evaporation or crystallization, to manage the increasing salinity in the recirculating stream. | >97% |
| >APS + secondary RO [7] | >This method utilizes accelerated precipitation softening (APS) to remove hardness ions from the brackish water before it enters the first RO unit. This pre-treatment reduces scaling potential and allows for a higher recovery ratio in the secondary RO stage. | >98% |
| >Intermediate chemical demineralization + RO [4] | >This process utilizes chemical treatment for partial demineralization of the brackish water, typically by removing hardness ions. The treated water then undergoes RO for further desalination, resulting in a higher overall water recovery. The process increases the recovery ratio from 85% to 95%. | >95% |
| >NF-RO and Mg mineralization [5] | >The study proposes a hybrid nanofiltration-reverse osmosis scheme to enhance the mineral composition of desalinated brackish water, demonstrating economic viability and recovery ratios as high as 85%. | >85% |
| LSRRO [11] | The study employs low salt rejection membranes, placed in series to desalinate brine into a highly saline water (up to 4 mol/L) in small intervals, using a normal RO pressure of 70 bars, thus enabling an energy-efficient (<4 kWh/m3) desalination. | >95% (ZLD) |
| Parameter | Unit | Value |
|---|---|---|
| Ca2+ | mg/L | 201 |
| Mg2+ | mg/L | 198 |
| Na+ | mg/L | 1378 |
| K+ | mg/L | 44 |
| Ba2+ | mg/L | 0.11 |
| Sr2+ | mg/L | - |
| SO42− | mg/L | 3852 |
| Cl− | mg/L | 1970 |
| F− | mg/L | 0.5 |
| NO3− | mg/L | 6 |
| SiO2 | mg/L | 20 |
| Alkalinity | mg/L as CaCO3 | 305 |
| pH | (-) | 6.90 |
| Parameter | Unit | DL | Reference | SW30HRLE | Reference |
|---|---|---|---|---|---|
| Molecular weight cut-off (MWCO) | Da | 150–300 | GE Osmonics | - | |
| MgSO4 rejection | % | 98 | GE Osmonics | 99.8 | FilmTec |
| Polymer type | - | Polyamide (TFC) | GE Osmonics | Polyamide (TFC) | FilmTec |
| Water permeability | L m−2 h−1 bar−1 | 3.5–10 | [17,18,19,20,21,22] | 0.9–1 | [23] |
| Na+ rejection | % | 5–30 | [19,24,25] | 99.8 | FilmTec |
| Mg2+ rejection | % | 20–50 | [24] | 99.8 | FilmTec |
| Zeta potential (at pH 7) | mV | ~ −20 | [26,27] | −15–−30 | [23] |
| Effective pore radius | nm | 0.58–0.7 | [19,28] | - |
| RR | SO42− | SiO2 | Ca2+ | Mg2+ | K+ | Na+ | SI Gypsum |
|---|---|---|---|---|---|---|---|
| % | mg/L | mg/L | mg/L | mg/L | mg/L | mg/L | - |
| 0 | 428 | 20 | 201 | 198 | 44 | 1378 | −1.52 |
| 90 | 3045 ± 87 | 27 ± 0 | 809 ± 4 | 1230 ± 4 | 50 ± 1 | 1458 ± 26 | 0.02 |
| 91 | 3274 ± 9 | 26 ± 0 | 848 ± 11 | 1343 ± 28 | 49 ± 1 | 1478 ± 30 | 0.07 |
| 92 | 3628 ± 136 | 26 ± 0 | 926 ± 1 | 1428 ± 46 | 50 ± 1 | 1443 ± 14 | 0.13 |
| 93 | 4073 ± 117 | 27 ± 0 | 995 ± 25 | 1574 ± 5 | 49 ± 0 | 1447 ± 48 | 0.20 |
| 94 | 4634 ± 138 | 28 ± 0 | 1134 ± 17 | 1791 ± 15 | 50 ± 0 | 1492 ± 18 | 0.26 |
| RR | SO42− | SiO2 | Ca2+ | Mg2+ | K+ | Na+ |
|---|---|---|---|---|---|---|
| % | mg/L | mg/L | mg/L | mg/L | mg/L | mg/L |
| 90 | 31 ± 4 | 20 ± 0 | 122 ± 6 | 67 ± 2 | 43 ± 1 | 1285 ± 17 |
| 91 | 31 ± 1 | 20 ± 0 | 124 ± 1 | 70 ± 0 | 42 ± 0 | 1281 ± 40 |
| 92 | 31 ± 1 | 20 ± 0 | 128 ± 1 | 70 ± 0 | 43 ± 1 | 1252 ± 1 |
| 93 | 33 ± 1 | 20 ± 0 | 131 ± 0 | 72 ± 1 | 43 ± 0 | 1289 ± 10 |
| 94 | 33 ± 2 | 20 ± 0 | 128 ± 0 | 72 ± 2 | 42 ± 0 | 1306 ± 10 |
| RO RR Calculation Based On: | Na+ | K+ | Ca2+ | Mg2+ | SO42− | SiO2 | B | Pressure | ||
|---|---|---|---|---|---|---|---|---|---|---|
| [SiO2] | [Ca2+] | Retentate volume | mg/L | mg/L | mg/L | mg/L | mg/L | mg/L | mg/L | bar |
| 0% | 0% | 0% | 1293 ± 6 | 44 ± 2 | 130 ± 0 | 74 ± 0.5 | 29 ± 0.3 | 19 ± 0 | 0.1 ± 0 | 20 |
| 70% | 71% | 70% | 4248 ± 75 | 144 ± 2 | 443 ± 3 | 251 ± 3 | 109 ± 18 | 65 ± 1 | 0.1 ± 0.1 | 25 |
| 75% | 74% | 75% | 5039 ± 16 | 172 ± 1 | 507 ± 5 | 291 ± 2 | 119 ± 6 | 77 ± 1 | 0 ± 0 | 28 |
| 80% | 80% | 80% | 6275 ± 175 | 215 ± 1 | 635 ± 1 | 356 ± 4 | 150 ± 6 | 95 ± 0 | 0.2 ± 0.2 | 32 |
| 84% | 84% | 85% | 7754 ± 35 | 267 ± 1 | 790 ± 6 | 446 ± 12 | 185 ± 6 | 119 ± 2 | 0 ± 0 | 37 |
| Iron Dose | FeCl3 Dose | Fe Electro-Dissolution | ||||
|---|---|---|---|---|---|---|
| % removal | Current | Time | % removal | |||
| mgFe/L | AVG | STDEV | A | s | AVG | STDEV |
| 80 | 29% | 0.5% | 4 | 41 | 45% | 1.2% |
| 110 | 35% | 2.8% | 4 | 57 | 54% | 4.3% |
| 140 | 41% | 3.0% | 4 | 73 | 60% | 1.5% |
| 170 | 49% | 4.9% | 4 | 88 | 66% | 4.6% |
| RR | RR | SiO2 | Ca2+ | K+ | Mg2+ | Na+ | SO42− | Cl− | Calculated Osmotic Pressure | Applied Pressure |
|---|---|---|---|---|---|---|---|---|---|---|
| By volume | by Ca | mg/L | mg/L | mg/L | mg/L | mg/L | mg/L | mg/L | bar | bar |
| 0 | 0 | 28 ± 0 | 939 ± 8 | 350 ± 6 | 500 ± 3 | 8942 ± 57 | 226 ± 1 | 17,057 ± 0 | 25.1 | 40 |
| 17% | 13% | 34 ± 0 | 1078 ± 7 | 396 ± 5 | 587 ± 4 | 10,584 ± 105 | 264 ± 3 | 20,101 ± 188 | 29.9 | 45 |
| 25% | 20% | 36 ± 0 | 1177 ± 6 | 433 ± 2 | 637 ± 3 | 11,386 ± 51 | 288 ± 2 | 21,677 ± 93 | 32.5 | 48 |
| 33% | 29% | 40 ± 0 | 1312 ± 4 | 485 ± 1 | 707 ± 2 | 12,583 ± 49 | 316 ± 4 | 23,992 ± 87 | 36.2 | 51 |
| 42% | 35% | 44 ± 1 | 1452 ± 15 | 539 ± 7 | 778 ± 8 | 13,818 ± 141 | 348 ± 4 | 26,376 ± 269 | 40.2 | 55 |
| 50% | 43% | 50 ± 1 | 1642 ± 18 | 613 ± 8 | 876 ± 8 | 15,542 ± 199 | 392 ± 4 | 29,691 ± 367 | 45.9 | 60 |
| Purchased Equipment Cost | Equipment for CAPEX Factor | Estimated CAPEX | Normalized Investment [USD /m3] | Normalized Investment [USD /m3/d)] | |
|---|---|---|---|---|---|
| NF/RO1 baseline (82.7% RR) | MUSD 6.953 | 23% | MUSD 30.23 | 0.0953 | 540 |
| NF/RO1/ND/RO2 (87.4% RR) | MUSD 9.017 | 23% | MUSD 39.21 | 0.1236 | 682 |
| MVR (95% RR) | MUSD 8.641 | 40% | MUSD 21.60 | 0.7762 | 4400 |
| Total plant | MUSD 60.81 | 0.1762 | 999 | ||
| Existing Ma’agan Michael reference (82% RR) | 658 (1) |
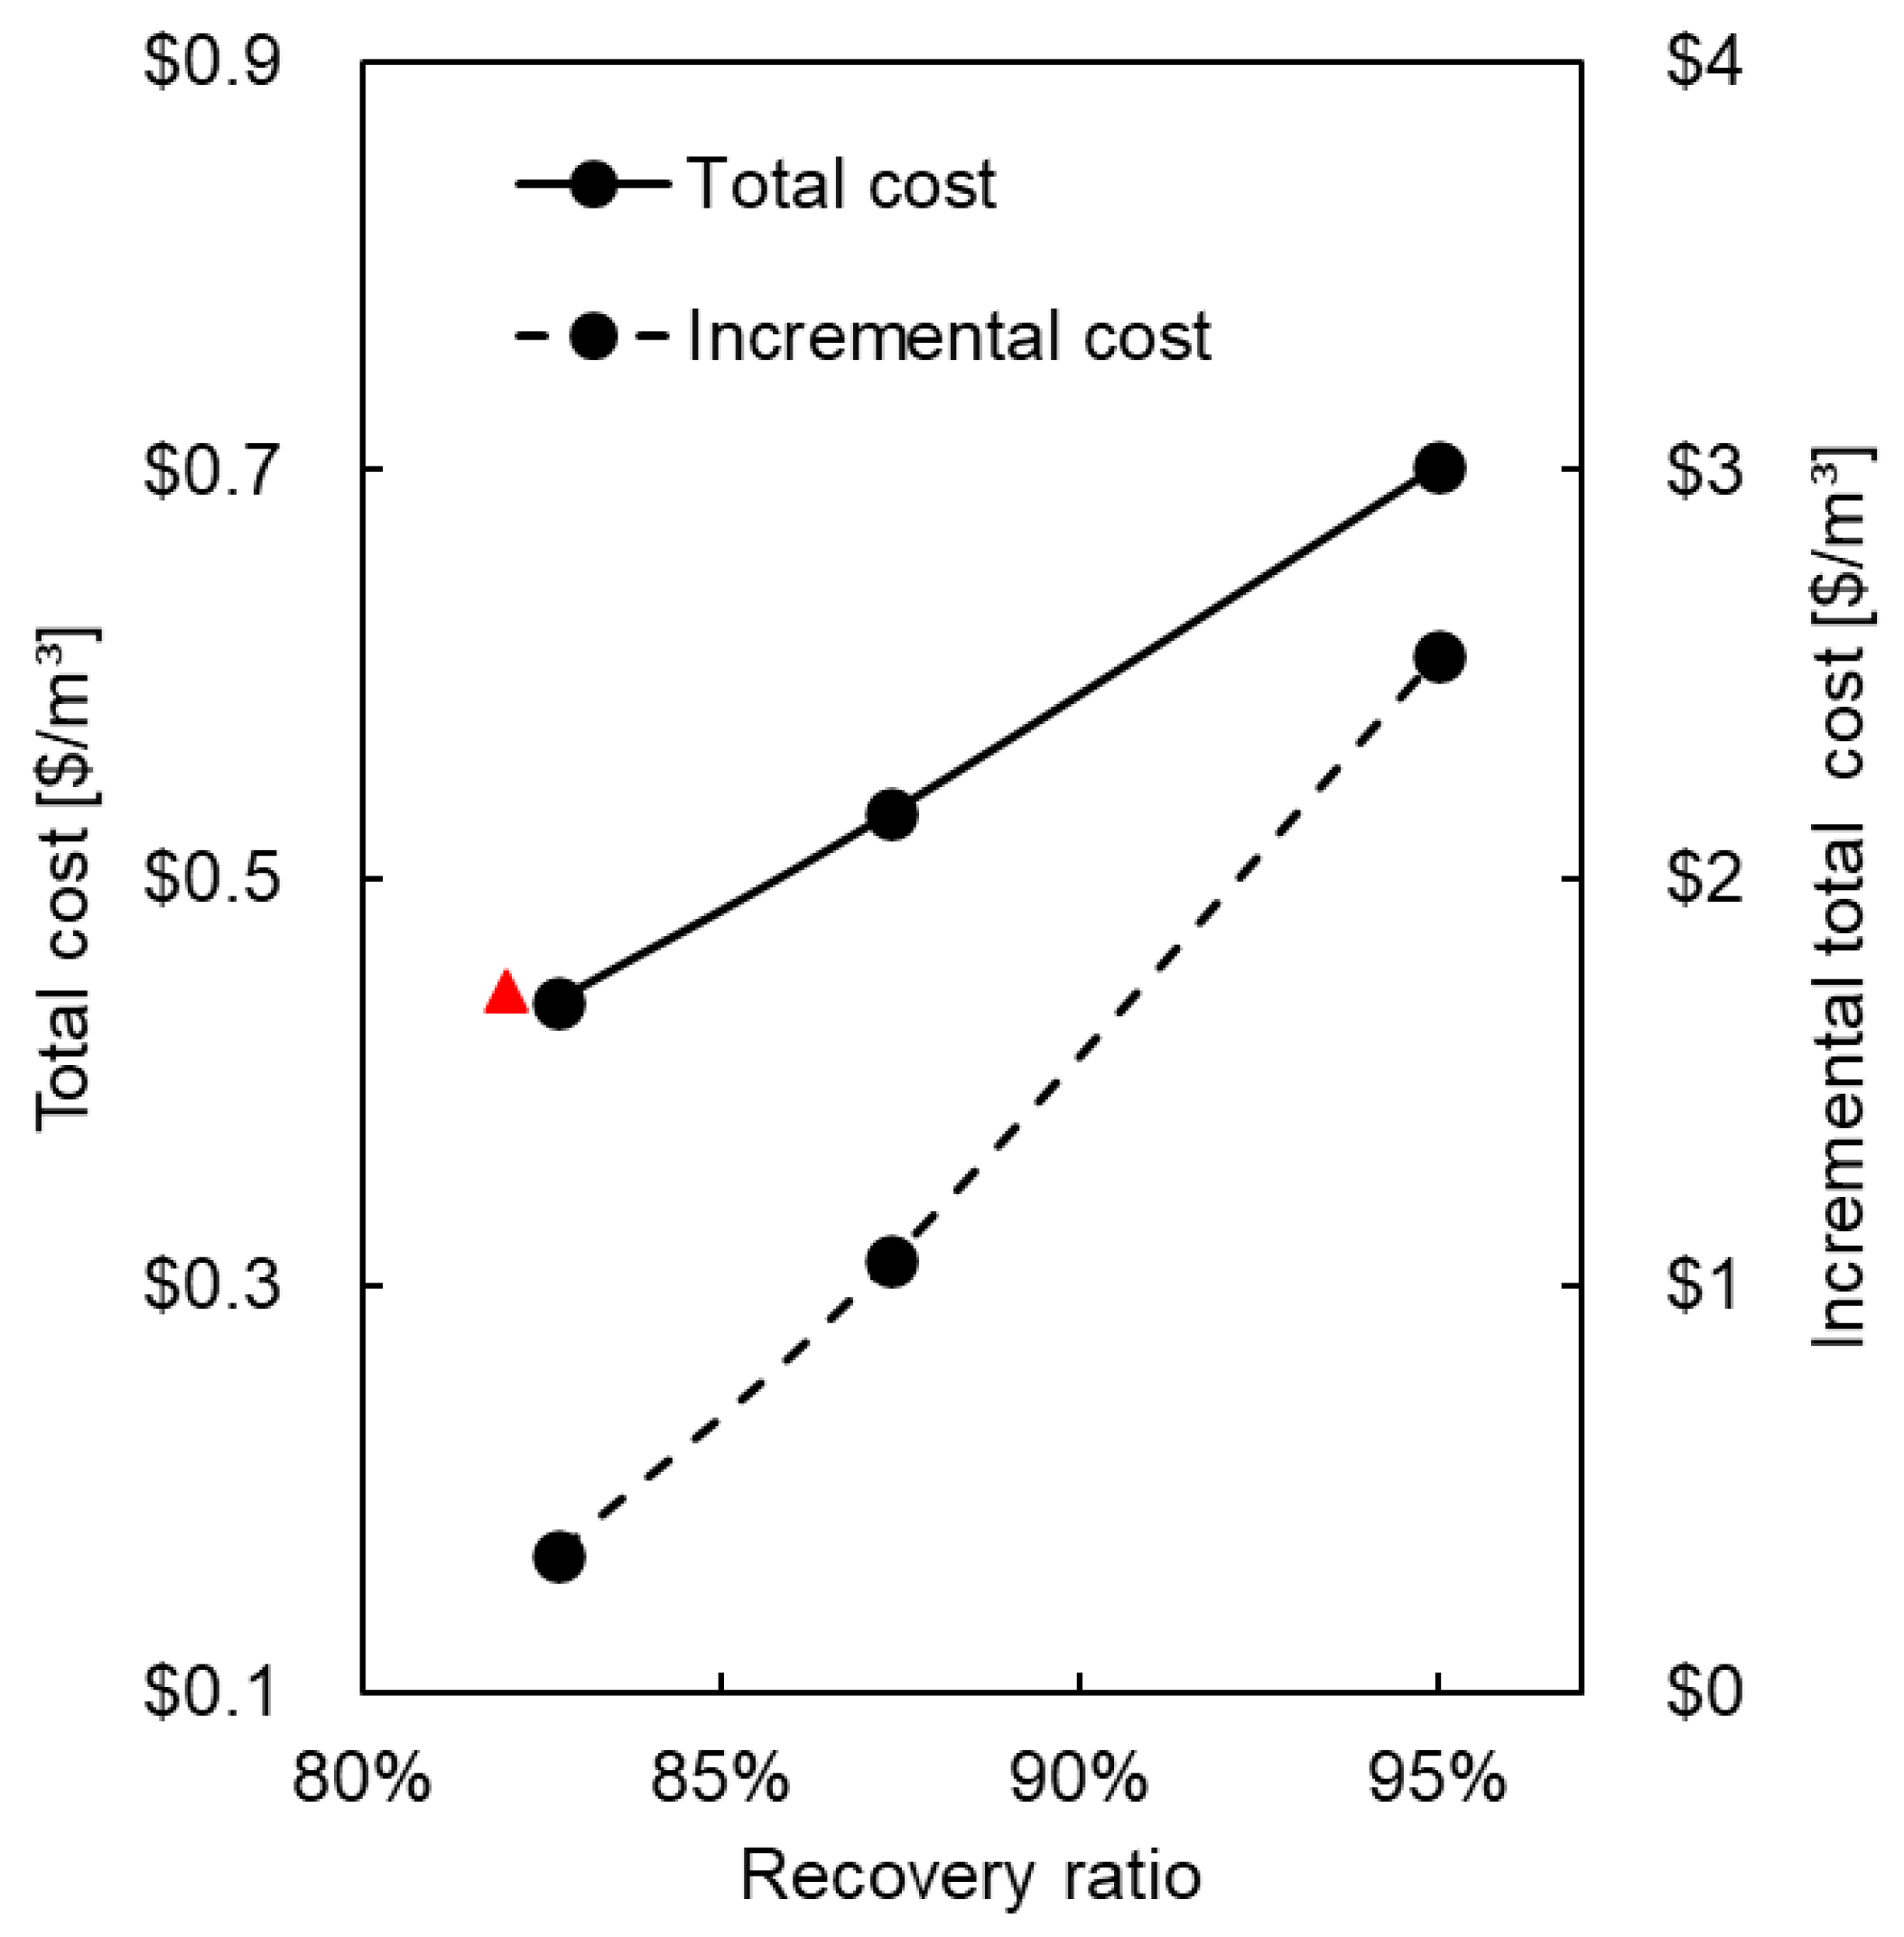
| Option | Total Flow [m3/h] | Incremental Product [m3/h] | OPEX [USD /m3] | Recovery Ratio | Total Cost [USD /m3] | Incremental Total Cost [USD /m3] |
|---|---|---|---|---|---|---|
| Two-stage RO (Ma’agan Michael plant’s actual operation) (1) | 2100 | 0 | 0.338 | 82.0% | 0.445 | ---- |
| NF/RO1 | 2209 | 108.6 | 0.332 | 82.7% | 0.439 | 0.439 |
| NF/RO1/ED/RO2 | 2332 | 143.1 | 0.408 | 87.4% | 0.531 | 1.160 |
| NF/RO1/ED/RO2/MVR (Full ZLD solution) | 2537 | 204.6 | 0.526 | 95.0% | 0.702 | 2.647 |
Disclaimer/Publisher’s Note: The statements, opinions and data contained in all publications are solely those of the individual author(s) and contributor(s) and not of MDPI and/or the editor(s). MDPI and/or the editor(s) disclaim responsibility for any injury to people or property resulting from any ideas, methods, instructions or products referred to in the content. |
© 2025 by the authors. Licensee MDPI, Basel, Switzerland. This article is an open access article distributed under the terms and conditions of the Creative Commons Attribution (CC BY) license (https://creativecommons.org/licenses/by/4.0/).
Share and Cite
Nativ, P.; Ben-Asher, R.; Aviezer, Y.; Lahav, O. Extending the Recovery Ratio of Brackish Water Desalination to Zero Liquid Discharge (>95%) Through Combination of Nanofiltration, 2-Stage Reverse-Osmosis, Silica Precipitation, and Mechanical Vapor Recompression. ChemEngineering 2025, 9, 70. https://doi.org/10.3390/chemengineering9040070
Nativ P, Ben-Asher R, Aviezer Y, Lahav O. Extending the Recovery Ratio of Brackish Water Desalination to Zero Liquid Discharge (>95%) Through Combination of Nanofiltration, 2-Stage Reverse-Osmosis, Silica Precipitation, and Mechanical Vapor Recompression. ChemEngineering. 2025; 9(4):70. https://doi.org/10.3390/chemengineering9040070
Chicago/Turabian StyleNativ, Paz, Raz Ben-Asher, Yaron Aviezer, and Ori Lahav. 2025. "Extending the Recovery Ratio of Brackish Water Desalination to Zero Liquid Discharge (>95%) Through Combination of Nanofiltration, 2-Stage Reverse-Osmosis, Silica Precipitation, and Mechanical Vapor Recompression" ChemEngineering 9, no. 4: 70. https://doi.org/10.3390/chemengineering9040070
APA StyleNativ, P., Ben-Asher, R., Aviezer, Y., & Lahav, O. (2025). Extending the Recovery Ratio of Brackish Water Desalination to Zero Liquid Discharge (>95%) Through Combination of Nanofiltration, 2-Stage Reverse-Osmosis, Silica Precipitation, and Mechanical Vapor Recompression. ChemEngineering, 9(4), 70. https://doi.org/10.3390/chemengineering9040070