Abstract
Pig slurry (PS) and wine vinasse (WV) pose environmental risks if not properly managed. Their composition makes them suitable for anaerobic co-digestion (AcoD), enhancing biomethane production and improving organic matter degradation efficiency. This research applies an innovative Design of Experiments (DoE) approach—specifically the Box–Behnken design (BBD)—to systematically optimize the AcoD process, surpassing traditional single-factor methods by efficiently evaluating the interactions. Variables such as temperature (35 °C, 52.5 °C, 70 °C), substrate ratio (25PS:75WV, 50PS:50WV, 75PS:25WV) and pH (7, 7.5, 8) were tested using a Box–Behnken design which studied the correlations between the experimental data and the model. In fact, the results showed that temperature, ratio, and their interaction significantly influenced biomethane production, being the pH the factor with the least influence on the response. Optimal conditions—pH of 8, temperature of 35 °C and a 50:50 substrate ratio—achieved a biomethane yield of 487.94 CH4/gVS (Volatile Solids). These results demonstrate the effectiveness of the DoE methodology in maximizing biomethane production and represent a significant advancement in valorizing wastes from pig farms and wineries, promoting a circular and sustainable economy.
1. Introduction
The excessive reliance on fossil fuels presents serious environmental challenges worldwide [1,2]. This issue is worsened by the continuous generation of organic waste. Rapid population growth and industrial expansion have increased energy demands. Fossil fuels remain the primary energy source, especially in high-emission sectors like transportation. Consequently, this dependence contributes significantly to greenhouse gas emissions and climate change. These facts highlight the urgent need for alternative and renewable energy solutions [3,4]. In response, waste valorization has emerged as a promising strategy to transform organic waste into sustainable energy resources, promoting a circular and environmentally friendly economic model [5].
Among these solutions, biofuels such as biomethane and green hydrogen have gained attention for their versatility in energy production. These gases can generate heat, produce electricity, and serve as fuel either independently or in combination [4].
Anaerobic digestion (AD) plays a crucial role in this transition by efficiently converting organic waste into biogas through microbial activity in oxygen-deprived environments [6]. This biochemical process breaks down complex organic matter—including carbohydrates, proteins, and lipids—into simpler compounds such as sugars, amino acids, and volatile fatty acids. Through four distinct phases—hydrolysis, acidogenesis, acetogenesis, and methanogenesis—AD produces biogas, primarily composed of biomethane and carbon dioxide [7], along with a nutrient-rich digestate. Moreover, the conversion of digestate into fertilizer supports sustainable agricultural practices [8,9,10,11,12,13]. Furthermore, the implementation of AcoD of different substrates enhances this process by optimizing nutrient balance, mitigating inhibitory effects, and improving biogas yields [14,15].
Pig slurry and wine vinasse cause significant environmental challenges due to their large volumes and high pollutant content. Spain, the largest pig producer in Europe (over 26 million animals), generates approximately 70 million kg of manure per day, calculated at 2.7 kg per animal daily. In regions like Aragón, pig farming alone contributes to the production of around 13.5 million cubic meters of slurry annually, raising concerns over nitrate pollution in water bodies and greenhouse gas emissions [16]. Mismanagement of these by-products has led to serious ecological issues, such as the degradation of the Mar Menor lagoon, where nutrient runoff has triggered harmful algal blooms and oxygen depletion [4,17]. Similarly, the wine industry, particularly during the harvest season, produces large quantities of vinasse and other by-products. In Cataluña, while composting initiatives have been introduced to manage these wastes, challenges remain due to low bulk density and high transportation costs [18,19]. Although innovative treatments, including AD and composting, have been implemented to reduce environmental impacts, their effectiveness varies depending on specific processes and local condition. AcoD offers sustainable waste management solutions that benefit industries generating large volumes of organic waste, such as livestock farming and winemaking. By integrating these processes, businesses can reduce environmental pollution, recover valuable nutrients, and produce renewable energy [4,20,21]. In addition, the widespread adoption of AcoD supports the global shift toward a circular economy, decreasing reliance on fossil fuels while promoting cleaner and more efficient energy alternatives. Despite these advantages, a major challenge remains the optimization of AcoD operational parameters, which is critical to maximizing process performance and ensuring system stability.
In this way, several operational parameters, notably substrate ratio, pH, and temperature, exert a significant influence on methanogenesis. For instance, optimized co-digestion ratios facilitate carbon and nitrogen equilibrium, mitigating ammonia inhibition [22,23]. Biomethane production is typically enhanced under neutral to alkaline pH conditions, while maintaining appropriate temperature levels is essential to ensure microbial activity and process stability. The resulting digestate represents a valuable resource recovery [24].
However, the determination of optimal parameter combinations, to optimize the process, presents a complex challenge. To address this challenge, methodologies such as Response Surface Methodology (RSM) provides a systematic framework for identifying optimal conditions by analyzing the effects and interactions among these variables [25].
RSM models offer a variety of forms for different experimental needs. Among these, second-order models stand out for their flexibility, capacity to predict curved response surfaces, and effectiveness in process optimization, making them the preferred choice for this study [26]. Notably, the most widely used designs within this category include the Central Composite Design (CCD), Box–Behnken design (BBD), and Doehlert Matrix Design (DM) [26,27].
In AcoD, multiple variables influence the efficiency and yield of the process, making it essential to apply a robust optimization methodology. The Box–Behnken design emerges as the most suitable model for this purpose, as it enables the systematic optimization of AcoD parameters by analyzing interactions between key operational factors, without testing impractical or inhibitory conditions. This approach minimizes experimental costs while maximizing process efficiency and stability, providing a structured and efficient method for optimizing the process [28,29].
The structure of BBD is based on a geometric arrangement where experimental points are positioned at the midpoints of the edges of a multidimensional cube, along with a central point. Once the experimental data have been collected, mathematical models are constructed to describe the relationship between the independent variables and the response variable. Typically, a second-order polynomial equation is used to represent these relationships, allowing an understanding of how the different factors interact [30]. Compared to traditional single-factor methods, this design framework offers clear advantages by enabling the simultaneous evaluation of multiple variables and their interactions. Such capability is particularly important in the complex context of AcoD, where factor interactions can strongly affect process performance. By reducing the number of required experiments while improving predictive accuracy and optimization efficiency, the Box–Behnken design represents an innovative and statistically robust methodology that enhances process understanding and supports scalable applications [28,29,30].
The Box–Behnken design (BBD) has been applied in various AcoD studies to optimize process parameters. For instance, a study evaluated the performance of different agricultural by-products using a BBD approach in a pilot-scale plant with four stirred stainless-steel digesters under mesophilic semi-continuous digestion. The results supported the creation of a technical framework to scale up the process and further evaluate potential environmental impacts through a Life Cycle Assessment methodology [31]. Another study utilized BBD to optimize biogas production from different animal manures and maize silage. The statistical evaluation of the results indicated that the response surface method could be used successfully in the co-fermentation of these substrates [32]. Additionally, BBD was employed to optimize bioelectricity production from winery residues, demonstrating its applicability in enhancing energy recovery from various organic wastes [33]. These examples illustrate the application of BBD in AcoD studies, thereby highlighting its role in optimizing process parameters for improved biogas production.
This study aimed to determinate the optimal conditions for methanogenic AcoD of pig slurry and wine vinasse to enhance biomethane production. To achieve this, the experimental design was structured using RSM with a Box–Behnken design. Key-factors, including substrate ratio, temperature, and pH, were systematically analyzed to assess their impact on biomethane production (mL), biomethane yield (mLCH4/gVS) and Total Volatile Fatty Acids (tVFA) removal, to optimize the AcoD of pig slurry and wine vinasse.
2. Materials and Methods
2.1. Organic Substrates and Inoculum
The substrates utilized in this study (Table 1) comprised pig slurry (PS) and wine vinasse (WV). The pig slurry was sourced from the pig farming facilities of the Montesierra S. L., situated in Jerez de la Frontera, Spain, while the wine vinasse was supplied by the González-Byass S.A. winery, also located in Jerez de la Frontera. The inoculum (I) employed originated from the anaerobic digester of the wastewater treatment plant (WWTP) in the municipality of Chiclana de la Frontera, Spain.

Table 1.
Initial characterization of substrates used.
Both the substrates and the inoculum were stored at an approximate temperature of 4 °C after collection to prevent biological degradation prior to use and were thoroughly characterized before experimentation.
2.2. Analytical Methods
Initial characterization was performed on the organic substrates and inoculum, including the analysis of pH, Total Solids (TS), Volatile Solids (VS), Total Chemical Oxygen Demand (tCOD), Soluble Chemical Oxygen Demand (sCOD) Carbon–Nitrogen ratio (C:N ratio) and tVFA.
pH was measured using a HACH sensION+ pH meter. The determination of TS, VS, tCOD, sCOD, and C/N ratio was carried out following the standard methods of APHA-AWWA-WPFC (2012) [34]. tVFA were quantified via gas chromatography using a Shimadzu GC-2010 gas chromatograph equipped with a flame ionization detector (FID) system and a Nukol capillary column. The tVFA analysis included acetic, propionic, butyric, isobutyric, valeric, isovaleric, caproic, and heptanoic acids.
2.3. Biochemical Methane Potential Test (BMP)
BMP assays serve as a reliable approach for assessing the anaerobic degradation potential of organic substrates for biomethane (CH4) production. The experiments were conducted in 250 mL amber bottles with a working volume of 120 mL, utilizing an orbital shaker under three distinct temperature conditions: mesophilic (35 °C), thermophilic (52.5 °C), and hyper-thermophilic (70 °C) conditions (Figure 1).
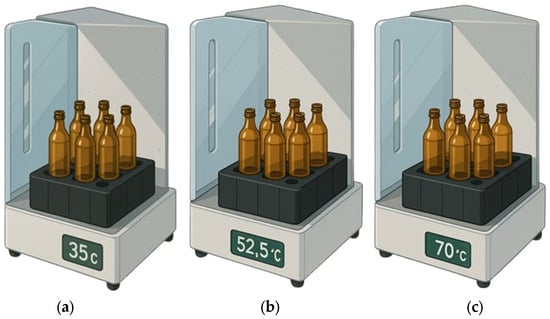
Figure 1.
BMP test scheme. Incubators at different temperature ranges: (a) Mesophilic (35 °C), (b) thermophilic (52.5 °C), and (c) hyper-thermophilic (70 °C).
Reactors were inoculated with substrate mixture at a 1:1 (v/v) ratio, ensuring that the inoculum constituted half of the final volume. To ensure anaerobic conditions, the headspace of the digesters was purged with N2 gas for 2 min prior to sealing.
The substrates were analyzed at both the initial and final stages of the BMP test. Furthermore, the daily biomethane volume and concentration were quantified to evaluate the efficiency of the process over a 17-day period, until biomethane production declined to less than 1% of the total accumulated biomethane.
2.4. Design of Experiments (DoE) Using Box–Behnken Design
The anaerobic co-digestion (AcoD) process was optimized using a DoE based on a BBD. This methodology allowed the evaluation of three independent variables—temperature, pH, and substrate ratio—each tested at three levels: 35.0 °C, 52.5 °C, and 70.0 °C; pH 7.0, 7.5, and 8.0; and substrate ratios of 25PS:75WV, 50PS:50WV, and 75PS:25WV, respectively.
Temperature was included due to its strong influence on microbial activity and degradation kinetics [35,36]. While higher temperatures can enhance hydrolysis and methane production, they may reduce process stability due to lower microbial diversity and greater sensitivity to inhibitors [37]. Including this variable within the BBD improves model robustness and real-world applicability.
The substrate ratios selected represent typical mixtures in co-digestion studies involving organic wastes and reflect practical variations in feedstock composition. These ratios allow for the assessment of synergistic or antagonistic effects between wine vinasse and pig slurry, which differ in biodegradability and inhibitory potential [38,39]
A total of 15 experimental runs were carried out following the BBD, including three central point replicates to estimate experimental error and curvature, plus three blank controls consisting of inoculum and tap water at the respective operating temperatures to quantify methane production from the inoculum alone. The characterization of these 15 experimental bottles is summarized in Table 2.

Table 2.
Characterization of 15 samples and 3 blanks used for analyses.
2.5. Kinetic Analysis in BMP Assays
Considering the kinetics of AcoD, several mathematical models were selected for analysis, notably the first-order kinetic model and the modified Gompertz model [40]. Anaerobic degradation following the initial lag phase is primarily governed by substrate-related kinetic parameters, which, under certain assumptions, can generally be described by a first-order kinetic law [41]. The first-order model is typically employed to predict the continuously declining biogas production rate during the AcoD.
On the other hand, the modified Gompertz model is widely regarded as suitable for characterizing the dynamics of AcoD processes, particularly when biogas production exhibits an initial exponential grow phase followed by a stabilization phase at the maximum production rate [42,43]. Both models were fitted to the biomethane production data and estimate key kinetic parameters. These parameters include biomethane production rate, the maximum biomethane yield and the lag phase duration.
The mathematical expressions for the first-order kinetic model (Equation (1)) and the modified Gompertz model (Equation (2)) are presented below:
where
- H = biomethane generation (cumulative) in time (t) (mL/gVS);
- P = potential for maximum biomethane generation (mL/gVS);
- Rm = biomethane generation rate (mL of biogas/gVS/d);
- Λ = the lag phase during biomethane generation (d);
- T = time required for the cumulative production of biomethane.
3. Results
The implementation of AcoD for pig slurry and wine vinasse, optimized through DoE, yielded noteworthy results. A summary of the main outcomes of BMP, including the percentage VS, and sCOD, as well as biomethane volume (mL) and biomethane yield, is presented in Table 3.

Table 3.
Results from BMP test conducted using Box–Behnken design.
3.1. Biomethane Production Using a Box–Behnken Design for AcoD of Pig Slurry and Wine Vinasse
The Pareto diagram displays the magnitude of the standardized effects of each factor and their interactions. In Figure 2 the standardized effects of three primary factors—pH, temperature, and substrate ratio—as well as their interactions on biomethane production (mL) can be observed. The red dashed line denotes the significance threshold (α = 0.05), indicating that any effect exceeding this threshold is statistically significant. In this analysis, the standardized effects threshold was found to be 2.571.
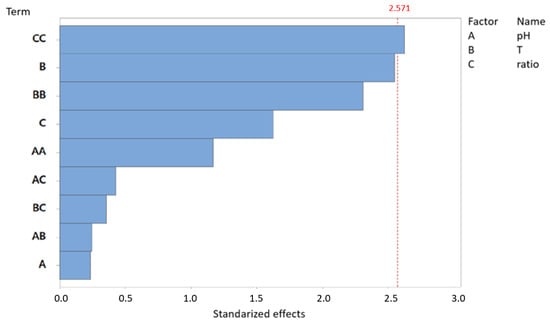
Figure 2.
Pareto chart of standardized effects: biomethane production (mL) for AcoD from pig slurry and wine vinasse (α = 0.05).
The quadratic interaction ratio (CC) is the most influential factor in biomethane production volume, exhibiting the highest standardized effect. The interaction of temperature (B), as well as the quadratic interaction temperature (BB), also has an important impact in biomethane production. However, the pH appears to be one of the least influential variables, with a standardized effect of less than 1.5. The remaining factors and interactions fall well below the significance threshold, suggesting that their influence on biomethane production is negligible.
The regression equation in uncoded units for predicting methane volume (V CH4 in mL) is: V CH4 (mL) = 9748 − 2953·pH + 41.4·T + 29.4·ratio + 207·pH2 − 0.334·T2 − 0.1858·ratio2 − 1.20·pH·T − 1.46·pH·ratio − 0.0348·T·ratio.
This second-order polynomial model incorporates linear, quadratic, and interaction terms for the variables pH, temperature, and ratio. The model shows a relatively good fit to the experimental data with an R2 of 82.32%.
The 3D response surface plots illustrate the graphical relationship between biomethane production and the factors pH, temperature, and substrate ratio, based on a Box–Behnken design applied to a BMP assay in AcoD (Figure 3). Each plot depicts the interaction between two variables and their combined effect on biomethane production, while the third variable is held constant.
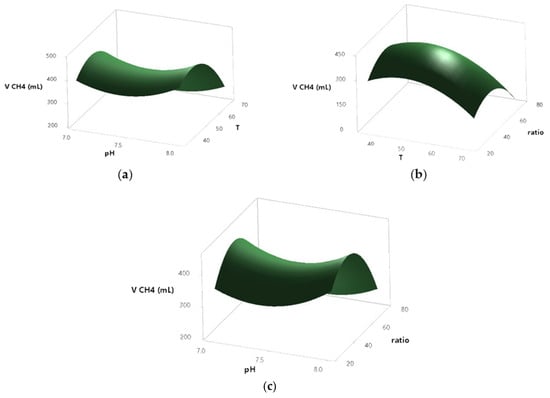
Figure 3.
Biomethane production response according to the following interactions: pH and temperature (a), pH and ratio (b), and temperature and ratio (c), in a BMP production for AcoD from pig slurry and wine vinasse.
In all three models, pH exhibited a limited influence on biomethane yield. Across the tested range (7.0–8.0), changes in pH did not result in significant variations in CH4 production, as evidenced by the relatively flat surface along the pH axis in the corresponding plots.
In contrast, both temperature and substrate ratio showed a more noticeable effect. In the temperature–pH interaction plot (Figure 3a), biomethane production increased moderately at intermediate temperatures—~55–60—with lower yields observed at both lower and higher extremes. A similar pattern was observed in the ratio–pH interaction plot (Figure 3b), where biomethane production was higher at intermediate substrate ratios—~50–60—while more extreme values were associated with reduced yields.
The temperature–ratio interaction plot (Figure 3c), displayed a more pronounced curvature, indicating a combined effect of both variables. Biomethane production peaked when both temperature and substrate ratio were at intermediate levels; thus, this suggests the existence of a local optimum under these conditions.
These results are consistent with the statistical analysis, where temperature and substrate ratio, particularly their quadratic and interaction terms, had a greater influence on biomethane production compared to pH.
3.2. tVFA Using a Box–Behnken Design for AcoD of Pig Slurry and Wine Vinasse
The Pareto diagram displays the standardized effects of three main factors—pH, temperature, and substrate ratio—and their interactions on tVFA production (Figure 4).
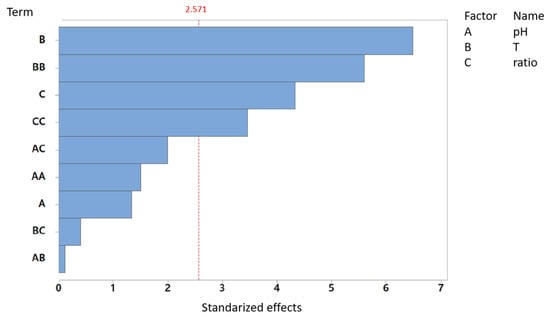
Figure 4.
Pareto chart of standardized effects: tVFA production for AcoD from pig slurry and wine vinasse (α = 0.05).
In this case, the standardized effects threshold was found to be 2.571, as well. Of the evaluated factors, temperature (B) exhibits the most pronounced effect, with standardized values sustainably exceeding the significance threshold. Additionally, the quadratic interaction temperature, the substrate ratio, and its quadratic term also demonstrate statistically significant effects. In contrast, pH and its interaction terms do not surpass the significance threshold, indicating a negligible influence on tVFA production under the experimental plan studied. These results related to the pH influence are in concordance with the response to the biomethane production.
The regression equation, in uncoded units, for predicting tVFA is expressed as: tVFA = −39738 + 15696·pH − 355·T − 367·ratio − 1179·pH2 + 3.592·T2 + 1.087·ratio2 + 2.5·pH·T + 30.1·pH·ratio + 0.175·T·ratio.
This model accounts for both linear and quadratic effects, as well as two-way interactions among the variables pH, temperature, and ratio. The coefficient of determination (R2) is 95.74%, indicating a strong fit to the experimental data.
Figure 5 shows the surface response plots describing the behavior of the response of tVFA (mL/g) production as a function of temperature (T), pH, and substrate ratio.
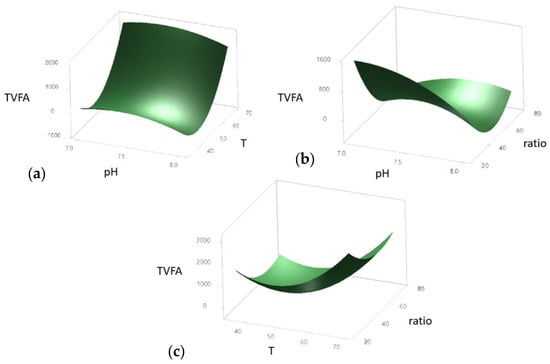
Figure 5.
tVFA production response according to the following interactions: pH and temperature (a), pH and ratio (b), and temperature and ratio (c), in a BMP production for AcoD from pig slurry and wine vinasse.
The surface response plot of temperature (T) and pH demonstrated a clear influence on tVFA production (Figure 5a). Maximum tVFA yields were obtained at lower temperatures (~40 °C) combined with intermediate pH values (~7.5). In contrast, higher temperatures and extreme pH levels resulted in a marked reduction in tVFA production.
Regarding the interaction between substrate ratio and pH (Figure 5b), the highest tVFA production occurred at intermediate ratio values (~50) and neutral pH conditions (~7.5). Both low and high ratios negatively impacted the response, highlighting the importance of maintaining a balanced ratio to optimize fermentation performance.
The combined effect of ratio and temperature (Figure 5c) revealed that lower temperatures (~40 °C) coupled with higher ratio values (~80) favored tVFA production. These results suggest that increasing substrate concentration enhances tVFA yield, particularly under moderate temperature conditions.
Overall, the surface response plots allowed the identification of the optimal conditions and the most sensitive regions of the studied variables for maximizing tVFA production. Consequently, among the factors evaluated, temperature and substrate-to-inoculum ratio were identified as the most influential variables.
3.3. Biomethane Yield Using a Box–Behnken Design for AcoD from Pig Slurry and Wine Vinasse
The pareto diagram illustrates the standardized effects of three primary factors—pH, temperature, and substrate ratio—as well as their interactions on biomethane yield (CH4/gVS) (Figure 6).
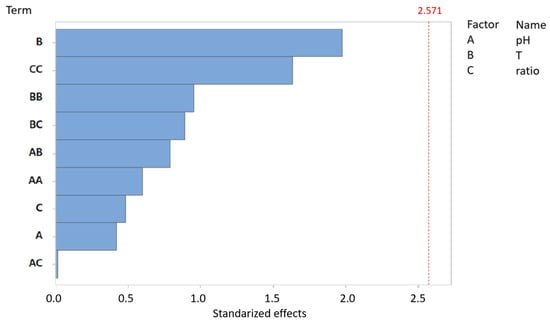
Figure 6.
Pareto chart of standardized effects: biomethane yield (CH4/gVS) for AcoD from pig slurry and wine vinasse (α = 0.05).
Regarding biomethane yield, none of the variables evaluated in this study exceed the significance threshold, suggesting that, based on this model, none of them exert a statistically significant effect. However, in the Pareto chart, temperature and the quadratic interaction of the substrate ratio display values approaching significance. This trend is consistent with previous findings, where the quadratic interaction of substrate ratio was the most influential factor in biomethane production (Figure 2), and temperature was identified as the most significant variable in tVFA production (Figure 4). Finally, it is worth noting that, as observed in the previous Pareto analyses, pH consistently appears as the least influential variable.
The regression equation, in uncoded units, for predicting methane yield (YmlCH4/gVS) is given by: YmlCH4/gVS = 5420 − 1929·pH + 62.7·T + 21.6·ratio + 150·pH2 − 0.195·T2 − 0.164·ratio2 − 5.45·pH·T + 0.06·pH·ratio – 0.123·T·ratio.
This second-order polynomial model incorporates linear, quadratic, and interaction terms among the independent variables: pH, temperature, and ratio. The model’s R2 is 65.97%, indicating a moderate level of fit to the experimental data.
Similarly to the previous cases, for biomethane productivity (YmCH4/gVS), the effect of temperature (T), pH, and substrate ratio was evaluated through response surface analysis, allowing a better understanding of the interactions between these variables.
Methane yield (YmLCH4/gVS) was significantly affected by the interaction between temperature and pH (Figure 7a). The surface response plot revealed that intermediate pH values (~7.5) combined with moderate temperatures (~55 °C) maximized biomethane production. In contrast, both lower pH values and extreme temperatures led to a decrease in YmLCH4.
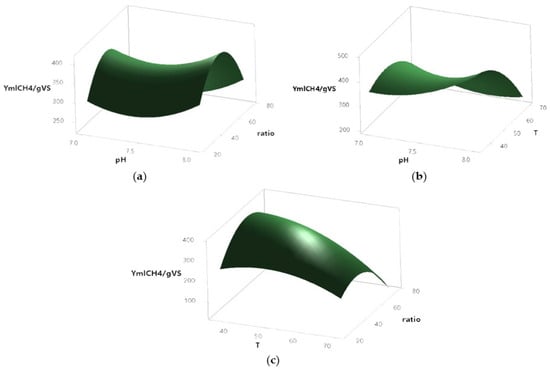
Figure 7.
Biomethane yield production response according to the following interactions: pH and temperature (a), pH and ratio (b), and temperature and ratio (c), in a BMP in AcoD from pig slurry and wine vinasse.
In terms of the combined effect of substrate ratio and pH (Figure 7b), higher biomethane yields were obtained at intermediate pH values (~7.5) and low ratio values (~20–30). Both increasing the ratio and moving away from neutral pH conditions resulted in a reduction of biomethane production. Meanwhile, the interaction between ratio and temperature (Figure 7c) indicated that lower ratios (~20) together with lower temperatures (~40 °C) favored biomethane generation. As temperature increased beyond ~55 °C, YmLCH4 production decreased regardless of the ratio applied.
These findings suggest that biomethane production is favored under conditions where the substrate ratio is low, the pH remains near neutral, and moderate temperatures are maintained. The synergistic interaction of these variables plays a key role in optimizing biomethane yield during AD.
3.4. Mathematical Optimization of Biomethane Yield Form AcoD of Pig Slurry and Wine Vinasse Through a Box–Behnken Design
According to the mathematical model, optimal biomethane production is achieved in a system operating at a temperature of 35 °C, pH of 8 and a substrate ratio of 50PS:50WV. Under these conditions, the predicted biomethane yield is 487.94 CH4/gVS. Therefore, the desirability value is 1, confirming that this combination of parameter is the optimal setting for maximizing biomethane production.
Examining the factors in greater depth, temperature is the most influential variable, with an optimal value of 35 °C under mesophilic conditions. As illustrated in Figure 8, biomethane yield tends to increase at low temperatures reaching a maximum at around 35°. The substrate ratio plays a significant role as well, with the highest biomethane yield observed at a 50PS:50WV ratio. The relationship between yield and substrate ratio follows a parabolic pattern: production initially increases as the ratio approaches 50%, but beyond this point, further increases lead to a decline in yield. As seen in Figure 3, pH has the least influence among the variables analyzed. The optimal pH is determined to be 8, but its effect on biomethane yield is considerably smaller compared to that of temperature and substrate ratio.
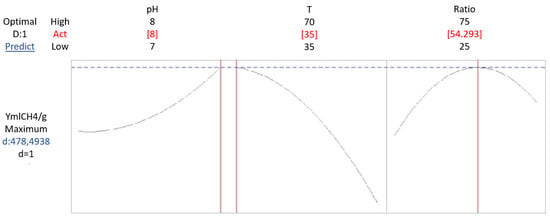
Figure 8.
Optimization of biomethane yield response in the AcoD of pig slurry and wine vinasse, based on pH, temperature, and ratio.
3.5. Kinetic Analysis of Biomethane Production of Pig Slurry and Wine Vinasse via a Box–Behnken Design
To assess the biomethane production kinetics of the substrates under AcoD conditions, experimental data were modeled using both first-order and modified Gompertz equations. Both models adequately described the biomethane yield and allowed quantification of the kinetic parameters, thereby providing insights into the process dynamics.
The comparative evaluation of kinetic models applied to cumulative biogas production data revealed notable differences in fitting performance between the first order and Gompertz models. The first-order kinetic model demonstrated a moderate to strong fit, explaining between 74% of the variance in the experimental data. Parameters a and b, representing the theoretical maximum biomethane potential and the reaction rate constant, respectively, were statistically significant (p < 0.0001), indicating robust parameter estimation.
In contrast, the modified Gompertz model consistently exhibited superior fitting performance, with coefficients of determination (R2) often approaching unity and lower standard errors of estimate across multiple datasets. The kinetic parameters obtained (as detailed in Table 4) were statistically significant in most cases (p < 0.0001), confirming the strong agreement between the model and experimental data.

Table 4.
Kinetic parameters obtained from fitting of first-order model and modified Gompertz model.
To further elucidate the influence of operational parameters on volumetric production, a comparative analysis was performed between selected test pairs, differing in substrate ratios and temperatures. The focus was to assess the effect of substrate composition (PS:WV ratio) and temperature on performance, as well as to evaluate the modeling accuracy of the first-order versus the modified Gompertz model.
Both Test 2 and Test 9 (Figure 9) were conducted at 35 °C but differed in substrate ratio: Test 2 employed a 50PS:50WV mixture, while Test 9 used a 25PS:75WV composition. As shown in the respective plots, Test 2 yielded a higher accumulated volume (~9 mL) compared to Test 9 (~4.5 mL), under otherwise identical thermal conditions. This indicates that a 50PS:50WV ratio enhances production efficiency, potentially due to improved substrate availability and nutrient balance. Notably, the modified Gompertz model accurately captured the rapid initial production and early plateau in both cases, outperforming the first-order model, which showed slight deviations in the exponential growth phase. For Test 2, the model yielded a p of 8.704 mL and an R2 of 0.870, indicating a good fit to the observed data. Similarly, for Test 9, the p was 4.163 mL, with an R2 of 0.889, further confirming the robustness of the modified Gompertz model in describing the biogas production dynamics.

Figure 9.
Comparison of accumulated volume over time for Test 2 and Test 9 at 35 °C with varying PS:WV ratios.
Test 5 and Test 15 (Figure 10) were both conducted at the optimal thermophilic temperature of 52.5 °C, but with inverted substrate ratios: 25PS:75WV and 50PS:50WV, respectively. Although both setups achieved relatively high cumulative volumes, Test 15—with a 50PS:50WV ratio—resulted in a noticeably higher final volume (~55 mL) compared to Test 5 (~60 mL initially, then leveling off). The modified Gompertz model provided a markedly superior fit, particularly in capturing the evident lag phase in both experiments. These results highlight that, even at optimal temperatures, the 50PS:50WV ratio is more conducive to sustained and efficient production, likely due to better synergy between the organic fraction and water content. Significantly, the model accurately described the rapid initial production and its subsequent stabilization, outperforming the first-order model. Test 5 exhibited a p value of 113.416 mL with an R2 of 0.920, while Test 15 showed a p of 78.022 mL and an R2 of 0.958. These differences suggest that, although both tests demonstrated strong model fits, Test 5 had a higher production potential, whereas Test 15 showed a slightly better goodness of fit.

Figure 10.
Comparison of accumulated volume over time for Test 5 and Test 15 at 52.5 °C with varying PS:WV ratios.
Test 3 and Test 10 (Figure 11) were both conducted at 70 °C, with substrate ratios of 50PS:50WV and 25PS:75WV, respectively. Test 3 achieved the highest accumulated volume among all tests (~55,000–60,000 mL), in contrast to the significantly lower output observed in Test 10 (~3200 mL). Despite the elevated temperature, the reduced PS content in Test 10 appears to have limited bioconversion efficiency. The modified Gompertz model once again delivered a superior fit across both tests, accurately modeling the characteristic lag phase and subsequent exponential increase, which the first-order model tended to oversimplify. Specifically, Test 3 yielded a p of 60.009 mL with an R2 of 0.954, indicating substantial biogas production and a strong model fit. In contrast, Test 10 showed a markedly lower p of 3.265 mL, though it achieved a slightly higher R2 of 0.959, suggesting a very precise fit despite the limited production. This contrast highlights the model's flexibility in capturing production dynamics across varying performance levels.

Figure 11.
Comparison of accumulated volume over time for Test 3 and Test 10 at 70 °C with varying PS:WV ratios.
Overall, the statistical and structural characteristics observed across datasets indicate that the Gompertz model provides a more accurate representation of biomethane production behavior under the experimental conditions analyzed.
4. Discussion
This study supports the effectiveness of optimizing biomethane production using a Box–Behnken design withing the framework of RSM, by identifying some key operational parameters. Substrate ratio, temperature, and pH were systematically recognized as critical factors influencing the process performance [30,44,45]
Among the investigated variables substrate ratio exhibited the most significant impact on biomethane production, particularly through its quadratic effect, followed by temperature. In contrast, pH demonstrates minimal influence within the operating range tested. Response surface plots further illustrated that biomethane production was maximized at intermediate substrate ratios (~50–60%) and temperatures (approximately 55–60 °C) with a significant interaction observed between these two variables. A local optimum was identified at intermediate levels of both parameters, confirming the synergistic effects highlighted in the statistical analysis.
Balanced substrate mixtures were found to enhance process stability and biomethane generation [46,47], whereas extreme substrate ratios were associated with reduced production, likely due to nutrient imbalances or microbial inhibition [48]
Regarding tVFA production, the analysis showed that temperature was the most influential factor, followed by the quadratic interaction between temperature and substrate ratio, as well as their respective quadratic effects. Furthermore, these results are consistent with previous studies highlighting the critical role of temperature in microbial metabolism, enzymatic activity, and overall biochemical reaction rates during AcoD [49,50]. Response surface plots indicated that maximum tVFA accumulation occurred at intermediated temperatures (~40 °C), combined with moderately alkaline pH values (~7.5) and either intermediate or higher substrate ratios under moderate temperature conditions. This prominent role of temperature in tVFA generation can be attributed to its impact on microbial community dynamics [51].
Moreover, previous research has demonstrated that temperature and pH interact synergistically to optimize microbial growth conditions during AcoD processes [52]. Overall, these findings suggest that the conditions favoring tVFA accumulation differ from those optimizing methanogenesis, which is particularly relevant for the design of multi-stage digestion systems or processes aiming at tVFA recovery as value-added intermediates.
The analysis of biomethane yield (mLCH4/gVS) revealed that although no variables reached full statistical significance, temperature and the quadratic term of the substrate ratio approached the significance threshold. The response surface analysis revealed that intermediate pH (~7.5) and temperature (~55 °C) favored higher biomethane production, while low substrate ratios (~20–30% PS) enhanced yields at middle-low temperatures (~40 °C). Mathematical optimization predicted that under intermediate conditions—a temperature of 35 °C, a pH of 8, and a 50:50 PS:WV ratio—the theoretical maximum biomethane yield could reach 487.94 mL CH4/gVS. These trends can be rationalized by known inhibition mechanisms in AcoD. Specifically, excessive substrate concentrations can lead to tVFA accumulation and subsequent pH drops, inhibiting methanogenesis [45].
In addition, balanced substrate ratios (~50PS:50WV) likely prevent acidification and nutrient imbalances, while also maintaining an appropriate C/N ratio essential to avoid ammonia toxicity or nitrogen limitation [30]. Likewise, moderate temperatures avoid thermal inhibition and favor methanogenic performance, since high ammonia concentrations (>1.5–3.0 gN/L) at elevated temperatures are known to inhibit the process [30]. Although pH was a less influential variable according to the model, the optimization confirmed an optimal pH of 8, highlighting the importance of strong buffering capacity to resist acidogenic shocks and maintain system stability [44]
Subsequently, a kinetic analysis was conducted using two commonly applied models for AcoD: first-order and modified Gompertz. The modified Gompertz model consistently exhibited the best fit across all experimental conditions, accurately representing the temporal dynamics of biomethane production and enabling the estimation of key kinetic parameters. In contrast, the first-order model showed lower predictive capability, likely because it does not account for the initial exponential growth phase followed by a steady-state phase at the maximum production rate, which is typical in biogas production during AcoD [42,43]. Notably, the superior performance of the modified Gompertz model also enabled clearer differentiation between experimental conditions, reinforcing that a 50PS:50WV substrate ratio and a temperature of 52.5 °C are optimal for volumetric yield. These results reinforce the importance of applying more flexible models to better capture the complex kinetics and rate-limiting steps of the process under different operational conditions [53].
Although this study focused on three key variables—temperature, substrate ratio, and pH—it is suggested that future research could expand the analysis by considering other parameters such as organic loading rate, hydraulic retention time, or micronutrient supplementation, as well as evaluating the long-term stability of the process under optimal condition.
5. Conclusions
The AcoD of pig slurry and wine vinasse has proven to be an effective strategy for enhancing biomethane production and valorizing agro-industrial residues. Through the application of a Box–Behnken design within the framework of RSM, the process was successfully optimized, identifying 35 °C, pH 8, and a 50PS:50WV substrate ratio as optimal conditions, which yielded a predicted maximum biomethane production of 487.94 mL CH4/gVS.
Across all comparative pairs, the combination of a 50PS:50WV ratio and a temperature of 52.5 °C consistently resulted in higher volumetric production. These findings underscore the importance of substrate balance and moderate thermophilic conditions for optimizing process performance. Furthermore, the modified Gompertz model was consistently more accurate than the first-order model, particularly due to its ability to capture the initial lag phase. In fact, the Gompertz model achieved R2 values consistently higher than 0.988, demonstrating a markedly superior fit across all conditions. Consequently, the modified Gompertz model is recommended for kinetic modeling in similar systems due to its superior descriptive capacity and flexibility.
Interestingly, the conditions favoring tVFA accumulation—such as lower temperatures (~50 °C), intermediate pH (~7.5), and higher or intermediate substrate ratios—differed significantly from those optimizing biomethane production and biomethane yield. This distinction highlights the possibility of steering the process toward different end-products, depending on operational objectives, and supports the potential for multi-stage or selectively controlled anaerobic systems.
These findings reinforce the viability of optimized AcoD as a sustainable strategy for renewable energy generation and waste management. The combined use of empirical and kinetic modeling offers a powerful methodology to improve the design, control, and scalability of AD processes, particularly in industries such as pig farming and winemaking that face significant challenges in organic waste treatment. Future research could explore the incorporation of pretreatment technologies to further enhance process performance. For example, low-intensity magnetic pretreatment could be a promising option to improve the efficiency and stability of anaerobic digestion [54]. Such technologies help accelerate hydrolysis, increase biogas production, and improve system stability, while reducing inhibitory compounds and fostering optimal conditions for microbial activity, resulting in more efficient and resilient AD processes.
Author Contributions
Conceptualization, B.C., J.F.-R., R.S. and M.P.; methodology, B.C.; software, B.C. and J.F.-R.; validation, B.C.; formal analysis, B.C. and J.F.-R.; investigation, B.C.; resources, R.S. and M.P.; data curation, B.C. and J.F.-R.; writing—original draft preparation, B.C.; writing—review and editing, B.C., J.F.-R., R.S. and M.P.; visualization, J.F.-R., R.S. and M.P.; supervision, J.F.-R., R.S. and M.P.; project administration, R.S. and M.P.; funding acquisition, R.S. and M.P. All authors have read and agreed to the published version of the manuscript.
Funding
This research was founded by Junta de Andalucía for the award of the project Sustainable management of agri-food waste: Energy recovery of slurry and stillage to generate energy and biofertilizers (File code: GOPG-CA-23-0002).
Data Availability Statement
The data presented in this study are available on request from the corresponding author.
Conflicts of Interest
The authors declare no conflicts of interest.
Abbreviations
The following abbreviations are used in this manuscript:
| PS | Pig slurry |
| WV | Wine vinasse |
| AcoD | Anaerobic co-digestion |
| DoE | Design of Experiments |
| VS | Volatile Solids |
| BMP | Biochemical Methane Potential |
| BBD | Box–Behnken design |
| AD | Anaerobic digestion |
| RSM | Response Surface Methodology |
| CCD | Central Composite Design |
| DM | Doehlert Matrix Design |
| tVFA | Volatile Fatty Acids |
| WWTP | Wastewater treatment plant |
| TS | Total Solids |
| tCOD | Total Chemical Oxygen Demand |
| sCOD | Soluble Chemical Oxygen Demand |
| FID | Flame ionization detector |
References
- Pirmoradi, N.; Ghaneian, M.T.; Ehrampoush, M.H.; Salmani, M.H.; Hatami, B. The conversion of poultry slaughterhouse wastewater sludge into biodiesel: Process modeling and optimization. Renew. Energy 2021, 178, 1236–1249. [Google Scholar] [CrossRef]
- Faisal, S.; Ebaid, R.; Li, L.; Zhao, F.; Wang, Q.; Huang, J.; Abomohra, A. Enhanced waste hot-pot oil (WHPO) anaerobic digestion for biomethane production: Mechanism and dynamics of fatty acids conversion. Chemosphere 2022, 307, 135955. [Google Scholar] [CrossRef] [PubMed]
- Johannesson, G.H.; Crolla, A.; Lauzon, J.D.; Gilroyed, B.H. Estimation of biogas co-production potential from liquid dairy manure, dissolved air flotation waste (DAF) and dry poultry manure using biochemical biomethane potential (BMP) assay. Biocatal. Agric. Biotechnol. 2020, 25, 101605. [Google Scholar] [CrossRef]
- Zhang, W.; Wei, Q.; Wu, S.; Qi, D.; Li, W.; Zuo, Z.; Dong, R. Batch anaerobic co-digestion of pig manure with dewatered sewage sludge under mesophilic conditions. Appl. Energy 2014, 128, 175e83. [Google Scholar] [CrossRef]
- Silva, F.M.S.; Mahler, C.F.; Oliveira, L.B.; Bassin, J.P. Hydrogen and biomethane production in a two-stage anaerobic digestion system by co-digestion of food waste, sewage sludge and glycerol. Waste Manag. 2018, 76, 339–349. [Google Scholar] [CrossRef]
- Sillero, L.; Solera, R.; Perez, M. Biochemical assays of potential biomethane to test biogas production from dark fermentation of sewage sludge and agricultural residues. Int. J. Hydrogen Energy 2022, 27, 13289–13299. [Google Scholar] [CrossRef]
- Bhatt, A.H.; Tao, L. Economic perspectives of biogas production via anaerobic digestion. Bioengineering 2020, 7, 74. [Google Scholar] [CrossRef]
- Guangyin, Z.; Youcai, Z. Sewage sludge generation and characteristics. In Pollution Control and Resource Recovery for Sewage Sludge; Elsevier: Amsterdam, The Netherlands, 2017; pp. 1–11. [Google Scholar] [CrossRef]
- Tena, M.; Perez, M.; Solera, R. Effect of hydraulic retention time on the methanogenic step of a two-stage anaerobic digestion system from sewage sludge and wine vinasse: Microbial and kinetic evaluation. Fuel 2021, 296, 120674. [Google Scholar] [CrossRef]
- Chynoweth, D.P.; Owens, J.M.; Legrand, R. Renewable biomethane from anaerobic digestion of biomass. Renew. Energy 2020, 22, 1e8. [Google Scholar] [CrossRef]
- Sillero, L.; Solera, R.; Perez, M. Anaerobic co-digestion of sewage sludge, wine vinasse and poultry manure for bio-hydrogen production. Int. J. Hydrogen Energy 2021, 47, 3667–3678. [Google Scholar] [CrossRef]
- Tena, M.; Buller, L.S.; Sganzerla, W.G.; Berni, M.; Forster-Carneiro, T.; Solera, R.; Perez, M. Techno-economic evaluation of bioenergy production from anaerobic digestion of byproducts from ethanol flex plants. Fuel 2022, 309, 122171. [Google Scholar] [CrossRef]
- Sganzerla, W.G.; Ampese, L.C.; Parisoto, T.A.C.; Forster-Carneiro, T. Process intensification for the recovery of biomethane-rich biogas from dry anaerobic digestion of açaí seeds. Biomass Convers. Biorefin. 2021, 13, 8101–8114. [Google Scholar] [CrossRef]
- Franchi, O.; Menin, L.; Sciubba, F. Green hydrogen production from biogas: A review on current technologies and applications. Renew. Sustain. Energy Rev. 2019, 102, 266–277. [Google Scholar]
- Tena, S.; Martínez, E.J.; Gómez, X. Biochemical green hydrogen potential (BHP) of organic wastes: Dark fermentation trials. Int. J. Green Hydrogen Energy 2019, 44, 6716–6724. [Google Scholar]
- European Commission. Integrated Pig Manure Digestate Processing for a Direct Injection of Organic Liquid Fertilizer into Irrigation System. European Commission, LIFE Public Database. 2019. Available online: https://webgate.ec.europa.eu/life/publicWebsite/project/LIFE14-ENV-ES-000640/integrated-pig-manure-digestate-processing-for-direct-injection-of-organic-liquid-fertiliser-into-irrigation-systems (accessed on 18 April 2025).
- Kassam, A. ‘Toilet of Europe’: Spain’s Pig Farms Blamed for Mass Fish Die-Offs. The Guardian. 2021. Available online: https://www.theguardian.com/environment/2021/oct/13/toilet-of-europe-spains-pig-farms-blamed-for-mass-fish-die-offs#:~:text=Images%20of%20the%20lagoon’s%20cloudy,leaving%20the%20fish%20suffocating%20underwater (accessed on 18 April 2025).
- Miller, R.A. Spain: Composting in the Catalonia Wine Industry. BioCycle. 2004. Available online: https://www.biocycle.net/spain-composting-in-the-catalonia-wine-industry/ (accessed on 18 April 2025).
- García-González, M.C.; Riaño, B.; Teresa, M.; Herrero, E.; Provolo, G.; Moscatelli, G.; Piccinini, S.; Bonmati, A.; Bernal, M.P.; Wisniewska, H.; et al. Treatment of swine manure: Case studies in European’s N-surplus areas. Sci. Agric. 2016, 73, 444–454. [Google Scholar] [CrossRef]
- Grosser, A.; Neczaj, E.; Singh, B.R.; Almås, R.; Brattebø, H.; Kacprzak, M. Anaerobic digestion of sewage sludge with grease trap sludge and municipal solid waste as co-substrates. Environ. Res. 2017, 155, 249–260. [Google Scholar] [CrossRef]
- Li, Z.; Chen, Z.; Ye, H.; Wang, Y.; Luo, W.; Chang, J.S.; Li, Q.; He, N. Anaerobic co-digestion of sewage sludge and food waste for hydrogen and VFA production with microbial community analysis. Waste Manag. 2018, 78, 789–799. [Google Scholar] [CrossRef]
- Nasr, M.; Ismail, S.A.; Mostafa, A.T. Enhancement of anaerobic co-digestion of slaughterhouse wastes for biogas production: A review. J. Clean. Prod. 2020, 276, 124247. [Google Scholar]
- Zamanzadeh, M.; Parker, W.; Neufeld, J.D. Inhibition and recovery in anaerobic digestion of slaughterhouse waste: A kinetic study on ammonia and VFAs. Bioresour. Technol 2021, 562, 124312. [Google Scholar]
- López-González, J.A.; González-López, C.; Martínez-Hernández, S. Valorization of digestate for biofertilizer and bioplastics production. Fuel 2020, 274, 117962. [Google Scholar]
- Nor, N.M.; Mohamed, M.S.; Loh, T.C.; Foo, H.L.; Rahim, R.A.; Tan, J.S.; Mohamed, R. Comparative analyses of medium optimization using one-factor-at-a-time, response surface methodology, and artificial neural network for lysine-methionine biosynthesis by Pediococcus pentasaceus RF-1. Biotechnol. Biotechnol. Equip. 2017, 31, 935–947. [Google Scholar] [CrossRef]
- Bradley, N. The Response Surface Methodology. Master’s Thesis, Indiana University South Bend, South Bend, IN, USA, 2017. [Google Scholar]
- Berkani, M.; Kadmi, Y.; Bouchareb, M.K.; Bouhelassa, M.; Bouzaza, A. Combinatıon of a Box-Behnken design technique with response surface methodology for optimization of the photocatalytic mineralization of C.I. Basic Red 46 dye from aqueous solution. Arab. J. Chem. 2020, 13, 8338–8834. [Google Scholar] [CrossRef]
- Ferreira, S.L.C.; Bruns, R.E.; Da Silva, E.G.P.; Dos Santos, W.N.L.; Quintella, C.M.; David, J.M.; De Andrade, J.B.; Breitkreitz, M.C.; Jardin, I.C.S.F.; Neto, B.B. Statistical designs, and response surface techniques for the optimization of chromatographic systems. J. Chromatogr. A 2007, 1158, 2–14. [Google Scholar] [CrossRef] [PubMed]
- Montgomery, D.C. Design and Analysis of Experiments; John Wiley and Sons: New York, NY, USA, 2001. [Google Scholar]
- Mosquera, J.; Varela, L.; Santis, A.; Villamizar, S.; Acevedo, P.; Cabeza, I. Improving anaerobic co-digestion of different residual biomass sources readily available in Columbia by process parameters optimization. Biomass Bioenergy 2020, 142, 105790. [Google Scholar] [CrossRef]
- Mosquera, J.; Rangel, C.; Thomas, J.; Santis, A.; Acevedo, P.; Cabeza, I. Biogas Production by Pilot-Scale Anaerobic Co-Digestion and Life Cycle Assessment Using a Real Scale Scenario: Independent Parameters and Co-Substrates Influence. Processes 2021, 9, 1875. [Google Scholar] [CrossRef]
- Akhmetov, N.; Ar, İ. Determination of Optimun Conditions for Biogas Production from Different Animal Manures and Maize Silage: Box-Behnken Design and Mechanism. Turk. J. Agric. Nat. Sci. 2023, 10, 640–649. [Google Scholar] [CrossRef]
- Devesa-Rey, R.; Arce, E.; Cartelle, A.; Suárez-García, A. Use of Plackett–Burman and Box–Behnken Designs to Optimize Bioelectricity Production from Winery Residues. Water 2023, 15, 3051. [Google Scholar] [CrossRef]
- American Public Health Association (APHA); American Water Works Association (AWWA); Water Environment Federation (WEF). Standard Methods for the Examination of Water and Wastewater, 22nd ed.; APHA: Washington, DC, USA, 2012. [Google Scholar]
- Amani, T.; Nosrati, M.; Mousavi, S.M. Study of syntrophic anaerobic digestion of volatile fatty acids using enriched cultures at mesophilic and thermophilic conditions. Int. J. Environ. Sci. Technol. 2010, 7, 311–322. [Google Scholar] [CrossRef]
- Demirel, B.; Scherer, P. The roles of acetotrophic and hydrogenotrophic methanogens during anaerobic conversion of biomass to methane: A review. Rev. Environ. Sci. Bio/Technol. 2008, 7, 173–190. [Google Scholar] [CrossRef]
- Boušková, A.; Dohányos, M.; Schmidt, J.E.; Angelidaki, I. Strategies for changing temperature from mesophilic to thermophilic conditions in anaerobic CSTR reactors treating sewage sludge. Water Res. 2005, 39, 1481–1488. [Google Scholar] [CrossRef]
- Mata-Alvarez, J.; Macé, S.; Llabrés, P. Anaerobic digestion of organic solid wastes. An overview of research achievements and perspectives. Bioresour. Technol. 2000, 74, 3–16. [Google Scholar] [CrossRef]
- Banks, C.J.; Chesshire, M.; Heaven, S.; Arnold, E. Anaerobic digestion of source-segregated domestic food waste: Performance assessment by mass and energy balance. Bioresour. Technol. 2011, 102, 612–620. [Google Scholar] [CrossRef] [PubMed]
- Scarcelli, P.G.; Serejo, M.L.; Paulo, P.L.; Boncz, M.Á. Evaluation of biomethanization during co-digestion of thermally pretreated microalgae and waste activated sludge, and estimation of its kinetic parameters. Sci. Total Environ. 2020, 706, 135745. [Google Scholar] [CrossRef] [PubMed]
- Kim, H.-W.; Han, S.-K.; Shin, H.-S. The optimization of food waste addition as a co-substrate in anaerobic digestion of sewage sludge. Waste Manag. Res. 2003, 21, 515–526. [Google Scholar] [CrossRef]
- Madenoğlu, T.G.; Jalilnejad Falizi, N.; Kabay, N.; Güneş, A.; Kumar, R.; Pek, T.; Yüksel, M. Kinetic analysis of biomethane production from anaerobic digestion of water lettuce (Pistia stratiotes L.) with waste sludge. Fuel 2022, 324, 124436. [Google Scholar] [CrossRef]
- Ripoll, V.; Agabo-García, C.; Perez, M.; Solera, R. Improvement of biomethane potential of sewage sludge anaerobic co-digestion by addition of “sherry-wine” distillery wastewater. J. Clean. Prod. 2020, 251, 119667. [Google Scholar] [CrossRef]
- Ngema, L.; Madondo, I.N.; Mguni, L.L.; Sathiyah, D.; Tetteh, E.K.; Rathilal, S. Optimizing Anaerobic Digestion of a Local South African Municipal Wastewater Using Box-Behnken Design of Response Surface Methodology. In Proceedings of the 39th JOHANNESBURG International Conference on “Chemical, Biological and Environmental Engineering” (JCBEE-23), Johannesburg, South Africa, 16–17 November 2023. [Google Scholar] [CrossRef]
- Kim, H.W.; Shin, H.S.; Han, S.K.; Oh, S.E. Response Surface Optimization of Substrates for Thermophilic Anaerobic Co-digestion of Sewage Sludge and Food Waste. J. Air Waste Manag. Assoc. 2007, 57, 309–318. [Google Scholar] [CrossRef]
- Zhao, L.; Zhang, Y.; Wang, M.; Yu, D. Influence of pH on anaerobic digestion: A comprehensive review of different reactor configurations. Chem. Eng. J. 2020, 382, 122827. [Google Scholar]
- Aboudi, K.; Álvarez-Gallego, C.J.; Romero García, L.I. Optimization of anaerobic co-digestion of fruit and vegetable waste and sewage sludge using the Box-Behnken design of experiments. J. Environ. Manag. 2020, 263, 110404. [Google Scholar]
- Kothari, R.; Pandey, A.; Kumar, S. Anaerobic digestion of organic wastes for hydrogen production: A sustainable energy perspective. Fuel 2020, 316, 123456. [Google Scholar]
- Appels, L.; Lauwers, J.; Degrève, J.; Helsen, L.; Lievens, B.; Willems, K.; Impe, J.V.; Dewil, R. Anaerobic digestion in global bio-energy production: Potential and research challenges. Renew. Sustain. Energy Rev. 2011, 15, 4295–4301. [Google Scholar] [CrossRef]
- Mao, C.; Feng, Y.; Wang, X.; Ren, G. Review on research achievements of biogas from anaerobic digestion. Renew. Sustain. Energy Rev. 2015, 45, 540–555. [Google Scholar] [CrossRef]
- Chen, Y.; Cheng, J.J.; Creamer, K.S. Inhibition of anaerobic digestion process: A review. Bioresour. Technol. 2008, 99, 4044–4064. [Google Scholar] [CrossRef] [PubMed]
- Labatut, R.A.; Angenent, L.T.; Scott, N.R. Conventional mesophilic vs. thermophilic anaerobic digestion: A trade-off between performance and stability? Water Res. 2014, 53, 249–258. [Google Scholar] [CrossRef]
- Arslan, D.; Steinmetz, H.; Özdemir, E. Green hydrogen production from waste biomass via anaerobic digestion: Kinetics and reactor design. Bioresour. Technol. 2022, 364, 127358. [Google Scholar]
- Di Costanzo, N.; Di Capua, F.; Cesaro, A.; Carraturo, F.; Salamone, M.; Mascolo, M.C.; Carpentieri, A.; Esposito, G. Low-intensity magnetization pretreatment to enhance biomethane generation and the abundance of key microorganisms for anaerobic digestion of sewage sludge. Bioresour. Technol. 2024, 413, 131534. [Google Scholar] [CrossRef]
Disclaimer/Publisher’s Note: The statements, opinions and data contained in all publications are solely those of the individual author(s) and contributor(s) and not of MDPI and/or the editor(s). MDPI and/or the editor(s) disclaim responsibility for any injury to people or property resulting from any ideas, methods, instructions or products referred to in the content. |
© 2025 by the authors. Licensee MDPI, Basel, Switzerland. This article is an open access article distributed under the terms and conditions of the Creative Commons Attribution (CC BY) license (https://creativecommons.org/licenses/by/4.0/).