Article

The Re-Modeling of a Polymeric Drug Delivery System Using Smart Response Surface Designs: A Sustainable Approach for the Consumption of Fewer Resources

1
Faculty of Pharmaceutical Engineering and Technology, German International University, New Administrative Capital 9030020, Egypt
2
Department of Pharmaceutics and Industrial Pharmacy, Faculty of Pharmacy, Ain Shams University, Cairo 11566, Egypt
*
Author to whom correspondence should be addressed.
ChemEngineering 2025, 9(3), 60; https://doi.org/10.3390/chemengineering9030060
Submission received: 7 February 2025 / Revised: 13 May 2025 / Accepted: 27 May 2025 / Published: 1 June 2025

Abstract

Introduction: The use of response surface designs for drug formulation is highly warranted nowadays. Such smart designs reduce the number of required experiments compared to full-factorial designs, while providing highly accurate and reliable results. Aim: This study compares the effectiveness of two of the most commonly used response surface designs—Central Composite Design (CCD) and D-optimal Design (DOD)—in modeling a polymer-based drug delivery system. The performance of the two designs was further evaluated under a challenging scenario where a central point was deliberately converted into an outlier. Methods: Both methods were assessed using ANOVA, R-squared values, and adequate precision, and were assessed through an experimental validation point. Results: Both models demonstrated statistical significance (p-value < 0.05), confirming their ability to describe the relationships between formulation variables and critical quality attributes (CQAs). CCD achieved higher R-squared and predicted R-squared values compared to DOD (0.9977 and 0.9846 vs. 0.8792 and 0.7858, respectively), rendering it as the superior approach in terms of modeling complex variables’ interactions. However, DOD proved to be more predictive as it scored a lower percentage relative error. Conclusion: The demonstrated resilience of both models, despite the introduction of an outlier, further validates their utility in real-world applications, instead of the exhaustive full-factorial design.

1. Introduction

The pharmaceutical industry continuously strives for innovations in drug delivery systems (DDSs) to enhance therapeutic efficacy and improve patient compliance. Amongst these advancements, polymer-based DDSs have emerged as promising systems that can leverage the unique properties of polymers to encapsulate drugs whilst providing controlled release, improved stability, and enhanced bioavailability [1,2]. However, optimizing the critical quality attributes (CQAs) of such systems, including particle size (PS), encapsulation efficiency, and drug release profiles, is essential for achieving the desired therapeutic outcomes and meeting regulatory standards. A pivotal methodology in pharmaceutical research for addressing such optimization challenges is the Design of Experiments (DoE) [3]. DoE is a statistical approach that systematically investigates the relationships between multiple factors and their effects on selected responses [4]. The integration of DoE in the development of polymer-based DDSs offers numerous benefits [4,5]. Unlike the traditional one-factor-at-a-time (OFAT) experimental approach, DoE identifies critical factors and evaluates interactions among variables simultaneously, at a substantially lower experimental workload. Thereby, adopting DoE helps in reducing time and resources’ consumption, while providing a robust process understanding and prediction of the response(s) [6]. Hence, DoE is currently considered a crucial element of quality by design (QbD). In fact, as part of pharmaceutical regulatory guidelines, the QbD framework emphasizes the use of DoE to ensure product quality and process reproducibility, underscoring the latter’s importance in modern pharmaceutical development and in facilitating smoother approval processes [7].
Two of the most widely used DoE approaches in pharmaceutical research are the Central Composite Design (CCD) and the D-optimal Design (DOD), each offering distinct advantages tailored to specific experimental needs and constraints [8,9].
CCD is a response surface methodology (RSM) used to model quadratic relationships between factors and responses. It incorporates factorial or fractional factorial designs, center points, and axial points to explore curvature effects. This design is particularly effective in optimizing formulation parameters of polymer-based DDS, where non-linear interactions, such as those between polymer concentration, drug loading, and processing conditions, are prevalent [10]. By providing a comprehensive understanding of these interactions, CCD enables researchers to predict responses across a broad experimental space [11].
On the other hand, DOD is highly flexible and especially efficient in scenarios where traditional factorial designs are impractical due to constraints like limited resources or complex experimental setups. In this design, a subset of experimental runs is selected such that the determinant of the information matrix is maximized, subsequently ensuring high statistical coverage and sufficiency [12]. Consequently, DOD is specifically valuable in optimizing pharmaceutical systems involving expensive active pharmaceutical ingredients (APIs) or rare excipients. Its adaptability makes it ideal for tackling issues related to advanced DDS, such as those related to the stability testing of polymeric nanoparticles (PNPs) [13].
PNPs have gained significant attention as advanced carriers for drug delivery and targeting. These sub-micron particles offer several advantages, including enhanced solubility and stability of drugs, improved bioavailability, and the ability to provide controlled and sustained release [14]. Their versatility allows for the encapsulation of both hydrophilic and hydrophobic drugs, addressing diverse therapeutic challenges. Additionally, PNPs can be surface-modified for targeted delivery, minimizing systemic side effects and improving therapeutic efficacy [14].
Polymers such as poly (lactic-co-glycolic acid) (PLGA), chitosan, and polyethylene glycol (PEG) are widely used in the fabrication of PNPs due to their biocompatibility and tunable properties [15]. PLGA, for example, is extensively employed in delivering anticancer agents, peptides, and vaccines because of its biodegradability and non-toxic degradation products. The ability to customize the polymer composition and processing conditions further enhances the utility of PNPs in precision medicine.
Optimizing the CQAs of PNPs, including PS, zeta potential, encapsulation efficiency, and drug release profiles, is crucial for achieving the desired therapeutic performance [16]. These attributes directly influence the nanoparticles’ stability, biodistribution and pharmacokinetics, making their systematic investigation and optimization a priority in drug delivery research.
This study was based on using smart response-surface DoE methodologies, specifically CCD and DOD, to re-model the CQAs of an established polymer-based DDS that has been published in the literature. The aim of such re-modeling was to evaluate the efficacy, accuracy and added value of modeling using smart designs (which employ a much lower number of experiments and run points) compared to more resource-consuming approaches. For this purpose, the study published by Bhavsar et al. 2006 [17] was re-visited, in which a polymeric Nanoparticles-in-Microsphere Oral Delivery System (NiMOS), composed of gelatin nanoparticles in poly(ε-caprolactone) (PCL) microspheres, were formulated. The study aimed at developing a stable oral delivery system that can protect the nanoparticles from gastrointestinal fluids and improve their mucosal uptake for drug delivery. In the original article, a 33 (usually denoted as 3-3) randomized full-factorial design [18,19] was employed to optimize the developed system and assess the influence of three independent variables, namely polymer concentration, nanoparticle amount in the internal phase and stirring speed, on its PS. The number of experimental runs in such a model is usually calculated by raising the number of levels (3) to the power of the number of factors (also 3), resulting in a total of 27 experimental runs. This design allowed for the simultaneous evaluation of the main effects, interaction terms, and quadratic effects of variables through an exhaustive design to ensure a comprehensive coverage of the experimental space. In the present work, we systematically re-evaluate the same key formulation variables reported in the work of Bhavsar et al. [17], within the same defined ranges, but through the application of two smart RSMs that claim comparable accuracy and reliability while minimizing experimental workload and material consumption.
By combining advanced experimental designs with the versatility of nanocarriers, we aim to develop innovative DDSs that meet therapeutic and industrial needs. This approach not only advances pharmaceutical research but also contributes to improved health-care outcomes by delivering safe, effective, and patient-friendly treatments [20]. Adopting experimental designs involving a small number of experiments leads to lower consumption of resources and aligns with the sustainable development goals (SDGs), specifically goal number 12 (responsible consumption and production). This goal aims for the achievement of sustainable management and the efficient use of natural resources (https://sdgs.un.org/) accessed on 1 February 2025.

2. Methodology

2.1. Software

The models and plots for CCD and DOD that are presented in this paper were produced using Design Expert v.7.0. (Design Expert Software, StatEase Inc., Minneapolis, MN, USA).

2.2. The Published Results of the Original Article

The work by Bhavsar et al. 2006 [17] was re-visited: the same factors and their corresponding range values were utilized in the current research work.
The investigated factors, also called critical processing parameters (CPPs), were as follows: X1: polymer concentration in the organic solvent (% w/v), X2: amount of nanoparticles used as the internal phase (mg) and X3: speed of homogenization (rpm). The response or CQA was Y: particle size (PS) of NiMOS (measured in micrometers) (Table 1).
The relationship between the factors and the response was modeled using regression analysis. The final cubic equation as reported in the original research was as follows:
Y = 11.789 + 4.804X1 − 0.648X2 − 4.646X3 + 0.562X12 + 2.482X22 + 1.543X32 − 0.870X1X2 + 0.955X2X3 − 2.701X1X3 − 0.431X1X2X3
where Y denotes the PS, and X1, X2 and X3 represent the factors [17].
Increasing the polymer concentration (X1) resulted in a larger PS, which can be attributed to a higher collision frequency during the formation of microspheres. In contrast, increasing the amount of the internal phase (X2) led to a reduction in PS, likely due to decreased distortion and droplet fusion within the emulsion. Additionally, higher homogenization speeds (X3) produced a smaller PS, consistent with established theories on microsphere formation. These findings highlight the significant influence of polymer concentration, internal phase amount, and homogenization speed on controlling PS during the process.

2.3. The Use of Central Composite and D-Optimal Designs to Re-Optimize the Results

A total of 20 points were used to generate the CCD (Table 2). Regarding DOD, the point-exchange settings of the Design Expert program were utilized to generate 17 points (10 models + 2 to estimate lack of fit + 0 replicates + 5 additional center points) (Table 3).

2.4. Introduction of an Outlier

Results of the newly adopted design points were generated based on the equation reported in the original research [17] (See Section 2.2).
An outlier central point result was deliberately introduced for all the central points of both the proposed designs. Accordingly, the PS for coded points corresponding to (0, 0, 0) for X1, X2 and X3, respectively, was altered to a value of 17 µm, as demonstrated in Table 2 and Table 3. The addition of an outlier was essential to deviate from the anticipated results’ perfection that is usually observed after employing the full-factorial design’s generated model. The value of the outlier point was set at 17 µm to deviate by more than 50% from the originally predicted value of 11.79 µm.

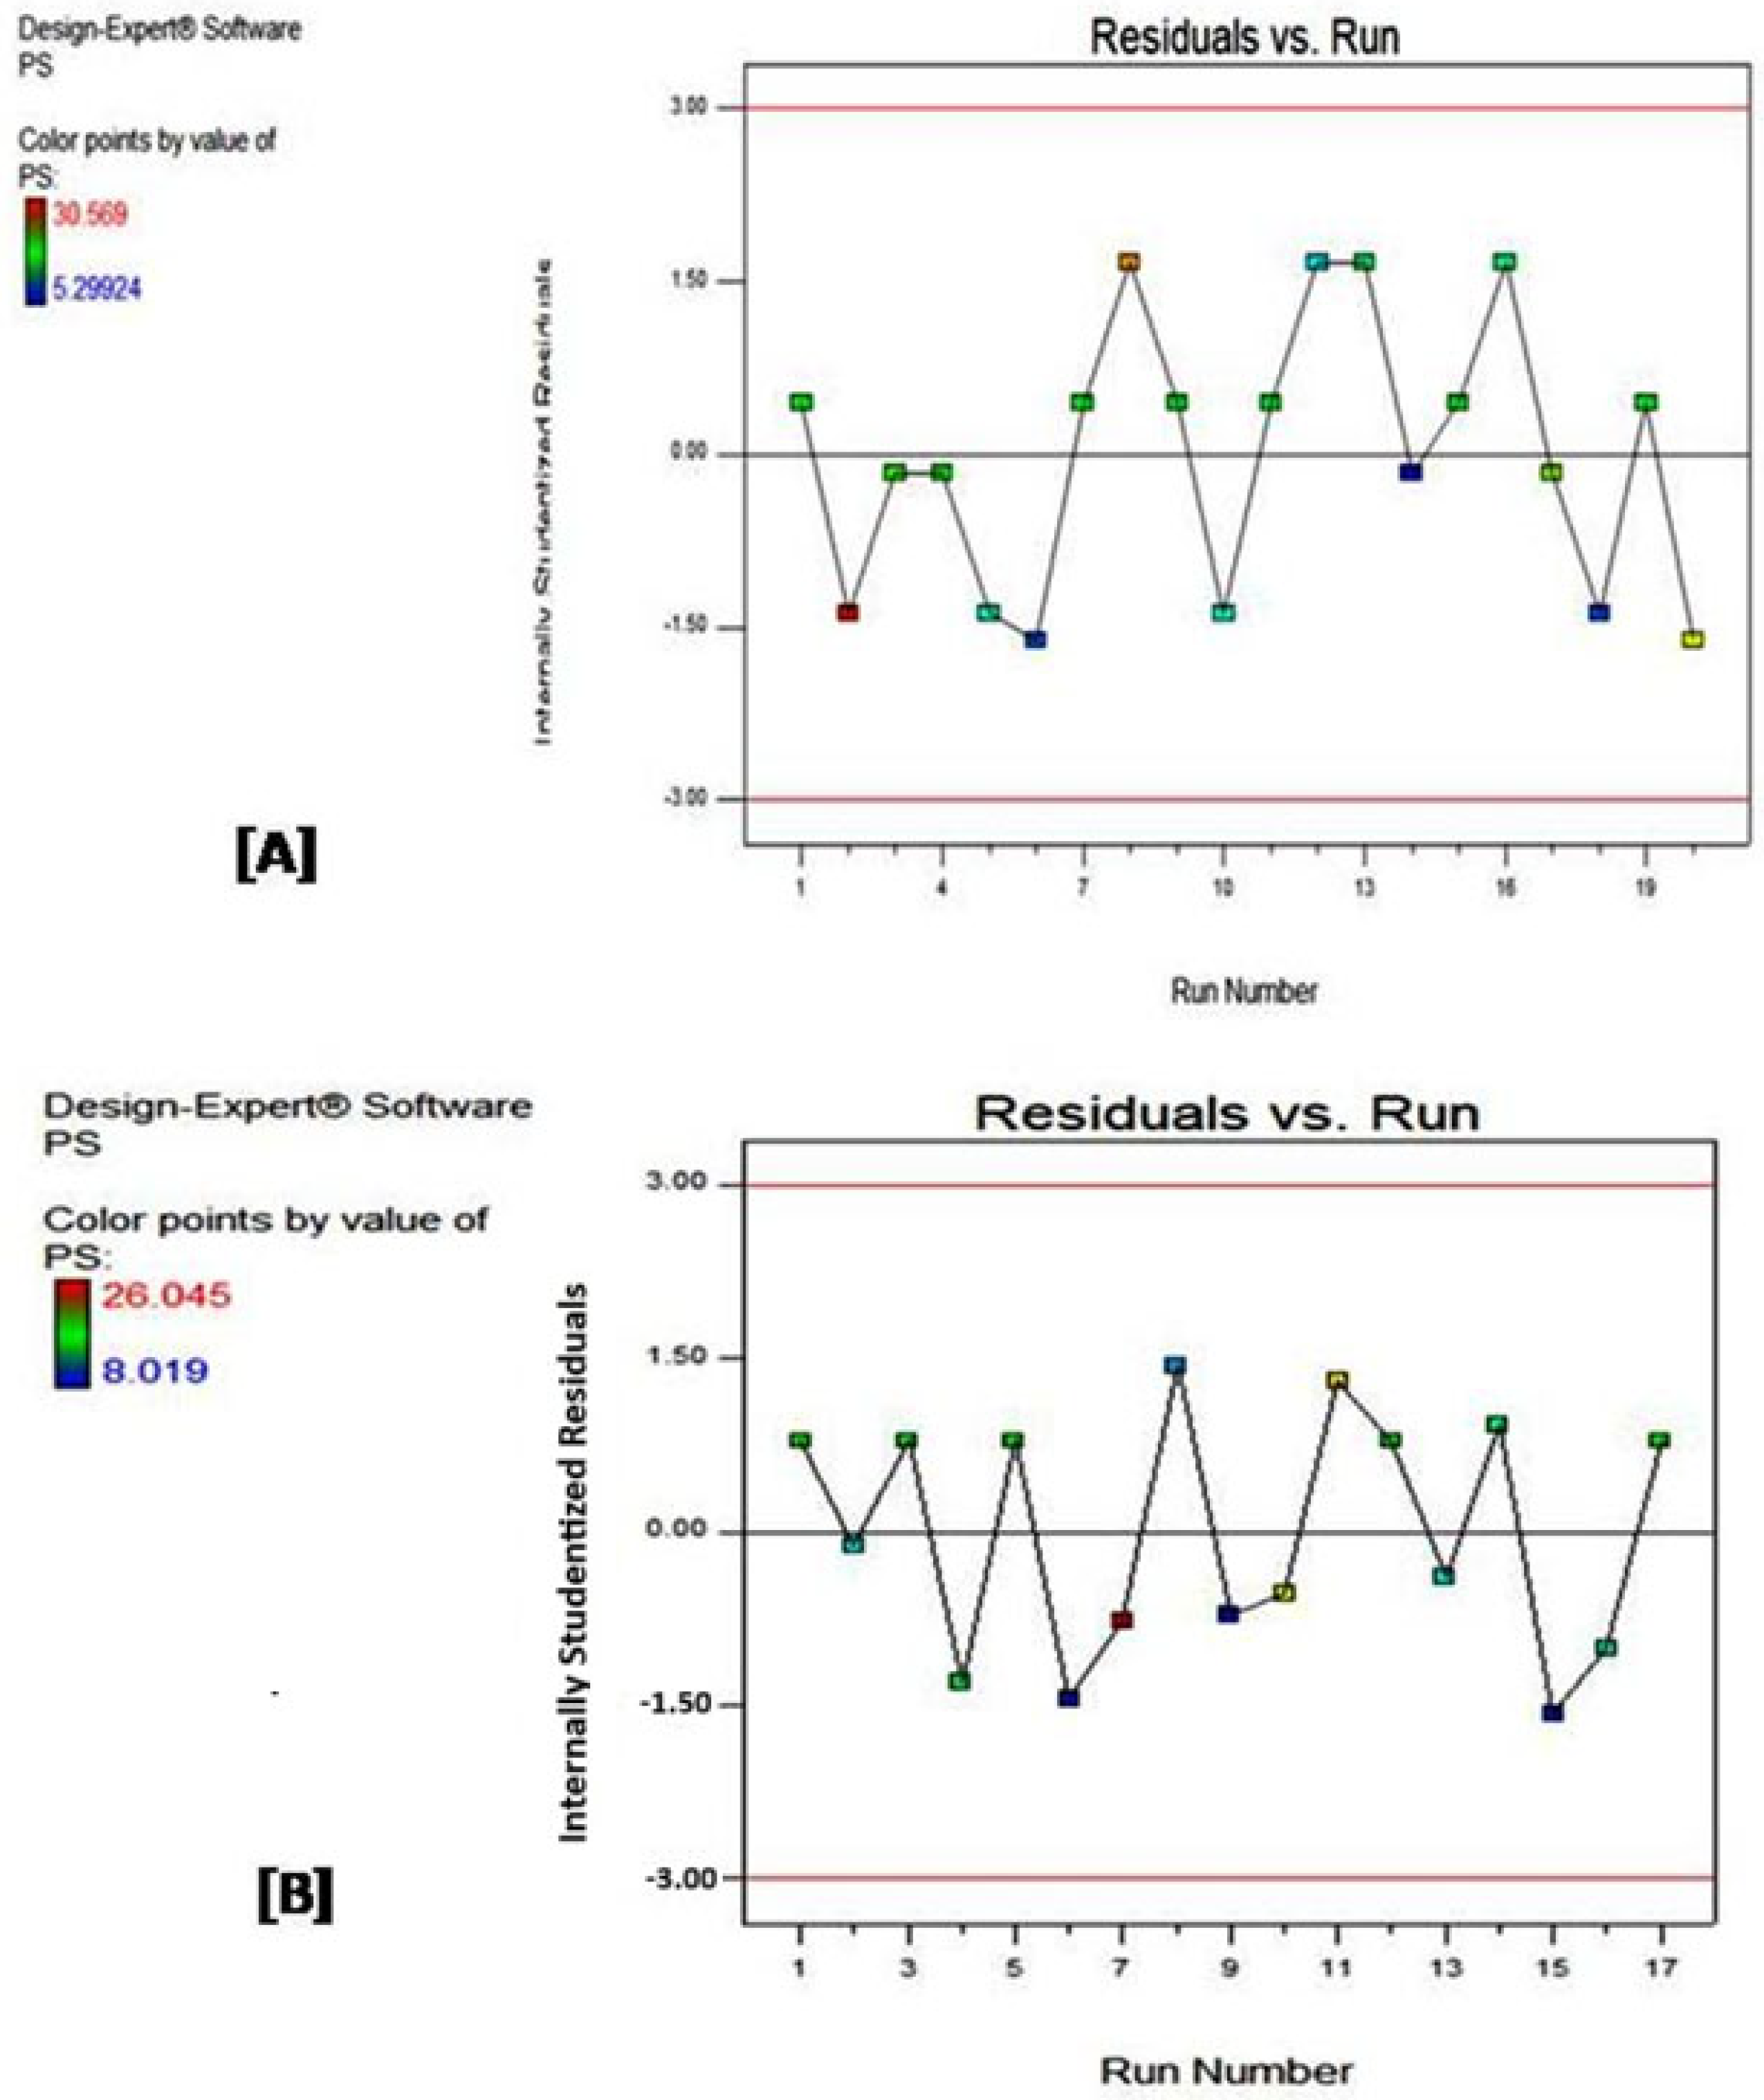
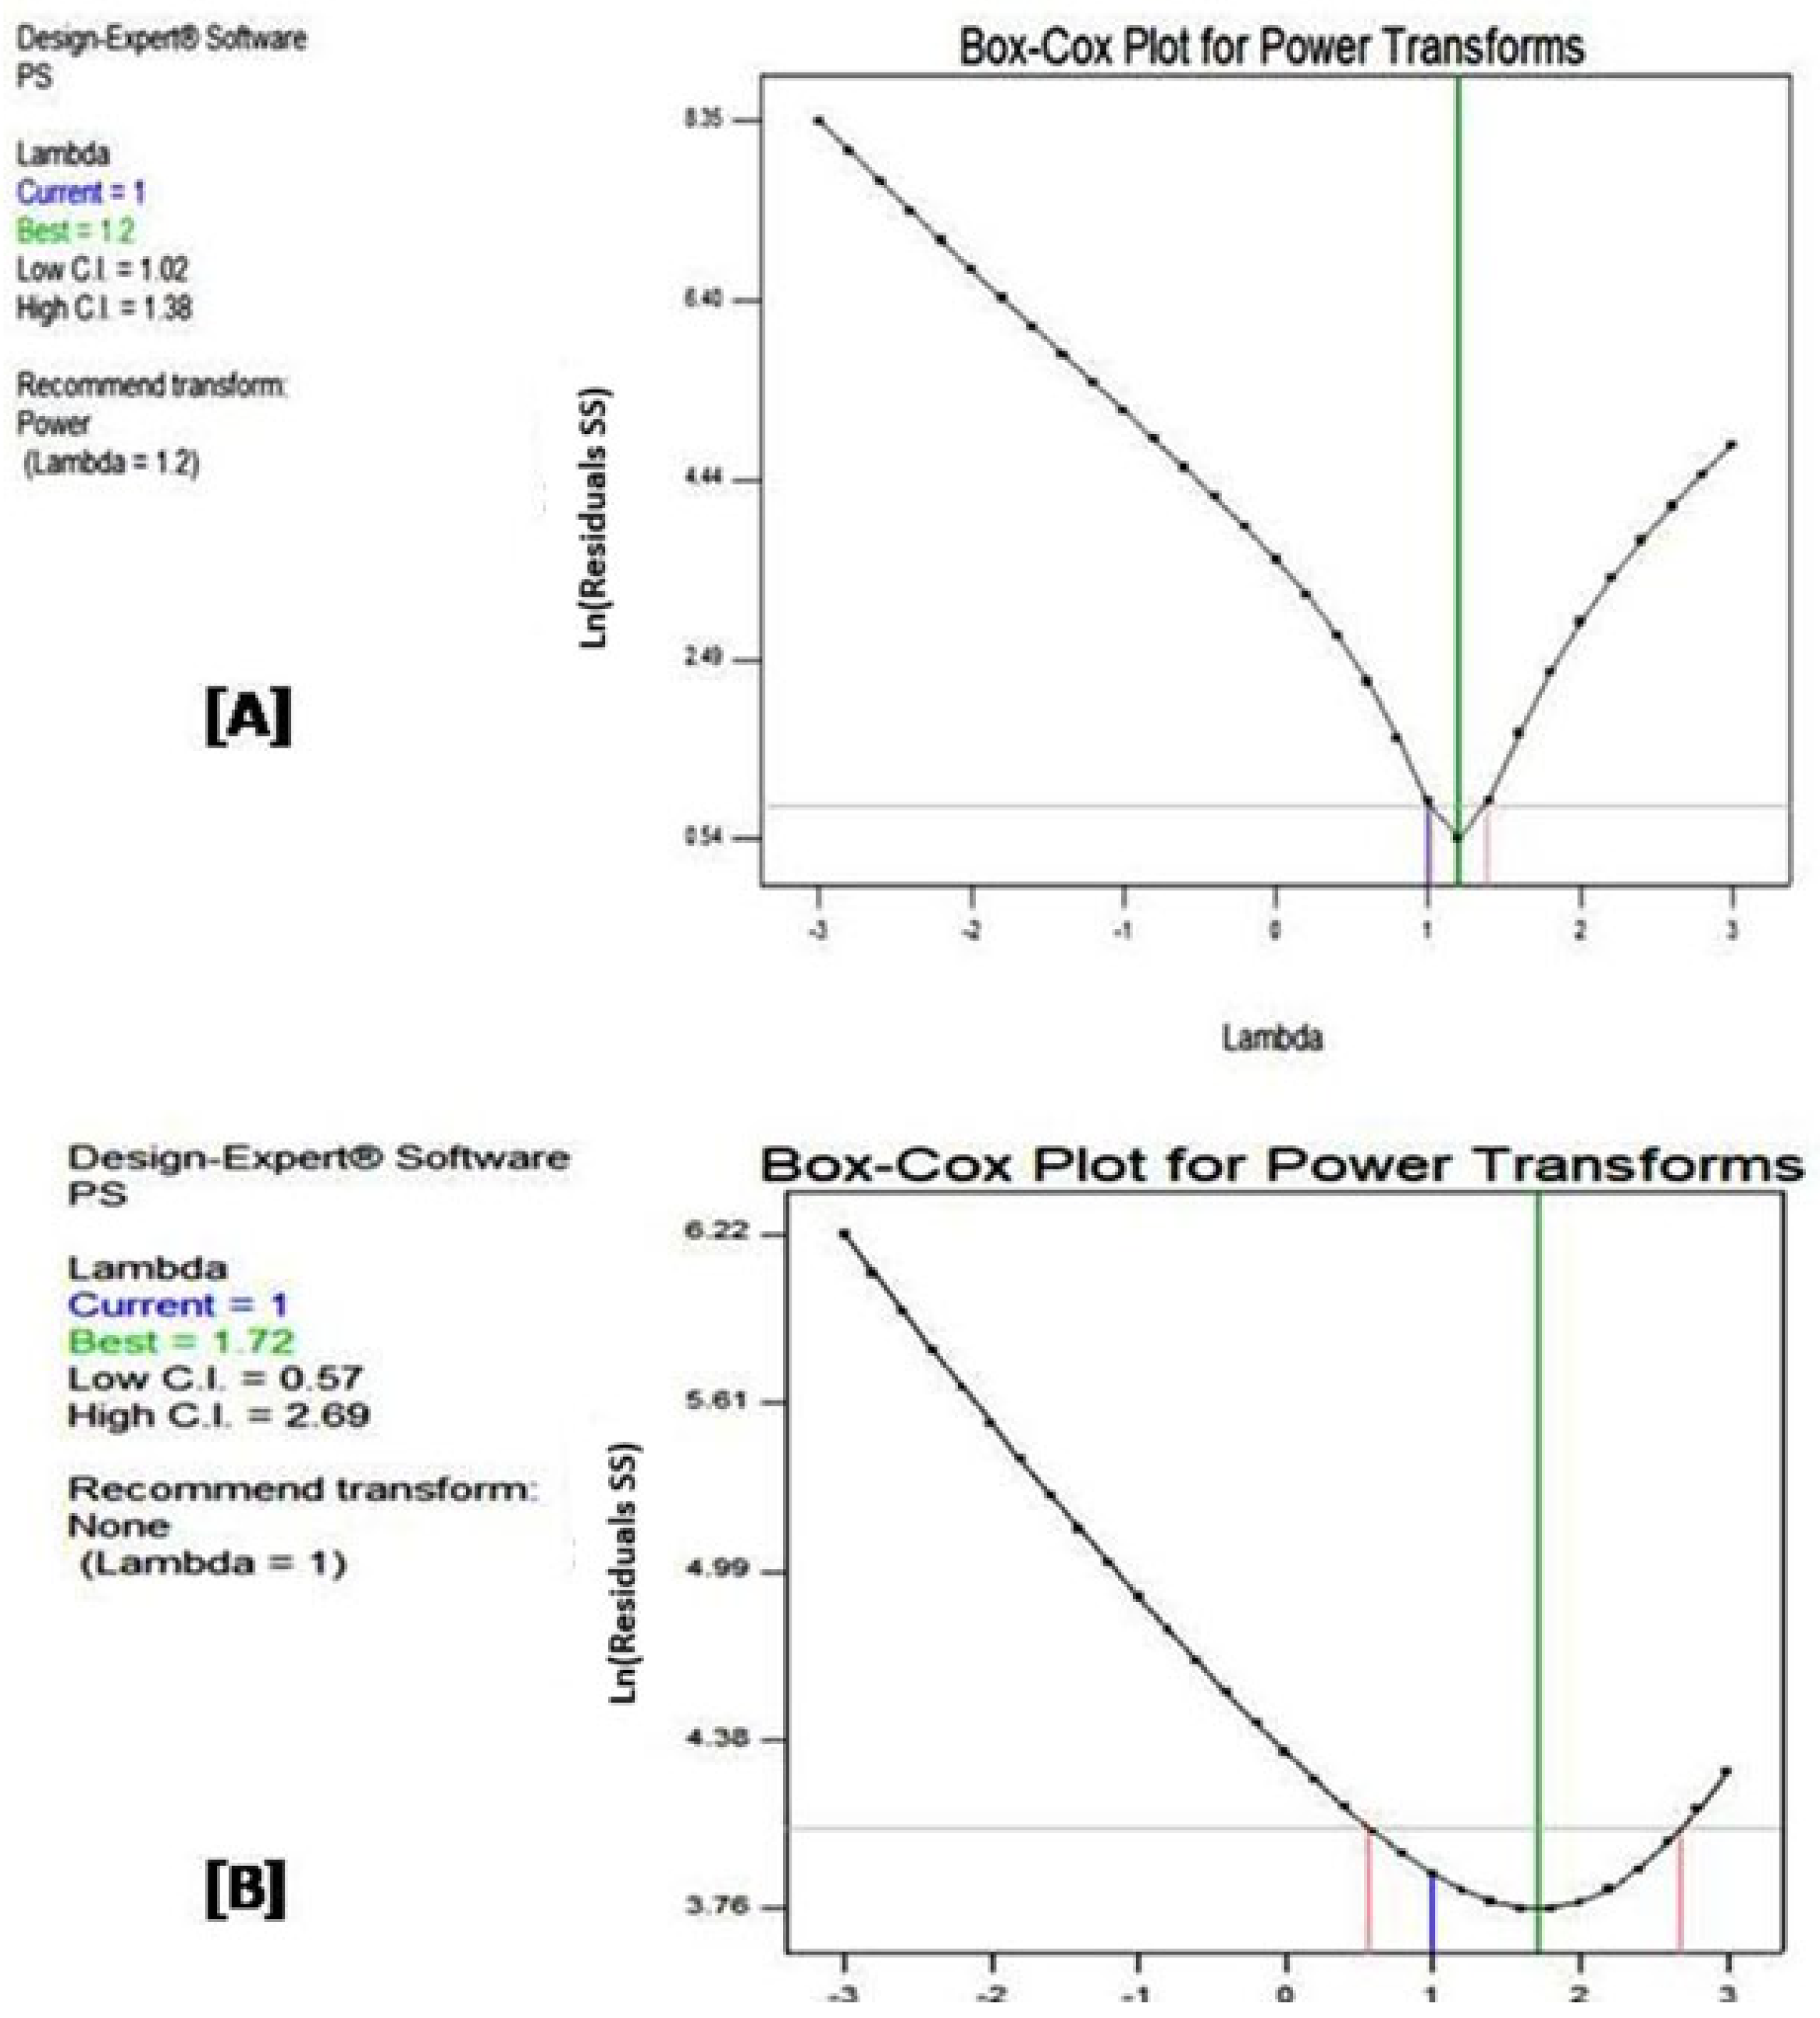
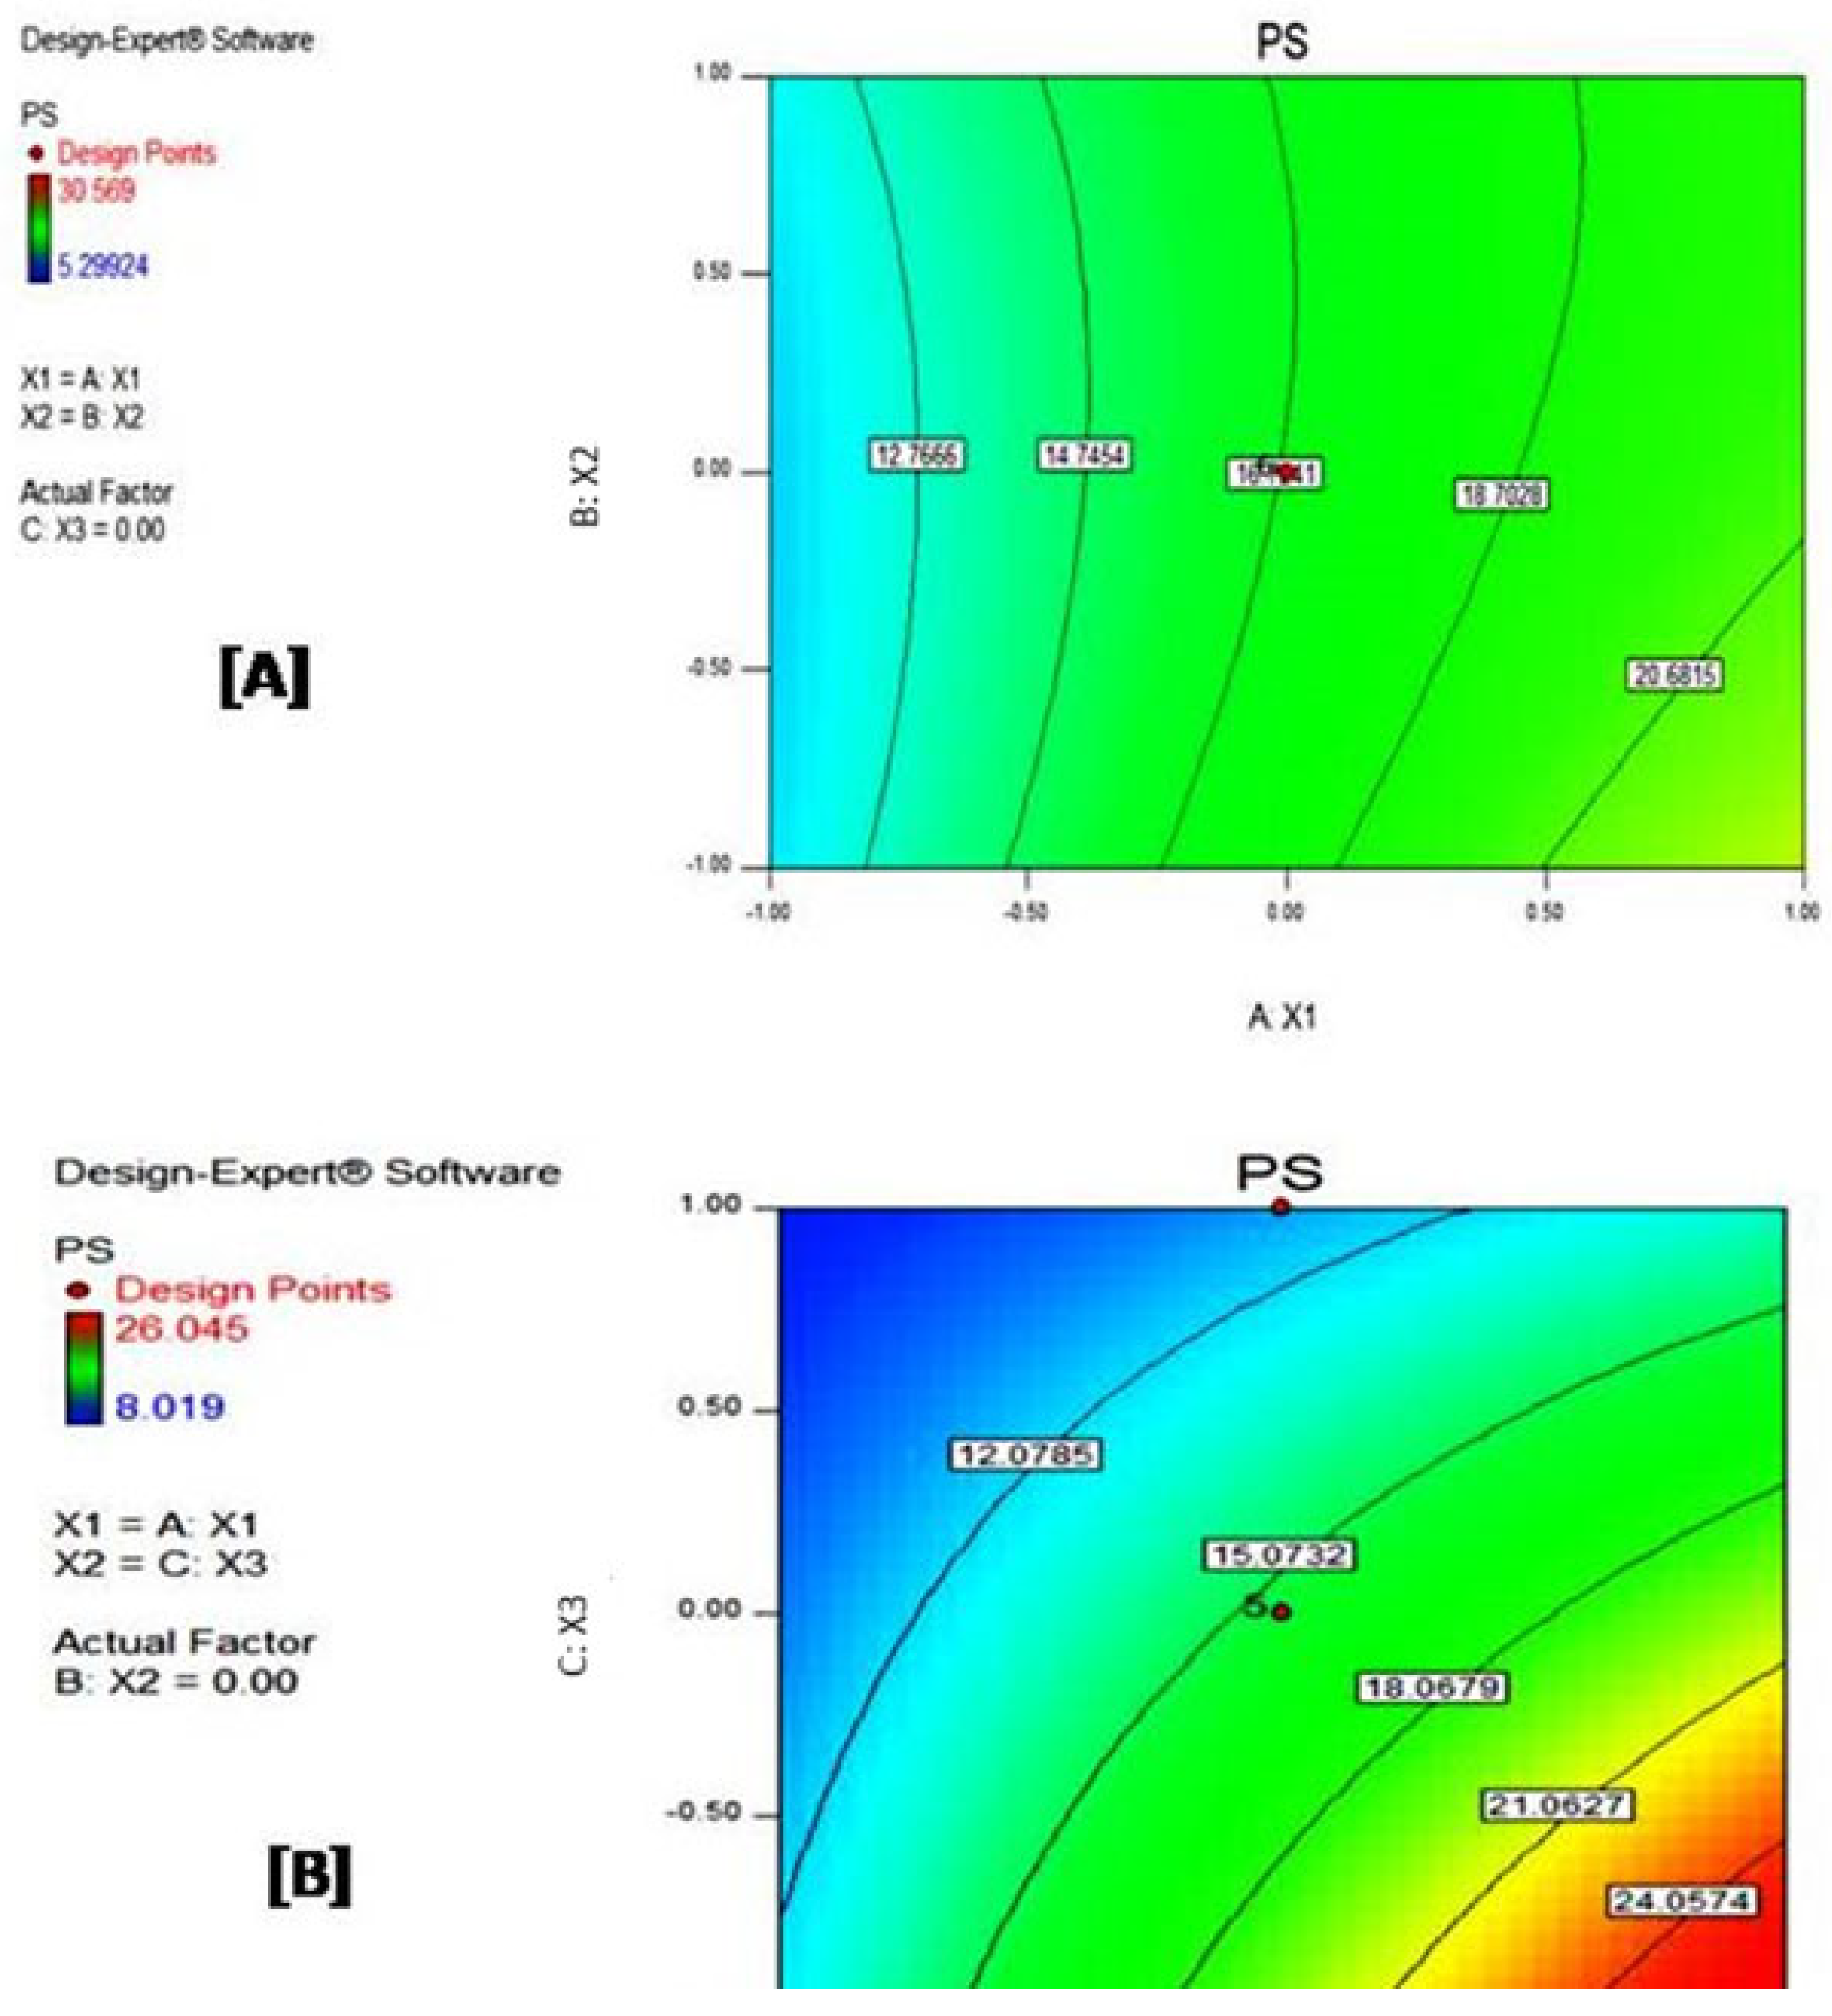
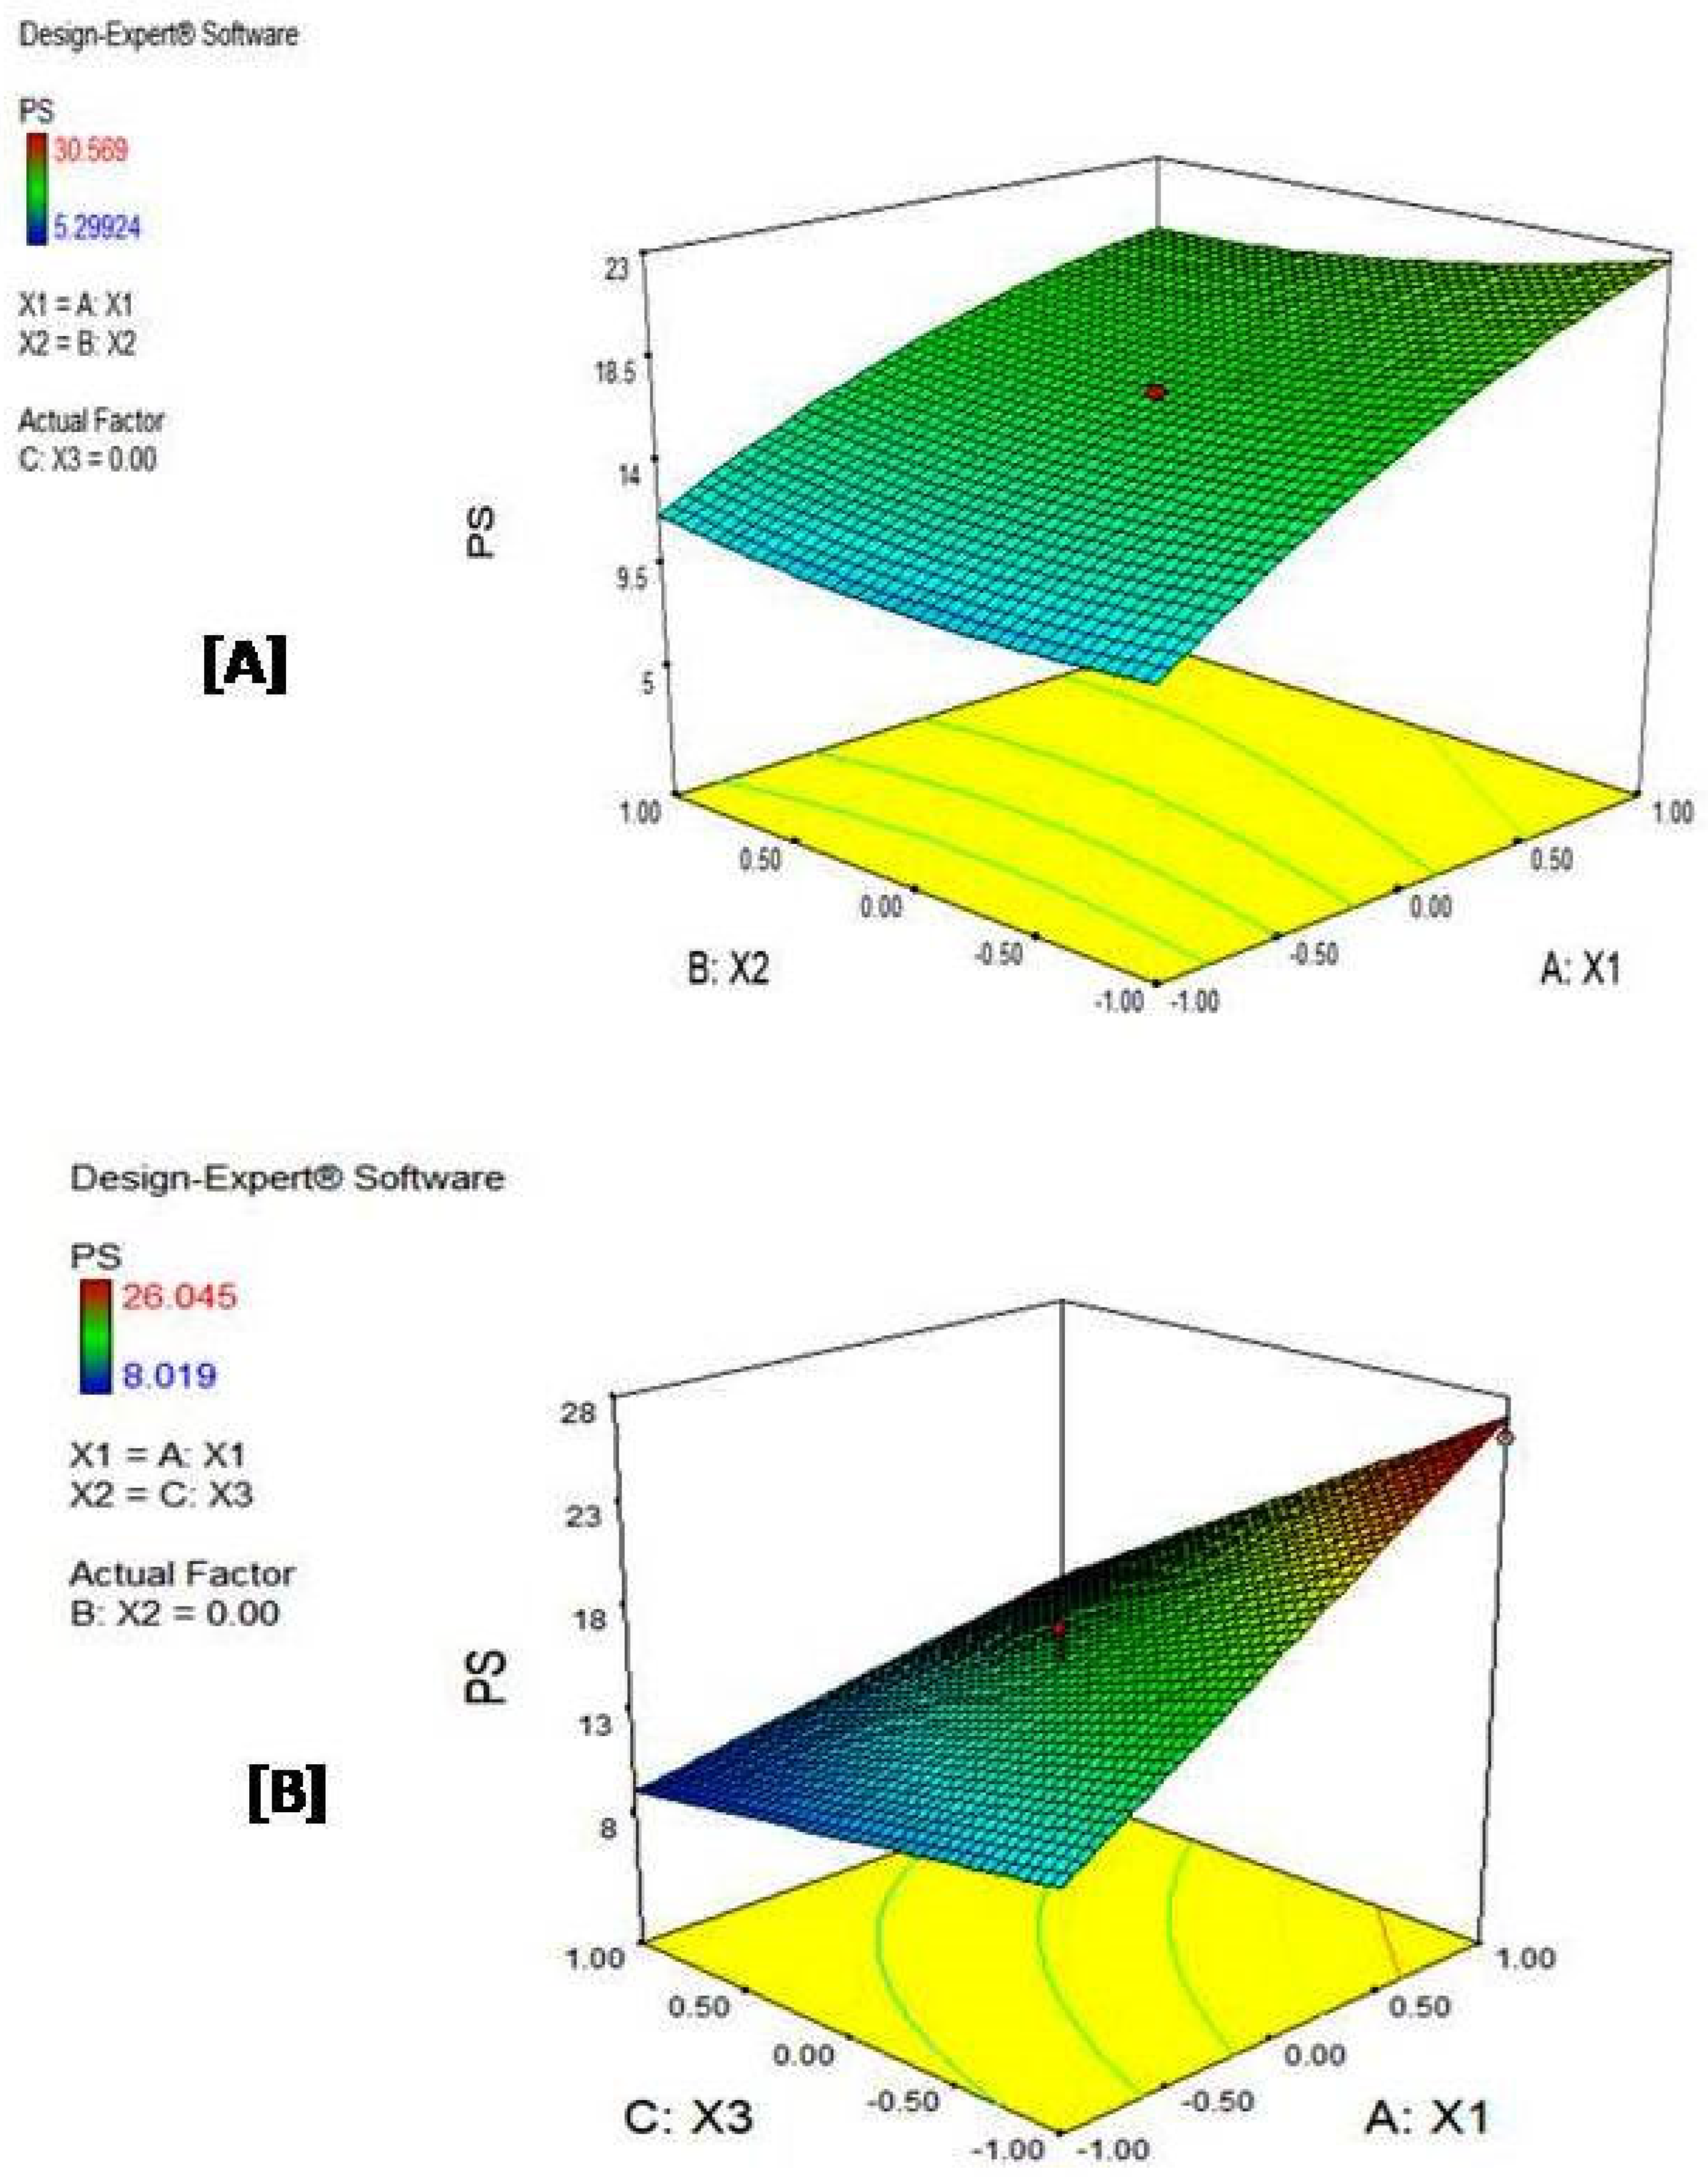
2.5. Analysis of Results

The process of generating the models, both of which were quadratic, was carefully documented. To evaluate the significance of the models, an ANOVA analysis was conducted. This statistical test assesses differences between groups, offering valuable insights into the models’ overall effectiveness and robustness.
To ensure the reliability and accuracy of the results, several key metrics were calculated, including R-Squared, Adjusted R-Squared, and Predicted R-Squared. The R-Squared value indicates how well the model fits the data, while the Adjusted R-Squared accounts for the fitting efficiency after the exclusion of insignificant terms. Predicted R-Squared reflects the model’s ability to predict the response; in this case, the PS. Additionally, the model’s adequate precision was assessed, providing a quantitative measure of the signal-to-noise ratio.
Visual diagnostic tests such as residuals versus runs, predicted versus actual plot and Box–Cox transformation were performed to further evaluate the model’s validity and easily identify any flaws or inefficiencies that might require adjustments. These diagnostic tools offer valuable insights into the model’s accuracy and highlight areas for potential improvement [21].
Moreover, to facilitate a deeper understanding of the models and their underlying relationships, contour and 3D surface plots were generated. These visual representations illustrate how changes in the variables (X1, X2 and X3) influence the response (PS). These plots also help identify optimal regions within the models and provide an intuitive way to interpret the findings.
Overall, generating the models, evaluating their significance, calculating key metrics, performing diagnostic tests, and visualizing the results through contour and 3D surface plots were critical steps in ensuring the validity and consistency of this study’s findings.

2.6. Percentage Relative Error (% Relative Error)

The percentage relative error between the predicted and actual results of a selected experimental formulation was calculated as a check point. The parameters of the check point were 2.5% w/v polymer (X1), 20 mg of nanoparticles as the internal phase (X2) and 6000 rpm as the speed of homogenization (X3), corresponding to a coded formulation of −0.5, −0.5, −0.5. The relative percentage error was computed for the two RSM designs investigated by utilizing the following equation:
Relative error (%) = (|Predicted value − Actual value|/Predicted value) × 100
The actual value for the PS of this check point was recorded as 14.7 µm (as reported by Bhavsar et al., 2006 [17]).

3. Results and Discussions

As depicted in Table 4, both models were statistically significant, with p-values lower than 0.05, indicating their effectiveness in explaining the variability in the response variable (PS). This confirms that both models are valid representations of the system albeit using fewer experiments (20 and 17 for CCD and DOD, respectively), as compared to that generated by the full-factorial design (27 runs). This corresponds to a 25% and 38% reduction in the laboratory work needed to model this polymeric system.
Comparison between the two designs reveals that CCD consistently outperforms DOD across multiple statistical measures and modeling aspects, making it the preferred choice for modeling the selected system (Table 4). In terms of model fit and explanation of variability, CCD achieves a much higher R-Squared value compared to DOD (0.9964 versus 0.8792, respectively). This indicates that CCD explains 99.64% of the response variability, whereas DOD accounts for only 87.92%. Additionally, CCD outperforms DOD in Adjusted R-Squared (0.9938 vs. 0.8435), demonstrating that CCD remains highly accurate, even after accounting for the insignificant terms in the model. DOD’s lower Adjusted R-Squared suggests that it may include fewer effective predictors or fail to fully capture the complexity of the system.
When assessing predictive accuracy using Predicted R-Squared, CCD achieved an impressive 0.9790 as opposed to 0.7858 by DOD, showing the higher reliability of the former for predicting purposes. Furthermore, CCD exhibits a significantly higher Adequate Precision (78.748) compared to DOD (19.072). Since values above four are desirable, CCD’s high value underscores its robustness and ability to distinguish meaningful signals from noise, whereas DOD, though acceptable, is far less precise.
In terms of complexity and comprehensiveness, the equation generated in CCD is more detailed, incorporating linear, interactions and quadratic terms. This allows it to capture complex relationships and nuanced interactions between variables (X1, X2, X3) and their combined effect on PS. On the other hand, the DOD equation is simpler, focusing only on linear and interaction terms. While this makes it easier to interpret, it may fail to capture important quadratic effects and interactions present in the system.
To sum up, the findings of the current work reveal that CCD displays a higher R-Squared, stronger predictive accuracy, and superior signal-to-noise ratio compared to DOD. CCD’s superior performance across all metrics reflects its ability to capture intricate relationships between variables and ensures a more comprehensive and precise representation for studying this polymeric system. Its ability to provide a detailed equation and better prediction of outcomes makes it an ideal DoE approach for systems with complex relationships between variables.
In the following section, a comprehensive comparison of the various visual representations generated by each DoE model is made to elucidate differences in system behavior and predictive performance.
Figure 1 displays the predicted vs. actual plots generated using Design-Expert® software for both investigated models. These plots are commonly used to assess the accuracy of predictive models by comparing predicted values (on the y-axis) against the actual experimental values (on the x-axis). The closer the data points are to the diagonal line, the more accurate the model’s predictions are.
As depicted in Figure 1A, CCD demonstrates a high accuracy and reliability in predicting outcomes, evidenced by the tightly clustered points around the diagonal line, indicating that predicted values closely match the actual values. Additionally, the range of PS values extends from 5.29924 (blue) to 30.569 (red), highlighting a broad response range and good capturing of the system’s complexity [22].
On the other hand, DOD exhibits moderate accuracy, with most of the points lying relatively close to the diagonal line (Figure 1B). However, noticeable deviations are seen, particularly at the higher range of PS values, indicating some prediction errors. The range of PS values is narrower than that covered in CCD, spanning from 8.019 (blue) to 26.045 (red). This latter finding suggests a potentially less comprehensive model compared to the CCD model. Additionally, the deviations observed from the diagonal line imply that this model is less precise in modeling the selected polymeric system with a higher potential for residual error, making it less robust in comparison to CCD.
Residual versus run plots for both designs are displayed in Figure 2. The term residuals [23] usually refers to the difference between the actual observed response value and the value predicted by the model (it can be considered as the error magnitude), whereas the term run is the order in which the data points were collected or the experiment was conducted.
The purpose of residuals versus run plots is to check for patterns or trends in the residuals overtime or in the experiment order, helping to visually identify potential issues. They also assess whether the model assumptions, such as independence and constant variance of residuals, are met.
As shown in Figure 2A,B, graphs of both CCD and DOD exhibit a similar range of residuals (from −1.5 to 1.5). Furthermore, both models provide a good fit for the data, where the residuals are randomly distributed around the zero line without any clear upward or downward trend. This random scatter suggests that both models capture the main variations in the data, and any remaining deviations are likely due to random noise. Accordingly, we can assume that both models meet the assumptions of constant variance and independence, most likely capturing the main trends in the data.
Figure 3 illustrates Box–Cox plots of both designs. A Box–Cox plot [24] is a graphical tool used to determine the optimal power transformation for a variable, in order to improve the fit of a statistical model. This is achieved by determining the value of lambda (λ) that will minimize the sum of squared residuals (SSR) [24].
Figure 3A displays the relationship between lambda values (λ) and SSR in CCD. The U-shape of the curve indicates that there is likely a power transformation that can improve the model fit [25]. The lowest point of the curve, which corresponds to the minimum SSR, occurs at a lambda value of 1.2, suggesting that this is the optimal value for power transformation. The vertical pink lines on the plot represent the confidence interval for the best lambda value, which ranges approximately from 1.02 to 1.38. Based on this analysis, the plot recommends applying a slight power transformation, which involves raising the data to the power of 1.2. This transformation is expected to enhance the model’s fit and improve its overall performance. Indeed, applying the recommended power transformation with lambda = 1.2 has led to improved model fit (lower SSR), more accurate predictions and better adherence to model assumptions (e.g., normality of residuals) [26]. The values of R-squared, adjusted R-squared, predicted R-squared and adequate precision improved to 0.9977, 0.9960, 0.9846 and 97.833, respectively.
Figure 3B, representing the Box–Cox plot of DOD, also exhibits a U-shaped curve, with a minimum SSR occurring at a lambda value of 1.72. The confidence interval for the optimal lambda value spans approximately from 0.57 to 2.69. Notably, the value of lambda = 1, corresponding to no need for transformation, falls within this confidence interval. In other words, the plot recommends no transformation to achieve an optimal model fit, suggesting that the current model with the original variable already provides a reasonable fit.
Contour plots, such as that depicted in Figure 4, employ a spectrum of colors to visually differentiate areas within a plot. Each colored area represents a region with a varying level of the response variable, PS. The changes in color intensity directly correlate with how the combination of input factors (A: X1 and B: X2) influences the response. This visualization is particularly useful and finds numerous practical applications, such as allowing a quick identification of CPP combinations that will produce a desired response or defining a design space where the process remains robust.
Three-dimensional surface plots (Figure 5) offer a three-dimensional visualization of how the response changes according to variations in the input factors, similar to the information conveyed by contour plots. In these plots, peak responses are typically represented by warmer colors (like red), while lower responses are often depicted using cooler colors (like blue). For example, Figure 5B reveals that the maximum particle size (red region) is observed at coded factor levels of (1, 0, −1) for X1, X2, and X3, respectively.
Table 5 demonstrates the results of the relative percentage error for both designs. Interestingly, the calculated relative error values for both DoE models were lower than that obtained for the original full-factorial design (16.67%) despite the inclusion of a central-point outlier in the investigated smart designs. These results confirm the success of both designs in modeling the prepared polymeric microparticles with high accuracy and predictability.
It is worth mentioning that the higher value of percentage relative error that was recorded for the CCD can be attributed to its higher sensitivity to the central points, as it is a main component of its structure compared to DOD. This design usually depends on central and axial points in order to estimate the quadratic effects which make it more sensitive to the induction of an outlier at one of these positions [27]. Moreover, nearly perfect R-values, similar to those encountered in the CCD results, are usually associated with the problem of over-fitting, which usually distorts the prediction power of real experiments of the corresponding generated model [28].
To sum up, our study provides a comprehensive comparison between CCD and DOD in optimizing polymer-based DDSs, where our findings demonstrate a clear distinction in their performance metrics and utility [29]. Both designs demonstrated statistical significance (p-value < 0.05), confirming their validity in modeling the system. However, CCD outperforms DOD across all the critical internal validating metrics (computed through the software algorithm according to the utilized runs only and without external experimental validation), making it the more robust and effective approach.
The R-squared value, which measures the proportion of variability explained by the model, is substantially higher for CCD (0.9977) compared to DOD (0.8792). This indicates that CCD provides a near-complete explanation of the response variability. Adjusted R-squared values of 0.9960 for CCD versus 0.8435 for DOD further emphasize the first model’s robustness and suggest its ability to maintain accuracy even after elimination of insignificant terms. Predicted R-squared values, measuring the model’s ability to predict unseen data, also heavily favor CCD (0.9846) over DOD (0.7858). These findings align with previous research that highlights CCD’s superior capacity for capturing non-linear and interactive effects, especially in pharmaceutical applications where complex interactions among formulation variables are prevalent.
Additionally, CCD demonstrates a significantly higher adequate precision (97.833 vs. 19.072 for DOD), a measure of signal-to-noise ratio, which confirms its ability to detect meaningful patterns amidst variability. The equations derived from both models reflect this difference: CCD’s equation incorporates linear, interaction, and quadratic terms, allowing for a detailed understanding of the relationships between factors (e.g., polymer concentration, nanoparticle amount, and stirring speed) and responses (e.g., PS). In contrast, DOD primarily includes linear and interaction terms, limiting its capacity to capture the intricate relationships that are often critical in DDS optimization.
Furthermore, CCD’s superiority was visualized in diagnostic plots. The “Predicted vs. Actual” plot for CCD shows near-perfect alignment of points with the diagonal line, indicating a robust model with a better fit and minimal error in predicting outcomes. Similarly, residuals were randomly distributed around the “zero” in the “Residual vs. Run” plot, suggesting that the CCD model effectively captures the trends in the data without systematic bias. Research on response surface methodologies corroborates the importance of such diagnostics in validating model accuracy and precision [30].
Overall, CCD’s performance across statistical metrics and diagnostic tests reflects its ability to model complex systems, rendering it the preferred choice for optimizing CQAs for polymer-based DDSs. DOD, though not as precise in modeling the experimental runs [31] yet, offered a statistically significant and resource-efficient model [32]. When comparing the experimental predictive power of both designs (via external validation through a real experiment), DOD demonstrated a higher predictive ability (scoring lower percentage relative error) as compared to CCD. This may be attributed to its computer-based algorithm that can cover the experimental space precisely by selecting the points from an information matrix that maximizes the determinant of the information matrix. Stretching the experimental space through the additional axial points in case of CCD may lead to prediction distortion [29]. These findings are supported by studies that emphasize the role of CCD in pharmaceutical research for its ability to balance precision, robustness, and comprehensiveness in experimental design [27].

4. Conclusions

The novelty of this manuscript lies in investigating two smart response-surface designs and comparing these models regarding accuracy and prediction power to recommend the optimum design that best models polymeric systems. Both Central Composite Design (CCD) and D-optimal Design (DOD) successfully modeled the experimental system, even after introducing a significant deviation in both designs by converting the central point into an outlier. The robustness of these models was evident in their ability to maintain statistical significance (p-value < 0.05) and provide meaningful insights into the relationships between variables and the response. However, CCD consistently outperformed DOD across multiple performance metrics. CCD exhibited superior R-squared, adjusted R-squared and predicted R-squared values compared to DOD, demonstrating its capability to capture complex interactions and maintain predictive accuracy despite experimental perturbations. Additionally, CCD’s higher adequate precision highlighted its ability to distinguish meaningful signals from noise, making it a more reliable choice in capturing the differences between different formulations.
The smart design methodologies used in this study, particularly CCD, provide significant benefits. By incorporating center points and axial points, CCD allowed for an in-depth exploration of quadratic and interaction effects, enabling the identification of optimal process conditions. In contrast, DOD, while more predictive and resource-efficient, was less effective in capturing the system’s complexity and hence the differences between the different formulations, as revealed by the lower adequate precision of the DOD-generated model. Both designs minimized resources’ consumption by reducing the number of experimental runs as compared to the original full-factorial design, while ensuring comprehensive exploration of critical factors and maximizing information extraction, aligning with the principles of efficiency and sustainability. The reduced consumption of materials, energy and resources is considered an environment-saving approach conforming to the global SDGs, especially goal number 12: responsible consumption and production. Our findings in this research work underscore the critical role of smart experimental designs in advancing robust, reproducible, and cost-effective pharmaceutical industry.

Author Contributions

Conceptualization, R.M.H.; methodology, M.M.A., S.S.I. and R.M.H.; software, M.M.A., S.S.I. and R.M.H.; validation, M.M.A., S.S.I. and R.M.H.; formal analysis, M.M.A., S.S.I. and R.M.H.; investigation, M.M.A., S.S.I. and R.M.H.; data curation, M.M.A., S.S.I. and R.M.H.; writing—original draft preparation, M.M.A., S.S.I. and R.M.H.; writing—review and editing, S.S.I. and R.M.H.; visualization, S.S.I. and R.M.H.; supervision, R.M.H.; project administration, R.M.H. All authors have read and agreed to the published version of the manuscript.

Funding

This research received no external funding.

Data Availability Statement

Data would be available upon request.

Conflicts of Interest

The authors declare no conflict of interest.

References

  1. Hathout, R.M.; Metwally, A.A.; El-Ahmady, S.H.; Metwally, E.S.; Ghonim, N.A.; Bayoumy, S.A.; Erfan, T.; Ashraf, R.; Fadel, M.; El-Kholy, A.I.; et al. Dual stimuli-responsive polypyrrole nanoparticles for anticancer therapy. J. Drug Deliv. Sci. Technol. 2018, 47, 176–180. [Google Scholar] [CrossRef]
  2. Hathout, R.M.; Metwally, A.A.; Woodman, T.J.; Hardy, J.G. Prediction of Drug Loading in the Gelatin Matrix Using Computational Methods. ACS Omega 2020, 5, 1549–1556. [Google Scholar] [CrossRef]
  3. Vanaja, K.; Shobha Rani, R.H. Design of Experiments: Concept and Applications of Plackett Burman Design. Clin. Res. Regul. Aff. 2007, 24, 1–23. [Google Scholar] [CrossRef]
  4. Gabr, S.; Nikles, S.; Pferschy Wenzig, E.M.; Ardjomand-Woelkart, K.; Hathout, R.M.; El-Ahmady, S.; Motaal, A.A.; Singab, A.; Bauer, R. Characterization and optimization of phenolics extracts from Acacia species in relevance to their anti-inflammatory activity. Biochem. Syst. Ecol. 2018, 78, 21–30. [Google Scholar] [CrossRef]
  5. Danhier, F.; Ansorena, E.; Silva, J.M.; Coco, R.; Le Breton, A.; Préat, V. PLGA-based nanoparticles: An overview of biomedical applications. J. Control. Release 2012, 161, 505–522. [Google Scholar] [CrossRef] [PubMed]
  6. Jankovic, A.; Chaudhary, G.; Goia, F. Designing the design of experiments (DOE)—An investigation on the influence of different factorial designs on the characterization of complex systems. Energy Build. 2021, 250, 111298. [Google Scholar] [CrossRef]
  7. Beg, S.; Swain, S.; Rahman, M.; Hasnain, M.S.; Imam, S.S. Chapter 3—Application of Design of Experiments (DoE) in Pharmaceutical Product and Process Optimization. In Pharmaceutical Quality by Design; Beg, S., Hasnain, M.S., Eds.; Academic Press: Cambridge, MA, USA, 2019; pp. 43–64. [Google Scholar]
  8. Atkinson, A.C.; Donev, A.N.; Tobias, R.D. Optimum Experimental Designs, with SAS; Oxford University Press: Oxford, UK, 2007. [Google Scholar]
  9. Beg, S. Screening Experimental Designs and Their Applications in Pharmaceutical Development. In Design of Experiments for Pharmaceutical Product Development: Volume I: Basics and Fundamental Principles; Beg, S., Ed.; Springer: Singapore, 2021; pp. 15–26. [Google Scholar]
  10. Singh, R.; Lillard, J.W. Nanoparticle-based targeted drug delivery. Exp. Mol. Pathol. 2009, 86, 215–223. [Google Scholar] [CrossRef]
  11. Beg, S.; Rahman, Z. Central Composite Designs and Their Applications in Pharmaceutical Product Development. In Design of Experiments for Pharmaceutical Product Development: Volume I: Basics and Fundamental Principles; Beg, S., Ed.; Springer: Singapore, 2021; pp. 63–76. [Google Scholar]
  12. Mohamad Zen, N.I.; Abd Gani, S.S.; Shamsudin, R.; Fard Masoumi, H.R. The Use of D-Optimal Mixture Design in Optimizing Development of Okara Tablet Formulation as a Dietary Supplement. Sci. World J. 2015, 2015, 684319. [Google Scholar] [CrossRef]
  13. Nahata, T.; Saini, T.R. Formulation optimization of long-acting depot injection of aripiprazole by using D-optimal mixture design. PDA J. Pharm. Sci. Technol. 2009, 63, 113–122. [Google Scholar]
  14. Jana, S.; Manna, S.; Nayak, A.K.; Sen, K.K.; Basu, S.K. Carbopol gel containing chitosan-egg albumin nanoparticles for transdermal aceclofenac delivery. Colloids Surf. B Biointerfaces 2014, 114, 36–44. [Google Scholar] [CrossRef]
  15. Karim, S.; Akhter, M.H.; Burzangi, A.S.; Alkreathy, H.; Alharthy, B.; Kotta, S.; Md, S.; Rashid, M.A.; Afzal, O.; Altamimi, A.S.A.; et al. Phytosterol-Loaded Surface-Tailored Bioactive-Polymer Nanoparticles for Cancer Treatment: Optimization, In Vitro Cell Viability, Antioxidant Activity, and Stability Studies. Gels 2022, 8, 219. [Google Scholar] [CrossRef] [PubMed]
  16. Ma, Y.; Zhao, X.; Li, J.; Shen, Q. The comparison of different daidzein-PLGA nanoparticles in increasing its oral bioavailability. Int. J. Nanomed. 2012, 7, 559–570. [Google Scholar]
  17. Bhavsar, M.D.; Tiwari, S.B.; Amiji, M.M. Formulation optimization for the nanoparticles-in-microsphere hybrid oral delivery system using factorial design. J. Control. Release 2006, 110, 422–430. [Google Scholar] [CrossRef]
  18. Khanvilkar, K.H.; Huang, Y.; Moore, A.D. Influence of Hydroxypropyl Methylcellulose Mixture, Apparent Viscosity, and Tablet Hardness on Drug Release Using a 23 Full Factorial Design. Drug Dev. Ind. Pharm. 2002, 28, 601–608. [Google Scholar] [CrossRef] [PubMed]
  19. Badawi, M.A.; El-Khordagui, L.K. A quality by design approach to optimization of emulsions for electrospinning using factorial and D-optimal designs. Eur. J. Pharm. Sci. 2014, 58, 44–54. [Google Scholar] [CrossRef]
  20. Nematallah, K.A.; Ayoub, N.A.; Abdelsattar, E.; Meselhy, M.R.; Elmazar, M.M.; El-Khatib, A.H.; Linscheid, M.W.; Hathout, R.M.; Godugu, K.; Adel, A.; et al. Polyphenols LC-MS2 profile of Ajwa date fruit (Phoenix dactylifera L.) and their microemulsion: Potential impact on hepatic fibrosis. J. Funct. Foods 2018, 49, 401–411. [Google Scholar] [CrossRef]
  21. Kollipara, S.; Bende, G.; Movva, S.; Saha, R. Application of rotatable central composite design in the preparation and optimization of poly(lactic-co-glycolic acid) nanoparticles for controlled delivery of paclitaxel. Drug Dev. Ind. Pharm. 2010, 36, 1377–1387. [Google Scholar] [CrossRef]
  22. Hooda, A.; Nanda, A.; Jain, M.; Kumar, V.; Rathee, P. Optimization and evaluation of gastroretentive ranitidine HCl microspheres by using design expert software. Int. J. Biol. Macromol. 2012, 51, 691–700. [Google Scholar] [CrossRef]
  23. Box, G.E.P.; Wilson, K.B. On the Experimental Attainment of Optimum Conditions. In Breakthroughs in Statistics: Methodology and Distribution; Springer: New York, NY, USA, 1992; pp. 270–310. [Google Scholar]
  24. Sakia, R.M. The Box-Cox Transformation Technique: A Review. J. R. Stat. Soc. Ser. D 1992, 41, 169–178. [Google Scholar] [CrossRef]
  25. Box, G.E.P.; Cox, D.R. An Analysis of Transformations. J. R. Stat. Soc. Ser. B Methodol. 1964, 26, 211–243. [Google Scholar] [CrossRef]
  26. Yeo, I.; Johnson, R.A. A new family of power transformations to improve normality or symmetry. Biometrika 2000, 87, 954–959. [Google Scholar] [CrossRef]
  27. Bhattacharya, S. Central Composite Design for Response Surface Methodology and Its Application in Pharmacy. In Response Surface Methodology in Engineering Science; Kayaroganam, P., Ed.; IntechOpen: Rijeka, Croatia, 2021. [Google Scholar]
  28. Elsayed, T.; Hathout, R.M. Evaluating the prediction power and accuracy of two smart response surface experimental designs after revisiting repaglinide floating tablets. Future J. Pharm. Sci. 2024, 10, 34. [Google Scholar] [CrossRef]
  29. Dean, A.; Voss, D.; Draguljic, D. Response Surface Methodology. In Design and Analysis of Experiments; Dean, A., Voss, D., Dragulji-ç, D., Eds.; Springer International Publishing: Cham, Switzerland, 2017; pp. 565–614. [Google Scholar]
  30. Ojha, S.K.; Singh, P.K.; Mishra, S.; Pattnaik, R.; Dixit, S.; Verma, S.K. Response surface methodology based optimization and scale-up production of amylase from a novel bacterial strain, Bacillus aryabhattai KIIT BE-1. Biotechnol. Rep. 2020, 27, e00506. [Google Scholar] [CrossRef] [PubMed]
  31. Jones, B.; Allen, M.; Goos, P. A-optimal versus D-optimal design of screening experiments. J. Qual. Technol. 2021, 53, 369–382. [Google Scholar] [CrossRef]
  32. Namdar, A.; Borhanzadeh, T.; Salahinejad, E. A new evidence-based design-of-experiments approach for optimizing drug delivery systems with exemplification by emulsion-derived Vancomycin-loaded PLGA capsules. Sci. Rep. 2024, 14, 31164. [Google Scholar] [CrossRef]
Figure 1. Predicted vs. actual for (A) central composite and (B) D-optimal designs. The change from blue to red color indicates an increase in the value of the response.
Chemengineering 09 00060 g001
Figure 2. Residuals versus run for (A) Central Composite and (B) D-optimal designs. The change from blue to red color indicates an increase in the value of the response.
Chemengineering 09 00060 g002
Figure 3. Box–Cox plots for (A) central composite and (B) D-optimal designs. The red lines indicate the confidence interval borders for lambda (power of the response), the green line indicates the best lambda and the blue line indicates the current lambda of the model.
Chemengineering 09 00060 g003
Figure 4. Contour plots for (A) central composite and (B) D-optimal designs. The change from blue to red color indicates an increase in the value of the response.
Chemengineering 09 00060 g004
Figure 5. Three-dimensional surface plots for (A) central composite and (B) D-optimal designs. The change from blue to red color indicates an increase in the value of the response.
Chemengineering 09 00060 g005
Table 1. Investigated critical processing parameters (CPPs) (material and formulation parameters) and their tested ranges.
CPPRange of Values
Low (−1)Medium (0)High (+1)
Polymer concentration
(X1, % w/v)
1510
Nanoparticle amount (X2, mg)103060
Stirring speed
(X3, rpm)
500070009000
Table 2. The central composite design points.
The Central Composite Generated Design
Experiment NumberPolymer Concentration (X1, % w/v)Nanoparticle Amount
(X2, mg)
Stirring Speed (X3, rpm)PS
(µm)
100017
21−1−130.569
30−1.68179019.89896
401.681793017.71935
511112.839
6001.6817938.339654
700017
811−126.485
900017
10−11−112.353
1100017
12−11111.235
131−1114.827
14−1.68179005.299243
1500017
16−1−1−114.681
171.6817930021.45791
18−1−118.019
1900017
2000−1.6817923.96687
Table 3. The D-optimal design points.
The D-Optimal Generated Design
Experiment NumberPolymer Concentration (X1, % w/v)Nanoparticle Amount
(X2, mg)
Stirring Speed (X3, rpm)PS
(µm)
100017
2−11−112.353
300017
40.5−0.5015.4935
500017
60018.686
710−126.045
8−11111.235
9−1−118.019
100.3333331−121.27477778
110−1−122.063
1200017
1311112.839
141−1114.827
15−1−0.33333−0.333338.722555556
1601013.623
1700017
Table 4. Analysis results of generated models.
Design TypeCentral CompositeD-Optimal
SignificanceSignificantSignificant
p-value < 0.05p-value < 0.05
Model TypeQuadraticQuadratic
R-squared0.99640.8792
Adjusted R-squared0.99380.8435
Predicted R-squared0.97900.7858
Adequate precision78.74819.072
Equation GeneratedPS =
     +16.79937
     +4.80400 × X1
     −0.648000 × X2
     −4.646000 × X3
     −0.87000 × X1 × X2
     −2.70100 × X1 × X3
     +0.95500 × X2 × X3
     −1.19056 × X12
     +0.72944 × X22
PS =
     +15.51814
     +4.72381 × X1
     −4.26030 × X3
     −2.54981 × X1 × X3
Table 5. Values procured for the checkpoint X1 = 2.5% w/v of polymer, X2 = 20 mg of nanoparticles as internal phase and X3 = 6000 rpm as speed of homogenization.
DesignRelative Error (%)
Central Composite Design11.77
D-optimal Design0.68
Disclaimer/Publisher’s Note: The statements, opinions and data contained in all publications are solely those of the individual author(s) and contributor(s) and not of MDPI and/or the editor(s). MDPI and/or the editor(s) disclaim responsibility for any injury to people or property resulting from any ideas, methods, instructions or products referred to in the content.

