
Mechanisms and Optimization of Foam Flooding in Heterogeneous Thick Oil Reservoirs: Insights from Large-Scale 2D Sandpack Experiments

 ,
,
Abstract
1. Introduction
- (1)
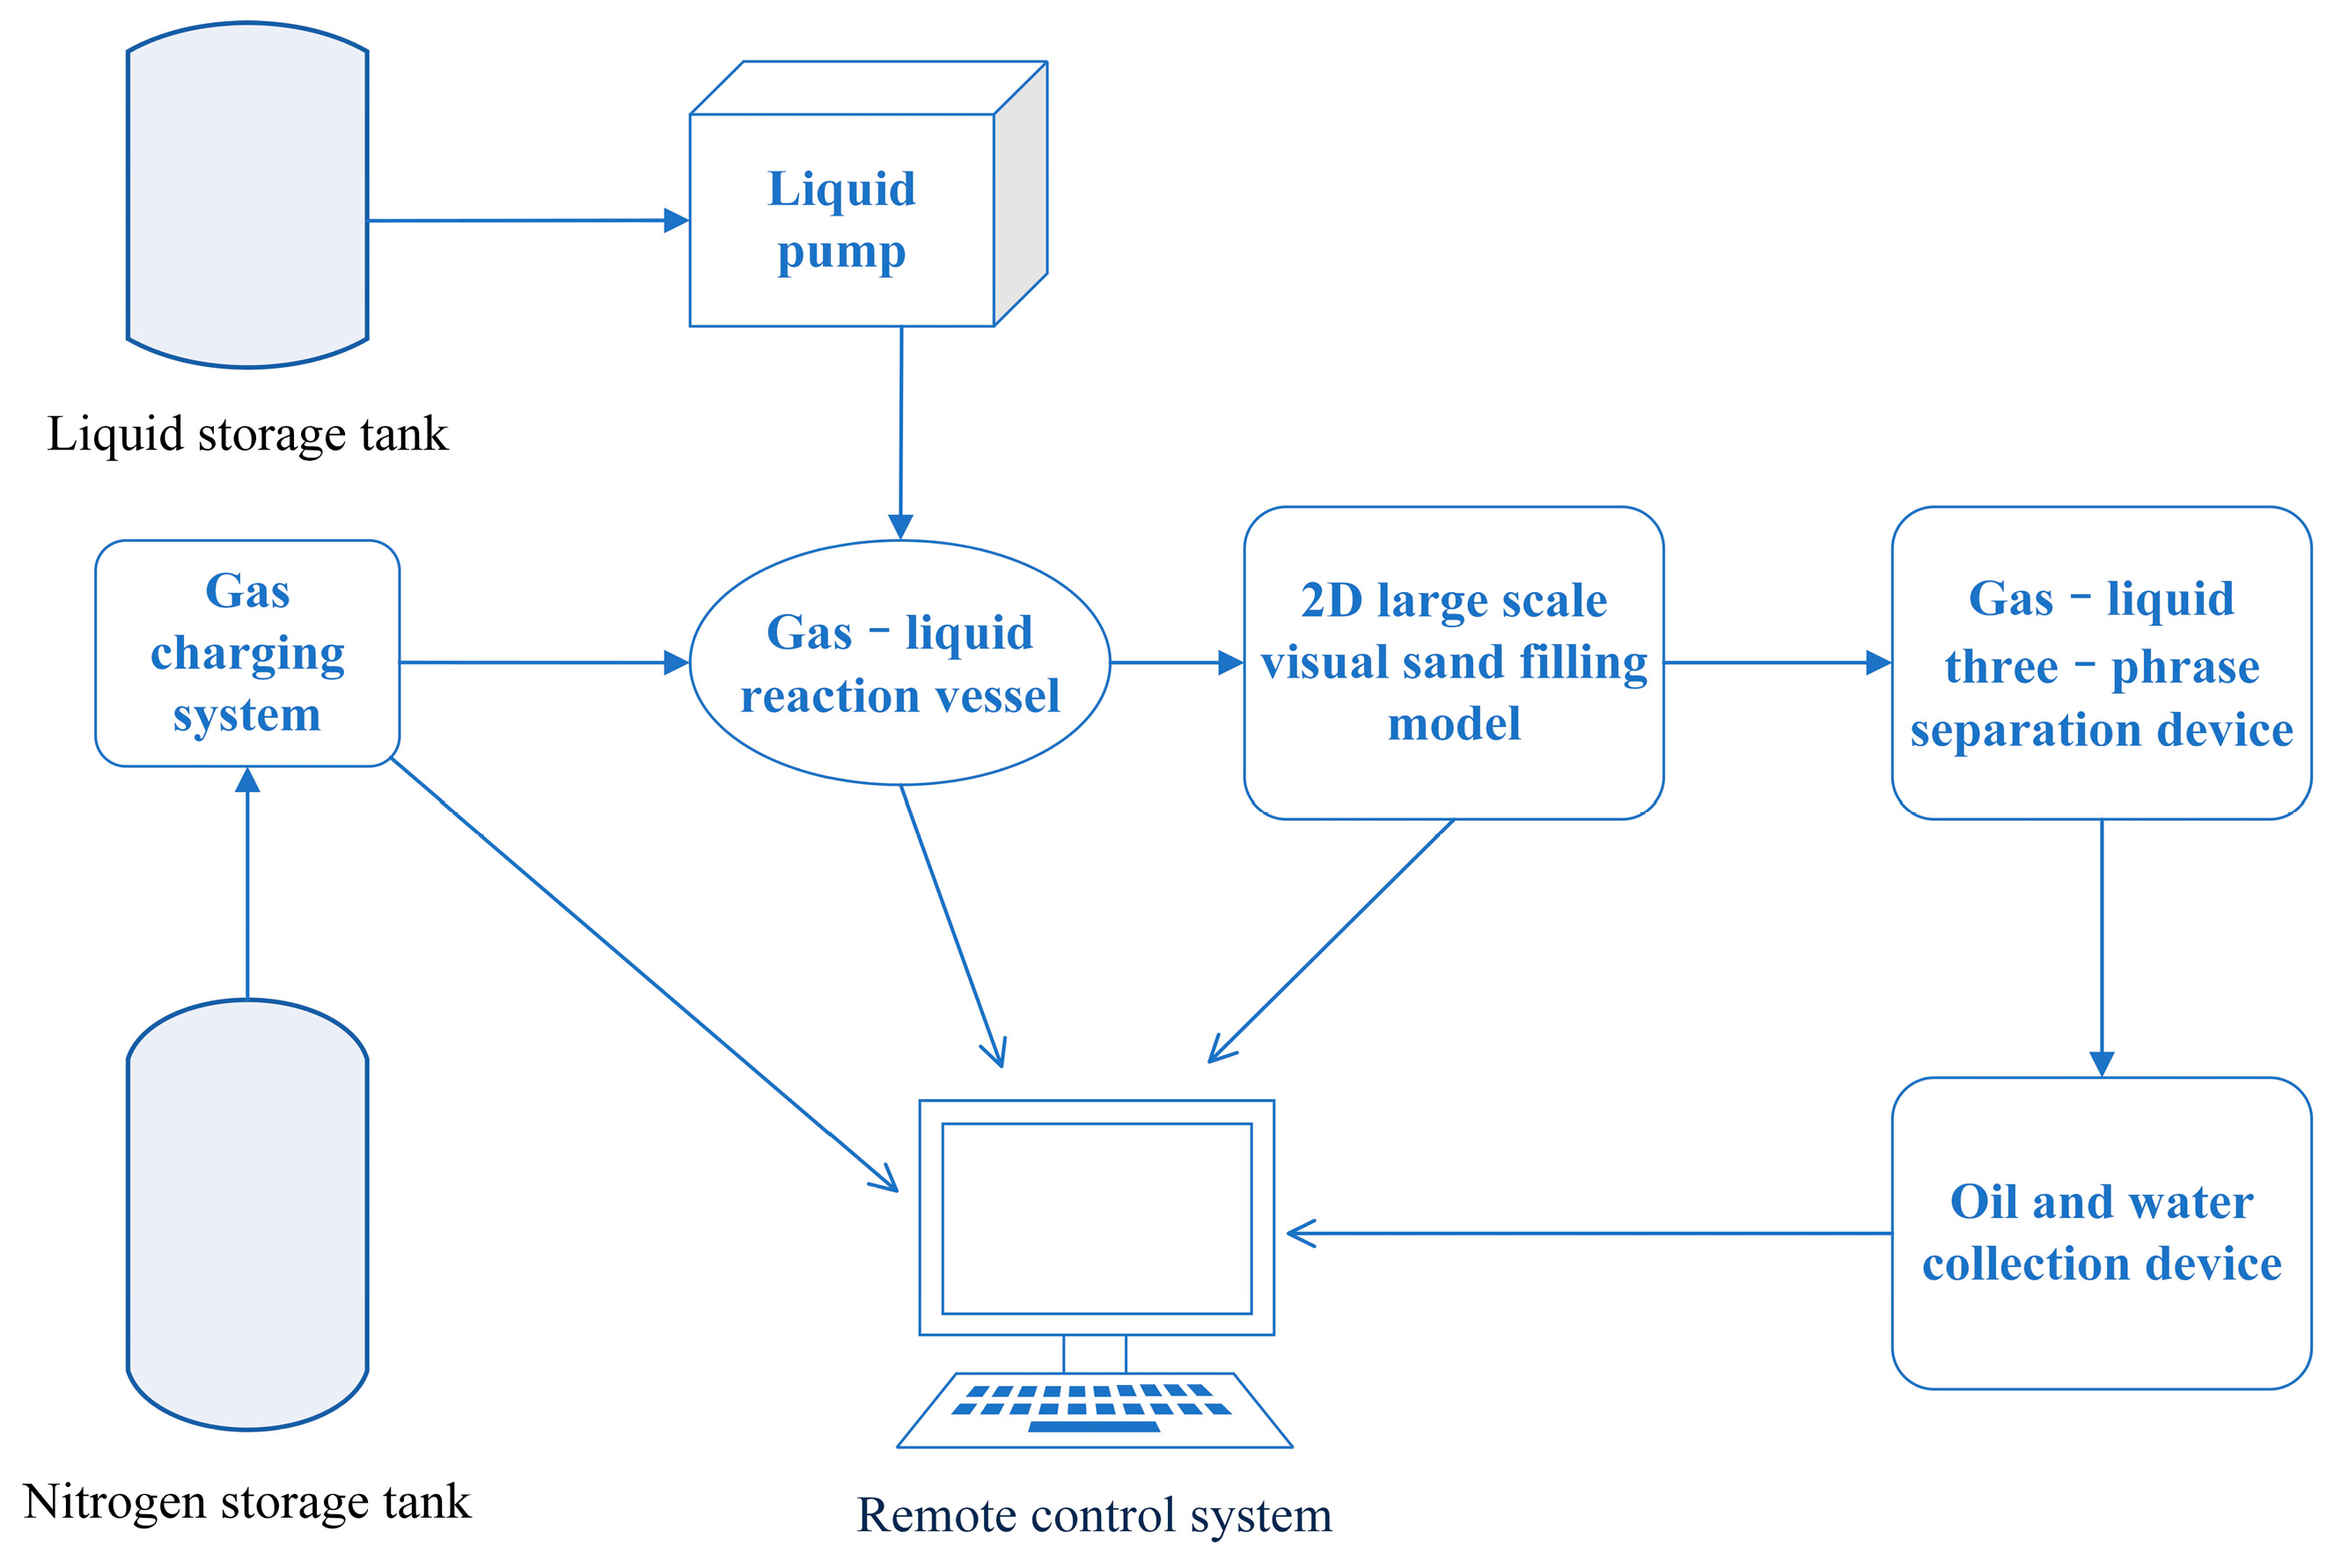
- A 2D large-scale sandpack model (5 m × 1 m × 0.04 m) integrating resistivity tomography and high-speed imaging, enabling visualization of foam flooding mechanisms in meter-scale heterogeneous systems.
- (2)
- (3)
- A cost-effective composite strategy combining high-concentration slugs (0.7% AOS), salt-resistant polymer-enhanced foaming, and multi-round profile control, suppressing gas channeling by 67%.
2. Experimental Method
2.1. Experimental System Design
2.2. Fluid Configuration and Displacement Scheme
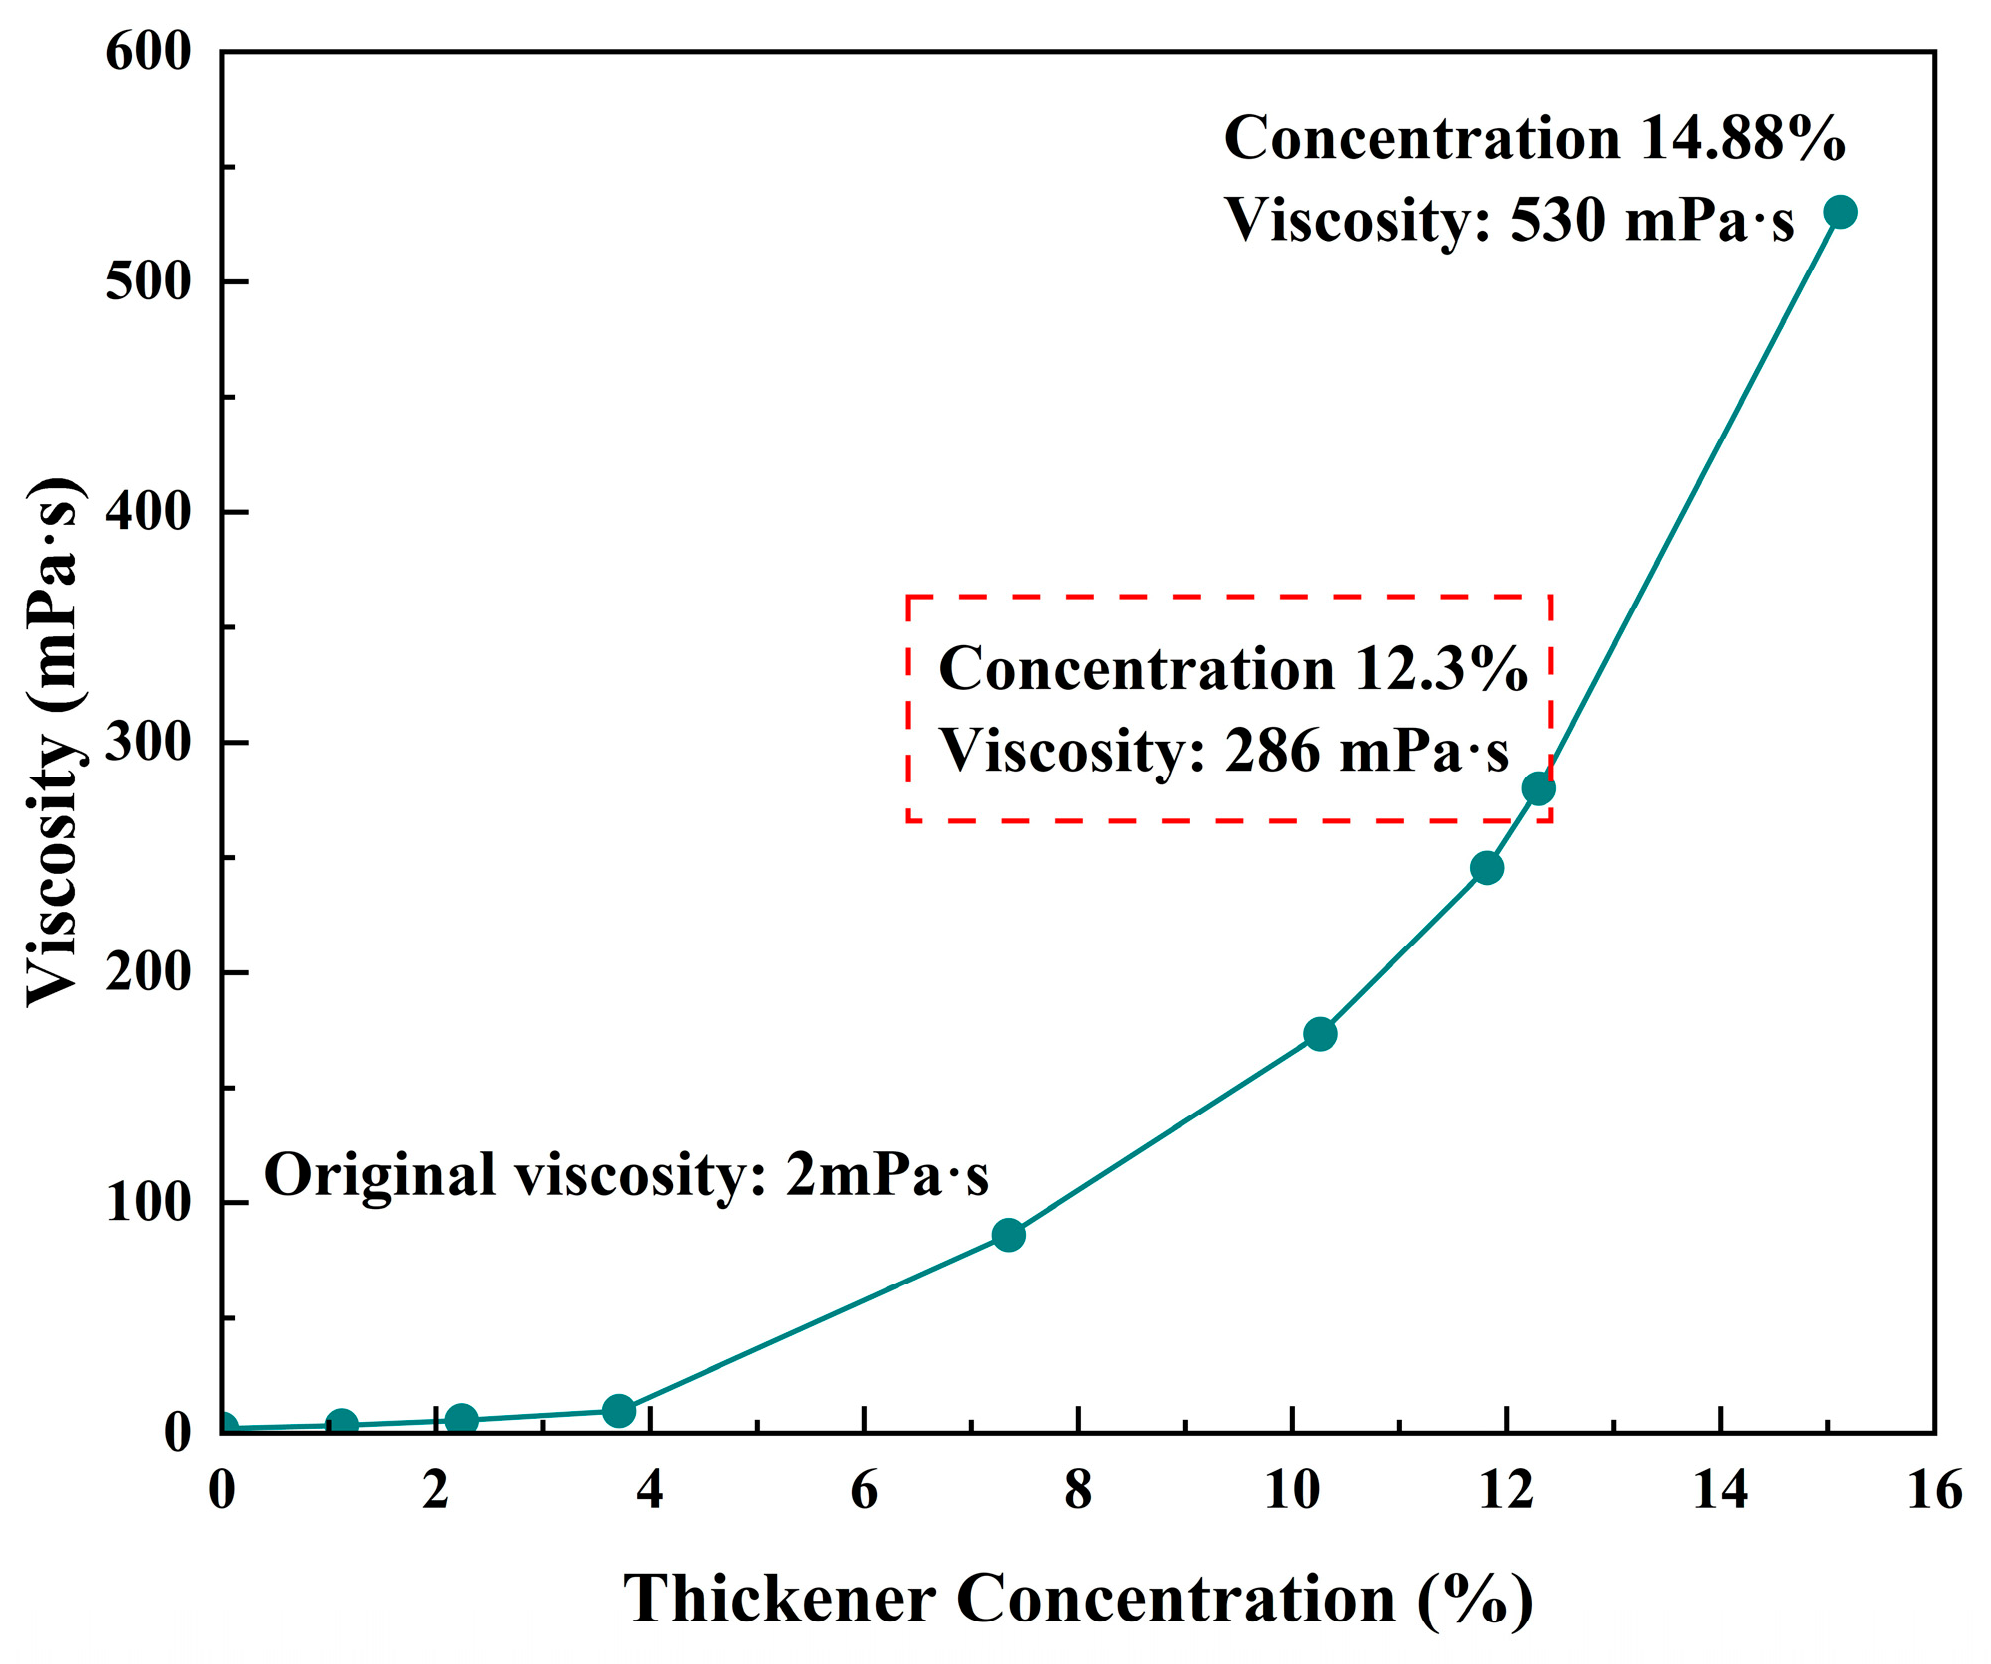
2.2.1. Simulated Fluid
2.2.2. Displacement Process
- (1)
- Model saturation
- (2)
- Experimental process
2.3. Data Acquisition and Analysis Methods
3. Results and Analysis
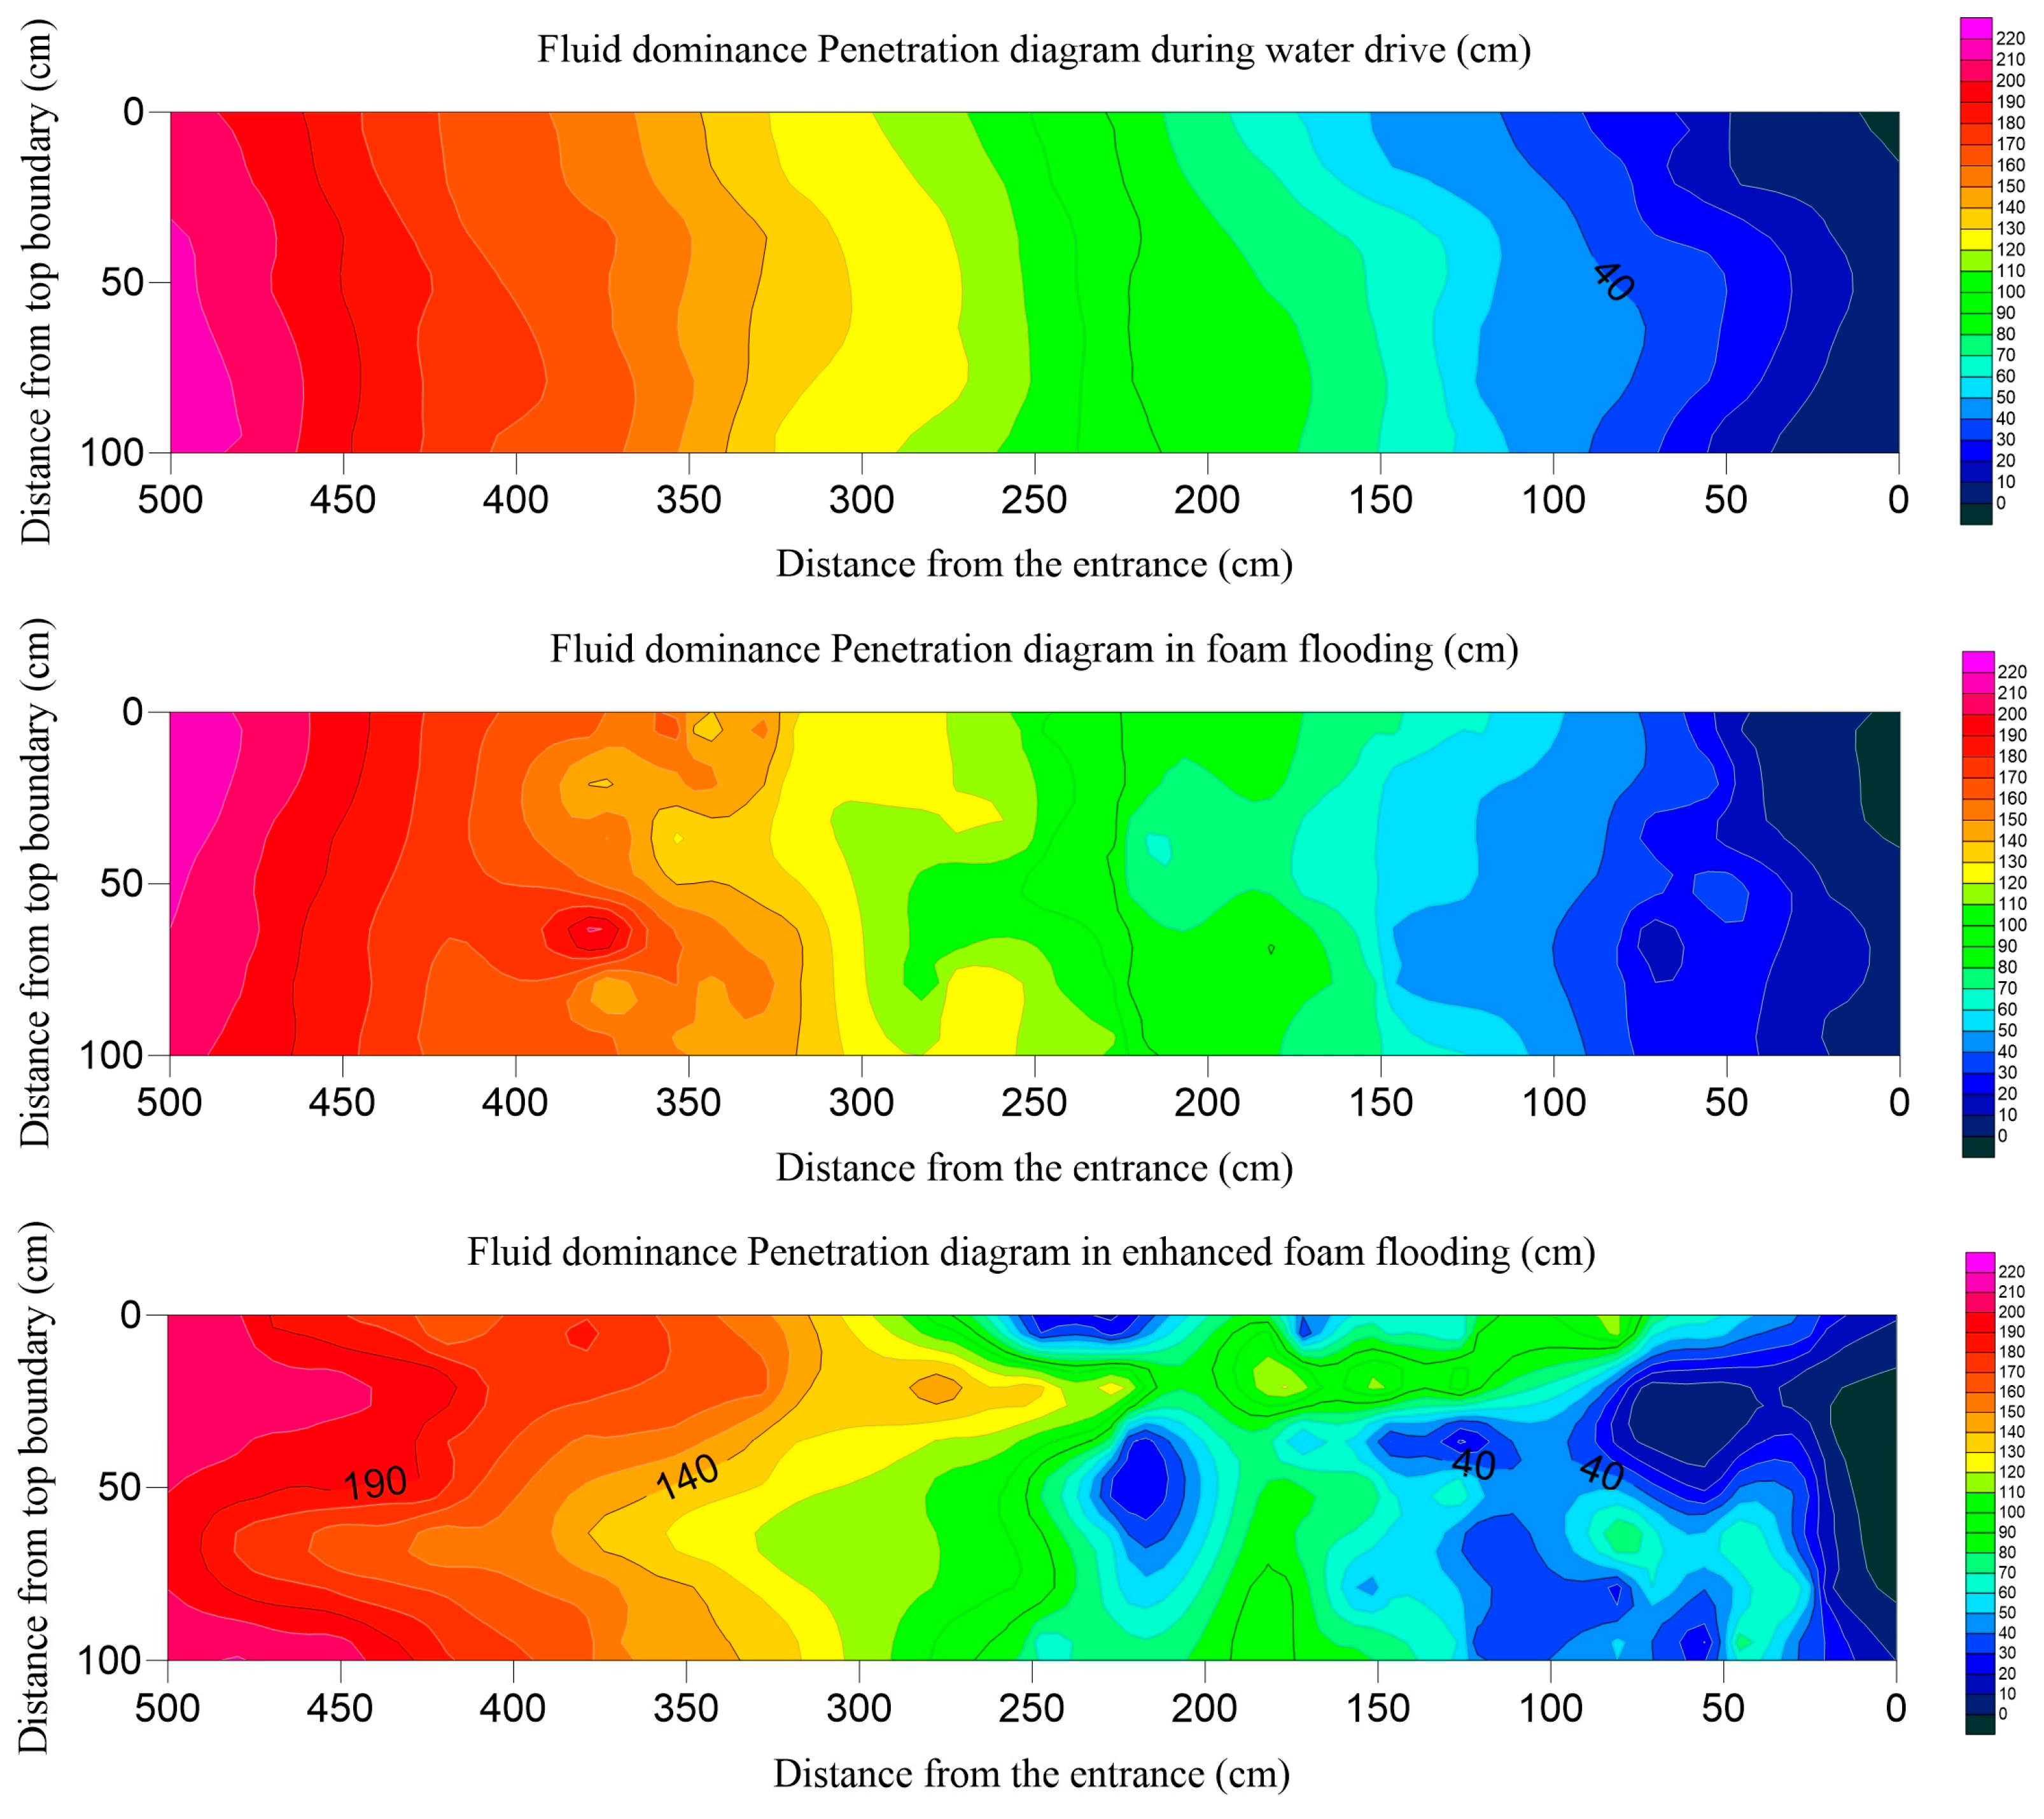
3.1. Discussion on the Law and Mechanism of Water Drive Development
3.2. Key Factors Influencing Foam Flooding Efficiency
3.2.1. Microscopic Mechanism
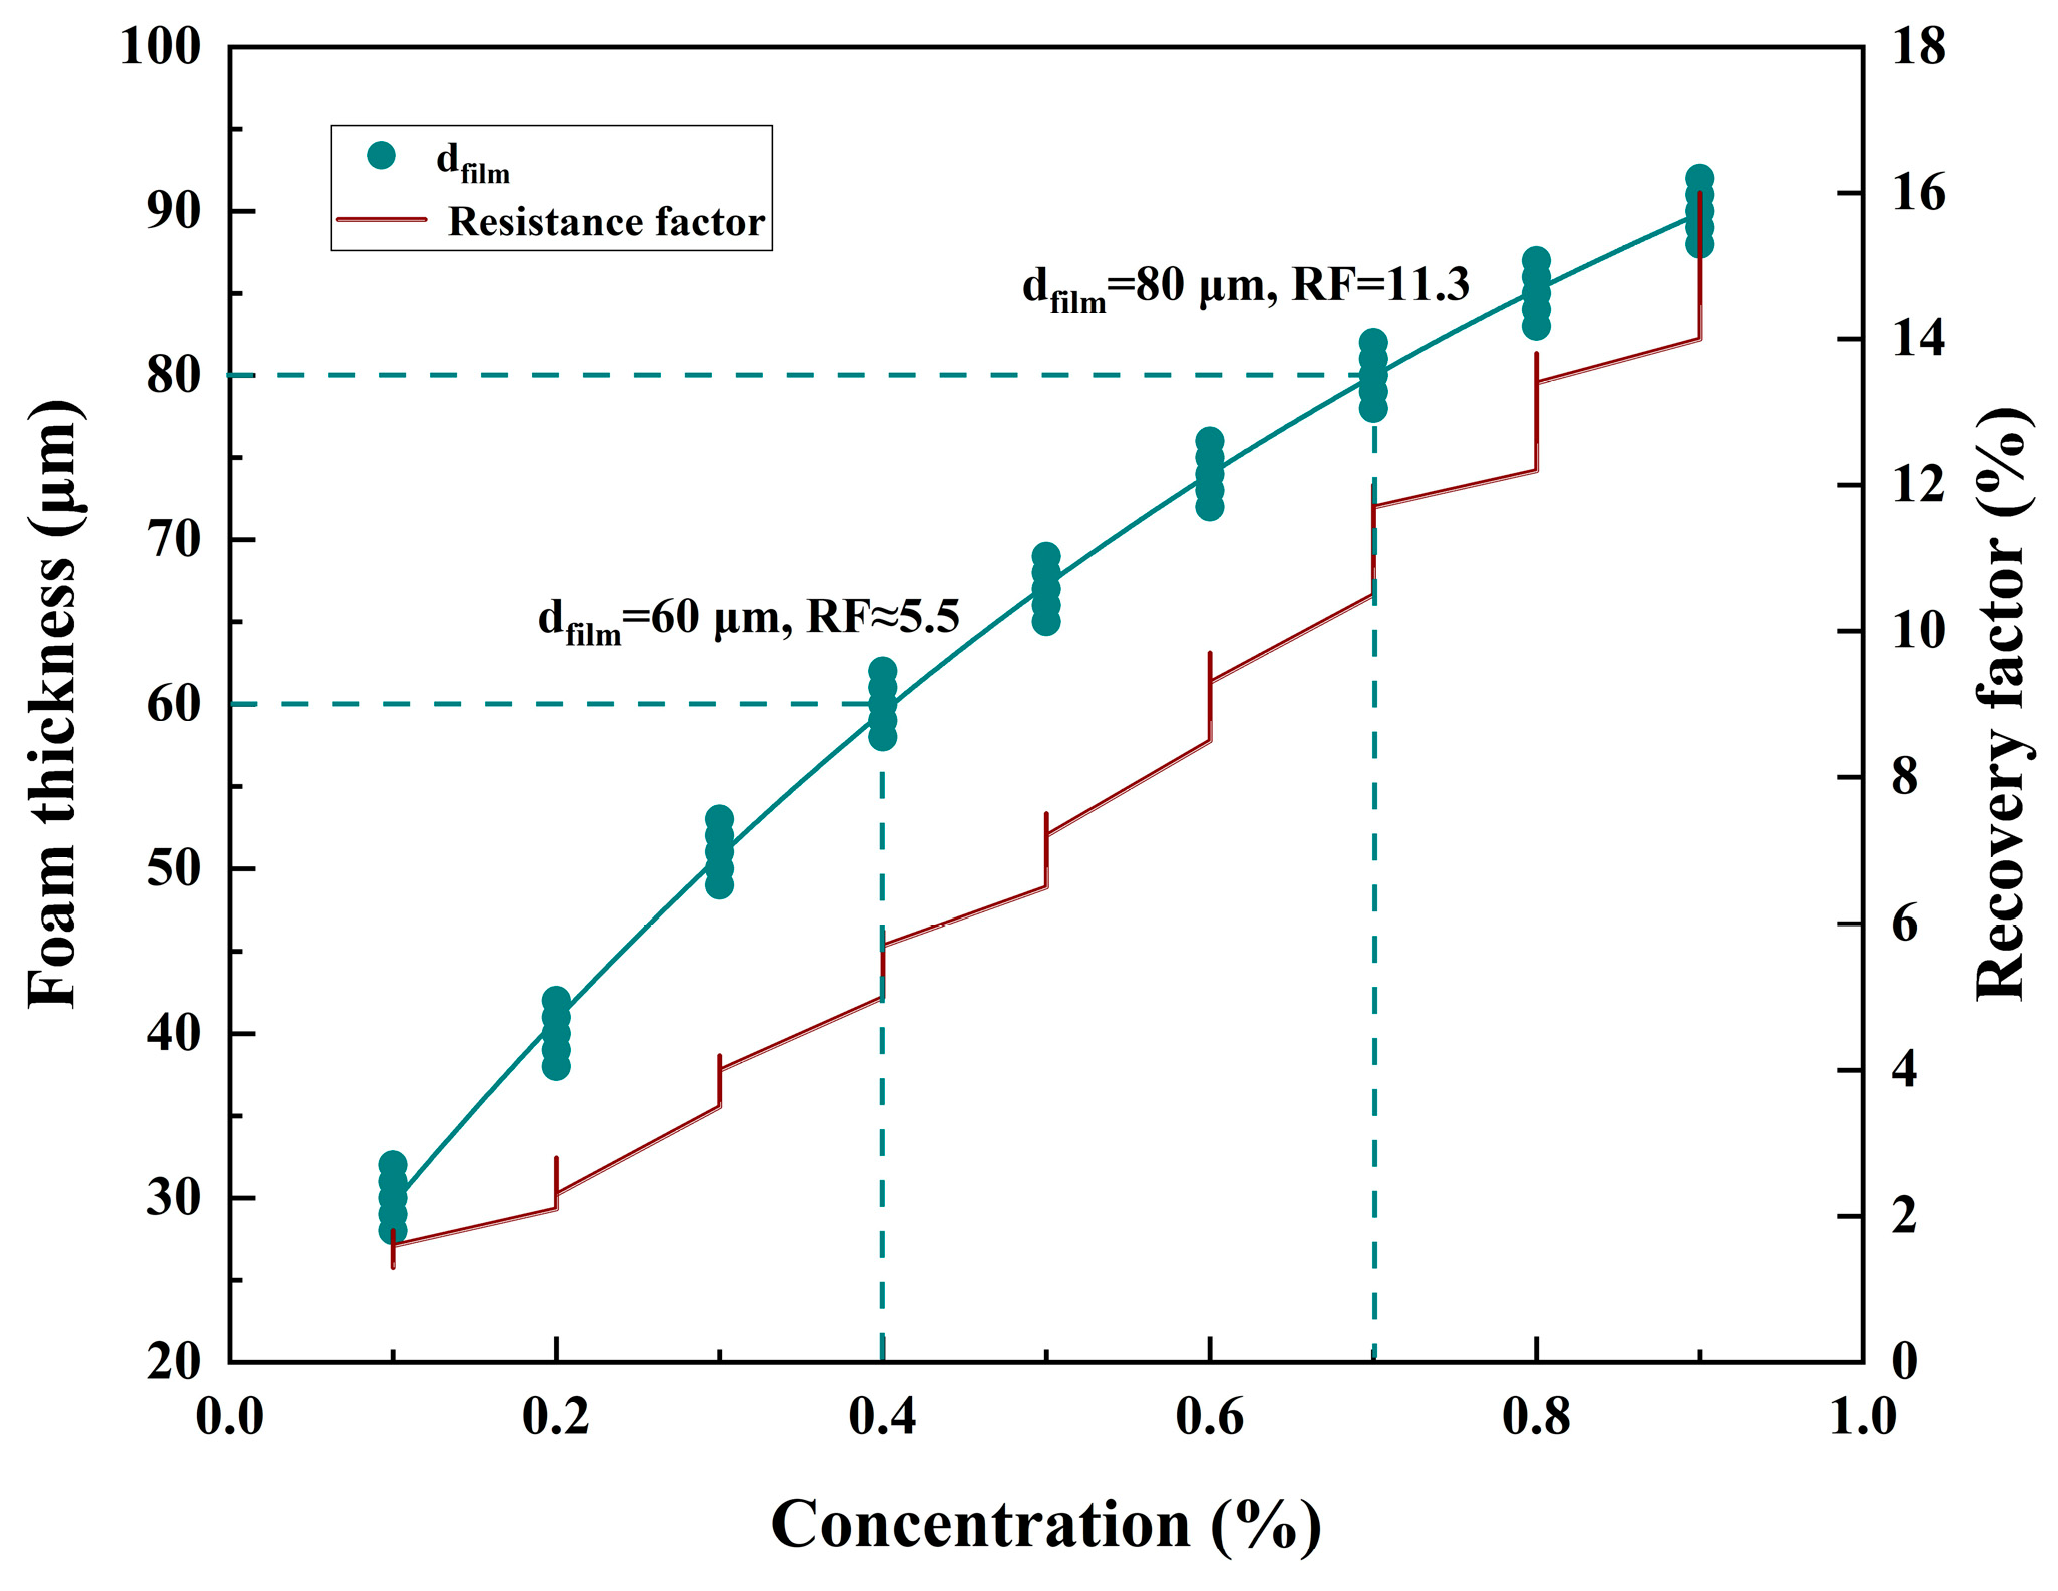
- Relationship between foam film thickness (dfilm) and foaming agent concentration (C)
- 2.
- Theoretical model: a modified Jamin effect equation
- 3.
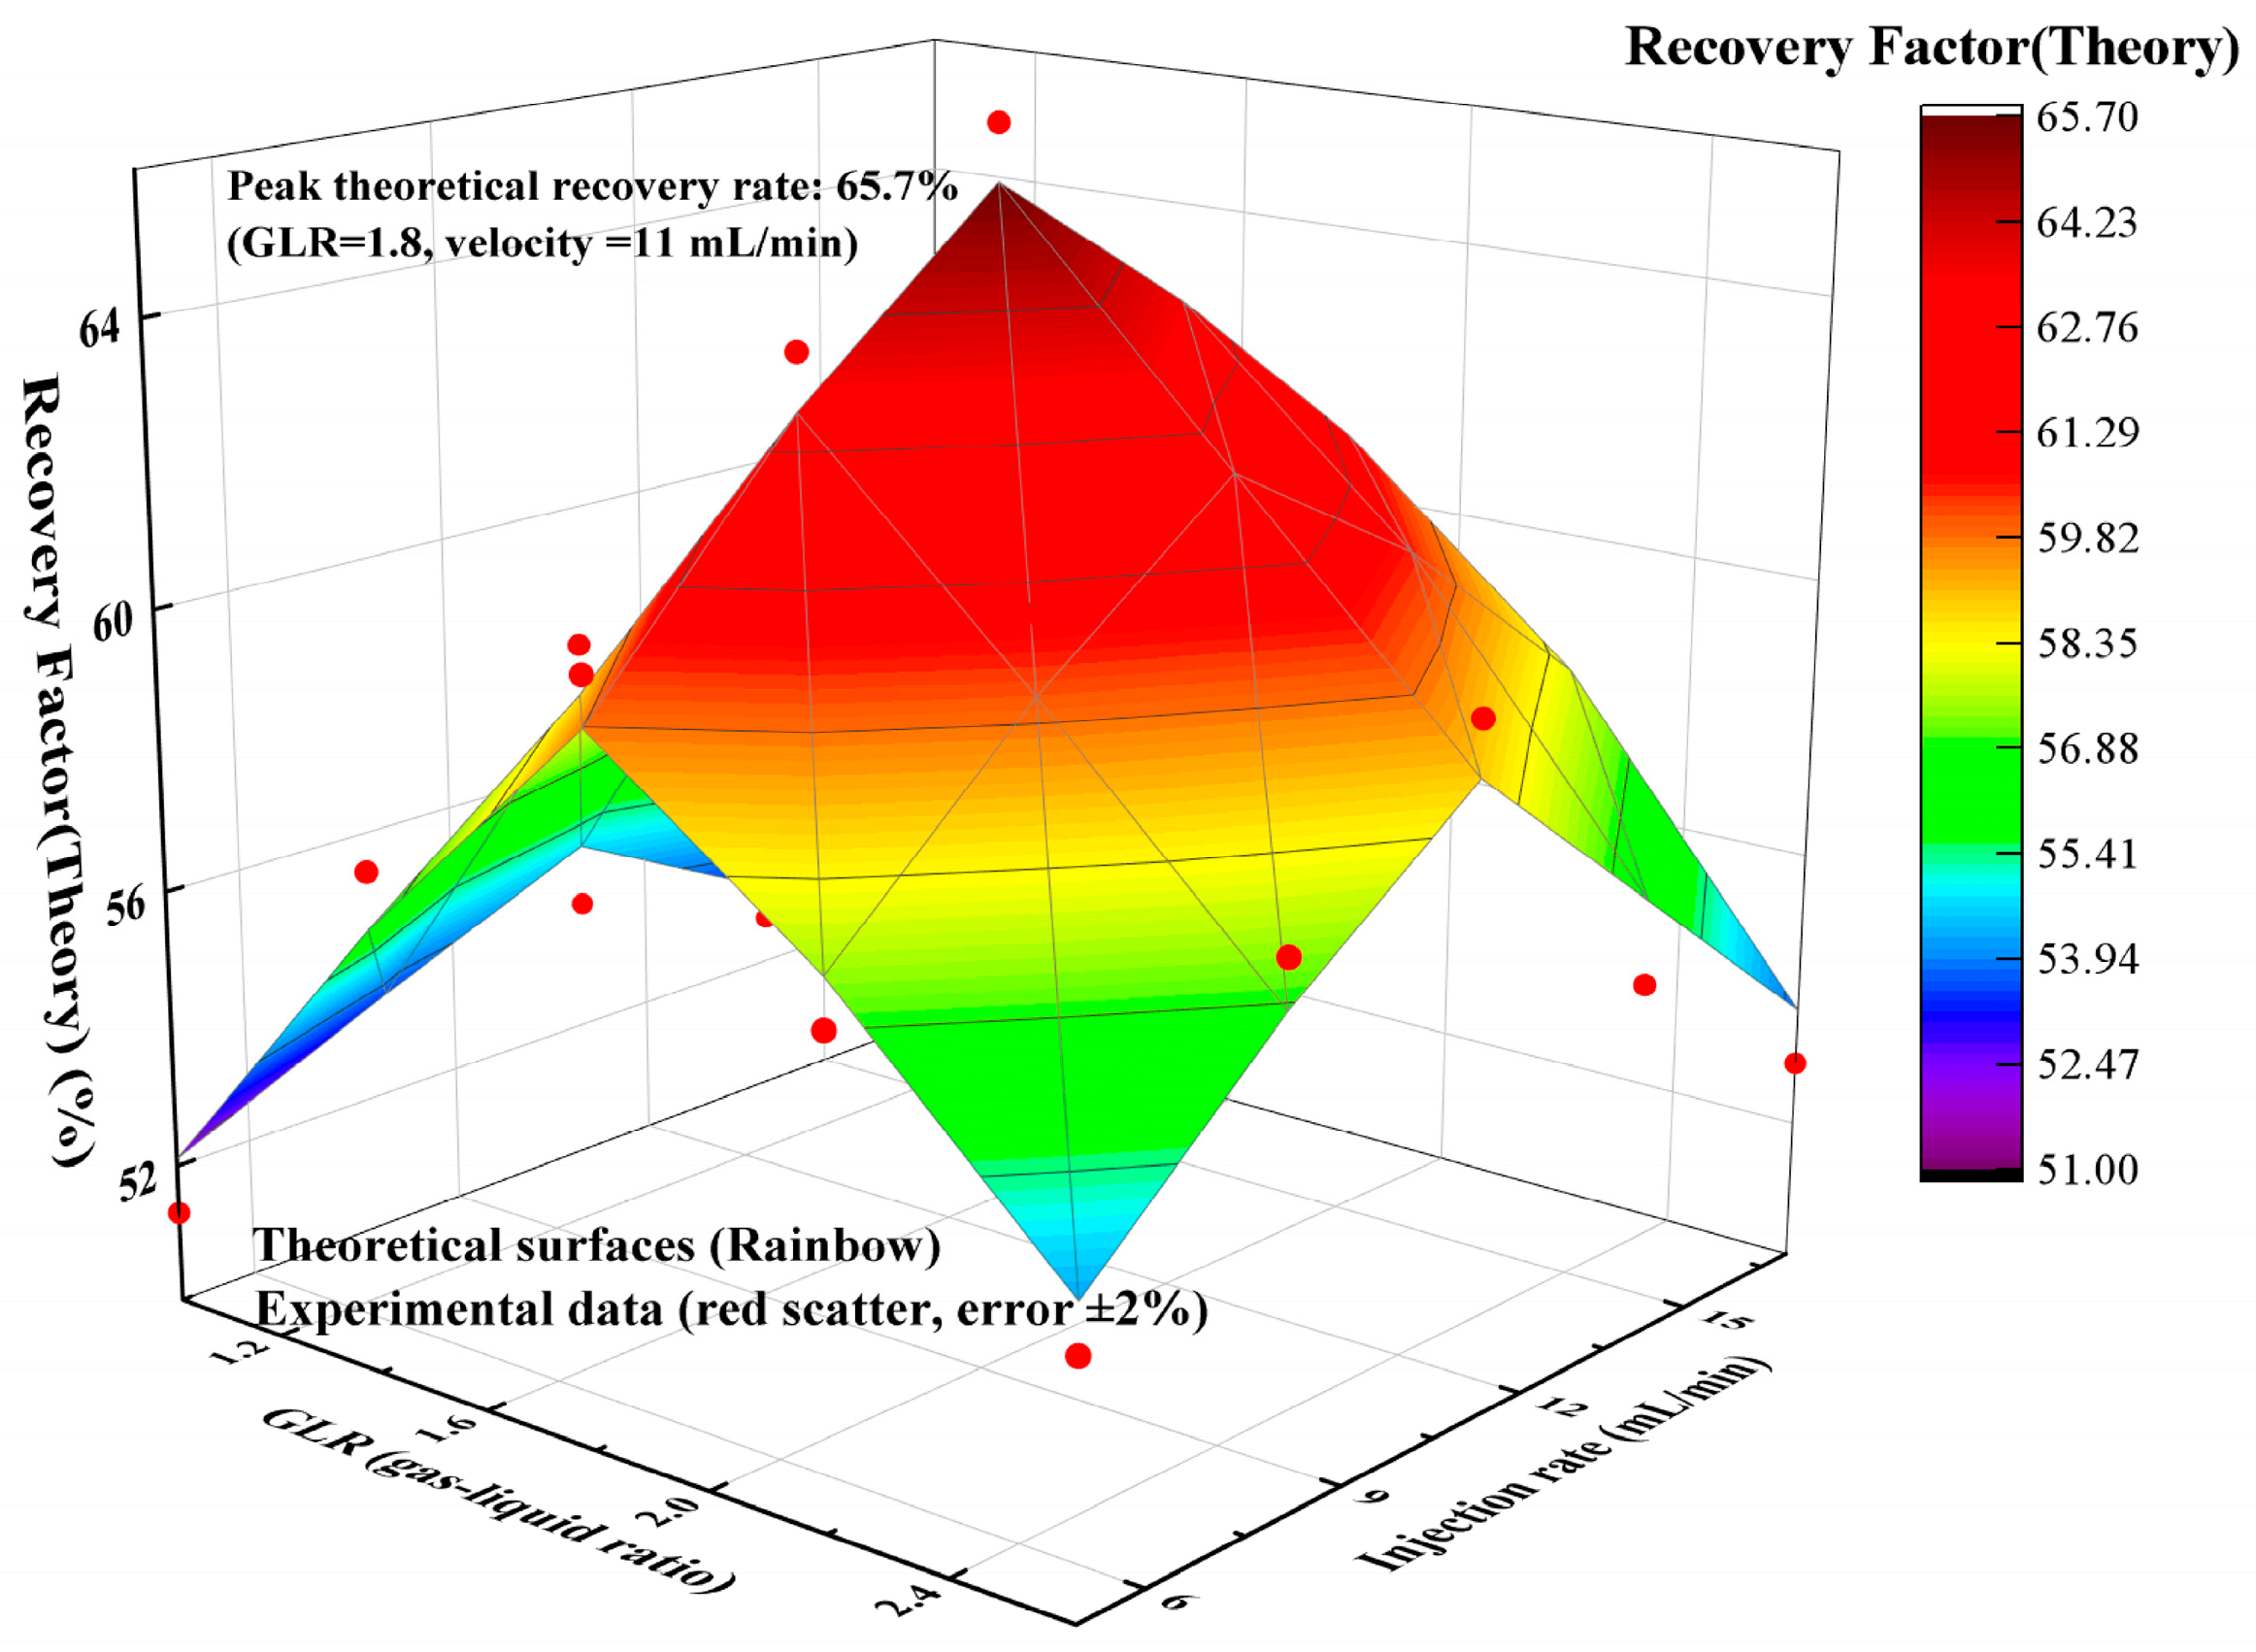
- Foam flooding parameter sensitivity analysis
3.2.2. Macro Control Mechanism
- Extended gas channeling time: increased from 8.5 ± 0.6 h (GLR = 1:1) to 12.3 ± 0.5 h (Δt = +3.8 h, p < 0.01).
- Enhanced foam stability: the half-life reached 120 min under high-salinity conditions (160,599 mg/L), surpassing conventional formulations by 65% (Table 3).
3.2.3. Key Influence Factor
- Foam stability–gas channeling correlation
- 2.
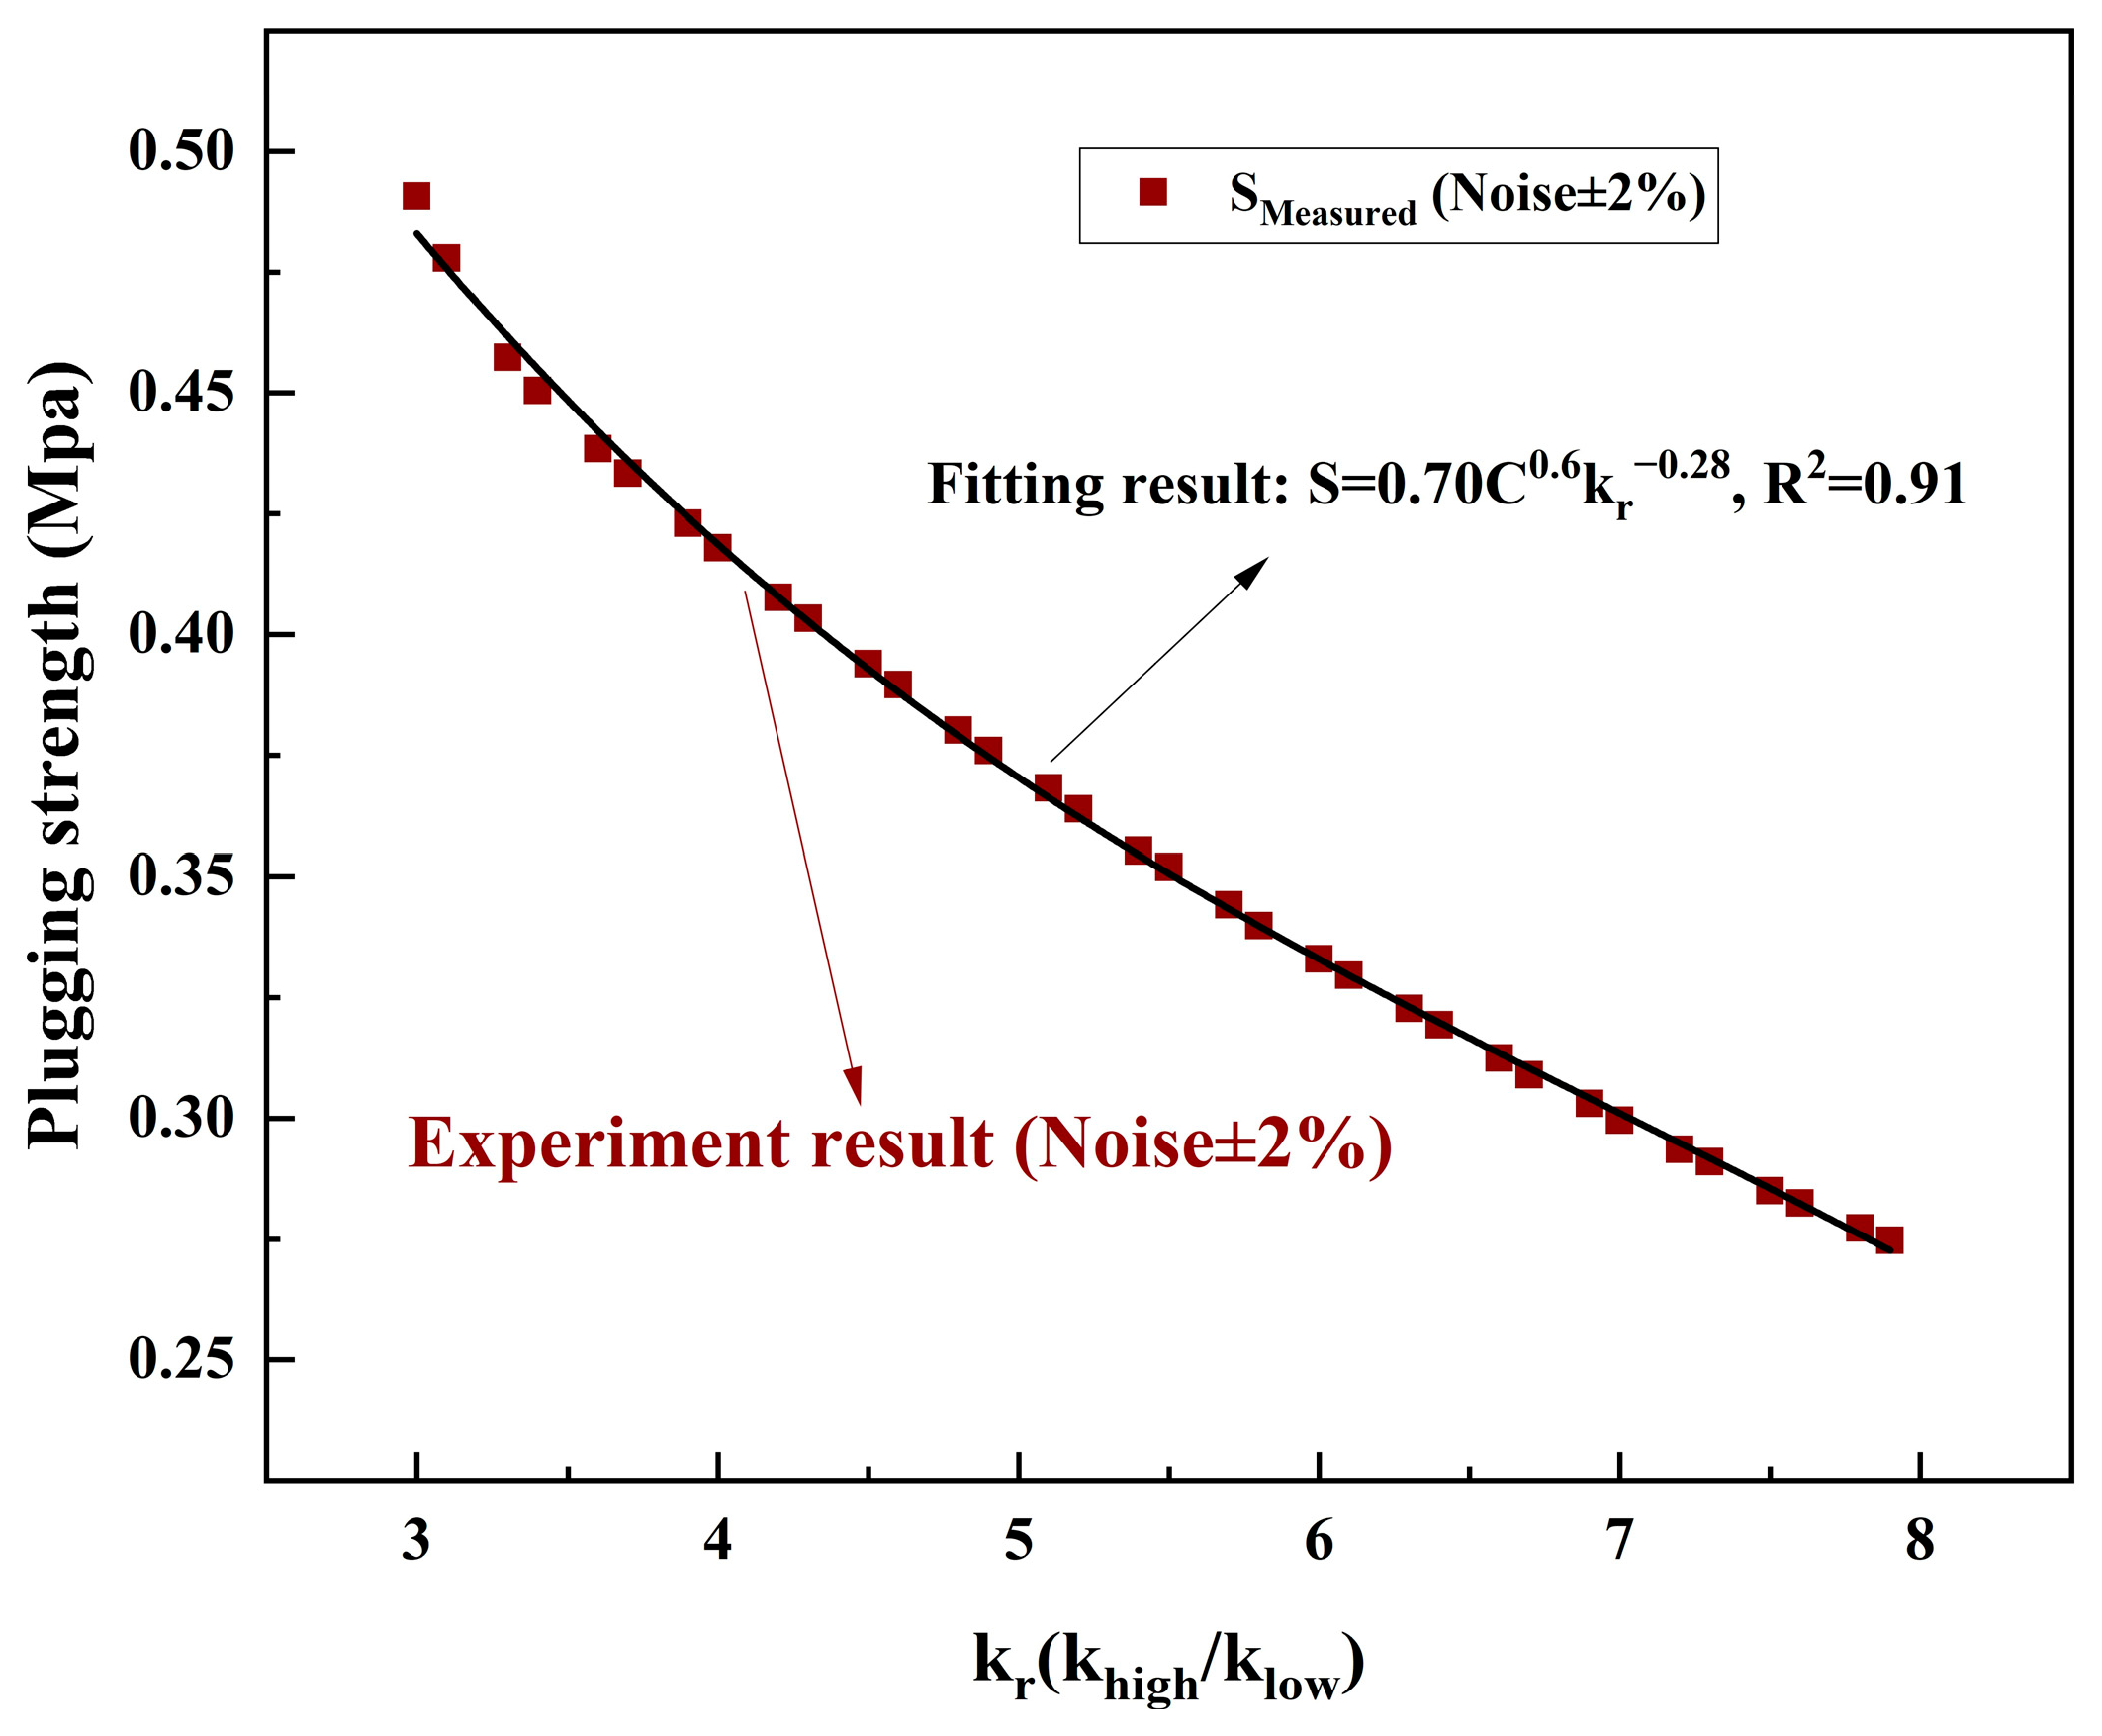
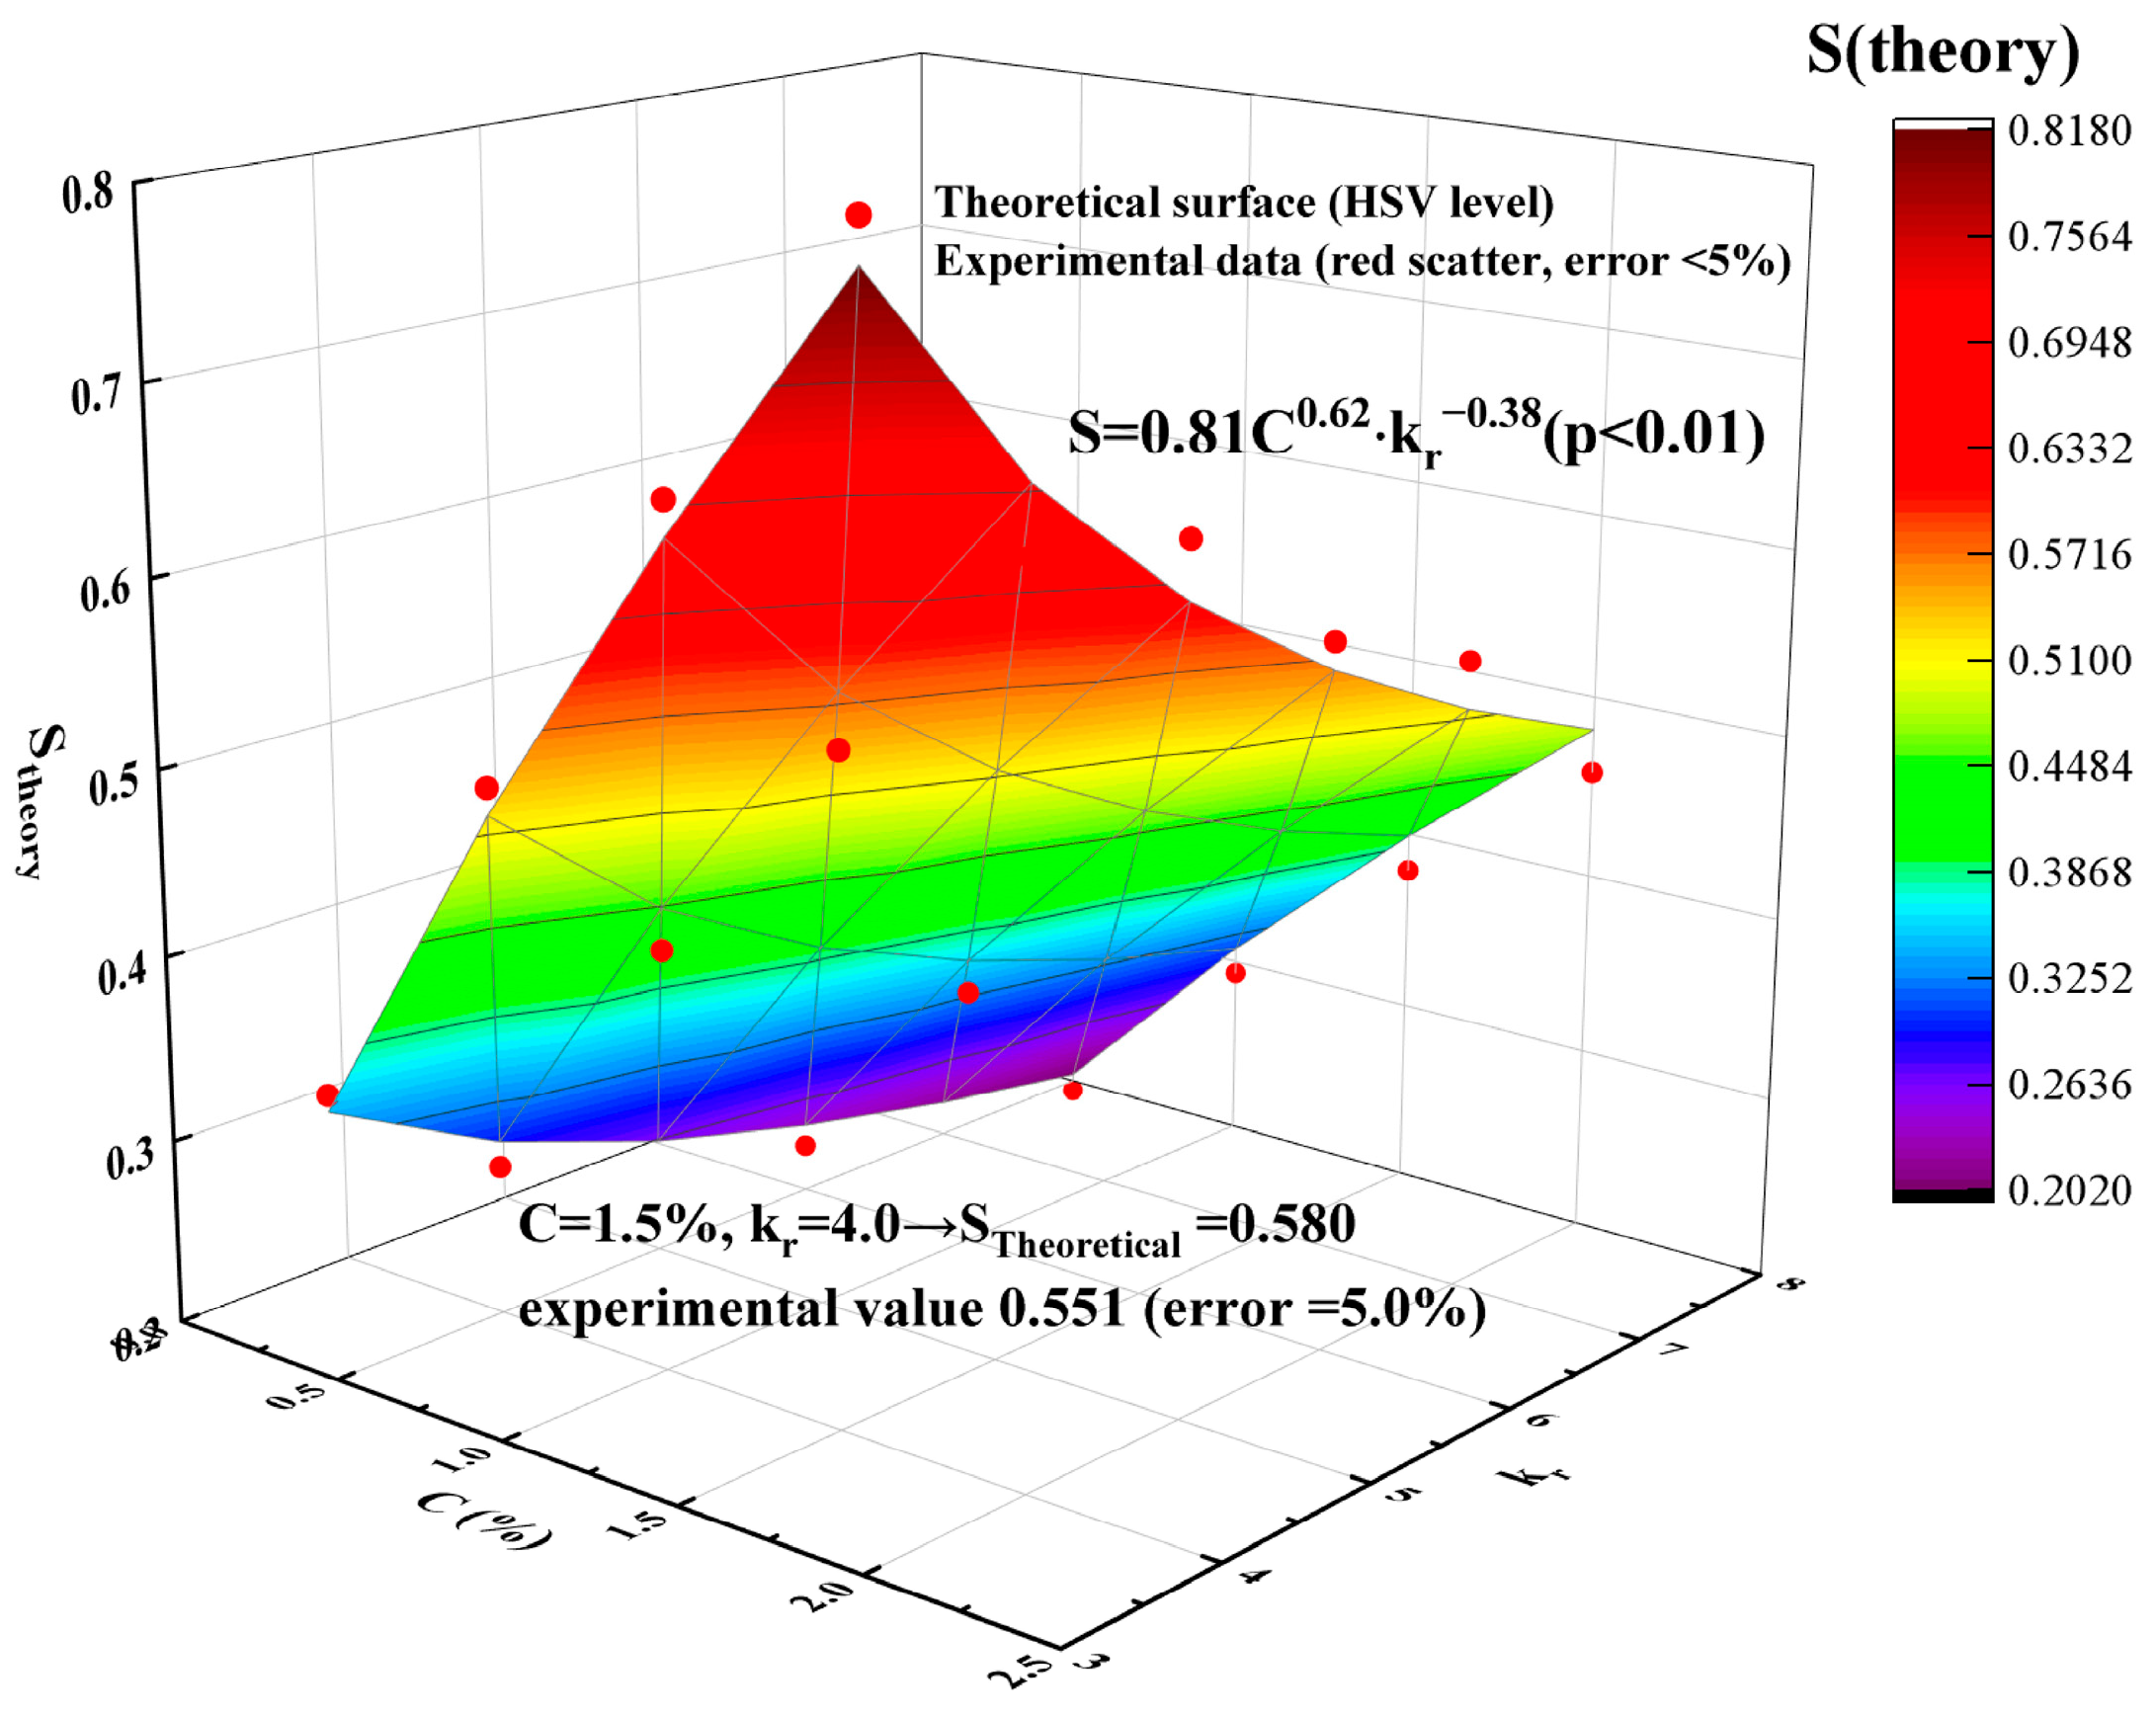
- Nonlinear effect of the permeability stage difference on plugging strength
- -
- α: concentration influence index (expected positive correlation);
- -
- β: permeability contrast influence index (expected negative correlation).
- At kr = 3, measured S = 0.65 MPa aligns with the predicted 0.67 MPa (error: −3.0%);
- For kr = 8, S decreases to 0.38 MPa, consistent with the model’s prediction (40 MPa) within a −5.0% error margin.
- The longest foam half-life: 85 ± 4.2 min (vs. 42 ± 2.5 min for GLR = 2:1, Group 9);
- A maximized recovery rate increase: 12.5 ± 0.8% (Table 7);
- An extended breakthrough time: 12.3 ± 0.5 h (vs. baseline 8.5 h, +44.7%).
4. The Compound Synergistic Technique and Simulation Methods
4.1. Multi-Dimensional Verification of Compound Efficiency Enhancement Technology
4.1.1. Inject the Slug with a High Concentration Foaming Agent Solution
4.1.2. Ground Strengthening Foaming Technology
4.1.3. Multiple Rounds of Profile Control Coordinated Displacement
4.2. Intelligent Upgrading of the Large-Scale Simulation Method System
5. Conclusions
Author Contributions
Funding
Data Availability Statement
Conflicts of Interest
References
- Wang, L.-Y.; Ma, Y.-Y.; Wang, F.; Sun, Y.-H.; Chen, X. Analysis of Oil Displacement Effect and Reservoir Influencing Factors of Air Foam Flooding Technology in Block M. J. Yan’an Univ. Nat. Sci. Ed. 2024, 43, 46–53. [Google Scholar]
- Li, C.; Qu, C.J.; Zong, T.H.; Dang, G.L.; Zhang, F. Research and Application of Air Foam Flooding Technology Suitable for Low-Permeability Oil Reservoirs. Contemp. Chem. Ind. 2022, 51, 1664–1667. [Google Scholar]
- Wang, P.; Zhai, S.-Q.; Luo, X.-B.; Wang, S.-P.; Sun, G.-Y. Screening and Evaluation of Foam Systems Under Simulated Reservoir Conditions. J. Math. Pract. Theory 2024, 54, 92–99. [Google Scholar]
- Li, X. Influence of the Gas-Liquid Interfacial Rheology of the Reinforced Foam System on the Oil Displacement Effect. Pet. Geol. Eng. 2021, 35, 72–75. [Google Scholar]
- Li, Z.M.; Li, B.F.; Zhang, Q. Challenges and Strategies for Heavy Oil Recovery in Heterogeneous Reservoirs. J. Pet. Sci. Eng. 2020, 195, 107532. [Google Scholar]
- Wang, H.M.; Liang, T.R.; Yao, W.Y. Water Channeling Mechanism in High-Viscosity Oil Reservoirs: A Case Study of Luqin Oilfield. SPE Res. Eval. Eng. 2019, 22, 876–889. [Google Scholar]
- Alvarado, V.; Ranson, A.; Manrique, E. Mobility Control in Waterflooding: From Mechanisms to Field Applications. SPE J. 2012, 17, 1140–1152. [Google Scholar]
- Farajzadeh, R.; Krastev, R.; Zitha, P.L.J. Foam Films Stabilized with Alpha Olefin Sulfonate for Enhanced Oil Recovery. Colloids Surf. A Physicochem. Eng. Asp. 2008, 324, 35–40. [Google Scholar] [CrossRef]
- Almajid, M.M.; Kovscek, A.R. Pore-Level Mechanics of Foam Generation and Coalescence in the Presence of Oil. Adv. Colloid Interface Sci. 2016, 233, 65–82. [Google Scholar] [CrossRef]
- Zhang, H.; Li, Z.; Chen, Q. Enhanced Foam Stability by Nanoparticles for Foam-Assisted Water-Alternating-Gas Process. Energy Fuels 2019, 33, 10763–10772. [Google Scholar]
- Liu, Q.; Dong, M.; Ma, S. Synergistic Effect of Mixed Surfactants on Foam Stability for Enhanced Oil Recovery. J. Pet. Sci. Eng. 2020, 184, 106541. [Google Scholar]
- Kam, S.I.; Nguyen, Q.P.; Rossen, W.R. Dynamic Imaging of Foam Displacement in Porous Media Using X-Ray Computed Tomography. Transp. Porous Media 2007, 70, 93–112. [Google Scholar]
- Ashoori, E.; Abad, B.D.; Marchesin, D. Mechanisms of Foam Generation in Porous Media: From Pore-Scale Dynamics to Macroscopic Models. Phys. Rev. Fluids 2020, 5, 084303. [Google Scholar]
- Hirasaki, G.J.; Miller, C.A.; Puerto, M. Recent Advances in Surfactant EOR. SPE J. 2011, 16, 889–907. [Google Scholar] [CrossRef]
- Zhao, J.; Zheng, J.-L.; Chen, S.-J.; Liu, H.-Y.; Wu, B.-B. Research and Application of Adaptive Composite Displacement Technology in Offshore J Oilfield. Petrochem. Ind. Appl. 2024, 43, 42–46. [Google Scholar]
- Seright, R.S. Gel Placement in Fractured Systems. SPE Prod. Facil. 1995, 10, 241–248. [Google Scholar] [CrossRef]
- Rossen, W.R.; van Duijn, C.J. Gravity Segregation in Steady-State Horizontal Flow in Homogeneous Reservoirs. J. Pet. Sci. Eng. 2004, 43, 99–111. [Google Scholar] [CrossRef]
- Farajzadeh, R.; Andrianov, A.; Krastev, R.; Hirasaki, G.J.; Rossen, W.R. Foam Stability in the Presence of Oil: Effect of Surfactant Concentration and Oil Type. Colloids Surf. A 2012, 402, 62–71. [Google Scholar]
- Yu, J.; An, C.; Mo, D.; Liu, N.; Lee, R.; Jiang, L.; Li, Y.; Wang, J.; Zhang, P.; Song, Y.; et al. Synergistic Stabilization of Foam by Nanoparticles and Surfactants in High-Salinity Environments. Energy Fuels 2019, 33, 4983–4992. [Google Scholar]
- Zhao, F.; Ma, K.; Ren, G.; Wang, Y.; Luo, J.; Li, Z.; Chen, Q.; Liu, H.; Zhang, X.; Sun, L.; et al. Foam Mobility Control in Heterogeneous Reservoirs: Experimental and Numerical Insights. J. Pet. Sci. Eng. 2019, 178, 1090–1100. [Google Scholar]
- Sun, L.; Bai, B.; Wei, B.; Pu, W.; Wei, P.; Li, D.; Zhang, C.; Liu, R.; Wang, F.; Chen, Y.; et al. Pre-Crosslinked Microspheres Assisted Foam Flooding for In-Depth Profile Modification. J. Pet. Sci. Eng. 2021, 205, 108952. [Google Scholar]
- Kovscek, A.R.; Patzek, T.W.; Radke, C.J. A Mechanistic Population Balance Model for Transient and Steady-State Foam Flow in Porous Media. SPE J. 1995, 10, 405–416. [Google Scholar]
- Wang, J.; Dong, M.; Asghari, K. Design of a Large-Scale 3D Physical Model for Foam Flooding in Heterogeneous Reservoirs. SPE J. 2018, 23, 1635–1648. [Google Scholar]
- Guo, H.; Zitha, P.L.J.; Faber, R.; Buijse, M. Scaling Criteria for Foam Flooding Experiments in Meter-Scale Heterogeneous Systems. Fuel 2020, 270, 117482. [Google Scholar]
- Hirasaki, G.J.; Miller, C.A.; Szlendak, S.M.; Tanzil, D.; Lawson, J.B.; Stegemeier, G.L. Foam Mobility in Heterogeneous Porous Media. Transp. Porous Media 2011, 88, 73–98. [Google Scholar]
- Ma, K.; Farajzadeh, R.; Lopez-Salinas, J.L.; Miller, C.A.; Biswal, S.L.; Hirasaki, G.J. Modeling Foam Flow in Fractured Porous Media: A Population Balance Approach. Transp. Porous Media 2019, 128, 589–613. [Google Scholar]
- Kam, S.I.; Rossen, W.R. Optimal Injection Strategies for Foam IOR. SPE Res. Eval. Eng. 2008, 11, 390–398. [Google Scholar]
- Wang, L.; Yang, L.-T.; Qian, G.-Q.; Shi, W.-C.; Qu, S.; Yao, F. Preparation of Graphene Oxide-Grafted Xanthan Gum and Its Enhancement of Foam Flooding for Oil Displacement. J. Nanjing Univ. Nat. Sci. 2025, 61, 140–147. [Google Scholar]
- Simjoo, M.; Dong, Y.; Andrianov, A. Novel Insights into Foam Mobility Control for Gas Channeling Mitigation. Fuel 2021, 292, 120318. [Google Scholar]
- Lake, L.W. Enhanced Oil Recovery; Prentice Hall: Englewood Cliffs, NJ, USA, 1989; pp. 215–230. [Google Scholar]
- Kovscek, A.R.; Radke, C.J. Fundamentals of Foam Transport in Porous Media. In Foams: Fundamentals and Applications in the Petroleum Industry; Schramm, L.L., Ed.; American Chemical Society: Washington, DC, USA, 1994; Volume 242, pp. 115–163. [Google Scholar]
- Sun, X.; Zhang, L.; Wang, Y. Salt-Resistant Polymer-Enhanced Foam Stability in High-Salinity Reservoirs. Energy Fuels 2021, 35, 5896–5905. [Google Scholar]
- Guo, H.; Li, X.; Yu, J. Conformance Control Through Gel-Foam Alternate Injection in Heterogeneous Reservoirs. SPE J. 2022, 27, 432–445. [Google Scholar]
- Torsæter, O.; Li, X.; Khorsandi, S. Dynamic Reservoir Characterization Using Electrical Resistivity Tomography. J. Pet. Sci. Eng. 2020, 193, 107442. [Google Scholar]
- Panja, P.; Velasco, R.; Pathak, M. Machine Learning Assisted Optimization of Gas Injection Parameters in EOR Processes. Fuel 2023, 334, 126735. [Google Scholar]
- Zhang, Y.; Li, S.; Wang, C. Digital Twin-Driven Optimization of Enhanced Oil Recovery Processes. J. Pet. Sci. Eng. 2023, 220, 111202. [Google Scholar]
- Kumar, S.; Mandal, A. Nanoparticle-Stabilized Foam for Enhanced Oil Recovery: A Review of Recent Progress. Fuel 2022, 310, 122443. [Google Scholar]
- SY/T 5345-2007; Test Method for Rock Resistance Increase Rate. China National Petroleum Corporation (CNPC): Beijing, China, 2007.
- Yan, Y.-L.; Qu, C.-T.; Zhang, N.-S.; Yang, Z.-G.; Liu, L. A Study on the Kinetics of Liquid Drainage from Colloidal Gas Aphrons (CGAs). Colloids Surf. A Physicochem. Eng. Asp. 2005, 259, 167–172. [Google Scholar] [CrossRef]


| Parameter | Value/Range |
|---|---|
| Model dimensions | 5 m × 1 m × 0.04 m |
| Sand grain size | 200 mesh |
| Permeability | 500–1000 mD |
| Compaction pressure | 25/27/29 MPa |
| Heterogeneity index | 0.65–0.75 |
| Na+, K+ | Ca2+ | Mg2+ | Cl− | SO42− | HCO3− |
|---|---|---|---|---|---|
| 53,089 | 7416 | 1204 | 7400 | 1224 | 266 |
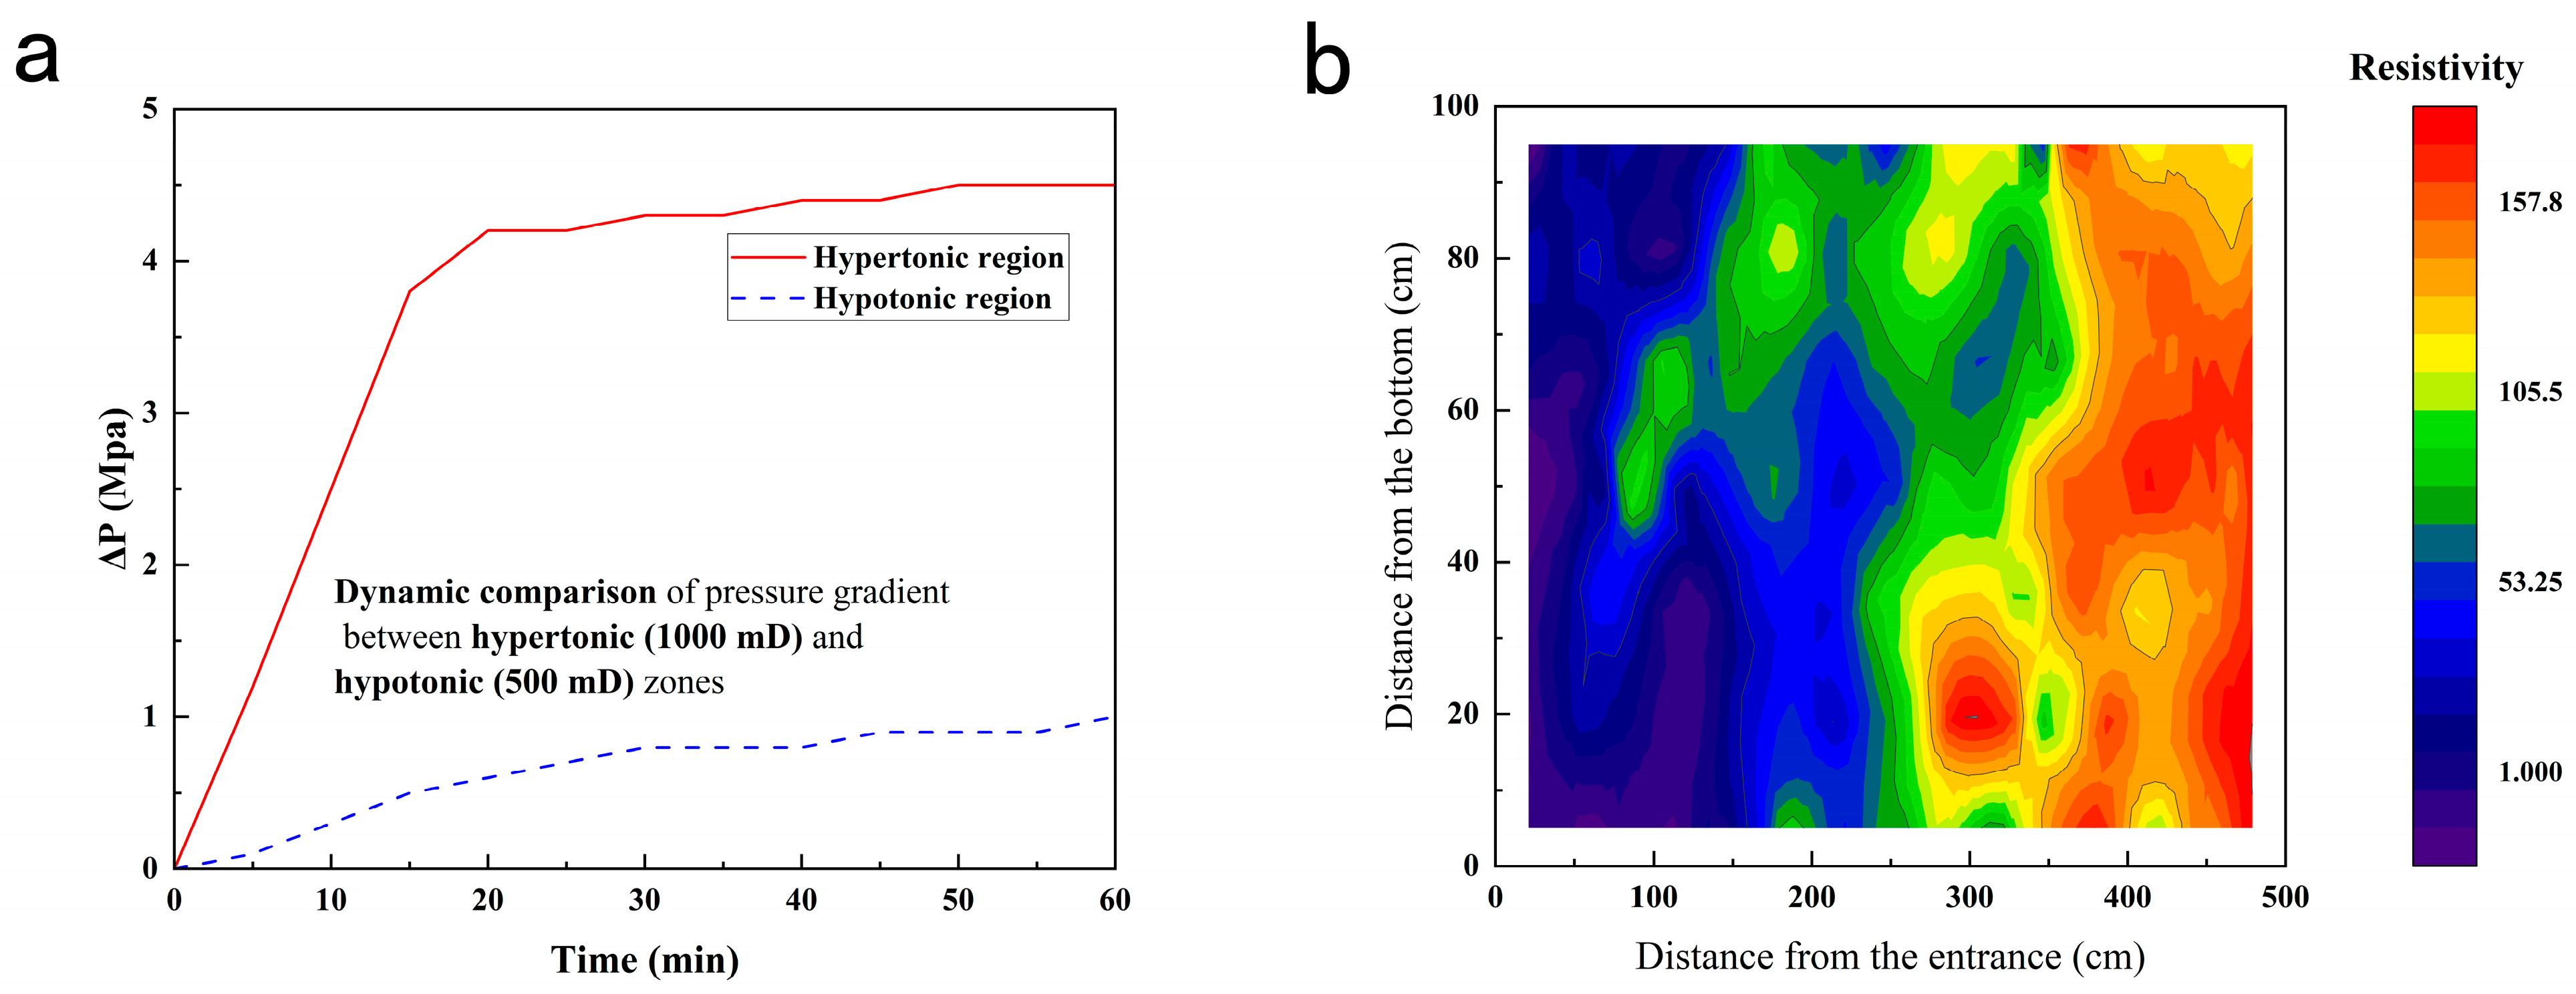
| Injection Phase | Zone Type | ΔP (MPa, Mean ± SD) | Oil Saturation (%) | Specific Resistance (Ω·m) | Explanation |
|---|---|---|---|---|---|
| Pre-foam injection | Hypertonic region | 0 (baseline) | 72 ± 3 (n = 5) | 150–200 | Initial state with high oil saturation in low-permeability zones |
| Foam injection | +2.5 ± 0.2 | <15 (estimated) | 50–80 | Foam-induced pressure surge diverts fluid to low-permeability zones | |
| Pre-foam injection | Hypotonic zone | 0 (baseline) | 72 ± 3 (n = 5) | 240–260 | High oil content in low-permeability zones due to preferential water channeling |
| Foam injection | +0.4 ± 0.1 | 35–42 (38.5 ± 3.2, n = 5) | 80–120 | Displacement fluid diversion activates trapped oil, reducing saturation |
| Group | C (%) | kr | S | ln(S) | ln(C) | ln(kr) |
|---|---|---|---|---|---|---|
| 1 | 1.0 | 3 | 12.5 | 2.526 | 0 | 1.0986 |
| 2 | 1.0 | 5 | 9.8 | 2.282 | 0 | 1.6094 |
| 3 | 1.0 | 8 | 8.7 | 2.163 | 0 | 2.0794 |
| 4 | 0.8 | 5 | 7.3 | 1.988 | −0.2231 | 1.6094 |
| 5 | 1.2 | 5 | 10.5 | 2.351 | 0.1823 | 1.6094 |
| Permeability Contrast Ratio (kr) | Measured Plugging Strength (MPa, Mean ± SD) | Predicted Plugging Strength (MPa) | Relative Error (%) | Kovscek Model (MPa) |
|---|---|---|---|---|
| 3 | 0.65 ± 0.03 | 0.67 | −3.0% | 0.52 ± 0.05 |
| 5 | 0.52 ± 0.02 | 0.50 | +4.0% | 0.41 ± 0.04 |
| 6 | 0.48 ± 0.02 | 0.46 | +4.3% | 0.35 ± 0.03 |
| 8 | 0.38 ± 0.01 | 0.40 | −5.0% | 0.28 ± 0.02 |
| Group | GLR | Slug Volume (PV) | Injection Rate (mL/min) |
|---|---|---|---|
| 1 | 1:1 | 0.2 | 8 |
| 2 | 1:1 | 0.3 | 12 |
| 3 | 1:1 | 0.4 | 16 |
| 4 | 1.5:1 | 0.2 | 12 |
| 5 | 1.5:1 | 0.3 | 16 |
| 6 | 1.5:1 | 0.4 | 8 |
| 7 | 2:1 | 0.2 | 16 |
| 8 | 2:1 | 0.3 | 8 |
| 9 | 2:1 | 0.4 | 12 |
| Experimental Group | Half Foam Life Period (min) | tbreak (h) | ΔR (%) |
|---|---|---|---|
| 5 | 85 | 12.3 | 12.5 |
| 4 | 78 | 10.8 | 10.2 |
| 9 | 42 | 7.5 | 6.8 |
| Parameter | Before Profile Control | After Profile Control | Improvement Range |
|---|---|---|---|
| Dominant channel permeability (mD) | 980 ± 45 | 343 ± 28 | 65% (p < 0.001) |
| Sweep efficiency (%) | 54 ± 2.1 | 82 ± 3.5 | +28% (p < 0.01) |
| Gas channeling time (h) | 8.5 ± 0.6 | 14.2 ± 1.1 | +67% (p < 0.05) |
Disclaimer/Publisher’s Note: The statements, opinions and data contained in all publications are solely those of the individual author(s) and contributor(s) and not of MDPI and/or the editor(s). MDPI and/or the editor(s) disclaim responsibility for any injury to people or property resulting from any ideas, methods, instructions or products referred to in the content. |
© 2025 by the authors. Licensee MDPI, Basel, Switzerland. This article is an open access article distributed under the terms and conditions of the Creative Commons Attribution (CC BY) license (https://creativecommons.org/licenses/by/4.0/).
Share and Cite
Meng, Q.; Wang, H.; Yao, W.; Han, Y.; Chao, X.; Liang, T.; Fang, Y.; Sun, W.; Li, H. Mechanisms and Optimization of Foam Flooding in Heterogeneous Thick Oil Reservoirs: Insights from Large-Scale 2D Sandpack Experiments. ChemEngineering 2025, 9, 62. https://doi.org/10.3390/chemengineering9030062
Meng Q, Wang H, Yao W, Han Y, Chao X, Liang T, Fang Y, Sun W, Li H. Mechanisms and Optimization of Foam Flooding in Heterogeneous Thick Oil Reservoirs: Insights from Large-Scale 2D Sandpack Experiments. ChemEngineering. 2025; 9(3):62. https://doi.org/10.3390/chemengineering9030062
Chicago/Turabian StyleMeng, Qingchun, Hongmei Wang, Weiyou Yao, Yuyang Han, Xianqiu Chao, Tairan Liang, Yongxian Fang, Wenzhao Sun, and Huabin Li. 2025. "Mechanisms and Optimization of Foam Flooding in Heterogeneous Thick Oil Reservoirs: Insights from Large-Scale 2D Sandpack Experiments" ChemEngineering 9, no. 3: 62. https://doi.org/10.3390/chemengineering9030062
APA StyleMeng, Q., Wang, H., Yao, W., Han, Y., Chao, X., Liang, T., Fang, Y., Sun, W., & Li, H. (2025). Mechanisms and Optimization of Foam Flooding in Heterogeneous Thick Oil Reservoirs: Insights from Large-Scale 2D Sandpack Experiments. ChemEngineering, 9(3), 62. https://doi.org/10.3390/chemengineering9030062