Abstract
A steady-state tubular reactor for total oxidation reaction under typical industrial conditions in the removal of volatile organic components (VOC) is described using a one-dimensional heterogeneous reactor model with intraparticle diffusion, using a fully developed Langmuir–Hinshelwood reaction rate expression. The effectiveness factor, accounting for these intraparticle diffusion limitations, is calculated with a generalized Thiele modulus. The actual inclusion of this factor shows that higher operational reactor temperatures can be possible, since this diffusion limitation restricts the heat production inside the catalyst particle. Special attention is given to the outlet concentration of propane, taken as the model VOC, and runaway criteria, reported in the literature, are evaluated. Furthermore, the well-known Barkelew criterion (to evaluate runaway for exothermic reactions) is implemented for practical and safe reactor design. This work identifies that the critical couples populating the Barkelew diagram are positioned lower (up to a 50% difference, compared to Barkelew’s original report), so that operation of the reactor under higher hydrocarbon molar inlet fractions is possible while maintaining safe performance.
1. Introduction
According to Theloke and Friedrich [1], four main sources of volatile organic components (VOC) can be distinguished, namely transport (37%), solvent use (55%), production and storage processes (4%), and combustion processes (4%). One third of all emitted gases are alkanes. The emissions coming from mobile sources, most of them automotive, can be eliminated by the use of monolith reactors [2]. The stationary emissions can be destructed using the same reactor type, but the use of tubular reactors is preferred, since industrial effluents have a higher flow rate than car exhaust gases. Furthermore, for highly exothermic reactions, as is the case for total oxidation reactions, this type of reactor, embedded in molten salt, is definitely preferred for its heat transfer [3]. In this type of reaction, exothermicity cannot be neglected; therefore, hotspots and runaway are the origins of a poor oxidation reactor operation. Literature overviews of these phenomena are given by Baptista et al. [4], Velo et al. [5], and Quina et al. [6]. Excessive temperatures during runaway may lead to serious damage to the reactor, catalyst sintering and deactivation, and, last but not least, hazardous situations for the operators. It is clear that these phenomena should be avoided at all times. A recent report deals with thermal runaway for wall-cooled multi-tubular fixed-bed catalytic reactors (MTR), using an nth order reaction in multiple stacked reactor configuration [7]. Regarding safe reactor operation, Calverley et al. suggest the loading mixtures of active and inert catalyst pills into multi-tubular reactors. This process produces natural variations in catalyst activity [8]. Nevertheless, their commercial-scale reactor simulations for the partial oxidation of o-xylene to phthalic anhydride suggest that this variation can still cause a significant fraction of the reactor tubes to run away, even though the reactor is operating well within its stable range when a perfect activity profile is assumed, A very comprehensive overview in terms of runaway prevention is given by Kummer and Varga [9]. They consider the appropriate design of the reactor, the operation strategy, and an early warning detection system. Reactor runaway criteria can indicate thermal runaway early, which can be addressed via three criteria classes (based on geometry, sensitivity, and stability). Furthermore, the works of Westerterp and Molga [10] and Yang et al. [11] on criteria for runaway phenomena are recommended.
In this work, a steady-state non-isothermal plug flow reactor is simulated for the total oxidation of volatile organic components (VOC), for which propane is taken as a model molecule, using a fully developed Langmuir–Hinshelwood reaction rate expression. Intraparticle gradients are accounted for by means of an effectiveness factor, calculated with a generalized Thiele modulus [3]. After the discussion of a base case, several variations in inlet and reactor conditions are presented. Special attention is paid to the runaway phenomenon in terms of the well-known Barkelew graph [3,12,13], which can occur when the reaction is exothermic and the generation rate of heat exceeds the rate of its removal. The simulation results using a fully developed kinetic model including intraparticle diffusion limits will be compared to the results of Barkelew in terms of reactor operation (temperature, inlet hydrocarbon molar fraction).
2. Model Description
This section contains an explanation of the reactor model that was used for the simulations (Section 2.1). In Section 2.2, it is proven that a pseudo-homogeneous is sufficient for the current simulations. Section 2.3 describes the details of the total oxidation kinetic model that was used. Details of the solution procedure are summarized in Section 2.4. This section ends with a reflection on the typical reactor duty for total oxidation reactions (Section 2.5).
2.1. Reactor Model
For the simulation of the total oxidation of propane, a one-dimensional reactor model is used, in which it is assumed that concentration and temperature gradients only occur in the axial direction. The continuity equation for propane is given by Equation (1), in which , , , and represent the molar flow rate of propane through the reactor, the bed density, the cross section of the reactor, and the specific production rate of propane. The energy equation is given by Equation (2), in which us, , T, cp,f, (−ΔrH), U, dt, and Tr are the superficial velocity, gas density, bulk fluid temperature, the specific heat of the gas mixture, reaction enthalpy, overall heat transfer coefficient, reactor tube diameter, and reactor temperature, respectively. Equation (3) is the momentum equation, in which pt, f, and dp are the total pressure along the axis of the reactor, the friction factor, and the equivalent particle diameter, respectively.
The conditions at the inlet of the reactor are , , and . In the above continuity Equations (1) and (2), the only mechanism of transport is plug flow. In all the performed simulations, the Péclet numbers for mass and heat transfer and , as a measure of the deviation from the plug flow regime, are calculated at the reactor inlet. When the rate monotonically decreases in the reactor bed, Young and Finlayson [14] point out that the critical position where the importance of axial mixing has to be assessed is the bed inlet.
The Péclet numbers for axial mass transfer, , and axial heat transfer, , are obtained from Equations (6) and (7), where Sc and Pr are the dimensionless Prandtl and Schmidt number. The static contribution for axial heat transfer, , and typical values for constant C are given by Kulkarni and Doraiswamy [15].
Corresponding to base case conditions (see Table 1), it was concluded from the obtained values in Equations (6) and (7) (see Table 2) that axial mixing is not significantly present, and hence no additional second-order terms, accounting for axial diffusion, were to be added to Equations (1) and (2).
Regarding possible radial variations, earlier work ruled out significant radial influences under the given conditions [16,17]. If higher values for the reactor tube diameter are to be considered, the 1D model probably needs to be replaced by a 2D model using cylindrical coordinates, i.e., including the radial direction [3]. Instructive reports are the works of Donaubauer et al. [18] and Kern and Jess [19].
A heterogeneous reactor model, in which a distinction is made between the conditions in the fluid and the catalyst particle, is advised in the case of rapid reactions or reactions with an important heat effect, e.g., (total) oxidation reactions [3]. Since high flow rates, and hence superficial velocities, are adopted in industrial reactors, the concentration and temperature gradients on the reactor scale are generally smaller than on the catalyst particle scale [3]. External gradients are investigated in more detail in Section 2.2.
Within the catalyst particle, temperature gradients are generally smaller than concentration gradients [3]. In order to account for the concentration gradients inside the catalyst particle, an effectiveness factor can be calculated. This factor corresponds to the ratio of the rate of reaction with pore diffusion resistance to the reaction rate at surface conditions, i.e., without internal gradients. Hence, the specific production rate in Equations (1) and (2) equals , with being the rate of disappearance of propane (see Section 2.3), and it is possible to characterize the situation inside the catalyst particle by means of a single number, [3]. Nevertheless, it is common to use constant effectiveness factors [20,21,22], where calculated values for are updated along the axial position in the reactor. Instructive examples can be found in Lee et al. [23], investigating the kinetics and effectiveness factor for methanol steam reforming over Cu/ZnO/Al2O3 catalyst; Carrasco-Venegas et al. [24], describing the catalytic dehydrogenation of cyclohexanol; Lee et al. [25], reporting on the simulation of a fixed-bed reactor for dimethyl ether synthesis with complex kinetics; and Kim et al. [26], proposing a novel method for an effectiveness factor estimation of two simultaneous reactions in the preferential CO oxidation over CuO/CeO2.

Table 1.
Base case conditions used in the simulations. The oxygen source is air; the total inlet pressure is calculated to have a fixed outlet pressure, patm.
Table 1.
Base case conditions used in the simulations. The oxygen source is air; the total inlet pressure is calculated to have a fixed outlet pressure, patm.
| Parameter | Symbol | Units | Value |
|---|---|---|---|
| reactor configuration | |||
| number of tubes | Nt | - | 3000 |
| inner diameter | dt | m | 0.016 |
| wall thickness | dw | m | 0.002 |
| wall heat conductivity | λw | W m−1 K−1 | 48.9 + 0.0426 T [27] |
| tube length | Lt | m | 12.0 |
| bed porosity | εb | m3 m−3 | 0.49 |
| catalyst | |||
| equivalent particle diameter | dp | m | 2.33 × 10⁻³ |
| pore radius | rp | m | 6.34 × 10⁻⁹ |
| particle porosity | εp | m3 m−3 | 0.62 |
| tortuosity | τp | m m−1 | 2.0 [28] |
| density | kgcat mcat−3 | 3254 | |
| effective thermal conductivity | λe | J m−1 s−1 K−1 | 36.0 [27] |
| operating conditions | |||
| inlet temperature | T0 | K | 598 |
| reactor temperature | Tr | K | 648 |
| inlet total pressure | pt,0 | Pa | 2.10 × 10+5 |
| inlet total flow rate | Ft,0 | molt,0 s−1 | 26.6 |
| inlet mole fractions | 3.70 × 10⁻³ | ||
| 1.00 × 10⁻¹ | |||
| 1.00 × 10⁻¹ | |||
| heat of reaction | −ΔrH | J mol−1 | 1.98 × 10+6 |
Table 2.
Mass and heat transfer coefficients.
Table 2.
Mass and heat transfer coefficients.
| Parameter | Units | Value |
|---|---|---|
| Mass transfer | ||
| 0.14 | ||
| 1.91 | ||
| jD | - | 0.07 |
| Rep | - | 1.05 × 10+2 |
| Sc | - | 0.45 |
| lhs Equation (4) | - | 3.78 × 10⁻⁴ |
| - | 2.12 | |
| Heat transfer | ||
| α | 3.50 × 10+2 | |
| jH | - | 0.17 |
| Pr | - | 0.60 |
| lhs Equation (5) | - | 1.05 × 10⁻⁵ |
| - | 1.62 × 10⁻⁴ |
For spherical catalyst particles, it is calculated with Equation (8), using the generalized Thiele modulus (see Equation (9)). For an irreversible reaction, the propane partial pressure at equilibrium, , is set to zero:
The Prater relation, given by Equation (10), provides the temperature inside the pellet, , as a function of the surface temperature, , surface partial pressures , and the propane partial pressure inside the pellet .
The partial pressure profiles of the dependent components, needed in the integrand of Equation (9), are obtained as a function of the key component partial pressure (see Equations (11)–(13)) [3]:
The effective diffusion coefficient for component i, De,i, is calculated with the Bosanquet equation, i.e., from the molecular diffusion coefficient, Dm,i, and the Knudsen diffusion coefficient, DK,i, corrected for the pellet porosity εp and tortuosity τp. The former is obtained from the Stefan–Maxwell equation, corrected with the so-called ‘approximate film factor’, which is justified because external gradients are not important [29] (see Section 2.2).
Values for the physical parameters, f and cp,f, present in Equations (1)–(3) are obtained from correlations [27], and their values, considered to be a function of temperature and composition, are updated along the reactor length. The overall heat transfer coefficient U is calculated as a total resistance to heat transfer, replacing a series of thermal resistances [3,30]. The friction factor f in Equation (3) is calculated with the correlation of Hicks for spherical particles [3]. Typical reactor dimensions and inlet conditions are given in Section 4.1.
2.2. External Gradients
The external concentration gradient can be estimated by Equation (14), in which , , and Ci are the mass transfer coefficient from gas to solid interface, the specific external surface, and the molar concentration of component i, respectively. The specific external surface is obtained from Equation (15):
The propane molar concentration difference amounts to 2.3 × 10⁻³ mol m−3, which is, compared to the propane molar inlet concentration of 0.2 mol m−3, negligible. It can hence be concluded that external gradients are not significantly relevant in the performed reactor simulations [29,31].
The external temperature gradient can be calculated by Equation (16), in which p and α are the particle density and the convective heat transfer coefficient, respectively:
In the performed simulations, the maximum temperature difference between bulk and catalyst surface amounts to 1.6 K, so it is acceptable to assume that external temperature gradients are not significantly present.
The mass transfer coefficient from gas to solid interface, , and convective heat transfer coefficient, α, are calculated using the Chilton–Colburn j factors [30]. For mass and heat transfer, the jD and jH factors are calculated according to Sengupta and Thodos [32] and Deacetis and Thodos [33]. Typical values are reported in Table 2.
In conclusion, based on the absence of significant external gradients under the applied conditions, a pseudo-homogeneous reactor is acceptable.
2.3. Kinetic Model
For the simulation of a tubular reactor, the steady-state Langmuir–Hinshelwood (LH) kinetic model for the total oxidation of propane over a CuO-CeO2/γ-Al2O3 mixed metal oxide catalyst [17] is used. The corresponding kinetic parameters are listed in Table 3.
Table 3.
Kinetic parameters for the LH model for the total oxidation of propane, obtained from Heynderickx et al. [17].
Fractional coverages for adsorbed propane, dissociatively chemisorbed oxygen, carbon dioxide, water, and hydroxyl species are given by Equations (18)–(22), with N being the square root of the denominator in Equation (17):
The fractional coverage for the free active sites is obtained by solving Equation (23) for and subsequent substitution of Equations (18)–(22):
The average fractional coverage for surface species i along the reactor axis is obtained by elaboration of Equation (24): the fractional coverage inside the catalyst particle, as an analogue to Equation (9), is averaged over the catalyst particle for every axial position inside the reactor:
While the first reports on runaway phenomena used first-order [34] or pseudo-first-order reactions [35], it is important to consider realistic reaction rate expressions.
2.4. Solution Procedure
The code starts by reading all the variables needed for integration of the reactor differential equations (physical properties, reactor details (length, number of tubes, bed porosity), flow rate, inlet concentrations, inlet mole fractions, kinetic parameters, catalyst properties (particle size, tortuosity)), i.e., all the base case conditions reported in Table 1, together with the properties from Table 2. Then, the fourth order Runge–Kutta routine is called, rk4 [36], for the first integration step (step size along the tubular reactor axis was 1.0 × 10⁻⁴ m), where the in-house written subroutine rhs () takes care of the actual right-hand sides of the differential equations (calculation of specific heat, heat transfer coefficient on the bed side (Leva correlation [37]), overall heat transfer coefficient, friction factor according to Hicks [38], etc.). Parameters and updated properties are shared via common blocks. Thereafter, the effectiveness factor is calculated from the generalized Thiele modulus with the in-house code gthiel(). Molecular diffusion coefficients are updated using the Fuller–Schettler–Giddings correlation [39], and together with the calculated Knudsen diffusion, the effective diffusion coefficient is obtained via the Bosanquet relation [3,29]. The in-house written function rate (p,T) calculates the pressure values inside the particle according to Equations (11)–(13). The integral in Equation (9) to calculate the Thiele modulus is performed by means of Chebyshev polynomials [40]. At this point, the right-hand side of the differential continuity and heat equations can be fully calculated by the Runge–Kutta method, and thereafter the procedure loops back into the second space increment and so on until the total reactor tube length is simulated. Values for variable properties are stored in separate files as the integration goes along (from inlet to end of the reactor tubes). The average computational time on a Samsung PC (Intel® Core™ i5-6200U CPU @ 2.30 GHz, sourced from Samsung Electronics Co., Ltd. (Suwon, Republic of Korea) with processor from Intel Corporation (Santa Clara, CA, USA)) was 20 s.
2.5. Reactor Duty in Total Oxidation Operation
In industrial applications, the pressure at the outlet of the tubular reactor is generally atmospheric pressure. Therefore, the given total inlet pressure, , is iteratively adapted in the base case simulation until atmospheric pressure is obtained at the outlet of the reactor.
Since the tubular reactor is used in the total oxidation of VOC, full propane conversion at the outlet should be aimed at. A higher reactor temperature results in an increase in propane conversion, and hence in a smaller tubular reactor, but it also gives rise to runaway behavior, which is to be avoided. On the other hand, a longer reactor results in a higher propane conversion, but the length is limited by construction as well as by the pressure drop. The optimization of the tubular reactor for total oxidation purposes depends on the reactor configuration, on the inlet conditions, and on the required outlet conditions.
3. Safety and Runaway Criteria
Barkelew [34] proposed two dimensionless numbers, S and N, to diagnose runaway by simulation of a first-order reaction:
S is the product of the adiabatic temperature rise and the dimensionless activation energy (see Equation (25)). N is given by Equation (26), and the ratio N/S represents the ratio of the rate of heat transfer per unit reactor volume to the rate of heat generation per unit volume. In order to avoid runaway, S should be as small as possible, whereas N/S should be as high as possible. Details on the Barkelew approach can be found in Velo et al. [5]. If the operational conditions lead to a point above the curve in the so-called ‘Barkelew diagram’, the reactor is considered as insensitive to small fluctuations. If the calculated couple (S, N/S) is situated under the curve, runaway is considered to be likely to occur [3].
In order to quantify the rate coefficient k*, calculated at the reactor temperature Tr, the real reaction rate at the inlet of the reactor (see Equation (17)) and the first-order reaction rate are set to be equal. This can be done since the total oxidation of propane is modeled in an excess of oxygen [21]. In order to meet the dimensions in Equation (26), this rate coefficient k* is given by Equation (27):
Since the total oxidation reaction rate, , is a monotonically decreasing function of the propane conversion, the highest value for is obtained at the inlet conditions. In addition, at the reactor inlet, the highest effectiveness factor, η, is obtained. Putting all the information together, Equation (26) gives the minimum value for N, and it is this value that is required for interpretation of the Barkelew diagram (see Section 4.3.3).
Morbidelli and Varma [13] define the so-called ‘hotspot’ as the maximum in the temperature versus axial position profile, and runaway operation occurs only when those hotspots are accompanied by a positive second derivative in this profile before the reactor temperature reaches its maximum value, i.e., at the hotspot. Equivalently, runaway occurs when an inflection point is observed before the maximum in the temperature versus axial position profile.
It can be mentioned that the purpose of this paper is not to investigate all runaway criteria. The Barkelew approach is interpreted with respect to a fully developed Langmuir–Hinshelwood reaction rate, rather than a simplified first-order or pseudo-first-order reaction rate expression. For other possible approaches, one is referred to the excellent work of Szeifert et al. [41], describing design diagrams for methanol synthesis where the runaway boundaries are defined based on Lyapunov’s indirect method; Casson et al. [42] and Vianello et al. [43], applying runaway criteria to define alarm and onset temperatures; and Kummer and Varga [44], using thermal runaway criteria as nonlinear constraints to define the optimal feeding trajectory in the operation of semi-batch reactors.
Lastly, it can be noted that the Barkelew criterion can be applied for any exothermic reaction, where the compound properties (reaction enthalpy to calculate the heat produced during reaction and the specific heat capacity) and reactor operational properties (such as inlet molar fraction, reactor diameter, overall heat transfer coefficient, bed porosity, particle porosity, and catalyst density) must be properly substituted in Equations (25) and (26). Furthermore, the calculation of the reaction rate coefficient needs to be performed based on the actual kinetic model and the specific value of the effectiveness factor (along the reactor axis) (see Equation (27)).
4. Results and Discussion
4.1. Reactor Dimension and Operation Conditions
The reactor and catalyst dimensions as well as the operating conditions for a base case (benchmark) are mentioned in Table 1. In order to guarantee the safety of the plant, the inlet molar fraction of VOC is allowed to be 25% of the lower explosion limit (LEL) at the maximum [45]. For a typical reactor temperature of 648 K, the LEL of propane in air is 0.015 and hence an inlet molar fraction 0.0037 is taken in the base case. A total molar inlet flow rate of 26.6 mol s−1 is applied, corresponding to typical molar flow rates in total oxidation applications of VOC [45]. The oxygen source is air, which is freely available. Simulations are performed with 0.10 carbon dioxide and 0.10 water in the feed, which mimics the composition of typical industrial waste gases [46,47]. The catalyst particles have a cylindrical shape with average diameter 1.86 × 10⁻³ m and average height 4.67 × 10⁻³ m, from which an equivalent diameter dp is calculated as 2.33 × 10⁻³ m (see Appendix A). The bed porosity, εb, and the catalyst particle, εp, are experimentally determined as 0.47 and 0.62 (see Appendix B). For completion, all symbols used in this work are mentioned in Appendix C.
Using the specific area of the catalyst, 1.60 × 10+5 [48], the pore radius inside the catalyst particle, rp, is determined as 6.34 × 10⁻⁹ m [15]. The total catalyst mass loaded in the tubular reactor is 4565 kgcat. Within the permissible limits for the reactor temperature (see Section 2.4), the catalyst is known to operate without deactivation [48].
4.2. Base Case
Corresponding to the base case conditions (see Table 1), the outlet propane conversion gives a maximum remaining propane mole fraction of 1.85 × 10⁻⁹ , corresponding to a concentration of 0.32 mg m−3, which is a good accomplishment compared to the European emission limit for solvent use, 2.0 mg m−3 [49].
Using the Prater relation (10), the temperature increase inside the pellet amounts to 0.1 K at its maximum in the performed simulations. Hence, the main transport resistance inside the catalyst pellet is due to mass transfer, in accordance with the literature [3]. In the next section, the main results of the base case simulation are compared to those obtained by variation in inlet and operation conditions.
4.3. Variation of Inlet Conditions and Runaway Behavior
4.3.1. Total Inlet Pressure
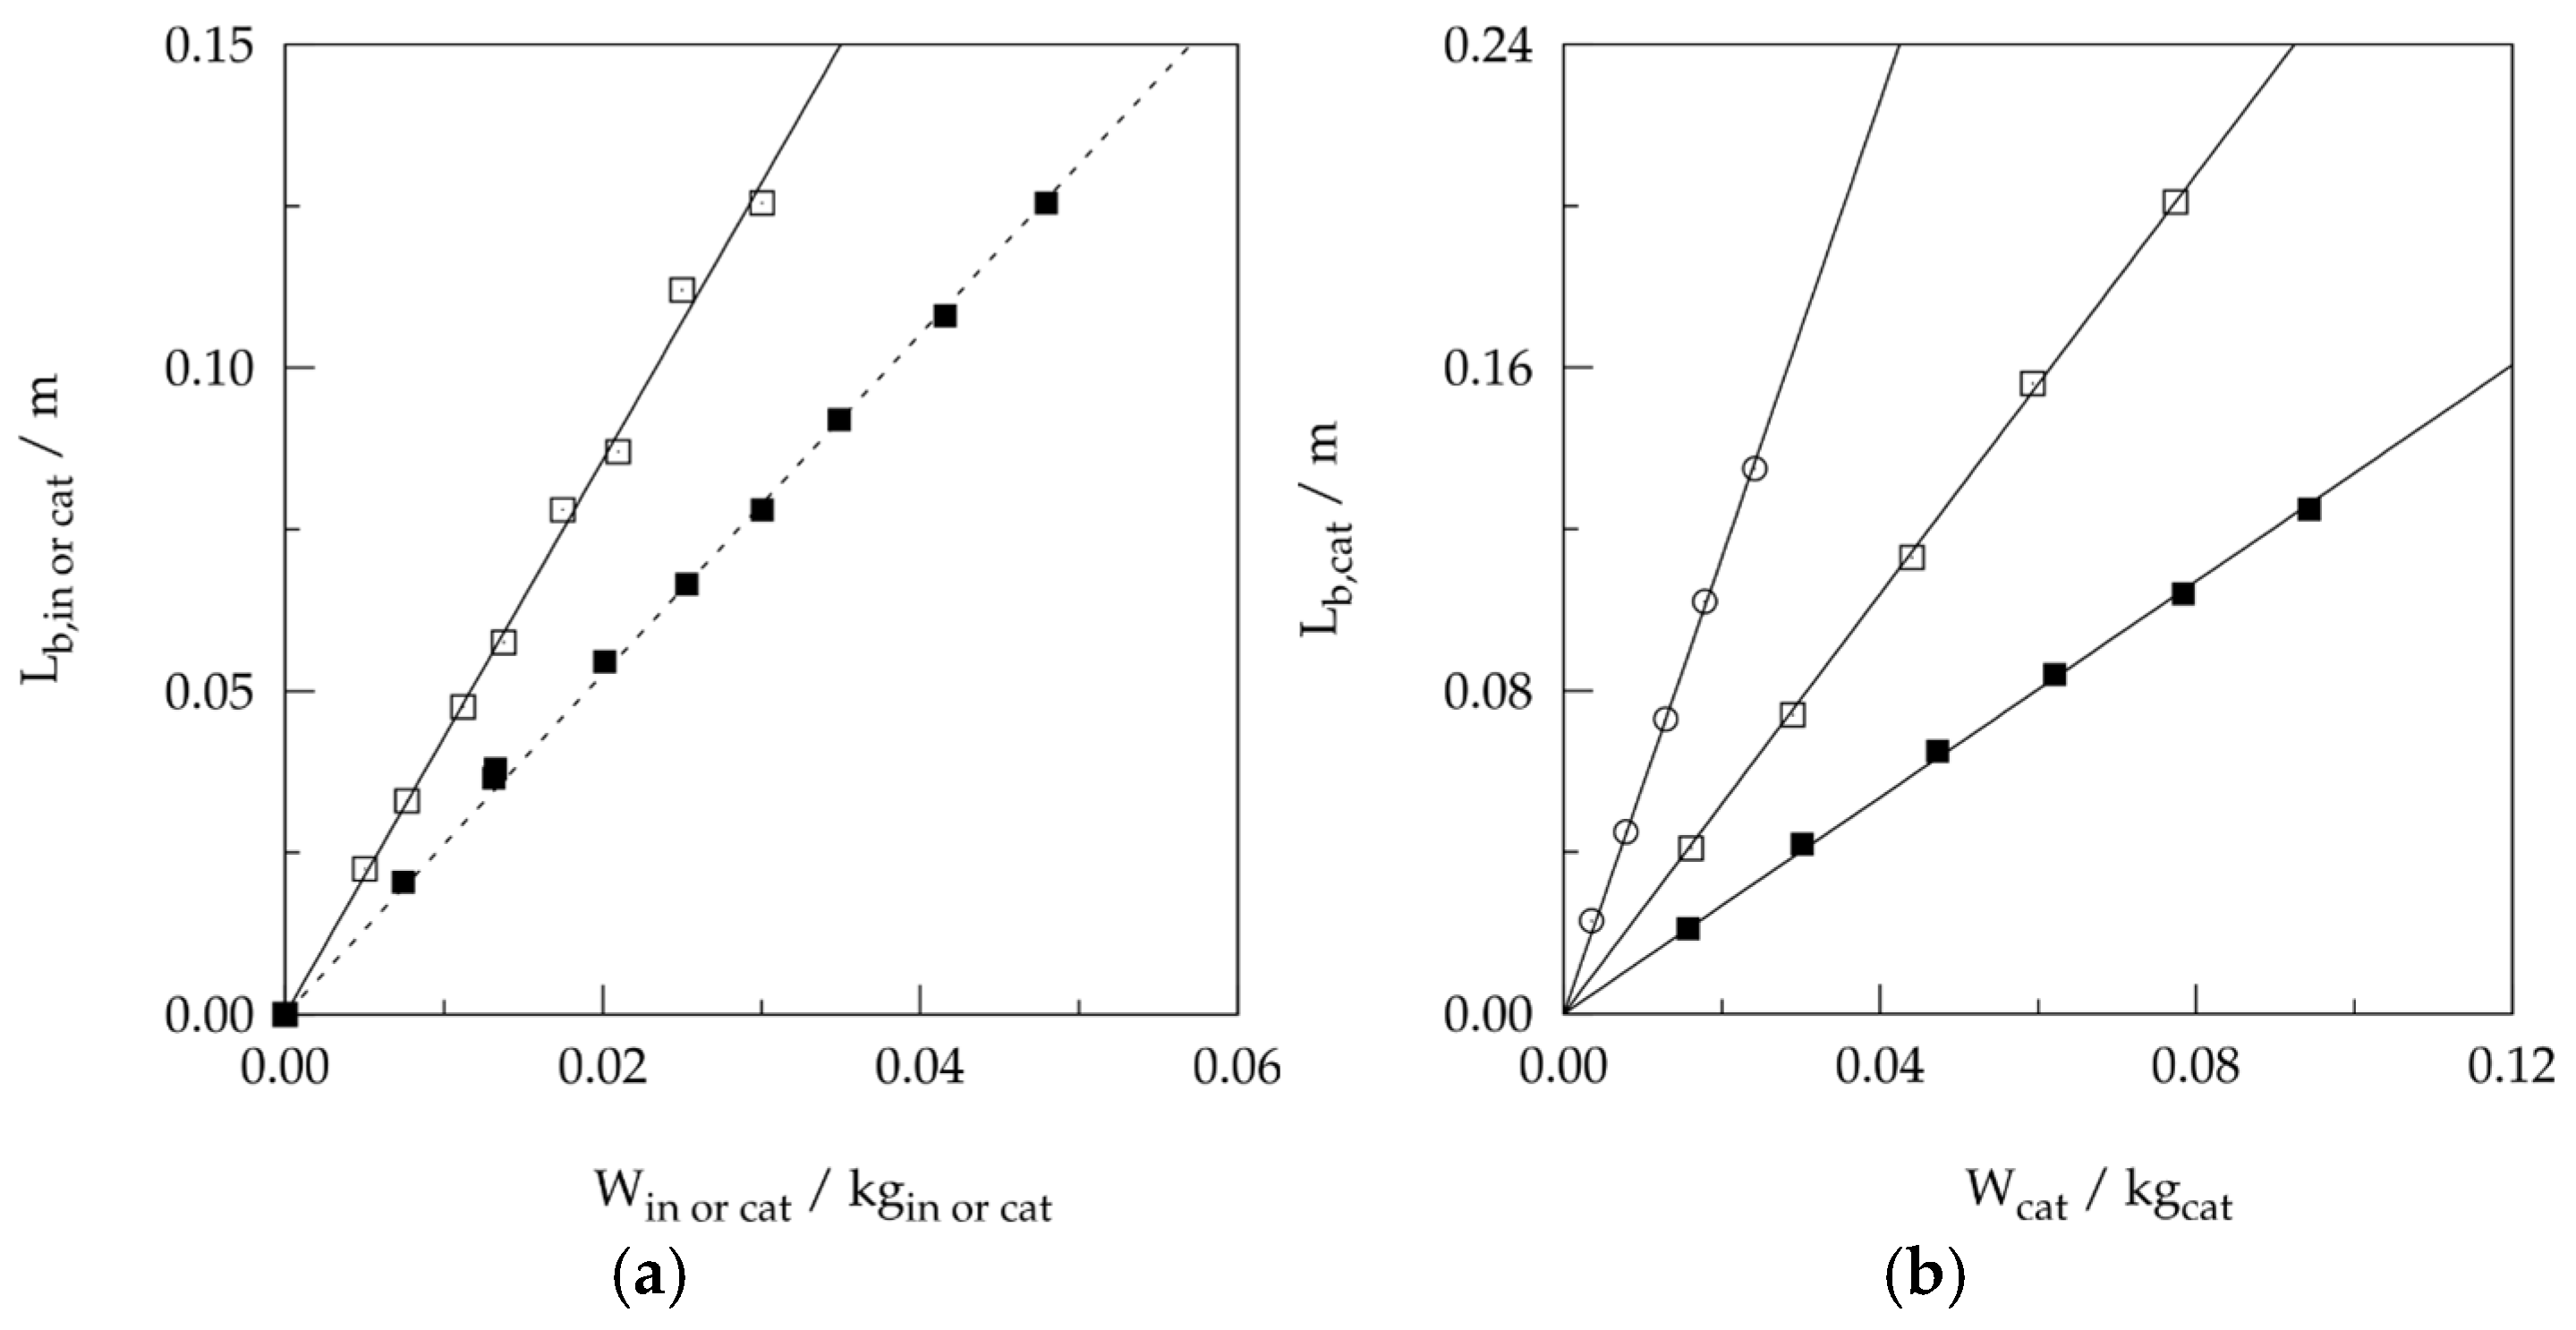
Figure 1 gives the pressure drop over the tubular reactor versus the total inlet pressure for different inlet molar flow rates. The total inlet pressure in the base case is tuned to have atmospheric pressure at the reactor outlet (see Section 4.1). For an identical inlet total molar flow rate, the pressure drop decreases as the total inlet pressure increases. This is expected from Equation (3), since f ~ pt and us ~.
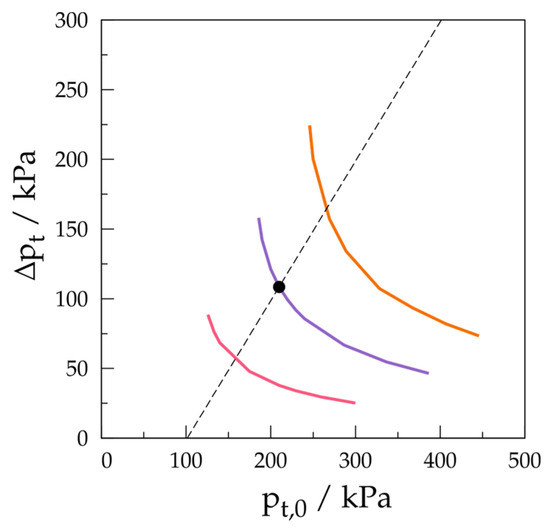
Figure 1.
Pressure drop vs. total inlet pressure, obtained by integration of Equations (1)–(3) at base case conditions (see Table 1), with variation of the total inlet molar flow rate and total inlet pressure. (▬) Ft,0 = 16.6 mol s−1; (▬) Ft,0 = 26.6 mol s−1; (▬) Ft,0 = 36.6 mol s−1. Dashed line corresponds to atmospheric outlet pressure. (●) base case.
As a result, for an identical inlet total pressure and a higher inlet total molar flow rate, a higher pressure drop is obtained. This is due to the increased superficial velocity, us (see Equation (3)). A very steep decrease in the simulated reactor pressure is observed once this pressure falls below the atmospheric value (corresponding to operation in suction mode).
4.3.2. Inlet Temperature
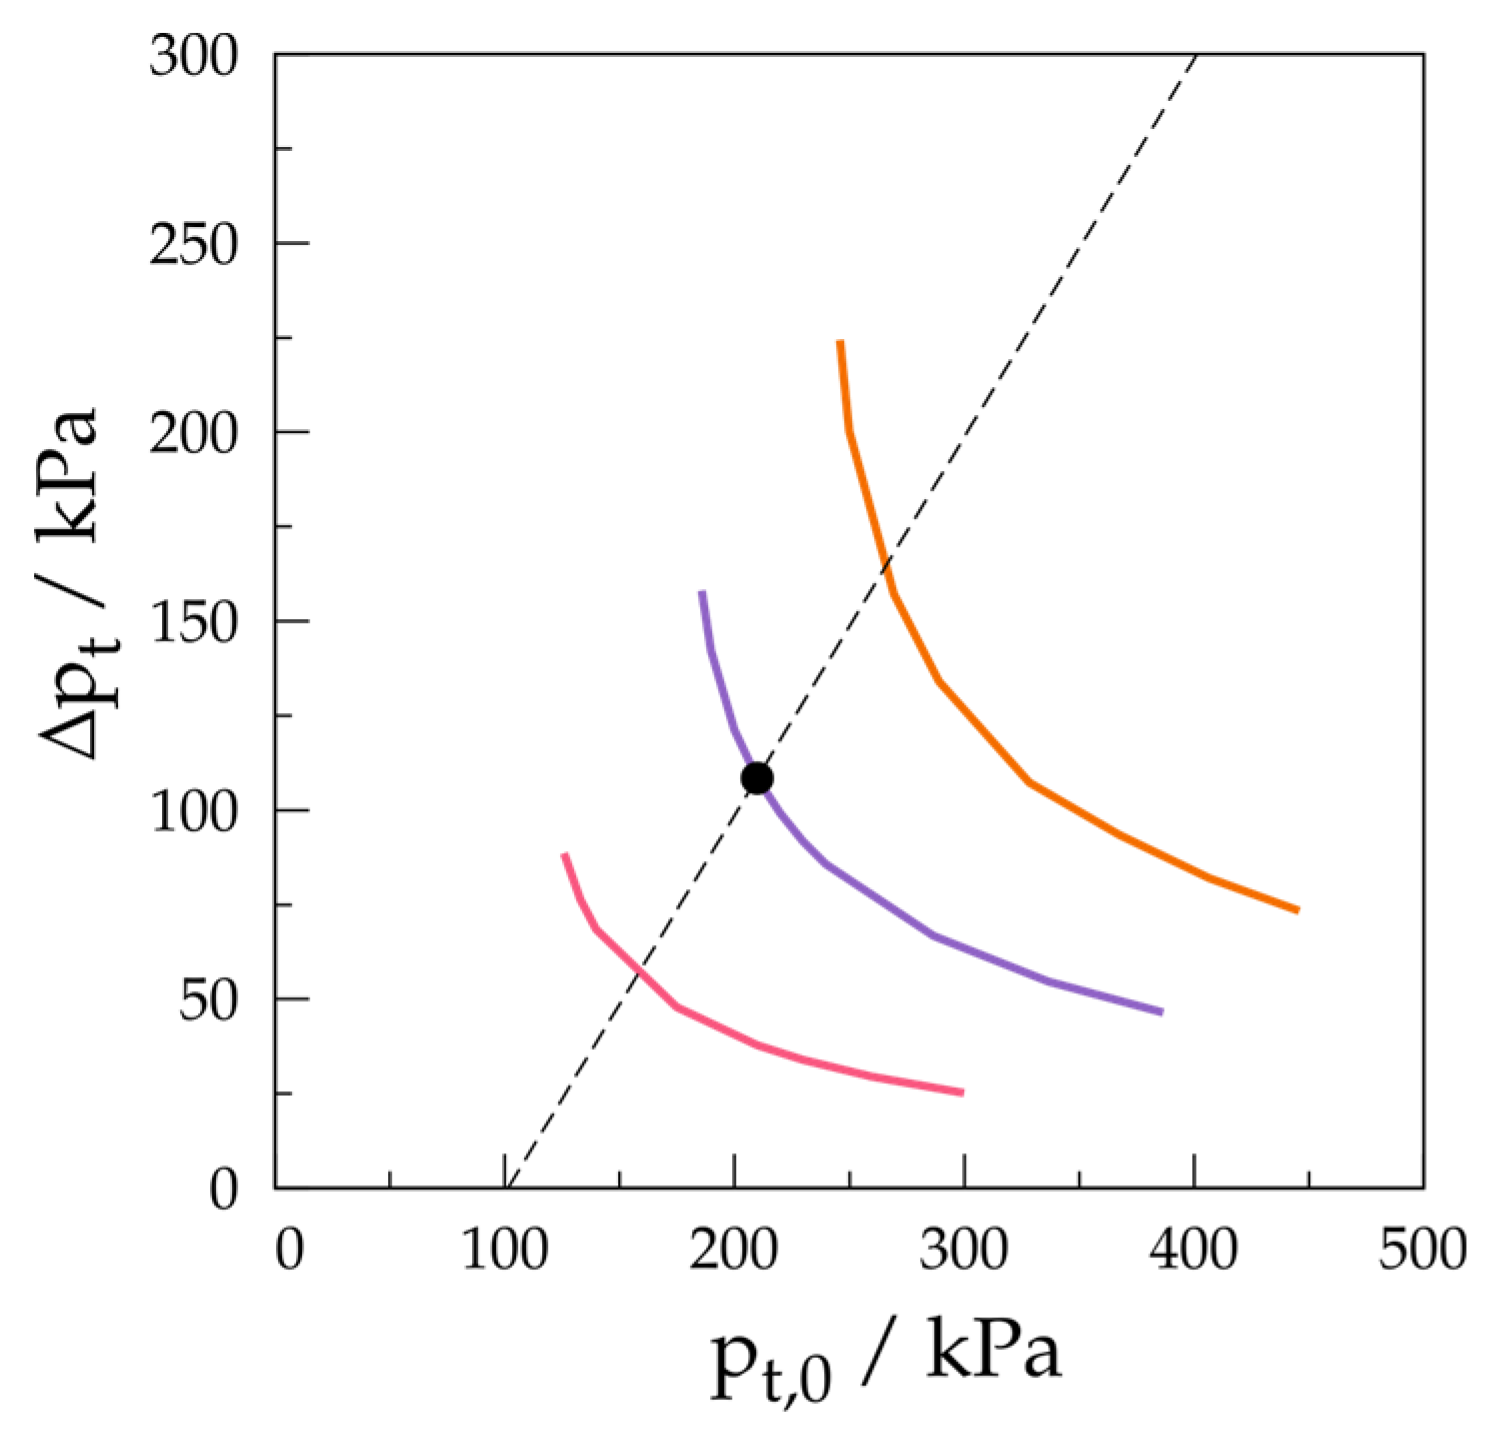
The effect of gas inlet phase temperature is not very pronounced (see Figure 2): the maximum reactor temperature for the lowest inlet temperature of 298 K amounts to 663 K, whereas a hotspot of 667 K is obtained for an inlet temperature of 598 K. These results indicate that no additional heat exchanger before the reactor to heat up the incoming feed needs to be considered. The first part of the reactor works as a very efficient heat exchanger, and it sufficiently allows buffering variations in inlet temperature. It is calculated that the outlet propane mole fraction is not significantly affected by the inlet gas phase temperature, and a similar outlet propane concentration (see Section 4.2) is obtained.
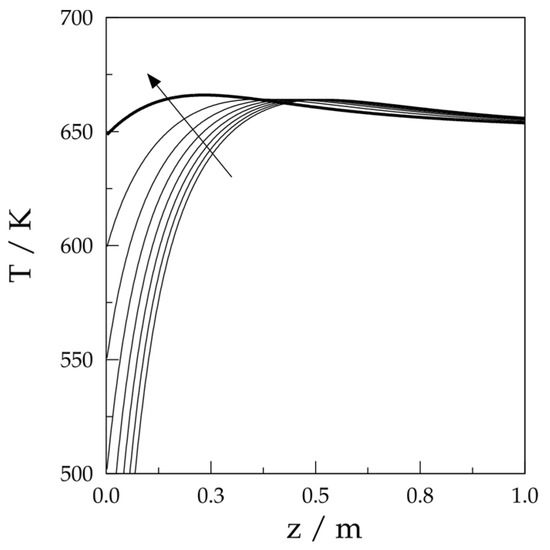
Figure 2.
Gas phase temperature vs. axial reactor coordinate, obtained by integration of Equations (1)–(3). Simulations are performed at (▬) base case conditions (see Table 1), with variation of the inlet gas temperature ranging from 298 to 648 K, indicated by the arrow.
4.3.3. Propane Inlet Molar Fraction
For the base case, a maximum reactor temperature increase of 16 K is observed. An increase in the propane inlet molar fraction from 0.0017 to 0.0127 increases the results in a higher hotspot temperature (see Figure 3a). When the propane inlet molar fraction exceeds the critical value for runaway to occur, the temperature increase rockets up to 300 K.
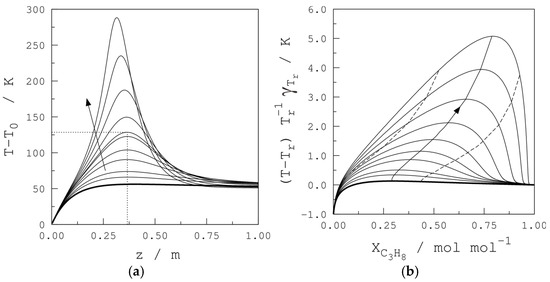
Figure 3.
(a) Temperature vs. axial reactor coordinate, obtained by integration of Equations (1) to (3). The dotted line indicates temperature increase and the corresponding axial reactor position for which the propane inlet propane mole fraction is critical, i.e., above this value two inflections point occur before the maximum temperature. (b) Dimensionless temperature (see Equation (28)) vs. propane conversion for increasing propane inlet molar fractions. The full line with arrow and the dashed lines indicate, respectively, the maximum and the inflection point(s) in the temperature vs. axial reactor coordinate profile. Simulations are performed at (▬) base case conditions (see Table 1), with variation of the propane inlet molar fractions from 0.0017 to 0.0127 , indicated by the arrow.
In order to trigger runaway operation under typical conditions, a dimensionless temperature can be defined [5,13] (see Equation (28)). By division of Equation (2) by Equation (1) and integrating the temperature profile along the tubular reactor as a function of the propane conversion, this dimensionless temperature is plotted versus the propane conversion (see Figure 3b).
Morbidelli and Varma [13] showed that runaway behavior occurs when the operating curve (see Equation (28)) is tangent to the curve, i.e., the curve evaluated at the inflection point(s) before the hotspot, vide infra. These observations match with the results from Van Welsenaere and Froment [35]. Nevertheless, these authors used a pseudo-first-order reaction, and they did not update the physical parameters along the axial reactor position (see Section 2.1). In this way, they could determine an analytical expression for the maximum in the inlet partial pressure versus reactor temperature profile, by which a critical inlet partial pressure, and hence inlet molar fraction, was defined.
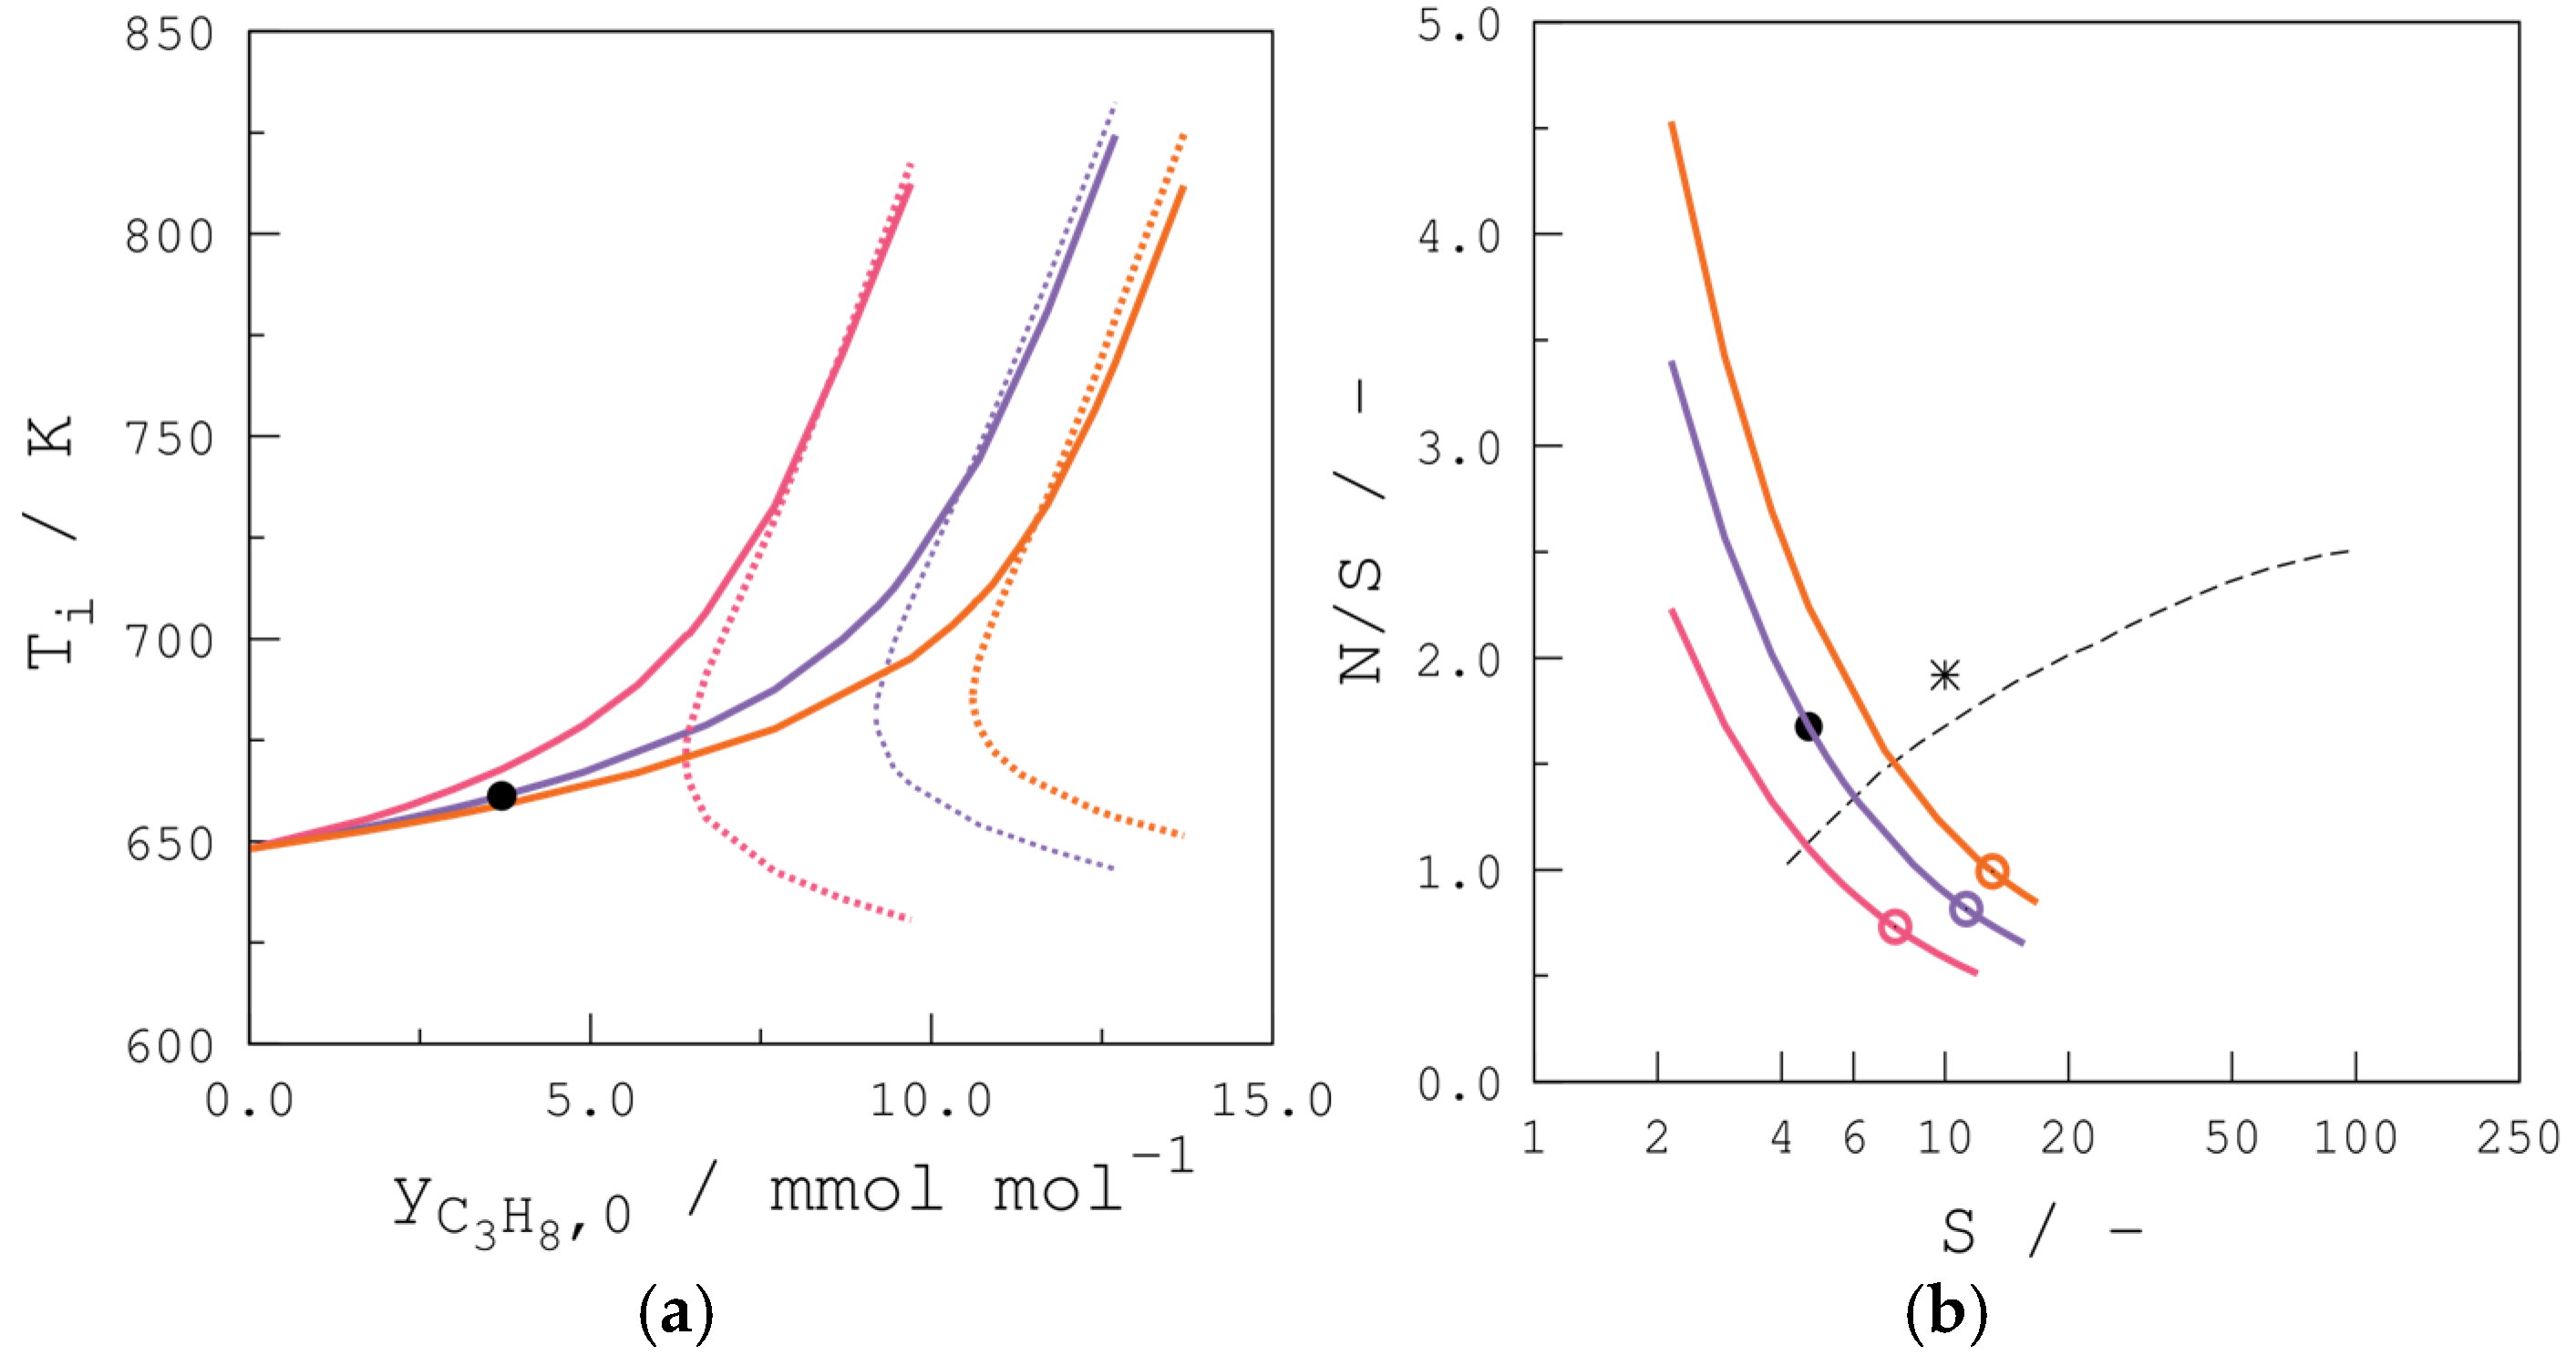
Figure 4a gives the reactor temperatures corresponding to the inflection points in the reactor temperature versus axial reactor coordinate profile. It can be observed that below a certain propane inlet molar fraction, i.e., the critical propane inlet molar fraction, only a single inflection point occurs after the hotspot. The lower the molar inlet flow rate is, the smaller the critical propane inlet molar fraction is for which runaway behavior occurs. A low total molar flow rate corresponds specifically to a low heat transfer, which explains the higher temperature increase in the reactor.
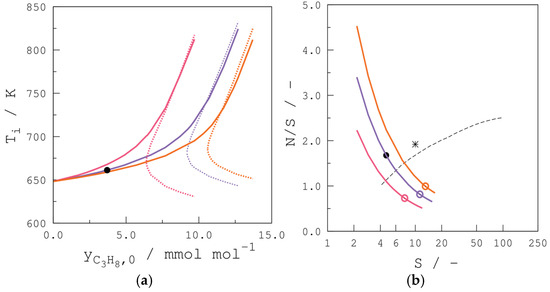
Figure 4.
(a) Temperature corresponding to the inflection point(s) in the reactor temperature vs. axial reactor coordinate profile, vs. propane inlet molar fraction, obtained by integration of Equations (1) to (3). Full lines represent the inflection point after the maximum, whereas the dotted lines correspond to the inflection point(s) before the maximum. (b) Corresponding runaway diagram. Dashed line corresponds to the data given by Barkelew [3,34]. Base case conditions (see Table 1) are applied with variation of total inlet molar flow rate. (▬) Ft,0 = 16.6 mol s−1; (▬) Ft,0 = 26.6 mol s−1; (▬) Ft,0 = 36.6 mol s−1. (●) base case; (*) reference from Froment and Bischoff [3]; (o) (S,N/S) couples corresponding to the critical point, obtained from (a).
In Figure 4b, the (S,N/S) couples (see Equations (25) and (26)) are plotted versus the runaway data, obtained by Barkelew [34]. This author concluded that runaway occurs when the (S,N/S) couple, corresponding to reactor operation, is situated below the dashed line (up to 50% of the Barkelew values, dashed line). From the performed simulation results, it is observed that the lower the total inlet molar flow rate is, the lower the operation point is situated. Furthermore, an increasing propane molar inlet fraction gives a higher value for S (see Equation (25)), whereas the value for N/S decreases (see Equations (25) and (26)), explaining the calculated lines in Figure 4b. The base case is indicated by the symbol ‘●’. A reference point, obtained by Van Welsenaere and Froment in the o-xylene oxidation into phtalic anhydride, is indicated by ‘*’. For every total inlet molar flow rate, the symbol ‘o’ indicates the critical propane inlet molar fraction (see above). Based on the results, presented in Figure 4b, the original curve, proposed by Barkelew [34], can be transposed to lower N/S values for this specific highly exothermic oxidation reaction, so that the reactor can be operated with higher tube diameters; a higher reactor temperature, Tr; or higher propane inlet molar fractions (less dilution required). In other words, the region of reactor stability is bigger for the presented case than the one proposed by Barkelew. Of course, this is a process-dependent action, and hence this result should not be generalized.
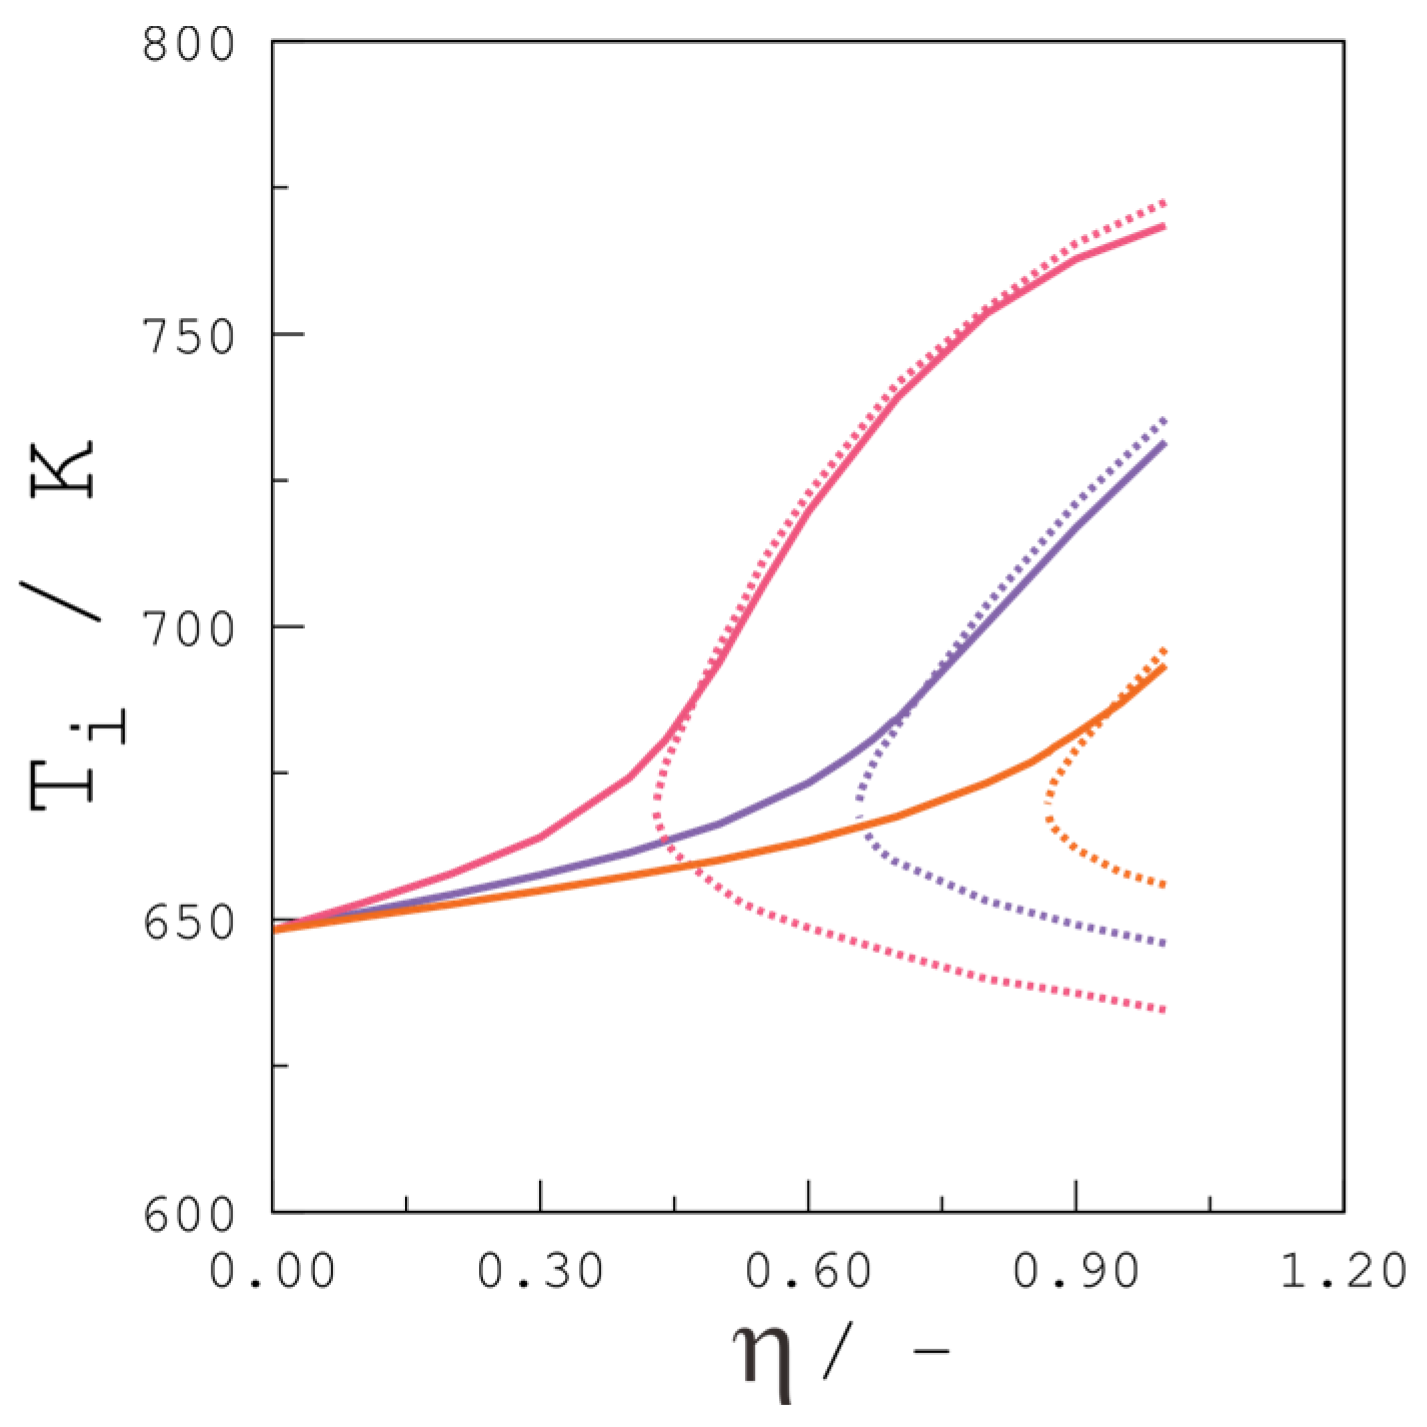
Due to mass transfer inside the catalyst particle, the effectiveness factor will be lower than unity. This results in a higher value for N (see Equation (26)) and allows one to operate the tubular reactor with higher reactor tube diameters or higher inlet concentrations of VOC. de Smet et al. [20] report a temperature underestimation of 200 K in the catalytic partial oxidation of methane to synthesis gas, due to the introduction of a constant effectiveness factor. In order to justify the use of a variable effectiveness factor along the axial position in the tubular reactor, simulation results with constant effectiveness factor are performed (see Figure 5). The same observations can be made as for Figure 4a. When the effectiveness factor is erroneously taken as unity, which corresponds to neglecting intraparticle diffusion resistance, the flow rate apparently needs to be higher or the reactor tube diameter or propane inlet molar fraction smaller, which is not the case. This leads to an incorrect design of the industrial reactor, and hence the latter is not optimally operated.
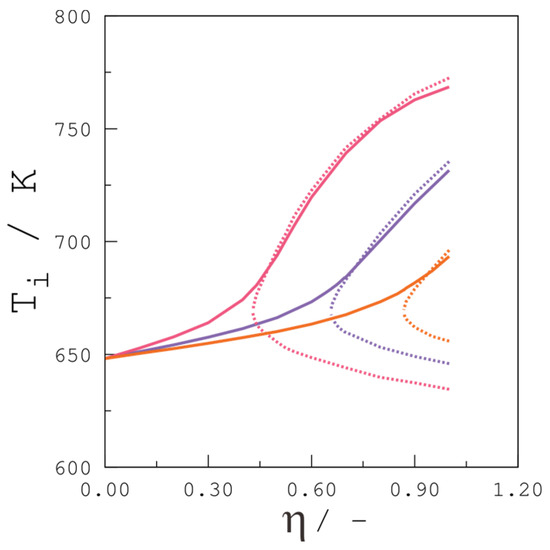
Figure 5.
Temperature corresponding to the inflection point(s) in the reactor temperature vs. axial reactor coordinate profile, vs. effectiveness factor, obtained by integration of Equations (1) to (3). Full lines represent the inflection point after the maximum, whereas the dotted lines correspond to the inflection point(s) before the maximum. Base case conditions (see Table 1) are applied with variation of total inlet molar flow rate. (▬) Ft,0 = 16.6 mol s−1; (▬) Ft,0 = 26.6 mol s−1; (▬) Ft,0 = 36.6 mol s−1.
4.3.4. Reactor Temperature
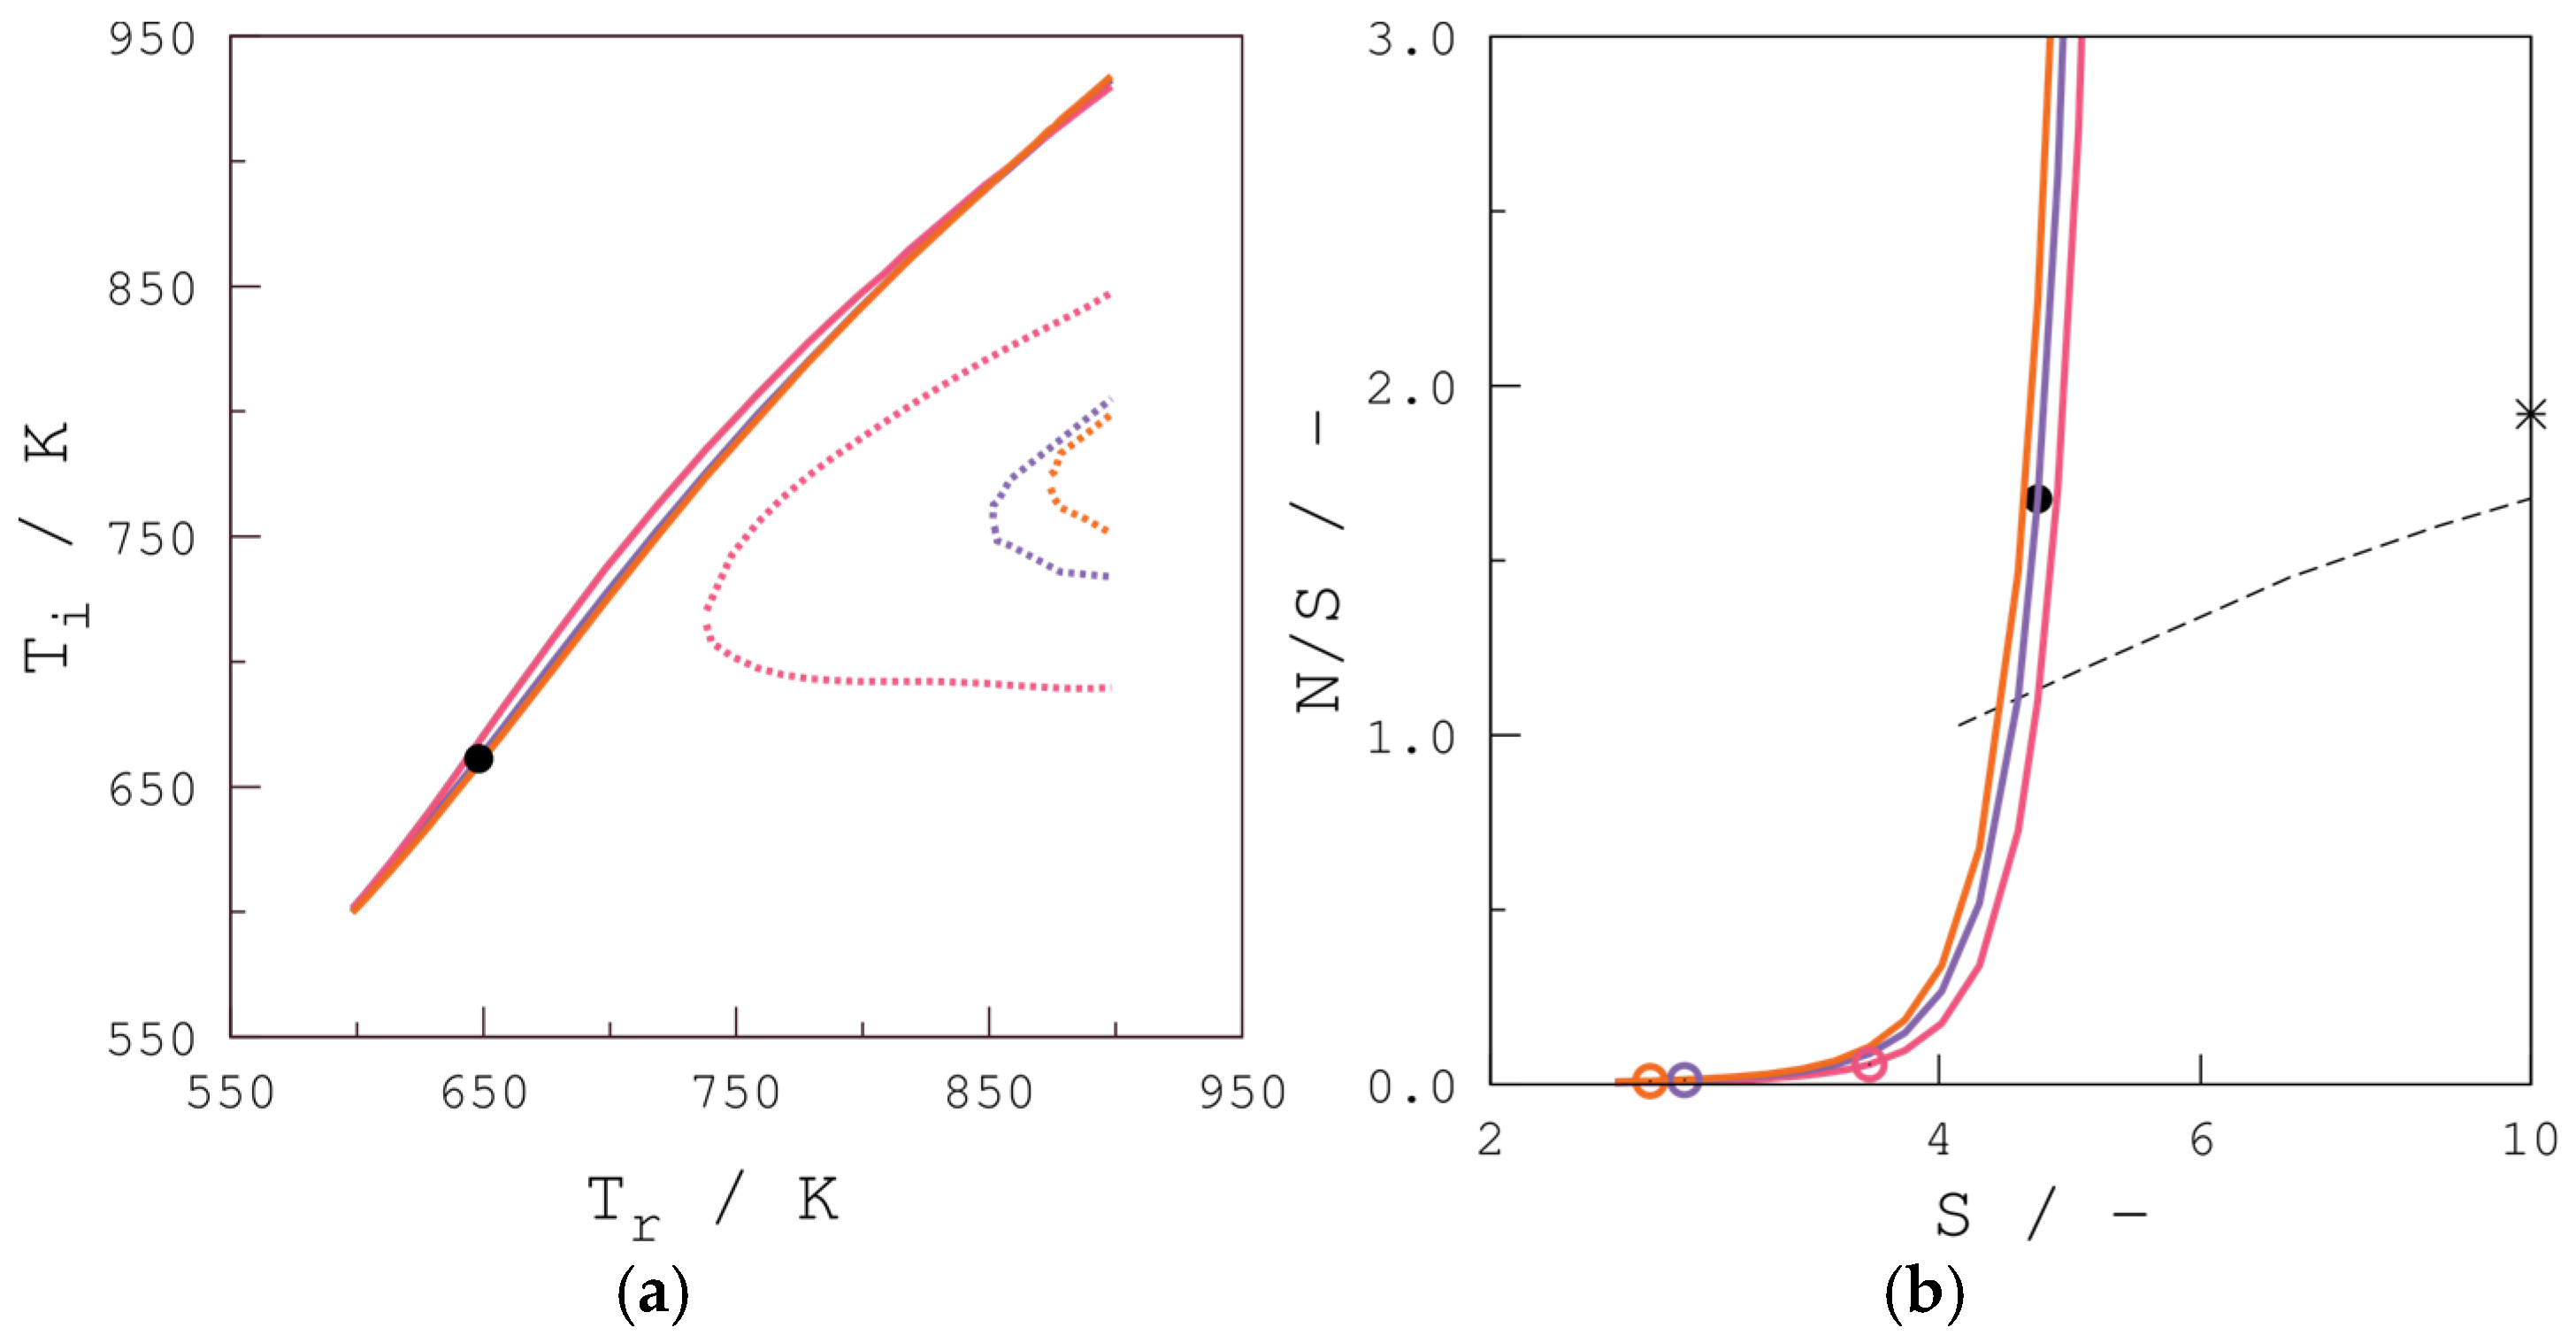
Increasing the reactor temperature, Tr, has essentially the same effect on the propane conversion profile as is depicted for the increase of the propane inlet molar fraction (see Figure 6a,b). From the former, it can be observed that before a certain reactor temperature, only a single inflection point occurs after the hotspot. The same trend is observed as in Figure 4a, although the calculated lines, corresponding to the inflection point after the maximum, nearly coincide. Increasing the reactor temperature results in the presence of three inflection points in the temperature versus axial coordinate profile, and hence runaway behavior occurs. Based on the results in Figure 6b, the original curve, proposed by Barkelew [34], can be significantly transposed to lower N/S values. From a certain value of S, N/S increases very rapidly: a decreasing reactor temperature gives higher values for N and S (see Equations (25) and (26)), explaining the calculated lines in Figure 6b. The same conclusions as in the case of a variable propane inlet molar fraction hold (see Section 4.3.3).
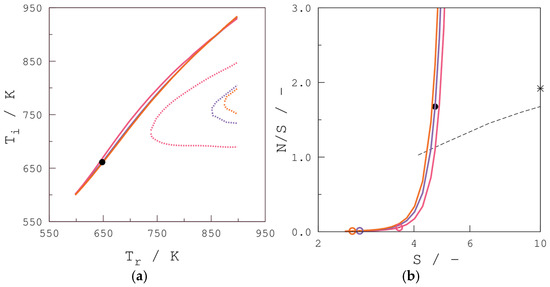
Figure 6.
(a) Temperature corresponding to the inflection point(s) in the reactor temperature vs. axial reactor coordinate profile, vs. reactor temperature, obtained by integration of Equations (1) to (3). Full lines represent the inflection point after the maximum, whereas the dotted lines correspond to the inflection point(s) before the maximum. (b) Corresponding runaway diagram. Dashed line corresponds to the data given by Barkelew [3]. Base case conditions (see Table 1) are applied with variation of total inlet molar flow rate. (▬) Ft,0 = 16.6 mol s−1; (▬) Ft,0 = 26.6 mol s−1; (▬) Ft,0 = 36.6 mol s−1. (●) base case; (*) reference from Froment and Bischoff [3]; (o) (S,N/S) couples corresponding to the critical point, obtained from (a).
Higher reactor temperatures result in possible runaway, whereas lower temperatures will operate the reactor in a safe regime, but a longer reactor is needed in order to obtain the required conversion of propane.
4.3.5. Water Inlet Pressure
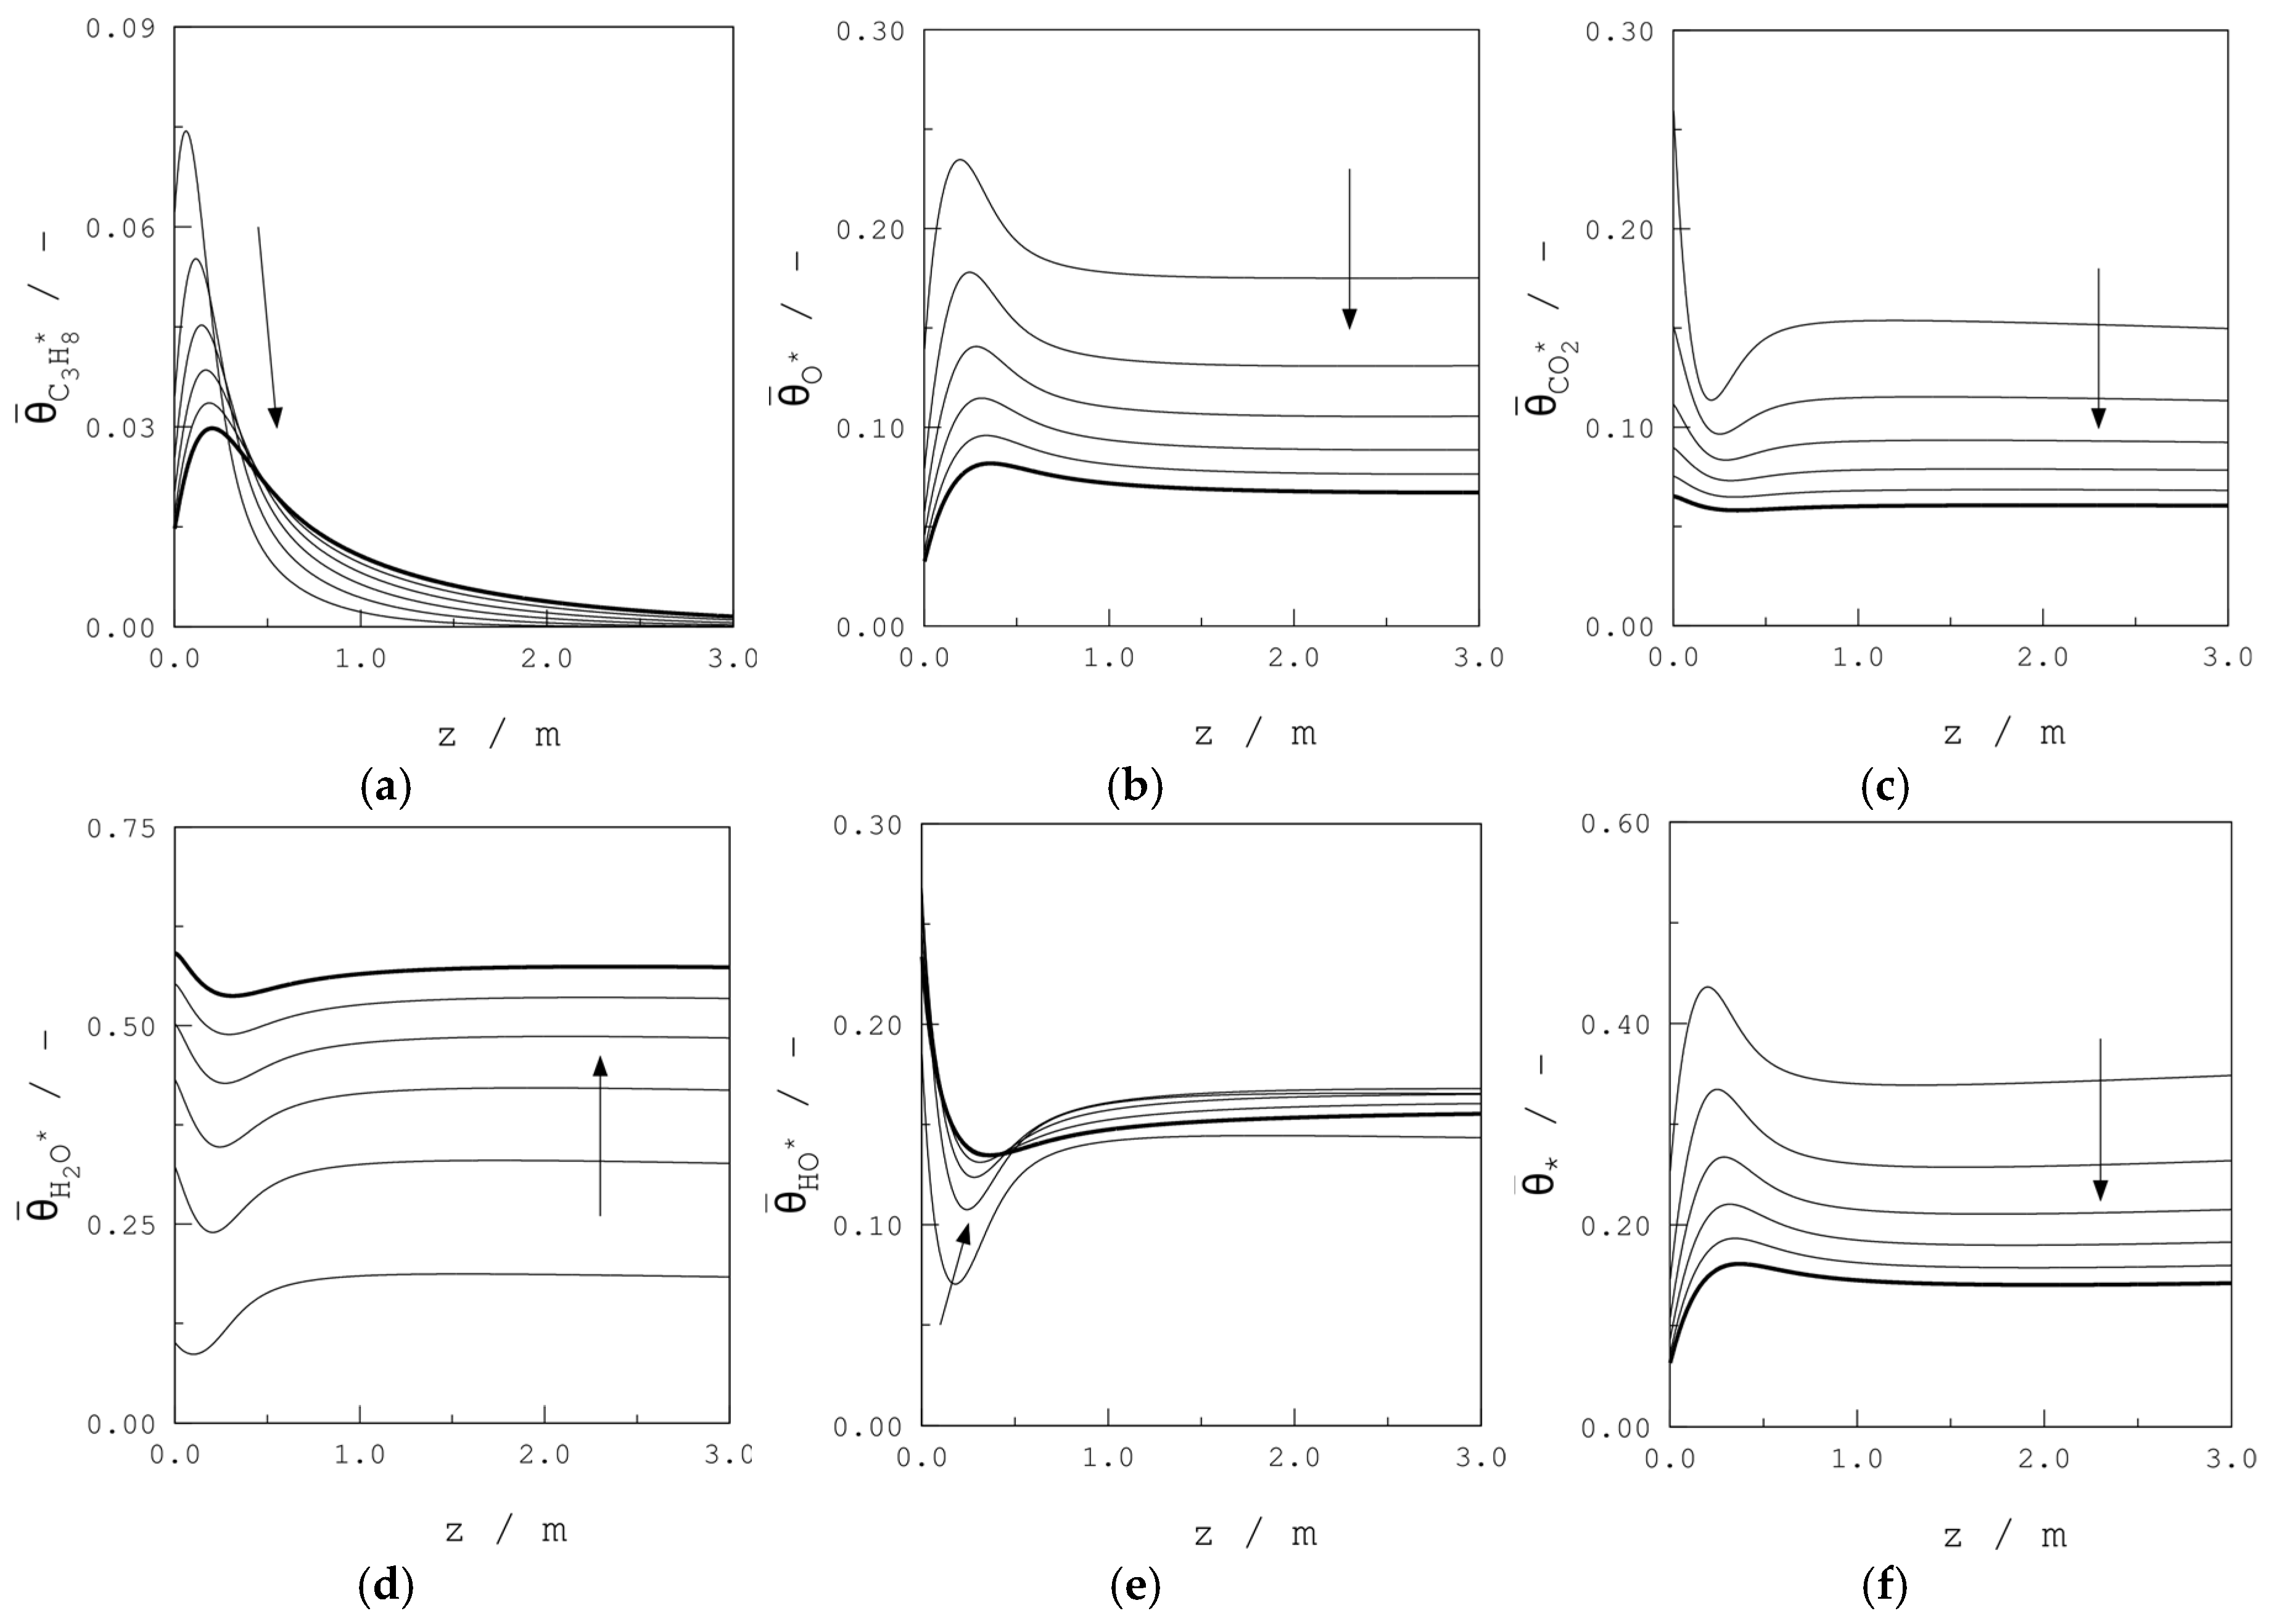
The average fractional coverages of propane, dissociatively chemisorbed oxygen, carbon dioxide, and water are simulated with the base case input data (see Table 1) obtained by the integration of Equations (1) to (3) and application of Equation (24), using Equations (18) to (23). From these results (see Figure 7), it was clear that a rather small fractional coverage of carbon dioxide is present on the catalyst, whereas water occupies the main part of the surface sites. Therefore, the effect of the water inlet molar fraction, going from 0.00 to 0.10 on the fractional coverages, is evaluated by means of plotting the average fractional coverages along the reactor axis for different values of .

Figure 7.
Average fractional coverages vs. axial reactor coordinate, obtained by integration of Equations (1) to (3) and application of Equation (24), using Equations (18) to (23): (a) propane; (b) oxygen; (c) carbon dioxide; (d) water; (e) hydroxyl species; (f) free active sites. Simulations are performed at base case conditions (▬) (see Table 1), with an increasing, indicated by an arrow, water inlet molar fraction from = 0.00 up to 0.10 .
From Figure 7a,b, it is observed that the fractional coverages of propane and oxygen are halved for a water inlet molar fraction of 0.10 compared to the simulation results without water in the feed. The sum of the fractional coverage of both reactants is maximally 30% of the catalyst surface. Figure 7c,d give the fractional coverage of the reaction products. The carbon dioxide fractional coverage ranges from 15 to 5% for an increasing water inlet molar fraction. Due to the temperature, the conversion profile along the reactor, and the quasi-equilibrium adsorption for carbon dioxide (see Table 3), the curve goes through a minimum. This is less pronounced when the water inlet molar fraction increases. From Figure 7a–d, it is clear that the fractional coverages for propane, oxygen, and carbon dioxide significantly decrease as the water inlet molar fraction increases, which points to a strong adsorption of water onto the catalyst surface [17]. Again, for the same reason, a minimum in the average water fractional coverage is observed. Under typical industrial conditions (see Table 1), it is observed that along the tubular reactor, approximately half of the active catalyst surface is covered with water. For the average fractional coverage of hydroxyl species, the same conclusion holds as in the case of the other reaction products (see Figure 7e). The average fractional coverage of the free active sites decreases from 35 to 10% for an increasing water inlet molar fraction (see Figure 7f).
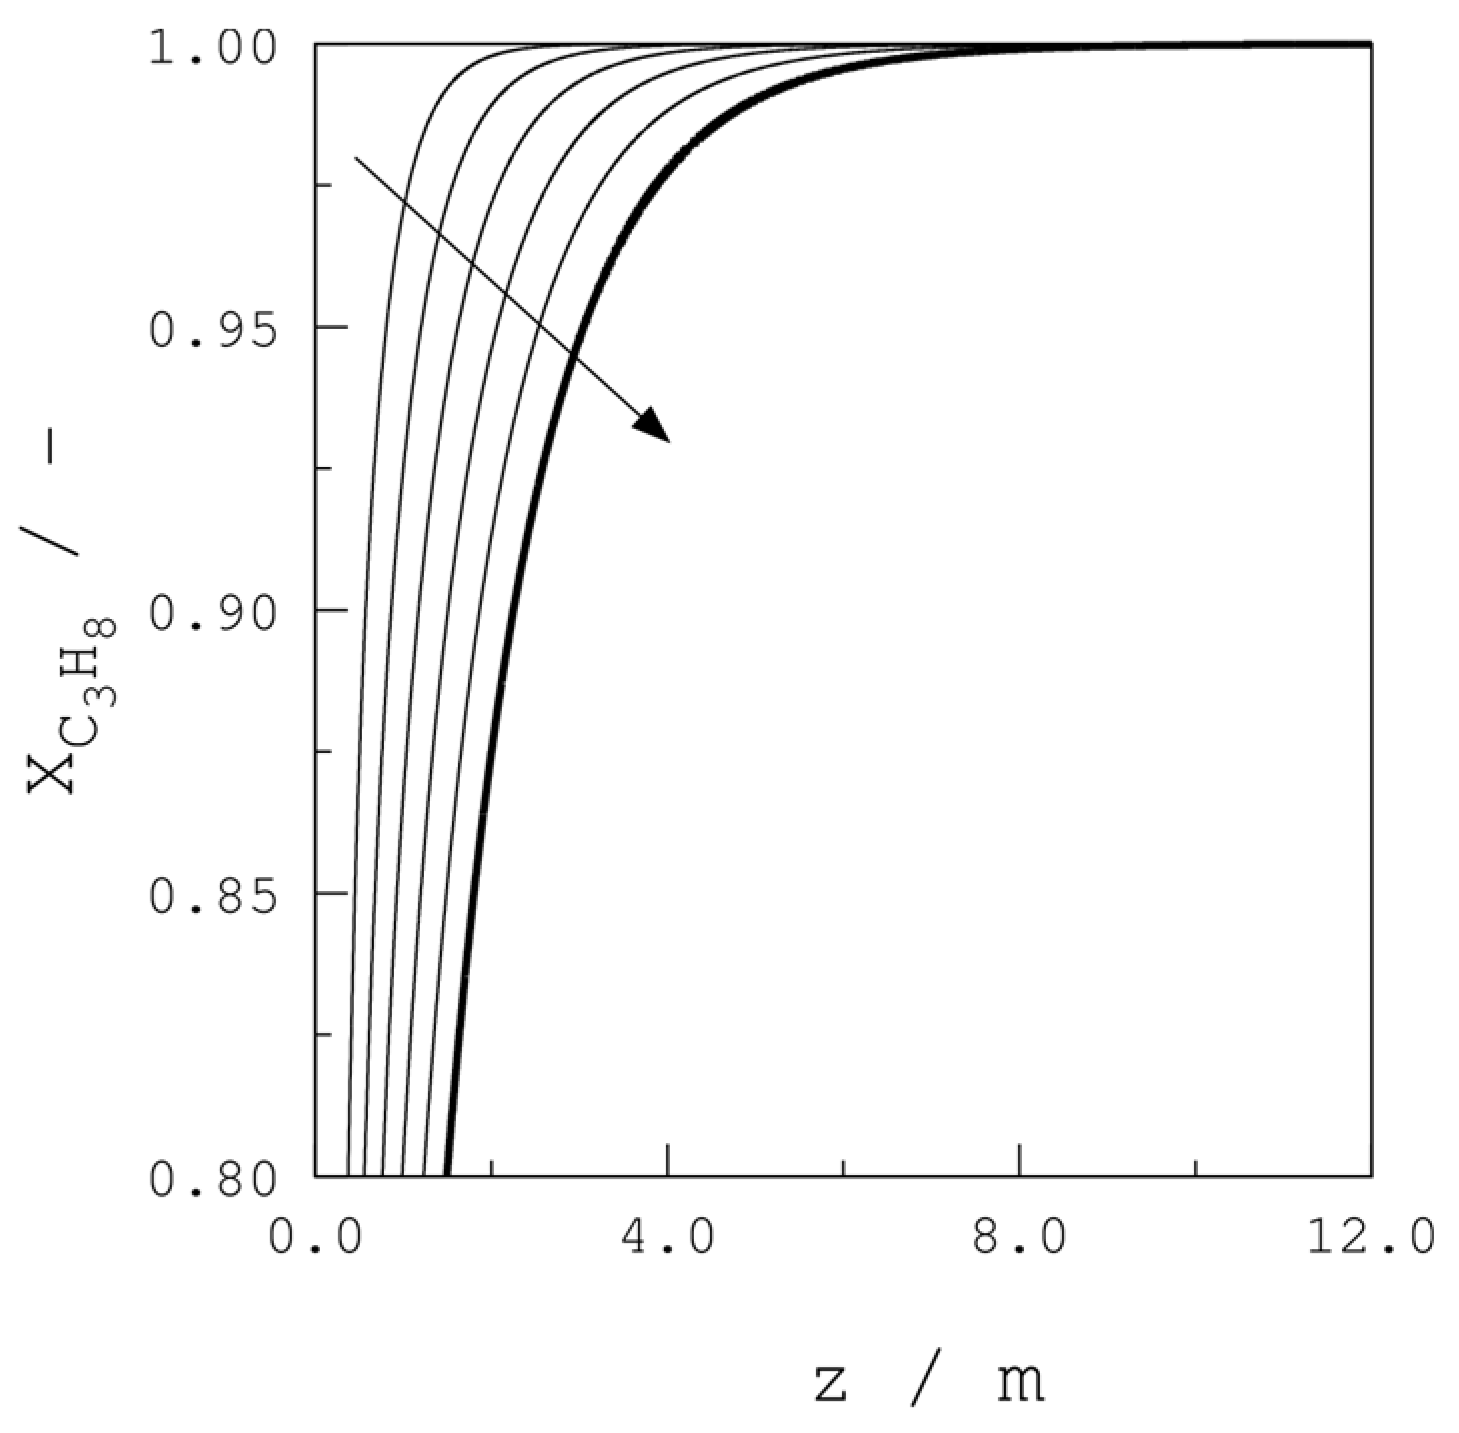
Full propane conversion should be obtained at the end of the reactor. Even with 0.10 , an outlet propane concentration of 0.32 mg m−3 (see Section 4.2) is obtained. Nevertheless, it takes a higher reactor length to obtain an identical propane conversion than in the case where no water is present in the feed (see Figure 8).

Figure 8.
Propane conversion vs. axial reactor coordinate, obtained by integration of Equations (1) to (3) at base case conditions (see Table 1), with an increasing variation, indicated by an arrow, of the water inlet molar fraction, ranging from 0.00 up to 0.10 . (▬) base case condition.
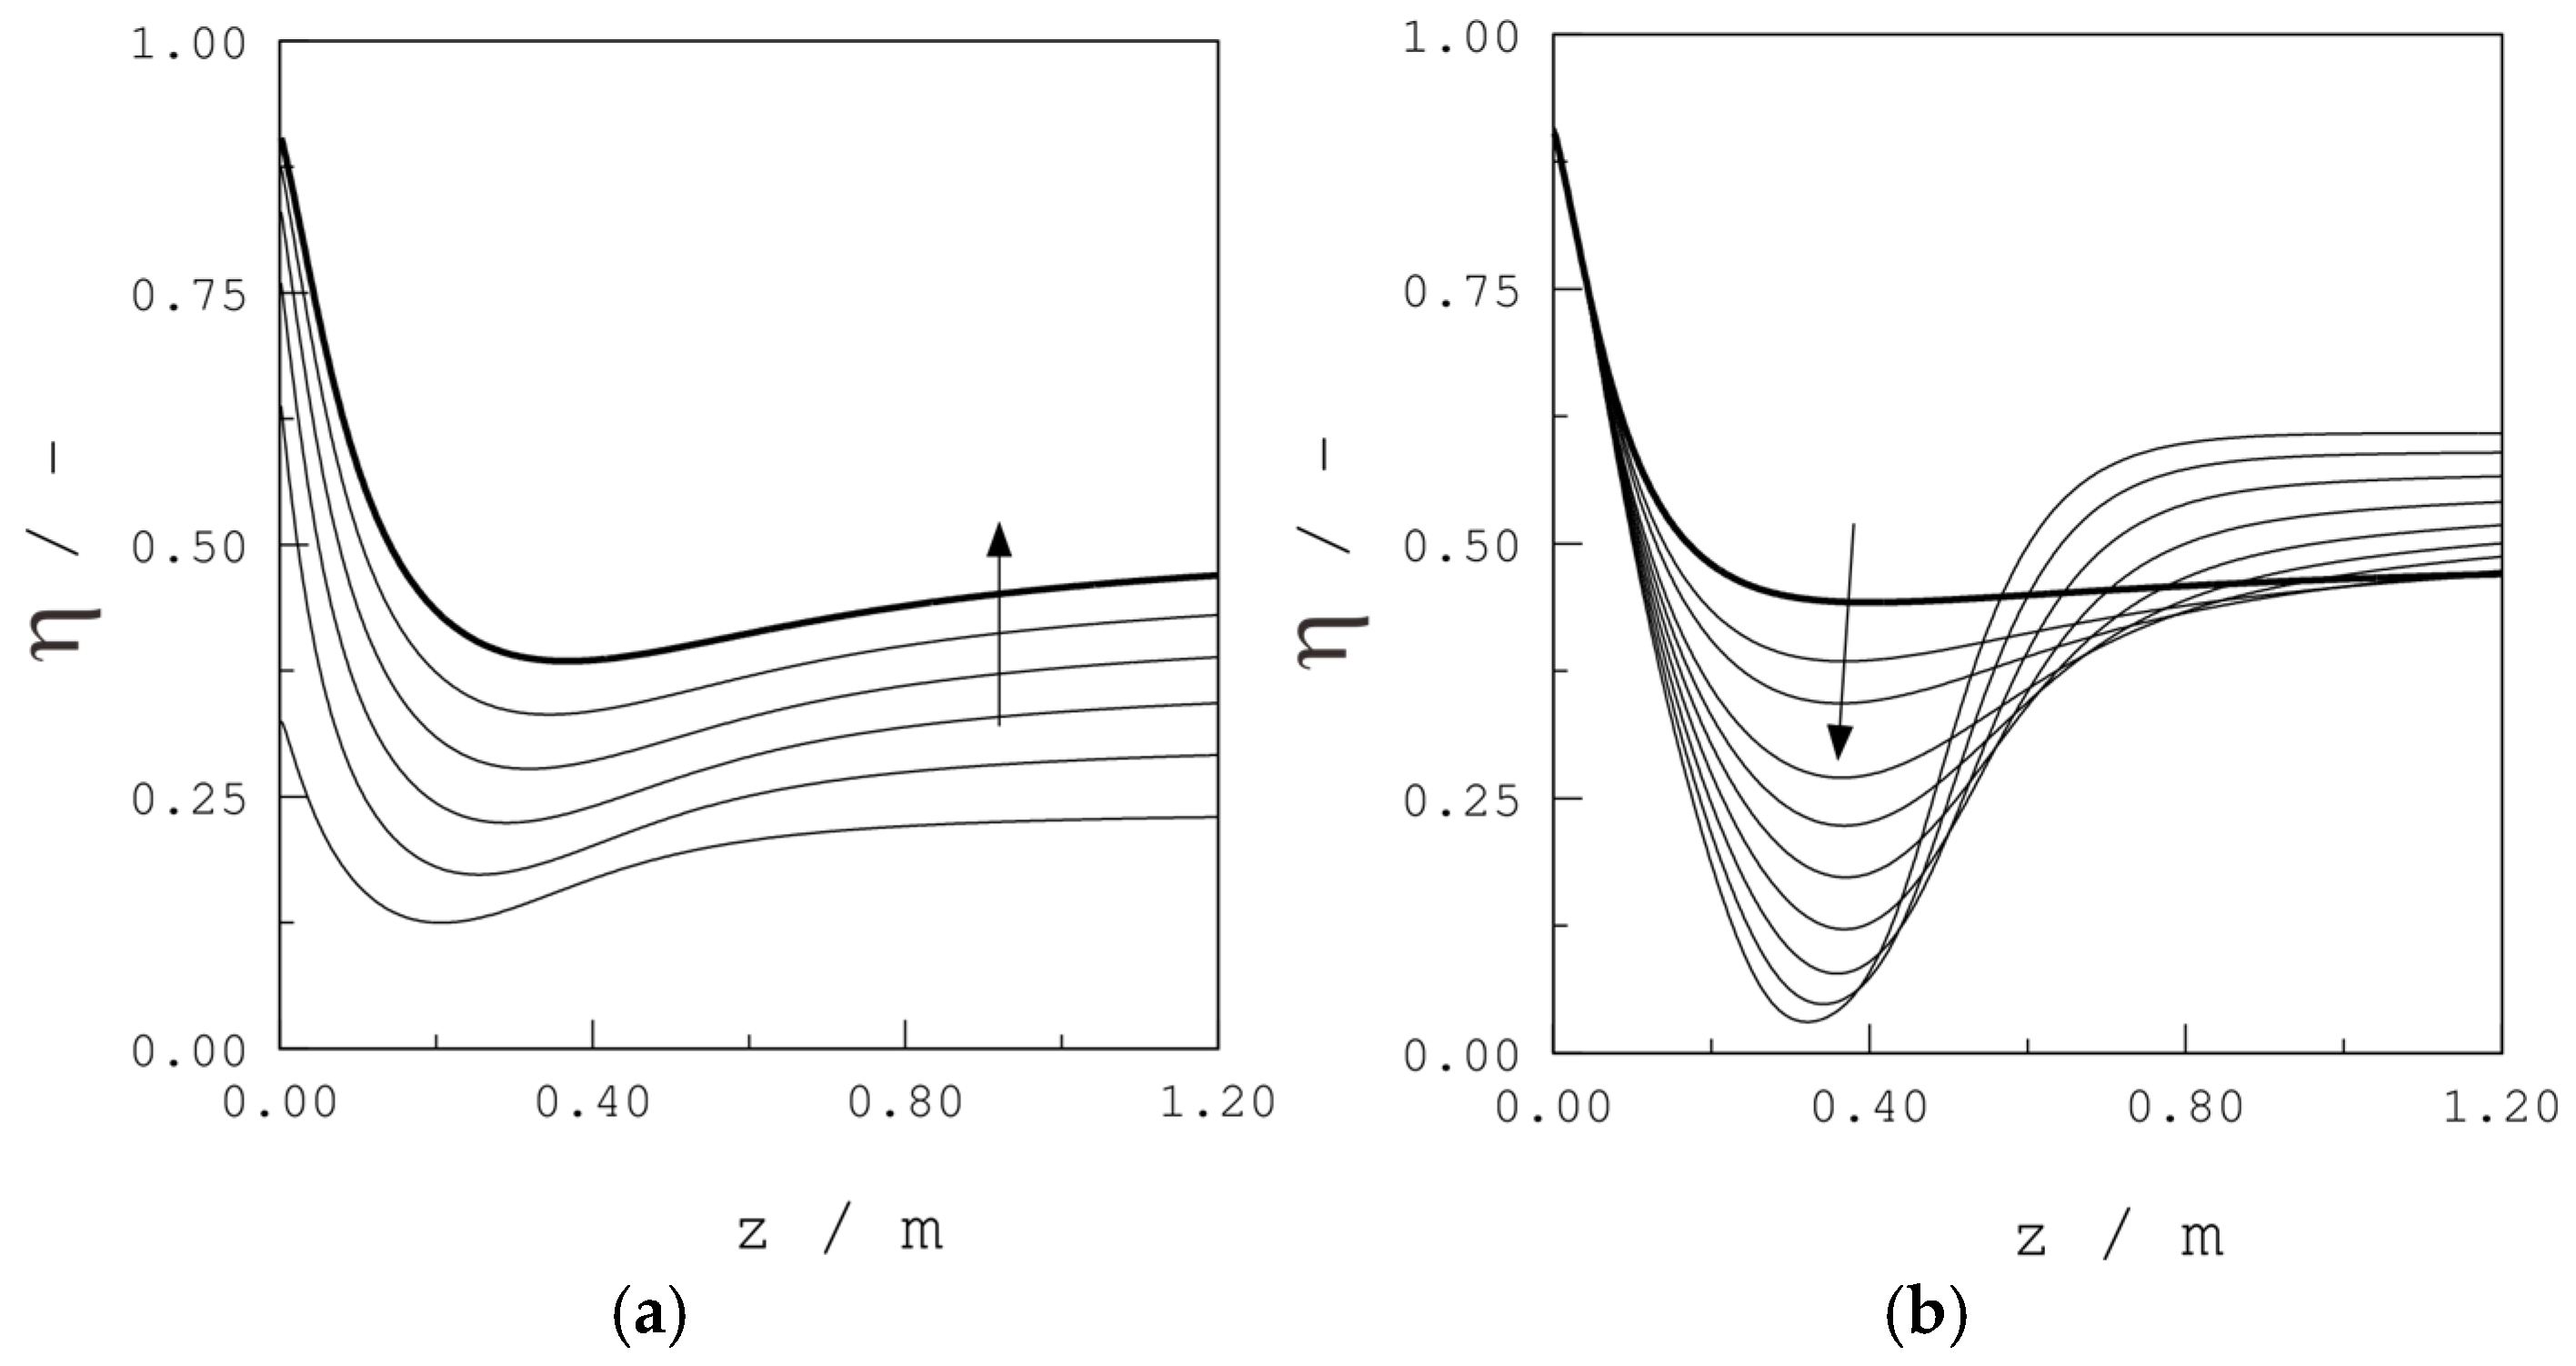
The effect of the water and propane inlet molar fractions on the effectiveness factor is evaluated in Figure 9a,b. The former describes the effectiveness factor along the reactor axis for an increasing water inlet molar fraction. This factor increases as the water content increases, indicating that the presence of water weakens the effect of diffusion limitations on the reaction rate (see Section 2.1). In other words, with an increasing water content, the reaction rate will be slowed down, since the reaction rate expression contains an important water adsorption factor in the denominator [17]. As a consequence, the corresponding temperature rise will be less pronounced, giving rise to smaller diffusion effects, and this results in a smaller difference between the reaction inside the catalyst pellet and the reaction at surface conditions (while the actual reaction rate is slowed down).
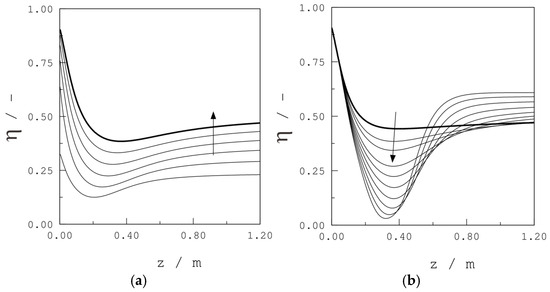
Figure 9.
Effectiveness factor vs. axial reactor coordinate. Simulations are performed (a) for an increasing, indicated by an arrow, water inlet molar fraction ranging from 0.00 up to 0.10 and (b) for an increasing, indicated by an arrow, propane inlet molar fraction from 0.0017 up to 0.0127 by integration of Equations (1) to (3) and application of Equations (8) and (9). The highest water inlet molar fraction and lowest propane inlet molar fraction of 0.0037 correspond to the (▬) base case condition (see Table 1).
Figure 9b shows that an increasing propane inlet molar fraction results in a steeper initial decrease of the effectiveness factor along the reactor axial coordinate. For the highest propane inlet molar fraction (i.e., 0.0127), a very low value for the effectiveness factor of 0.03 is observed at a reactor length of 0.32 m. This is related to the hotspot temperature increase of 238 K.
5. Conclusions
A tubular reactor for total oxidation reaction under typical industrial conditions in the removal of volatile organic components (VOC) is described using a one-dimensional steady-state heterogeneous reactor model with propane as the model hydrocarbon compound using a fully developed Langmuir–Hinshelwood kinetic model. The effectiveness factor, accounting for intraparticle diffusion limitations, is calculated with a generalized Thiele modulus. The inclusion of this factor shows that higher operational reactor temperatures can be possible, since this diffusion limitation restricts the heat production inside the catalyst particle. Special attention is given to the outlet concentration of propane, taken as the model VOC, and runaway criteria, reported in the literature, are critically evaluated. It appears that the criterion based on the data of Barkelew [34] is more severe than the criterion of Morbidelli and Varma [13], which states that runaway takes place when an inflection point occurs before the maximum reactor temperature. This might be verified for other reactions and reactor configurations. Furthermore, the Barkelew criterion is implemented for practical reactor design, as it can be applied for any nonlinear kinetics, and it was concluded that the critical couples populating the Barkelew diagram are positioned significantly lower (up to 50%, compared to Barkelew’s original report), so operation of the reactor under higher hydrocarbon molar inlet fractions is possible while maintaining safe performance.
Author Contributions
P.M.H.: conceptualization, methodology, software, validation, formal analysis, investigation; data curation, writing—original draft preparation, writing—review and editing, visualization. J.W.T.: software, validation, resources, writing—review and editing, supervision, project administration, funding acquisition. All authors have read and agreed to the published version of the manuscript.
Funding
This work was performed in the framework of a Concerted Research Action (GOA, 01G00319), financed by Ghent University.
Data Availability Statement
The data presented in this study are available on request from the corresponding author.
Acknowledgments
P.M.H. acknowledges the Research and Development Program of Ghent University Global Campus (GUGC), South Korea. The authors thank the reviewers for their constructive remarks.
Conflicts of Interest
The authors declare no conflicts of interest.
Appendix A
Using a Mitutoyo MIT-500-197 caliper, 1879 catalyst extrudate particles are measured for their diameter and height. The diameter is 1.86 mm, probably corresponding to the extrusion outlet opening. For the length, a range of values is measured (see Figure A1, which is a histogram constituted from 26 classes).

Figure A1.
Probability distribution function Φ(hp) (see Equation (A1) for the calculation of the average catalyst particle diameter).
Figure A1.
Probability distribution function Φ(hp) (see Equation (A1) for the calculation of the average catalyst particle diameter).
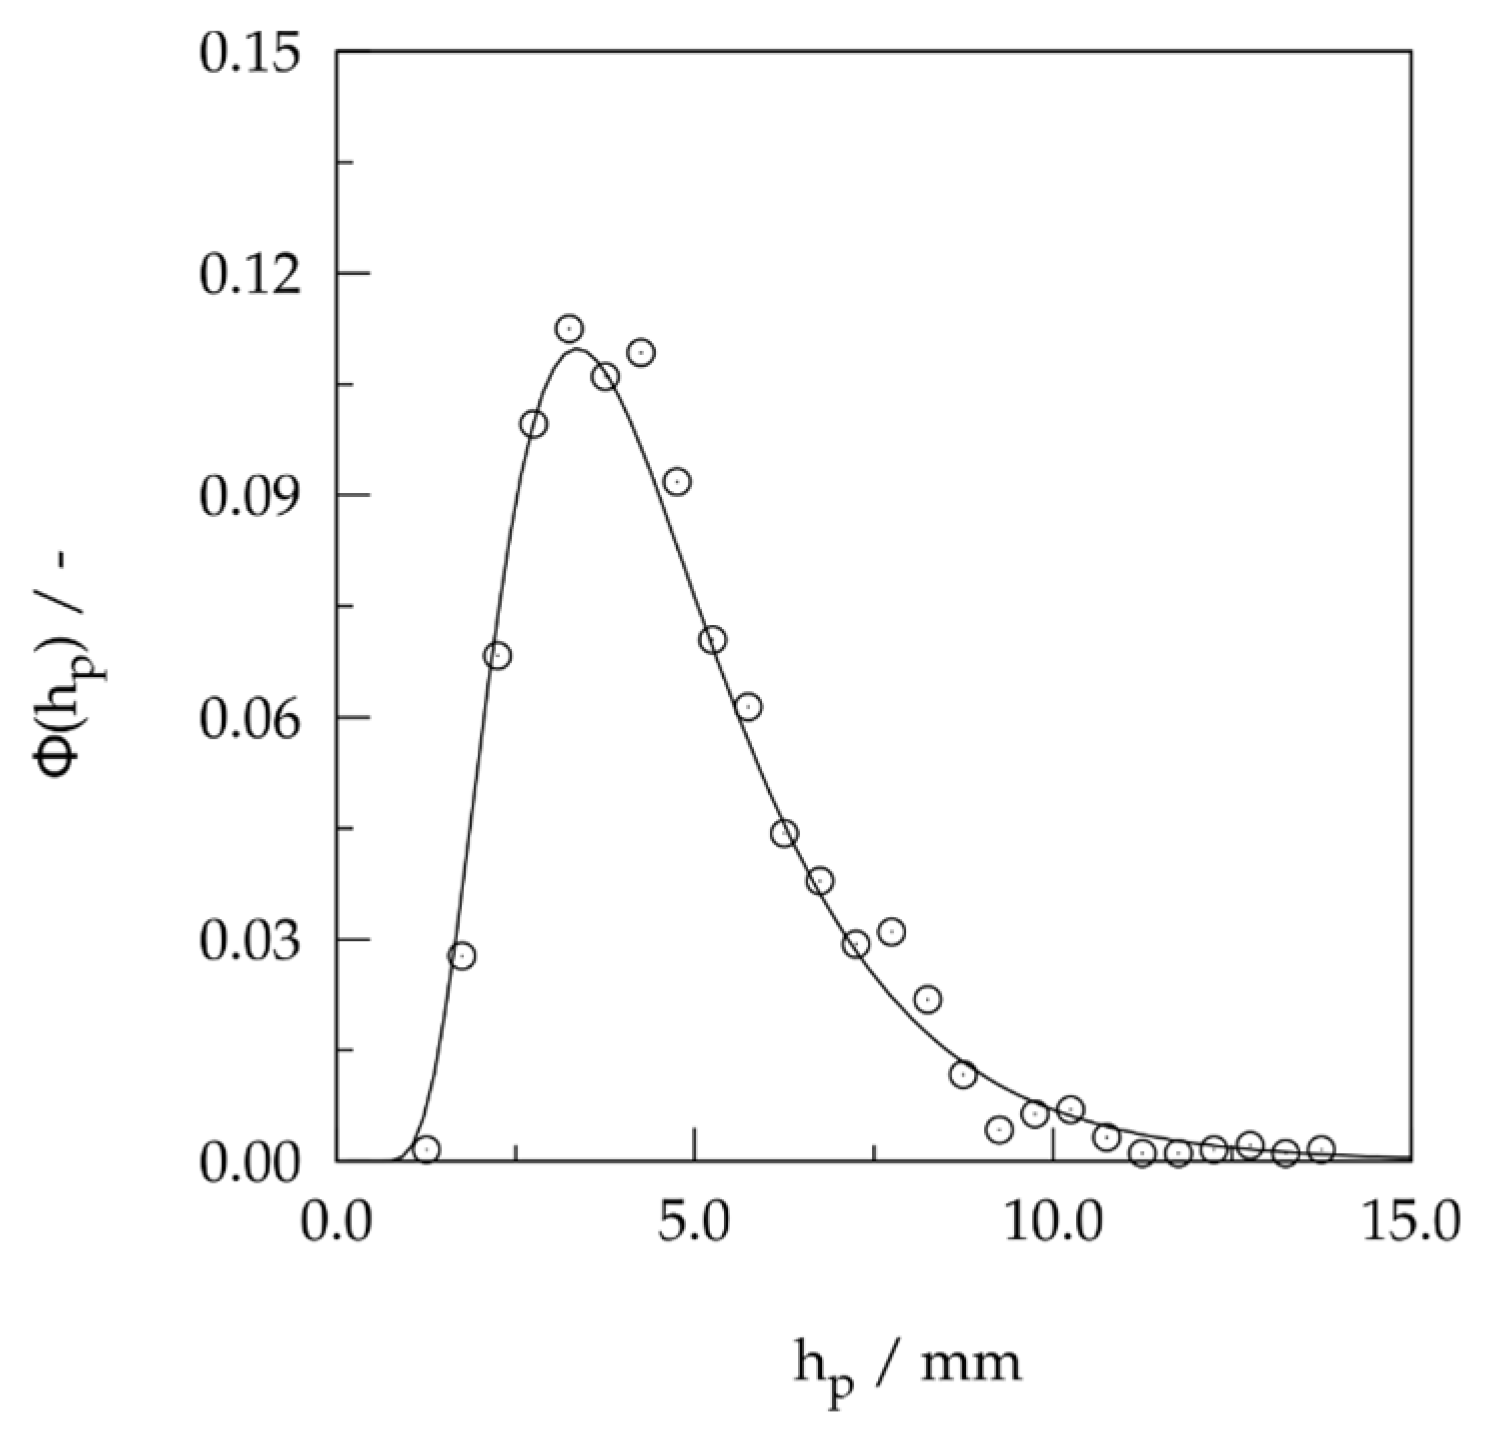
With an inverse normal distribution (see Equation (A1)), an average catalyst particle height, equal to v, and the standard deviation, given by Equation (A2), are obtained. An average catalyst particle height of 4.67 ± 0.12 mm is obtained.
Given a cylindrical geometry with diameter dp and height hp, an average particle diameter, , of 2.33 ± 0.06 mm is calculated using Equation (A3):
Appendix B
The bed and catalyst particle porosity, εb and εp, can be obtained from experimental bed length versus loaded mass (see Figure A2) by means of Equations (A4) and (A5). Details can be found in Heynderickx [50].
The bed porosity is experimentally measured for several tube diameters ranging from 0.01 to 0.05 m (see Figure A2b). Commercial extrudate particles were used. The relation between the bed porosity and the tube diameter was found to be given by Equation (A6), with R2 = 0.9872:
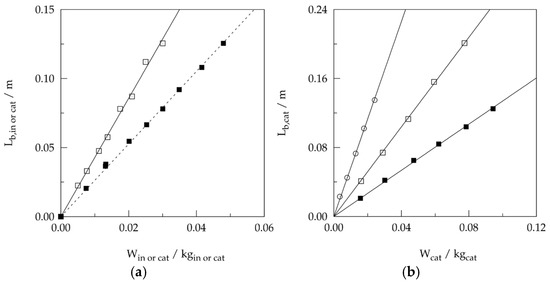
Figure A2.
Experimental determination of catalyst bed porosity, εb, and catalyst particle porosity, εp. (a) (□) Catalyst bed length and (■) inert bed length vs. loaded mass for dt = 0.0143 m and crushed extrudate catalyst particles in the range 400–500 μm. (b) Catalyst bed length vs. loaded mass of commercial extrudate catalyst particles for (○) dt = 0.0181 m; (□) dt = 0.0264 m; and (■) dt = 0.0364 m. Dashed and full line are obtained by regression of the experimental data with Equation (A4) and (A5), respectively.
In the kinetic laboratory experiments with the given catalyst, the bed porosity is estimated at 0.41 ± 0.01 for an average particle size between 400 and 500 μm [48,50]. Using Equation (A5) and the data from Figure A2a, a corresponding particle porosity, εp, of 0.62 is obtained.
Appendix C. Symbols and Annotations
| Roman symbols | ||
| as | specific external surface | |
| cp,f | specific heat | J mol−1 K−1 |
| Ci | molar concentration of component i | mol m−3 |
| d | diameter | m |
| Di | diffusion coefficient for component i | m2 s−1 |
| EA | activation energy | kJ mol−1 |
| f | friction factor | - |
| Fi | molar flow rate of component i | mol s−1 |
| ΔHi | adsorption enthalpy for component i | kJ mol−1 |
| −ΔrH | reaction enthalpy | kJ mol−1 |
| k | reaction coefficient | dep. |
| mass transfer coefficient from gas to solid interface | ||
| k* | rate coefficient; see Equation (27) | |
| Kj | adsorption equilibrium coefficient for component j | kPa−1 |
| L | reactor length | m |
| N | defined by Equation (26) | - |
| Nt | number of tubes | - |
| p | pressure | kPa |
| ), based on particle diameter | - | |
| Pr | ) | - |
| Δp | pressure drop | kPa |
| r | specific reaction rate | |
| rp | mean pore radius | m |
| R | universal gas constant | kJ mol−1 K−1 |
| Rep | ), based on particle diameter | - |
| Rw,i | specific production rate of component i | |
| S | defined by Equation (25) | - |
| Sc | Schmidt number (= ) | - |
| ΔSi | adsorption entropy for component i | J mol−1 K−1 |
| T | temperature | K |
| u | velocity | m s−1 |
| U | overall heat transfer coefficient | J m−2 K−1 s−1 |
| X | fractional conversion | mol mol−1 |
| z | axial coordinate | m |
| Greek symbols | ||
| α | convective heat transfer coefficient | |
| γ | dimensionless activation energy | - |
| ε | porosity | m3 m−3 |
| η | effectiveness factor | - |
| θ | fraction of active sites | - |
| ϑ* | dimensionless temperature; see Equation (28) | - |
| λ | heat conductivity | J m−1 s−1 K−1 |
| ρ | density | kg m−3 |
| τ | tortuosity | m−2 m−2 |
| φ | generalized Thiele modulus | - |
| Ω | cross section of reactor | m2 |
| Subscripts | ||
| a | axial | |
| atm | atmospheric | |
| b | bed, bulk | |
| cat | catalyst | |
| diss | dissociation | |
| e | effective | |
| eq | equilibrium | |
| f | fluid | |
| h | heat transfer | |
| i | component i, interstitial, inflection point | |
| K | Knudsen | |
| m | molecular, mass transfer, mixture | |
| p | particle, pore | |
| r | reactor | |
| s | inside solid, superficial | |
| t | total, tube | |
| w | wall | |
| 0 | initial | |
| Superscripts | ||
| obs | observed | |
| s | condition at external surface | |
| * | critical, reference, surface species | |
| - | averaged | |
| Abbreviations and acronyms | ||
| LEL | lower explosion limit | |
| lhs | left hand side | |
| LH | Langmuir–Hinshelwood | |
| VOC | volatile organic component | |
References
- Theloke, J.; Friedrich, R. Compilation of a database on the composition of anthropogenic VOC emissions for atmospheric modeling in Europe. Atmos. Environ. 2007, 41, 4148–4160. [Google Scholar] [CrossRef]
- Tomasic, V. Application of the monoliths in DeNOx catalysis. Catal. Today 2007, 119, 106–113. [Google Scholar] [CrossRef]
- Froment, G.F.; Bischoff, K.B. Chemical Reactor Analysis, 2nd ed.; Wiley: New York, NY, USA, 1990. [Google Scholar]
- Baptista, C.M.S.G.; Castro, J.A.A.M. A contribution to the study of runaway and parametric sensitivity in fixed bed catalytic reactors. Chem. Eng. Sci. 1996, 51, 3119–3124. [Google Scholar] [CrossRef]
- Velo, E.; Bosch, C.M.; Recasens, F. Thermal safety of batch reactors and storage tanks. Development and validation of runaway boundaries. Ind. Eng. Chem. Res. 1996, 25, 1288–1299. [Google Scholar] [CrossRef]
- Quina, M.M.J.; Ferreira, R.M.Q. Thermal runaway conditions of a partially diluted catalytic reactor. Ind. Eng. Chem. Res. 1999, 38, 4615–4623. [Google Scholar] [CrossRef]
- Zhang, J.; Tighe, C.J.; Hellgardt, K.; Unruh, D.; Bos, R. Generalized runaway diagrams for catalytic reactors with stacked catalyst activities. Chem. Eng. J. 2024, 502, 157960. [Google Scholar] [CrossRef]
- Calverley, E.M.; Witt, P.M.; Sweeney, J.D. Reactor runaway due to statistically driven axial activity variations in graded catalyst beds. Chem. Eng. Sci. 2012, 80, 393–401. [Google Scholar] [CrossRef]
- Kummer, A.; Varga, T. What do we know already about reactor runaway? A review. Process Saf. Environ. Prot. 2021, 147, 460–476. [Google Scholar] [CrossRef]
- Westerterp, K.R.; Molga, E.J. Safety and runaway prevention in batch and semibatch reactors—A review. Chem. Eng. Res. Des. 2006, 84, 543–552. [Google Scholar] [CrossRef]
- Yang, Y.N.; Jin, J.; Zhu, L.T.; Zhou, Y.N.; Luo, Z.H. Runaway criteria for predicting the thermal behavior of chemical reactors. Curr. Opin. Chem. Eng. 2023, 43, 100986. [Google Scholar] [CrossRef]
- Arpentier, P.; Cavani, F.; Trifirò, F. The Technology of Catalytic Oxidations; Technip: Paris, France, 2001. [Google Scholar]
- Morbidelli, M.; Varma, A. Parametric sensitivity and runaway in tubular reactors. AIChE J. 1982, 28, 705–713. [Google Scholar] [CrossRef]
- Young, L.C.; Finlayson, B.A. Axial dispersion in nonisothermal packed bed chemical reactors. Ind. Eng. Chem. Fundam. 1973, 12, 412–422. [Google Scholar] [CrossRef]
- Kulkarni, B.D.; Doriswamy, L.K. Estimation of effective transport properties in packed bed reactors. Catal. Rev. Sci. Eng. 1980, 22, 431–483. [Google Scholar] [CrossRef]
- Heynderickx, P.M.; Thybaut, J.W.; Poelman, H.; Poelman, D.; Marin, G.B. Kinetic modeling of the total oxidation of propane over anatase and vanadia sputter deposited catalysts. Appl. Catal. B Environ. 2009, 90, 295–306. [Google Scholar] [CrossRef]
- Heynderickx, P.M.; Thybaut, J.W.; Poelman, H.; Poelman, D.; Marin, G.B. Kinetic modeling of the total oxidation of propane over CuO-CeO2/γ-Al2O3. Appl. Catal. B Environ. 2010, 95, 26–38. [Google Scholar] [CrossRef]
- Donaubauer, P.J.; Schmalhorst, L.; Hunrichsen, O. 2D flow fields in fixed-bed reactor design: A robust methodology for continuum models. Chem. Eng. Sci. 2007, 208, 115137. [Google Scholar] [CrossRef]
- Kern, C.; Jess, A. On the role of radial dispersion in the behavior of a cooled fixed-bed reactor: Numerical investigation of Fischer–Tropsch synthesis with a cobalt-based catalyst. Chem. Eng. Technol. 2024, 47, e202400201. [Google Scholar] [CrossRef]
- de Smet, C.R.H.; de Croon, M.H.J.M.; Berger, R.J.; Marin, G.B.; Schouten, J.C. Design of adiabatic fixed-bed reactors for the partial oxidation of methane to synthesis gas. Application to production of methanol and hydrogen-for-fuel-cells. Chem. Eng. Sci. 2001, 56, 4849–4861. [Google Scholar] [CrossRef]
- De Groote, A.M.; Froment, G.F. Simulation of the catalytic partial oxidation of methane to synthesis gas. Appl. Catal. A Gen. 1996, 138, 245–264. [Google Scholar] [CrossRef]
- Lommerts, B.J.; Graaf, G.H.; Beenacker, A.C.M. Mathematical modeling of internal mass transport limitations in methanol synthesis. Chem. Eng. Sci. 2000, 55, 5589–5598. [Google Scholar] [CrossRef]
- Lee, J.K.; Ko, J.B.; Kim, D.H. Methanol steam reforming over Cu/ZnO/Al2O3 catalyst: Kinetics and effectiveness factor. Appl. Catal. A Gen. 2004, 278, 25–35. [Google Scholar] [CrossRef]
- Carrasco-Venegas, L.A.; nzález-Fernández, J.V.; Castañeda-Pérez, L.G.; Medina-Collana, J.T.; Palomino-Hernández, G.; Martínez-Hilario, D.G.; Trujillo-Pérez, S.A. Analysis of the effectiveness factor in a fixed-bed tubular reactor system: Catalytic dehydrogenation of cyclohexanol. Catalysts 2023, 13, 585. [Google Scholar] [CrossRef]
- Lee, S.B.; Cho, W.; Park, D.K.; Yoon, E.S. Analysis of the effectiveness factor in a fixed-bed tubular reactor system: Catalytic dehydrogenation of cyclohexanol. Korean J. Chem. Eng. 2006, 23, 522–530. [Google Scholar] [CrossRef]
- Kim, D.H.; Park, D.R.; Lee, J. Preferential CO oxidation over CuO-CeO2 in excess hydrogen: Effectiveness factors of catalyst particles and temperature window for CO removal. Int. J. Hydrog. Energy 2013, 38, 4429–4436. [Google Scholar] [CrossRef]
- Perry, R.H.; Green, D.W.; Maloney, J.O. Perry’s Chemical Engineers’ Handbook, 2nd ed.; McGraw-Hill: New York, NY, USA, 1997. [Google Scholar]
- Zalc, J.M.; Reyes, S.C.; Iglesia, E. The effects of diffusion mechanism and void structure on transport rates and tortuosity factors in complex porous structures. Chem. Eng. Sci. 2004, 59, 2947–2960. [Google Scholar] [CrossRef]
- Berger, R.J.; Stitt, E.H.; Marin, G.B.; Kapteijn, F.; Moulijn, J.A. Eurokin. Chemical reaction kinetics in practice. Cattech 2001, 5, 30–60. [Google Scholar] [CrossRef]
- Welty, J.R.; Wicks, C.E.; Wilson, R.E.; Rorrer, G.L. Fundamentals of Momentum, Heat and Mass Transfer, 5th ed.; Wiley: Hoboken, NJ, USA, 2000. [Google Scholar]
- Kunii, D.; Suzuki, M. Particle-to-fluid heat and mass transfer in packed beds of fine particles. Int. J. Heat Mass Transf. 1967, 10, 845–852. [Google Scholar] [CrossRef]
- Sengupta, A.; Thodos, G. Mass and heat transfer in the flow of fluids through fixed and fluidized beds of spherical particles. AIChE J. 1962, 8, 608–610. [Google Scholar] [CrossRef]
- Deacetis, J.; Thodos, G. Mass and heat transfer in flow of gases through spherical packings. Ind. Eng. Chem. 1960, 52, 1003–1006. [Google Scholar] [CrossRef]
- Barkelew, C.H. Stability of chemical reactors. Chem. Eng. Prop. Symp. Ser. 1959, 55, 37–46. [Google Scholar]
- Van Welsenaere, R.J.; Froment, G.F. Parametric sensitivity and runaway in fixed bed catalytic reactors. Chem. Eng. Sci. 1970, 25, 1503–1516. [Google Scholar] [CrossRef]
- Available online: https://people.sc.fsu.edu/~jburkardt/f77_src/rk4/rk4.f (accessed on 13 February 2025).
- Leva, M. Fluid flow through packed beds. Chem. Eng. 1949, 56, 115–120. [Google Scholar]
- Hicks, R.E. Pressure drop in packed beds of spheres. Ind. Eng. Chem. Fundam. 1970, 9, 500–502. [Google Scholar] [CrossRef]
- Fuller, E.N.; Schettler, P.D.; Giddings, J.C. New Method for Prediction of Binary Gas-Phase Diffusion Coefficients. Ind. Eng. Chem. Res. 1966, 58, 18–27. [Google Scholar] [CrossRef]
- Available online: https://people.sc.fsu.edu/~jburkardt/f77_src/toms446/toms446.html (accessed on 13 February 2025).
- Szeifert, F.; Chovan, T.; Nagy, L.; Abonyi, J.; Arva, P. Runaway of chemical reactions: Parametric sensitivity and stability. Hung. J. Ind. Chem. 2007, 35, 19–30. [Google Scholar] [CrossRef]
- Casson, V.; Lister, D.G.; Milazzo, M.F.; Maschio, G. Comparison of criteria for prediction of runaway reactions in the sulphuric acid catalyzed esterificationof acetic anhydride and methanol. J. Loss Prev. Process Ind. 2012, 25, 209–217. [Google Scholar] [CrossRef]
- Vianello, C.; Salzaon, E.; Brocanello, A.; Manzardo, A.; Maschio, G. Runaway reaction for the esterification of acetic anhydride with methanol catalyzed bysulfuric acid. Ind. Eng. Chem. Res. 2018, 57, 4195–4202. [Google Scholar] [CrossRef]
- Emig, G.; Hofman, H.; Hoffmann, U.; Fiand, U. Experimental studies on runaway of catalytic fixed-bed reactors (vinyl-acetate synthesis). Chem. Eng. Sci. 1980, 35, 249–257. [Google Scholar] [CrossRef]
- Moretti, E.C. Practical Solutions for Reducing Volatile Organic Compounds and Hazardous Air Pollutants; AIChE CWRT: New York, NY, USA, 2001; p. 150. [Google Scholar]
- Lin, H.; Gao, X.; Luo, Z.Y.; Cen, K.F.; Pei, M.X.; Huang, Z. Removal of NOx from wet flue gas by corona discharge. Fuel 2004, 83, 1251–1255. [Google Scholar] [CrossRef]
- Chen, J.-C.; Wey, M.-Y.; Yeh, C.-L.; Liang, Y.-S. Simultaneous treatment of organic compounds, CO, and NOx in the incineration flue gas by three-way catalyst. Appl. Catal. B Environ. 2004, 48, 25–35. [Google Scholar] [CrossRef]
- Heynderickx, P.M.; Thybaut, J.W.; Poelman, H.; Poelman, D.; Marin, G.B. The total oxidation of propane over supported Cu and Ce oxides: A comparison of single and binary metal oxides. J. Catal. 2010, 272, 109–120. [Google Scholar] [CrossRef]
- Available online: http://www.eurochlor.org/solventsemissionsdirective (accessed on 16 September 2009).
- Heynderickx, P.M. Steady-State Kinetic Modelling of the Total Oxidation of Propane over Metal Oxide Catalysts. Ph.D. Thesis, Ghent University, Ghent, Belgium, 2009. Available online: https://biblio.ugent.be/publication/01J8PMN5S4RHQJG8BXWAFKAWN0 (accessed on 23 December 2009).

Disclaimer/Publisher’s Note: The statements, opinions and data contained in all publications are solely those of the individual author(s) and contributor(s) and not of MDPI and/or the editor(s). MDPI and/or the editor(s) disclaim responsibility for any injury to people or property resulting from any ideas, methods, instructions or products referred to in the content. |
© 2025 by the authors. Licensee MDPI, Basel, Switzerland. This article is an open access article distributed under the terms and conditions of the Creative Commons Attribution (CC BY) license (https://creativecommons.org/licenses/by/4.0/).