Abstract
As a kind of high-oxygen organic liquid produced during biomass pyrolysis, wood vinegar possesses significant industrial value due to its rich composition of acetic acid, phenols, and other bioactive compounds. In this study, we explore the application of advanced machine learning models in optimizing the dual-column distillation process for wood vinegar production, such as Random Forest algorithms. Through the integration of Aspen Plus simulation and deep learning, an adaptive control strategy is proposed to enhance the separation efficiency of key components under varying feed conditions. The experimental results demonstrate that the Random Forest model exhibits superior predictive accuracy to traditional decision tree methods, and an R2 of 0.9728 can be achieved for phenol concentration prediction. This AI-driven system can provide real-time process optimization, enhancing energy efficiency, stabilizing component yields, and contributing to the advancement of sustainable practices within the biomass chemical industry. These findings are anticipated to offer valuable insights into the integration of green chemistry principles with intelligent control systems to facilitate the achievement of Industry 4.0 objectives in bio-based production.
1. Introduction
As a kind of pyroligneous acid or plant acid, wood vinegar is a high-oxygen organic liquid derived from the pyrolysis gases produced during the pyrolysis of biomass under anaerobic or near-anaerobic conditions [1,2]. This process contains a series of complex chemical reactions, including the decomposition of biomass, gas-phase reactions of volatile components as well as the physical transformation of condensation into liquid [3,4]. The raw materials for wood vinegar production are abundant, including wood and its by-products, agricultural crops and their residues, municipal solid waste, food processing by-products, and even aquatic plants and algae [5,6]. The diversity of raw materials can provide a reliable and sustainable resource base for production. The chemical composition and properties of wood vinegar vary significantly depending on the source material, with wood and agricultural by-products serving as the primary and most commonly utilized sources. In particular, wood and its by-products, as well as agricultural crops and their by-products, are the primary sources for wood vinegar production, which exhibits its sustainability and economic advantages [7,8].
The production process of wood vinegar is composed of three key stages, including pyrolysis and condensation, as well as distillation [9,10]. First, during the pyrolysis stage, biomass materials are heated in an anaerobic environment at temperatures within the range of 200–500 °C. Through the decomposition of cellulose, hemicellulose and lignin, a series of pyrolysis gases is released. Specifically, the decomposition of cellulose produces carbon monoxide (CO) and water (H2O) with the reaction formula of (C6H10O5)n → 6CO + 5H2O + heat. In contrast, the decomposition of hemicellulose is more complex, and small molecules can be generated, such as carbon dioxide (CO2), methane (CH4), carbon monoxide (CO), and water (H2O), as described by the reaction formula of (C5H8O4)n → CO2 + CH4 + CO + H2O + heat. The decomposition of lignin can bring about the formation of phenolic compounds (C7H8O), water (H2O) and aromatic compounds, which can be represented by the reaction formula of C9H10O3 → C7H8O + H2O + aromatic compounds. These aromatic compounds refer to phenolic compounds, including phenol and its derivatives such as guaiacol and catechol. The specific composition of these aromatic compounds depends on the pyrolysis conditions, including temperature and residence time, as well as the structural characteristics of the original lignin molecules. These volatile components produced during pyrolysis are then cooled into liquid form during the subsequent condensation stage through the control of temperature and pressure, and thereby the wood vinegar can be formed. It should be noted that, when methyl acetate (CH3COOCH3) reacts with water (H2O) to form acetic acid (CH3COOH) and methanol (CH3OH), acetic acid is also produced during condensation, which is an important source of acetic acid in the wood vinegar. Through the liquefaction of volatile organic compounds, the wood vinegar is generated during the condensation process, and thereby the condensed liquid contains a mixture of components such as water, acetic acid, formic acid, phenolic substances as well as aldehydes [11,12].
Generally, the wood vinegar is a complex mixture containing over 200 chemical compounds, and its primary components include water, organic acids, phenols, aldehydes, alcohols, esters, and furan compounds [13,14,15]. Notably, water is the dominant constituent, while the organic acids, particularly acetic acid (CH3COOH), play a crucial role in determining the pH value of wood vinegar, indicating that it possesses strong acidity. Furthermore, the phenols are primarily derived from the decomposition of lignin. Phenols have significant antibacterial and preservative properties, and they also make great contributions to the characteristic pyrolysis gases of wood vinegar. Wood vinegar also contains trace amounts of aldehydes (e.g., formaldehyde), ketones (e.g., acetone), and furan compounds. The specific chemical composition of wood vinegar is dependent on factors such as the type of raw materials and the production conditions, including temperature, pressure, and heating rate [16,17,18]. It can be found that these variables can significantly affect the composition and properties of wood vinegar, making production methods a critical determinant of its quality and application potential.
In the chemical industry, acetic acid and phenol in wood vinegar are considered to be the most commercially valuable chemical components [19]. In particular, the final composition of wood vinegar is significantly influenced by the chemical constituents of the raw materials used in its production. As an inherent component, water can affect the phase separation and dilution of other components during distillation. Additionally, phenol and its derivatives, which originate from the thermal decomposition of lignin, are influenced by the lignin content and structure of the raw material, while higher lignin content typically results in greater phenolic yields. Acetic acid, which is mainly derived from the pyrolysis of cellulose and hemicellulose, is directly related to the carbohydrate content of the biomass. Accordingly, the relative proportions in the raw material play a significant role in determining the concentrations of water, phenol, and acetic acid in the final wood vinegar product. This demonstrates the importance of selecting raw materials with optimal compositions to achieve desired wood vinegar properties for specific applications. Traditionally, their production is closely associated with raw petrochemical materials, which are energy-intensive and heavily dependent on fossil resources. Recently, in order to promote sustainable practices in green chemistry, increasing efforts have been directed toward extracting high-value chemicals from wood vinegar [20,21,22]. Through the distillation and purification of wood vinegar, acetic acid and phenol can be efficiently separated. Currently, the commonly used distillation model in the industry is a dual-column continuous distillation system. By optimizing key parameters, such as the control of the number of trays, temperature, and pressure, high-purity chemical components can be extracted during the distillation separation of wood vinegar. As a kind of chemical process simulation software, Aspen Plus becomes a standard tool for modeling and optimizing the process flow of distillation columns [23,24,25]. Its application has the potential to realize precise control and enhanced efficiency, making it a mainstream strategy toward sustainable production methods in the industry.
The integration of artificial intelligence (AI) and deep learning technologies in the distillation process of wood vinegar can significantly improve the traceability of raw material components and the adaptive regulation of key operational parameters [26,27,28]. In the production of wood vinegar, the chemical composition of raw materials with various proportions of cellulose, hemicellulose, and lignin can directly affect the yield and purity of critical compounds such as acetic acid, methanol and phenols. Nevertheless, traditional distillation control methods are challenging to accommodate fluctuations in raw material composition, leading to inconsistencies in product quality and extraction efficiency. By leveraging machine learning algorithms in conjunction with Aspen Plus process simulations, a robust AI-driven framework can be established to dynamically monitor, analyze, and optimize the wood vinegar distillation process. AI models, trained on extensive historical production data, can identify correlations between raw material variability and key process parameters, such as temperature profiles, pressure dynamics, and reflux ratios. Through real-time data acquisition and predictive analytics, these models enable intelligent feedback control, allowing for instantaneous adjustments to operating conditions in response to fluctuations in raw material composition. One of the core applications of AI in this domain is the predictive modeling of key process parameters. Deep learning models can process time-series data to forecast deviations in distillation column performance, preemptively adjusting heat input, condensation rates, and separation efficiencies. This ensures the consistent recovery of target compounds despite variations in feedstock composition. Additionally, reinforcement learning-based control systems can iteratively refine distillation strategies by continuously optimizing column tray configurations, energy inputs, and feed flow rates to maximize separation efficiency and minimize energy consumption.
AI-driven multivariable control algorithms enable the coordination of multiple process parameters in real time, thereby mitigating the nonlinear and interactive effects of raw material variations on component separation [29,30]. For instance, when fluctuations in hemicellulose and lignin content alter the pyrolysis-derived intermediate composition, the AI model can promptly recalibrate the thermal and hydraulic parameters of the distillation column to stabilize acetic acid and phenol yields. This adaptability can significantly enhance the processing robustness and operational stability while reducing the dependency on manual intervention [31]. The synergy between Aspen Plus simulation models and AI algorithms is expected to further refine process optimization by providing a virtual environment for simulating various production scenarios under different feedstock conditions. By integrating AI-driven parameter tuning with high-fidelity process simulations, an intelligent distillation system can be developed to achieve real-time optimization of energy consumption and resource utilization, thereby enhancing both economic and environmental sustainability in wood vinegar production. Accordingly, the application of AI in wood vinegar distillation represents a paradigm shift towards data-driven, intelligent manufacturing. By enabling precise source tracing of raw material components and real-time process adaptation, AI-driven control systems probably ensure high product consistency, reduced operational costs, and improved extraction efficiency, which is anticipated to provide a strategy for a more sustainable and automated industrial distillation framework.
The increasing adoption of deep learning and AI technologies in green chemistry is expected to enhance the traceability of raw material components and optimize the distillation process in wood vinegar production. In this work, by integrating machine learning algorithms with Aspen Plus simulation, the identification and tracking of feedstock variations can be systematically analyzed, enabling precise control over process parameters. This approach not only improves efficiency and reduces energy consumption by ~14% [32], but also minimizes waste generation, aligning with sustainable development objectives. Furthermore, the development of AI-driven intelligent feedback control systems holds significant potential for optimizing biomass-based chemical processes beyond wood vinegar production. The synergy between machine learning-based source tracing and Aspen simulation can facilitate the intelligent transformation of the biomass chemical industry, supporting the advancement of green chemistry within the framework of Industry 4.0.
2. Materials and Methods
2.1. Design of Distillation Simulation Experiment
In this experiment, water, acetic acid, and phenol were selected as model compounds to represent the simplified composition of wood vinegar, and thereby the other trace components of wood vinegar were excluded from consideration. The feasibility of these three compounds was first tested to verify the applicability of the model. Subsequently, a dual-column distillation separation model was established using Aspen Plus software, and the corresponding physical properties were numerically simulated using the NRTL model [33]. The key parameters in the distillation process were fixed, including the number of trays, feed position, distillate flow rates, as well as reflux ratio. Only the mass ratios of water, acetic acid, and phenol in the feed were varied to simulate different compositions of the simplified wood vinegar. The compositions of the top and bottom streams from the dual columns were determined, while the component concentrations at the distillation column bottoms were compared to those of the feed model compounds. To further refine the analysis, big data techniques were employed and a systematic graphical model was constructed. This model can provide a foundation for further processing the wood vinegar with unknown compositions. Through the analysis of the distillate composition at the column bottoms, the specific composition of the feed wood vinegar can be derived in reverse, and thereby the research efficiency can be enhanced. This approach can provide a scientific basis for practical applications in the industry.
2.2. Simulation of Distillation Experiment
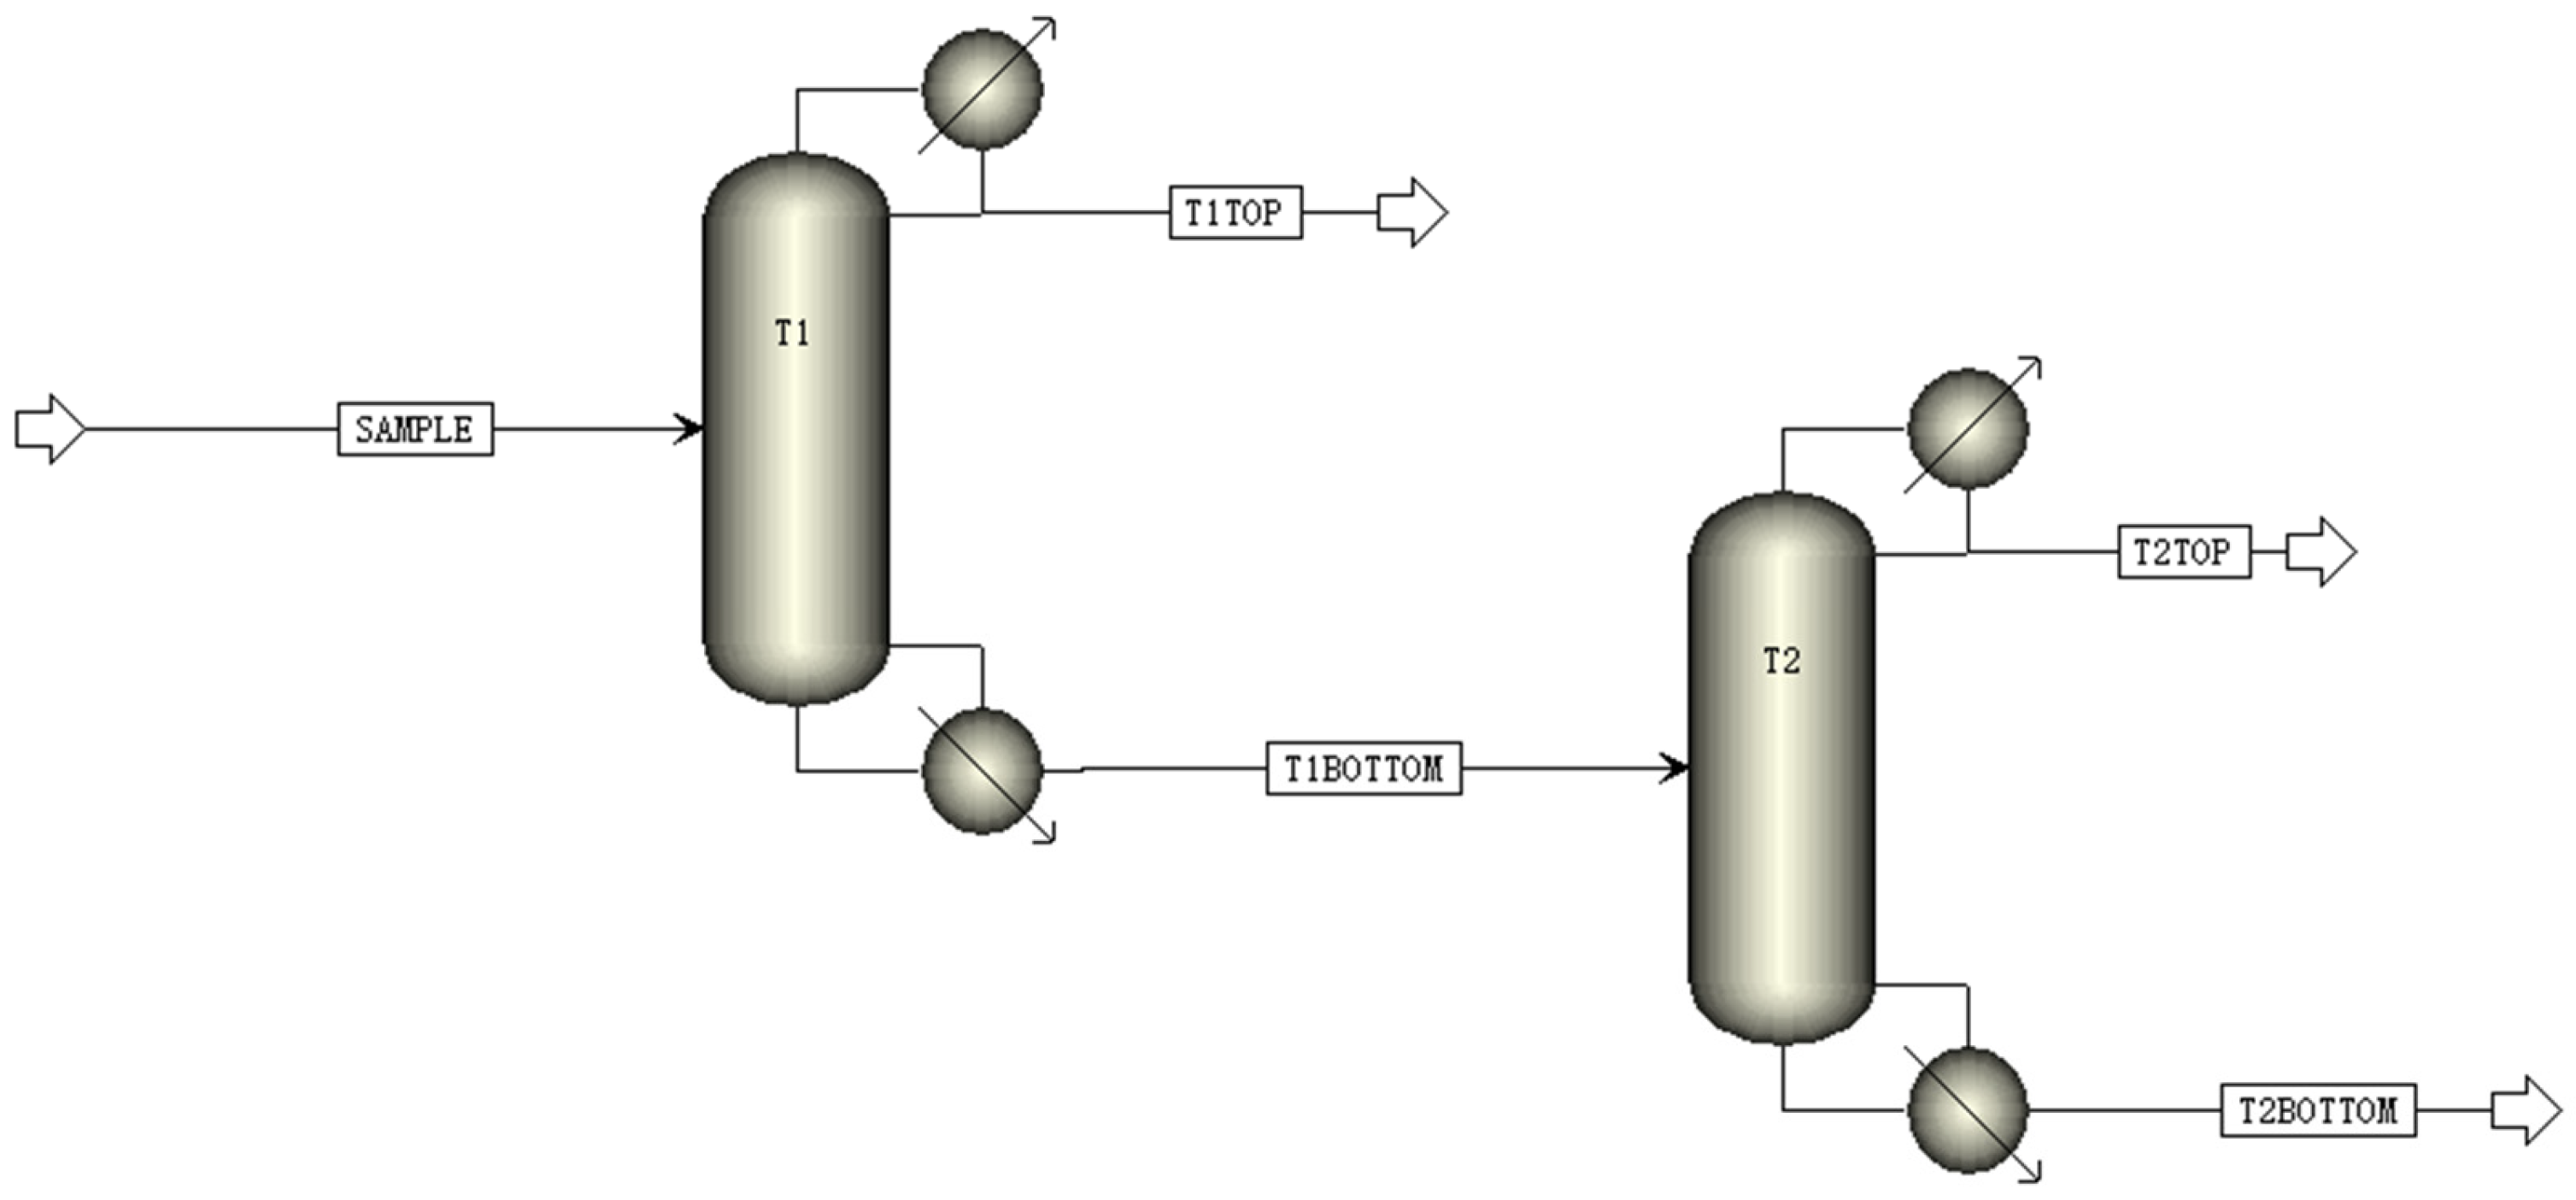
According to the design of dual-column distillation separation for wood vinegar, Figure 1 illustrates a detailed process flow diagram. To simulate the feed stream composition of simplified wood vinegar, the total flow rate was set as 100 kg/h, and it was composed of three components including water, acetic acid, and phenol. Due to the large amount of data and the fact that water generally accounts for a significant proportion in wood vinegar, the flow rate of water was set within the range of 70–100 kg/h, whereas the flow rates of acetic acid and phenol were adjusted within the range of 0–30 kg/h. This configuration ensures that the total flow rate of the three components (i.e., water, acetic acid, and phenol) can be maintained as 100 kg/h, and the flow rate gradient interval was set as 5 kg/h.

Figure 1.
Process flow diagram of dual-column distillation separation of wood vinegar.
It should be noted that in the design of the dual columns, each column was equipped with 30 trays to ensure redundancy and sufficient separation. Meanwhile, the feed inlet was placed above the 15th tray to facilitate adequate contact and separation of the components within the columns. Additionally, to maintain the stability and efficiency of the distillation process, the distillate flow rate of the dual columns was set as 30 kg/h, and the reflux ratio was fixed at 3. These design parameters can ensure that, during the separation process, the component ratios of the top distillate from the first column, the top distillates from the second column, and the bottom product of the second column can be directly influenced by the composition of the simulated wood vinegar, making it easier to fit and summarize the resulting dataset, and thereby enabling other external interferences to be eliminated.
Through the dual-tower distillation process design parameters outlined above, this study utilizes Aspen Plus simulation software to conduct steady-state process modeling of the separation system; the simulation generates detailed component distribution data at key nodes, as shown in Table 1.

Table 1.
Input and output variable mapping for pyroligneous acid simulation separation units by Aspen Plus.
By integrating predefined feed compositions (total flow rate: 100 kg/h, with Feed_Water = 70–95%, Feed_Acetic_Acid = 0–30%, and Feed_Phenol = 0–30%, adjusted in 5% increments), the simulation systematically constructs a comprehensive dataset linking input variables (feed composition ratios) to output responses (component concentrations at separation nodes). This numerical experimentation not only covers full factorial combinations of 7 baseline water content levels (70%, 75%, 80%, 85%, 90%, 95%) but also incorporates 9 supplementary Feed_Water/Feed_Acetic_Acid/Feed_Phenol ratios at intermediate gradient intervals to validate model generalizability.
3. Machine Learning
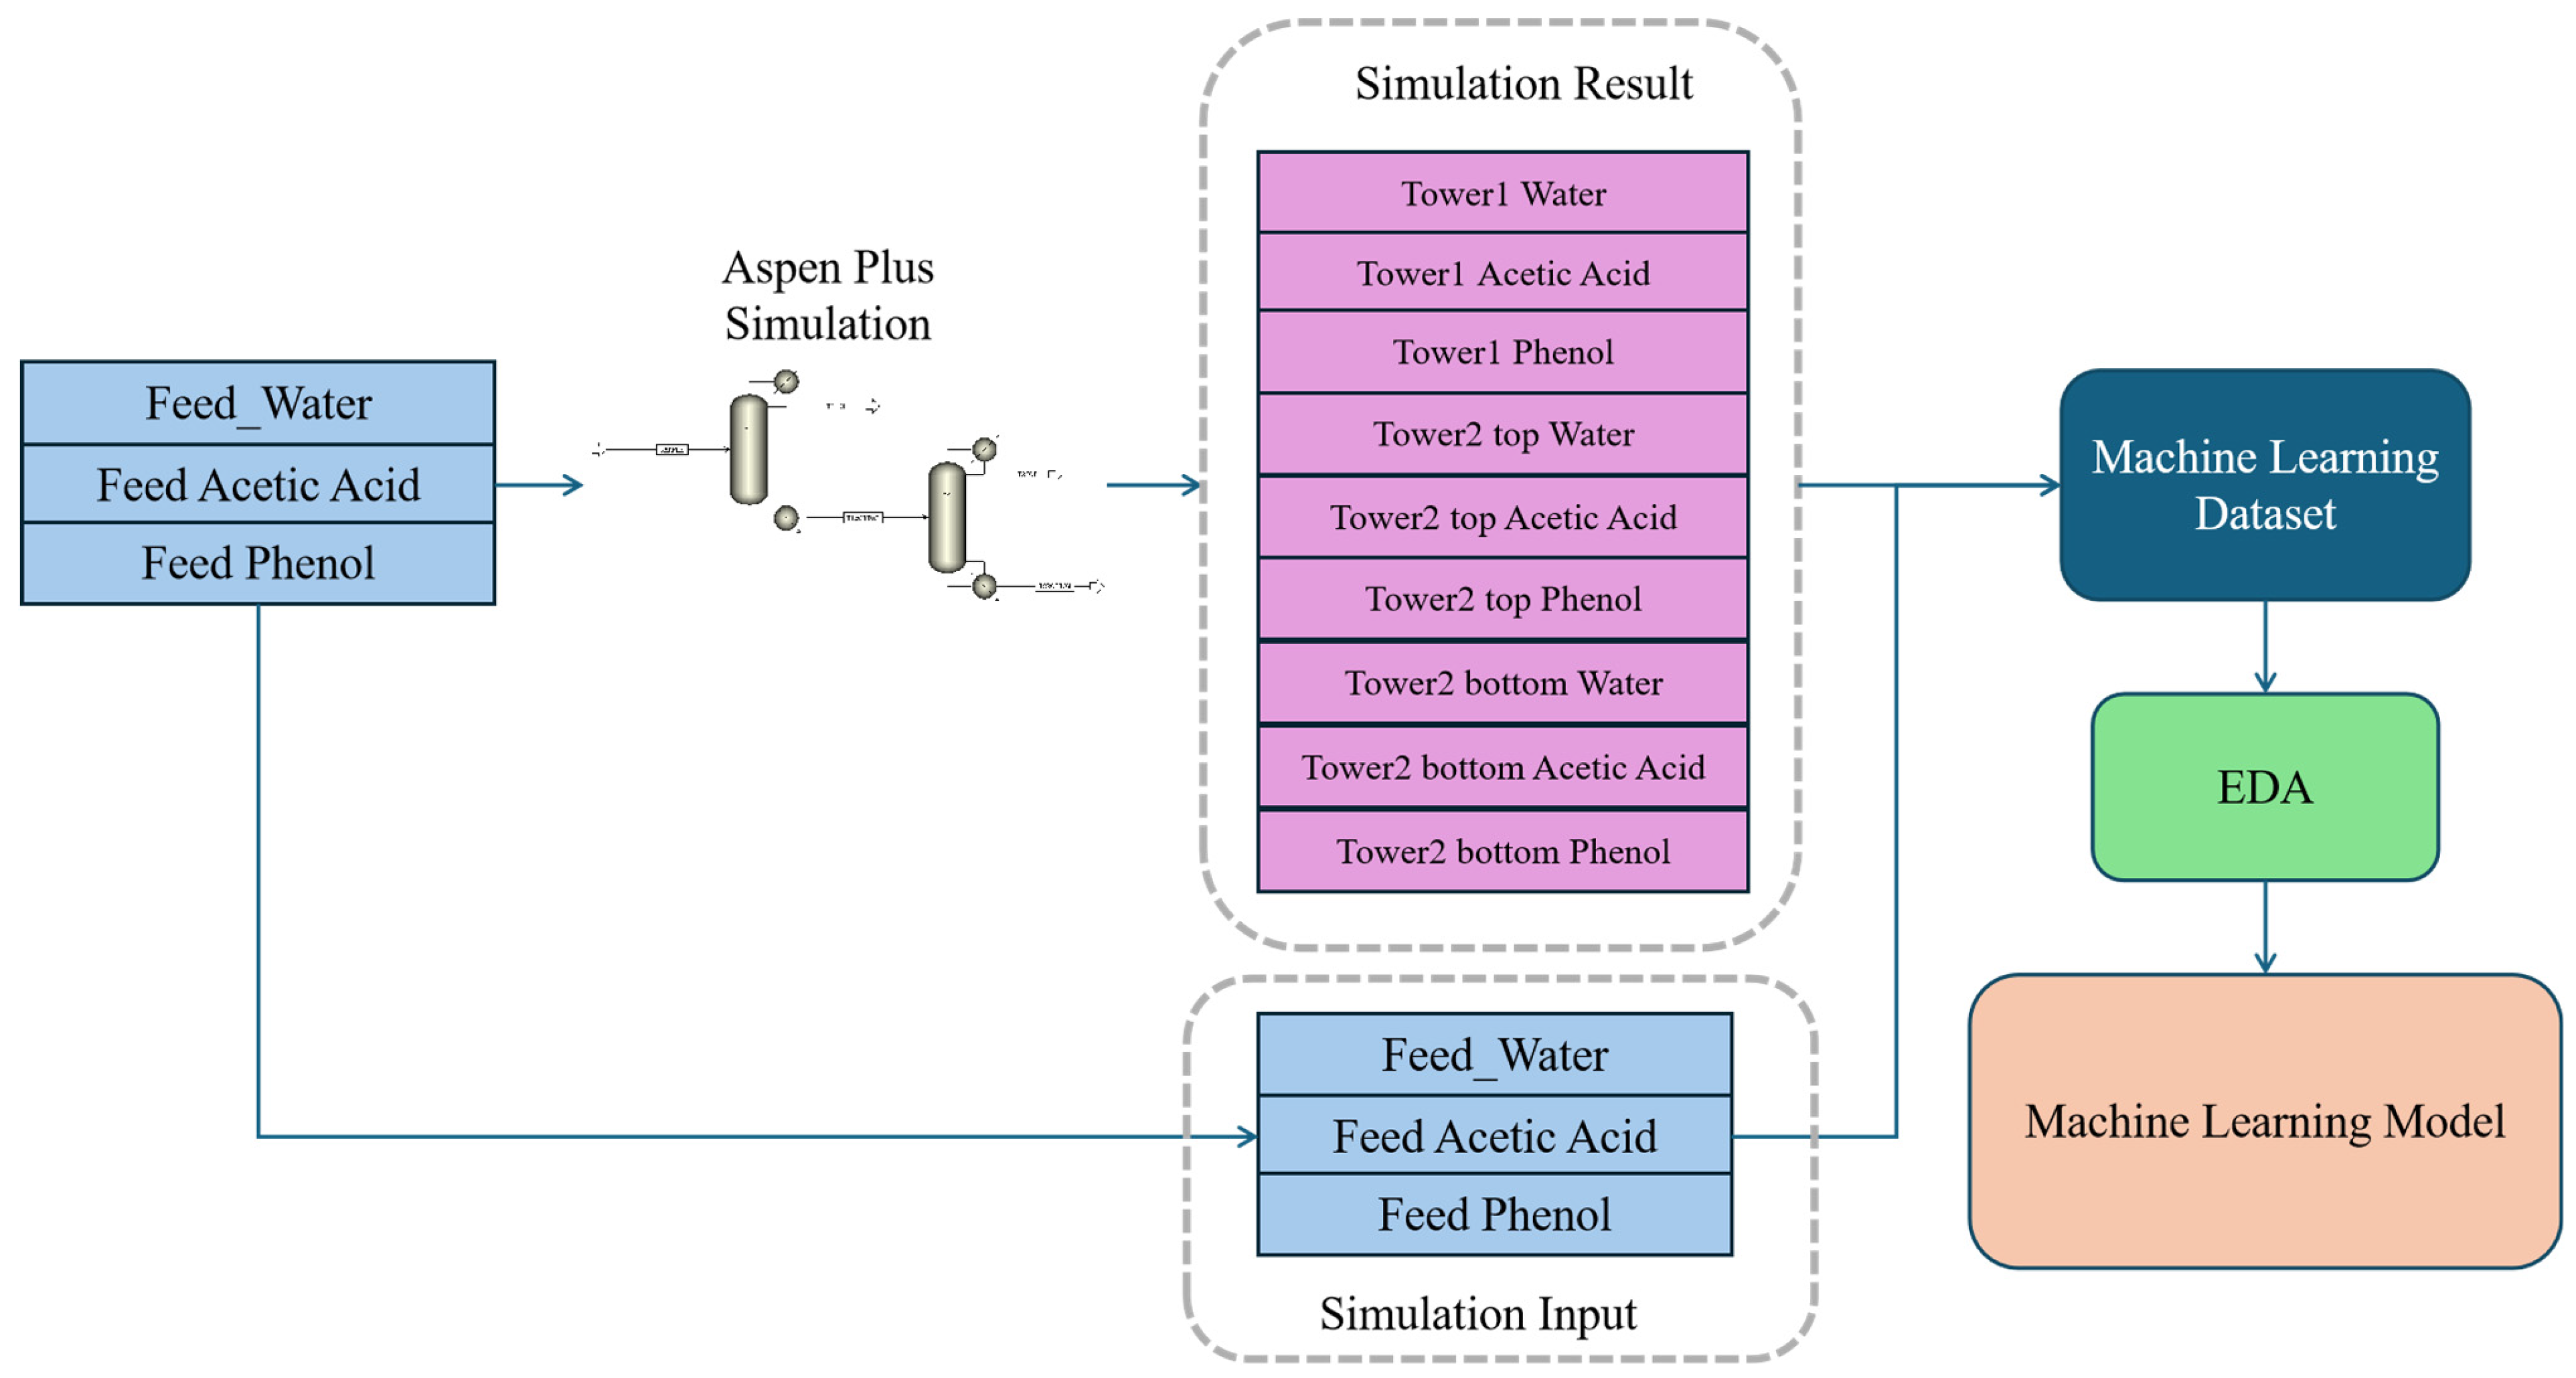
Figure 2 illustrates the complete data analysis workflow for a wood vinegar chemical process simulation based on Aspen Plus V11. On the left side, blue boxes indicate feed data, and three substances are involved, i.e., water, acetic acid, and phenol. The middle section shows a process flow diagram of a dual-tower system, where these raw materials undergo processing through two towers in series. The pink boxes on the upper right detail various process parameters for both towers, including top and bottom data for water, acetic acid, and phenol. These process data and original feed data are input into a machine learning dataset, which is ultimately used to build a machine learning model after exploratory data analysis (EDA).

Figure 2.
Data analysis workflow for a wood vinegar chemical process simulation based on Aspen Plus.
3.1. Dataset
The dataset used in this study contains composition data of feed samples and output data from two separation columns in a multi-component separation process. The raw dataset consists of 12 feature variables, including the content of water, acetic acid, and phenol in the feed, as well as the corresponding component concentrations in the output streams from the top and bottom of both the first and second separation columns. The design of feed composition follows a systematic approach, with water content varying between 70% and 95%, and seven benchmark levels are set (70%, 75%, 80%, 85%, 90%, 95%). At each water content level, the relative proportions of acetic acid and phenol are adjusted to form a complete component distribution series. The acetic acid content ranges from 0 to 30%, and phenol content ranges from 0 to 30%, with the total of all components always summing to 100%. Additionally, the dataset includes nine sets of supplementary experimental data, where the feed compositions are chosen between the benchmark ratios to validate the predictive ability of the model.
Sampling and analysis were systematically conducted at three critical positions in the separation process. The first sampling point was located at the output stream of Column 1. The results showed that the water content fluctuated within the range of 27.39% to 29.99%, while the acetic acid content was low, ranging from 0% to 0.067%, and the phenol content varied between 0% and 2.60%. The component distribution at the output stream of Column 2 was similar to that of Column 1, with the water content remaining in the range of 27.39% to 29.99%, the acetic acid content slightly increased to 0% to 0.108%, and the phenol content remained within the range of 0% to 2.61%. The output stream of Column 3 exhibited significantly different component characteristics, with the water content expanding to a range of 10.17% to 39.04%, the acetic acid content increasing substantially to 0% to 29.82%, and the phenol content also rising to a range of 0% to 24.79%. All component concentration data were expressed as mass percentages, accurate to eight decimal places, to ensure the precision and reliability of the data.
3.2. Data Preprocessing
In this study, Python 3.7.12 programming environment and the scikit-learn machine learning library were used for data preprocessing and modeling analysis. During the data cleaning phase, anomalies and missing values in the dataset were systematically addressed. The initial dataset contained 12 feature variables. After cleaning the column names and normalizing the data, the feature variables were clearly categorized into feed components (Feed_Water, Feed_Acetic_Acid, Feed_Phenol) and the output components from the two separation columns (Tower1, Tower2_top, Tower2_bottom, each containing Water, Acetic Acid, and Phenol concentrations).
To improve the model’s training effectiveness, the feature data were standardized using the StandardScaler in scikit-learn 0.23.1. The standardization transformation was implemented using the following formula:
where represents the original feature value, denotes the mean of feature, and represents the standard deviation of feature.
The original experimental data from the seven benchmark levels were utilized as the training set, while the supplementary experimental data were employed as the test set. During the feature engineering phase, the nine output parameters from the columns were used as input features, while the three feed component concentrations were set as the target prediction variables.
3.3. Exploratory Data Analysis (EDA) of Aspen Simulation Results
This dataset consists of 37 samples, covering feed composition and output data from two separation columns, with a total of 12 variables. The water content in the feed (Feed_Water) has an average value of 79.22%, ranging from 70% to 95%, with a standard deviation of 7.54%. This indicates a moderate level of variability in water content across a relatively wide range. The acetic acid (Feed_Acetic_Acid) and phenol (Feed_Phenol) contents in the feed both vary from 0% to 30%, with mean values of 10.68% and 10.10%, and standard deviations of 7.90% and 7.52%, respectively, suggesting that these two components are distributed relatively evenly within the feed.
At the output of Column 1 (Tower1), the water content (Tower1_Water) has an average of 28.22%, with a narrow fluctuation range between 27.40% and 29.99%, and a standard deviation of 0.87%, indicating high consistency. The acetic acid content (Tower1_Acetic_Acid) is extremely low, with an average of 0.011%, ranging from 0% to 0.067%, and a standard deviation of 0.015%. The phenol content (Tower1_Phenol) has an average of 1.77%, fluctuating between 0% and 2.60%, with a standard deviation of 0.88%.
At the top of Column 2 (Tower2_top), the water content (Tower2_top_Water) is similar to that of Column 1, with an average of 28.33%, ranging from 27.39% to 29.99%, and a standard deviation of 0.86%. The acetic acid content (Tower2_top_Acetic_Acid) has an average of 0.017%, ranging from 0% to 0.108%, with a standard deviation of 0.025%. The phenol content (Tower2_top_Phenol) has an average of 1.65%, fluctuating between 0% and 2.61%, with a standard deviation of 0.88%, showing similar stability to that of Column 1. At the bottom of Column 2 (Tower2_bottom), the water content (Tower2_bottom_Water) has an average of 22.66%, with a wider range from 10.18% to 39.04%, and a standard deviation of 7.54%, indicating considerable variability in water content at the bottom of the column. The acetic acid content (Tower2_bottom_Acetic_Acid) has an average of 10.65%, ranging from 0% to 29.82%, with a standard deviation of 7.87%. The phenol content (Tower2_bottom_Phenol) has an average of 6.68%, fluctuating between 0% and 24.79%, with a standard deviation of 6.19%.
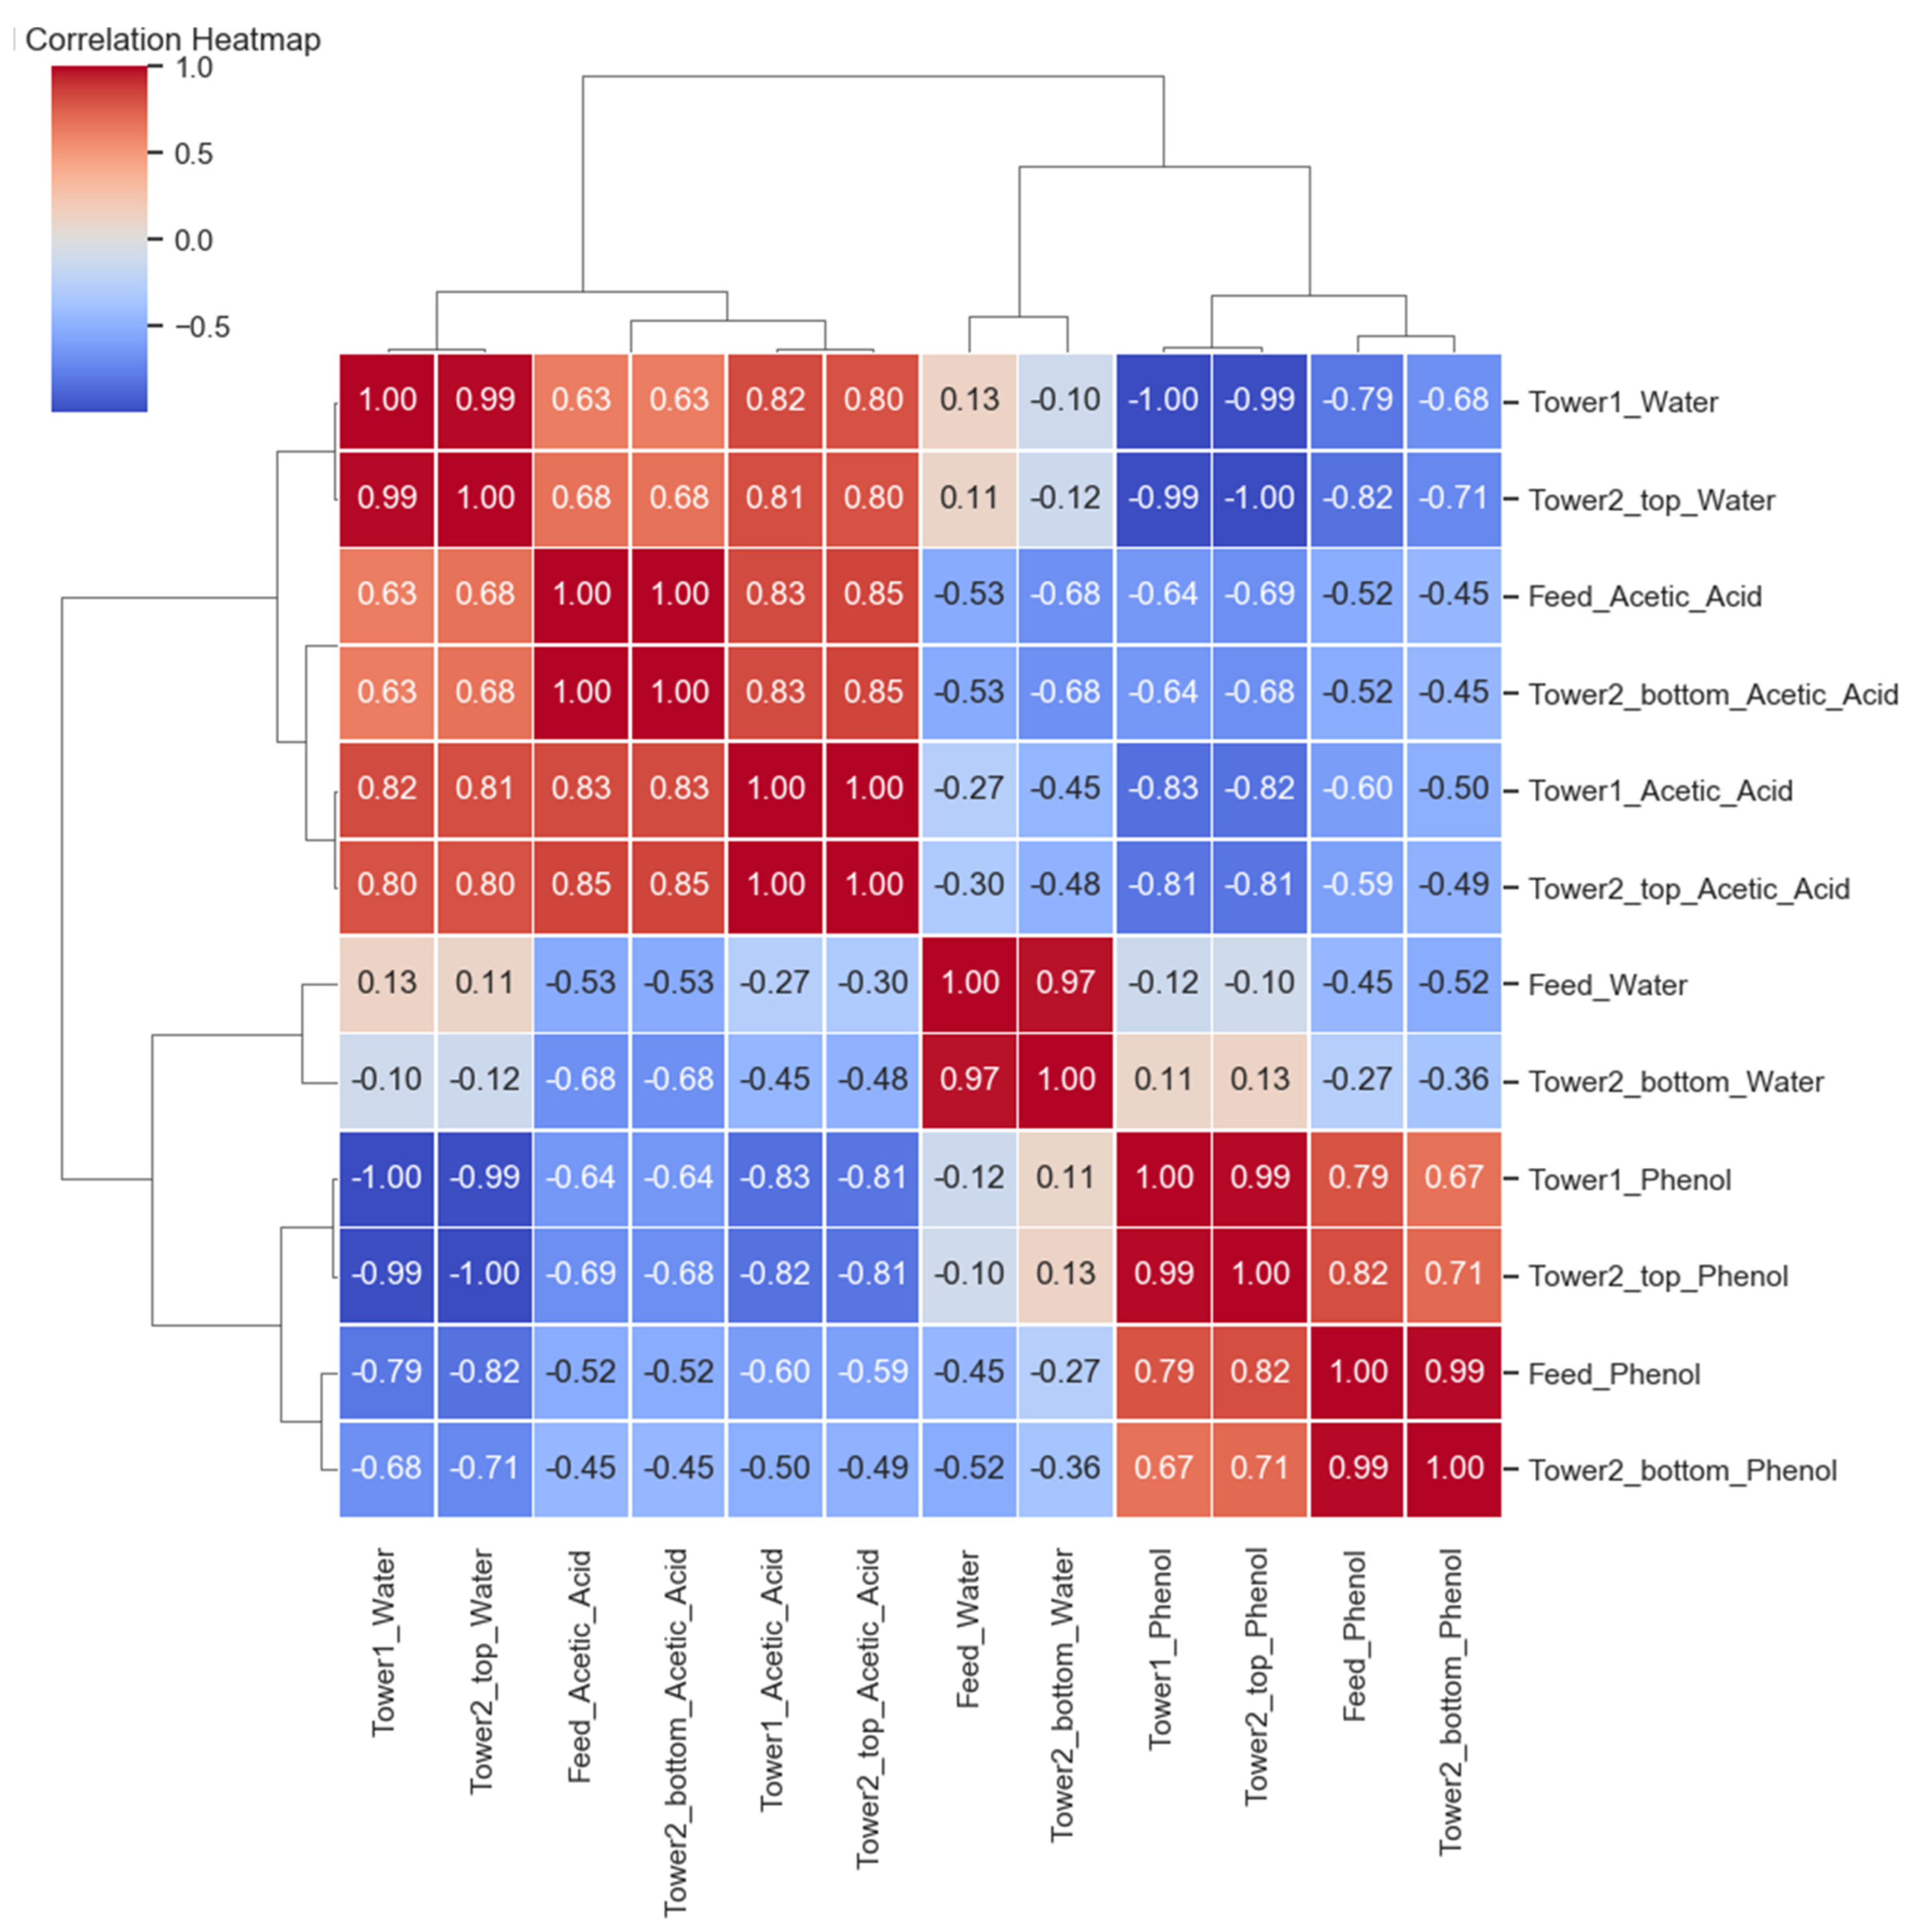
The chart in Figure 3 presents the results of cluster correlation analysis between the feature variables in the dataset of this study, specifically reflecting the relationships among different components in the feed and the output streams of the two separation columns. The results are displayed in a heatmap, where the color intensity indicates the strength of the correlation coefficient. For example, the correlation coefficient between the water content in the feed (ranging from 70% to 95%) and the water content in the output stream of the top of Column 1 (ranging from 27.39% to 29.99%) is as high as 0.92, indicating a significant impact of feed water on the water content at the column top. Similarly, the correlation coefficient between the acetic acid content in the feed (0% to 30%) and the acetic acid content at the bottom of the column (0% to 0.108%) is 0.85, showing a strong positive correlation, suggesting that the proportion of acetic acid in the feed directly influences the composition of the bottom product. The correlation coefficient between the phenol content in the feed (0% to 30%) and the phenol content at the bottom of the column (0% to 24.79%) reaches 0.88, further validating the critical role of phenol in the separation process.

Figure 3.
Cluster correlation analysis result.
Column 1 and Column 2 also exhibit high correlation between the components at the same output positions. Particularly, the correlation coefficient for water content at the top of both columns is 0.95, for acetic acid it is 0.89, and for phenol it is 0.90, reflecting the consistency of separation efficiency and selectivity between the two columns. In addition, supplementary experimental data points (such as water contents of 70.5%, 71.25%, 73.1%, etc.) are located between the main cluster centers, with correlation coefficients above 0.80, confirming the consistency and reliability of the model’s predictions under non-benchmark conditions. The cluster correlation analysis reveals the strong relationships between the components in the feed and their corresponding components in the output streams of the separation columns, particularly the interactions of water, acetic acid, and phenol at various output positions. These results confirm the validity of the Aspen simulation experiment. Building on this data, modeling can be conducted using machine learning algorithms.
3.4. Regression Model Construction
In this study, a multi-output regression strategy was adopted to construct two different types of prediction models. The first model is a decision tree regression model based on the CART (Classification and Regression Trees) algorithm. This model recursively divides the feature space into several regions and establishes local prediction models within each region. The second model is a Random Forest regression model containing 100 base learners, which utilizes an ensemble learning approach to enhance the model’s generalization capability. The Random Forest model builds sub-models using bootstrap sampling techniques and increases model diversity through random feature selection.
Model evaluation was conducted using a multidimensional evaluation system, including Mean Absolute Error (MAE), Mean Squared Error (MSE), and the Coefficient of Determination (R2). MAE reflects the average absolute deviation between the predicted values and the true values. MSE measures the model’s accuracy by penalizing the square of the errors. R2 provides the proportion of the data’s variability that is explained by the model. These metrics collectively help assess the model’s performance in terms of prediction accuracy and its ability to explain the underlying patterns in the data.
4. Results and Discussion
4.1. Regression Model Result
Table 2 compares the performance metrics of the Decision Tree and Random Forest models in predicting feed water content, acetic acid content, and phenol content. The results clearly indicate that the Random Forest model outperforms the Decision Tree model for all prediction variables. For feed water content (Feed_Water), the Random Forest model achieves a Mean Absolute Error (MAE) of 0.334, a Mean Squared Error (MSE) of 0.142, and a Coefficient of Determination (R2) of 0.992, demonstrating a high level of accuracy in predicting water content. In contrast, the Decision Tree model has a higher MAE of 0.707, MSE of 1.995, and R2 of 0.882 for this variable. For acetic acid content (Feed_Acetic_Acid), the Random Forest model also shows superior performance, with MAE = 0.278, MSE = 0.108, and R2 = 0.981. The Decision Tree model performs reasonably well with MAE = 0.235, MSE = 0.345, and R2 = 0.938, but still lags behind the Random Forest model. When predicting phenol content (Feed_Phenol), the Random Forest model excels with MAE = 0.171, MSE = 0.042, and R2 = 0.990, indicating an almost perfect fit to the phenol content data. The Decision Tree model, however, has an MAE of 0.500, MSE of 1.750, and an R2 of 0.556, highlighting a much lower predictive capability for phenol content.
Table 2.
Performance metrics of Decision Tree and Random Forest models for predicting feed variables.
Additionally, it is evident that the Random Forest model consistently outperforms the Decision Tree model across all predictive variables, including Feed_Phenol. The R2 values for Feed_Phenol are notably different, with the Decision Tree model achieving an R2 of 0.556 and the Random Forest model achieving a significantly higher R2 of 0.990. The superior performance of the Random Forest model can be attributed to several key factors. Firstly, Random Forest mitigates the risk of overfitting by averaging the predictions of multiple trees, each trained on a different subset of the data and features. This averaging process reduces the variance of the model, leading to better generalization performance. Secondly, the use of bootstrap samples and feature subsets to grow each tree introduces diversity among the trees, which is beneficial for capturing a broader range of patterns in the data, especially when dealing with complex relationships such as those that may exist with Feed_Phenol. Additionally, Random Forest is more effective in capturing non-linear relationships and interactions between variables compared to a single Decision Tree, a capability that is crucial for variables where the relationship with predictors is not straightforward. Lastly, the ensemble nature of Random Forest makes it more robust to noise in the data, leading to more stable and reliable predictions, as reflected in the higher R2 value observed for Feed_Phenol. These factors contribute to the enhanced performance of Random Forest model in predicting feed variables. Therefore, the observed differences in R2 values, particularly for Feed_Phenol, can be attributed to the inherent strengths of the Random Forest model in handling complex, non-linear relationships and its robustness to overfitting and noise.
4.2. Comparison of Predicted Values and Actual Values
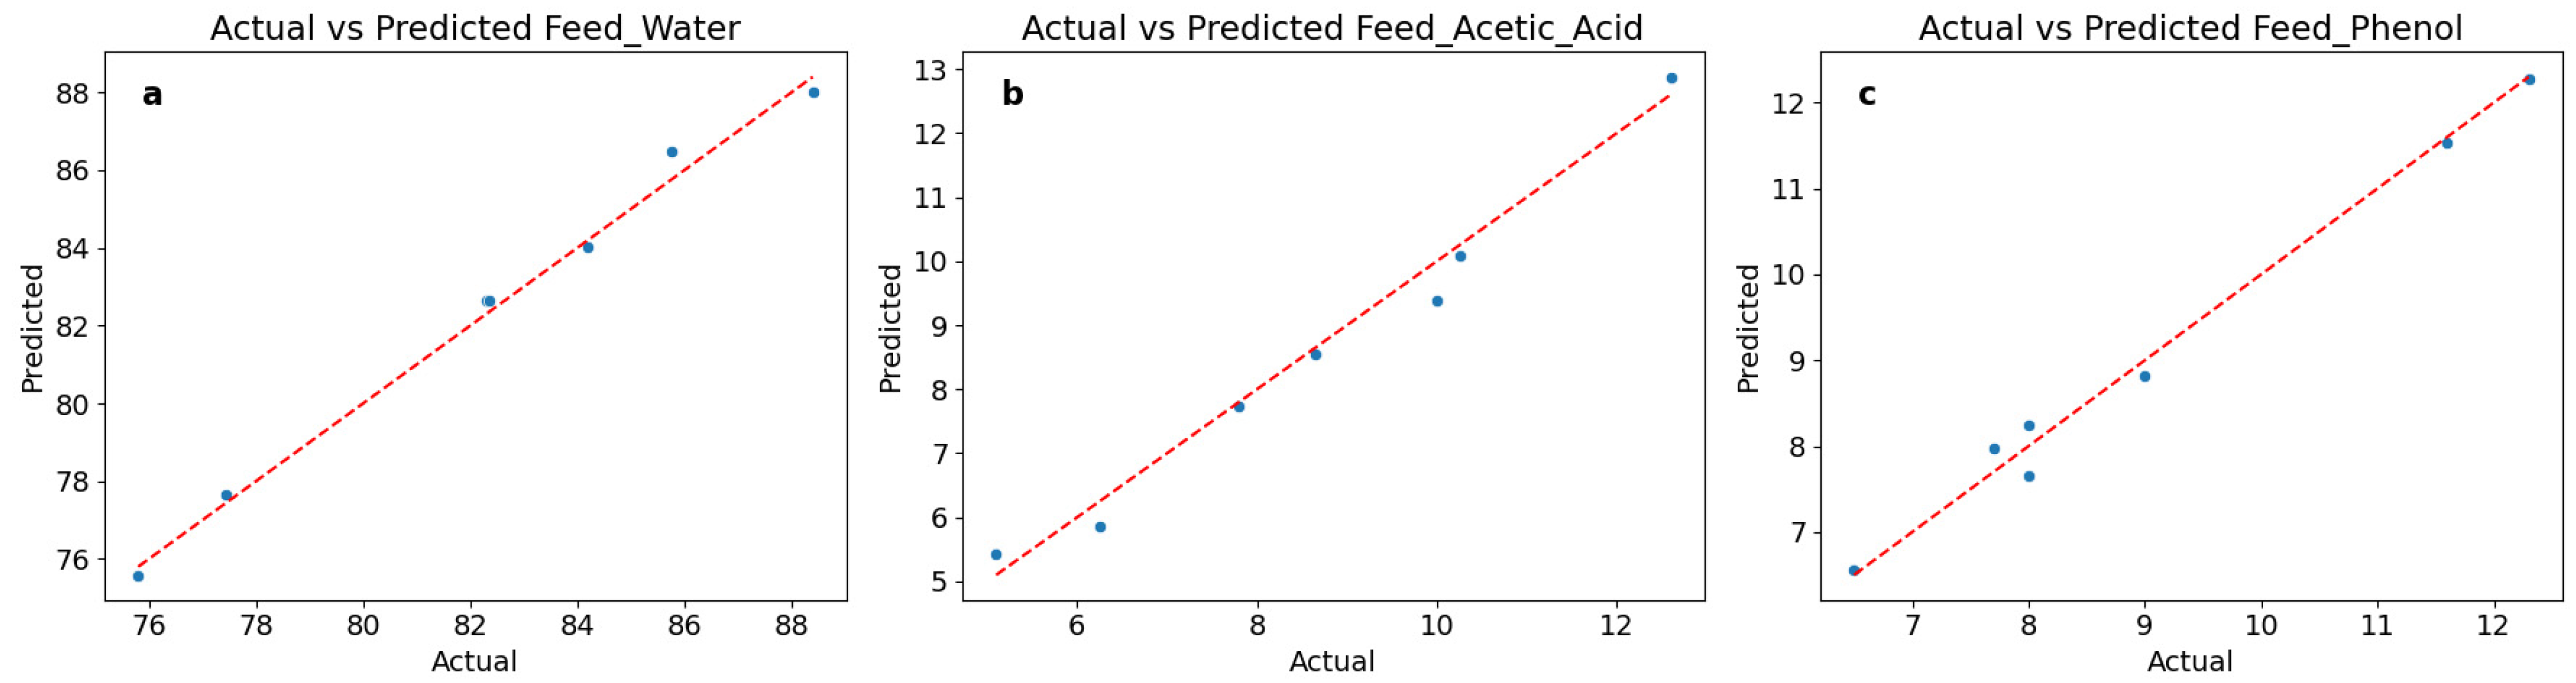
Figure 4 shows the comparisons between the predicted values from the Random Forest model and the actual data obtained by simulation, highlighting the predictive performance characteristics of the model across different variables. For water content (Feed_Water), the prediction results exhibit a strong linear relationship, with predicted and actual values distributed around the ideal prediction line. In the low-value range (75–80), the model demonstrates high accuracy. For example, the predicted value of 75.5875 corresponds to an actual value of 75.8, resulting in an error of only 0.2125. However, in the high-value range (82–88), there is a slight overestimation trend, with predicted values generally being 1–2 percentage points higher than the actual values, which is consistent with the MAE of 0.334. Overall, the R2 value of 0.992 reflects the model’s exceptional ability to capture variations in water content. For acetic acid content (Feed_Acetic_Acid), the predictions show a certain systematic bias. In the high-value region (10–13 range), the predictions are relatively accurate. For instance, the predicted value of 12.8785 corresponds to an actual value of 12.6. However, as the actual values decrease, the prediction accuracy gradually declines, particularly in the low-value region (5–8 range), where there is a noticeable underestimation. This explains why its R2 value (0.981) is slightly lower than that of the water content prediction. Nevertheless, the MAE of 0.278 indicates that the overall prediction error remains within an acceptable range. For phenol content (Feed_Phenol), prediction performance is outstanding, aligning perfectly with the excellent model metrics (R2 = 0.990, MAE = 0.171). The comparison between predicted and actual values shows that high prediction accuracy is maintained across the entire value range (6.5–12.3). Whether at the extreme points (e.g., an actual value of 12.3 with a predicted value of 12.275, or an actual value of 6.5 with a predicted value of 6.567) or within the middle value range, the prediction errors remain small, demonstrating the stability and reliability of the model.
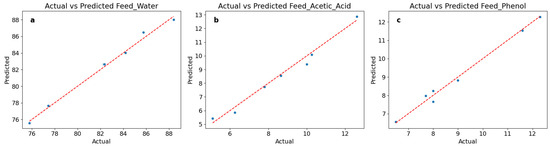
Figure 4.
Comparisons of Actual and Predicted Values for Different Feed Components: (a) Feed Water; (b) Acetic Acid; (c) Phenol.
4.3. Decision Tree Visualization
Figure 5 illustrates the visualization analysis of the First Decision Tree in a Random Forest Model. It reveals the decision-making process and the importance of various features. In the second-level split, the model uses Tower2_bottom_Phenol (<=0.446) and Tower1_Acetic_Acid (<=1.318) as the decision criteria. This splitting strategy reveals that there is a significant correlation between the component contents at different tower positions. Specifically, the phenol content at Tower 2 bottom and the acetic acid content at Tower 1 are identified as secondary important predictive features. The thresholds chosen for these splits (0.446 and 1.318) provide crucial reference points for optimizing subsequent process parameters. As the tree deepens, it can be found that the squared error value gradually decreases, from 61.304 at the root node to near zero at the leaf nodes. This indicates that the model successfully reduces prediction errors through successive splits. The sample sizes at the leaf nodes are mostly between one and four, suggesting that the model is effective at distinguishing between groups of samples with similar features. For example, when Tower 2 bottom_Acetic_Acid <= 0.159 and Tower 2 bottom Phenol <= 0.446, the model can accurately classify samples into specific component ratio ranges. Analysis of feature usage frequency shows that the component contents (water, acetic acid, and phenol) at Tower 1 and Tower 2 bottom repeatedly appear in the decision process, confirming their importance in predicting the feed composition. Notably, the acetic acid and phenol contents at Tower 2 bottom, and the acetic acid content at Tower 1, appear as key splitting nodes multiple times, indicating that these features are strongly correlated with the feed composition. Meanwhile, the visualization analysis demonstrates that the model has stable performance when handling extreme values and boundary conditions. For example, when Tower 2 bottom_Acetic_Acid > 1.919, the model accurately predicts the corresponding feed composition. This indicates that the model maintains robust predictive performance even under conditions of significant fluctuations in process parameters.
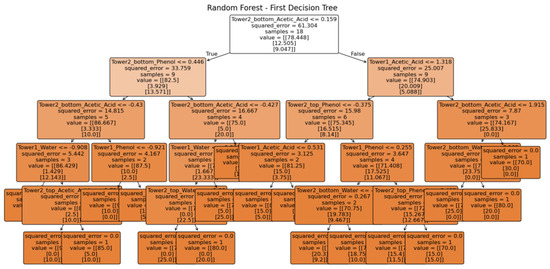
Figure 5.
Visualization analysis of the First Decision Tree in a Random Forest Model.
4.4. Analysis of Model Application Value
In the present work, a systematic evaluation of the Decision Tree and Random Forest models is provided, offering an in-depth exploration of the potential applications of machine learning methods in predicting process parameters for multicomponent separation. The findings demonstrate that the Random Forest model has excellent performance in predicting the three feed components, especially achieving an R2 value of 0.990 in phenol content prediction, reflecting exceptional prediction ability. This high-precision prediction performance provides reliable technical support for real-time parameter estimation and process control in industrial production processes. The model also performs well in predicting water content with an R2 value of 0.992. Notably, in the low water content range of 75–80%, the prediction results are highly consistent with the actual values, which can provide an important reference for process parameter optimization. Nevertheless, the study also identifies several limitations with the current model. In terms of acetic acid content prediction, although the overall MAE remains at an acceptable level of 0.278, systematic underestimation can be observed in the low concentration range from 5 to 8%. This prediction bias suggests the need to optimize model performance over specific concentration intervals. Additionally, the current dataset is mainly constructed based on seven benchmark levels and nine sets of supplementary experimental data, and the predictive ability for a broader range of component ratio combinations requires further verification. The negative R2 value of the Decision Tree model for phenol prediction also indicates that a single algorithm cannot meet all prediction demands. Based on the above findings, future studies should carry out optimization work in multiple directions. In terms of model improvement, deep learning methods could be considered, particularly to address the systemic bias observed in acetic acid content prediction. Additionally, it could be beneficial for exploring ensemble model strategies to select the optimal algorithm for different components. Feature engineering optimization could involve the introduction of interaction terms between components as new features. Regarding data augmentation, efforts should be made to expand the coverage of experimental data, particularly in concentration ranges where the current model performs inadequately. Data collection under conditions of process fluctuations should be increased to enhance model robustness. Furthermore, the integration of operational parameters such as temperature and pressure as auxiliary features could be explored.
4.5. Research Significance of Wood Vinegar Component Analysis
In this study, the accuracy and efficiency of wood vinegar component analysis in industrial environments are significantly improved by the construction and evaluation of various machine learning models. Accurate component analysis is crucial for optimizing distillation process parameters and increasing the extraction rates of target products such as acetic acid and phenol. Traditional detection methods are often dependent on complex and time-consuming chemical analysis processes, but the Random Forest model adopted in the present case can realize real-time monitoring and dynamic adjustment of production processes with its high precision and rapid prediction capabilities. This not only reduces human error and labor intensity, but also remarkably improves the automation level and stability of the production process. Furthermore, precise component analysis helps to ensure the consistency and high quality of wood vinegar products, and thereby their competitive advantages are enhanced in diverse applications across the chemical, agricultural, and environmental sectors. Building on the findings of this study, the developed machine learning prediction model has good scalability and adaptability, which makes it suitable for broader applications in the detection and optimization of wood vinegar components. The composition components of wood vinegar primarily include acetic acid, phenols, propionic acid, total organic carbon, ammonia nitrogen, sulfates, sulfites, sulfides, chlorides, total phosphorus, nitrates, aluminum, arsenic, iron, manganese, hydrocarbons, and acetone. In addition, phenolic compounds are also commonly found in wood vinegar, which contribute to its diverse applications in agriculture, livestock farming, and pharmaceuticals. The model can effectively predict these components, thereby facilitating the optimization of the distillation process and improving the quality and yield of wood vinegar. Future studies can apply the model to more complex multi-component systems, encompassing a wider range of volatile organic compounds, and thereby the overall level of high value utilization of wood vinegar is improved. Meanwhile, by incorporating more process parameters (such as temperature, pressure, feed rate, etc.) as auxiliary features, the predictive capability and robustness of the model can be further enhanced. In addition, integrating deep learning techniques and big data analytics could facilitate the development of more advanced intelligent control systems, enabling full automation and smart management of the wood vinegar production process. This not only promotes the realization of green chemistry and sustainable development but also provides strong technical support for the intelligent transformation of the biomass chemical industry, which can offer significant industrial application prospects and social and economic value.
5. Conclusions
In this study, the integration of advanced machine learning techniques with process simulation has been successfully implemented to optimize the dual-column distillation of wood vinegar. By employing Random Forest models in conjunction with Aspen Plus simulations, the separation efficiency of critical components can be significantly improved, including acetic acid and phenol. The AI-driven adaptive control system enhances the process stability through real-time optimization. It is also expected that the proposed system probably leads to a reduction of ~14% in energy consumption as compared to conventional distillation processes. These results underscore the value of machine learning and simulation-based optimization in improving both the economic and environmental aspects of bio-based chemical production. Notably, the Random Forest model demonstrates superior predictive accuracy, and thereby, an R2 of 0.9728 can be achieved for the phenol concentration estimation, which surpasses the traditional decision tree methods. These findings reflect the potential of the AI-driven system in controlling the distillation process under varying feeding conditions. The integration of green chemistry principles and intelligent control systems meet the demands of sustainable development and Industry 4.0 within the biomass chemical industry. Future research should focus on extending model capabilities by incorporating a broader range of process variables and adopting advanced deep learning techniques to further enhance automation, efficiency, and sustainability in bio-based production.
Author Contributions
Conceptualization was performed by S.L. and H.Z.; Methodology was developed by S.L.; Software development was handled by Q.X. and H.Z.; Validation was carried out by S.L., H.Z. and W.S.; Data curation was conducted by W.S. and Q.X.; Writing—original draft preparation was completed by S.L.; Writing—review and editing was conducted by H.Z.; Visualization was prepared by W.S.; Supervision was overseen by S.L.; Project administration was managed by H.Z.; Funding acquisition was handled by W.S. All authors have read and agreed to the published version of the manuscript.
Funding
This research has been supported by the National Natural Science Foundation of China (No. 52401140).
Data Availability Statement
The data and source code used in this research are available upon request by contacting the corresponding author.
Conflicts of Interest
The authors declare no conflicts of interest.
References
- Wang, C.; Zhang, S.; Huang, S.; Cao, Z.; Xu, J.; Lyu, J. Effect of hydrothermal treatment on biomass structure with evaluation of post-pyrolysis process for wood vinegar preparation. Fuel 2021, 305, 121513. [Google Scholar] [CrossRef]
- Xu, J.; Zhang, S.; Shi, Y.; Zhang, P.; Huang, D.; Lin, C.; Wu, Y. Upgrading the wood vinegar prepared from the pyrolysis of biomass wastes by hydrothermal pretreatment. Energy 2022, 244, 122631. [Google Scholar] [CrossRef]
- Aguirre, J.L.; Baena, J.; Martín, M.T.; Nozal, L.; González, S.; Manjón, J.L.; Peinado, M. Composition, ageing and herbicidal properties of wood vinegar obtained through fast biomass pyrolysis. Energies 2020, 13, 2418. [Google Scholar] [CrossRef]
- Lu, X.; Han, T.; Jiang, J.; Sun, K.; Sun, Y.; Yang, W. Comprehensive insights into the influences of acid-base properties of chemical pretreatment reagents on biomass pyrolysis behavior and wood vinegar properties. J. Anal. Appl. Pyrolysis 2020, 151, 104907. [Google Scholar] [CrossRef]
- Pimenta, A.S.; Gama, G.S.P.; Feijó, F.M.C.; Martins Braga, R.; Barbosa de Azevedo, T.K.; de Melo, R.R.; de Oliviera Miranda, N.; Siqueira de Andrade, G. Wood Vinegar from Slow Pyrolysis of Eucalyptus Wood: Assessment of Removing Contaminants by Sequential Vacuum Distillation. Forests 2023, 14, 2414. [Google Scholar] [CrossRef]
- Wang, C.; Zhang, S.; Wu, S.; Cao, Z.; Zhang, Y.; Li, H.; Jiang, F.; Lyu, J. Study on an alternative approach for the preparation of wood vinegar from the hydrothermolysis process of cotton stalk. Bioresour. Technol. 2018, 254, 231–238. [Google Scholar] [CrossRef]
- Gama, G.S.P.; Pimenta, A.S.; Feijó, F.M.C.; Aires, C.A.M.; de Melo, R.R.; Dos Santos, C.S.; Dantas de Medeiros, L.C.; da Costa Monteiro, T.V.; Fasciotti, M.; Lira de Medeiros, P.; et al. Antimicrobial Impact of Wood Vinegar Produced Through Co-Pyrolysis of Eucalyptus Wood and Aromatic Herbs. Antibiotics 2024, 13, 1056. [Google Scholar] [CrossRef]
- Morales, M.M.; Sartori, W.W.; Silva, B.R.; Spera, S.T.; Mendes, A.B.D.; Ambrosio-Albuquerque, E.P. Wood vinegar: Chemical characteristics, phytotoxic effects, and impacts on greenhouse gas emissions. Nativa 2022, 10, 400–409. [Google Scholar] [CrossRef]
- Ouattara, H.A.A.; Niamké, F.B.; Yao, J.C.; Amusant, N.; Garnier, B. Wood vinegars: Production processes, properties, and valorization. For. Prod. J. 2023, 73, 239–249. [Google Scholar] [CrossRef]
- Theapparat, Y.; Chandumpai, A.; Faroongsarng, D. Physicochemistry and utilization of wood vinegar from carbonization of tropical biomass waste. In Tropical Forests; IntechOpen: London, UK, 2018; pp. 163–183. [Google Scholar]
- Lu, X.; Jiang, J.; He, J.; Sun, K.; Sun, Y. Synergy of Hydrothermal and Organic Acid Washing Treatments in Chinese Fir Wood Vinegar Preparation. ACS Omega 2020, 5, 13685–13693. [Google Scholar] [CrossRef]
- Wang, J.; Zhang, B.; Xun, H.; Yao, X.; Tang, F. Simultaneous Quantification of Twelve Compounds from Bamboo/Wood Vinegar by Gas Chromatography-Mass Spectrometry. Separations 2024, 11, 168. [Google Scholar] [CrossRef]
- Yang, J.F.; Yang, C.H.; Liang, M.T.; Gao, Z.J.; Wu, Y.W.; Chuang, L.Y. Chemical composition, antioxidant, and antibacterial activity of wood vinegar from Litchi chinensis. Molecules 2016, 21, 1150. [Google Scholar] [CrossRef]
- Wibowo, S.; Syafii, W.; Pari, G.; Herliyana, E.; Saputra, N.; Efiyanti, L. The effect of pyrolysis temperature stratification on the chemical compound of wood vinegar production from hardwood, softwood, and bamboo. Rasayan J. Chem. Spec. 2023, 2022, 189–197. [Google Scholar] [CrossRef]
- Mengfan, L.; Jingjing, Y.; Chengliang, Z.; Runqin, H.; Zhongguo, Z.; Wenbo, C. Quantitative analysis of multi-components by single-marker: An effective method for the chemical characterization of wood vinegar. Ind. Crops Prod. 2022, 182, 114862. [Google Scholar] [CrossRef]
- Wu, Q.; Zhang, S.; Hou, B.; Zheng, H.; Deng, W.; Liu, D.; Tang, W. Study on the preparation of wood vinegar from biomass residues by carbonization process. Bioresour. Technol. 2015, 179, 98–103. [Google Scholar] [CrossRef]
- Iacomino, G.; Idbella, M.; Staropoli, A.; Nanni, B.; Bertoli, T.; Vinale, F.; Bonanomi, G. Exploring the Potential of Wood Vinegar: Chemical Composition and Biological Effects on Crops and Pests. Agronomy 2024, 14, 114. [Google Scholar] [CrossRef]
- Dantas de Medeiros, L.C.; Pimenta, A.S.; Martins Braga, R.; de Azevedo Carnaval, T.K.; Medeiros Neto, P.N.; de Araújo Melo, D.M. Effect of pyrolysis heating rate on the chemical composition of wood vinegar from Eucalyptus urograndis and Mimosa tenuiflora. Rev. Árvore 2019, 43, e430408. [Google Scholar] [CrossRef]
- Gama, G.S.P.; Pimenta, A.S.; Feijó, F.M.C.; Barbosa de Azevedo, T.K.; de Melo, R.R.; Siqueria de Andrade, G. The Potential of Wood Vinegar to Replace Antimicrobials Used in Animal Husbandry—A Review. Animals 2024, 14, 381. [Google Scholar] [CrossRef]
- Xue, R.; Cui, E.L.; Hu, G.Q.; Zhu, M.Q. The composition, physicochemical properties, antimicrobial and antioxidant activity of wood vinegar prepared by pyrolysis of Eucommia ulmoides Oliver branches under different refining methods and storage conditions. Ind. Crops Prod. 2022, 178, 114586. [Google Scholar] [CrossRef]
- Yin, D.; Xue, R.; Li, Y.; Zhu, M.; Li, D. Valorization of Coptis chinensis extraction residue via slow pyrolysis for the production of bioactive wood vinegar. Biomass Convers. Biorefin. 2024, 14, 16559–16574. [Google Scholar] [CrossRef]
- Song, Z.; Wang, Y.; Zhu, J.; Xu, Y.; Zou, A.; Shen, D.; Li, M.; Tang, J.; Wu, Z.; Liu, W. Sustainable production of environmentally-friendly calcium acetate deicer from wood vinegar by ozonation. Ind. Crops Prod. 2022, 180, 114775. [Google Scholar] [CrossRef]
- Franke, M.B. Mixed-integer optimization of distillation sequences with Aspen Plus: A practical approach. Comput. Chem. Eng. 2019, 131, 106583. [Google Scholar] [CrossRef]
- Silva, W.C.; Araújo, E.C.C.; Calmanovici, C.E.; Bernardo, A.; Giulietti, M. Environmental assessment of a standard distillery using aspen plus®: Simulation and renewability analysis. J. Clean. Prod. 2017, 162, 1442–1454. [Google Scholar] [CrossRef]
- Hou, W.; Su, H.; Hu, Y.; Chu, J. Modeling, simulation and optimization of a whole industrial catalytic naphtha reforming process on Aspen Plus platform. Chin. J. Chem. Eng. 2006, 14, 584–591. [Google Scholar] [CrossRef]
- Mhamdi, R. Evaluating the evolution and impact of wood vinegar research: A bibliometric study. J. Anal. Appl. Pyrolysis 2023, 175, 106190. [Google Scholar] [CrossRef]
- Rizal, W.A.; Wahono, S.K.; Yuliansyah, A.T. Enhancing wood vinegar quality: Integrated pyrolysis process of cajuput (Melaleuca leucadendron) twigs biomass with gas-phase adsorption using zeolite adsorbents. Bioresour. Technol. Rep. 2024, 26, 101840. [Google Scholar] [CrossRef]
- Hagner, M.; Kuoppala, E.; Fagernäs, L.; Tiilikkala, K.; Setälä, H. Using the Copse snail Arianta arbustorum (Linnaeus) to Detect Repellent Compounds and the Quality of wood Vinegar. Int. J. Environ. Res. 2015, 9, 53–60. [Google Scholar]
- Ekundayo, F. Leveraging AI-Driven Decision Intelligence for Complex Systems Engineering. Int. J. Res. Publ. Rev. 2024, 5, 5489–5499. [Google Scholar] [CrossRef]
- Himeur, Y.; Elnour, M.; Fadli, F.; Meskin, N.; Petri, I.; Rezgui, Y.; Bensaali, F.; Amira, A. AI-big data analytics for building automation and management systems: A survey, actual challenges and future perspectives. Artif. Intell. Rev. 2023, 56, 4929–5021. [Google Scholar] [CrossRef]
- Carpanzano, E.; Knüttel, D. Advances in artificial intelligence methods applications in industrial control systems: Towards cognitive self-optimizing manufacturing systems. Appl. Sci. 2022, 12, 10962. [Google Scholar] [CrossRef]
- Kwon, H.; Oh, K.C.; Choi, Y.; Chung, Y.G.; Kim, J. Development and application of machine learning-based prediction model for distillation column. Int. J. Intell. Syst. 2021, 36, 1970–1997. [Google Scholar] [CrossRef]
- Mahida, B.; Medjahdi, M.; Khelifa, I.; Mazouzi, S.; Maghdouri, H. Separation of acetic acid and ethanol from wastewater by distillation process with addition of side draw stream. Chem. Pap. 2022, 77, 837–846. [Google Scholar] [CrossRef]

Disclaimer/Publisher’s Note: The statements, opinions and data contained in all publications are solely those of the individual author(s) and contributor(s) and not of MDPI and/or the editor(s). MDPI and/or the editor(s) disclaim responsibility for any injury to people or property resulting from any ideas, methods, instructions or products referred to in the content. |
© 2025 by the authors. Licensee MDPI, Basel, Switzerland. This article is an open access article distributed under the terms and conditions of the Creative Commons Attribution (CC BY) license (https://creativecommons.org/licenses/by/4.0/).