Article

Phytochemical Profiling and Antioxidant Activity of True Leaves and Cotyledons of Adenocaulon himalaicum

1
Department of Plant Science and Technology, Chung-Ang University, Anseong 17546, Republic of Korea
2
Gyeonggi-do Forestry Environment Research Center, Osan 18118, Republic of Korea
3
Natural Product Institute of Science and Technology, Anseong 17546, Republic of Korea
*
Author to whom correspondence should be addressed.
ChemEngineering 2025, 9(2), 31; https://doi.org/10.3390/chemengineering9020031
Submission received: 8 January 2025 / Revised: 21 February 2025 / Accepted: 6 March 2025 / Published: 10 March 2025

Abstract

:
Adenocaulon himalaicum is widely distributed across Asia. In its early growth stages, A. himalaicum is traditionally consumed as a food source in Korea. Although previous research has identified the presence of bioactive compounds in A. himalaicum extract, suggesting its potential as a medicinal resource, the phytochemical profile of A. himalaicum extract has not been extensively determined. This investigation aimed to identify the phytochemicals present in the true leaf and cotyledon of A. himalaicum (TLA and CLA, respectively) and evaluate their radical-scavenging activity. By performing LC-MS/MS and HPLC, varying amounts of isochlorogenic acid A, cryptochlorogenic acid, isochlorogenic acid B, rutin, chlorogenic acid, hyperin, and neochlorogenic acid were detected in the TLA and CLA extracts. Chlorogenic acid (9.002 mg/g DW), isochlorogenic acid A (28.512 mg/g DW), and isochlorogenic acid B (12.223 mg/g DW) were the most abundant in TLA. TLA exhibited higher phytochemical content (49.737 mg/g DW), total phenolic content (45.51 mg tannic acid equivalent/g extract), and total flavonoid content (16.24 mg quercetin equivalent/g extract) than CLA. Moreover, the radical-scavenging activity of TLA was two times higher than that of CLA. The young leaf of A. himalaicum has a rich phytochemical profile and robust antioxidant activity; hence, it has potential as natural antioxidant sources for human health and valuable pharmacognosy raw materials for pharmaceutical and functional food applications.

1. Introduction

Adenocaulon himalaicum Edgew. is classified as a long-lived herbaceous plant (the Asteraceae family). It typically grows in moist and shady environments in forests and mountainous regions and is commonly referred to as the Asian trail plant. The species is widely distributed across Central Asia, East Asia, and Russia. Due to its strong environmental adaptability, A. himalaicum shows minimal differences in antioxidant activity between invasive and native populations, suggesting its potential for commercial cultivation and broader utilization [1].
Although A. himalaicum is a commonly found plant, its bioactive properties have not been extensively studied. Previous studies have demonstrated that A. himalaicum can mitigate skin damage and delay aging by suppressing inflammatory responses [2]. Furthermore, A. himalaicum has been reported to exhibit immunostimulatory and anti-obesity effects, contributing to immune system enhancement and metabolic disorder management [3]. Additionally, A. himalaicum has been studied for its anticancer properties [4].
However, these studies have primarily focused on whole-plant crude extracts, and a systematic investigation regarding the chemical constituents and antioxidative properties of its edible leaf remains unexplored. Notably, the early-stage leaves of A. himalaicum have traditionally been consumed as food sources in Korea [2]. Given this historical use, it is essential to characterize the specific bioactive compounds and evaluate the antioxidant capacity of its edible leaf.
This investigation aims to address this research gap by qualitatively and quantitatively analyzing key phytochemicals in the true leaf and cotyledon of A. himalaicum (TLA and CLA, respectively). Furthermore, we analyzed their radical-scavenging activity as an indicator of antioxidant potential. These findings will enhance the understanding of A. himalaicum’s potential as a natural antioxidant source for health-promoting applications and as a valuable pharmacognosy raw materials for pharmaceutical and functional food applications.

2. Materials and Methods

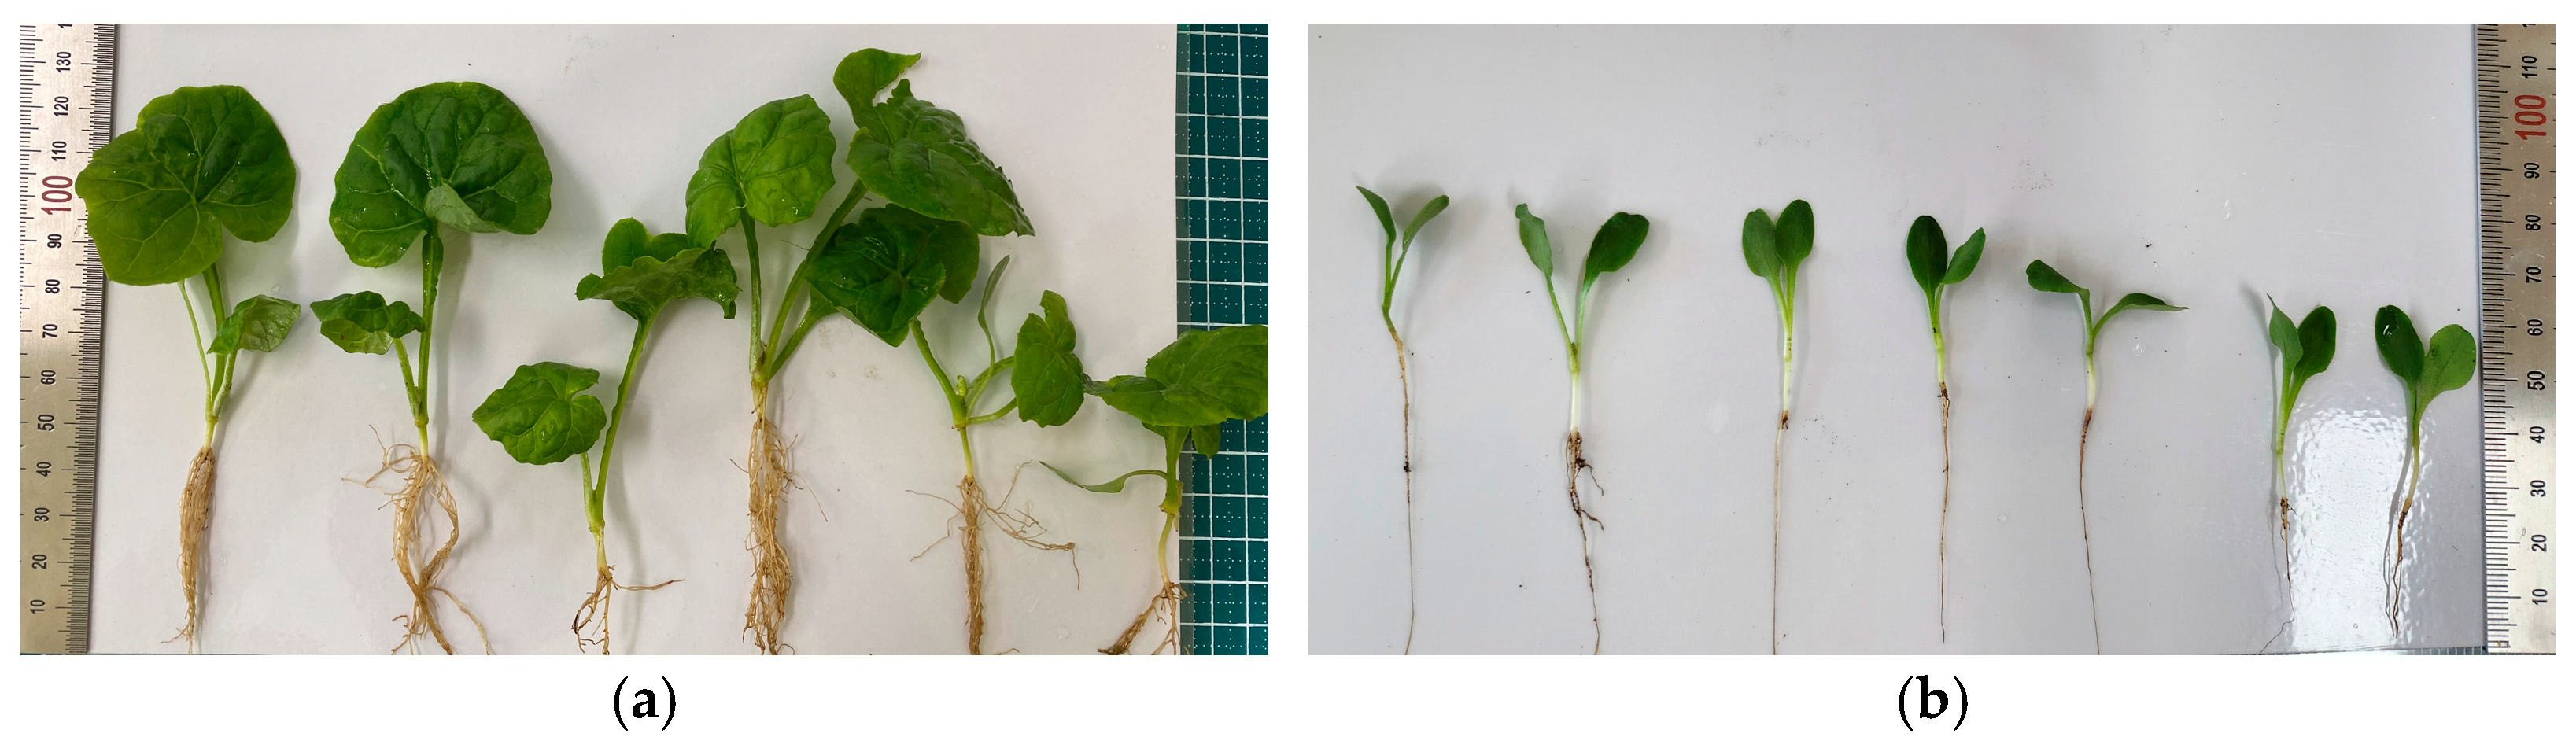
2.1. Plant Materials

The A. himalaicum seeds were acquired from Daehak mountain (37°40′50.26″ N; 128°5′27.83″ E), Hongcheon, Republic of Korea (October 2022). To break seed dormancy, the seeds were subjected to cold stratification at 3 °C for 3 weeks. The seeds were sown on the field of the Gyeonggi-do Forestry Environment Research Center (early April 2023), Osan, Republic of Korea, and the resulting seedlings of TLA and CLA were analyzed (Figure 1). The cultivation climate conditions of sowing site were as follows: an average temperature of 25.65 °C, an average humidity of 88.86%, and an average soil moisture content of 31.65%.

2.2. Apparatus and Chemicals

Quantitative analysis was performed on an HPLC (Waters Alliance 2695, Milford, MA, USA) with a PDA detector (Waters 996, Milford, MA, USA), a pump, and an auto-sampler with an INNO C18 column (25 cm × 4.6 mm; pore size 5 μm) (YMC, Kyoto, Japan). LC–MS/MS analysis was conducted using an UHPLC system (Ultimate 3000, Thermo Scientific, San Jose, CA, USA) and a high-resolution mass spectrometer (Triple TOF 5600+, AB Sciex, Framingham, MA, USA). Organic solvent was evaporated by a vacuum rotary evaporator (OSB-2100, Eyela, Tokyo, Japan). HPLC solvents including MeOH, trifluoroacetic acid (TFA), and water were procured from J. T. Baker (Center Valley, PA, USA). The Folin–Ciocalteu reagent, tannic acid, quercetin, and AlCl3·6H2O were purchased from Sigma-Aldrich (St. Louis, MO, USA). The absorbance was conducted by using a microplate reader (Epoch; Bio Tek, Winooski, VT, USA). Neochlorogenic acid (1), chlorogenic acid (2), cryptochlorogenic acid (3), rutin (4), hyperin (5), isochlorogenic acid A (6), and isochlorogenic acid B (7) were supplied from the Natural Product Institute of Science and Technology (www.nist.re.kr; accessed on 6 June 2024), Anseong, Republic of Korea (Figure 2).

2.3. Sample Extraction

Dried TLA (10 g) and CLA (4 g) samples were finely crushed and refluxed with 30 volumes of EtOH for 3 h thrice. The EtOH extracts were concentrated by using a vacuum rotary evaporator. Subsequently, the extraction yield was calculated. The extraction method was performed according to a modified method from previous studies [5,6].

2.4. LC–MS/MS States

Chromatographic separation was performed utilizing an LC system that included a UHPLC and Waters Cortex C18 column (1.6 µm; 2.1 mm × 150 mm) kept at 45 °C. The flow rate was fixed at 0.25 mL/min. The mobile phase employed for gradient elution consisted of formic acid (0.1%) in water (A) and formic acid (0.1%) in acetonitrile (ACN) (B). The conditions of elution were set as follows: 3% B from 0 to 15 min, 15% B at 15 min, 100% B at 50 min, 100% B from 50 to 55 min, and 3% B again from 55.1 to 60 min. MS analysis was conducted using a Triple TOF+ mass spectrometer, which was equipped with an electrospray ion source operated under negative and positive ionization conditions. A full-scan MS spectrum (100–2000 m/z) and an MS/MS scan (30–2000 m/z) were acquired using Information-Dependent Acquisition scanning. The nebulizing and heating gases were set to 50 psi, and the curtain gas was maintained at 25 psi. The desolvation temperature was adjusted at 500 °C. The collision gas used in this study was nitrogen.

2.5. Sample Preparation and Standard Solutions for HPLC

TLA and CLA extracts (each 30 mg) were melted in 80% MeOH (4 mL). Compounds 17 (each 1 mg) were melted in 80% MeOH (1 mL). Afterwards, the samples were sonicated for 30 min and then filtered through a 0.20 μm membrane filter of PVDF. This procedure was adapted from a previously reported method with slight modifications [7].

2.6. HPLC/PDA Conditions

HPLC/PDA analysis using an RP HPLC system with an INNO C18 column kept at 35 °C was performed on TLA and CLA samples. The mobile phase employed in gradient elution consisted of 0.1% TFA in water (A) and ACN (B). The elution states were set as follows: 10% B from 0 to 18 min, 20% B at 18 min, 50% B at 28 min, 100% B from 38 to 48 min, and 10% B from 53 to 63 min. The column temperature was kept at 35 °C. The flow rate, injection volume, and wavelength were set at 1.0 mL/min, 10 μL, and 254 nm, respectively.

2.7. Calibration Curves

The calibration curve was established using standard stock solutions prepared through serial dilution, with concentrations ranging from 31.25 to 1000 ppm. The calibration function was defined using parameters such as the peak area (Y, mAU), concentration (X, µg/mL), and mean value (n = 3) ± SD. Additionally, linearity was evaluated by determining the correlation coefficient (r2), and the amounts of compounds 2, 6, and 7 in the extracts were quantified accordingly.

2.8. TPC Assay

The TPC was determined using the Folin–Ciocalteu method, following a previously described procedure [8]. The stock solutions of TLA and CLA samples were prepared through serial dilution, with concentrations ranging from 0.125 to 2.0 mg/mL. In a 96-well plate, 60 μL of each diluted sample was first added, followed by 40 μL of Folin–Ciocalteu (2N) agent, and then 100 μL of sodium carbonate (7.5%). This process was repeated thrice to ensure the accuracy and consistency of the experiment. The mixtures were mixed properly by a microplate shaker and allowed to react in the dark at room temperature for 30 min. After the reaction was completed, the absorbance of the samples was measured at 760 nm using a microplate reader. The standard solutions of tannic acid were prepared at concentrations of 100.0, 50.0, 25.0, 12.5, and 6.25 ppm.

2.9. TFC Assay

The TFC was assessed through an aluminum chloride colorimetric assay, as described in a previous study [8]. The stock solutions of TLA and CLA samples were prepared through serial dilution, with concentrations ranging from 0.125 to 2.0 mg/mL. First, 100 μL of each diluted sample was added to a 96-well plate. Next, 100 μL of AlCl3∙6H2O was added. This process was repeated thrice to ensure the accuracy and consistency of the experiment. The mixtures were mixed properly by using a microplate shaker and allowed to react for 10 min in the dark at room temperature. Following the completion of the reaction, sample absorbance was determined at 430 nm using a microplate reader. The standard solutions of quercetin were prepared at concentrations of 100.0, 50.0, 25.0, 12.5, and 6.25 ppm.

2.10. DPPH Assay

At the beginning of the assay, DPPH stock solution (2 mM) dissolved in MeOH was diluted to make a working solution. The DPPH working solution was diluted until it reached an absorbance of 0.8 at 514 nm. The stock solutions of the samples were serially diluted in various concentrations. First, 10 μL of each diluted sample was added to a 96-well plate, and 200 μL of the DPPH working solution was added to each sample. This process was repeated thrice to ensure the accuracy and consistency of the experiment. The mixtures were mixed properly by using a microplate shaker and allowed to react for 30 min at room temperature in the dark. Following the completion of the reaction, sample absorbance was determined at 514 nm using a microplate reader. Ascorbic acid (AA) was used as the standard. In the case of the blank test, 95% MeOH was used instead of the DPPH working solution.

2.11. ABTS+ Assay

At the beginning of the assay, the ABTS+ stock solution was made by dissolving ABTS+ (7.4 mM) and K2S2O8 (2.6 mM) in deionized water. The ABTS+ stock solution was diluted until it reached an absorbance of 1.0 at 734 nm. The stock solutions of the samples were serially diluted in various concentrations. First, 10 μL of each diluted sample was added to a 96-well plate, and 200 μL of the ABTS+ working solution was added to each sample. This process was repeated thrice to make sure of the accuracy and consistency of the experiment. The mixtures were mixed properly by a microplate shaker and allowed to react for 30 min at room temperature in the dark. Following the completion of the reaction, sample absorbance was determined at 734 nm using a microplate reader. AA was used as the standard. For the blank test, deionized water was used instead of the ABTS+ working solution.

2.12. Statistical Analysis

All experiments were performed in triplicate to reduce statistical errors and increase the reproducibility and reliability of the results. The results were expressed as the mean ± SD. The data were analyzed by Student’s t-test and one-way analysis of variance, followed by Tukey’s post hoc test. The normality of the data was tested prior to employing the statistical tests described above. The statistical tests were conducted in Graphpad Prism 8.0.2 (Graphpad Software, Boston, MA, USA). A p-value of less than 0.05 was regarded as an indicator of statistical significance, suggesting that the observed differences were unlikely to have occurred by chance.

3. Results and Discussion

3.1. Sample Extraction Yield

The extraction yields of 95% EtOH extracts derived from TLA and CLA samples were 38% and 40%, respectively (Table 1). Previous studies on A. himalaicum reported that the extraction yields of MeOH, aqueous, and 30% EtOH extracts were 17.8%, 20.2%, and 22.3%, respectively [2,9]. Among various extraction solvents, EtOH demonstrated the highest extraction yield. Congruent with the results of previous research, the extraction yield of the 95% EtOH used in this study was consistently high; it was approximately twice as high as that of 30% EtOH.

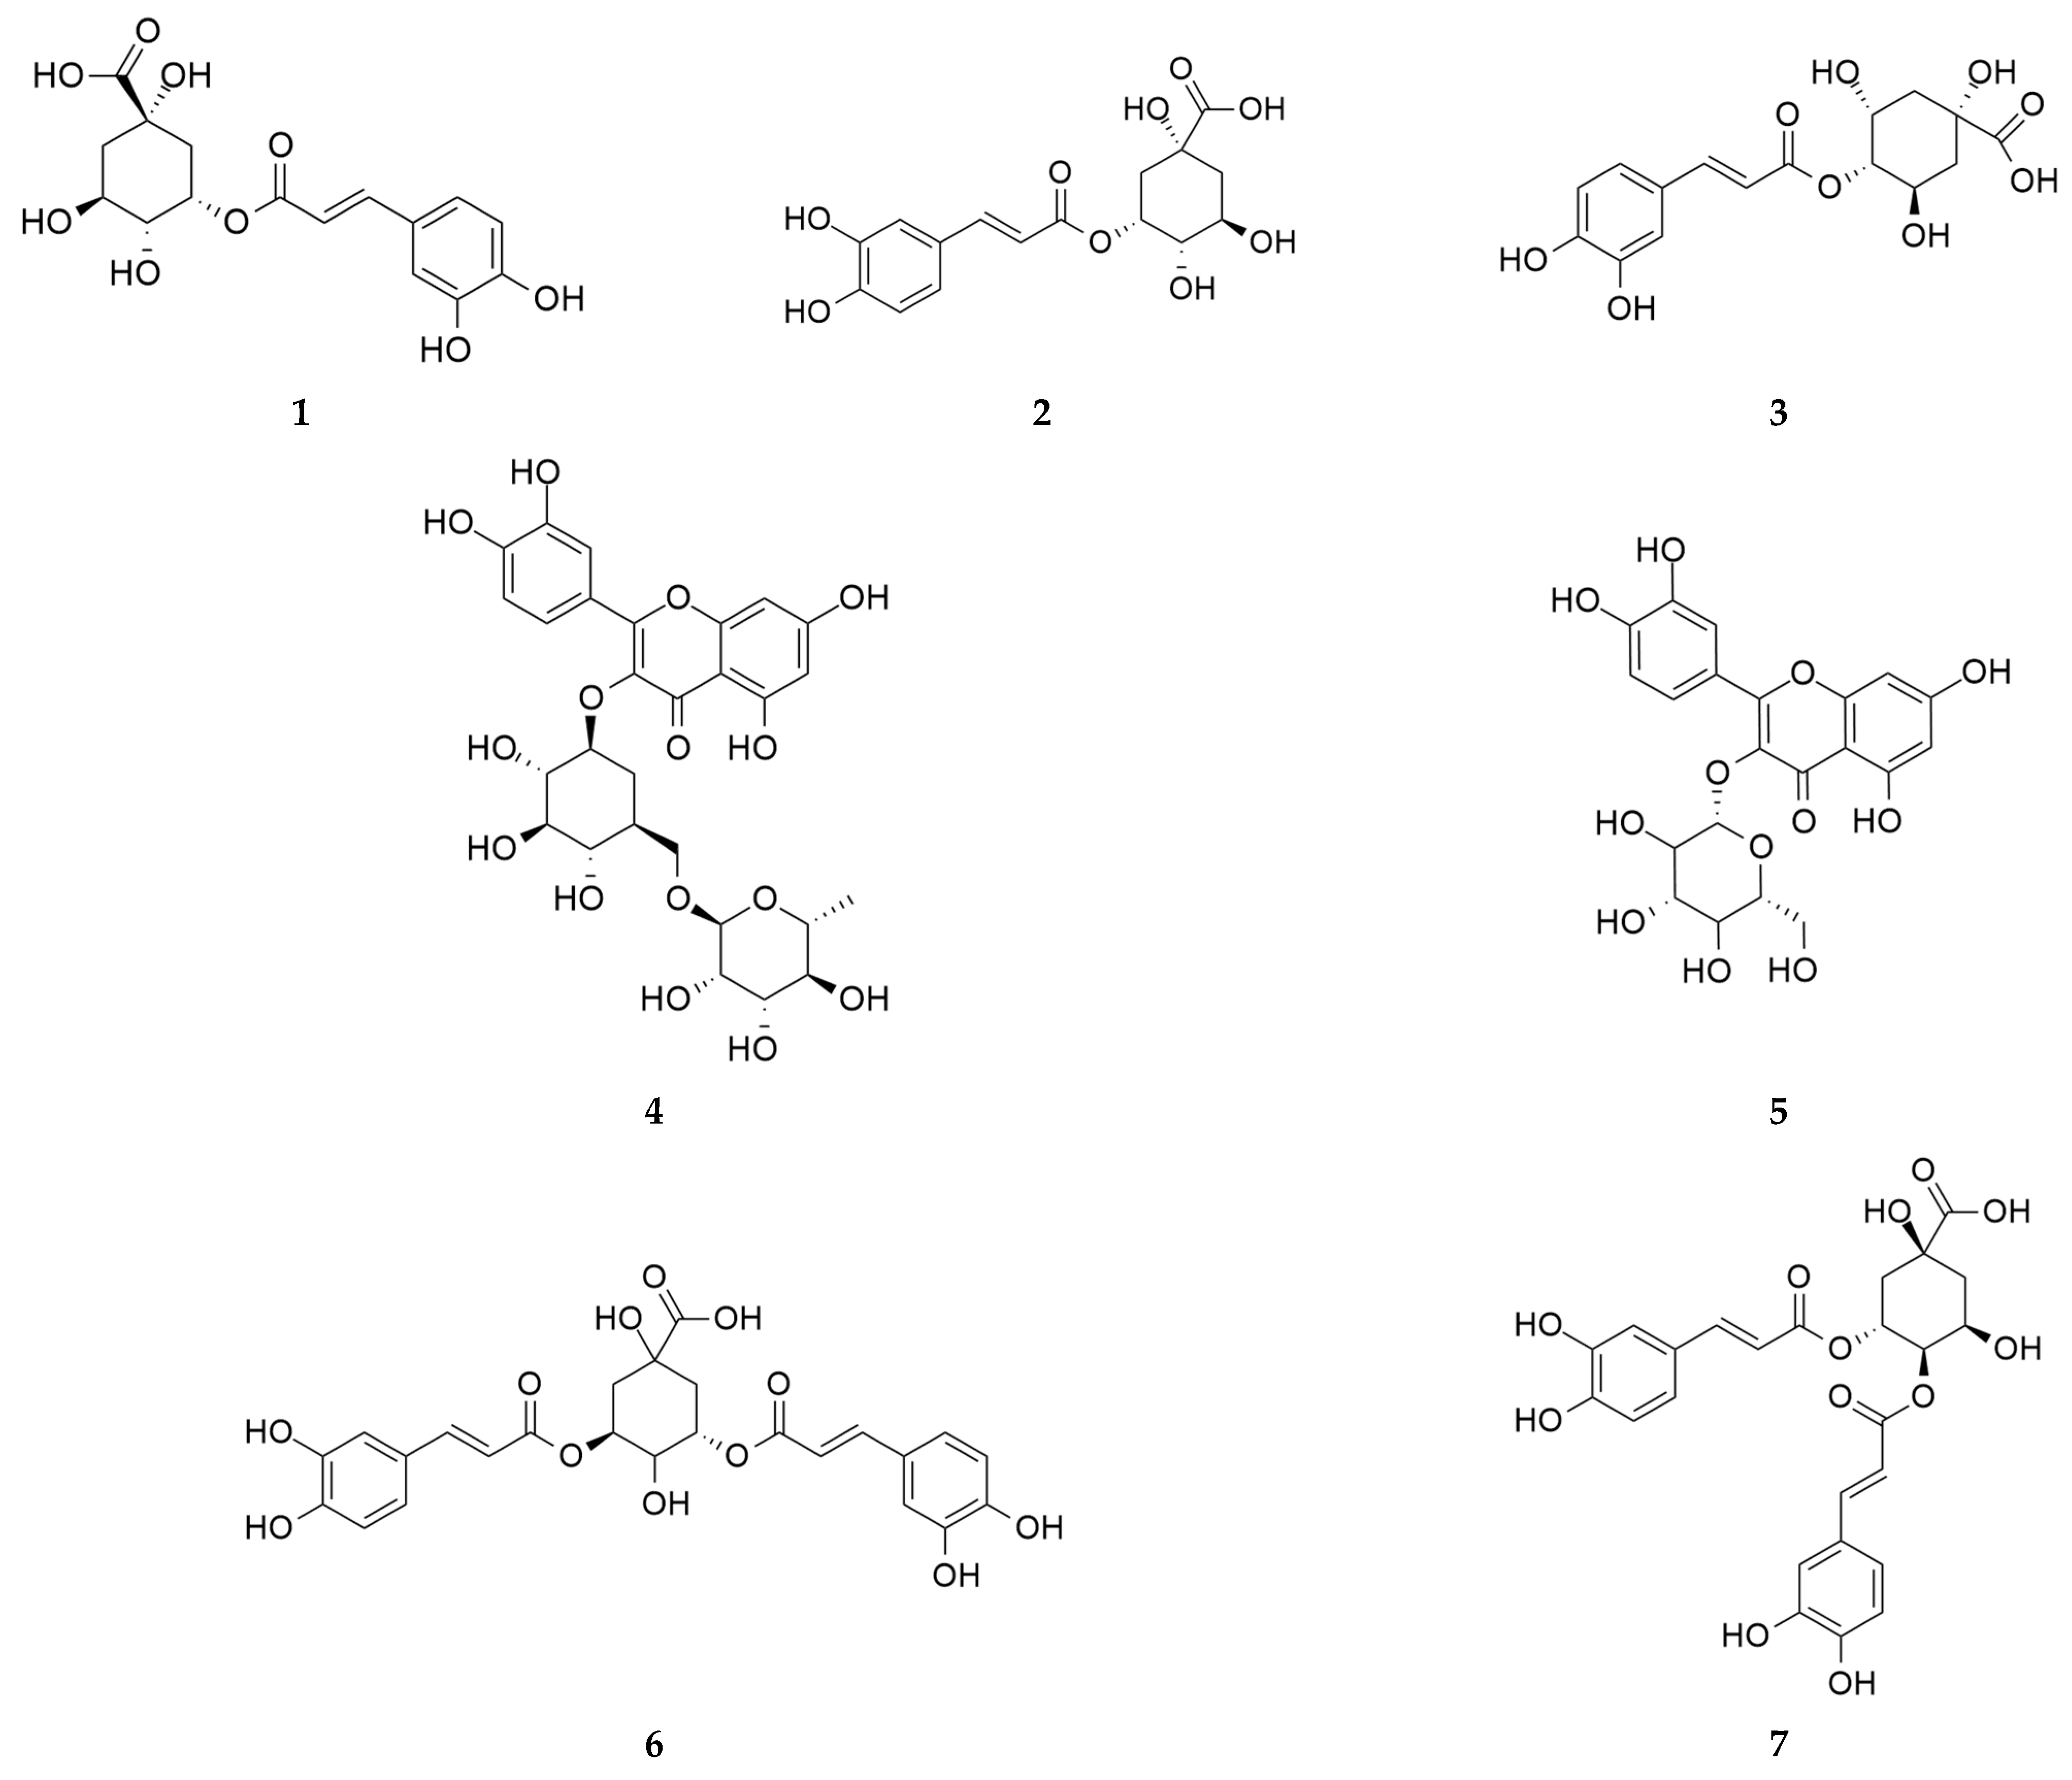
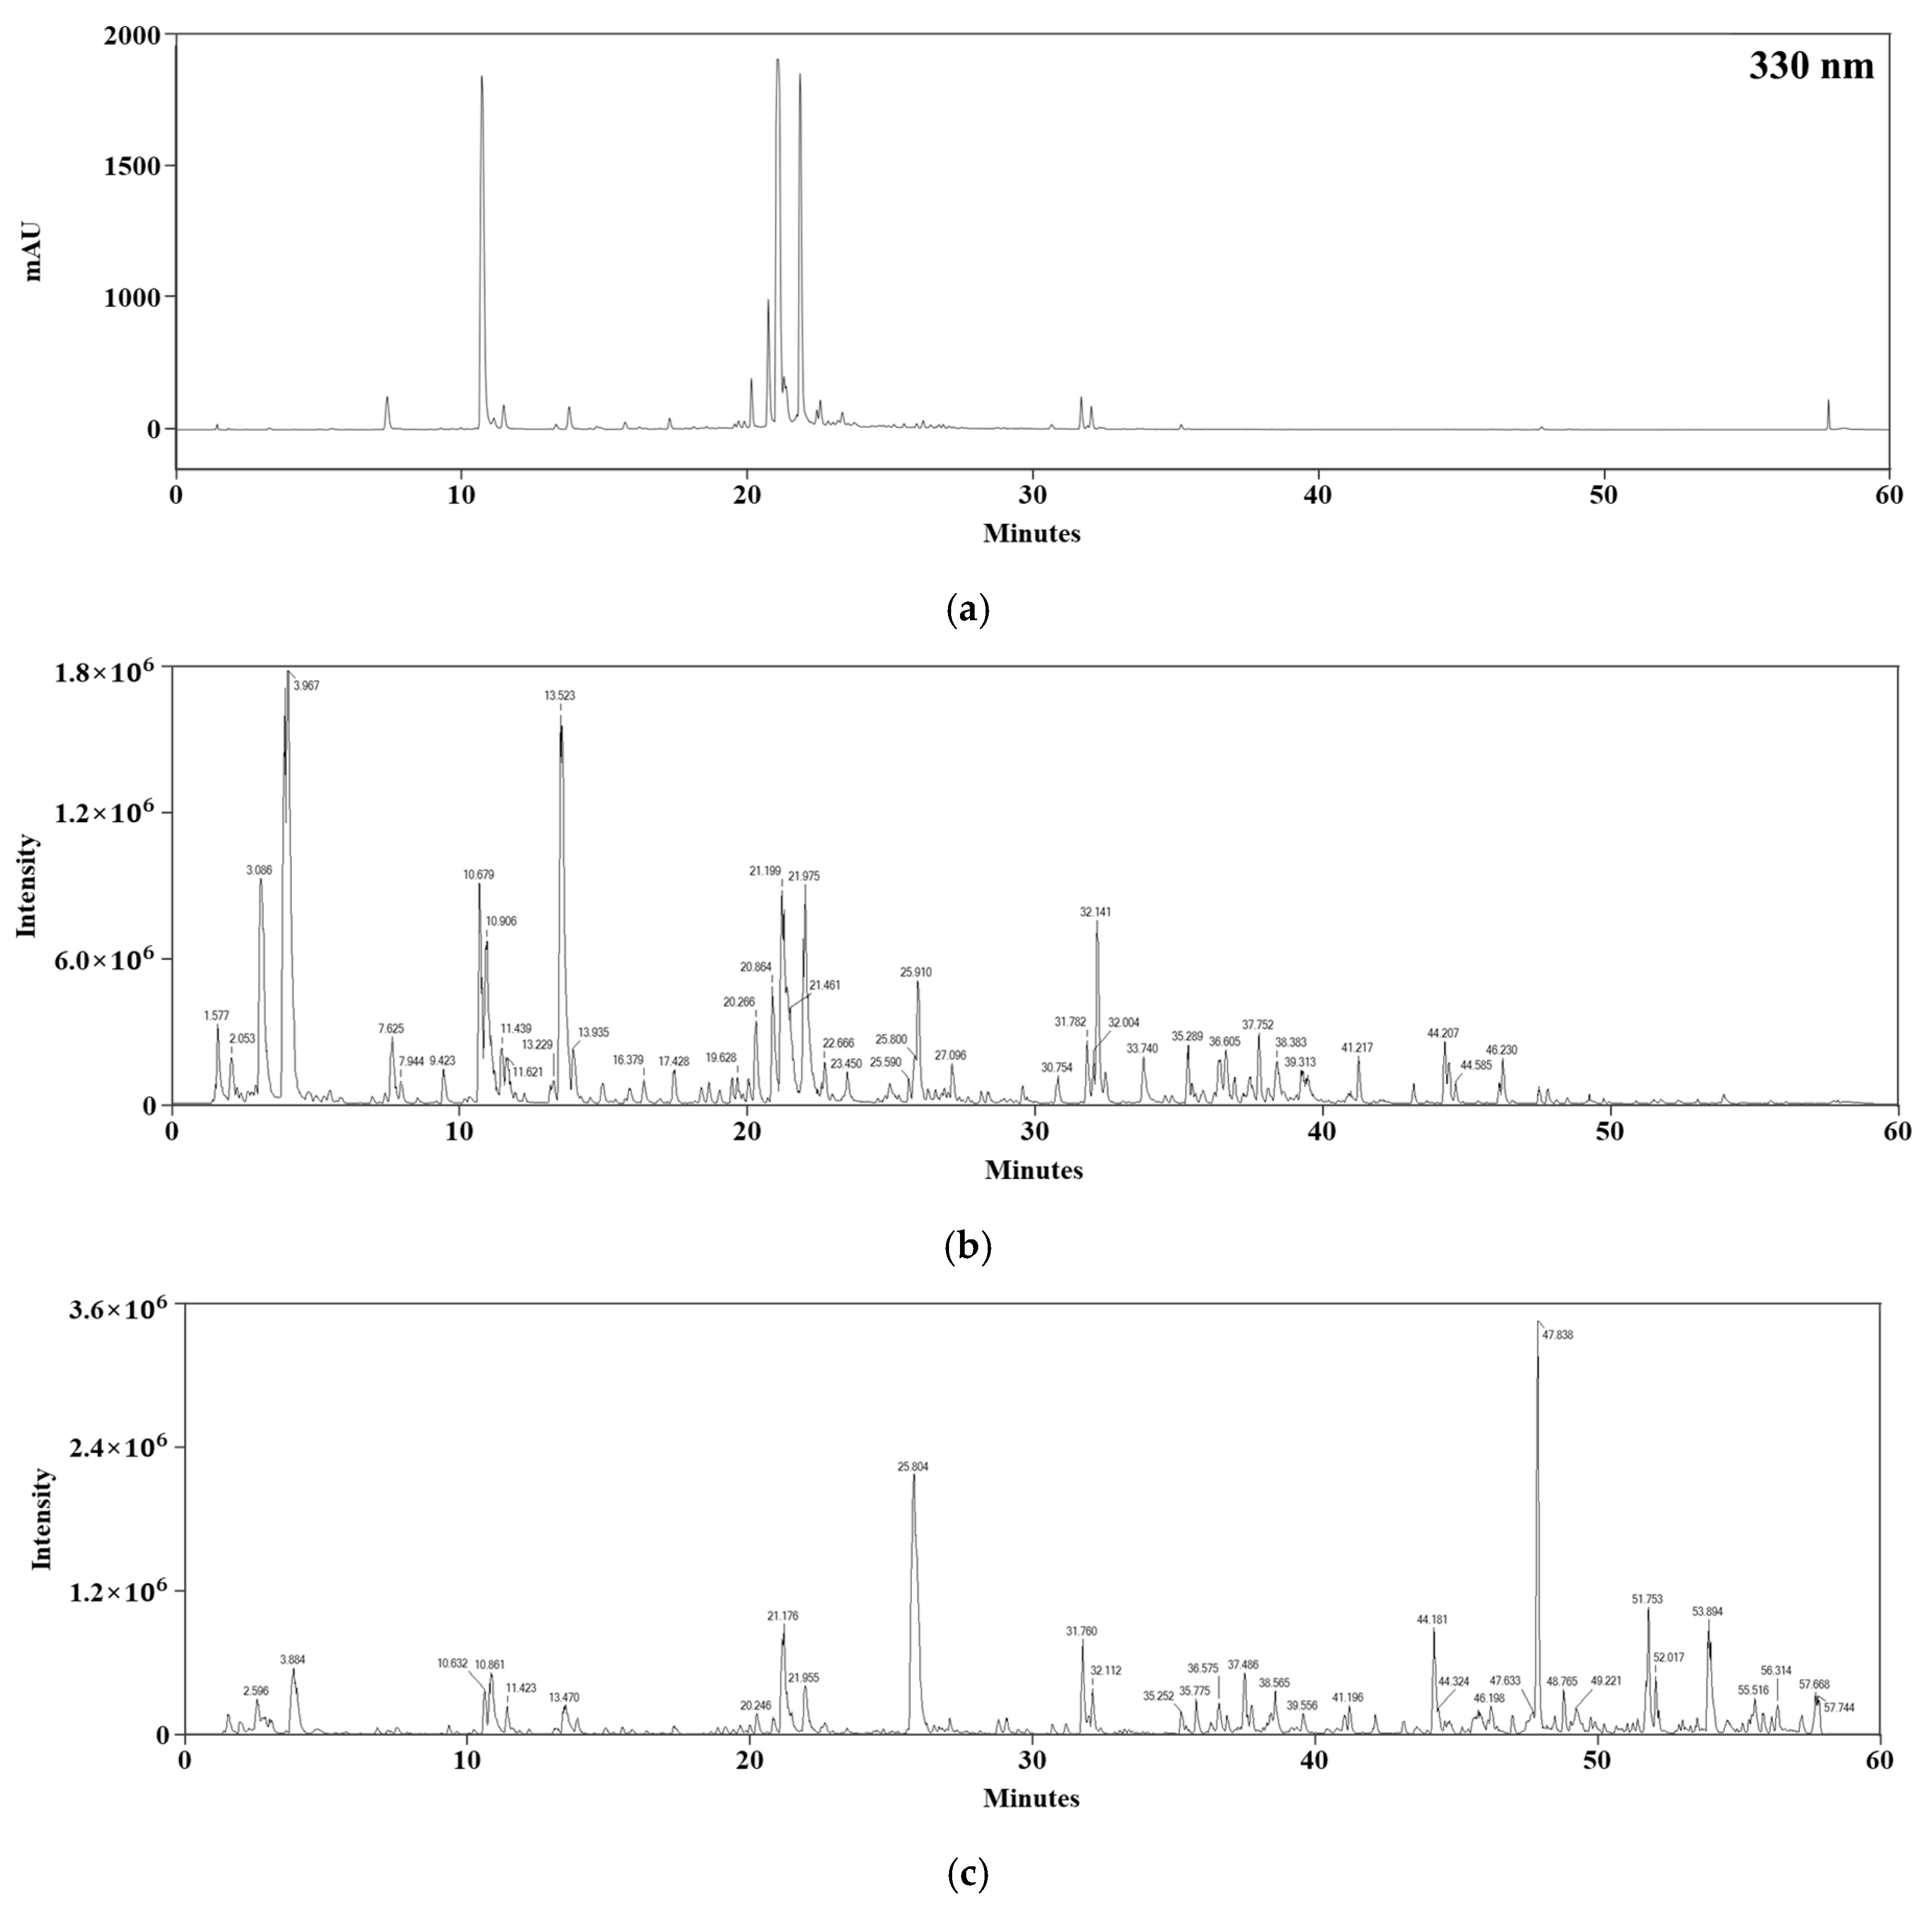
3.2. LC–MS/MS Analysis

The compounds were analyzed by performing tandem MS, according to their mass-to-charge ratios. The primary peaks of the samples were characterized using a web-based database and multiple spectral libraries, leading to the identification of 14 compounds (Table 2).
In the negative ion mode, seven more compounds were detected compared to the positive ion mode. This discrepancy is probably due to the differential polarity of the compounds detectible in each ionization mode [10,11]. As EtOH was employed as the extraction solvent, it was expected that more polar substances would be extracted, which may have accounted for more compounds being identified in the negative mode.
LC–MS/MS profiling was conducted to investigate the phytochemical constituents of TLA. The UV chromatogram recorded at 330 nm, along with the base peak chromatograms obtained in the negative and positive ion modes, is depicted in Figure 3.

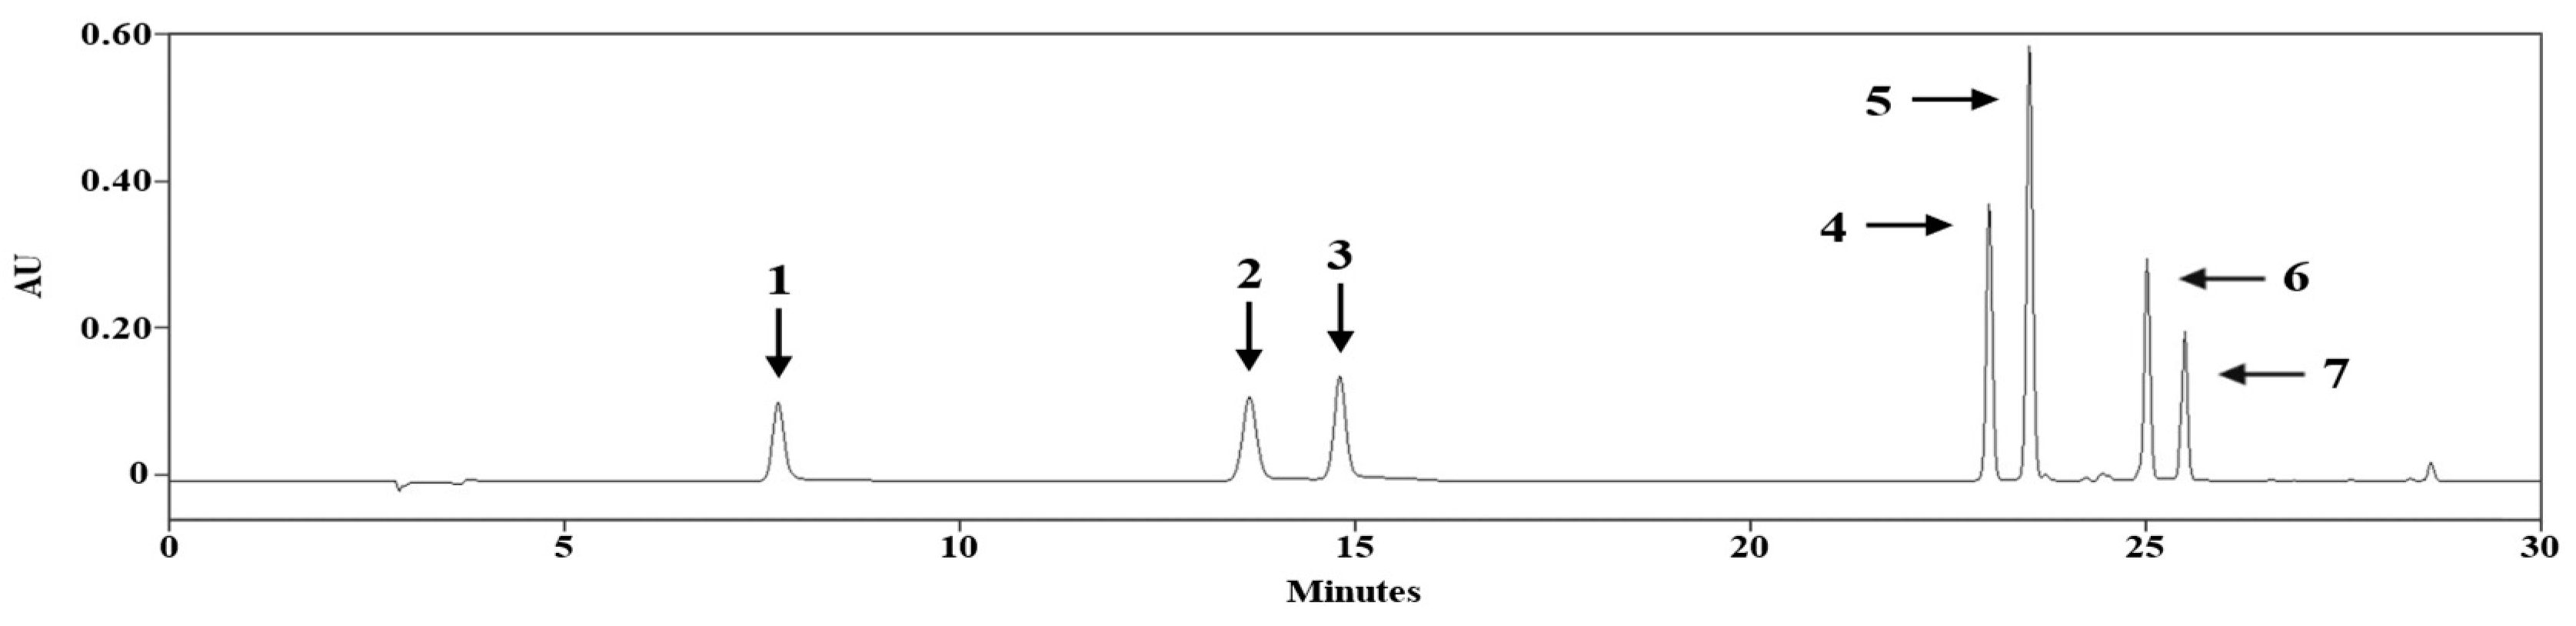
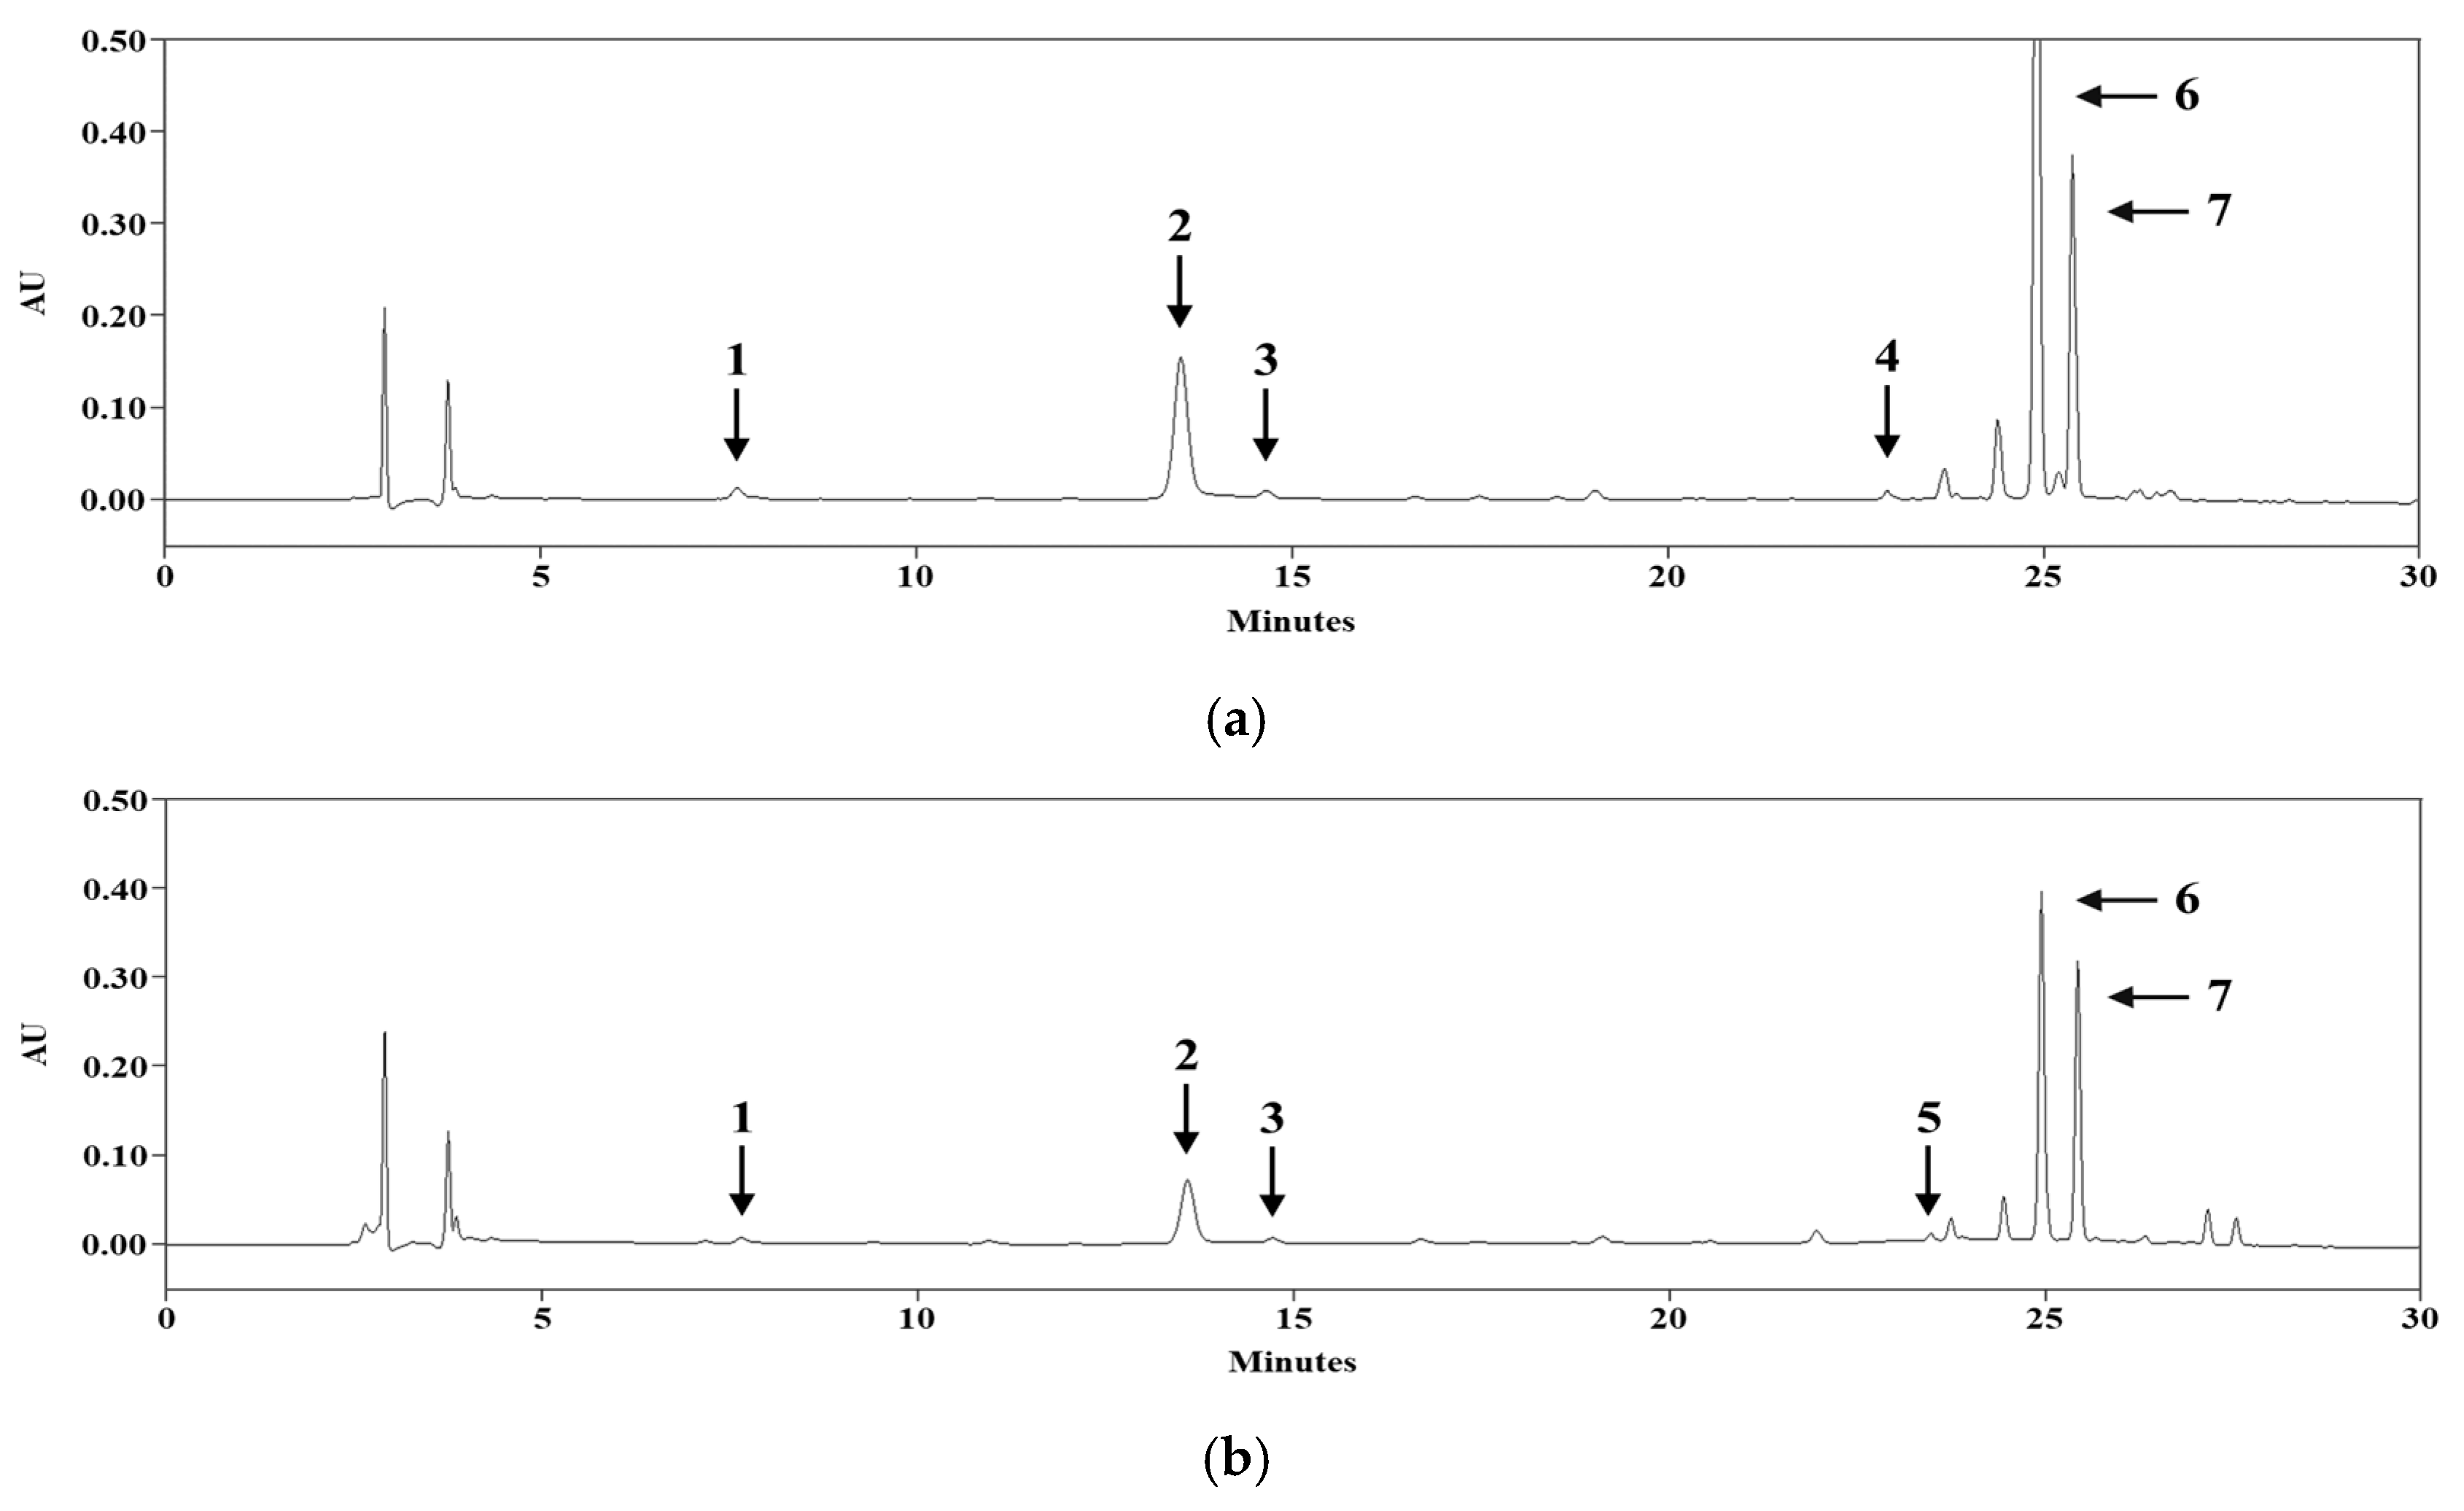
3.3. HPLC/PDA Analysis

HPLC/PDA analysis was conducted in connection with the LC–MS/MS data to further identify and quantify the phytochemicals in the TLA and CLA extracts. In the HPLC analysis, compounds 1–7 were used as the standard compounds in the HPLC analysis. The chromatogram of the standard compounds displayed well-separated peaks within the retention time, ranging from 7.61 to 25.45 min (Figure 4).
While the other compounds were undetected or only present in trace amounts, compounds 2, 6, and 7 displayed a significant peak in both the TLA and CLA chromatograms. Based on the results, calibration equations for compounds 2, 6, and 7 were calculated (Table 3). The linearity of this method was validated by a correlation coefficient (r2) exceeding 0.999.
The HPLC results were consistent with those from LC–MS/MS, revealing that compounds 1, 2, 3, 6, and 7 were detected in both TLA and CLA extracts (Figure 5). However, compound 4 was only detected in the TLA extract, while compound 5 was only detected in the CLA extract. Rutin is a flavonol that serves as an essential nutritional compound in various dietary sources [12,13]. According to previous studies, rutin has cytoprotective, antioxidant, anticarcinogenic, neuroprotective, cardioprotective, and vasoprotective activities [14,15,16,17,18,19,20,21]. To synthesize rutin, two successive glycosylation processes from quercetin are required.
Ohgami et al. reported that the enzyme responsible for glycosylation is expressed at a higher level in mature leaf than in the young leaf of Camellia sinensis [22]. This aligns with another study indicating that the rutin content in mature tea leaf is 2.15 times higher than in young tea leaf [23]. These previous studies can be referred to for interpreting the difference in rutin content between the TLA and CLA extracts. Rutin is well known for its bitter taste [24], and this may have contributed to the utilization of young A. himalaicum leaf as food. On the contrary, hyperoside was only detected in the CLA extract. Hyperoside has various pharmacological effects such as anticancer, neuroprotective, and renoprotective effects, among others. Moreover, hyperoside demonstrates a more superior antioxidant performance than rutin as the additional sugar group in rutin increases steric hindrance, which reduces its ability to interact effectively with free radicals [25,26]. The fact that A. himalaicum is used for dietary purposes rather than medicinal purposes suggests that the detection of bioactive compounds with strong antioxidant properties alone indicates sufficient utility value.
By using the calibration equations in Table 3, the amounts of phytochemicals in the TLA and CLA extracts were determined (Table 4). The overall phytochemical content of the TLA extract (49.73 mg/g DW) was approximately two times higher than that of the CLA extract (25.73 mg/g DW), suggesting that cotyledons, with their relatively small leaf area and short duration, may contain fewer phytochemicals than true leaf. Phytochemicals are produced in response to biotic and abiotic stressors [27,28].
Compounds 1, 2, 3, 6, and 7 are phenolic acids belonging to the caffeoylquinic acid family and share a common biosynthetic pathway [29]. These compounds are characterized by having an ester bondage between a caffeoyl group and a quinic acid group and are derived from the phenylpropanoid pathway [30]. The caffeoylquinic acid family exhibits anticancer, antioxidant, antiviral, anti-Alzheimer’s, antibacterial, and neuroprotective properties [31,32,33,34,35,36,37,38,39,40,41,42]. Compounds 1 and 3, from the caffeoylquinic acid series, were detected in relatively small quantities in the TLA and CLA extracts. According to Mullen et al. [43], the content of isomers may vary depending on the extraction method employed. It is possible that the 95% EtOH used in the experiment may have hydrolyzed the ester bonds during the extraction process, which might have affected the isomer formation of caffeoylquinic acid. Of note, significant amounts of compounds 2, 6, and 7 were commonly detected in both the TLA and CLA extracts. Compound 6 contained the largest amount of caffeoylquinic acid (28.512 mg/g), followed by compounds 7 and 2. The composition ratios for compounds 2, 6, and 7 in both the TLA and CLA extracts exhibited similar patterns. Compounds 6 and 7, which had the highest content of caffeoylquinic acid, are isomers of dicaffeoylquinic acid. According to Xu et al. [44], their antioxidant activity is superior to that of caffeoylquinic acid. In addition to their direct structural radical-scavenging capacity, these compounds contribute to indirect antioxidant activity by stimulating the transcription factor Nrf2 [4]. The quantitative abundance of these phytochemicals, in addition to their outstanding bioactivity, indicates that the leaves of A. himalaicum have significant potential for promoting human health.

3.4. TPC and TFC

The quantification of TPC and TFC was based on calibration curves established using tannic acid and quercetin as standard compounds, respectively. The calibration curve equations and correlation coefficients for each standard are presented (Table 5).
The TPC and TFC assay results revealed a significant difference in phytochemical content between TLA and CLA. The TLA (45.51 mg tannic acid equivalent/g extract) was approximately 1.7 times higher than that of CLA (26.52 mg tannic acid equivalent/g extract). Similarly, the TLA (16.24 mg quercetin equivalent/g extract) was about 1.4 times higher than that of CLA (11.53 mg quercetin equivalent/g extract) (Figure 6).
Trichomes are hair-like outgrowths present on various plant species’ surfaces [45,46]. The presence of more well-developed trichomes in TLA may have led to the higher TPC and TFC of TLA than those of CLA. According to previous studies, various types of trichomes have been identified in the Asteraceae family [47], and web-like white trichomes are densely distributed on the stem of A. himalaicum and on the abaxial surface of TLA. Generally, trichomes serve as physical and chemical defense mechanisms against herbivores and pathogens [48]. In terms of chemical defense mechanisms, they produce or store various phenolic compounds [49]. Although there have been no studies on the trichomes of A. himalaicum, a previous study on Helianthus annuus, another member of the Asteraceae family, identified trichomes as reservoirs of flavonoids and sesquiterpenes [50,51,52,53]. Similarly, the well-developed trichomes in TLA are likely contributors to its enriched phytochemical profile.
Additionally, TLA performs photosynthetic activity and is exposed to environmental stress for a longer duration than CLA. Since TLA has a larger leaf surface area than CLA, it inevitably receives higher light exposure, including UV radiation, which is known to induce oxidative stress and trigger secondary metabolite production [54]. The biosynthesis of phenolic compounds and flavonoids, which function as protective agents against oxidative stress, were affected by UV radiation, which is a kind of major environmental factors [55]. Several studies have reported that leaves exposed to high UV radiation accumulate increased levels of flavonoids and phenolic compounds as part of their protective mechanisms [56,57]. Given that TLA remains exposed to natural light for a longer period than CLA, and its larger surface area further enhances its susceptibility to UV radiation, it is reasonable to assume that climatic factors, particularly light quality and UV exposure, contribute to the higher TPC and TFC in TLA.

3.5. DPPH and ABTS+ Radical-Scavenging Assays

DPPH and ABTS+ assays were performed to evaluate the radical-scavenging properties of the TLA and CLA extracts, which were expressed as the IC50 and were compared with AA—the representative positive control for these assays. Based on the IC50 values in the DPPH and ABTS+ assays, the TLA extract demonstrated higher antioxidant ability than the CLA extract (Table 6). However, the IC50 value of the TLA extract was much lower than the antioxidant level of AA. A positive correlation was observed between the relative content of compounds 17 and the DPPH and ABTS+ radical-scavenging activity of the TLA and CLA extracts, aligning with the findings from the quantitative analysis. The observed difference in DPPH and ABTS+ radical-scavenging activity between TLA and CLA may be attributed to the quantity of phytochemicals in each extract.
According to previous studies, the antioxidant activity of dicaffeoylquinic acid is more superior than that of caffeoylquinic acid due to hydroxyl groups and additional ortho-hydroxyl groups linked to the aromatic ring [44,58,59,60]. The radical-scavenging capacity of TLA and CLA is considered to be significantly influenced by compounds 6 and 7 as a result of their high content in quantitative analysis and their highly effective structural radical-scavenging capacity.

4. Conclusions

This study comprehensively detected the phytochemical constituents and antioxidant activities of TLA and CLA. Utilizing LC-MS/MS and HPLC analyses, seven phytochemical constituents were identified and quantified. Significantly, TLA exhibited considerably higher total phytochemical content, as indicated by TPC and TFC, in comparison to CLA. This trend was further substantiated by the superior radical-scavenging activities observed in DPPH and ABTS+ assays. The results highlight that TLA serves as a richer source of biologically active compounds than CLA. This discrepancy is postulated to be a consequence of the prolonged exposure of the true leaf to biotic and abiotic stressors in conjunction with the presence of well-developed trichomes. Additionally, A. himalaicum leaves, especially TLA, are rich in dicaffeoylquinic acids, implying their strong antioxidant potential. These findings provide a basic understanding of the potential of A. himalaicum as a natural antioxidant source for use in the production of functional foods and natural therapeutic agents. This study successfully identified its phytochemical composition and confirmed its potential antioxidant activity. However, additional in vivo research is necessary to evaluate its actual physiological effects, bioavailability, and mechanism of action in biological systems. Future research should focus on validating these findings through in vivo models to fully explore its practical applications.

Author Contributions

HPLC/PDA analysis and DPPH/ABTS+ radical-scavenging activity, S.-Y.L.; TPC, TFC analysis and LC-MS/MS analysis, N.P.U. and N.Y.; resources and experimental design, C.-H.C.; supervision, writing—review, and editing, S.L. All authors have read and agreed to the published version of the manuscript.

Funding

This work was supported by the grant (No. 202406) of the Natural Product Institute of Science and Technology, Anseong 17546, Republic of Korea.

Data Availability Statement

The data presented in this study are available on request from the corresponding author.

Acknowledgments

We express our gratitude to Gyeonggi-do Forestry Environment Research Center (Osan 18118, Republic of Korea) for generously providing the samples.

Conflicts of Interest

The authors declare no conflicts of interest.

References

  1. Vinogradova, Y.; Shelepova, O.; Vergun, O.; Ganina, A. Possibility of ssing an invasive species Adenocaulon adhaerescens Maxim. (Asteraceae) as a medicin plant. Agrobiodivers. Improv. Nutr. Health Life Qual. 2020, 4, 59–69. [Google Scholar] [CrossRef]
  2. Ahn, H.S.; Kim, H.J.; Na, C.; Jang, D.S.; Shin, Y.-K.; Lee, S.H. The protective effect of Adenocaulon himalaicum Edgew. and its bioactive compound neochlorogenic acid against UVB-induced skin damage in human dermal fibroblasts and epidermal keratinocytes. Plants 2021, 10, 1669. [Google Scholar] [CrossRef] [PubMed]
  3. Choi, H.J.; Choi, J.W.; Im, S.W.; Jeong, J.B. Immunostimulatory and anti-obesity activities of Adenocaulon himalaicum leaves in RAW264.7 and 3T3-L1 Cells. Exp. Ther. Med. 2023, 25, 219. [Google Scholar] [CrossRef] [PubMed]
  4. Yun, J.H.; Lee, S.B.; Kang, K.; Lee, E.H.; Lee, H.J.; Jung, S.H.; Nho, C.W. Bifunctional chemopreventive effects of Adenocaulon himalaicum through induction of detoxification enzymes and apoptosis. J. Med. Food 2013, 16, 701–710. [Google Scholar] [CrossRef] [PubMed]
  5. Khoddami, A.; Wilkes, M.; Roberts, T. Techniques for analysis of plant phenolic compounds. Molecules 2013, 18, 2328–2375. [Google Scholar] [CrossRef]
  6. Yoon, N.; Yu, H.; Tran, G.H.; Ko, C.H.; Kim, H.; Yoon, M.J.; Lee, S. Profiling the phytochemicals of Orostachys margaritifolia: Biological activities, LC-ESI/MS, and HPLC analyses. Pharmaceuticals 2024, 17, 290. [Google Scholar] [CrossRef]
  7. Uy, N.P.; Kim, H.; Ku, J.; Lee, S. Regional variations in Peucedanum japonicum antioxidants and phytochemicals. Plants 2024, 13, 377. [Google Scholar] [CrossRef]
  8. Lee, C.-D.; Uy, N.P.; Lee, Y.; Lee, D.-H.; Lee, S. Comparative analysis of phytochemical composition and antioxidant properties of Smilax china rhizome from different regions. Horticulturae 2024, 10, 850. [Google Scholar] [CrossRef]
  9. Lee, Y.M.; Bae, J.H.; Jung, H.Y.; Kim, J.H.; Park, D.S. Antioxidant activity in water and methanol extracts from Korean edible wild plants. J. Korean Soc. Food Sci. Nutr. 2011, 40, 29–36. [Google Scholar] [CrossRef]
  10. Liigand, P.; Kaupmees, K.; Haav, K.; Liigand, J.; Leito, I.; Girod, M.; Antoine, R.; Kruve, A. Think negative: Finding the best electrospray Ionization/MS mode for your analyte. Anal. Chem. 2017, 89, 5665–5668. [Google Scholar] [CrossRef]
  11. Han, Y.K.; Vinh, L.B.; Nam, M.; Lee, K.Y. Identification of compounds using HPLC-QTOF-MS online antioxidant activity mapping from aerial parts of Ligularia stenocephala. Appl. Biol. Chem. 2023, 66, 53. [Google Scholar] [CrossRef]
  12. Ganeshpurkar, A.; Saluja, A.K. The pharmacological potential of rutin. Saudi Pharm. J. 2017, 25, 149–164. [Google Scholar] [CrossRef]
  13. Harborne, J.B. Nature, distribution and function of plant flavonoids. Prog. Clin. Biol. Res. 1986, 213, 15–24. [Google Scholar] [PubMed]
  14. Javed, H.; Khan, M.M.; Ahmad, A.; Vaibhav, K.; Ahmad, M.E.; Khan, A.; Ashafaq, M.; Islam, F.; Siddiqui, M.S.; Safhi, M.M.; et al. Rutin prevents cognitive impairments by ameliorating oxidative stress and neuroinflammation in rat model of sporadic dementia of alzheimer type. Neuroscience 2012, 210, 340–352. [Google Scholar] [CrossRef]
  15. Richetti, S.K.; Blank, M.; Capiotti, K.M.; Piato, A.L.; Bogo, M.R.; Vianna, M.R.; Bonan, C.D. Quercetin and rutin prevent scopolamine-induced memory impairment in zebrafish. Behav. Brain Res. 2011, 217, 10–15. [Google Scholar] [CrossRef] [PubMed]
  16. Nassiri-Asl, M.; Mortazavi, S.-R.; Samiee-Rad, F.; Zangivand, A.-A.; Safdari, F.; Saroukhani, S.; Abbasi, E. The effects of rutin on the development of pentylenetetrazole kindling and memory retrieval in rats. Epilepsy Behav. 2010, 18, 50–53. [Google Scholar] [CrossRef]
  17. Mellou, F.; Loutrari, H.; Stamatis, H.; Roussos, C.; Kolisis, F.N. Enzymatic esterification of flavonoids with unsaturated fatty acids: Effect of the novel esters on vascular endothelial growth factor release from K562 cells. Process Biochem. 2006, 41, 2029–2034. [Google Scholar] [CrossRef]
  18. Trumbeckaite, S.; Bernatoniene, J.; Majiene, D.; Jakstas, V.; Savickas, A.; Toleikis, A. The effect of flavonoids on rat heart mitochondrial function. Biomed. Pharmacother. 2006, 60, 245–248. [Google Scholar] [CrossRef]
  19. Schwedhelm, E.; Maas, R.; Troost, R.; Böger, R.H. Clinical pharmacokinetics of antioxidants and their impact on systemic oxidative stress. Clin. Pharmacokinet. 2003, 42, 437–459. [Google Scholar] [CrossRef]
  20. Janbaz, K.H.; Saeed, S.A.; Gilani, A.H. Protective effect of rutin on paracetamol- and CCl4-induced hepatotoxicity in rodents. Fitoterapia 2002, 73, 557–563. [Google Scholar] [CrossRef]
  21. La Casa, C.; Villegas, I.; Alarcón de la Lastra, C.; Motilva, V.; Martıín Calero, M.J. Evidence for protective and antioxidant properties of rutin, a natural flavone, against ethanol induced gastric lesions. J. Ethnopharmacol. 2000, 71, 45–53. [Google Scholar] [CrossRef] [PubMed]
  22. Shoji, O.; Ono, E.; Hiromi, T.; Watanabe, N.; Toshiyuki, O. Identification and characterization of Camellia sinensis glucosyltransferase, UGT73A17: A possible role in flavonol glucosylation. Plant Biotechnol. 2014, 31, 573–578. [Google Scholar] [CrossRef]
  23. Liu, Z.; Bruins, M.E.; de Bruijn, W.J.C.; Vincken, J.P. A comparison of the phenolic composition of old and young tea leaves reveals a decrease in flavanols and phenolic acids and an increase in flavonols upon tea leaf maturation. J. Food Compos. Anal. 2020, 86, 103385. [Google Scholar] [CrossRef]
  24. Fabjan, N.; Rode, J.; Košir, I.J.; Wang, Z.; Zhang, Z.; Kreft, I. Tartary buckwheat (Fagopyrum tataricum Gaertn.) as a source of dietary rutin and quercitrin. J. Agric. Food Chem. 2003, 51, 6452–6455. [Google Scholar] [CrossRef]
  25. Hua, S.; Liu, J.; Zou, L.; Li, P. Hyperoside: A review of resources, synthesis pathways, physicochemical properties, metabolism, pharmacological activities, clinical trials and human studies, toxicology and safety, marketed products, and patents. In Handbook of Dietary Flavonoids; Springer: Berlin/Heidelberg, Germany, 2023; pp. 1–103. [Google Scholar] [CrossRef]
  26. Cai, W.; Chen, Y.; Xie, L.; Zhang, H.; Hou, C. Characterization and density functional theory study of the antioxidant activity of quercetin and its sugar-containing analogues. Eur. Food Res. Technol. 2013, 238, 121–128. [Google Scholar] [CrossRef]
  27. Šamec, D.; Karalija, E.; Šola, I.; Vujčić Bok, V.; Salopek-Sondi, B. The role of polyphenols in abiotic stress response: The influence of molecular structure. Plants 2021, 10, 118. [Google Scholar] [CrossRef]
  28. Hu, W.; Sarengaowa; Guan, Y.; Feng, K. Biosynthesis of phenolic compounds and antioxidant activity in fresh-cut fruits and vegetables. Front. Microbiol. 2022, 13, 906069. [Google Scholar] [CrossRef]
  29. Clifford, M.N. Chlorogenic acids and other cinnamates—Nature, occurrence and dietary burden. J. Sci. Food Agric. 1999, 79, 362–372. [Google Scholar] [CrossRef]
  30. Alcázar Magaña, A.; Kamimura, N.; Soumyanath, A.; Stevens, J.F.; Maier, C.S. Caffeoylquinic acids: Chemistry, biosynthesis, occurrence, analytical challenges, and bioactivity. Plant J. 2021, 107, 1299–1319. [Google Scholar] [CrossRef]
  31. Hamed, Y.S.; Abdin, M.; Chen, G.; Akhtar, H.M.S.; Zeng, X. Effects of impregnate temperature on extraction of caffeoylquinic acid derivatives from Moringa oleifera leaves and evaluation of inhibitory activity on digestive enzyme, antioxidant, anti-proliferative and antibacterial activities of the extract. Int. J. Food Sci. Technol. 2020, 55, 3082–3090. [Google Scholar] [CrossRef]
  32. Nzekoue, F.K.; Angeloni, S.; Navarini, L.; Angeloni, C.; Freschi, M.; Hrelia, S.; Vitali, L.A.; Sagratini, G.; Vittori, S.; Caprioli, G. Coffee silverskin extracts: Quantification of 30 bioactive compounds by a new HPLC-MS/MS method and evaluation of their antioxidant and antibacterial activities. Food Res. Int. 2020, 133, 109128. [Google Scholar] [CrossRef] [PubMed]
  33. Trendafilova, A.; Ivanova, V.; Rangelov, M.; Todorova, M.; Ozek, G.; Your, S.; Ozek, T.; Aneva, I.; Veleva, R.; Moskova-Doumanova, V.; et al. Caffeoylquinic acids, cytotoxic, antioxidant, acetylcholinesterase and tyrosinase enzyme inhibitory activities of Six Inula species from Bulgaria. Chem. Biodivers. 2020, 17, e2000051. [Google Scholar] [CrossRef]
  34. Soumaya, B.; Iness, B.R.; Khaoula, M.H.; Isoda, H.; Riadh, K.; Wided, M.K. LC-ESI-TOF-MS and GC-MS profiling of Artemisia herba-alba and evaluation of its bioactive properties. Food. Res. Int. 2017, 99, 702–712. [Google Scholar] [CrossRef]
  35. Bulgakov, V.P.; Vereshchagina, Y.V.; Veremeichik, G.N. Anticancer polyphenols from cultured plant cells: Production and new bioengineering strategies. Curr. Med. Chem. 2018, 25, 4671–4692. [Google Scholar] [CrossRef]
  36. Liu, W.; Li, J.; Zhang, X.; Zu, Y.; Yang, Y.; Liu, W.; Xu, Z.; Gao, H.; Sun, X.; Jiang, X.; et al. Current advances in naturally occurring caffeoylquinic acids: Structure, bioactivity, and synthesis. J. Agric. Food Chem. 2020, 68, 10489–10516. [Google Scholar] [CrossRef] [PubMed]
  37. Murad, L.D.; da Costa Pereira Soares, N.; Brand, C.; Monteiro, M.C.; Teodoro, A.J. Effects of caffeic and 5-caffeoylquinic acids on cell viability and cellular uptake in human colon adenocarcinoma cells. Nutr. Cancer 2015, 67, 532–542. [Google Scholar] [CrossRef]
  38. Taira, J.; Uehara, M.; Tsuchida, E.; Wakana, O. Inhibition of the β-catenin/Tcf signaling by caffeoylquinic acids in sweet potato leaf through down regulation of the Tcf-4 transcription. J. Agric. Food Chem. 2013, 62, 167–172. [Google Scholar] [CrossRef]
  39. Dimitrina, Z.D.; Reneta, G.; Zaharieva, M.M.; Hristo, N.; Silviya, R.; Lozanov, V.; Vessela, B.; Yagi, S.; Georgi, M.; Vanio, M. HPLC-UV and LC–MS analyses of acylquinic acids in Geigeria alata (DC) Oliv. & Hiern. and their contribution to antioxidant and antimicrobial capacity. Phytochem. Anal. 2016, 28, 176–184. [Google Scholar] [CrossRef]
  40. Matthews, D.G.; Caruso, M.; Alcazar, M.A.; Wright, K.M.; Maier, C.S.; Stevens, J.F.; Gray, N.E.; Quinn, J.F.; Soumyanath, A. Caffeoylquinic acids in Centella asiatica reverse cognitive deficits in male 5XFAD Alzheimer’s disease model mice. Nutrients 2020, 12, 3488. [Google Scholar] [CrossRef]
  41. Gray, N.E.; Morré, J.; Kelley, J.; Maier, C.S.; Stevens, J.F.; Quinn, J.F.; Soumyanath, A. Caffeoylquinic acids in Centella asiatica protect against amyloid-β toxicity. J. Alzheimers Dis. 2014, 40, 359–373. [Google Scholar] [CrossRef]
  42. Sasaki, K.; Davies, J.; Doldán, N.G.; Arao, S.; Ferdousi, F.; Szele, F.G.; Isoda, H. 3,4,5-Tricaffeoylquinic acid induces adult neurogenesis and improves deficit of learning and memory in aging model senescence-accelerated prone 8 mice. Aging 2019, 11, 401–422. [Google Scholar] [CrossRef] [PubMed]
  43. Mullen, W.; Nemzer, B.; Ou, B.; Stalmach, A.; Hunter, J.; Clifford, M.N.; Combet, E. The antioxidant and chlorogenic acid profiles of whole coffee fruits are influenced by the extraction procedures. J. Agric. Food Chem. 2011, 59, 3754–3762. [Google Scholar] [CrossRef] [PubMed]
  44. Xu, J.G.; Hu, Q.P.; Liu, Y. Antioxidant and DNA-protective activities of chlorogenic acid isomers. J. Agric. Food Chem. 2012, 60, 11625–11630. [Google Scholar] [CrossRef]
  45. Werker, E. Trichome Diversity and development. Adv. Bot. Res. 2000, 31, 1–35. [Google Scholar] [CrossRef]
  46. Tissier, A. Glandular trichomes: What comes after expressed sequence tags? Plant J. 2012, 70, 51–68. [Google Scholar] [CrossRef]
  47. Perveen, A.; Khan, M.; Mansuri, S.; Tabassum, T. Morphological studies on trichome of family Asteraceae. Int. J. Biol. Biotechnol. 2016, 13, 172–182. [Google Scholar]
  48. Aschenbrenner, A.K.; Amrehn, E.; Bechtel, L.; Spring, O. Trichome differentiation on leaf primordia of Helianthus annuus (Asteraceae): Morphology, gene expression and metabolite profile. Planta 2014, 241, 837–846. [Google Scholar] [CrossRef]
  49. Karabourniotis, G.; Liakopoulos, G.; Nikolopoulos, D.; Bresta, P. Protective and defensive roles of non-glandular trichomes against multiple stresses: Structure–function coordination. J. For. Res. 2019, 31, 1–12. [Google Scholar] [CrossRef]
  50. Spring, O.; Bienert, U.; Klemt, V. Sesquiterpene lactones in glandular trichomes of sunflower leaves. J. Plant Physiol. 1987, 130, 433–439. [Google Scholar] [CrossRef]
  51. Spring, O.; Rodon, U.; Macias, F.A. Sesquiterpenes from noncapitate glandular trichomes of Helianthus annuus. Phytochemistry 1992, 31, 1541–1544. [Google Scholar] [CrossRef]
  52. Göpfert, J.; Conrad, J.; Spring, O. 5-Deoxynevadensin, a novel flavone in sunflower and aspects of biosynthesis during trichome development. Nat. Prod. Commun. 2006, 1, 1934578X0600101. [Google Scholar] [CrossRef]
  53. Schilling, E.E.; Panero, J.L.; Storbeck, T.A. Flavonoids of Helianthus series Microcephali. Biochem. Syst. Ecol. 1987, 15, 671–672. [Google Scholar] [CrossRef]
  54. Kumar, K.; Debnath, P.; Singh, S.; Kumar, N. An overview of plant phenolics and their involvement in abiotic stress tolerance. Stresses 2023, 3, 570–585. [Google Scholar] [CrossRef]
  55. Martinez, V.; Mestre, T.C.; Rubio, F.; Girones-Vilaplana, A.; Moreno, D.A.; Mittler, R.; Rivero, R.M. Accumulation of flavonols over hydroxycinnamic acids favors oxidative damage protection under abiotic stress. Front. Plant Sci. 2016, 7, 838. [Google Scholar] [CrossRef] [PubMed]
  56. Agati, G.; Tattini, M. Multiple functional roles of flavonoids in photoprotection. New Phytol. 2010, 186, 786–793. [Google Scholar] [CrossRef]
  57. Kolb, C.A.; Käser, M.A.; Kopecký, J.; Zotz, G.; Riederer, M.; Pfündel, E.E. Effects of natural intensities of visible and ultraviolet radiation on epidermal ultraviolet screening and photosynthesis in grape leaves. Plant Physiol. 2001, 127, 863–875. [Google Scholar] [CrossRef]
  58. Degfie, T.; Endale, M.; Tafese, T.; Dekebo, A.; Shenkute, K. In vitro antibacterial, antioxidant activities, molecular docking, and ADMET analysis of phytochemicals from roots of Hydnora johannis. Appl. Biol. Chem. 2022, 65, 76. [Google Scholar] [CrossRef]
  59. So, J.; Lee, H.D.; Kim, J.H.; Lee, S.; Lim, J.H. Antioxidant, antimicrobial, and skin-whitening effects and quantitative analysis of phenolic compounds in Korean wild Chrysanthemum flowers via HPLC/UV. Hortic. Environ. Biotechnol. 2024, 65, 215–227. [Google Scholar] [CrossRef]
  60. Doan, T.T.M.; Tran, G.H.; Nguyen, T.K.; Lim, J.H.; Lee, S. Antioxidant activity of different cultivars of Chrysanthemum morifolium and quantitative analysis of phenolic compounds by HPLC/UV. Appl. Biol. Chem. 2024, 67, 17. [Google Scholar] [CrossRef]
Figure 1. TLA (a) and CLA (b) samples used in this study. The CLA represents the cotyledons, the initial leaf that develops during the germination process. In contrast, the TLA signifies the first true leaf to emerge after the cotyledon. The scale illustrates the difference in size between the two leaf types.
Chemengineering 09 00031 g001
Figure 2. Chemical structures of compounds 17.
Chemengineering 09 00031 g002
Figure 3. Ultraviolet chromatogram (a) of TLA extracts at 330 nm; the base peak chromatograms of the TLA extract analyzed in the negative (b) and the positive (c) ion modes.
Chemengineering 09 00031 g003
Figure 4. HPLC/PDA chromatogram of compounds 17. Neochlorogenic acid (1), chlorogenic acid (2), cryptochlorogenic acid (3), rutin (4), hyperin (5), isochlorogenic acid A (6), and isochlorogenic acid B (7).
Chemengineering 09 00031 g004
Figure 5. HPLC/PDA chromatograms of TLA (a) and CLA (b) extracts. Neochlorogenic acid (1), chlorogenic acid (2), cryptochlorogenic acid (3), rutin (4), hyperin (5), isochlorogenic acid A (6), and isochlorogenic acid B (7).
Chemengineering 09 00031 g005
Figure 6. Comparison of TPC (a) and TFC (b) of TLA and CLA extracts. Statistical significance of mean ± SD values in each bar is determined using a t-test, indicating significant differences. The asterisks indicate different levels of statistical significance between TLA and CLA extracts (**, p < 0.01; ****, p < 0.0001).
Chemengineering 09 00031 g006
Table 1. Extraction yields of TLA and CLA extracts.
SampleDry Sample (g)Extract (g)Yield (%)
TLA103.838.0
CLA4.01.640.0
Table 2. Proposed structures by performing LC-MS/MS using negative and positive modes.
tR (min)MWTentative Identification
7.63354.1Neochlorogenic acid 1
10.89354.1Chlorogenic acid 1,2
11.62354.1Cryptochlorogenic acid 1
13.48354.11-O-Caffeoylquinic acid 1
13.91338.14-O-Coumaroylquinic acid 1,2
15.84368.15-O-Feruloylquinic acid 1,2
16.38338.11-O-Coumaroylquinic acid 1
19.68610.2Rutin 1,2
19.70564.1Kaempferol 3-arabinofuranoside 7-rhamnofuranoside 1
19.99464.1Hyperin 1,2
20.88516.1Cynarin 1
21.19516.1Isochlorogenic acid A 1,2
21.96516.1Isochlorogenic acid B 1,2
23.44516.1Dicaffeoylquinic acid 1
1 negative ion mode. 2 positive ion mode.
Table 3. Calibration curves for compounds 17.
CompoundtR (min)Calibration EquationCorrelation Factor, r2
17.61--
213.51Y = 10,830X − 14,2260.9996
314.73--
423.04--
523.50--
624.96Y = 10,251X + 53,2920.9998
725.45Y = 6733.6X + 99,8400.9991
Y, peak area; X, concentration of the standard (μg/mL); r2, correlation coefficient for six calibration data points (n = 3). Neochlorogenic acid (1), chlorogenic acid (2), cryptochlorogenic acid (3), rutin (4), hyperin (5), isochlorogenic acid A (6), and isochlorogenic acid B (7).
Table 4. The quantification of compounds 17 in the TLA and CLA extracts.
SampleContent (mg/g DW)
1234567Total
TLAtr9.002 ± 0.055 ****trtrND28.512 ± 0.217 ****12.223 ± 0.074 ****49.737 ****
CLAtr4.422 ± 0.032 ****trNDtr10.062 ± 0.070 ****11.255 ± 0.049 ****25.739 ****
The statistical significance of the mean ± SD values in each bar is determined using a t-test, indicating significant differences. The asterisks indicate different levels of statistical significance between TLA and CLA extracts (****, p < 0.0001). Neochlorogenic acid (1), chlorogenic acid (2), cryptochlorogenic acid (3), rutin (4), hyperin (5), isochlorogenic acid A (6), and isochlorogenic acid B (7).
Table 5. Calibration curves for tannic acid and quercetin.
StandardCalibration EquationCorrelation Factor, r2
Tannic acidY = 0.0147X + 0.08830.9995
QuercetinY = 0.0167X − 0.03290.9999
Y, absorbance at the respective wavelength (760 nm for tannic acid, 430 nm for quercetin); X, concentration of the standard (μg/mL); r2, correlation coefficient for five calibration data points (n = 3).
Table 6. DPPH and ABTS+ radical-scavenging activities of TLA and CLA extracts.
SampleDPPH (IC50, mg/mL)ABTS+ (IC50, mg/mL)
TLA1.59 ± 0.02 a1.43 ± 0.04 a
CLA2.82 ± 0.12 b2.53 ± 0.05 b
AA0.12 ± 0.00 c0.13 ± 0.00 c
a–c Different letters indicate statistically significant differences within the same column, determined by Tukey’s test (p < 0.05).
Disclaimer/Publisher’s Note: The statements, opinions and data contained in all publications are solely those of the individual author(s) and contributor(s) and not of MDPI and/or the editor(s). MDPI and/or the editor(s) disclaim responsibility for any injury to people or property resulting from any ideas, methods, instructions or products referred to in the content.

