Article

Pectin Extraction Process from Cocoa Pod Husk (Theobroma cacao L.) and Characterization by Fourier Transform Infrared Spectroscopy

by
Ismael Santiago-Gómez
1,
Areli Carrera-Lanestosa
1,
Fanny Adabel González-Alejo
1,
Zenaida Guerra-Que
2,
Ricardo García-Alamilla
3,
José Luis Rivera-Armenta
3 and
Pedro García-Alamilla
1,*
1
Academic Division of Agriculture and Livestock Science, Universidad Juárez Autónoma de Tabasco (UJAT), Carret. Villahermosa-Teapa Km 25, Ra. La Huasteca, Villahermosa 86280, Mexico
2
Laboratorio de Investigación 1 Área de Nanotecnología, Tecnológico Nacional de México—Instituto Tecnológico de Villahermosa (TECNM—I. T. Villahermosa), Km. 3.5 Carretera Villahermosa-Frontera, Cd. Industrial, Villahermosa 86010, Mexico
3
National Technological Institute of Mexico/Instituto Tecnológico de Ciudad Madero, Madero, Petrochemical Research Center, Prol. Bahía de Aldahir y Av. De las Bahías, Parque de la Pequeña y Mediana Industria, Altamira 89600, Mexico
*
Author to whom correspondence should be addressed.
ChemEngineering 2025, 9(2), 25; https://doi.org/10.3390/chemengineering9020025
Submission received: 11 November 2024 / Revised: 30 January 2025 / Accepted: 18 February 2025 / Published: 27 February 2025
(This article belongs to the Collection Green and Environmentally Sustainable Chemical Processes)

Abstract

The Cocoa Pod Husk (CPH) accounts for 67–76% of the total cocoa fruit weight, making it its main agro-industrial waste of cocoa production. A valorization of this waste is possible through the extraction of pectin. In this study, pectin was extracted from CPH powder by acid hydrolysis using citric acid and sulfuric acid. Fourier transform infrared spectroscopy (FT-IR) was employed as a qualitative and quantitative characterization technique. The FT-IR of the pectin samples showed the bands visible at 1732 and 1626 cm−1 corresponding to the esterified and free carboxylic groups, respectively. These bands can be differentiated according to their degree of methyl esterification (DE) by analyzing the area under the curve. The extracted pectin showed no significant difference in yields (p ≤ 0.05) between the two acids; however, significant differences (p ≤ 0.05) were observed in DE and methoxylation percentage (MeO). According to the FT-IR results, pectin extracted with citric acid presented a lower DE (7.43%) and MeO (1.12%) compared to pectin extracted with sulfuric acid, which showed a DE of 18.15% and a 2.96% MeO. Pectin with a DE below 50% is classified as low-methylated, making it unsuitable for the food industry. However, these create a raw material that has a potential use in the pharmaceutical and bioenergy industries.

Graphical Abstract

1. Introduction

Agro-industrial waste represents a significant source of lignocellulosic biomass that, if not properly managed, can become an environmental problem. Failure to properly manage the lignocellulosic biomass generated by agro-industrial waste can have serious environmental and health consequences. The uncontrolled decomposition of these wastes generates greenhouse gas emissions and contributes to soil and water pollution. Moreover, it represents a loss of valuable resources that could be reevaluated and used to create industrial products, contributing to a circular economy [1].
A prominent example is the Cocoa (Theobroma cacao L.) Pod is a by-product that constitutes 67–76% of the total weight of the cocoa fruit [2]. According to research by Vriesmann et al. [3], currently, due to limited information on the management of these wastes, producers tend to dispose of them in landfills or in the open, which can lead to the proliferation of pathogenic microorganisms and diseases, such as black pod disease. Consequently, it is essential to develop management strategies for this residue to valorize it through existing or innovative technologies. Cocoa pods are rich in functional or bioactive compounds such as phenolic compounds, alkaloids, saponins, and pectin [3,4,5,6,7,8,9], as well as an important source of lignocellulosic material [10], which can be as a carbon source for biofuel production.
Lignocellulosic biomass, composed of cellulose, hemicellulose, lignin, and pectin, offers enormous potential for extracting valuable compounds that could be used in various industries [11]. These lignocellulosic materials are primary components of the plant cell wall structure [12]. The primary cell wall consists of pectic polysaccharides that provide structural support, while hemicellulose is more abundant in secondary cell walls [13]. The proper management and re-evaluation of this biomass not only helps to mitigate environmental issues, but also promotes the creation of valuable and necessary products.
Pectin is a polysaccharide in the plant cell walls known for its gelling and thickening properties, making it valuable for the food, pharmaceutical, cosmetic, and medical industries. Its market has experienced significant growth, with an estimated USD 1.07 billion in in 2025 and a projected compound annual growth rate (CAGR) of 6.02% over the 2025–2030 period [14]. Pectin extraction is typically carried out through acid hydrolysis, which is an efficient process. However, it requires high temperatures, long reaction times, and significant amounts of mineral acids, leading to the production of substantial volumes of acidic wastewater and solid waste [15]. The limitations of the traditional processes have led to the consideration of other solvents and green technologies such as supercritical fluid extraction (SFE), microwave-assisted extraction (MAE), enzyme-assisted extraction (EAE), accelerated solvent extraction (ASE), and ultrasound-assisted extraction (UAE). The choice of extraction method depends largely on the cost of the technology [16,17]. Nevertheless, for research purposes involving new raw materials for pectin extraction, the process is controlled. Therefore, for any technological implementation, traditional methods using acid hydrolysis are required as a starting point.
The characterization of lignocellulosic biomass and extracted compounds is crucial to understand their properties, establish yield potential, and optimize their use. The appropriate characterization such as the physical, chemical, and thermochemical properties is an important stage in obtaining efficient pectin yield and other compounds of commercial interest, such as biofuels or bioenergy. Fourier transform infrared spectroscopy (FT-IR) is a technique used to identify chemical compounds, as each chemical bond absorbs infrared radiation at a specific frequency. This method is used in various research fields such as chemistry, biochemistry, pharmacology, materials science, and forensic investigation, among others [18,19]. It is particularly useful for the analysis of solid, liquid, and gaseous samples [20]. For example, Liu et al. [21] performed an FT-IR study on cell wall polysaccharides, exploring the 1800–800 cm−1 region, and found relevant wave numbers assigned to xylose at 1035 cm−1 to xylose-containing hemicelluloses, 1065 and 807 cm−1 to mannose-containing hemicelluloses, 988 cm−1 to cellulose, and 1740 and 1600 cm−1 to homogalacturonans depending on the degree of methylation. FT-IR is also widely used in the characterization of pectin and is able to identify the functional groups that it contains. The specific signals of the FT-IR spectra at 1753 cm−1 attributed to the carbonyl groups of esters and 1640 cm−1 to the stretching of the carboxylate ions contribute to the calculation of the degree of esterification and percentage of methoxylation [22]. The methodology used to determine the degree of esterification and methoxylation is based on the calculation of the areas of the bands in the 1700–1750 cm−1 (methyl esterified uronic acids) and 1600–1630 cm−1 (free uronic acids) regions [23,24]. These parameters directly influence the gelling properties of pectin.
Pectin gelling properties are determined depending on their degree of methoxylation (DM); high methoxylation (HM) refers to pectins having a DM > 50%, and low methoxylation (LM) refers pectins having a DM < 50%. HM forms gels in high (over 55%) sugar concentration or similar solutes at pH < 3.5. However, LM can form gels in the presence of divalent ions, such as Ca2+, with or without sugar. Therefore, LM is preferred in some commercial applications, such as in the low-calorie or diet food products [25,26,27].
The extraction of pectin from agro-industrial wastes, such as Cocoa Pod Husk, offers an alternative as an efficient solution for the management of these wastes while also providing valuable raw materials for various industries. Optimized methodologies and a detailed characterization of the extracted compounds are essential to maximize benefits and minimize environmental impacts. This integrated approach to waste re-evaluation represents a promising route for the development of sustainable processes and the generation of high-value-added industrial products.
This work aims to characterize the degree of methylation and esterification of pectin extract from Cocoa Pod Husk using infrared spectroscopy (FT-IR). This study contributes to agro-industrial waste management and opens new perspectives for the re-evaluation of cocoa by-products, contributing to the sustainable and profitable development of this industry.

2. Materials and Methods

The experimental study was carried out at the Process Engineering Laboratory of the Academic Division of Agricultural and Livestock Science of the Universidad Juárez Autónoma de Tabasco. Carretera Villahermosa-Teapa, Km. 25, Ra. La Huasteca, Centro, Tabasco, México. Cocoa pods were provided by producer Gerardo Valenzuela Hernandez’s crop farm in Paraiso, Tabasco, with coordinates 18.370317–93.235077.
The raw material for the study was 10 kg of Cocoa Pod Husks, which were chopped, exposed to the sun for three days on an extended surface, and then placed in an oven (Venticell, LSIK-B2V/VC 111, Planegg, Germany, Manufactured in the USA) at 50 °C for 48 h.

2.1. Lignocellulosic Composition of Cocoa Pod Powder (CCP)

For the quantitative characterization of lignocellulosic compounds, it was necessary to obtain Cocoa Pod Powder (CPP). The dried cocoa pod was ground in two stages: the first stage was carried out using a conventional mill (Surtek, MOGRA1, El Salto, Jalisco, Mexico), and the second stage was performed with a spice mill (Hamilton Beach, 80350R, USA, Manufactured in Grupo HB PS, S.A. de C.V., Mexico City, Mexico). The resultant CPP was then sieved through No. 40 sieve (Montinox, Manufactured in Montiel Inoxidables, Mexico City, Mexico). The particle size was standardized to approximately 429 μm.
The determination of extractables, hemicellulose, lignin, and cellulose were carried out following the methodology of Selvaraju and Bakar, 2017 [28] and Li et al. (2014) [29], whose works have been widely cited and validate the use of these techniques. Therefore, the precision of the method was not the focus of this research.

2.1.1. Extractables

CPP (w0) was mixed with a benzene/ethanol solution (2:1 v/v) at a consistent temperature for 3 h. It was then dried in an oven (Venticell, LSIK-B2V/VC 111, Planegg, Germany, Manufactured in the USA) at 105 °C to achieve a consistent weight after 24 h. The residue was cooled to room temperature in a desiccator and weighed (w1). The extractable percentage was measured according to Equation (1).
% E x t = W 0 W 1 W 0 × 100
The residue was used to measure hemicellulose and lignin percentage content.

2.1.2. Hemicellulose

A total of 150 mL NaOH (20 gL−1) was mixed with the residue generated from the extractable percentage (w2). The mixture was placed in a covered beaker and heated for 3.5 h. The solid obtained by Buchner filtration was washed four times with 150 mL distilled water to remove Na ions. It was then dried at 105 °C for 24 h and weighed (w3). The hemicellulose percentage content was calculated according to Equation (2).
% H e m i c e l l u l o s e = W 2 W 3 W 2 × 100 %   E x t

2.1.3. Lignin

A total of 1 g of residue from the extractable analysis was weighed and dried in an oven at 105 °C to a consistent weight. The sample was cooled in a desiccator and weighed (w4). Slowly, 30 mL of H2SO4 (72%) was added to the sample. The mixture was kept at 8–15 °C for 24 h. Then, it was transferred to a flask, diluted with 300 mL of distilled water, and brought to boiling for 1 h. The residue was filtered and washed to remove sulfate ions, dried at 50 °C to a consistent weight, cooled to room temperature in a desiccator, and weighed (w5). The lignin percentage content was calculated according to Equation (3).
% L i g n i n = W 5 W 4 × 100 %   E x t

2.1.4. Cellulose

The cellulose percentage content was determined by difference according to Equation (4):
% C e l l u l o s e = 100 % E x t % H e m i c e l l u l o s e % L i g n i n

2.1.5. Proximate Analysis

Proximate analysis was performed according to the Association of Official Analytical Chemists (AOAC) (2000): moisture content (925.09), crude fat (920.30), crude protein (979.09), ash (923.03), crude fiber (962.09), and carbohydrates were measured by their difference.

2.1.6. Thermogravimetric Analysis

Thermal analyses were performed in a TA Instruments SDT Q600 V20.9 Build 20 simultaneous calorimeter (TA Instruments, New Castle, DE, USA) at a heating rate of 10 °C min−1 from room temperature to the end of the study. Specifically, the thermal analysis (TGA-DTG) was carried out in two stages, from room temperature to 900 °C in an inert atmosphere, and then an oxidizing atmosphere.

2.2. Pectin Extraction

The Cocoa Pod Husk was pulverized, and a powder with a particle size of 429 µm was obtained and used to extract the pectins. The particle size was selected on the bases of the preliminary test conducted to obtain the pectin and avoid gelation and filtration issues. The extraction was carried out under the following conditions: 3 g of cocoa pod powder in 100 mL of distilled water acidified with sulfuric acid (3 N), citric acid (4%), or both at different pH conditions (2, 3, and 4). The mixture was maintained with magnetic stirring at 80 °C for 45 min and then filtered. The filtered liquid was precipitated with absolute alcohol, and the supernatant was centrifuged (7280× g, 10 °C, 20 min) in a HERMLE centrifuge (Z 326 K, Gosheim, Germany), washed with 70% alcohol (v v−1) to pH 4, and dried at 50 °C for 24 h. Finally, it was ground in a mortar and stored in Eppendorf tubes for further analysis.

2.3. Fourier Transform Infrared Spectroscopy

Vibrational analysis was conducted using a Fourier transform infrared (FT-IR) spectrophotometer (Perkin Elmer, Frontier, Waltham, MA, USA), with an attenuated total reflection (ATR) diamond controlled with Windows 10 Enterprise LTSC software, in the wavenumber range from 400 to 4000 cm−1 at a resolution of 4 cm−1 and 32 scans per spectrum. For deposition in the ATR, samples of the CPP before extraction, of the pectin obtained by each treatment, and of the spent matrix were used. A baseline correction, smoothing, and normalization were performed on all the spectra obtained, using the Spectrum 10.6.2 software of the FT-IR spectrometer (Perkin Elmer, Frontier, Waltham, MA, USA), and each sample was read in triplicate. Using the Spectrum software utilities, the area under the curve of the signals at 1732 cm−1 and 1626 cm−1 was determined. The area was defined by a starting and ending abscissa value, and two base points. The generated data were processed in Origin 8.5.1. for the creation of spectrum figures and signal assignment.

2.3.1. Degree of Esterification

The degree of esterification (DE) of the extracted pectin was calculated according to the data from IR spectra obtained and substituted on Equation (5) [24], which compares the areas under the curve of the free carboxylic group (1626 cm−1) to the esterified group (1732 cm−1).
D E = A r e a   u n d e r   c u r v e   t o   t h e   e s t e r i f i e d   g r o u p A r e a   u n d e r   t o   t h e   f r e e   c a r b o x y l i c   g r o u p + a r e a   u n d e r   c u r v e   t o   t h e   e s t e r i f i e d   g r o u p × 100

2.3.2. Methoxylation Percentage

The methoxylation percentage (%MeO) was estimated using the proposed equation from Zouambia et al. (2014) [30]:
% M e O = 16.32 100 × D E

2.3.3. Pectin Yield

The pectin yield was gravimetrically determined according to the following equation:
% P e c t i n   y i e l d = m a s s   o f   e x t r a c t e d   d r i e d   p e c t i n   ( g ) m a s s   o f   d r i e d   C C P   ( g ) × 100
All the analyses were repeated three times on three different samples and the average values are reported in Table 1 and Table 2.

3. Result and Discussion

The results obtained are detailed below and are divided into the following stages: (1) CPP characterization, (2) pectin extraction, and (3) the characterization of residual biomass after extraction.

3.1. Cocoa Pod Powder Characterization

3.1.1. Proximate and Lignocellulosic Analysis

Table 1 shows the proximate and lignocellulosic characterization results of the biomass contained in the CPP. The composition is highly variable; according to Valladares-Diestra et al. [31], CPP is composed of polymers of lignin, cellulose, hemicellulose, and a fraction of extractable. The extraction procedure used by Valladares-Diestra et al. [31] for the extractable material was carried out according to the procedure of the National Renewable Energy Laboratory, whose methodology is based on Soxhlet extraction with water and ethanol as solvents in two stages depending on the type of biomass, which differs from the methodology cited in this research. According to Valladares-Diestra et al. [31], the results showed for extractables, on a dry basis, an extractable amount in water and ethanol of 34.32% and 2.24%, respectively, making a total of 36.55%, which is higher than the results found in this research The above indicates the differences that can be found depending on the extraction methods and solvents. In our work, we obtained a content of 13.4%, which represents less than half of what they reported. The lignin content was also lower than that reported by Valladares-Dientra et al. [31]. However, the cellulose and hemicellulose content was higher. Similarly, another study reported hemicellulose contents lower than those reported in the present study [32]. The sample cellulose content of 19.92% is lower compared to results reported in other studies [33,34,35]. These variations are mainly attributed to the type of cocoa variety, plantation management, and soil and climatic conditions [15,31]. Depending on the type of variety, the morphological properties of the fruit vary widely, and so does the composition of the origin.
The cellulose content of the CCP was in line with the findings of other studies, which used associated residues for extracting pectin, bioactive compounds, biofuels, or biorefinery products [15,36,37,38]. Lignin is a rich source of aromatic compounds, which are valuable for the production of high-value-added chemicals, such as resins, adhesives, and polymers [39]. Another benefit of lignin is its ability to improve the mechanical and thermal properties of composite materials. By incorporating lignin into polymeric matrices, biocomposites with improved strength and durability, suitable for construction and automotive applications, can be developed [40,41]. The proximate analysis of CCP showed similar results to those reported in different fields of application, such as human health, cosmetics, the food industry, and bioremediation [2,3,7,42].
Lignocellulosic compounds in plant biomass are closely related to the proportions of measurable variables in the proximate analysis. For example, lignin, a complex polymer that confers rigidity to plant cell walls, is inversely related to moisture and carbohydrates as its high content indicates a lower availability of these components. In contrast, cellulose and hemicellulose, which constitute the bulk of the structural carbohydrates in biomass, are positively correlated with fiber and ash as they represent a significant fraction of the insoluble and mineral matter of the plant [21]. The presence of fat in biomass might be influenced by the presence of these structural components since the cell wall structure may affect the lipid storage capacity of the plant [43].
The CCP is a potential source of value-added products. Based on proximate analysis (Table 1), the reported primary metabolites serve as a foundation for evaluating the nutritional potential of this raw material. Furthermore, this type of residual biomass is rich in antioxidant molecules, primarily due to its secondary metabolites such as phenolic compounds, which confer bioactivity. Additionally, it is notable for its high dietary fiber and protein content [3,4,5,6,7,8,9].
The characterization results of the residual biomass of CPP reveal the complex interaction between lignocellulosic components and proximate parameters, providing information on the quality of the plant biomass. Understanding the lignocellulosic composition of agro-industrial wastes is essential for their re-evaluation for biotechnological applications, such as replacing petroleum-derived chemicals like ethylene and propylene, which are converted into countless products including plastics, solvents, cosmetics, and pharmaceuticals [44], biofuel production, the production of pectin nanoparticles in the pharmaceutical industry [45], and bioplastics and renewable chemical products [46]. The pectin extraction from CPP represents a suitable strategy for re-evaluation to address the use of this waste, as well as to close the gap towards reaching a circular economy.

3.1.2. Thermogravimetric Analysis

Thermogravimetric analysis (TGA) using isothermal and non-isothermal steps is an effective tool for the characterization of the thermal decomposition of biomass [47]. The basis of the method is the determination of the sample’s mass change as a function of time under a controlled atmosphere program. In addition, TGA-DTG provides a more comprehensive understanding of pyrolysis [48].
Figure 1 shows the thermogram of CPP, where a significant weight loss (89.74 wt.%) was observed between 0 and 550 °C. A plateau with a yield of 27.97% was found in the final inert atmosphere condition. In addition, three well-defined stages of CPP mass loss related to temperature increase and four stages in Differential-Thermogravimetric Analysis (DTG) were observed. This analysis is crucial for understanding the thermal stability and composition of lignocellulosic biomass.
The first stage (at approximately 11 min) shows a weight loss of 9.83%, corresponding mainly to the elimination of free water and moisture absorbed in the CPP, in addition to the primary decomposition of extractives as cited by Milian-Luperón et al. (2019) [48]. In lignocellulosic biomass thermograms, this initial stage of dehydration is commonly observed and usually occurs at temperatures below 150 °C.
The most significant stage of weight loss occurs between 50 and 100 min, with a 72.03% decrease in weight. This phase corresponds to the thermal decomposition of the main components of lignocellulosic biomass: hemicellulose, cellulose, and lignin. The decomposition of hemicellulose generally occurs between 180 and 350 °C, while cellulose decomposes between 280 and 400 °C. Lignin, which is more resistant to heat, shows a more gradual decomposition that can extend to up to 600 °C. The lignocellulosic biomass of cocoa CPP shows significant decomposition in this region, similar to other lignocellulosic materials such as sugarcane bagasse [49] and rice husk [50].
After 100 min, the weight loss stabilizes, leaving a final residue of 8.50%. This residue is mainly composed of ash and fixed carbon, which are the most resistant components to thermal degradation, common in lignocellulosic biomass due to the presence of lignin and other non-volatile mineral components [47,51,52].
The blue curve, representing the derivative of weight loss (%/min), shows peaks indicating maximum decomposition rates. These peaks correspond to the temperatures where the highest mass loss occurs due to the decomposition of specific components. Two significant peaks were found at 261.78 °C and 294.73 °C that would correspond to the decomposition of hemicellulose and cellulose/lignin. The first peak in the derivative of weight loss is observed around 50–100 min, which coincides with the stage of hemicellulose and cellulose decomposition. This behavior is similar to other lignocellulosic biomass, where hemicellulose decomposition occurs first due to its less crystalline and more amorphous structure compared to cellulose [53]. A second, less pronounced peak can be attributed to the decomposition of lignin and other more resistant components. This behavior is characteristic of lignin, which does not decompose in a narrow temperature range but does so more extensively and gradually. The results are similar to those shown by Milian-Luperón et al. (2019) [48], who found peaks at 281.41 °C and 353.17 °C for CCP. In addition, with the change from an inert atmosphere to an oxidant one, the residual biomass was burned and a peak appeared in the DTG curve at 581 °C. This last peak for our study occurred at 557 °C. The residual biomass content after TGA for Millian-Luperón et al. (2019) [48] was 5.8%, while for our results, it was slightly higher at 8.5%. These last data are considered to be affected by the ash content, which is slightly above that reported in the proximal analysis. According to Saffe et al. (2019) [47], the TGA results are similar to those reported by standard methods. The thermogram indicated that CPP biomass decomposition was approximately at 550 °C, a higher condition than the 450 °C reported by Millian-Luperóna et al. (2019) [48].
Compared to other types of lignocellulosic biomass, CPP shows thermal decomposition patterns similar to rice husk, sugarcane bagasse, and wood sawdust. The initial stage of moisture loss, followed by the rapid decomposition of hemicellulose and cellulose, and finally, the slower decomposition of lignin, is a common pattern.
The CPP thermogram shows that the lignocellulosic biomass had a thermal behavior comparable to other similar biomasses, with a significant weight loss during the decomposition of hemicellulose and cellulose and a final residue consistent with the presence of lignin and other mineral components.

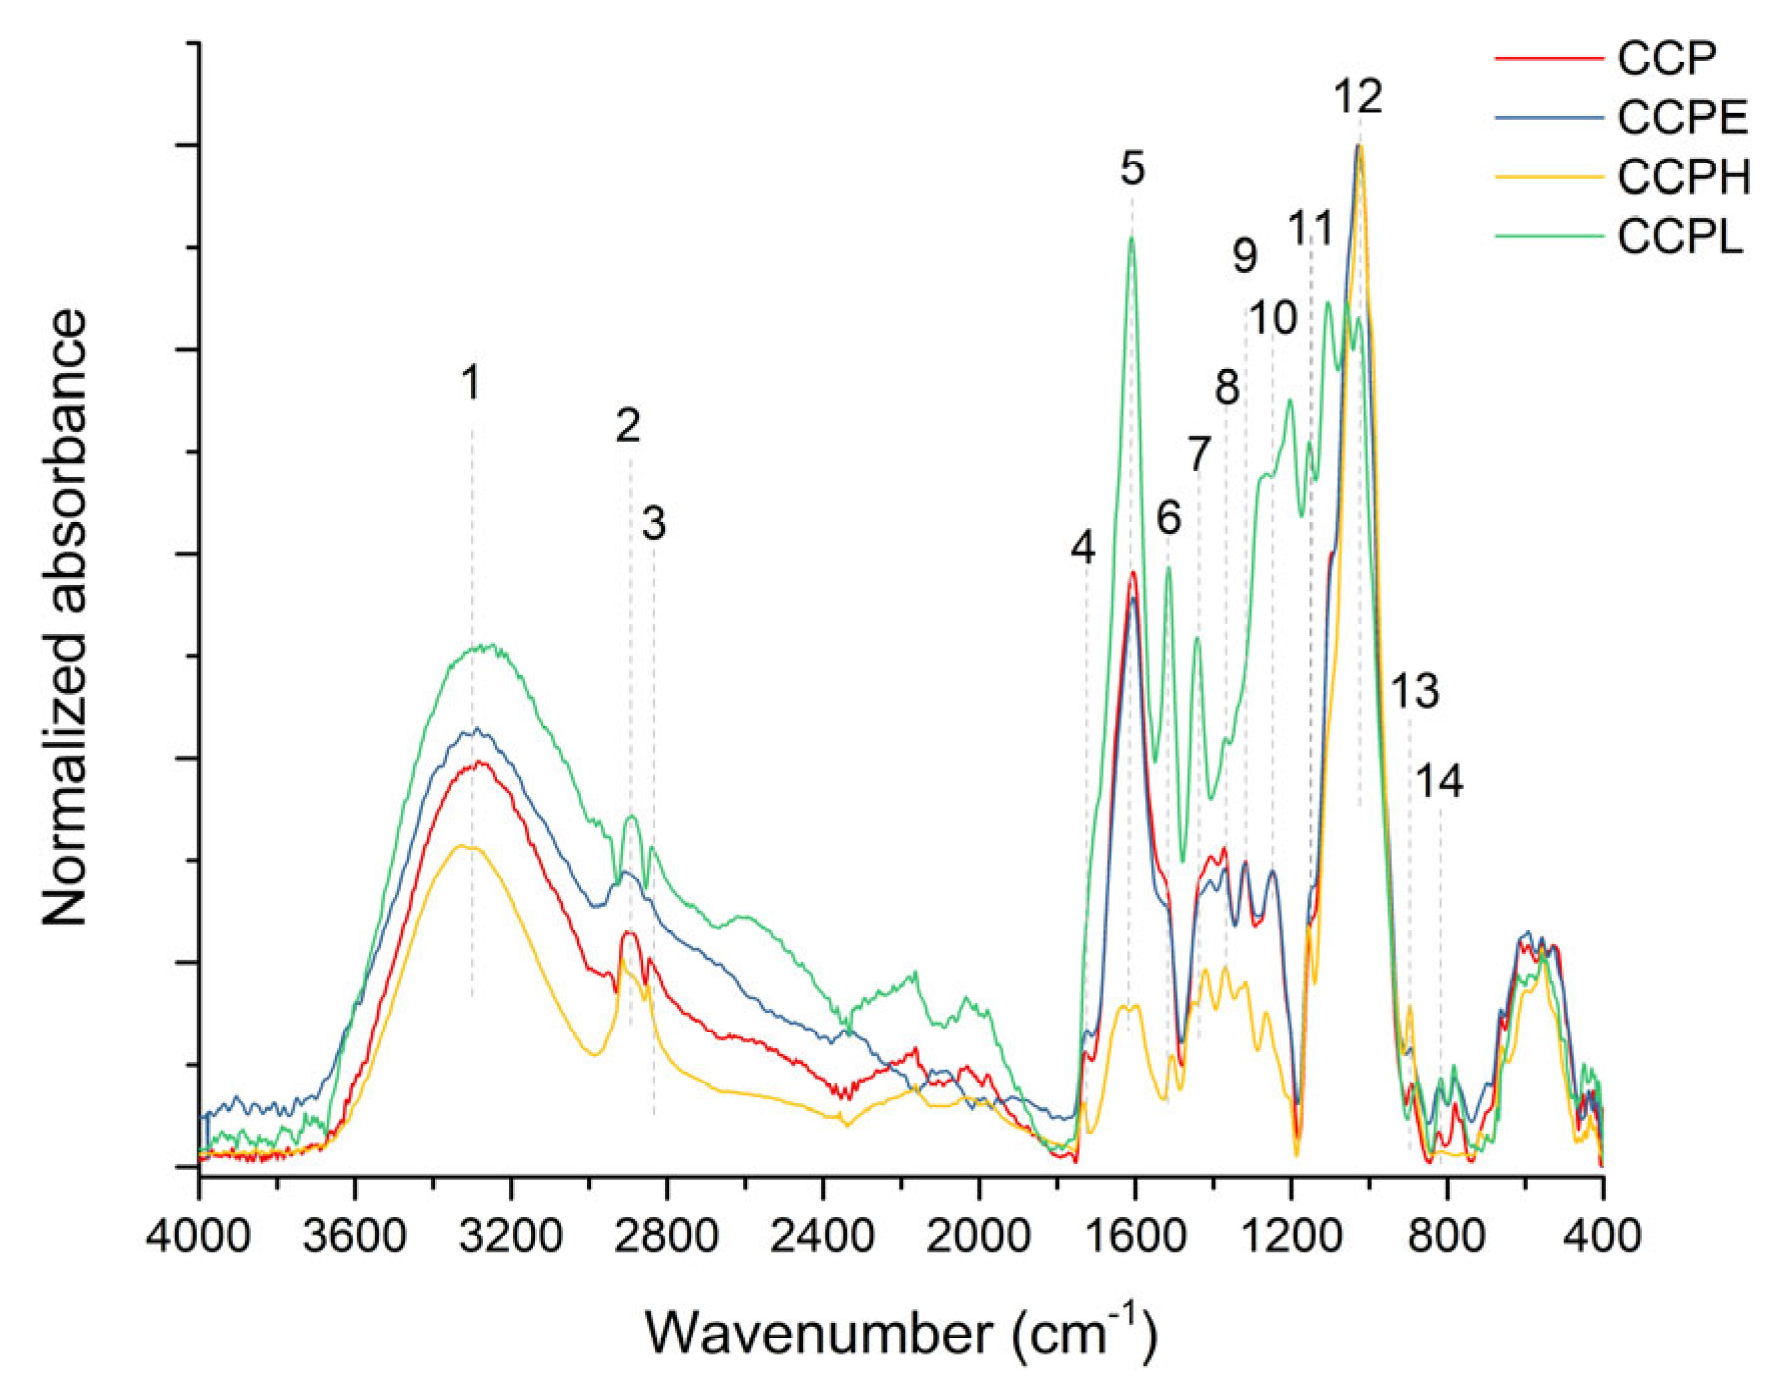
3.1.3. Infrared Spectroscopy Analysis

Figure 2 shows the CPP spectra, showing a broad band from 3500 to 3000 cm−1. In this region, the signal at 3302 cm−1 (1) encompasses different functional groups that are characteristic in this type of sample, such as O-H, N-H, and C≡C, and that present strong overlapping of their bands, making their identification challenging [21]. The assignments at 2904 cm−1 (2), and 2846 cm−1 (3) were attributed to aliphatic bonds with the symmetric C-H stretching of methyl (-CH3) and methylene (=CH2), respectively [54]. The signal at 1726 cm−1 (4) for CPP is related to the symmetric C=O stretching vibration of carbonyl ester groups, characteristic of pectin polysaccharides [55].
The signal 1606 cm−1 (5) corresponds to the asymmetric stretching of free carboxyl groups (COO-) present in polygalacturonic acid and homogalacturonan DM 70 [52,53,54]. The signal 1520 cm−1 (6) was attributed to the amide II N-H (proteins) deformation present in the basic phenolic-lignin structure in combination with hemicellulose [21,56,57,58].
The 1410 cm−1 signal assignment (7) is characteristic of the symmetric COO- (free carboxyl) stretching typical of the rhamnogalacturonan and homogalacturonan groups commonly associated with the basic pectin structure [59]. The 1372 cm−1 signal (8) identifies a CH2 asymmetric bending typically associated with the monosaccharides L-rhamnose, β-glucans (microcrystalline cellulose, yeast β-glucan, and Curdlan or 1,3-β-glucan), and 1,4-β-D-mannan [21]. At 1317 cm−1 (9), a CH2 symmetric bending signal was observed, which has been found in the monosaccharide D−(−) −arabinose and β-glucans, a main characteristic of cellulose [60]. At 1248 cm−1 (10), C-O single bond stretching is present, which is found in polysaccharides like rhamnogalacturonan and homogalacturonan [60]. A low-intensity signal at 1144 cm−1 (11) identifies glycosidic (O-C-O) bond vibrations present in pectin uronic acid [21,22,61]. At 1030 cm−1 (12), it was assigned to C-O and C-C stretching, which are characteristic bands of cellulose [21]. Finally, signals at 894 cm−1 (13) and 820 cm−1 (14) were assigned to C1-H bending (xylose contained in hemicellulose) and the vibration of the pectin ring [59,60].
In the present study, the signal assignment at 3302 cm−1 (1) identifies N-H bonds, which belong to amines present in amino acid peptide bonds [62]. Likewise, the amino group is present in the theobromine, which is a characteristic molecule of cocoa [63]. In addition, this signal in the infrared spectra corresponds to O-H groups (alcohols) and C≡C alkene groups found in the structure of cellulose, hemicellulose, and pectin [21,55]. The decrease in signal intensity at 3302 cm−1 in the CPP is attributable to hemicellulose extraction. In fact, in the delignified pod powder sample (CCPL), it can be observed with higher intensity due to the decreased presence of lignin, which avoids an overlapping band of absorption signals characteristic of cellulose, hemicellulose, and pectin [22].

3.2. Pectin Extraction

The conventional extraction of pectin in the food industry is commonly performed by acid hydrolysis. Sulfuric acid, a strong acid, promotes the breaking of esterification bonds but causes serious corrosion problems. Alternatively, citric acid, a weak acid found in citrus fruits, offers a less aggressive alternative. The choice between them depends on factors such as the desired properties of the final product and economic and environmental considerations [63]. The selection of the right acid allows an efficient and sustainable extraction of pectin, guaranteeing the quality of the final products in the food industry. On the other hand, the implementation of sustainable processes necessitates a comprehensive life cycle analysis, which serves as a critical tool for informed decision-making in the selection of environmentally friendly and efficient methods. In their study, Nadar et al. (2022) [64] identified citric acid, ethanol, and electricity as key contributors to the increasing impact that this process has on the climate. Consequently, it becomes essential to evaluate various factors in accordance with the desired degree of technological development within the context of scientific and technological research.
The DE and MeO content for each Pectin (Table 2) was determined based on the area of the CO ester group stretching band (1732 cm−1) and the signals of the carboxyl ion stretching vibrations (1626 cm−1) [65]. The IR spectra of the extracted Pectin at different pH are shown in Figure 3 and compared with Commercial Pectin (CP). The CP sample is used as a positive control because it has a higher absorbance signal at 1732 cm−1 than at 1626 cm−1, which is characteristic of a Highly Esterified Pectin (HDE).
According to Equation (3), the DE for the CP sample was estimated to be about 58%. In the case of extracted pectin using citric acid to pH 4 (PCApH4), the highest intensity in absorbance corresponds to the signal of non-esterified carboxylic groups, which is characteristic of pectin low in DE. Table 2 shows that the extracted pectin did not present significant differences (p ≤ 0.05) in mass yield percentage with sulfuric or citric acid under different pH conditions in our study. However, the yield values are below the percentage range of 6.1–9.2% reported in research [2,3,34]. The above findings indicate that the type of acid and pH conditions did not affect the yield; however, this was not the case for the other study variables. In this research, the choice of citric acid was based on previous studies that demonstrated it to be more beneficial to use regarding environmental concerns and its greater effectiveness in pectin extraction than mineral acids in terms of yield and physicochemical properties [66]. However, extracted pectin with citric acid presented a lower DE than the pectin extracted with sulfuric acid. PCApH4, in particular, showed a higher absorbance intensity in the signal at 1626 cm−1 than at 1730 cm−1, that, as previously discussed, is characteristic of a low DE pectin compared to all the pectin extracted with both acids (Figure 3) and, therefore, it obtained the lowest degree of esterification with 6.94% (Table 2). Meanwhile, the extracted pectin using sulfuric acid at pH 2 (PSApH2) showed the highest DE, reaching 18.15%. Pectin with a DE lower than 50% was considered to have low methylation (LDM) [67].
Roman-Benn et al. (2023) [68] reported an overview of pectin sources, extraction methods, and applications of different agro-industrial residues. The text mentions that there are reports of low-esterification pectin (<50%) from different sections of residues from the citrus, apple juice, and flower industries: lemon (24–40%), orange (25%), grapefruit (34%), apple pomace (from 22.21 to 65.88%), and sunflower (10–40%). It indicates that, depending on the source and extraction methods, the percentages obtained, pectin structure, molecular weight, composition, purity and color vary, and thus, the specific applications are determined by these characteristics.
The growing trend of low-sugar products in the food industry, such as diet foods, low calorie jams, and carbonated drinks has driven the development of sugar-free products for diabetics, which in turn has increased the demand for low-methoxyl pectin. Additionally, the antioxidant capacity of pectin is attributed to its ability to chelate metal ions, influenced by the source of the raw material, extraction method, and the degree of esterification. Studies of citrus pectin on sunflower/flaxseed emulsions have shown that low DE pectin exhibits superior antioxidant potential compared to high-methoxyl pectin [68].
Pectins have been isolated that possess a combination of unexpectedly high molecular weights and low degrees of methylation. These high molecular weight and low degree of methylation pectins form gels at unexpectedly low concentrations. Such pectins can be obtained by extracting homogenized Aloe Vera plants or portions thereof. These pectins can be used to prepare pharmaceutical compositions comprising pharmacological agents encapsulated in a pectin gel for application to animals and humans, so as to provide a controlled release of the pharmacological agent [69].

3.2.1. Extracted Pectin Characterization by FT-IR

Figure 3A–D shows the FTI-R spectra of all pectin samples extracted by hydrolysis at different pH with sulfuric acid and citric acid, along with the infrared spectrum of commercial pectin (CP) categorized as a high degree of methoxylation (HDM) pectin. All IR spectra show a broad and intense band between 3600 cm−1 and 2900 cm−1 (Figure 3A,B), attributed to the stretching of O-H groups related to intra- and intermolecular hydrogen bonds [70,71].
Similarly, the bands in the 3000–2900 cm−1 region corresponded to the absorption of C-H stretching vibrational bonds of the methyl group (CH3) of the methyl ester [72]. Theoretically, the O-CH3 stretching bands in this region are used to differentiate LDM and HDM pectin. However, the IR spectrum showed no noticeable changes between the extracted pectin and commercial pectin (CP) because the hydroxyl absorption band was broad and strong, which generated that the overlapping signals masked the O-CH3 stretching signals; therefore, it is not a reliable indicator of methoxylation [70,73].
The strongest signals in the region 1750–1730 cm−1 (1) were related to carbonyl ester groups (C = O) present in the galacturonic acid chain characteristic of the pectin backbone [34]. The 1640–1620 cm−1 region attributed to asymmetric COO-stretching, specifically at 1632 cm−1 (2), was due to the stretching of the carboxylate ion present in pectin polysaccharides. As shown in Figure 3C,D, the carbonyl ester band (at 1730 cm−1) was more intense for CP due to its high degree of methoxylation (HDM) compared to the low degree of methoxylation (LDM) pectin samples obtained by conventional extraction. The samples obtained with H2SO4 showed lower intensity in this signal, particularly the PSApH2 sample, which was similar to the samples obtained with citric acid. In general, the carboxylate ion stretching band at 1632 cm−1 (2) presented higher intensity for low-methoxyl grade pectins. The O-CH3 stretch bands were not useful for the analysis of the degree of pectin methoxylation. However, as shown in Figure 3C,D, the carbonyl and carboxylate ester stretching bands were useful for pectin sorting. The esterified CH3 group presented bands in the 1450–1350 cm−1 region, with symmetric CH3 stretching around 1380 cm−1 (5) and asymmetric CH3 stretching around 1412 cm−1 (4) [74]. The carboxylate ion produced a weaker stretching band in CP than in the extracted pectin, around 1412 cm−1 (4). The stretching vibrations of C-O, C-C, and the ring structures, as well as the deformation of CH2 groups (characteristic of polysaccharides), showed bands in the region 1220 cm−1 (6) −776 cm−1 (13). The band characteristics of polysaccharides are located close to each other, which may cause identification problems due to band overlapping [60]. Intense peaks in the region 1150–1014 cm−1 were caused by the high homogalacturonan content in pectin. A less intense signal around 1142 cm−1 (7) was characteristic of the C-O-C vibrations of glycosidic bonds. At 1076 cm−1 (9) and 1048 cm−1 (10), signals were associated with sugars such as arabinose, xylose, and galactose, while a band around 950 cm−1 (12) indicated methyl grade [66]. Similarly, a particular intensity variation was shown in the 776 cm−1 signal (13), which was attributed to the vibration of the ring (pectin) and the bending vibrations of the carbonyl group (out-of-plane) and aromatic rings [21]. In the CP sample, the 776 cm−1 signal was not detectable; however, in the extracted pectin samples, an intensity variation between acid and pH [PSApH (2,3 and 4) and PCApH (2,3 and 4)] was observed. For pectin samples, this fingerprint region provides unique information for the compound and is often difficult to interpret [21]. The fingerprint region is unique for each sample. In all FT-IR spectra of the samples, the ester carboxylate signal was the most intense in the low-methoxyl grade pectin.

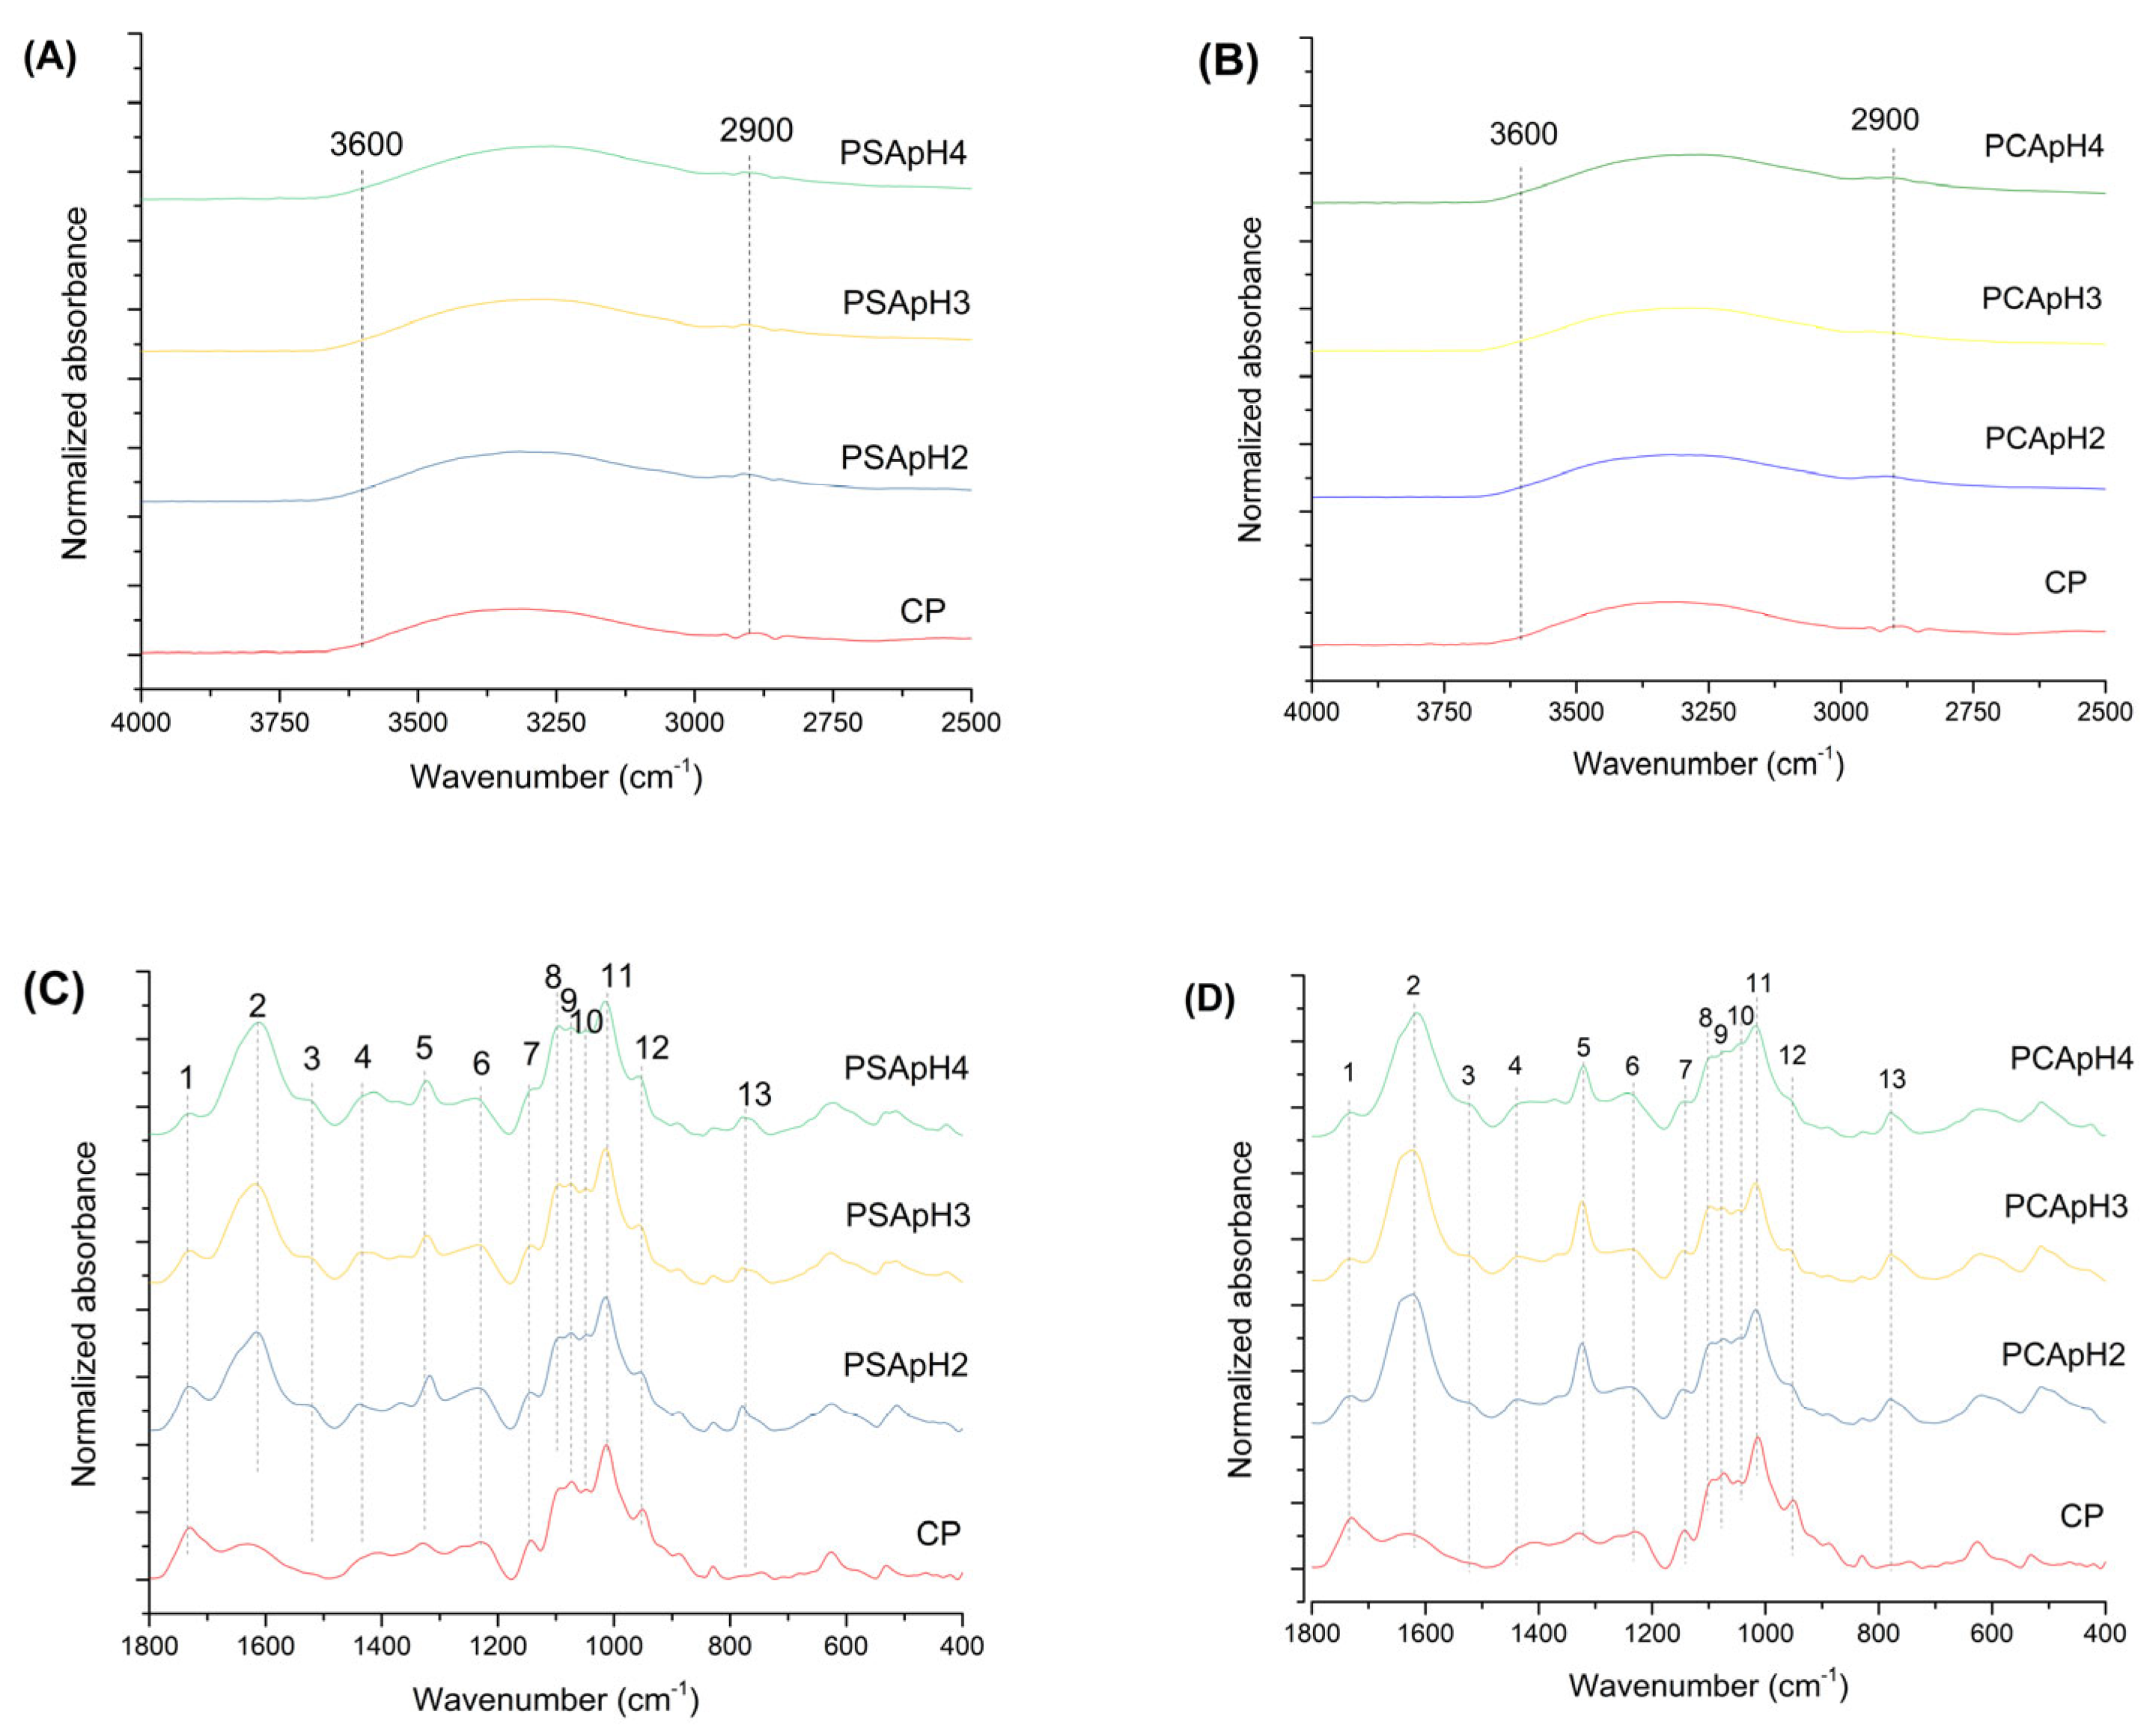
3.2.2. FT-IR Characterization of Residual Biomass

The IR spectrogram in Figure 4A–D shows the normalized absorbance of residual CPP after pectin extraction with sulfuric acid under different pH conditions (RSApH2, RSApH3, and RSApH4) in the range of 4000–400 cm−1. A sample of the fresh CPP is included for comparison.
Lignocellulosic biomass, such as Cocoa Pod Husks, is composed mainly of cellulose, hemicellulose, and lignin. Each of these components has characteristic signals in the IR spectrum: for cellulose, this was 3400 cm−1 OH stretching, 2900 cm−1 CH stretching, and 1050–1150 cm−1 C-O-C stretching [55,73]. For hemicellulose, this was similar to cellulose, with additional peaks at 1725 cm−1 (acetyl C = O) [75]. For lignin, this was from 1600 cm−1 to 1510 cm−1 aromatic ring stretching, 1260 cm−1 C-O stretching of ether/aromatic bonds, and 830 cm−1 out-of-plane deformation [76].
Pectin extraction by acid hydrolysis significantly alters the structure of the lignocellulosic biomass, which is reflected in changes in the signals of the IR spectrum.
For signals in the 1750–1500 cm−1 region (Figure 4C,D), PMC shows the presence of a band at 1740 cm−1 (7) corresponding to the C = O stretching of the acetyl groups of hemicellulose and esters in pectin. In the samples RASpH2, RASpH3, and RASpH4, after pectin extraction, this band decreased markedly, indicating the removal of pectin and acetylated compounds during acid hydrolysis.
For peaks in the region of 1500–1200 cm−1 (Peaks 8–11), 1510 cm−1 and 1420 cm−1 (Peaks 8 and 9) are associated with the aromatic rings and C-H bonds of lignin. These peaks are observed in all samples but with reduced intensity in treated samples (RASpH2, RASpH3, and RASpH4), suggesting a partial decrease in lignin.
The signal reached to 1370 cm−1 (10) was assigned in the C-H stretching of cellulose and hemicellulose. The decreased intensity in the treated samples indicates a partial degradation of these components during pectin extraction. The reduction in the peaks at 1230 cm−1 (Peak 11) associated with the C-O stretching of esters and C-O-C bonds of hemicellulose and pectin after acid treatment indicates the elimination of these groups.
For the peaks in the region of 1200–900 cm−1 (Peaks 12–13), 1160 cm−1 (Peak 12) is associated with the C-O-C bonds of cellulose. The decrease in intensity of the latter peak after pectin extraction suggests the depolymerization of the cellulose. The significant decrease in the peaks between the 1100 and 1000 cm−1 of C-O and C-C stretching of cellulose and hemicellulose indicates the breakdown of these polysaccharides during acid hydrolysis.
The extracted pectin can have a low or high methoxylation degree, which affects its gelling and thickening properties. The presence of methoxyl groups (−OCH3) is reflected in specific bands in the IR spectrum with the C = O stretching of methyl esters, while this is about 1740 cm−1 with the C-O stretching of methyl bonds.
In the citrus methylated-pectin (CMP) sample, these bands are prominent, indicating a high degree of methoxylation. In the treated samples (RSApH2, RSApH3, and RSApH4), the reduction in the intensity of these bands suggests that pectin extracted with sulfuric acid has a lower degree of methoxylation, which is common in pectins extracted by acid hydrolysis since methoxyl groups can be hydrolyzed under acidic conditions.

4. Conclusions

Fourier transform infrared spectroscopy is a valuable tool in the study of biomass components and their derivatives. It allows for a straightforward determination of the degree of esterification once the bands corresponding to 1626 cm−1 and 1732 cm−1 have been identified.
The yield of pectin extracted with sulfuric acid ranged from 2.4% to 2.6%, while it was between 2.3% and 2.5% with citric acid, without showing significant statistical differences as a function of pH (2–4), suggesting that the acid type and pH do not substantially influence pectin yield.
The extraction of pectin via the acid hydrolysis of CPH with sulfuric and citric acid showed a low degree of esterification compared to the requirements of the current food industry, which demands a value higher than 60%. The pectin extracted from CPH with the characteristics discussed in this work can currently be considered for various other applications, such as sugar-free products suitable for diabetic consumption or as an additive due to its antioxidant power. There is also a potential for it to be used as a raw material for the pharmaceutical industry, particularly to produce controlled release drugs, as well as for it to be used in bioenergetic processes and other high value-added chemical products.
Although the conventional method of extraction had a lower pectin yield, this could be improved by using non-conventional methods such as microwave and ultrasound extraction, which will be explored in further work.

Author Contributions

Conceptualization, I.S.-G. and P.G.-A.; methodology, I.S.-G., J.L.R.-A., R.G.-A. and A.C.-L.; software, I.S.-G., J.L.R.-A. and P.G-A.; validation, I.S.-G., F.A.G.-A., A.C.-L. and P.G.-A.; formal analysis, I.S.-G. and P.G.-A.; investigation, I.S.-G., A.C.-L. and P.G.-A.; resources, Z.G.-Q., A.C.-L. and P.G.-A.; writing—original draft preparation, I.S.-G., P.G.-A. and R.G.-A.; writing—review and editing, I.S.-G., R.G-A., Z.G.-Q. and P.G.-A.; supervision, A.C.-L. and P.G.-A.; project administration, P.G.-A. and A.C.-L. All authors have read and agreed to the published version of the manuscript.

Funding

This research was funded by Consejo de Ciencia y Tecnología del Estado de Tabasco (CCyTET), through the “Programa para el Desarrollo por la Ciencia, la Tecnología y la Innovación del Estado” (PRODECTI-2022-01/07), and by Fondo Mixto of CONACYT-Gobierno de Tabasco No. TAB-2018-01-01-84312. Ismael Santiago-Gómez received scholarship no. 1228321 from National Counsel for Science and Technology in Mexico (CONAHCYT).

Data Availability Statement

The original contributions presented in the study are included in the article. Further inquiries can be directed to the corresponding author.

Conflicts of Interest

The authors declare no conflicts of interest.

References

  1. Ubando, A.T.; Felix, C.B.; Chen, W.H. Biorefineries in the circular economy: A comprehensive review. Bioresour. Technol. 2020, 299, 122585. [Google Scholar] [CrossRef] [PubMed]
  2. Campos-Vega, R.; Nieto-Figuero, K.H.B.; Oomah, D. Cocoa (Theobroma cacao L.) pod husk: Renewable source of bioactive compounds. Trends Food Sci. Technol. 2018, 81, 172–184. [Google Scholar] [CrossRef]
  3. Vriesmann, L.C.; Amboni, R.D.M.C.; de Oliveira Petkowicz, C.L. Cacao pod husks (Theobroma cacao L.): Composition and hot water-soluble pectins. Ind. Crops Prod. 2011, 34, 1173–1181. [Google Scholar] [CrossRef]
  4. Abdul Karim, A.; Azlan, A.; Ismail, A.; Hashim, P.; Abd Gani, S.S.; Zainudin, B.H.; Abdullah, N.A. Phenolic composition, antioxidant, anti-wrinkles and tyrosinase inhibitory activities of cocoa pod extract. BMC Complement. Altern Med. 2014, 14, 381. [Google Scholar] [CrossRef]
  5. Nguyen, V.T.; Pham, T.D.; Vu, L.B.; Nguyen, V.H.; Tran, N.L. Microwave-assisted Extraction for Maximizing the Yield of Phenolic Compounds and Antioxidant Capacity from Cacao Pod Husk (Theobroma cacao L.). Curr. Nutr. Food Sci. 2020, 17, 225–237. [Google Scholar] [CrossRef]
  6. Oduro-Mensah, D.; Ocloo, A.; Lowor, S.T.; Mingle, C.; Okine, L.K.N.A.; Adamafio, N.A. Bio-detheobromination of cocoa pod husks: Reduction of ochratoxin A content without change in nutrient profile. Microb. Cell Fact. 2018, 17, 79. [Google Scholar] [CrossRef]
  7. Nguyen, V.T.; Nguyen, N.H. Proximate Composition, Extraction, and Purification of Theobromine from Cacao Pod Husk (Theobroma cacao L.). Technologies 2017, 5, 14. [Google Scholar] [CrossRef]
  8. Barrios-Rodríguez, Y.F.; Salas-Calderón, K.T.; Orozco-Blanco, D.A.; Gentile, P.; Girón-Hernández, J. Cocoa Pod Husk: A High-Pectin Source with Applications in the Food and Biomedical Fields. CheBioEng Rev. 2022, 9, 462–474. [Google Scholar] [CrossRef]
  9. Nguyen, V.T.; Tran, P.T.T. Characterization of microencapsulated powders rich in saponins from cocoa pod husk (Thebroma cacao L.) and medicinal plant an xoa (Helicteres hirsuta Lour.). Heliyon 2024, 10, e32703. [Google Scholar] [CrossRef]
  10. Díaz-González, A.; Luna, M.Y.P.; Morales, E.R.; Saldaña-Trinidad, S.; Blanco, L.R.; de la Cruz-Arreola, S.; Pérez-Sariñana, B.Y.; Robles-Ocampo, J.B. Assessment of the Pretreatments and Bioconversion of Lignocellulosic Biomass Recovered from the Husk of the Cocoa Pod. Energies 2022, 15, 3544. [Google Scholar] [CrossRef]
  11. Adiletta, G.; Brachi, P.; Riianova, E.; Crescitelli, A.; Miccio, M.; Kostryukova, N. A Simplified Biorefinery Concept for the Valorization of Sugar Beet Pulp: Ecofriendly Isolation of Pectin as a Step Preceding Torrefaction. Waste Biomass Valorization 2019, 11, 2721–2733. [Google Scholar] [CrossRef]
  12. Zhang, B.; Gao, Y.; Zhang, L.; Zhou, Y. The plant cell wall: Biosynthesis, construction, and functions. J. Integr. Plant Biol. 2021, 63, 251–272. [Google Scholar] [CrossRef] [PubMed]
  13. Wang, Y.; Fan, C.; Hu, H.; Li, Y.; Sun, D.; Wang, Y.; Peng, L. Genetic modification of plant cell walls to enhance biomass yield and biofuel production in bioenergy crops. Biotechnol. Adv. 2016, 34, 997–1017. [Google Scholar] [CrossRef] [PubMed]
  14. Mordor Intelligence. Available online: https://www.mordorintelligence.com/industry-reports/pectin-market (accessed on 17 February 2025).
  15. Gerschenson, L.N.; Fissore, E.N.; Rojas, A.M.; Encalada, A.M.I.; Zukowski, E.F.; Coelho, R.A.H. Pectins obtained by ultrasound from agroindustrial by-products. Food Hydrocoll. 2021, 118, 106–799. [Google Scholar] [CrossRef]
  16. Chemat, F.; Rombaut, N.; Meullemiestre, A.; Turk, M.; Perino, S.; Fabiano-Tixier, A.-S.; Abert-Vian, M. Review of Green Food Processing techniques. Preservation, transformation, and extraction. Innov. Food Sci. Emerg. Technol. 2017, 41, 357–376. [Google Scholar] [CrossRef]
  17. Kumar, K.; Shivmurti, S.; Sharanagat, V.S. Ultrasound assisted extraction (UAE) of bioactive compounds from fruit and vegetable processing by-products: A review. Ultrason. Sonochem. 2021, 70, 105325. [Google Scholar] [CrossRef]
  18. Peets, P.; Leito, I.; Pelt, J.; Vahur, S. Identification and classification of textile fibres using ATR-FT-IR spectroscopy with chemometric methods. Spectrochim. Acta Part A Mol. Biomol. Spectrosc. 2017, 173, 175–181. [Google Scholar] [CrossRef]
  19. Özgenç, Ö.; Durmaz, S.; Boyaci, I.H.; Eksi-Kocak, H. Determination of chemical changes in heat-treated wood using ATR-FTIR and FT Raman spectrometry. Spectrochim. Acta Part A Mol. Biomol. Spectrosc. 2017, 171, 395–400. [Google Scholar] [CrossRef]
  20. Parhizkar, E.; Ghazali, M.; Ahmadi, F.; Sakhteman, A. PLS-LS-SVM based modeling of ATR-IR as a robust method in detection and qualification of alprazolam. Spectrochim. Acta Part A Mol. Biomol. Spectrosc. 2017, 173, 87–92. [Google Scholar] [CrossRef]
  21. Liu, X.; Renard, C.M.; Bureau, S.; Le Bourvellec, C. Revisiting the contribution of ATR-FTIR spectroscopy to characterize plant cell wall polysaccharides. Carbohydr. Polym. 2021, 262, 117935. [Google Scholar] [CrossRef]
  22. Santos, E.E.; Amaro, R.C.; Bustamante, C.C.C.; Guerra, M.H.A.; Soares, L.C.; Froes, R.E.S. Extraction of pectin from agroindustrial residue with an ecofriendly solvent: Use of FTIR and chemometrics to differentiate pectins according to degree of methyl esterification. Food Hydrocoll. 2020, 107, 105921. [Google Scholar] [CrossRef]
  23. Pereira, P.H.F.; Oliveira TÍ, S.; Rosa, M.F.; Cavalcante, F.L.; Moates, G.K.; Wellner, N.; Waldron, K.W.; Azeredo, H.M. Pectin extraction from pomegranate peels with citric acid. Int. J. Biol. Macromol. 2016, 88, 373–379. [Google Scholar] [CrossRef] [PubMed]
  24. Manrique, G.D.; Lajolo, F.M. FT-IR spectroscopy as a tool for measuring degree of methyl esterification in pectins isolated from ripening papaya fruit. Posthasrvest Biol. Technol. 2002, 25, 99–107. [Google Scholar] [CrossRef]
  25. Hua, X.; Wang, K.; Yang, R.; Kang, J.; Zhang, J. Rheological properties of natural low-methoxyl pectin extracted from sunflower head. Food Hydrocoll. 2015, 44, 122–128. [Google Scholar] [CrossRef]
  26. Löfgren, C.; Guillotin, S.; Hermansson, A.M. Microstructure and kinetic rheological behavior of amidated and nonamidated LM pectin gels. Biomacromolecules 2006, 7, 114–121. [Google Scholar] [CrossRef]
  27. Racape, E.; Thibault, J. Properties of amidated pectin II. Polyelectrolyte behavior and calcium binding of amidated pectins and amidated pectic acids. Biopolymers 1989, 28, 1435–1448. [Google Scholar] [CrossRef]
  28. Selvaraju, G.; Bakar, N.K.A. Production of a new industrially viable green-activated carbon from Artocarpus integer fruit processing waste and evaluation of its chemical, morphological and adsorption properties. J. Clean. Prod. 2017, 141, 989–999. [Google Scholar] [CrossRef]
  29. Li, S.; Su, S.; Liu, S.; Yang, C.; Lu, Q. Fast pyrolysis of biomass in free-fall reactor for hydrogen-rich gas. Fuel Process. Technol. 2004, 85, 1201–1211. [Google Scholar] [CrossRef]
  30. Zouambia, Y.; Ettoumi, K.Y.; Krea, M.; Moulai-Mostefa, N. A new approach for pectin extraction: Electromagnetic induction heating. Arab. J. Chem. 2014, 10, 480–487. [Google Scholar] [CrossRef]
  31. Valladares-Diestra, K.K.; Porto, L.; Soccol, C.R. A biorefinery approach for pectin extraction and second-generation bioethanol production from cocoa pod husk. Bioresour. Technol. 2021, 346, 126635. [Google Scholar] [CrossRef]
  32. Sobamiwa, O.; Longe, O.G. Utilization of cocoa-pod pericarp fractions in broiler chick diets. Anim. Feed. Sci. Technol. 1994, 47, 237–244. [Google Scholar] [CrossRef]
  33. Grillo, G.; Boffa, L.; Binello, A.; Mantegna, S.; Cravotto, G.; Chemat, F.; Dizhbite, T.; Lauberte, L.; Telysheva, G. Cocoa bean shell waste valorisation; extraction from lab to pilot-scale cavitational reactors. Food Res. Int. 2019, 115, 200–208. [Google Scholar] [CrossRef] [PubMed]
  34. Mansur, D.; Tago, T.; Masuda, T.; Abimanyu, H. Conversion of cacao pod husks by pyrolysis and catalytic reaction to produce useful chemicals. Biomass Bioenergy 2014, 66, 275–285. [Google Scholar] [CrossRef]
  35. Ofori-Boateng, C.; Lee, K.T. The potential of using cocoa pod husks as green solid base catalysts for the transesterification of soybean oil into biodiesel: Effects of biodiesel on engine performance. Chem. Eng. J. 2013, 220, 395–401. [Google Scholar] [CrossRef]
  36. Awasthi, M.K.; Sindhu, R.; Sirohi, R.; Kumar, V.; Ahluwalia, V.; Binod, P.; Juneja, A.; Kumar, D.; Yan, B.; Sarsaiya, S.; et al. Agricultural waste biorefinery development towards circular bioeconomy. Renew. Sustain. Energy Rev. 2022, 158, 112–122. [Google Scholar] [CrossRef]
  37. Gavahian, M.; Mathad, G.N.; Pandiselvam, R.; Lin, J.; Sun, D.-W. Emerging technologies to obtain pectin from food processing by-products: A strategy for enhancing resource efficiency. Trends Food Sci. Technol. 2021, 115, 42–54. [Google Scholar] [CrossRef]
  38. Alavijeh, R.S.; Shahvandi, A.; Okoro, O.V.; Denayer, J.F.M.; Karimi, K. Biorefining of corn stover for efficient production of bioethanol, biodiesel, biomethane, and value-added byproducts. Energy Convers. Manag. 2023, 283, 116877. [Google Scholar] [CrossRef]
  39. Supanchaiyamat, N.; Jetsrisuparb, K.; Knijnenburg, J.T.; Tsang, D.C.; Hunt, A.J. Lignin materials for adsorption: Current trend, perspectives and opportunities. Bioresour. Technol. 2019, 272, 570–581. [Google Scholar] [CrossRef]
  40. Rath, S.; Pradhan, D.; Du, H.; Mohapatra, S.; Thatoi, H. Transforming lignin into value-added products: Perspectives on lignin chemistry, lignin-based biocomposites, and pathways for augmenting ligninolytic enzyme production. Adv. Compos. Hybrid Mater. 2024, 7, 27. [Google Scholar] [CrossRef]
  41. Huang, C.; Peng, Z.; Li, J.; Li, X.; Jiang, X.; Dong, Y. Unlocking the role of lignin for preparing the lignin-based wood adhesive: A review. Ind. Crops Prod. 2022, 187, 115388. [Google Scholar] [CrossRef]
  42. Lu, F.; Rodriguez-Garcia, J.; Van Damme, I.; Westwood, N.J.; Shaw, L.; Robinson, J.S.; Warren, G.; Chatzifragkou, A.; Mason, S.M.; Gomez, L.; et al. Valorisation strategies for cocoa pod husk and its fractions. Curr. Opin. Green Sustain. Chem. 2018, 14, 80–88. [Google Scholar] [CrossRef]
  43. Reszczyńska, E.; Hanaka, A. Lipids Composition in Plant Membranes. Cell Biochem. Biophys. 2020, 78, 401–414. [Google Scholar] [CrossRef] [PubMed]
  44. Mund, N.K.; Dash, D.; Mishra, P.; Nayak, N.R. Cellulose solvent–based pretreatment and enzymatic hydrolysis of pineapple leaf waste biomass for efficient release of glucose towards biofuel production. Biomass Convers. Biorefin. 2021, 12, 4117–4126. [Google Scholar] [CrossRef]
  45. Jacob, E.M.; Borah, A.; Jindal, A.; Pillai, S.C.; Yamamoto, Y.; Maekawa, T.; Nair, D. Synthesis and characterization of citrus-derived pectin nanoparticles based on their degree of esterification. J. Mater. Res. 2020, 35, 1514–1522. [Google Scholar] [CrossRef]
  46. Kumar, A.; Sharma, G.; Naushad, M.; Ala’a, H.; García-Peñas, A.; Mola, G.T.; Si, C.; Stadler, F.J. Bio-inspired and biomaterials-based hybrid photocatalysts for environmental detoxification: A review. Chem. Eng. J. 2020, 382, 122937. [Google Scholar] [CrossRef]
  47. Saffe, A.; Fernández, A.; Mazza, G.; Rodriguez, R. Prediction of regional agro-industrial wastes characteristicas by thermogravimetic analysis to obtain bioenergy using thermal process. Energy Explor. Exploit. 2019, 37, 544–557. [Google Scholar] [CrossRef]
  48. Milian-Luperón, L.; Hernández-Rodríguez, M.; Falcón-Hernández, J.; Otero-Calvis, A. Obtainin bioproducts slow pyrolysis of coffee and cocoa husks as suitable candidates for beins used as soil amendment and source of energy. Rev. Colomb. Quim. 2020, 49, 23–29. [Google Scholar] [CrossRef]
  49. Halder, P.; Kundu, S.; Patel, S.; Parthasarathy, R.; Pramanik, B.; Paz-Ferreiro, J.; Shah, K. TGA-FTIR study on the slow pyrolysis of lignin and cellulose-rich fractions derived from imidazolium-based ionic liquid pre-treatment of sugarcane straw. Energy Convers. Manag. 2019, 200, 112067. [Google Scholar] [CrossRef]
  50. Sohni, S.; Norulaini, N.A.N.; Hashim, R.; Khan, S.B.; Fadhullah, W.; Omar, A.K.M. Physicochemical characterization of Malaysian crop and agro-industrial biomass residues as renewable energy resources. Ind. Crops Prod. 2017, 111, 642–650. [Google Scholar] [CrossRef]
  51. Fernandez, A.; Saffe, A.; Pereyra, R.; Mazza, G.; Rodriguez, R. Kinetic study of regional agro-industrial wastes pyrolysis using non-isothermal TGA analysis. Appl. Therm. Eng. 2016, 106, 1157–1164. [Google Scholar] [CrossRef]
  52. Fernandez, A.; Palacios, C.; Echegaray, M.; Mazza, G.; Rodriguez, R. Pyrolysis and Combustion of Regional Agro-Industrial Wastes: Thermal Behavior and Kinetic Parameters Comparison. Combust. Sci. Technol. 2017, 190, 114–135. [Google Scholar] [CrossRef]
  53. Sangaré, D.; Bostyn, S.; Moscosa-Santillan, M.; Belandria, V.; García-Alamilla, P.; González-Chávez, M.M.; Gökalp, I. Hydrothermal carbonization of cocoa shell: Hydrochar characterization, kinetic triplets, and thermodynamic aspects of the process. Biomass Conv. Bioref. 2024, 14, 93–108. [Google Scholar] [CrossRef]
  54. Zhu, J.; Wang, H.; Guo, F.; Salmén, L.; Yu, Y. Cell wall polymer distribution in bamboo visualized with in situ imaging FTIR. Carbohydr. Polym. 2021, 274, 118653. [Google Scholar] [CrossRef] [PubMed]
  55. Canteri, M.H.; Renard, C.M.; Le Bourvellec, C.; Bureau, S. ATR-FTIR spectroscopy to determine cell wall composition: Application on a large diversity of fruits and vegetables. Carbohydr. Polym. 2019, 212, 186–196. [Google Scholar] [CrossRef] [PubMed]
  56. Talari, A.C.S.; Martinez, M.A.G.; Movasaghi, Z.; Rehman, S.; Rehman, I.U. Advances in Fourier transform infrared (FTIR) spectroscopy of biological tissues. Appl. Spectrosc. Rev. 2016, 52, 456–506. [Google Scholar] [CrossRef]
  57. Abidi, N.; Cabrales, L.; Haigler, C.H. Changes in the cell wall and cellulose content of developing cotton fibers investigated by FTIR spectroscopy. Carbohydr. Polym. 2013, 100, 9–16. [Google Scholar] [CrossRef]
  58. McCann, M.C.; Hammouri, M.; Wilson, R.; Belton, P.; Roberts, K. Fourier Transform Infrared Microspectroscopy Is a New Way to Look at Plant Cell Walls. Plant Physiol. 1992, 100, 1940–1947. [Google Scholar] [CrossRef]
  59. Szymanska-Chargot, M.; Chylinska, M.; Kruk, B.; Zdunek, A. Combining FT-IR spectroscopy and multivariate analysis for qualitative and quantitative analysis of the cell wall composition changes during apple development. Carbohydr. Polym. 2015, 115, 93–103. [Google Scholar] [CrossRef]
  60. Szymanska-Chargot, M.; Zdunek, A. Use of FT-IR Spectra and PCA to the Bulk Characterization of Cell Wall Residues of Fruits and Vegetables Along a Fraction Process. Food Biophys. 2012, 8, 29–42. [Google Scholar] [CrossRef]
  61. Coimbra, M.A.; Barros, A.; Barros, M.; Rutledge, D.N.; Delgadillo, I. Multivariate analysis of uronic acid and neutral sugars in whole pectic samples by FT-IR spectroscopy. Carbohydr. Polym. 1998, 37, 241–248. [Google Scholar] [CrossRef]
  62. Kelly, B.; Pearce, E.L. Amino Assets: How Amino Acids Support Immunity. Cell Metab. 2020, 32, 154–175. [Google Scholar] [CrossRef] [PubMed]
  63. Chandel, V.; Biswas, D.; Roy, S.; Vaidya, D.; Verma, A.; Gupta, A. Current Advancements in Pectin: Extraction, Properties and Multifunctional Applications. Foods 2022, 11, 2683. [Google Scholar] [CrossRef] [PubMed]
  64. Nadar, C.G.; Arora, A.; Shastri, Y. Sustainabiliy Challenges and Opportunities in Pectin Extraction from Fruit Waste. ACS Eng. 2022, 2, 61–74. [Google Scholar] [CrossRef]
  65. Urias-Orona, V.; Rascón-Chu, A.; Lizardi-Mendoza, J.; Carvajal-Millán, E.; Gardea, A.A.; Ramírez-Wong, B. A Novel Pectin Material: Extraction, Characterization and Gelling Properties. Int. J. Mol. Sci. 2010, 11, 3686–3695. [Google Scholar] [CrossRef]
  66. Baum, A.; Dominiak, M.; Vidal-Melgosa, S.; Willats, W.G.; Søndergaard, K.M.; Hansen, P.W.; Meyer, A.S.; Mikkelsen, J.D. Prediction of Pectin Yield and Quality by FTIR and Carbohydrate Microarray Analysis. Food Bioprocess Technol. 2017, 10, 143–154. [Google Scholar] [CrossRef]
  67. Sayah, M.Y.; Chabir, R.; Benyahia, H.; Rodi Kandri, Y.; Ouazzani Chahdi, F.; Touzani, H.; Errachidi, F. Yield, Esterification Degree and Molecular Weight Evaluation of Pectins Isolated from Orange and Grapefruit Peels under Different Conditions. PLoS ONE 2016, 11, e0161751. [Google Scholar] [CrossRef]
  68. Roman-Benn, A.; Contador, C.A.; Li, M.-W.; Lam, H.-M.; Ah-Hen, K.; Ulloa, P.E.; Ravanal, M.C. Pectin: An overview of sources, extraction and applications in food products, biomedical, pharmaceutical and environmental issues. Food Chem. Adv. 2023, 2, 100192. [Google Scholar] [CrossRef]
  69. Ni, Y.; Yates, K.M.; Zarzycki, R. High Molecular Weight, Low Methodyl Pectins, and Their Production and Uses. U.S. Patent No. 2003/0220485, 27 November 2023. [Google Scholar]
  70. Ghoshal, G.; Negi, P. Isolation of pectin from kinnow peels and its characterization. Food Bioprod. Process. 2020, 124, 342–353. [Google Scholar] [CrossRef]
  71. Kpodo, F.M.; Agbenorhevi, J.K.; Alba, K.; Bingham, R.; Oduro, I.N.; Morris, G.; Kontogiorgos, V. Pectin isolation and characterization from six okra genotypes. Food Hydrocoll. 2017, 72, 323–330. [Google Scholar] [CrossRef]
  72. Monsoor, M.A.; Kalapathy, U.; Proctor, A. Determination of polygalacturonic acid content in pectin extracts by diffuse reflectance Fourier transform infrared spectroscopy. Food Chem. 2001, 74, 233–238. [Google Scholar] [CrossRef]
  73. Gnanasambandam, R.; Proctor, A. Determination of pectin degree of esterification by diffuse reflectance Fourier transform infrared spectroscopy. Food Chem. 2000, 68, 327–332. [Google Scholar] [CrossRef]
  74. Fellah, A.; Anjukandi, P.; Waterland, M.R.; Williams, M.A. Determining the degree of methylesterification of pectin by ATR/FT-IR: Methodology optimisation and comparison with theoretical calculations. Carbohydr. Polym. 2009, 78, 847–853. [Google Scholar] [CrossRef]
  75. Yang, Y.-C.; Wei, M.-C.; Hong, S.-J.; Huang, T.-C.; Lee, S.-Z. Development/optimization of a green procedure with ultrasound-assisted improved supercritical carbon dioxide to produce extracts enriched in oleanolic acid and ursolic acid from Scutellaria barbata D. Don. Ind. Crops Prod. 2013, 49, 542–553. [Google Scholar] [CrossRef]
  76. Olsson, A.-M.; Salmén, L. The association of water to cellulose and hemicellulose in paper examined by FTIR spectroscopy. Carbohydr. Res. 2004, 339, 813–818. [Google Scholar] [CrossRef]
Figure 1. TG and DTG curves of CCP.
Chemengineering 09 00025 g001
Figure 2. FT−IR spectrum of CCP and after extraction of extractable (CCPE), hemicellulose (CCPH), and lignin (CCPL).
Chemengineering 09 00025 g002
Figure 3. FT−IR spectrum of commercial pectin (CP) and extracted pectin using sulfuric acid (PSApH) at different pH (2, 3, and 4) and citric acid (PCApH) at different pH (2, 3, and 4) in the range of 4000 to 2500 cm−1 (A,B) and 1800 to 500 cm−1 (C,D).
Chemengineering 09 00025 g003
Figure 4. FT−IR spectrum of residual CCP after pectin extraction with sulfuric acid RSApH (2, 3, and 4), citric acid (PCApH) at different pH (2, 3, and 4), and fresh CCP in the range of 4000 to 2500 cm−1 (A,B) and 1750 to 500 cm−1 (C,D).
Chemengineering 09 00025 g004
Table 1. Physicochemical characteristics of raw CCP.
PropertyContent (wt.%)
Extractable13.4 ± 0.5
Hemicellulose48 ± 8
Lignin19 ± 10
Cellulose20 ± 1
Protein5.3 ± 0.2
Fat7.3 ± 0.1
Fiber23 ± 1
Moisture9.2 ± 0.0
Ash (%)8.0 ± 0.1
Carbohydrate46.9 ± 0.0
Table 2. The contents of pectin, degree of esterification, and methoxylation in CCP using sulfuric and citric acid at different pH.
Sulfuric AcidCitric Acid
pHPectin (%) *DE (%)MeO (%)Pectin (%) *DE (%)MeO (%)
22.6 ± 0.218 ± 4.27 a3.0 ± 0.7 a2.5 ± 0.27.4 ± 0.3 b1.12 ± 0.04 b
32.4 ± 0.212.8 ± 0.6 ab2.1 ± 0.1 ab2.3 ± 0.312.5 ± 0.6 ab1.9 ± 0.1 a
42.5 ± 0.79 ± 3 b1.5 ± 0.5 a2.3 ± 0.26.9 ± 0.5 b1.13 ± 0.08 b
The results with the same letter in a column are not statistically significantly different (p ≤ 0.05) as determined by the Tukey test. * Not significant.
Disclaimer/Publisher’s Note: The statements, opinions and data contained in all publications are solely those of the individual author(s) and contributor(s) and not of MDPI and/or the editor(s). MDPI and/or the editor(s) disclaim responsibility for any injury to people or property resulting from any ideas, methods, instructions or products referred to in the content.

