Article

Operative Improvement in the Naphtha Catalytic Reforming Process to Reduce the Environmental Impact of Benzene Fugitive Emissions from Gasoline

by
Fabiola Velázquez-Alonso
1,2,
César Abelardo González-Ramírez
2,*,
José Roberto Villagómez-Ibarra
2,
Elena María Otazo-Sánchez
2,
Martín Hernández-Juárez
2,
Fernando Pérez-Villaseñor
3,*,
Ángel Castro-Agüero
3,
Laura Olivia Alemán-Vázquez
4,
César Camacho-López
2 and
Claudia Romo-Gómez
2
1
Departamento de Ingeniería Química y Bioquímica, Tecnológico Nacional de México/Instituto Tecnológico de Pachuca, Carretera México-Pachuca Km. 87.5, Colonia Venta Prieta, Pachuca 42080, Hidalgo, Mexico
2
Área Académica de Química, Instituto de Ciencias Básicas e Ingeniería, Universidad Autónoma del Estado de Hidalgo, Ciudad del Conocimiento, Carretera Pachuca-Tulancingo, Km. 4.5, Colonia Carboneras, Mineral de la Reforma 42184, Hidalgo, Mexico
3
Facultad de Ciencias Básicas, Ingeniería y Tecnología, Universidad Autónoma de Tlaxcala, Carretera Apizaquito S/N, San Luis Apizaquito, Apizaco 90401, Tlaxcala, Mexico
4
Instituto Mexicano del Petróleo, Eje Central Lázaro Cárdenas Norte 152, Colonia San Bartolo Atepehuacán, Alcaldía Gustavo A. Madero, Ciudad de México 07730, Mexico
*
Authors to whom correspondence should be addressed.
ChemEngineering 2025, 9(2), 21; https://doi.org/10.3390/chemengineering9020021
Submission received: 15 November 2024 / Revised: 20 January 2025 / Accepted: 11 February 2025 / Published: 21 February 2025

Abstract

:
A challenge for the oil refinement industry is the production of high-octane gasoline with a low benzene content. This work reports the calculation of the atmospheric benzene emissions generated from gasoline storage, transfer, and transport operations in Mexico, estimating 1.48 KBPD of environmental release. The aim was to estimate the minimum benzene emissions through operative improvements in refineries, initially by performing simulations of the Naphtha Catalytic Reforming (NCR) process using ASPEN HYSYS® ver. 8.8 (34.0.08909) and then by optimizing the operative conditions to improve the reformate quality while reducing the benzene content. The operative ranges comprised hydrogen/hydrocarbon (H2/HC) feedstock molar ratios from 2.0 to 6.0 and reaction temperatures from 450 to 525 °C, which were used as independent variables to assess the benzene content and the Research Octane Number (RON) of the produced gasoline. The Surface Response Method (SRM) and multi-objective optimization analysis were applied. The improved operative conditions were 491 °C and a H2/HC ratio of 2.0, which allowed us to obtain a RON value of 89.87, an aromatics value of 37.39% (v/v), and a benzene value of 1.48% (v/v), with an estimated 16.44% drop in atmospheric benzene emissions, meaning a reduction in greenhouse gas emissions and climate change, thus favorably impacting public health by improving refinery operations. The simulation outcomes were compared with industrial-scale data and the experimental results, with significant similitudes being observed.

Graphical Abstract

1. Introduction

The global demand for oil-derived fuels is a cause of climate change. This has become a global problem due to the atmospheric emissions generated either by the oil refining processes or during the use of fossil fuels as an energy source for transportation [1], triggering negative environmental and public health impacts, especially within metropolitan areas, in which there is a high concentration of vehicles.
Volatile emissions from gasoline stations, fugitive vapors from vehicles, and industrial releases associated with refineries are considered as the main benzene exposition sources, including benzene fugitive emissions from loading/unloading activities at gasoline bay installations. People living near refineries, petrochemical plants, hazardous waste disposal sites, or gasoline stations may be exposed to certain concentration levels of benzene through food, beverages, and drinking water. However, the levels may not be as high as the exposition levels from atmospheric sources [2].
A previous study [3] described the factors that influence the emission of volatile organic compounds (VOCs) using a sample of 15 vehicles in China, considering aspects such as the fuel type and driving conditions. It was found that ethanol-based gasoline helped to reduce VOCs by 16.8%, and the researchers concluded that future government policies should address the atmospheric pollution generated by VOCs and should formulate more specific strategies for reducing air pollution.
On the other hand, a previous report [4] established that benzene emissions contribute significantly to the total amount of atmospheric pollutants and are difficult to punctually quantify. Therefore, an analysis of 120 scenarios was performed using simulation results from a computational fluid dynamics (CFD) model to compare measurements of the atmospheric dispersion of pollutants emitted from 14 refinery installations in Texas, USA.
VOC emissions, generated from industrial complexes, depend on the type of industry and processed materials, producing gas mixtures that contain highly toxic compounds. Hence, some research projects are focused on characterizing the types of emissions and assessing both, toxicity and carcinogenicity levels. For example, one research used an equivalence factor between carcinogenicity and benzene atmospheric levels in the study of the emissions from a petrochemical industrial park in Taiwan, revealing the need to set efficient control strategies for the emission of carcinogenic VOCs such as benzene, since the exposure risks, caused by these pollutants, arise from the generating sources [5].

1.1. NCR and Low-Benzene Gasoline Production

The growing need to reduce the emissions generated by vehicles has led to control the presence of benzene-derived compounds in fuels. The future rise in greenhouse gas (GG) emissions, from the energy sector, has been estimated between 20 and 30% by the year 2040; then motivating new regulations specifying the properties and characteristics of oil-derived products [6].
VOCs such as benzene, toluene, and xylene (BTX) are considered as environmental and public health problems, because of their exposition risks and, for that reason, international organizations have established standard non-hazardous limits. However, detecting constant exposition either within or little below these limits may also have negative consequences on public health [7].
Since 85% of total benzene emissions are attributed to fuel use in Mexico, there is a need to improve gasoline quality. The demands of Mexican standards must be fulfilled while emphasizing that the maximum concentration of benzene is 1% (v/v), for the metropolitan zones of Mexico City, Monterrey, and Guadalajara, and 2% (v/v) for the rest of the country; considering the high volatility of benzene, which evaporates into the atmosphere and affects the population’s health [8].
In order to fulfill the national standard, Mexican refineries need to improve their current processes to increase the quality of fuels [9]; this could include the production of reformulated low-benzene gasolines with a high octane number, which is assumed as a main challenge for this industry [10].
The production of gasoline with a high octane number and high concentration of aromatic compounds, such as BTX, is one of the main objectives of the NCR process [11]; in this, complex chemical reactions occur on a bimetallic catalyst of Pt-Re/Al2O3. One example of these reactions is the dehydrogenation of alkyl-cyclohexane, which precedes the formation of aromatic compounds such as benzene and its derived compounds. Additional reactions, such as dehydrogenation, are of endothermic nature and occur on Pt catalytic sites at high temperatures [12].
The analysis of the NCR process, focused on the reduction of benzene content of reformed naphtha, may represent an alternative when looking for better operative conditions that may lead to minimize environmental and public health impacts, through the production of high-quality gasoline with a lower content of benzene.
Additional research about the modeling, simulation and optimization of the NCR process [13,14,15,16,17] has focused on operative improvement from a technical point of view, disregarding, in some cases, environmental aspects.
A multiple regression model has been reported to estimate the content of aromatic compounds in high-quality gasoline, with a Research Octane Number (RON) from 94.4 to 98.5, and of standard gasoline, with a RON from 84.7 to 94.4 [18]; this model was related to two physical properties of gasoline, such as the relative density (RD) and the final boiling point (FBP), finding that the estimated content of aromatic compounds was between 17.6 and 36.4% (v/v). This method may also be used to calculate the concentration of benzene, toluene, and xylene in gasoline.
A reduction of pollutant emissions, associated with the logistic transport, handling, and combustion of gasoline, may be achieved by implementing new techniques related to operative optimization, which should be focused on increasing the quality of gasoline. Therefore, operative improvements may also be used to increase the sustainability of the NCR process.
In this work, we develop a method for estimating the reduction of gasoline-associated greenhouse gas emissions, especially those related to VOCs. This approach focuses on the study and implementation of new operative options for controlling the selectivity of the NCR chemical reactions. Finally, it has also been possible to establish a relationship between the technical analysis of an oil refining process and its operative performance, aiming to improve industrial operations. A reduction in pollutant emissions can be reached after setting the optimized conditions, which can be obtained from computational simulation and experiments performed at pilot plant scale.

1.2. Description of the NCR Process

This is a fundamental process used to produce high-octane gasoline; in this, a complex low-sulfur hydrocarbon mixture (hydro-desulfurized naphtha) is fed to the system. The main components of the feedstock are naphthenes, n-paraffins, and aromatic compounds [19]; these chemical compounds can be molecularly restructured using a bimetallic catalyst of platinum and rhenium on alumina (Pt-Re/γ-Al2O3), in order to obtain a reformed naphtha with a higher content of aromatic compounds, and so improving the gasoline octane number [20]. This process involves chemical reactions such as isomerization, cyclization, and aromatization, forming chemical compounds that increase the RON. Simultaneously, other undesired reactions occur, such as coke formation, which poisons the catalyst and causes its deactivation on the metallic phase of the catalyst [21].
NCR units are classified according to the process that is followed for catalyst regeneration; the types of processes are semi-regenerative (SR), continuous catalyst regeneration (CCR), and cyclic regeneration (CR) [22]. Figure 1 represents a general scheme of the CCR process, which is the most recent NCR process; this comprises three to four catalytic reactors, which are installed as a tower with multiple reactors, and is followed by a system for the continuous regeneration of the catalyst. The technological advantage of the CCR system is its configuration, which allows the continuous processing of low-octane naphtha in order to obtain a reformed naphtha with a high RON, between 95 and 108 [23].

1.3. Advancements in Sustainable Fuel Production

Most research about the production of higher quality fuels has focused on meeting more stringent environmental regulations, due to growing concerns about climate change and public health. In this sense, the NCR is one of the most interesting oil refinement processes that has been studied in recent years. The generation of new catalysts is an important research target when aiming to improve the industrial performance to achieve high-octane gasoline with a controlled concentration of aromatics, including benzene, toluene, and xylene [12]. Some innovative catalysts have been proposed, with a reduction in particle size (down to 1–2 nm) and platinum (Pt) dispersion using tin (Sn) being hypothesized to increase the RON to approximately 103, and an aromatics composition of 83 wt.% and a lower need for Pt being hypothesized to reduce its catalytic content down to 30–50% [25]. Furthermore, hydrogen production has also been considered when studying the ability of the NCR process to increase the yield during fuel production [26] and optimize the operative conditions of the NCR without decreasing the RON values of reformed naphtha [27].
Complementary efforts have focused on improving the mathematical modeling of the kinetics of reforming reactions, which is based on simplifying the algorithms of the reaction network used to predict the yield and composition of products, along with temperature distribution [28]; these works have shown that computational tools play an important role when studying the NCR process. Additionally, computational fluid dynamics (CFD) constitutes a useful tool for modelling industrial naphtha reforming reactors, when predicting the catalyst residence time, fluid flow, and catalyst-related erosion of internal reactor pipes and parts [29], confirming the importance of numerical calculations focused on the NCR process.

1.4. Strategies for Benzene Reduction in Gasoline

The environmental constraints applied to the benzene content in gasoline have motivated research about different options for reducing or replacing this chemical compound in final gasoline blends; an option is to consider the possibility of substituting benzene with cyclohexane, which has been analyzed by taking into account the engine performance and total emissions generated by a reformulated fuel, finding that the energetic performance of the cyclohexane reformulated fuel is not significantly better than gasoline and is 3.7% lower than a 15% trimethylbenzene fuel at 2600 rev/min [30]. Other strategies have focused on benzene transformation, with a prior separation of benzene from the reformate, and then transformed into alkylated aromatics, by using zeolites and propylene [31]; this alternative is aligned with current industrial practices. Finally, another option is benzene hydrogenation to produce cyclohexane, by fusing nickel (Ni) catalysts [32]. These examples show that some research works, about reducing the benzene content of gasoline, are process-oriented and propose an increase in the number of separation/reaction process units and plants, along with an increase in the amount and types of catalysts required. Meanwhile, this research suggests an alternative method for analyzing the operative conditions, in order to improve the industrial practices used to produce low-benzene fuels without needing higher capital investments in the process.

1.5. Environmental and Public Health Impacts from Benzene Exposure

Benzene is widely acknowledged as a concerning pollutant of anthropogenic origin and it is mainly associated with transport fuels. For this reason, reducing the benzene content in gasoline is an important strategy for minimizing environmental impacts, with associated benefits to public health [33]. The atmospheric monitoring and measurement of benzene pollution are important, since accurate environmental assessments are necessary for identifying the exposure limits affecting occupational and public health, with the aim of proposing mitigation strategies and new regulations [34]; more specifically, the occupational health risks and human toxicity profiles related to gasoline components, which have been reported in detail [35], illustrating the human mechanisms and metabolisms that are triggered by gasoline exposure and its toxicity.
The oil refinement industry has been related to occupational and environmental benzene exposure; therefore, most efforts to reduce atmospheric emissions address this sector. Among them, the definition of regulatory limits, namely a benzene content under 1% (v/v) in gasoline, is one of the most important measures used to mitigate the environmental impact of this pollutant [36]. Benzene is also a concerning pollutant as one of the VOCs released from the industrial energy sector during the production, processing, transportation and storage of fuels; this has motivated research focused on enhancing our resilience to climate change through low-carbon-energy societies [37].

2. Materials and Methods

2.1. Mass Balance of Benzene Emissions and Scenario Analysis

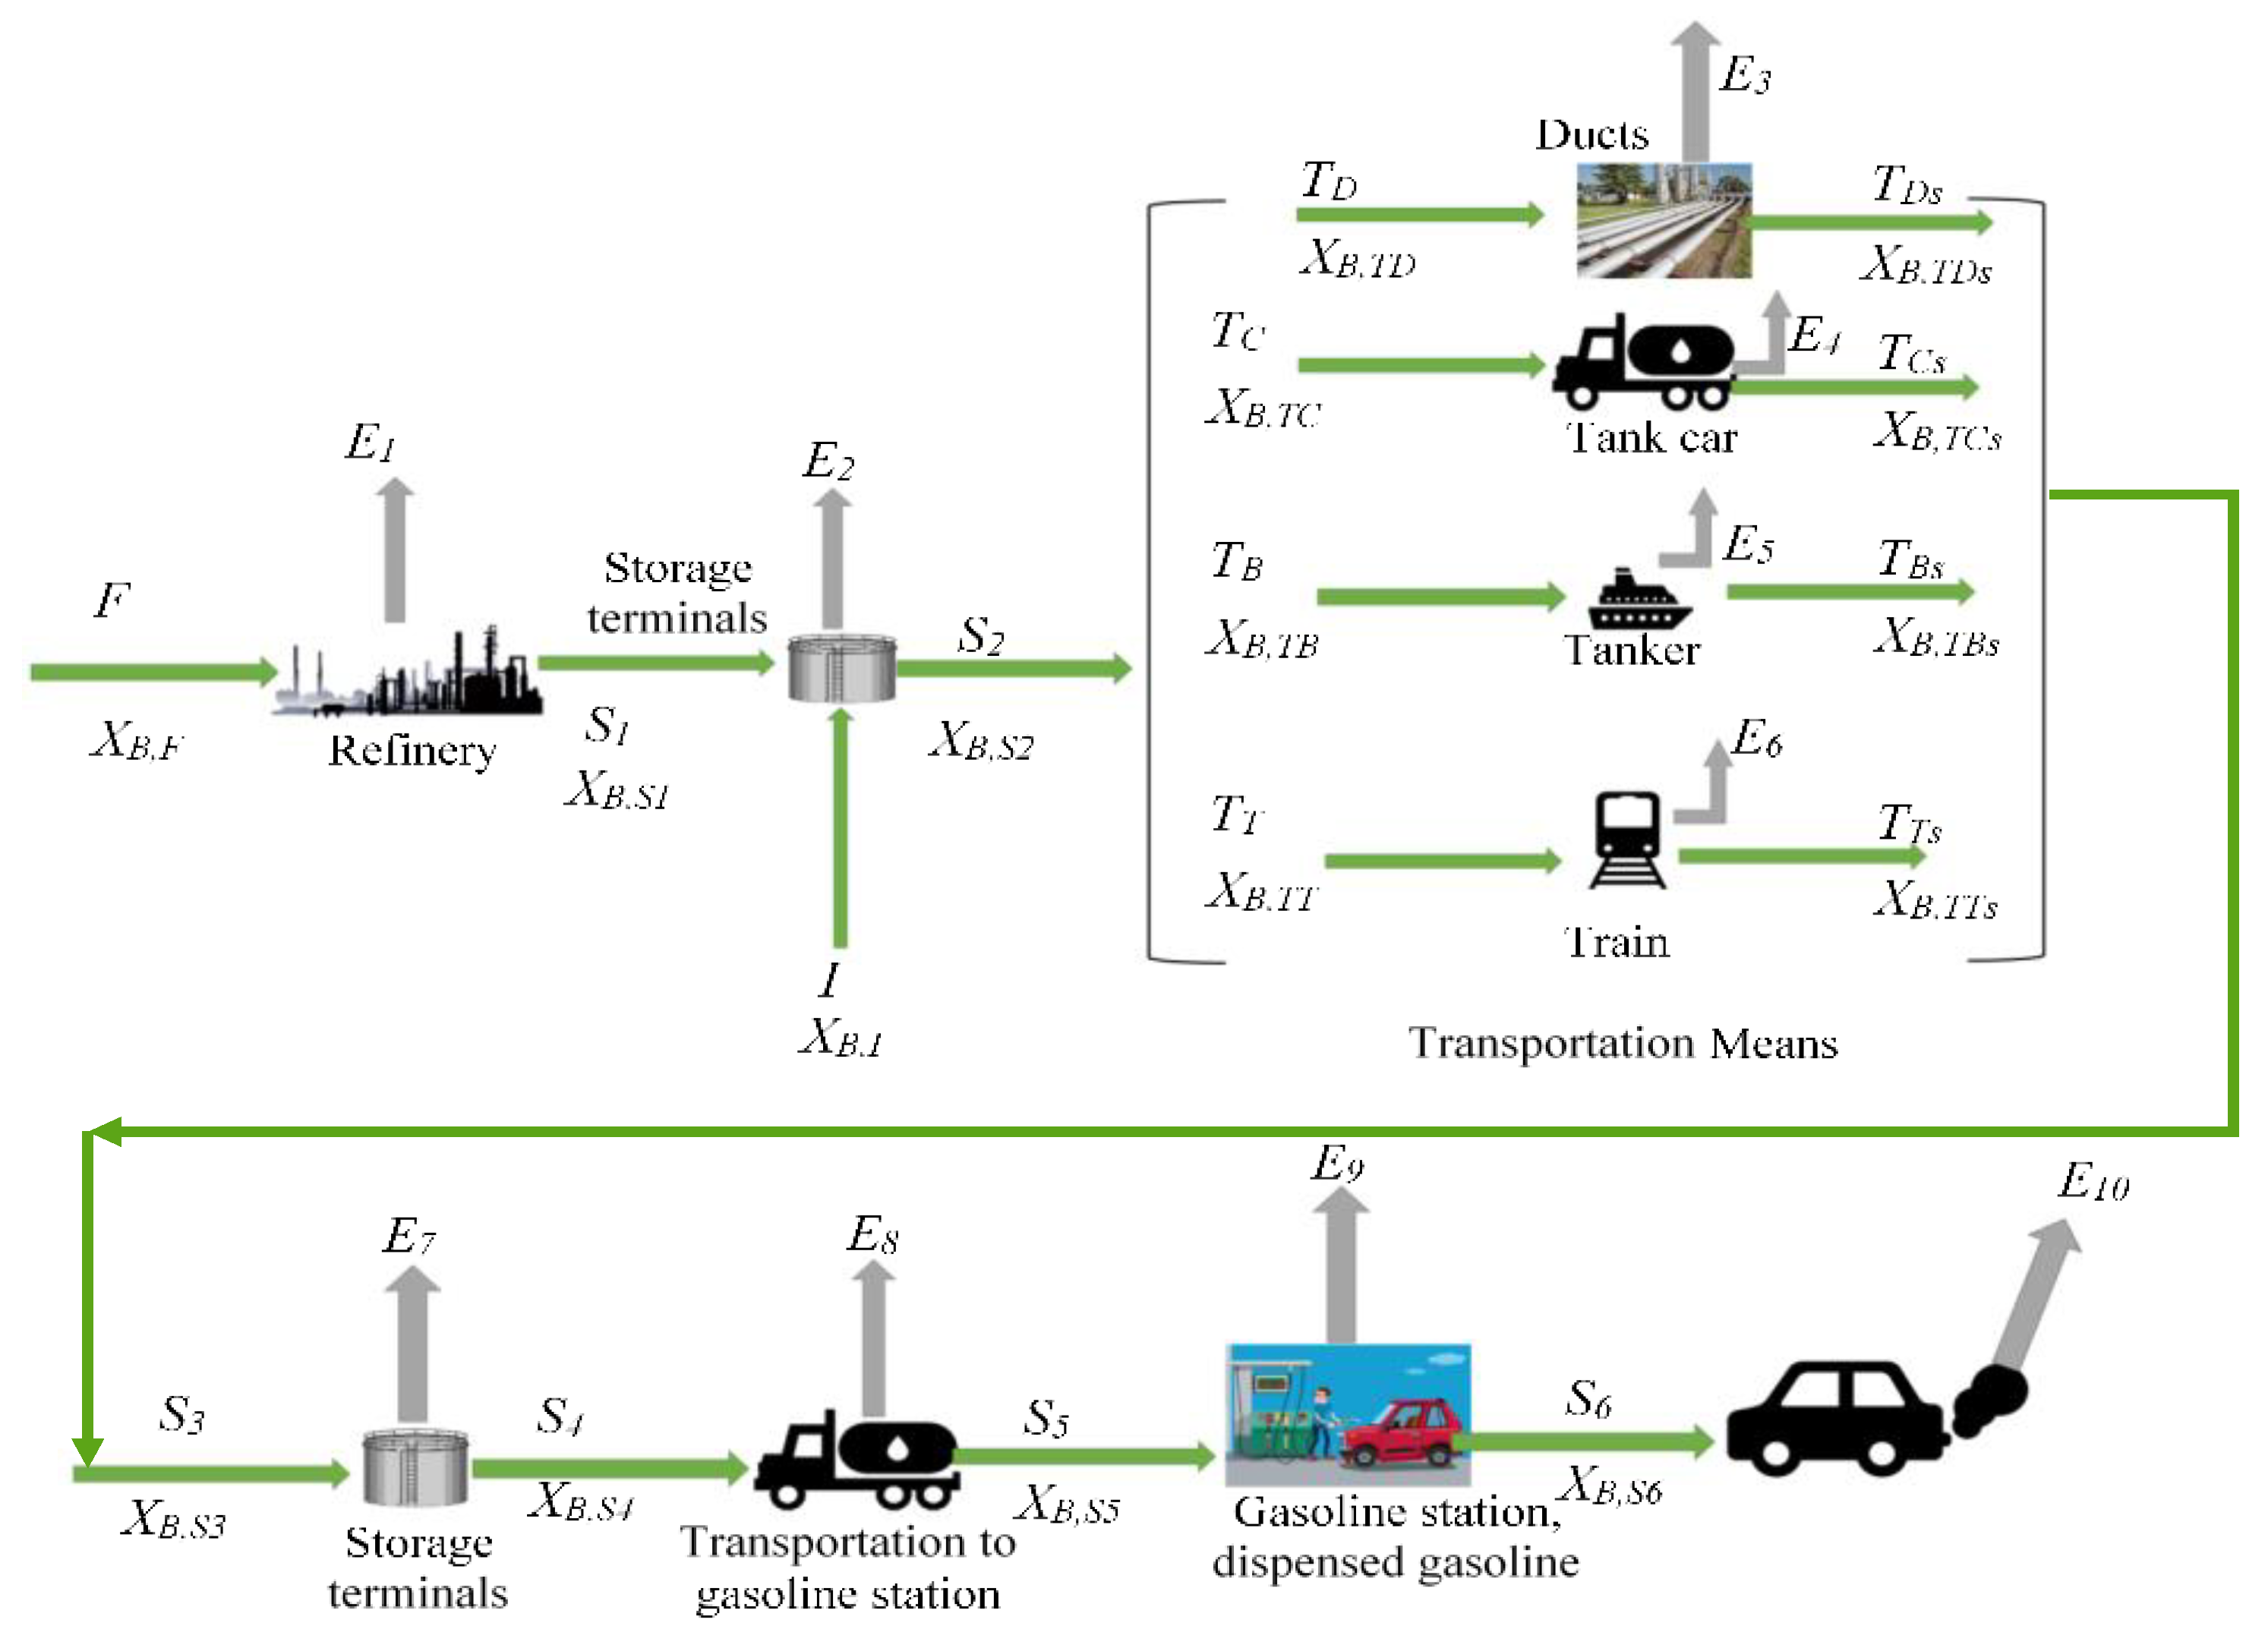
The mass balance calculation of the atmospheric emissions of benzene was performed in Mexico in 2023, when were reported a total refinement capacity of 2040 KBPD of crude oil and an annual average gasoline production of 252.4 KBPD. Additionally, for imported gasoline, the annual average of 419.5 KBPD was reported [38], with a benzene content of approximately 0.75% (v/v). [39]. A conceptual diagram of the mass balance is shown in Figure 2, in which there are 10 identified emission sources of benzene (Ein) that are associated to the refining process, fuel storage and transportation, public sales and dispatch at gasoline stations, also including the emissions generated from vehicles.
Additional data [40] revealed that gasoline logistic transportation in Mexico is carried out using ducts (65%), tank cars (26%), tankers (6%), and rail trains (3%). In this sense, the factor values of fuel evaporative losses during gasoline storage and distribution are reported (see Table 1).
Mass balance equations were established to quantify the total benzene emissions, which may be described as follows: “F” refers to the flowrate of the total gasoline produced in KBPD, “XB,i” is defined as the benzene content, and “Ei” corresponds to the benzene fugitive emission flowrate in KBPD. Additionally, it is assumed that the benzene gasoline content is between 0.75 and 2% (v/v) for processed gasoline in Mexico; this is based on the national standard NOM-016-CRE-2016 [45]. Hence, for evaporative losses during the refining processes, mass balance Equations (1) and (2) are as follows:
F = E 1 + S 1
E 1 = X B , S L / 100
where “L” represents the volumetric percent of evaporative losses.
For evaporative losses at storing terminals, Equation (3) was defined as follows:
E 2 = X B , S 1 + X B , I L / 100
For evaporative losses during distribution, Equation (4) is as follows:
E n = X B , T L / 100
A general expression for estimating benzene fugitive emissions is described by Equation (5):
E n = X B , n L / 100
Equation (6) is used for estimating the total emissions flowrate of evaporative losses, as follows:
T o t a l   e m i s s i o n s = i = 1 n E n
where “n” represents the total number of emission sources.
Figure 2 shows a scheme of the conceptual mass balance of gasoline storage and transportation for estimating the total flowrate of evaporative losses associated with the atmospheric emissions of benzene.
Based on the conceptual mass balance shown in Figure 2 (see Table A1 in Appendix A for a full description of the nomenclature), it was calculated that, for a 2% (v/v) benzene content in gasoline, there was a total benzene content in gasoline of 6.94 KBPD, which would cause 1.48 KBPD of benzene emissions. The results for each source, including the flowrate distribution from the refinery and through the logistic chains, are reported in Table A1 in Appendix A.
A scenario analysis (see Table 2) was carried to estimate that the benzene content reduced to 0.75% (v/v), which is the standard for imported gasoline; would help to reduce benzene emissions by 39.9%, regarding the 2% (v/v) content. This can be done with a higher fuel quality, by optimizing the NCR process.

2.2. Simulation Design

Analyzing the influence of the independent variables, in the NCR process, on the response variables, a sensitivity analysis was performed through comparisons of their main effects on the dependent variables. The independent variables were the reaction temperature (T); the hydrogen/hydrocarbon feedstock molar ratio (H2/HC); the total feedstock flowrate (F); and the operative pressure (P). These operative variables were assessed by analyzing their influence on the dependent variables, which included the octane index (RON) of the reformed naphtha; the content of aromatic compounds [A% (v/v)]; and the content of benzene [B% (v/v)]. Figure 3 shows the results of the sensitivity analysis, revealing that for the simulation and optimization of independent variables, the most influential independent variables are the hydrogen/hydrocarbon feedstock molar ratio (H2/HC) and the reaction temperature (T).
This research simulated the operative conditions using industrial-scale data, which were as follows: a total feedstock flowrate (F) of 120,075 kg/h; a reactor temperature (T) ranging from 457 to 503 °C; a RON of 75.25 from non-reformed naphtha; and a volumetric composition (% v/v) of 39.7% iso-paraffins, 24.8% naphthenes; 22.3% n-paraffins, and 12.9% aromatic compounds. Then, following the experimental design, in silico experiments were carried out using the REFSYS® simulation module from ASPEN HYSYS® ver. 8.8, with license number (34.0.0.8909), considering the most influential independent variables. The experimental design of simulations was based on data reported in Table 3.
Temperature and H2/HC values were within the normal operative ranges of the NCR process, according to industrial data, and in agreement with the achievable experimental conditions at the pilot plant. These ranges consider the catalyst viability during operation, since higher temperatures may cause catalyst poisoning, due to coke formation, and higher H2/HC ratios would displace the kinetic equilibrium of reforming reactions, then reducing selectivity and yield of desired products; conversely, low temperatures would cease the reaction, whereas lower H2/HC ratios would inhibit the catalytic activity.

2.3. Surface Response Method (SRM)

This is a mathematical method used for the experimental design and numerical optimization of the effect from operative variables on response variables. Its complexity increases with the number of variables included in the statistical model; however, multi-objective optimization requires complex statistical models that allow multiple responses to be generated; for example, these types of models have been used with the aim of optimizing the yield from fuel engines, while minimizing atmospheric emissions [46].
Moreover, the SRM can be combined with an experimental strategy and statistical modeling that can help to find optimum operative conditions. Generally, the SRM follows an initial experimental stage, in order to estimate the regions of operativity for the objective values of response variables [47].
Analyses based on the SRM require a multiple regression study that allows the relationship between the process variables (i.e., T and H2/HC) and response variables to be determined [48]. The results of the process simulation have been used to build a multivariate mathematical model for each dependent variable (see Table 4).
The statistical models of the SRM, are polynomic equations used to predict the value of a response variable, as a function of the entry factors [46]; such that, by having a “k” number of factors the general formula of a 1st order model is shown in Equation (7) [47].
Y = β 0 + i = 1 k β i x i + ε
The general formula for a 2nd order model is shown in Equation (8):
Y = β 0 + i = 1 k β i x i + i = 1 k β i i x i 2 + i = 1 k < i = 1 k β i j x i x j + ε
where “Y” is the response variable; “xi” is the independent variable; β 0 is the average of response values; β i , β i i and β i j are the regression coefficients of the statistical model.
Statistical models of each dependent variable are used to study the behavior of the objective response variables, when the independent variables have different values; thus with these results, it is possible to generate response surface plots to identify the objective states that can be applied when calculating an optimum transitional operative route (TOR) [27] that will drive operative changes towards an improved outcome.

2.4. Procedure for Identifying an Optimal TOR

A suitable method for estimating surface response models, that can be applied for defining and assessing TORs, consists of setting the simulation conditions of the CCR process, and then proceeding to generate useful data for calculating multivariate models; once the results from surface response models are obtained, it is possible to identify the TORs from initial conditions (IC) to objective conditions (OC), considering the high octane index and the low benzene content as the main objectives of the NCR process. Operative zones, on surface response plots, are also analyzed by performing an importance assessment for process operation, remarking that the minimization of benzene content may help to reduce atmospheric emissions of VOCs, due to the use of gasoline [27].

2.5. Multi-Objective Optimization

This method starts with a description of the optimization problem, in order to define multi-objective functions and to identify the minimum and maximum objective values for a further selection of the most suitable algorithm [49].
Once the surface graphs, generated by applying the SRM, and contour plots of each dependent variable were obtained, a contour superposition was performed to find a region where the response variables also had optimum ranges.

2.6. Pilot Plant Experiments

Experimental tests were carried out using a NCR pilot plant of the semi-regenerative (SR) process (see Figure 4) with 3 serially connected reactors, which can operate between the following conditions: a pressure of 10 to 190 bar; a temperature of 350 to 550 °C, and a space velocity of 0.5 to 8.0 1/h. Pilot plant experiments were performed as described in the following procedure:
  • Preparing the pilot plant and conditioning, including filling the reactors with the catalyst, cleaning the filters of the separation system, and filling the feed tank with non-reformed naphtha.
  • Checking the pipelines by performing leaking tests using nitrogen and then using hydrogen to detect leaks even with smaller molecules.
  • Catalyst heating up and setting under inert conditions using nitrogen.
  • Pilot plant stabilization under the previously settled experimental conditions, before starting a test.
  • Feeding the system with hydro-desulfurized naphtha.
  • Confirming the mass balance.
  • Starting the heating up of the reactor section.
  • Initiating operation, monitoring, and on/off-line sampling of reformation products.
Since pilot plants operate isothermally, the catalytic particles should be placed at the longitudinal central zone of each reactor; then, the top and bottom of each reactor should be packed with silicon carbide (SiC) as an inert material, also adding glass wool at the reactor inlet and outlet as a diffusion promoter. Each reactor is loaded by placing the catalyst in between the inert material, which helps to achieve naphtha vaporization. The middle zone of each reactor is then filled with a volumetric load of the reformation catalyst to be tested. The total working volume capacities of reactors 1, 2, and 3 are 196 cm3, 302 cm3, and 391 cm3, respectively. This volumetric distribution among the reactors helps to improve the flow patterns by increasing the fluid retention and enabling better control of the residence time. Additionally, silicon carbide helps to reach an isothermal environment within each reactor [27].
The limitations of the pilot plant are mainly related to the lack of a riser system in the Semi-Regenerative (SR) mode of the NCR process, since current industrial facilities have been reconfigured to adopt the Continuous Catalyst Regeneration (CCR) process in most refineries. The main difference consists of the fixed catalytic bed, of the SR mode, and the moving-extended catalytic bed in the CCR system, which enables simultaneous catalyst regeneration during catalytic reforming; conversely, the SR process needs to stop reforming to perform the regeneration of the catalyst. However, if only the catalyst activity is to be assessed and operative conditions such as the pressure, space velocity, temperature and H2/HC ratio are tested, the results from both systems can be compared. The scalability of the pilot plant can be complemented using simulation tools for generating useful data for the industry.

2.7. Analytical Methods for the NCR Products and Byproducts

For the analytical quantification of products and byproducts from the NCR process, the pilot plant includes two on-line gas chromatographers (GC), the first one used for hydrogen analysis (HiSpeed) and the second one used for a detailed hydrocarbon analysis (DHA).

2.7.1. GC for Detailed Hydrocarbons Analysis (DHA)

In order to analyze the composition of the intermediate products of the catalytic reforming, an on-line GC is used for the detailed analysis of hydrocarbons (DHA-GC); this analysis used a GC7890 DHA model from Petroleum Analytical Company®, Houston, TX, USA, Analytical Controls®, Rotterdam, Netherlands, and Agilent Technologies®, Santa Clara, CA, USA, with an automatized liquid sampler supplied with a 5 μL injection syringe, a capillary column made of dimethyl-silicone, and a detection system with a Flame Ionization Detector (FID), which was used to determine each component of the hydrocarbon mixture, following D6729-20, D5134-21, D6730-21, and D6733-01(2020) ASTM methods [27]. The DHA-GC includes the on-line sampler coupled with intermediate sampling pipettes placed in between the reactors and at the outlet of the third reactor [27].
DHA-GC methods are generally used for investigating the individual hydrocarbon components in fuels and fuel mixtures (of a boiling point range up to 225 °C), employing the oxygenated compounds used in spark ignition engines. This method is also comparable with more selective methods, including those looking for olefins and other analytes from different chemical groups of hydrocarbons. Although DHA-GC methods can be used to analyze benzene, toluene, and several oxygenated compounds, it has been possible to perform comparable analyses by applying more detailed analytical methods. As a reference, it has been reported that the ASTM D6729-20 method has also been used to analyze virgin naphtha samples using Argon (Ar) as a carrier gas [50].

2.7.2. Multidimensional GC

A GC system called the Reformulyzer, namely the M4 model from Petroleum Analytical Company®, Analytical Controls®, and Agilent Technologies®, was multidimensionally configurated, with the inclusion of several interconnected GC columns, as defined in [51]. This equipment was used to analyze liquid naphtha samples (at the inlet of the pilot plant) and condensed reformate (produced from the pilot plant); this method is able to analyze the aromatics content, benzene composition and perform a full PIANO (Paraffins, Iso-paraffins, Aromatics, Naphthenes, and Olefins) analysis, with a RON estimated for each sample [27].

2.8. GC Measurement and Estimation of the RON

The RON was measured by indirect analytical methods, such as DHA-GC (for on-line samples) and multidimensional GC (for off-line samples); these values were estimated using chromatographic results, by dividing them among 31 chemical families and assigning each RON contribution as reported in [52]. Then, the average RON was calculated using Equation (9):
R O N = i = 1 i = 31 W i ( R O N g r o u p ) i
where “Wi” is the mass fraction composition of group “i”, and “(RONgroup)i” is the octane index that has been assigned to each contributing family of hydrocarbons.
When operating the process, it is important to perform a preliminary analysis of the hydrotreated naphtha that will be fed to the reformer in every experiment. DHA-GC and multidimensional GC are currently the main techniques applied for indirect RON measurement and estimation.

3. Results

The data obtained from the simulation were used for estimating multivariate quadratic models, like the one shown in Equation (10):
y i = c 0 + c 1 x 1 + c 2 x 2 + c 3 x 1 2 + c 4 x 2 2 + c 5 x 1 x 2
where “yi” is the dependent variable, “x1” represents the temperature (T) in °C, whilst “x2” is the H2/HC molar ratio of the feedstock. Then a set of statistical coefficients was obtained by multivariate regression analysis, thus generating an equation for each dependent variable [RON, A% (v/v) and B% (v/v)] (see Table 5) and the corresponding response surface plots shown in Figure 5.

3.1. Operative Zones and Transitional Operative Routes (TOR)

By applying multivariate mathematical models and the data obtained from them, the operative zones of each objective function were identified and defined within boundary values, which were established as practical constraints, in order to maintain the quality of production:
  • RON values between 87 and 93.
  • Aromatic compound content between 30 and 40% (v/v).
  • Benzene content between 0.75 and 1.5% (v/v).
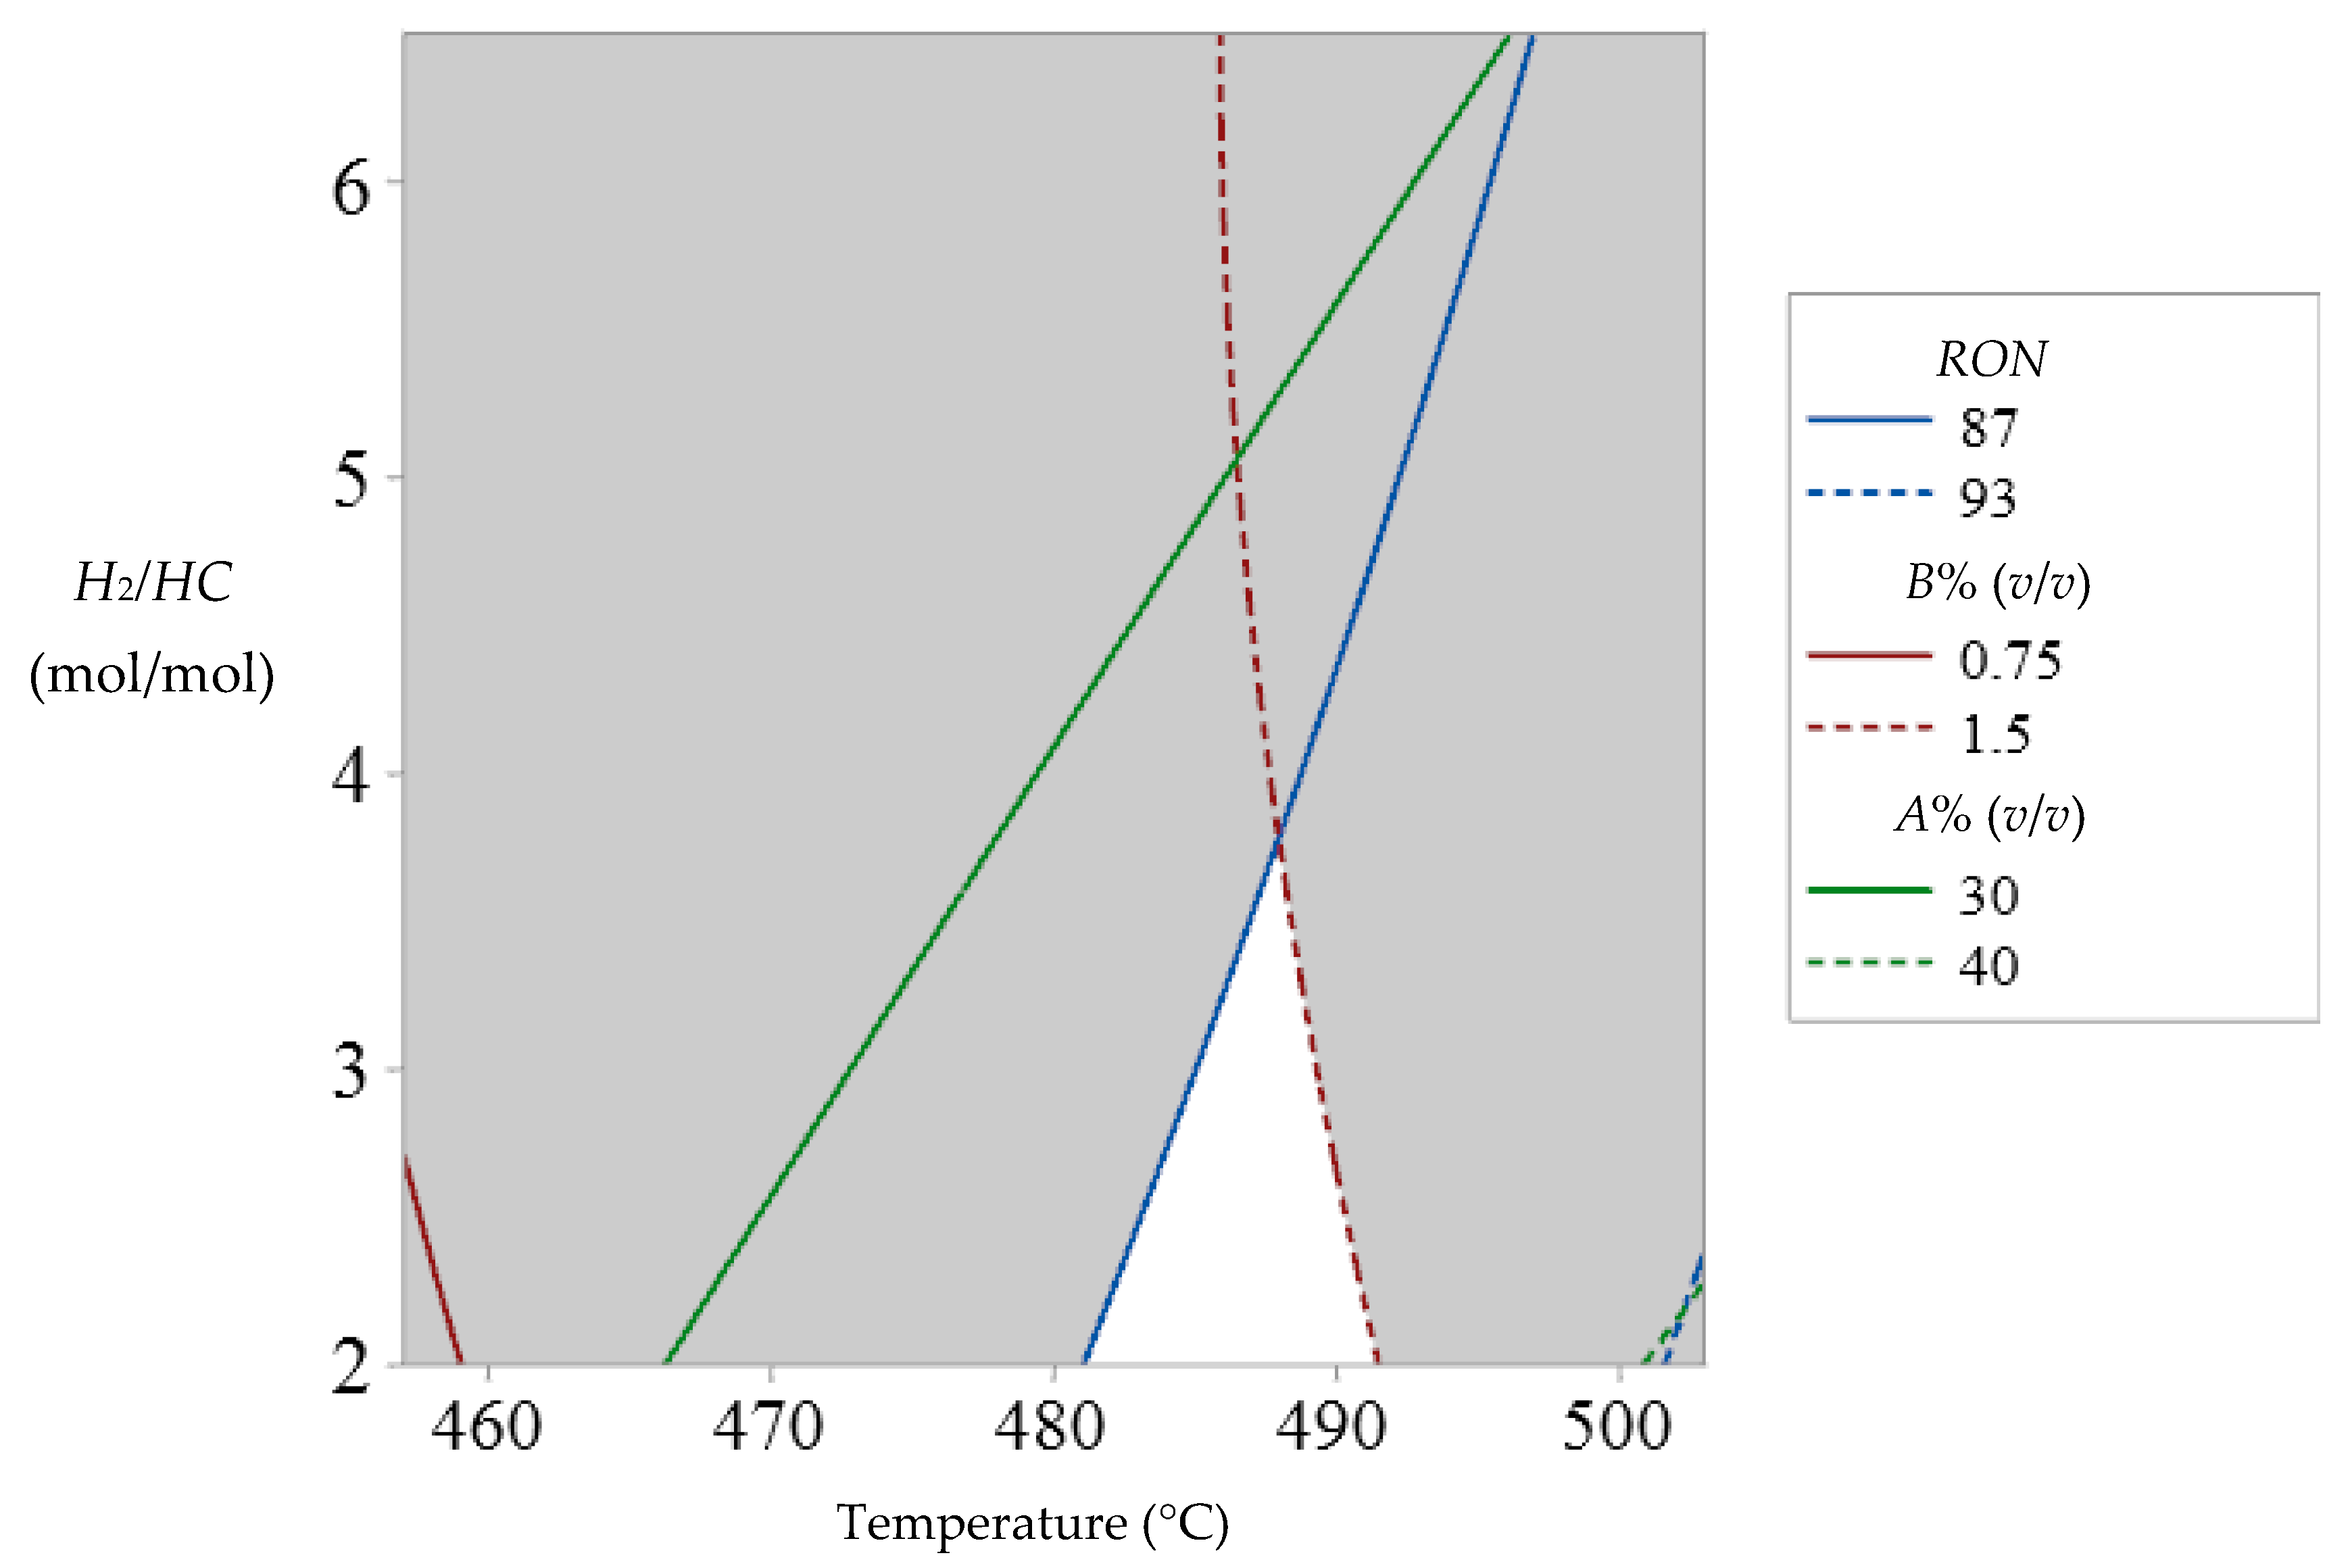
Therefore, considering these constraints, the operative zone of each objective variable was calculated; finding that, from a surfaces superposition some areas were identified within the limits of each constraint. The intersection of all operative zones was named as the “optimization zone“, in which the conditions are suitable for achieving a lower benzene content, with an acceptable octane index (RON) and an adequate composition of aromatic compounds, according to quality standards (see Figure 6).
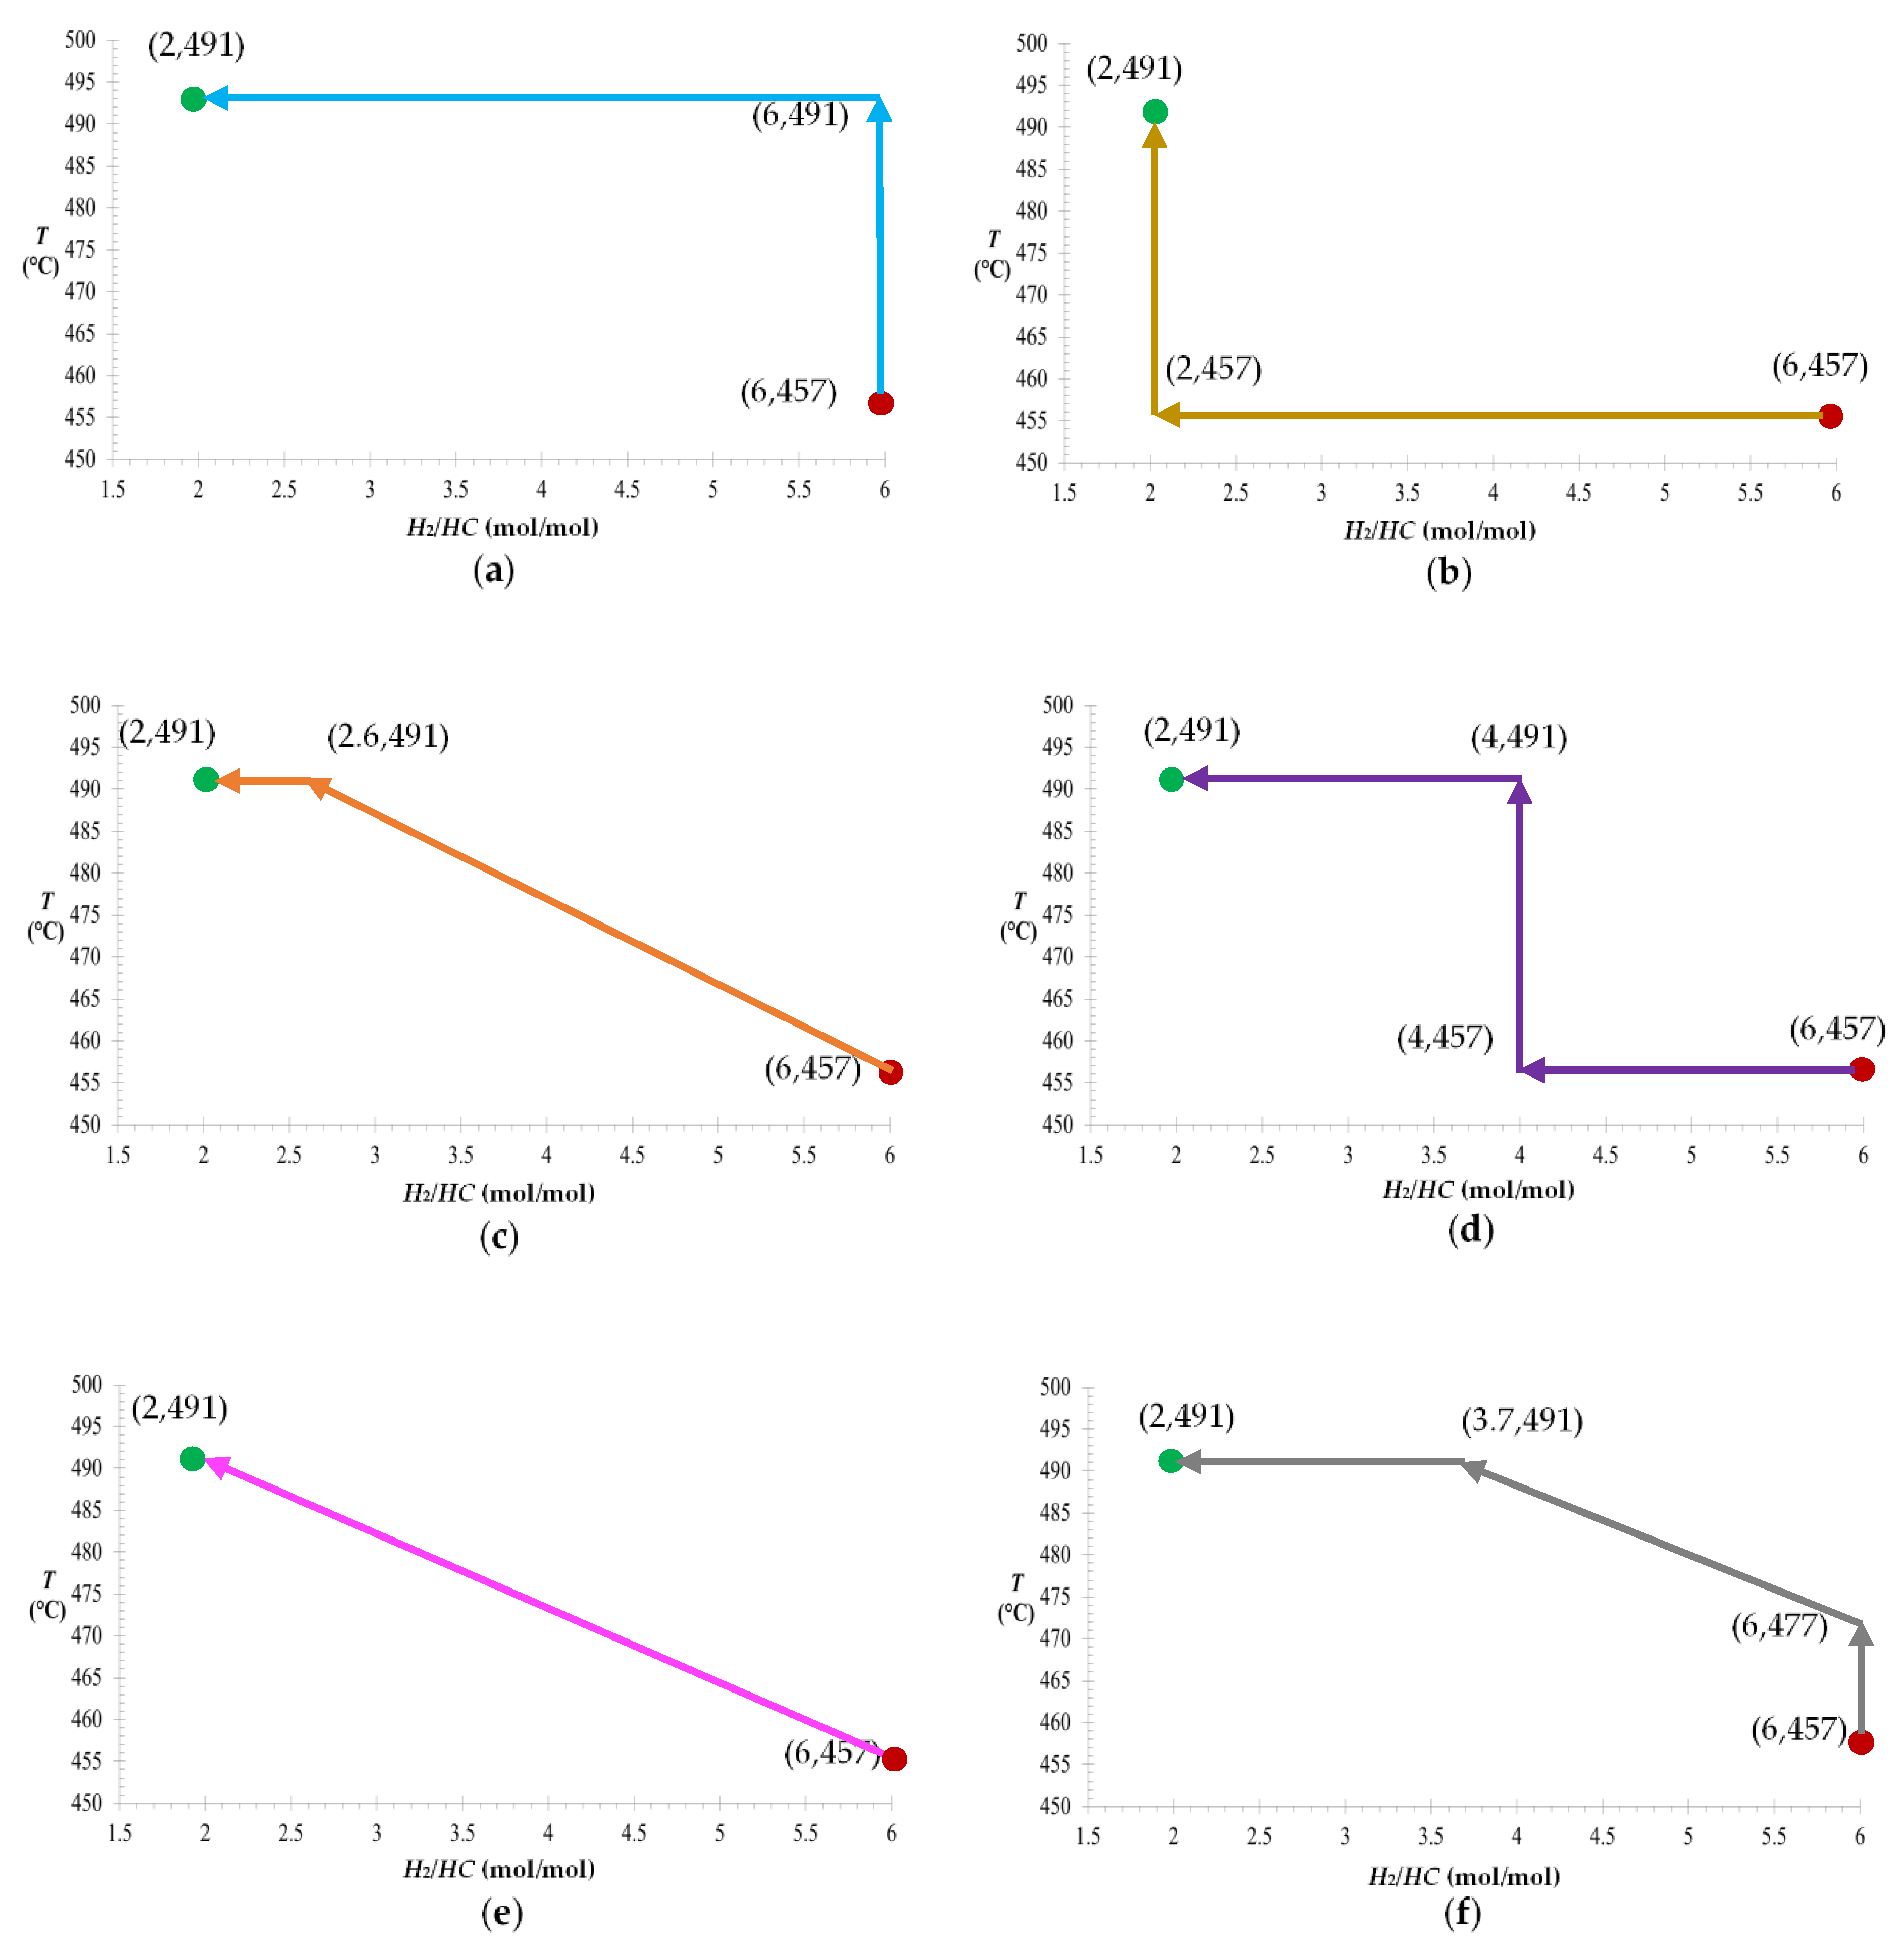
Figure 6 illustrates the multiple surface response superposition of the operative zones from each objective variable, generating an “optimization zone”, which can be visualized in the range of 482 to 491 °C; regarding the “H2/HC” feedstock ratio, this zone can be observed from 2.0 to 3.8 mol/mol. Therefore, in this work, it is proposed that a temperature value T = 491 °C and a “H2/HC” feedstock ratio of 2.0 are the objective conditions (OC) to be reached from the initial conditions (IC) of T = 457 °C and (H2/HC)= 6.0 when aiming to analyze the transitional operative routes (TOR) [27] to be followed when attempting to improve the operative conditions and optimize the reformate. Figure 7 shows the six TORs analyzed to find the optimum transition between the IC and the OC.
In order to achieve the objective conditions (OCs) that can improve the quality of gasoline and lower its benzene content, the transitional operative routes (TORs) were identified and selected, as shown in Figure 7. TOR 1 begins with a temperature increment from 457 to 491 °C, which is then followed by a reduction in the “H2/HC” feedstock molar ratio from 6.0 to 2.0. TOR 2 starts with a reduction in the “H2/HC” feedstock molar ratio from 6.0 to 2.0, and is followed by a temperature increase from 457 to 491 °C. TOR 3 starts with a rising slope as the temperature changes from 457 to 491 °C and the “H2/HC” feedstock molar ratio decreases from 6.0 to 2.6, finally reducing the “H2/HC” ratio from 2.6 to 2.0. TOR 4 comprises three steps: firstly, while maintaining a temperature of 457 °C, the “H2/HC” feedstock molar ratio is reduced from 6.0 to 4.0; secondly, the temperature is elevated from 457 to 491 °C; finally, there is a reduction in the “H2/HC” feedstock molar ratio from 4.0 to 2.0. TOR 5 is a direct rising slope change from the IC to the OC, which comprises a simultaneous rise in temperature from 457 to 491 °C and a reduction in the “H2/HC” feedstock molar ratio from 6.0 to 2.0. Finally, TOR 6 starts with a temperature increment from 457 to 477 °C, followed by a rising slope as the temperature rises from 477 to 491 °C, with a reduction in the “H2/HC” feedstock molar ratio from 6.0 to 3.7. To conclude, there is a reduction in the “H2/HC” feedstock molar ratio from 3.7 to 2.0.
A transitional analysis of the operative changes was carried out by using the average values from each objective variable [RON, A% (v/v) and B% (v/v)]. The average values were calculated from the results of the objective variables after modifying the operative conditions across every route of change and estimating the maximum value of each objective variable. The results of the assessment of different TORs are reported in Table 6.
When assessing and selecting the TORs, the route producing the most convenient values of the objective variables, through the operative changes, was considered; in order to compare the results of the dependent variables. In this sense, an evaluation of the average values, of response variables, was performed, considering that the best routes would produce the higher average values for RON and A% (v/v), with the lower benzene content B% (v/v), this while looking for a gasoline formulation with the best productivity and quality. A comparative analysis of each TOR was carried out, generating the description and selection of routes as follows: route 1 produced the highest average RON and A% (v/v) values; however, the benzene content [B% (v/v)] was the highest, at 1.410% (v/v). Nevertheless, this was considered the best TOR of all. Route 2 generated the lowest values of RON, A% (v/v) and B% (v/v), with the most convenient average benzene content, at 0.929% (v/v). Meanwhile, route 3 produced a B% (v/v) value of 1.227% (v/v), which was the third best assessed TOR. However, route 4 had nearly the same benzene content as Route 3, with 1.226% (v/v), and similar results as route 3 for the RON and A% (v/v) values. Route 5 was the second best regarding its average benzene content [B% (v/v)] but was fifth in terms of its RON and A% (v/v) values. Finally, route 6 was assessed as the second best of all, with the second-best RON and A% (v/v) values and a benzene content of 1.306% (v/v), which is lower than the 2% (v/v) limit defined in the Mexican standard [45].

3.2. NCR Operative Improvement

The optimum operative values were obtained by applying Minitab® ver. 19 software. The optimization results were selected to obtain the improved operative conditions (IOCs), as follows: T= 491 °C and H2/HC= 2.0. Therefore, the IOCs produced the following results for the objective variables: RON = 89.87; A% (v/v), = 37.39%, and B% (v/v) = 1.48%.

3.3. Experimental Results from the Pilot Plant

A platinum/rhenium on alumina catalyst (Pt-Re/Al2O3) was tested in a semi-regenerative pilot plant of the NCR process, setting a flowrate of 83 Nl/h at 7000 kPa, for fresh hydrogen, and at 6000 kPa, for recycled hydrogen, and setting a naphtha flowrate of 40 mL/min for 43 min; in order to stabilize the mass balance of naphtha flowing between the feed tank and the product tank. Then, the naphtha flowrate was decreased to 30 mL/min, maintaining a recycled hydrogen flowrate of 500 Nl/h at 7000 kPa and changing the temperature as follows: 400 °C for day 1; 450 °C for day 2; and 500 °C for day 3.

Analytical Results from Non-Reformed and Reformed Naphtha

Non-reformed naphtha was the main load of the reactants in the pilot plant; hence, the naphtha feedstock was initially analyzed using the Reformulyzer M4® multidimensional GC from Petroleum Analytical Company®, Houston, TX, USA, Analytical Controls®, Rotterdam, Netherlands, and Agilent Technologies®, Santa Clara, CA, USA, with the following results: RON = 75.25; density = 0.7518 g/mL; and a volumetric content of 0.12% cyclo-olefins; 0.26% olefins, 12.89% aromatic compounds, 20.09% n-paraffins, 31.94% naphthenes, and 34.68% iso-paraffins.
Liquid 10 mL samples of reformate products were taken at the outlet of the pilot plant; these samples were initially injected into the Multidimensional Gas Chromatographer to measure the RON from the feedstock, and at the end of every running day, for 3 consecutive days, with the following results: at day 1, RON = 79.50; at day 2, RON = 85.93; and at day 3, RON = 90.33. Table 7 shows the RON results and the volumetric concentrations of n-paraffins and naphthenes, which decreased during the experimental runs whilst the concentration of aromatic compounds increased, in accordance with the increase in the octane index of reformed naphtha.

3.4. Comparisons Between Industrial Data, Pilot Plant and Simulation Results

The data reported in Table 8 were compared with operative data at the industrial and pilot plant scale, with the results obtained by simulation in order to estimate the optimum operative ranges of the catalytic reforming process.
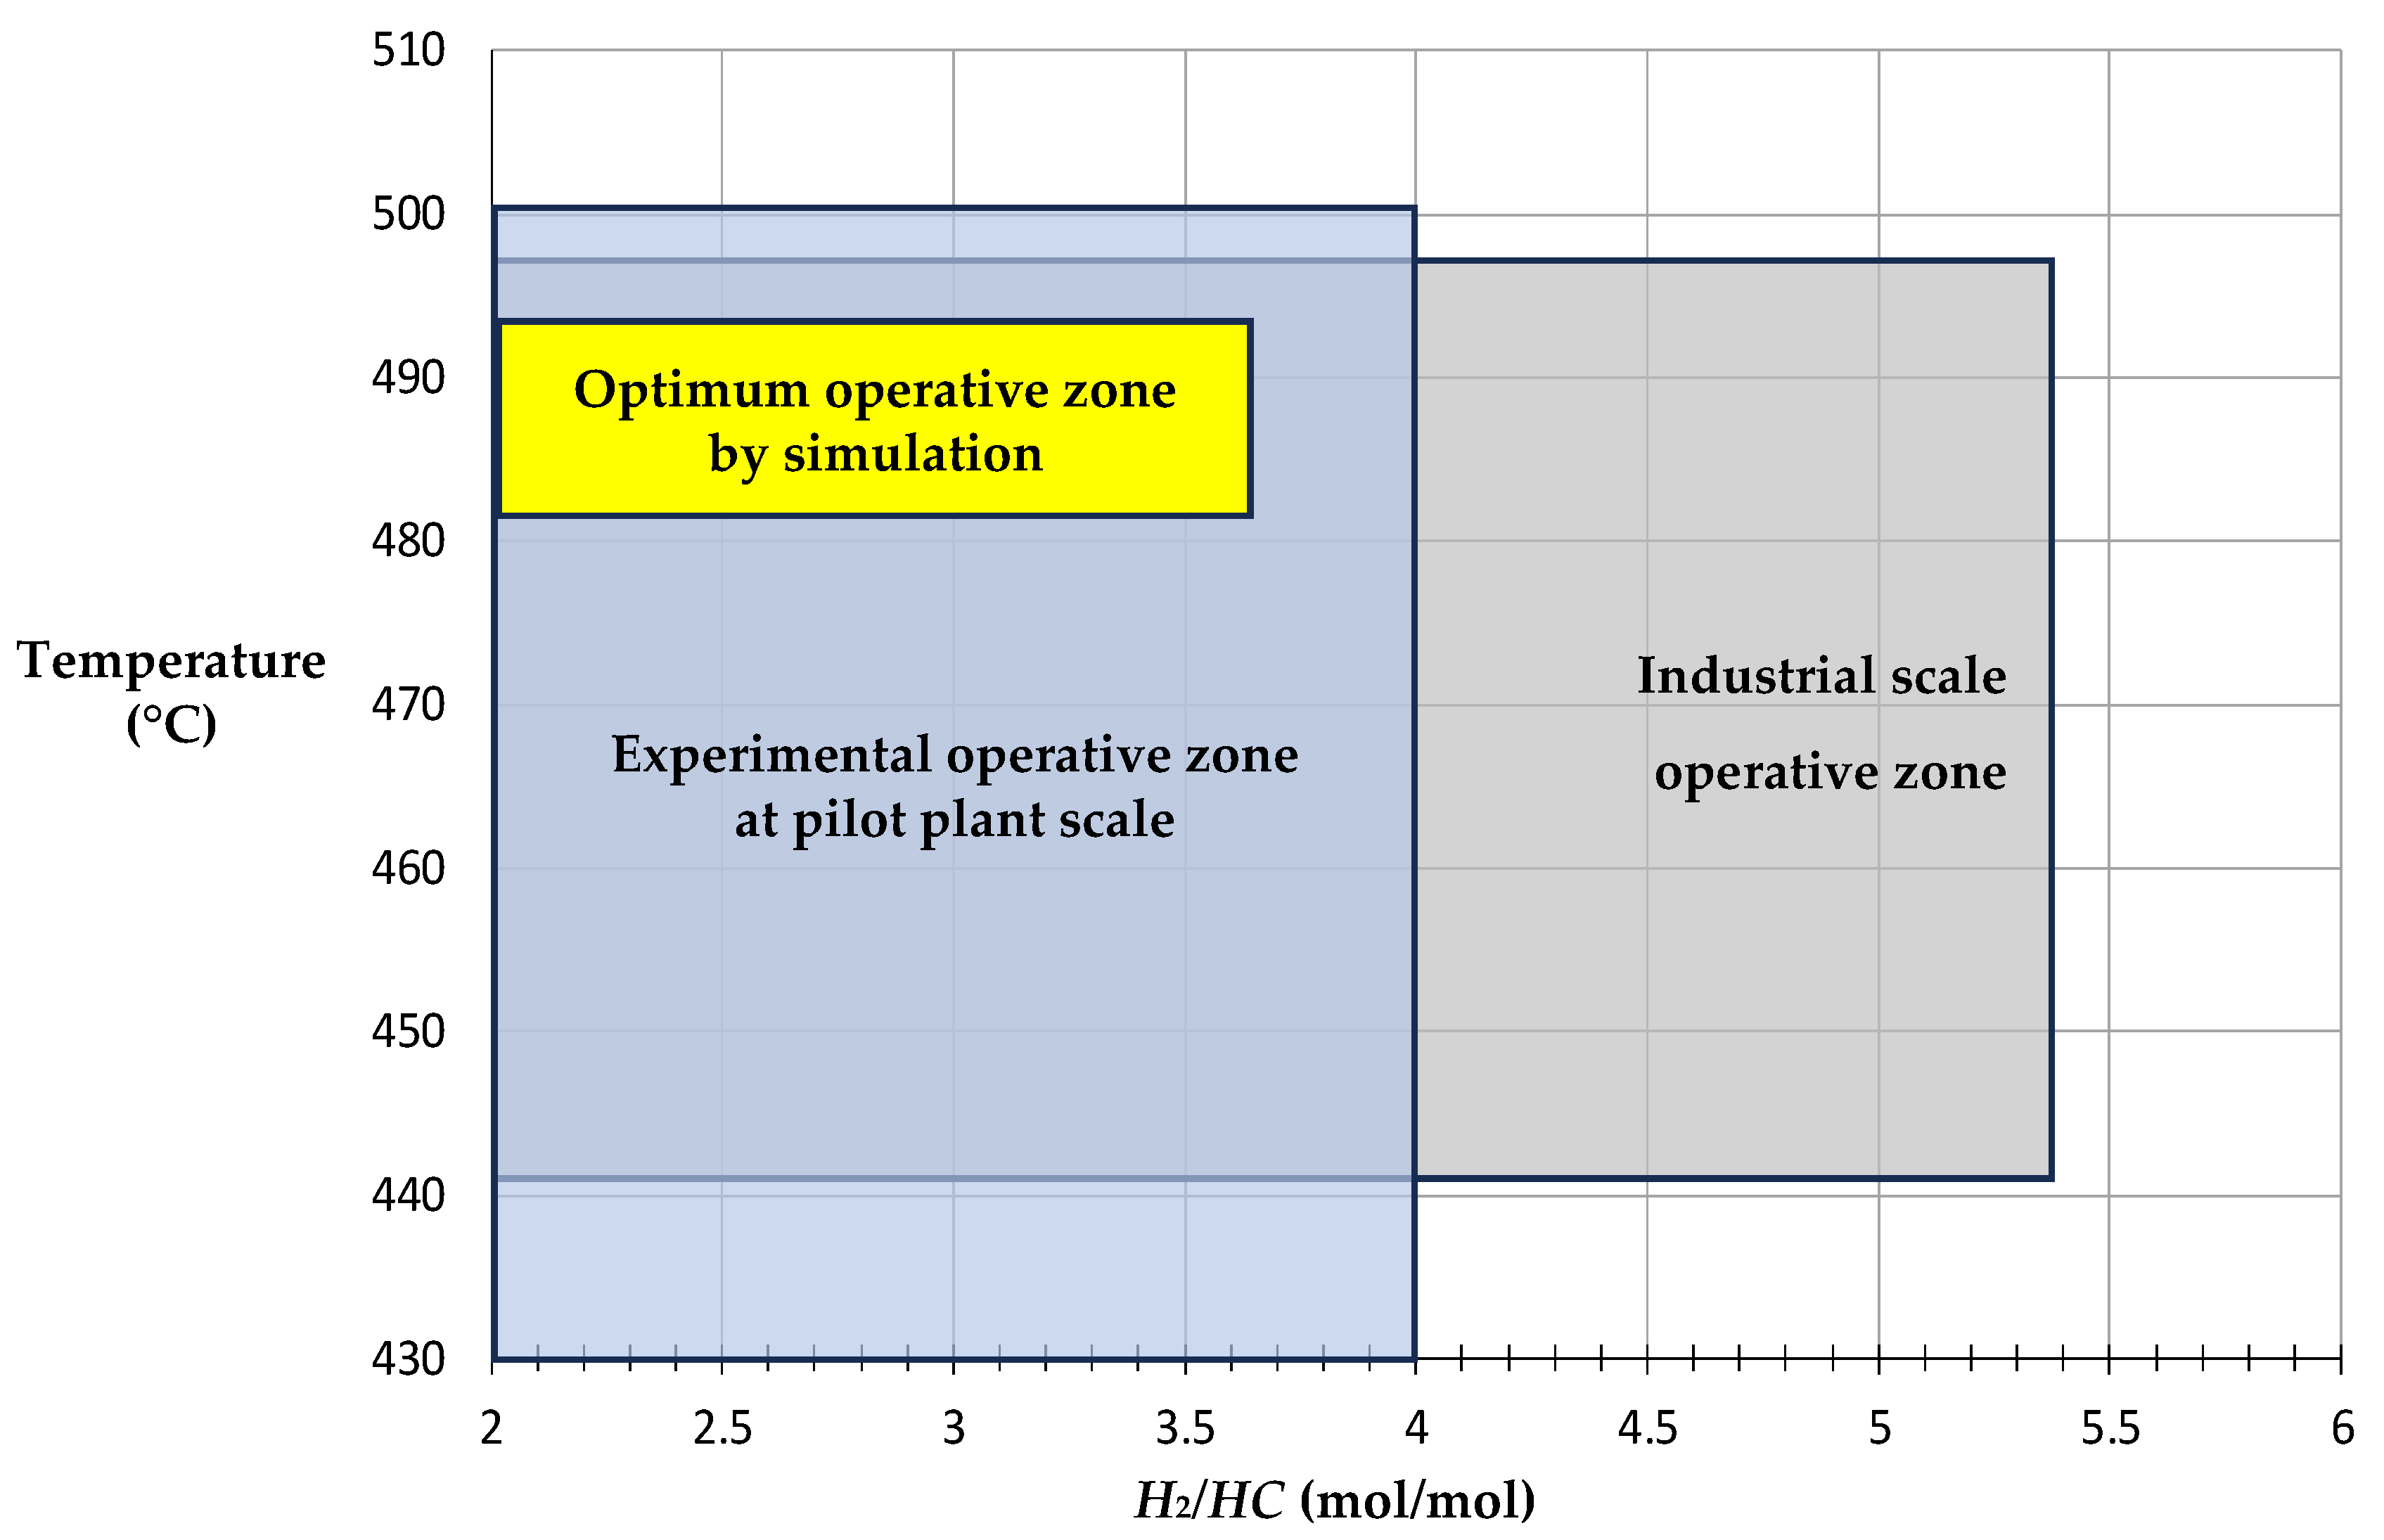
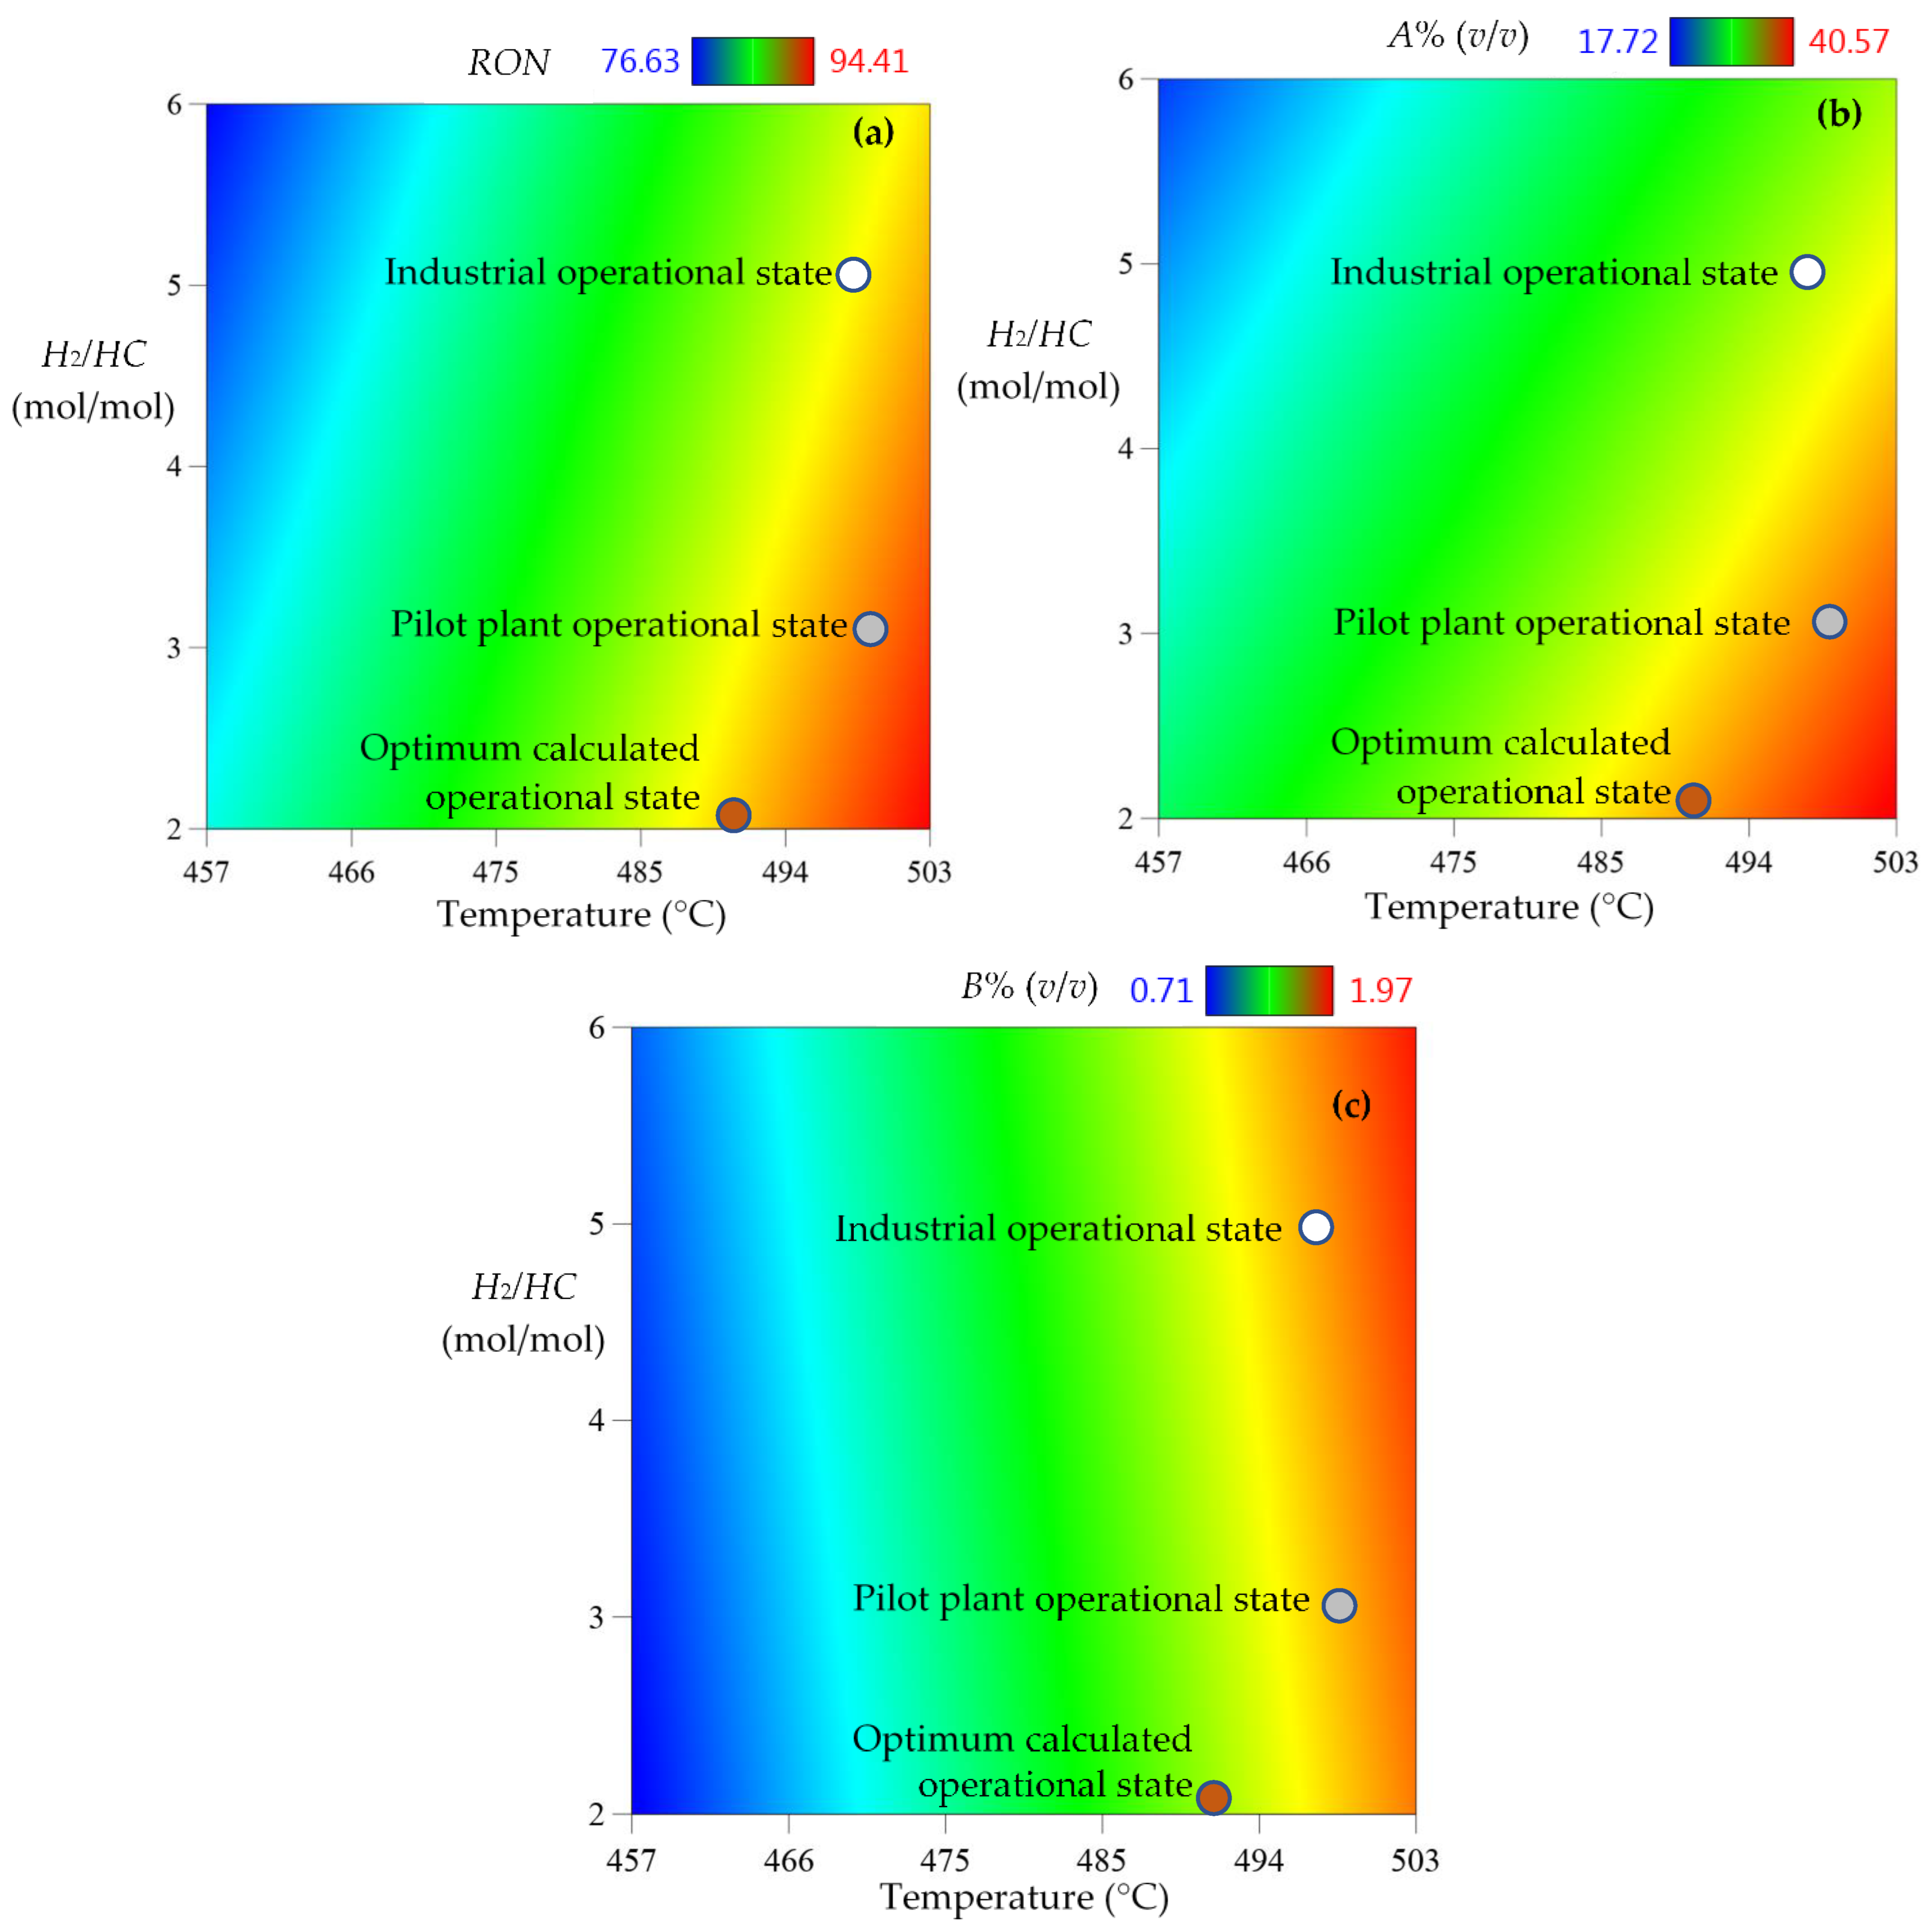
Using the conditions shown in Table 8, the operative zones were identified for the industrial and pilot plant scale; these are shown in Figure 8, including the optimum operative zone that was calculated by simulation. Thus, by identifying different operative conditions for every objective variable, it was observed that the industrial and pilot plant data converge to a temperature value of nearly 490 °C, which may improve the NCR process.
Figure 8 shows that the temperature ranged from 430 to 500 °C and that the H2/HC ratio ranged from 2.0 to 6.0; these values are the limits of both operative variables. These limits help to avoid undesirable effects on the catalytic material, such as catalyst deactivation, coke poisoning, crystallographic phase change in the supporting alumina, attrition and catalytic sintering. Temperatures > 510 °C may induce catalyst poisoning due to coke accumulation; therefore, the optimum operative temperature range is 498–503 °C, since lower temperatures may decrease the efficiency of the catalytic reaction. Additionally, the H2/HC ratio < 2.0 may affect the conversion rate of hydrocracking, cyclization and isomerization reactions, increasing coke deposition, reducing the efficiency of the NCR process, and shortening the catalyst’s lifetime. H2/HC values > 6.0 could cause the displacement of the chemical equilibrium of dehydrogenation and aromatization reactions due to an excess of hydrogen, which might decrease the octane index of the reformate. Thus, the optimum conditions must remain within operative limits in order to minimize the catalyst’s severity and maximize profits from the process. Figure 9 shows a set of color gradient graphics of the temperature vs. the H2/HC molar ratio and either the RON values (Figure 9a), the volumetric fraction of aromatic compounds A% (v/v) (Figure 9b), and the volumetric fraction of benzene B% (v/v) (Figure 9c); on each plot, three operational states are illustrated, including the industrial operational state (IOS), the pilot plant operational state (PPOS), and the optimum calculated operational state (OCOS). Figure 9 shows the differences between IOS and PPOS regarding the OCOS for the three objective variables. This analysis shows opportunities for applying operative changes when looking for optimal conditions to maximize both the RON and aromatics composition [A% (v/v)], whilst minimizing the benzene content [B% (v/v)]. Hence, by using TOR analysis, it could be possible to optimize the NCR process and find a pathway via which to perform an optimal transition whilst minimizing risks and the loss of profits. Table 9 reports the data of the final objective operative points from the industry, the pilot plant and simulation.
Table 9 shows a summary of the results obtained after comparing industrial data with the experimental results from the pilot plant, and the optimum results of the simulation. These comparisons confirm that, by using the proposed method, it is feasible to analyze the improvement in operative conditions needed to produce higher quality gasoline and, simultaneously, achieve indirect environmental goals concerning climate change and public health.

4. Discussion

The reduction in the content of short-chain aromatic compounds (C8/C8-) in gasoline has been studied in order to increase the efficiency of vehicle fuel engines and to reduce the atmospheric emissions, including nitrogen oxides (NOX), that are emitted from the combustion of ethylbenzene and ortho-xylene when vehicles are driven at high speed [53]. Similarly, this work analyzes the reduction in the content of aromatic compounds in gasoline. Particularly, this work focuses on benzene emissions, which are considered a constant concern for human health when related to the dispensing of gasoline at gas stations, due to its high volatility and toxicity levels, which are of interest for the government [54]. Therefore, the results of this work have been extended to calculate the mass balance scenarios of benzene emissions from gas stations and determine how these fugitive emissions may be reduced by optimizing oil-refining operations to produce higher quality fuels.

4.1. Production of High-Quality Fuels

The production of high-quality gasoline has also focused on reducing the benzene content; while some solutions involve increasing capital investments in refinement processes through the addition of new reaction units and the significant reconfiguration of the NCR plants [55], in this work, we propose the operative improvement of existing processes to achieve a reduction in the benzene content of gasoline, without a significant decrease in the RON, which directly affects fuel quality. Thus, a reduction in the benzene content of gasoline may be achieved by avoiding high capital investments and the substantial modification of the industrial process.

4.2. NCR Optimization for Fuels Benzene Reduction

Previous studies about the NCR process have focused on the use of mathematical modeling, simulation and optimization tools, either for model parametrization and/or the evaluation of complex kinetic models [56]; these studies have also proposed new strategies for selective gasoline production by applying statistic quadratic surface response models to optimize operative conditions such as the pressure, temperature, and space velocity; with the objective of a higher RON [57], in this work, operative improvements were determined by considering TORs under multivariate conditions, by using surface response methods and by taking the temperature (T) and H2/HC feedstock molar ratio as the most important independent variables. This work was also accomplished with a multi-objective optimization analysis that focused on an increase in the RON and a reduction in the benzene content of gasoline. Additionally, the production of clean and high-quality fuels can help to decrease atmospheric emissions and their associated environmental impact, which has previously been studied [58]. In this sense, multi-criterion NCR optimization has been studied by using genetic algorithm methods while assessing temperature as the single independent variable, and by searching for a reduction in the content of aromatic compounds, including benzene, which also cause a decrease in the RON [59]. Moreover, in a previous work, a reactor section model was proposed to study a countercurrent CCR reactor, aiming to optimize the production of aromatics, C7+ aromatics, and RON yields [60]; however, in this work, a simultaneous multivariate analysis of the temperature and H2/HC feedstock ratio was performed to find both the optimum operative zone, by surface superposition, and the TORs for the optimized operative conditions in order to reduce the content of benzene and aromatic compounds in gasoline (see Table 10).
Multi-objective optimization studies about the CCR process have focused on increasing the content of aromatics while reducing the benzene content of the reformate, finding that increasing the temperature from 520 to 530 °C also increases the content of aromatics by 0.15% (v/v) and lowers the benzene content down to 1.52% (v/v) [24]. Conversely, other studies have focused on analyzing the catalyst life cycles by changing the temperature from 460 to 540 °C, hence obtaining a RON between 89.7 and 108.4 [42] and disregarding the content of aromatics and benzene. These works have motivated more research about the quantification of and reduction in benzene emissions from gasoline by using multi-objective optimization tools and considering technical and environmental issues in order to identify the operative states of the NCR process, which may lead to a reduction in benzene without affecting the fuel quality.
Regarding pilot plant studies, a data-based model has been proposed to predict the RON, % (v/v) of benzene and Reid vapor pressure of gasoline [61]; in their report, the authors used a pilot-plant-scale reactor with commercial Pt/Al2O3 catalyst packing. By controlling the pressure, temperature, space velocity, and H2/HC molar ratio, a dataset was obtained to assess a kinetic model of isomerization reactions to predict the conditions needed to obtain a benzene content of 1.58% (v/v) in the reformate. In this work, simulation results were compared with experimental results at the pilot plant scale and with industrial-scale data, as complementary ways of validating data, in order to upscale the results and propose operative improvements. Additionally, the results of this work show that an operative temperature close to 500 °C allows a decrease in the content of benzene due to the endothermic nature of dehydrogenation and dehydrocycling reactions, which are promoted at higher temperatures [62].
Finally, the reduction in atmospheric emissions of benzene has become a challenge due to its potentially carcinogenic effects on public health, which are related to human exposure [63]. Therefore, the results of this work aim to contribute to operational improvements in the NCR process through a large-scope analysis of the mass balance scenarios of benzene emissions, with operative and transitional optimization performed during the refinement processes in order to produce high-quality and clean gasoline with a lower environmental impact.

4.3. Potential Challenges

At the industrial level, the operative conditions are carefully maintained in order to meet the quality and yield goals of the processes. Moreover, the catalyst lifetime is an important issue when monitoring naphtha reforming; for this reason, the reactor temperature is a key variable when aiming to maintain an increase in RON values but avoid coke formation and catalyst poisoning at higher temperatures. Additionally, dehydrogenation reactions can promote olefins formation, which could polymerize at active catalytic sites, thus obstructing access of naphtha reactants to the metallic phase of the catalyst. On the other hand, lower temperatures reduce benzene formation but also reduce RON reformate, whereas higher temperatures produce more benzene and better RON values. The operative key is to set an adequate temperature for balancing both objectives, namely the benzene content and RON of the reformate. In this sense, the H2/HC molar ratio must be kept at values close to and above 2.0 in order to avoid excessive hydrocracking reactions and a displaced kinetic equilibrium that affects the catalyst’s selectivity. Finally, the changing conditions of the catalyst throughout its lifetime make the continuous assessment of industrial data necessary, as well as their comparison with pilot plant and simulation results, in order to confirm the optimum operative conditions that could increase profits and the quality of the oil refining processes.

4.4. Comparative Analysis

Traditionally, industrial refining operations are performed in order to meet production objectives and take advantage of all available resources, including, in some cases, high capital investments; thus, changing the operative conditions is not usually an interesting issue since it alters the control and stability of the process, generating productivity and safety uncertainties. Nevertheless, the use of experimental tools, such as pilot plants, and computational methods is not often within the expectations of the industrial sector. However, testing new operative conditions at the laboratory scale and scaling up computational tools can offer an alternative point of view for industrial decision makers.
The methods tested and proposed in this work may be qualitatively compared with industrial approaches to decision-making, as shown in Table 11.
Decision-making for industrial managers and policymakers is not an easy task; for this reason, the use of scientific tools will help to achieve non-conventional and innovative goals at a real-scale level.

4.5. Environmental Benefits

The NCR is also a key process for the petrochemical production of derivatives of aromatic products; therefore, the optimization of the NCR may also lead to the more selective production of heavier products, hence minimizing the formation of volatile organic compounds (VOCs) and greenhouse gas emissions. In this study, the benzene content of gasoline is prioritized; however, aromatic compounds are also generated and contribute to the final RON of gasoline, which can also be increased by producing iso-paraffins. Thus, promoting isomerization reactions under optimum conditions may help to increase the gasoline quality without increasing the benzene content. In summary, considering the optimization analysis of catalytic reforming would result in environmental benefits, which could be related to the development of more sustainable industrial processes and the production of cleaner transportation fuels.

4.6. Further Research

The direction of future research may include the following: research on alternative reforming catalysts; the assessment of new TORs for minimizing the benzene content in fuels and/or maximizing the production of aromatics for petrochemical refineries; the analysis of benzene reduction, while minimizing coke formation to optimize the catalyst’s lifetime; the analysis of new TORs to promote isomerization reactions, including the study of further separation processes in the NCR; and extended environmental impact assessments of benzene emissions and/or additional volatile organic compounds (VOCs) that are of environmental interest in fuels, assuming diverse fugitive release scenarios.

5. Conclusions

A general mass balance has been developed for the study of benzene fugitive emissions from refineries and the whole logistic downstream process until fuel dispatch at gas stations; this study considered different composition scenarios, finding that reducing the benzene content of gasoline to 1.48% (v/v) would represent a 16.44% drop in the total atmospheric benzene emissions. Hence, it is feasible to reduce the environmental impact of fuel production and transportation by only improving refinery operations. In this sense, the optimization of the NCR process could play a key role in the production of high-quality fuels with a high octane number (>89.87) and a low benzene content [<1.488% (v/v)], which will help to mitigate climate change and increase the sustainability of the oil refinement industry. The analysis of the optimum transitional operations will not only help to improve the NCR process but will also lead to operative excellence in the industrial context. Finally, environmental issues have been addressed by proposing a novel approach to minimizing the benzene content in gasoline, which suggests that alternative options can be used to help policymakers make decisions.

Author Contributions

Conceptualization, F.V.-A. and C.A.G.-R.; methodology, F.V.-A. and C.A.G.-R.; software, F.V.-A.; validation, F.V.-A., C.A.G.-R. and L.O.A.-V.; formal analysis, F.V.-A., C.A.G.-R., F.P.-V. and J.R.V.-I.; investigation, F.V.-A. and C.A.G.-R.; resources, C.A.G.-R. and J.R.V.-I.; data curation, F.V.-A. and L.O.A.-V.; writing—original draft preparation, F.V.-A.; writing—review and editing, C.A.G.-R.; visualization, F.P.-V., Á.C.-A. and C.C.-L.; supervision, C.A.G.-R., J.R.V.-I., E.M.O.-S., M.H.-J., F.P.-V. and Á.C.-A.; project administration, C.A.G.-R. and C.R.-G.; funding acquisition, C.A.G.-R. and C.R.-G. All authors have read and agreed to the published version of the manuscript.

Funding

This research was funded by the Secretaría de Ciencia, Humanidades, Tecnología e Innovación (Secihti) of the federal Government of Mexico, through the project grant number 166571 and the scholarship of the first author with the grant number 790337.

Data Availability Statement

The original contributions presented in this study are included in the article. Further inquiries can be directed at the corresponding authors.

Conflicts of Interest

The authors declare no conflicts of interest, and the funders had no role in the design of the study; in the collection, analyses, or interpretation of data; in the writing of the manuscript; or in the decision to publish the results.

Appendix A

Table A1. Hydrocarbon mass balance flowrates (KBPD) related to Figure 2, and scenario analysis of benzene fugitive emissions.
Variable SymbolDescriptionBenzene Content Scenarios %(v/v)
2.01.51.00.75
FTotal gasoline production from refineries
(installed capacity in Mexico)
252.4252.4252.4252.4
XB,FTotal benzene content of gasoline produced5.0483.7862.5241.893
E1Fugitive benzene emissions from the NCR process (2%)0.1010.0760.0500.038
S1Gasoline production internally sent to storage terminals252.29252.32252.35252.36
XB,S1Benzene content of produced gasoline5.0463.7852.5241.893
IImported gasoline419.50419.50419.50419.50
XB,IBenzene content of imported gasoline (0.75% v/v)3.1463.1463.1463.146
E2Fugitive benzene emissions from storage of imported and nationally produced gasoline (6.7%)0.5480.4640.3790.337
S2Total gasoline stock for distribution671.24671.35671.47671.52
XB,S2Total benzene content in gasoline for distribution7.6446.4675.2914.702
TDGasoline transported by duct (inlet) (65%)436.31436.37436.46436.49
XB,TDBenzene content of gasoline transported by duct4.9694.2043.4393.056
TCGasoline transported by tank car (inlet) (26%)174.52174.55174.58174.59
XB,TCBenzene content of gasoline transported by tank car1.9871.6811.3751.222
TBGasoline transported by tanker (inlet) (6%)40.27440.28140.28840.291
XB,TBBenzene content of gasoline transported by tanker0.4590.3880.3170.282
TTGasoline transported by train (inlet) (3%)20.13720.14120.14420.145
XB,TTBenzene content of gasoline transported by train0.2290.1970.1580.141
E3Fugitive benzene emissions from duct transport (2.5%)0.1240.1050.0860.076
E4Fugitive benzene emissions from tank car transport (0.4%)0.00790.00670.00550.0049
E5Fugitive benzene emissions from tanker transport (0.4%)0.00180.00150.00120.0011
E6Fugitive benzene emissions from train transport (0.4%)0.000920.000780.000630.00056
TDsGasoline transported by duct (outlet)436.19436.26436.37436.41
TCsGasoline transported by tank car (outlet)174.51174.54174.58174.59
TBsGasoline transported by tanker (outlet)40.27240.27940.28640.289
TTsGasoline transported by train (outlet)20.13620.14020.14320.144
XB,TDsBenzene content of gasoline transported by duct (outlet)4.8454.0993.3532.980
XB,TCsBenzene content of gasoline transported by tank car (outlet)1.9791.6741.3691.217
XB,TBsBenzene content of gasoline transported by tanker (outlet)0.4570.3860.3150.280
XB,TTsBenzene content of gasoline transported by train (outlet)0.2280.1960.1570.140
S3Total gasoline to final storage terminals671.10671.22671.37671.43
XB,S3Benzene content of gasoline to final storage terminals7.5096.3565.1964.618
E7Fugitive benzene emissions from final storage terminals (6.7%)0.5030.4260.3480.309
S4Total gasoline to be distributed at gasoline stations670.60670.80671.03671.12
XB,S4Benzene content of gasoline to be distributed at gasoline stations7.0065.9304.8474.309
E8Fugitive benzene emissions from gasoline transported by tank car to gasoline stations (0.4%)0.0280.0230.0190.017
S5Total gasoline dispensed at gasoline stations670.57670.77671.01671.11
XB,S5Benzene content of gasoline stored at gasoline stations6.9805.9064.8284.292
E9Benzene fugitive emissions from gasoline stored and dispensed at gasoline stations (0.5%)0.0350.0290.0240.021
S6Total gasoline dispensed from gasoline stations670.54670.74670.98671.08
XB,S6Benzene content of gasoline dispensed to vehicles6.9435.8774.8044.270
E10Fugitive benzene emissions from vehicles (2%)0.1390.1170.0960.085

References

  1. Liu, Y.; Lu, S.; Yan, X.; Gao, S.; Cui, X.; Cui, Z. Life cycle assessment of petroleum refining process: A case study in China. J. Clean. Prod. 2020, 256, 120422. [Google Scholar] [CrossRef]
  2. Barton, C.C. Benzene. In Encyclopedia of Toxicology, 4th ed.; Wexler, P., Ed.; Elsevier: Washington, DC, USA, 2024; Volume 1, pp. 961–966. [Google Scholar] [CrossRef]
  3. Liu, P.; Wu, Y.; Li, Z.; Lv, Z.; Zhang, J.; Song, A.; Wang, T.; Wu, L.; Mao, H.; Peng, J. Tailpipe volatile organic compounds (VOCs) emissions from Chinese gasoline vehicles under different vehicles standards, fuel types, and driving conditions. Atmos. Environ. 2024, 323, 120348. [Google Scholar] [CrossRef]
  4. Li, Q.; Padilla, L.; Thompson, T.; Xiao, S.; Mohr, E.J.; Zhou, X.; Kacharava, N.; Cui, Y.; Wang, C. A modeling framework to assess fenceline monitoring and self-reported upset emissions of benzene from multiple oil refineries in Texas. Atmos. Environ. X 2024, 23, 100281. [Google Scholar] [CrossRef]
  5. Chen, W.-H.; Chang, C.-F.; Lai, C.-H.; Peng, Y.-P.; Su, Y.-J.; Chen, G.-F. Multivariate analysis of carcinogenic equivalence (CEQ) to characterize carcinogenic VOC emissions in a typical petrochemical industrial park in Taiwan. Environ. Int. 2024, 186, 108548. [Google Scholar] [CrossRef] [PubMed]
  6. Hienuki, S. Environmental and socio-economic analysis of naphtha reforming hydrogen energy using input-output tables: A case study from Japan. Sustainability 2017, 9, 1376. [Google Scholar] [CrossRef]
  7. Zahed, M.A.; Salehi, S.; Khoei, M.A.; Esmaeili, P.; Mohajeri, L. Risk assessment of Benzene, Toluene, Ethyl benzene, and Xylene (BTEX) in the atmospheric air around the world: A review. Toxic. Vitr. 2024, 98, 105825. [Google Scholar] [CrossRef] [PubMed]
  8. Alcántar-González, F.S.; Elizalde-Segovia, R.; Olvera-Santos, M.G.; López-Herrera, D.; Cruz-Gómez, M.J. Análisis del contenido de benceno en las gasolinas y estimación de emisiones de este compuesto al ambiente. Rev. Int. Contam. Ambient. 2020, 36, 321–331. [Google Scholar] [CrossRef]
  9. Romo, D. Refinación del petróleo en México y perspectiva de la reforma energética. Probl. Des. 2016, 47, 139–164. [Google Scholar] [CrossRef]
  10. Li, Z.; Ying, Y.; Yang, M.; Zhao, L.; Zhao, L.; Du, W. Monitoring and path optimization of catalytic reformer in a refinery: Principal component analysis and A* algorithm application. Expert Syst. Appl. 2022, 209, 118358. [Google Scholar] [CrossRef]
  11. Akhtar, M.N.; Aitani, A.M.; Ummer, A.C.; Alasiri, H.S. Review of the catalytic conversion of naphtha to aromatics: Advances and outlook. Energy Fuels 2023, 37, 2586–2607. [Google Scholar] [CrossRef]
  12. Aznárez, A.; Korilli, S.A.; Gil, A. Progress and recent novelties in naphtha reforming catalysts. J. Environ. Chem. Eng. 2024, 12, 113066. [Google Scholar] [CrossRef]
  13. Atarianshandiz, M.; McAuley, K.B.; Shahsavand, A. Modeling and parameter tuning for continuous catalytic reforming of naphtha in an industrial reactor system. Process 2023, 11, 2838. [Google Scholar] [CrossRef]
  14. Zapf, F.; Wallek, T. Case-study of a flowsheet simulation using deep-learning process models for multi-objective optimization of petrochemical production plants. Comp. Chem. Eng. 2022, 162, 107823. [Google Scholar] [CrossRef]
  15. Pishnamazi, M.; Nakhjiri, A.T.; Rezakazemi, M.; Marjani, A.; Shirazian, S. Mechanistic model and numerical simulation of axial flow catalytic reactor for naphtha reforming unit. PLoS ONE 2020, 15, e0242343. [Google Scholar] [CrossRef] [PubMed]
  16. Boukezoula, T.F.; Bencheikh, L.; Belkhiat, D.E.C. A heterogeneous model for a cylindrical fixed bed axial flow reactors applied to a naphtha reforming process with a non-uniform catalyst distribution n in the pellet. React. Kinet. Mech. Catal. 2020, 131, 335–351. [Google Scholar] [CrossRef]
  17. Yusuf, A.Z.; John, Y.M.; Aderemi, B.O.; Patel, R.; Mujtaba, I.M. Modelling simulation and sensitivity analysis of naphtha catalytic reforming reactions. Comp. Chem. Eng. 2019, 130, 106531. [Google Scholar] [CrossRef]
  18. Issa, H.M. Streamlining aromatic content detection in automotive gasoline for environmental protection: Utilizing a rapand simplified prediction model based on some physical characteristics and regression analysis. Results Eng. 2024, 21, 101771. [Google Scholar] [CrossRef]
  19. Martínez, J.; Zúñiga-Hinojosa, M.A.; Ruiz- Martínez, R.S. A thermodynamic analysis of naphtha catalytic reforming reactions to produce high octane gasoline. Process 2022, 10, 313. [Google Scholar] [CrossRef]
  20. Petrova, D.A.; Gushchin, P.A.; Ivanov, E.V.; Lyubimenko, V.A.; Kolesnikov, I.M. Modelling industrial catalytic reforming of low octane gasoline. Chem. Technol. Fuels Oils 2021, 57, 143–159. [Google Scholar] [CrossRef]
  21. Ivanchina, E.; Chernyakova, E.; Pchelintseva, I.; Poluboyartsev, D. Mathematical modelling and optimization of semi-regenerative catalytic reforming of naphtha. Oil Gas Sci. Technol.—Rev. IFP Energies Nouv. 2021, 76, 64–75. [Google Scholar] [CrossRef]
  22. Rahimpour, M.R.; Jafari, M.; Iranshahi, D. Progress in catalytic naphtha reforming: A review. Appl. Energy 2013, 109, 79–93. [Google Scholar] [CrossRef]
  23. Jafari, M.; Rafiei, R.; Amiri, S.; Karimi, M.; Iranshahi, D.; Rahimpour, M.R.; Mahdiyar, H. Combining continuous catalytic regenerative naphtha reformer with thermally coupled concept for improving the process yield. Int. J. Hydrogen Energy 2013, 38, 10327–10344. [Google Scholar] [CrossRef]
  24. Hou, W.F.; Su, H.Y.; Mu, S.J.; Chu, J. Multiobjective optimization of the industrial catalytic naphtha reforming process. Chin. J. Chem. Eng. 2007, 15, 75–80. [Google Scholar] [CrossRef]
  25. Belgamwar, R.; Santosh, K.; Valavarasu, G.; Sarawade, P.; Polshettivar, V. Tuning the interfacial interactions between alumina support and pseudo single atom platinum-tin catalytic sites for heavy naphtha reforming. Catal. Today 2024, 432, 114606. [Google Scholar] [CrossRef]
  26. Mokheimer, E.M.A.; Shakeel, M.R.; Harale, A.; Paglieri, S.; Mansour, R.B. Fuel reforming processes for hydrogen production. Fuel 2024, 359, 130427. [Google Scholar] [CrossRef]
  27. Velázquez- Alonso, F.; González-Ramírez, C.A.; Villagómez-Ibarra, J.R.; Otazo-Sánchez, E.M.; Hernández-Juárez, M.; Pérez-Villaseñor, F.; Castro-Agüero, A.; Alemán-Vázquez, L.O. Transitional analysis for multi-objective operative improvement of reformate quality and hydrogen production from a naphtha catalytic reforming process. Heliyon 2025, 11, e41428. [Google Scholar] [CrossRef] [PubMed]
  28. Chen, Z.; Wang, Y.; Li, Y.; Wu, J.; Zhang, L. Explicit molecule-based reaction network simplification: Theory and application on catalytic reforming. Chem. Eng. Sci. 2023, 277, 118833. [Google Scholar] [CrossRef]
  29. Mohebi, A.R.; Najafi, F.; Mozzafarian, M.; Dabir, B.; Amrabadi, N.E. Fludynamics and erosion analysis in industrial naphtha reforming: A CFD-DPM simulation approach. Powder Technol. 2024, 436, 119417. [Google Scholar] [CrossRef]
  30. Han, Y.; Li, Y.; Tian, J.; Zhang, K.; Ma, H. Feasibility analysis of replacing benzene in gasoline with cyclohexane: Engine performance and emissions. J. Energy Inst. 2025, 119, 101996. [Google Scholar] [CrossRef]
  31. Laredo, G.C.; Quintana-Solórzano, R.; Castillo, J.J.; Armendáriz-Herrera, H.; García-Gutiérrez, J.L. Benzene reduction in gasoline by alkylation with propylene over MCM-22 zeolite with a different Brønsted-Lewis acidity ratios. Appl. Catal. A Gen. 2013, 454, 37–45. [Google Scholar] [CrossRef]
  32. Rostamikia, T.; Parsafard, N.; Peyrovi, M.H. Benzene reduction in reformate gasoline by competitive hydrogenation: Effect of the preparation method. ChemistrySelect 2019, 4, 4861–4866. [Google Scholar] [CrossRef]
  33. Verma, D.K.; des Tombe, K. Benzene in gasoline and crude oil: Occupational and environmental implications. Am. Ind. Hyg. Assoc. J. 2002, 63, 225–230. [Google Scholar] [CrossRef] [PubMed]
  34. Kumari, P.; Soni, D.; Aggarwal, S.G. Benzene: A critical review on measurement methodology, certified reference material, exposure limits with its impact on human health and mitigation strategies. Environ. Anal. Health Toxicol. 2024, 39, e2024012. [Google Scholar] [CrossRef]
  35. Ekpenyong, C.E.; Asuquo, A.E. Recent advances in occupational and environmental health hazards of workers exposed to gasoline compounds. Int. J. Occup. Med. Environ. Health 2017, 30, 1–26. [Google Scholar] [CrossRef] [PubMed]
  36. Weisel, C.P. Benzene exposure: An overview of monitoring methods and their findings. Chem.-Biol. Interact. 2010, 184, 58–66. [Google Scholar] [CrossRef] [PubMed]
  37. Fetisov, V.; Gonopolsky, A.M.; Davardoost, H.; Ghanbari, A.R.; Mohammadi, A.H. Regulation and impact of VOC and CO2 emissions in low carbon energy systems resilient to climate change: A case study on an environmental issue in the oil and gas industry. Energy Sci. Eng. 2022, 11, 1516–1535. [Google Scholar] [CrossRef]
  38. Secretaría de Energía, México. Estadísticas de Petrolíferos (Gasolina). Available online: https://estadisticashidrocarburos.energia.gob.mx/gas.aspx (accessed on 1 October 2024).
  39. Velázquez-Alonso, F.; (TECNM campus Pachuca, Pachuca, Hidalgo, México). Personal communication, 2024.
  40. González-Ramírez, C.A.; (Universidad Autónoma del Estado de Hidalgo, Mineral de la Reforma, Hidalgo, México). Personal communication, 2024.
  41. EPA. Emission Factor Documentation for AP-42 Section 7.1 Organic Liqustorage Tanks Final Report, September 2006. Available online: https://nepis.epa.gov/Exe/ZyPURL.cgi?Dockey=P100NVV2.txt (accessed on 22 October 2024).
  42. Mata, T.M.; Smith, R.L.; Young, D.M.; Costa, C.A.V. Life cycle assessment of gasoline blending options. Environ. Sci. Technol. 2003, 37, 3724–3732. [Google Scholar] [CrossRef] [PubMed]
  43. Sheartson, J.A.; Hilpert, M. Gasoline vapor emissions during vehicle refueling events in a vehicle fleet saturated with onboard refueling vapor recovery systems: Need for an exposure assessment. Front. Public Health 2020, 8, 18. [Google Scholar] [CrossRef]
  44. Hilpert, M.; Mora, B.A.; Ni, J.; Rule, A.M.; Nachman, K.E. Hydrocarbon release during fuel storage and transfer at gas stations: Environmental and health effects. Curr. Environ. Health Rep. 2015, 2, 412–422. [Google Scholar] [CrossRef] [PubMed]
  45. Diario Oficial de la Federación. Available online: https://www.dof.gob.mx/nota_detalle.php?codigo=5450011&fecha=29/08/2016#gsc.tab=0 (accessed on 22 October 2024).
  46. Veza, I.; Spraggon, M.; Fattah, I.M.R.; Idris, M. Response surface methodology (RSM) for optimizing engine performance and emissions fueled with biofuel: Review of RSM for sustainability energy transition. Results Eng. 2023, 18, 101213. [Google Scholar] [CrossRef]
  47. Gutiérrez Pulido, H.; De la Vara Salazar, R. Análisis y Diseño de Experimentos, 2nd ed.; McGraw-Hill/ Interamericana Eds.: Mexico City, Mexico, 2008; pp. 384–420. [Google Scholar]
  48. Yusup, S.; Khan, Z.; Ahmad, M.M.; Rashidi, N.A. Optimization of hydrogen production in in-situ catalytic adsorption (ICA) steam gasification based on Response Surface Methodology. Biomass-Bioenergy 2014, 60, 98–107. [Google Scholar] [CrossRef]
  49. Al-Jamimi, H.A.; BinMakhashen, G.M.; Deb, K.; Saleh, T.A. Multiobjective optimization and analysis of petroleum catalytic processes: A review. Fuel 2021, 288, 119678. [Google Scholar] [CrossRef]
  50. ASTM D6729-20; Standard Test Method for Determination of Individual Components in Spark Ignition Engine Fuels by 100 Meter Capillary High Resolution Gas Chromatography. ASTM: West Conshohocken, PA, USA, 2020; p. 51.
  51. ASTM D6839-21a; Standard Test Method for Hydrocarbon Types, Oxygenated Compounds, Benzene, and Toluene in Spark Ignition Engine Fuels by Multidimensional Gas Chromatography. ASTM: West Conshohocken, PA, USA, 2021; p. 17.
  52. Cherepitsa, S.V.; Bychkov, S.M.; Gatsikha, S.V.; Kovalenko, A.N.; Mazanik, A.L.; Kuzmenkov, D.E.; Luchinina, Y.L.; Gremyako, N.N. Gas chromatographic analysis of automobile gasolines. Chem. Technol. Fuels Oils 2001, 37, 283–290. [Google Scholar] [CrossRef]
  53. He, Z.; Zao, W.; Liu, G.; Qian, Y.; Lu, X. Effects of short chain aromatics in gasoline on GDI engine combustion and emissions. Fuel 2021, 297, 120725. [Google Scholar] [CrossRef]
  54. Health Canada. Benzene Releases from Gasoline Stations: Implications for Human Health, 1st ed.; Government of Canada: Ottawa, ON, Canada, 2023; pp. 1–40. Available online: https://www.canada.ca/en/health-canada/services/publications/healthy-living/benzene-releases-gasoline-stations-implications-human-health.html (accessed on 13 January 2025).
  55. El-Malky, E.; Umansky, B.; Moy, E.; Donahoe, G.; Thom, T. Gasoline benzene reduction. Dig. Refin. 2013, 4, 1000839. [Google Scholar]
  56. Ma, X.C.; He, C.; Chen, Q.L.; Zhang, B.J. Modeling and optimization for the continuous catalytic reforming process based on the hybrsurrogate optimization model. Comp. Chem. Eng. 2024, 191, 108841. [Google Scholar] [CrossRef]
  57. Elfghi, F.M. Catalytic naphtha reforming; challenges for selective gasoline; an overview and optimization case study. J. Adv. Catal. Sci. Technol. 2016, 3, 27–42. [Google Scholar] [CrossRef]
  58. Abdellatief, T.M.M.; Ershov, M.A.; Kapustin, V.M.; Ali-Abdelkareem, M.; Kamil, M.; Olabi, A.G. Recent trends for introducing promising fuel components to enhance the anti-knock quality of gasoline: A systematic review. Fuel 2021, 291, 120112. [Google Scholar] [CrossRef]
  59. Zainullin, R.Z.; Zagoruiko, A.N.; Koledina, K.F.; Gubaidullin, I.M.; Faskhutdinova, R.I. Multi-criterion optimization of a catalytic reforming unit using a genetic algorithm. Catal. Ind. 2020, 12, 133–140. [Google Scholar] [CrossRef]
  60. Jiang, H.; Li, Z.; Sun, Y.; Jiang, S.; Tian, J. Optimization of the countercurrent continuous reforming process based on equation oriented modeling and the SQP algorithm. ACS Omega 2020, 7, 1757–1771. [Google Scholar] [CrossRef] [PubMed]
  61. Abdoulkarimi, V.; Sari, A.; Shokri, S. Robust prediction and optimization of gasoline quality using data-driven adaptive modeling for a light naphtha isomerization reactor. Fuel 2022, 328, 125304. [Google Scholar] [CrossRef]
  62. Otaraku, I.J.; Egun, I.L. Optimization of hydrogen production from Nigerian crude oil samples through continuous catalyst regeneration (CCR) reforming process using Aspen Hysys. React. Kinet. Catal. Lett. 2017, 5, 69–72. [Google Scholar] [CrossRef]
  63. Laredo, G.C.; Castillo, J.; Cano, J.L. Benzene reduction in gasoline range streams by adsorption process using a PVDC-PVC carbon molecular sieve. Fuel 2014, 135, 459–467. [Google Scholar] [CrossRef]
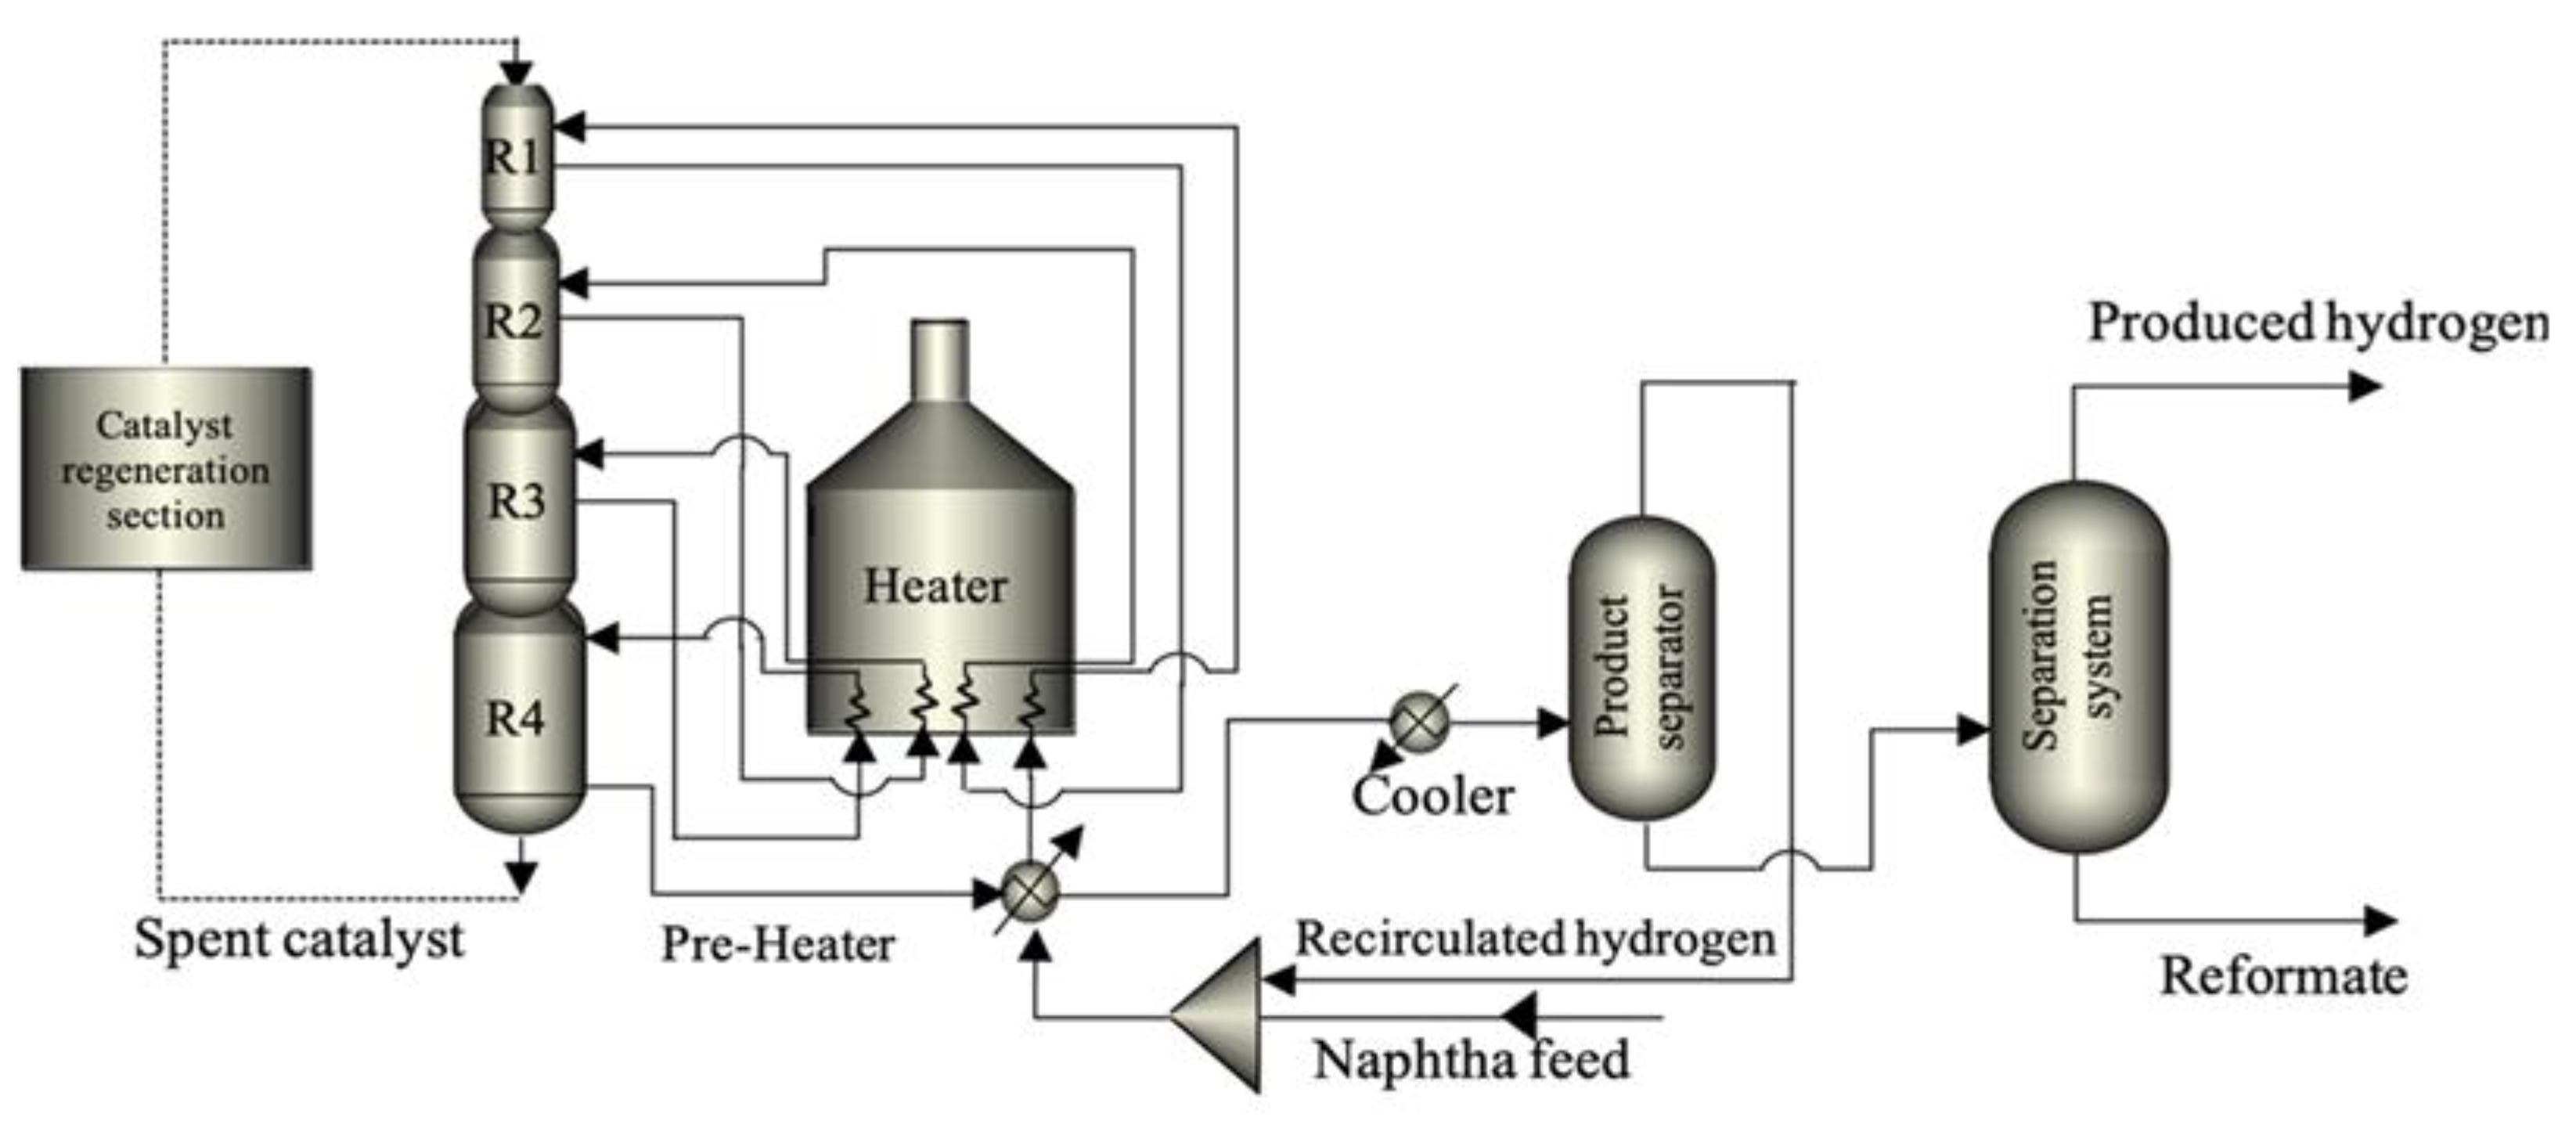
Figure 1. CCR process diagram of the NCR (redrawn from [24]).
Chemengineering 09 00021 g001
Figure 2. Schematic diagram describing the mass balance of benzene emissions.
Chemengineering 09 00021 g002
Figure 3. Graphics showing the main effects of the independent variables (T, H2/HC, F, and P) on the dependent variables of reformed naphtha: (a) the content of aromatic compounds [A% (v/v)]; (b) the content of benzene [B% (v/v)], and (c) the Research Octane Number (RON).
Chemengineering 09 00021 g003
Figure 4. Semi-regenerative pilot plant of the NCR process.
Chemengineering 09 00021 g004
Figure 5. Surface response plots of (a) octane index (RON); (b) volumetric composition of aromatic compounds [A% (v/v)]; and (c) volumetric composition of benzene [B% (v/v)].
Chemengineering 09 00021 g005
Figure 6. Operative zones from objective variables, highlighting the “optimization zone” in white.
Chemengineering 09 00021 g006
Figure 7. Transitional operative routes (TORs) used to minimize the benzene content and maximize the RON of the reformate: (a) route 1; (b) route 2; (c) route 3; (d) route 4; (e) route 5, and (f) route 6.
Chemengineering 09 00021 g007
Figure 8. Intersection diagram for locating the optimal operative zone.
Chemengineering 09 00021 g008
Figure 9. Multivariate surface response plots for industrial, pilot plant and optimum calculated operational states of (a) RON values; (b) composition of aromatic compounds [A% (v/v)]; and (c) benzene content [B% (v/v)].
Chemengineering 09 00021 g009
Table 1. Evaporative factor values related to gasoline releases during logistic operations.
Evaporation DuringEvaporative Loss (% v/v)Reference
Tank storage6.7[41]
Ducts transportation2.5[42]
Other transportation means0.4[43]
Dispensing at gasoline stations0.5[44]
Table 2. Scenario analysis of estimated benzene emissions.
Gasoline Benzene Content
% (v/v)
Total Gasoline
Production to be Sold (KBPD)
Total Benzene Emissions
(KBPD)
Total Benzene Content of
Dispensed Gasoline
(KBPD)
0.75671.080.894.27
1.00670.981.014.80
1.50670.741.255.87
2.00670.541.486.94
Table 3. Value levels of independent variables for the experimental design of simulations.
Operative VariableUnitsValues
LowMediumHigh
Temperature (T)°C457.0480.0503.0
H2/HC molar ratiomol/mol2.04.06.0
Table 4. Response variables of the NCR process.
Dependent VariablesSymbolUnits
Octane indexRONDimensionless
Volumetric fraction of aromatic compoundsA%% (v/v)
Volumetric fraction of benzeneB%% (v/v)
Table 5. Regression coefficients of quadratic surface response models and correlative values for each multivariate mathematical model.
yic0c1c2c3c4c5r2
RON59.906−0.1559−2.27834.52 ×10−40.02340.0021 0.9758
A% (v/v)−315.41.184−3.422−9.30 ×10−40.01540.00280.9614
B% (v/v)13.10−0.07410.04231.02 ×10−4−0.00710.00010.9948
Table 6. TORs assessment regarding each response variable.
TOR No.Average Estimated Values Across Each TOR
RONA% (v/v)B% (v/v)Average Position
184.491 (1)29.211 (1)1.410 (6)2.666
281.365 (6)27.198 (6)0.929 (1)4.333
383.540 (3)28.997 (3)1.227 (4)3.333
483.526 (4)28.981 (4)1.226 (3)3.666
582.871 (5)28.297 (5)1.170 (2)4.000
683.941 (2)29.077 (2)1.306 (5)3.000
Maximum values
of the response variables
89.87137.3951.488
(Position) is the relative position of the value generated from each TOR for each response variable.
Table 7. Comparison of simulation results against experimental data from the pilot plant.
DayData OriginRONVolumetric Fraction [% (v/v)]
n-ParaffinsAromaticsNaphthenesBenzene
1Simulation77.5465.3113.5419.610.28
Experiments79.5068.9512.9018.120.31
2Simulation84.0356.2024.3015.920.83
Experiments85.9360.4821.0317.540.77
3Simulation92.2550.9136.547.491.98
Experiments90.3354.5633.018.381.87
Correlation coefficient (r2)0.98440.99870.99960.96930.9995
Table 8. Comparison of the operative conditions and values of the response variables for the industrial scale, with simulation results and pilot plant experimental data.
VariablesData from the
Industry
Experimental Data
from the Pilot Plant
Results from Simulation
Independent
Temperature (°C)442.9–498.7430.0–500.0482.0–491.0
H2/HC ratio (mol/mol)2.0–5.22.0–4.02.0–3.5
Objective
Aromatics [A% (v/v)]38.47–58.412–3630–40
Benzene [B% (v/v)]2.580.28–1.980.75–1.5
RON83.2–92.877.0–92.087.0–94.0
Table 9. Summary of results of operative points compared between industrial, pilot plant and optimum simulated conditions.
VariablesOperative Points
IndustrialPilot PlantOptimum Simulated
Temperature (°C)498.7500491
H2/HC (mol/mol)5.003.002.00
Aromatics [A% (v/v)]34.563637.39
Benzene [B% (v/v)]1.81.51.48
RON919289.87
Table 10. Comparison of optimization results with those from previous studies.
VariableUnitsReported DataReferenceThis Work
Operative
State
Optimum
Result
Operative
State
Optimum
Result
Temperature°C510514.67[60]482–491491
400479.6 (R1)
478.5 (R2)
500.0 (R3)
[59]
H2/HC ratiomol /mol2.122.05[60]2.00–3.502.00
NRNR[59]
A%(v/v)53.0253.86[60]30–40
%(v/v)
37.39
%(v/v)
%(wt)56.0045.00[59]
B---NRNR[60]0.75–1.50
%(v/v)
1.48
%(v/v)
%(wt)4.003.08[59]
RON---99.3099.70[60]87–9489.87
92.7091.80[59]
(R1), (R2), (R3) reactors 1, 2, and 3. NR: Not Reported.
Table 11. Qualitative comparison between industrial and computational/experimental decision-making to produce low-benzene gasoline.
Decision
Issue
Decision Making
Traditional
Industrial Approach
Computational/
Experimental Approach
TemperatureTo maintain stable values under controlled conditions, avoiding catalyst severity.To analyze the optimum transition pathways for reaching fuel quality goals.
H2/HC
ratio
To adjust only when the feedstock flowrates change.To analyze the optimum TORs for promoting selected reactions.
Benzene
content
To keep it within environmental regulations.To minimize the benzene content, even under regulated limits, whilst assuring the reformate quality.
Aromatics
content
To maintain concentration levels, favoring the final RON of the reformate.To achieve an adequate concentration by increasing alkylated aromatics without increasing the benzene content.
RONTo reach the highest possible value.To obtain a reasonably high value that can be complemented at the final gasoline blend, without increasing the benzene content.
Catalyst
lifetime
To extend it as much as possible.To avoid polymerization reactions and coke formation from the analysis of operative conditions.
Coke
formation
To solve it in the regeneration unit.To minimize coke formation by controlling the operative conditions in the reactor.
SelectivityTo be assessed only if the RON of gasoline is not achieved.To promote selectivity from a kinetic analysis by assessing the operative conditions with process simulation.
Disclaimer/Publisher’s Note: The statements, opinions and data contained in all publications are solely those of the individual author(s) and contributor(s) and not of MDPI and/or the editor(s). MDPI and/or the editor(s) disclaim responsibility for any injury to people or property resulting from any ideas, methods, instructions or products referred to in the content.