Article

Experimental Investigation of Liquid Holdup in a Co-Current Gas–Liquid Upflow Moving Packed Bed Reactor with Porous Catalyst Using Gamma-Ray Densitometry

1
Linda and Bipin Doshi Department of Chemical and Biochemical Engineering, Missouri University of Science and Technology, Rolla, MO 65401, USA
2
Kuwait Institute for Science Research, P.O. Box 24885, Safat 13109, Kuwait
3
Applied Chemistry and Engineering Research Center of Excellence (ACER CoE), Mohammed VI Polytechnic University, Lot 660, Hay Moulay Rachid, Ben Guerir 43150, Morocco
*
Author to whom correspondence should be addressed.
ChemEngineering 2024, 8(3), 54; https://doi.org/10.3390/chemengineering8030054
Submission received: 23 November 2023 / Revised: 2 March 2024 / Accepted: 7 May 2024 / Published: 23 May 2024

Abstract

:
This study explores the dynamics of liquid holdup in a lab-scale co-current two-phase upflow moving packed bed reactor, specifically examining how superficial gas velocity influences the line average external liquid holdup at a fixed superficial liquid velocity. Utilizing gamma-ray densitometry (GRD) for precise measurements, this research extends to determining line average internal porosity within catalyst particles. Conducted with an air–water system within a bed packed with 3 mm porous particles, the study presents a novel methodology using Beer–Lambert’s law to calculate liquid, gas, and solid holdups and catalyst porosity that is equivalent to the internal liquid holdup that fills the catalyst pores. Findings reveal a decrease in liquid holdup corresponding with increased superficial gas velocity across axial and radial locations, with a notable transition from bubbly to pulse flow regime at a critical velocity of 3.8 cm/sec. Additionally, the lower sections of the packed bed exhibited higher external liquid holdup compared to the middle sections at varied gas velocities. The liquid holdup distribution appeared uniform at lower flow rates, whereas higher flow rates favored the middle sections.

1. Introduction

Improving the quality of light products and the increasing demand for heavy oil in compliance with strict environmental concerns have become a challenge for petrochemical refineries. Catalytic hydroprocessing is considered one of the most promising technologies for the conversion of heavy oils into high-value products, which is a well-known technology to remove undesirable components (sulfur, nitrogen, organometallic, etc.) from hydrocarbon feed streams and has been extensively utilized nowadays in refineries worldwide [1]. In hydrotreatment processes, the main issues are the catalyst life and performance limitation because the impurities can deposit on the catalysts resulting in rapid loss of its activity [2]. Under high temperatures and pressure, coking, poisoning, and sintering could cause serious agglomeration and maldistribution leading to unexpected unit shutdowns. Various designs of residue hydrotreating reactors have been described in the literature for treating heavy feedstocks [3]. There are some commercial designs such as moving bed of catalyst (MBR), (U.S. Pat. No. 5,076,908), fixed bed reactor (FBR) (U.S. Pat. No. 3879642 A), Ebullating catalyst bed (EBR), (U.S. Pat. Nos. 4,571,326 and 4,744,887) have been reported in the last few decades. The fixed bed systems deal with middle distillate feed, but they cannot deal with every residuum feed that is available. Heavy hydrocarbon feedstock with highly metallic contaminations (>250 ppm) makes the fixed bed catalytic hydrotreating system inefficient because the deposition of metals on the catalyst will result in a rapid loss of hydrogenation activity [4]. However, high-metal feeds are always the most economically attractive because of their relatively lower price. To deal with drastic changes in heavy petroleum feed properties, moving bed technology has been developed [5]. In general, the upflow moving bed reactor has a conical bottom part that allows the replacement of the deactivated catalysts with fresh new catalysts. The removed catalysts can be reprocessed and reinjected later on mixed with fresh catalyst from the top of the reactor. In this case, the upward flow fluid with a slight bed expansion could avoid coking and plugging and reduce the pressure drop of the system to some extent [5,6]. The advantages of the upflow moving packed bed reactors are the increased utilization of catalysts characterized by a slight back mixing for both the catalyst and the feedstock, providing a better quality of products and higher efficiency of the process than that of an ebullated bed reactor [7,8], and the periodic replacement of spent catalyst without shutdown. The moving bed configuration offers a relatively large catalyst migration time in comparison with the liquid mean residence time, so it can be considered as a pseudo two-phase (gas–liquid) upflow with a fixed bed [9]. Therefore, for the sake of the hydrodynamics study, the moving bed reactor can be investigated as a two-phase upflow packed bed reactor. The liquid holdup in upflow moving packed bed reactor is one of the important design and operating hydrodynamic parameters. Its measurement is essential to get a better understanding of the prediction of pressure drop, mass, and heat transfer mechanisms since the liquid serves as a transport of mass and heat to and from the catalyst particles. Moreover, the upflow packed bed reactor offers advantages for liquid-limited reaction [10]. For exothermic reactions, a higher liquid holdup and well distribution ensure complete wetting efficiency and better temperature control, thus contributing to the prevention of hot spot formation and thermal instabilities. A two-phase upflow packed bed reactor could be a satisfactory alternative to the classical trickle bed reactor for liquid-limited reactions because of increased gas and liquid interactions, thus increasing the effectiveness of contact, leading to better heat transfer and higher overall mass transfer coefficient [11]. For porous catalytic packed bed reactors, the total liquid holdup ( ε l , t ) means the overall volume of the liquid phase divided by the reactor bed volume. The total amount of liquid consists of two parts, which are dynamic liquid ( ε l , d ) and static liquid ( ε l , s t ). The static liquid includes the liquid inside the porous catalyst (internal static liquid, ε l , s t _ i n t ) and the stagnant liquid attached between the catalyst particles (external static liquid, ε l , s t _ e x t ). The dynamic liquid refers to the freely flowing liquid under operating conditions. Experimental data on the overall liquid holdup or saturation (liquid volume divided by the void volume of the reactor bed) can be obtained by various techniques, such as drainage [12], weighing [13], tracer methods [14], and electric capacitance tomography (ECT) [15]. The liquid holdup measurement techniques can be divided into integral, semi-integral, and local measurement methods [16]. Integral methods provide liquid holdup information over the entire volume of the packed bed; these methods include the draining, weighting, and tracer methods. Semi-integral measurement methods provide liquid holdup information over a section or a line integral of the packed bed, which includes radiation methods (e.g., gamma-ray and X-ray) that can be applied at many axial and radial positions to get line-averaged information. The local measurement methods provide local liquid information by inserting a sensor (e.g., electromagnetic radiation) or a probe (e.g., optical fiber). Probes can be used inside the packed bed at different positions or using time-averaged tomography (gamma-ray computed tomography) or instantaneous tomography (X-ray or electrical capacitance resistive tomography). However, liquid draining and tracer methods can only provide the average holdup for the whole packed column. They cannot offer any information on how the liquid is distributed in the packing bed [5]. In fact, the liquid holdup can vary significantly with spatial position, and this information is critical for a better understanding of flow hydrodynamics and mass transport in packed columns. In gas–liquid–solid systems where the catalytic bed is dense and opaque, it is hard to implement instrumentation inside three-phase systems. While noninvasive methods such as advanced radioactive measurement techniques eliminate the disturbances in the fluid flow during the measurements [17], these techniques can determine the flow distribution over the whole reactor section with good spatial resolution and are not intrusive [18,19,20]. The radiation method is based on the attenuation of the radiation beam as it passes through an absorption medium, which can be obtained by Beer–Lambert’s equation. Non-invasive techniques have become the tools of choice for detailed flow structures within porous media, unlike the more traditional interfering probes inserted within flows [15]. Since the catalytic packed bed is opaque, some noninvasive visualization techniques such as Digital Particle Image Velocimetry (DPIV) and Laser Doppler Anemometry (LDA) which are light-based techniques cannot measure the liquid–gas holdup distribution over its cross-section. Compared with other radiation techniques, the gamma-ray technique is well developed and more versatile because gamma-rays have strong energy to penetrate wide ranges of material and can be chosen depending on the test section used [21]. Therefore, gamma-ray approaches have played a major role and have become the tools of choice in the measurement technology for gas–liquid two-phase systems and gas–liquid–solid three-phase systems [22]. A summary of the literature review on the hydrodynamics studies of upflow packed bed is given elsewhere [23,24]. However, to the best of our knowledge, there are no studies reported in the literature that have studied liquid holdup in two-phase upflow moving beds with a conical bottom. The attenuation of the gamma radiation is mostly due to the presence of the liquid and solid compared to gas in the flow. Thus, information on the two-phase (liquid–gas) distribution can be obtained for flow over a fixed bed of catalyst, as the attenuation due to the catalyst will be fixed and the variation in attenuation is due to the flowing liquid. Qi et al. (2020) [25] studied dynamic liquid holdup in a trickle bed reactor (characterized by downward two-phase flow in a packed bed) filled with quadrilobe porous catalysts, using gamma-ray computed tomography (CT). They developed a method to measure the cross-sectional distribution of both dynamic liquid holdup and the combined liquid holdup inside the catalyst pores and the static liquid holdup between the catalyst joints. These measurements were validated through phantom of known dimensions measurements. They measured the cross-sectional distribution of the combined porosity of the catalyst that reflects the internal static liquid holdup within the catalyst pores relative to the bed volume and the external static holdup at the particles’ contact points. However, in this work we used our gamma-ray densitometry (GRD) technique that consists of one collimated detector and one collimated gamma-ray source (Cs-137), which is a simpler and industrially used technique compared to gamma-ray tomography (CT) [22,26], and developed a simplified method to measure and investigate the diameter profile of the line average solid holdup, void fraction, liquid holdup, gas holdup, and internal static liquid holdup inside the porous catalyst (where the external static liquid holdup could be neglected). For the cold flow laboratory packed bed used in this study, the column was packed randomly with commercial spherical catalyst. The flow conditions were scaled down from the industrial operation conditions. Owing to the distinct advantages of GRD, we employed it for the first time to measure the line average liquid holdup in a co-current gas–liquid upflow moving packed bed reactor operated under scaled-down flow rates of the industrial operating conditions.

2. Materials and Methods

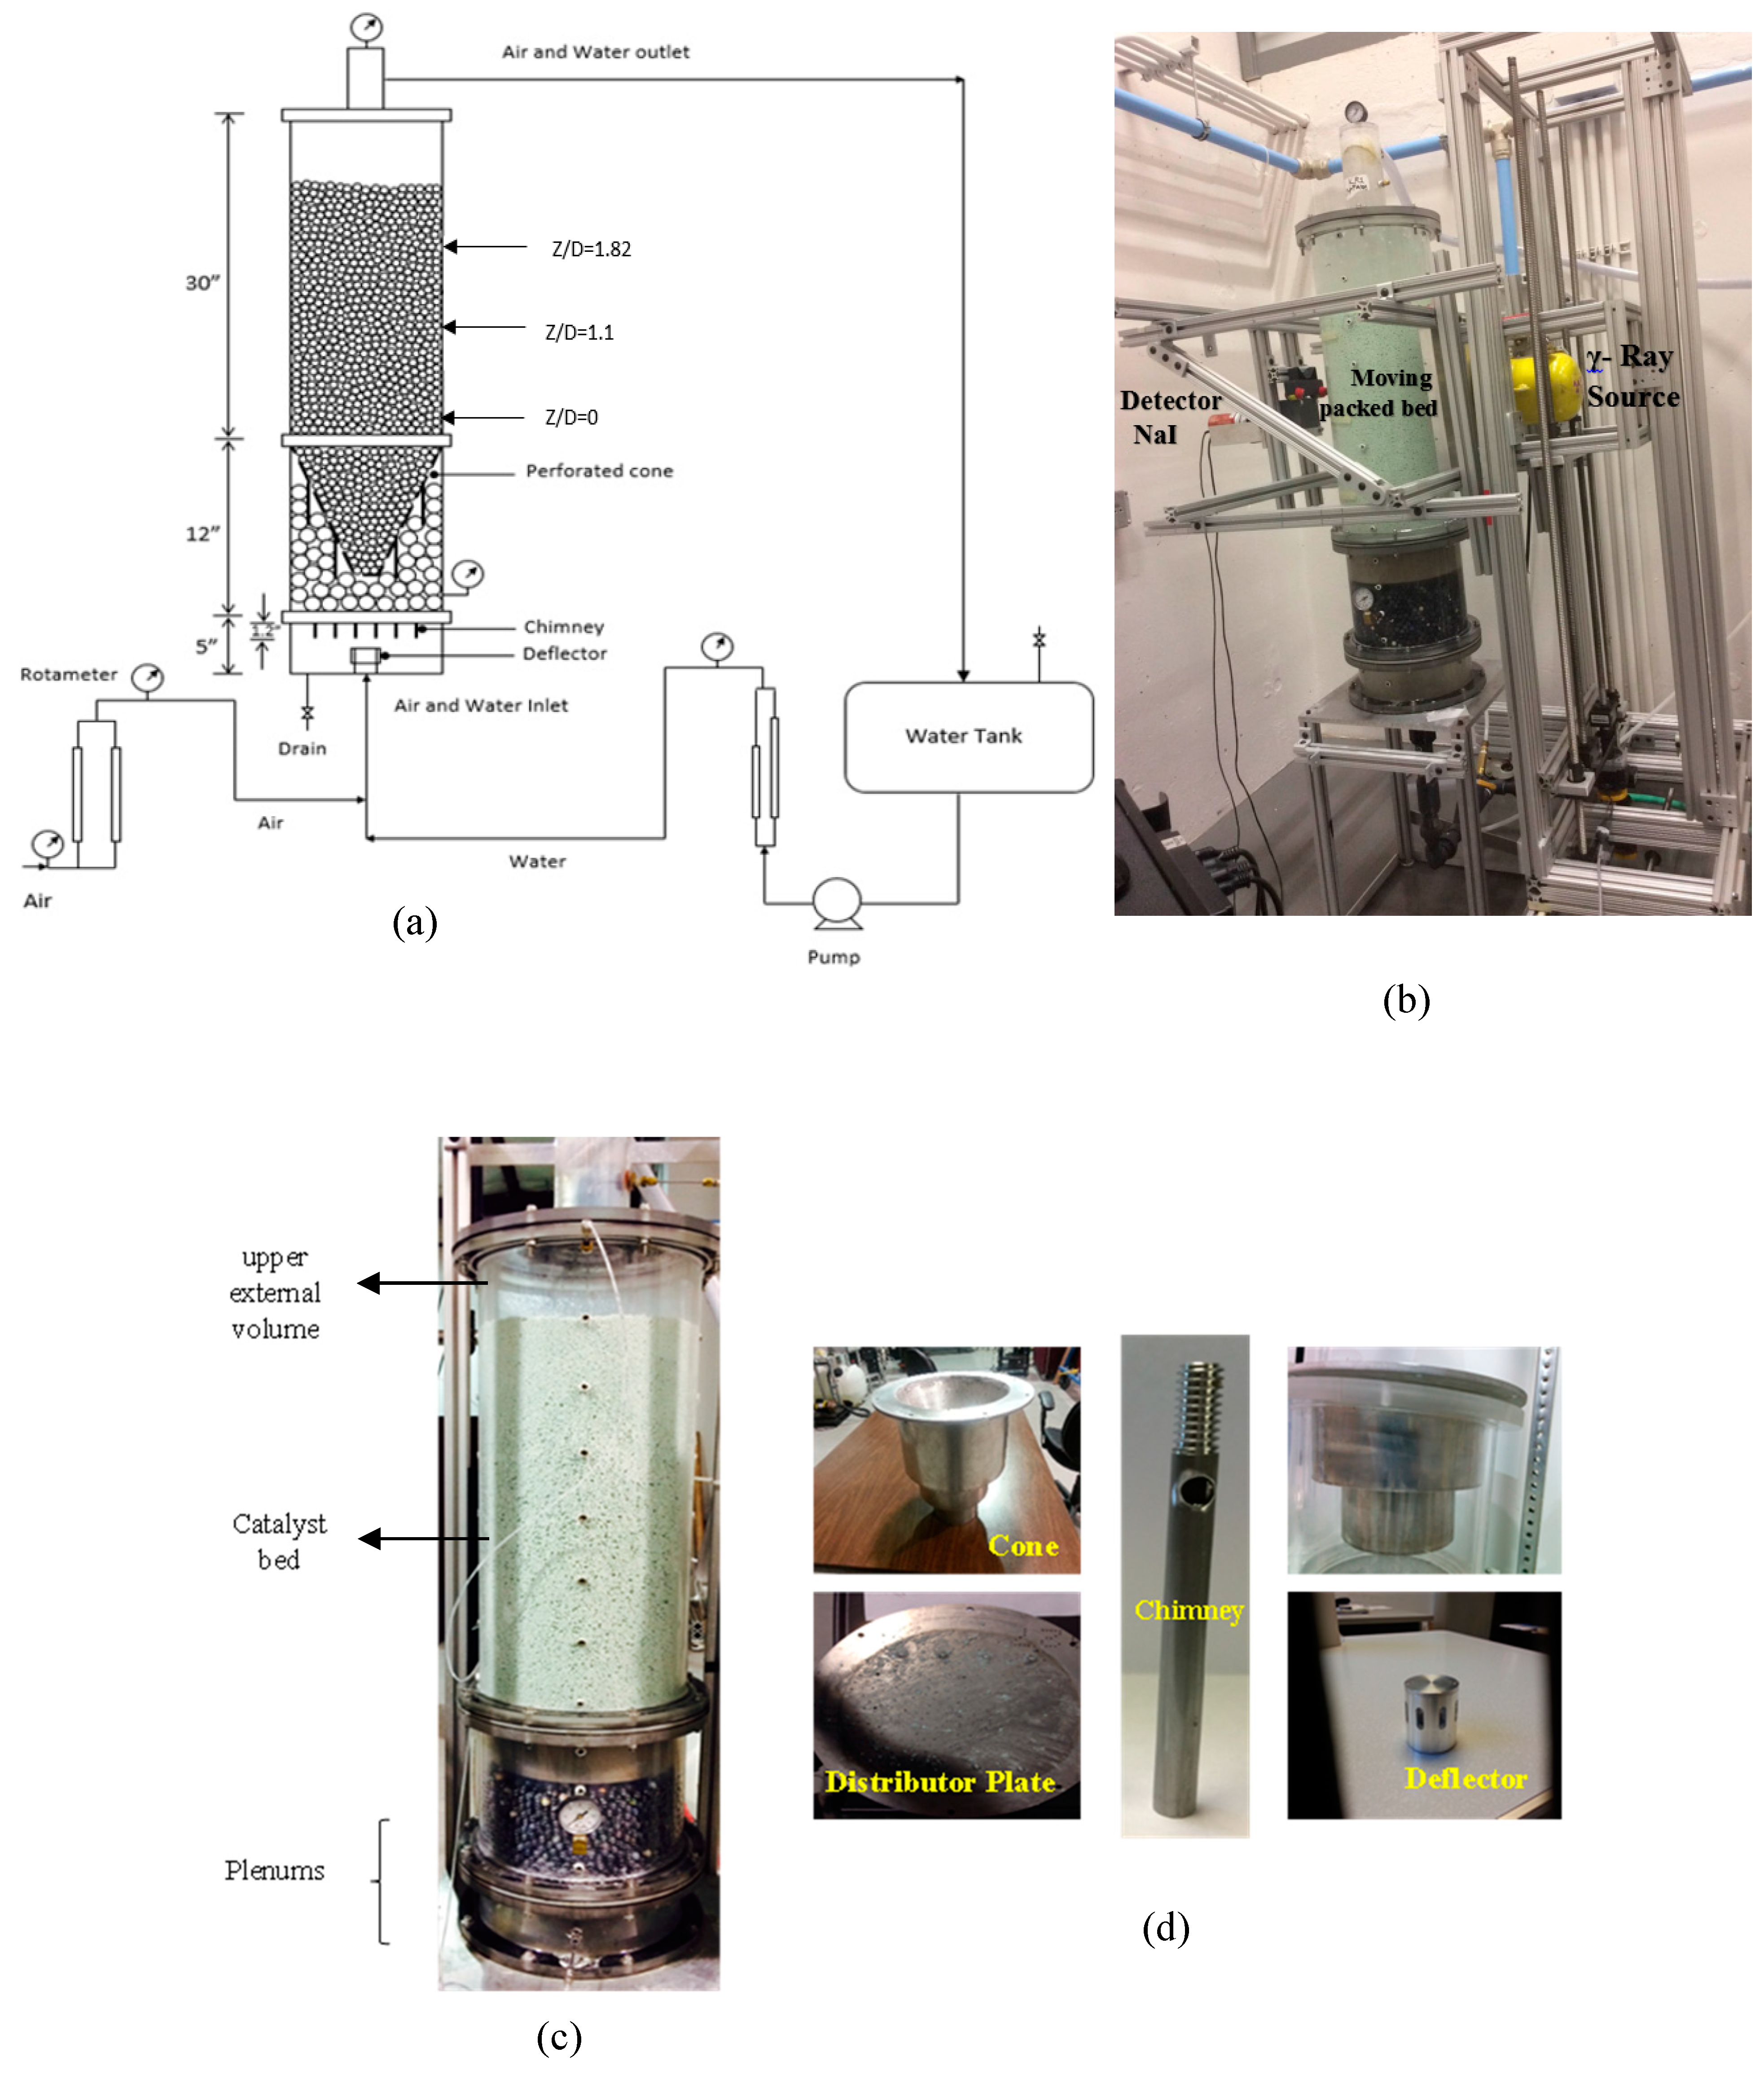
2.1. Experimental Setup

The experimental setup used in this study is a scaled-down version of an industrial upflow moving packed bed reactor, meticulously designed in accordance with the principles of similarity for hydrodynamics and geometry to mirror the essential hydrodynamic characteristics of its full-scale counterpart. We matched the Liquid Hourly Space Velocity (LHSV) to establish flow parameters and determine liquid flow rates, while gas flow rates were aligned with the industrial reactor’s liquid–gas ratio. Detailed scaling procedures are discussed in V. Alexander’s thesis [27]. The setup consists of a Plexiglas-packed bed column, a gas-supplying rotameter, a liquid cycling tank, and a pump. Its dimensions are 57 inches in height and 11 inches in internal diameter. Figure 1 presents the schematic of the experimental setup and the actual photos of the moving packed bed. At the base of the setup, the structure is divided into two primary sections: a gas–liquid distributor plenum and a perforated cone. The plenum features a deflector designed to evenly disperse the incoming mixture of gas and liquid phases. This deflector is strategically placed at the plenum’s base to ensure thorough distribution. To mitigate any initial maldistribution in the plenum and maintain consistent phase distribution into the column, a specially designed gas–liquid distributor equipped with a chimney is positioned between the plenum and cone sections. This distributor includes 19 holes, each with a diameter of 0.1 inch and a height of 1.2 inches, allowing liquid to pass through. Additionally, each chimney possesses a side hole (pitch) at the top, measuring 0.03 inches in diameter, facilitating gas passage. The cone section, situated between the packed bed and plenum sections, contains glass marbles within the space between the column wall and the perforated cone wall, forming a conical frustum distributor. This arrangement, along with the conical frustum in the cone section, is designed to provide a uniform upflow of phases into the catalyst bed and ensure stable bed operation. The design and photos of the internals are presented in Figure 1, and more details are given elsewhere [27]. The packed bed section, serving as the test area, is located above the cone section. It is randomly packed with a 3 mm diameter porous spherical catalyst of a bulk density of ≈570 kg/m3, commonly used in the industry, extending up to 24 inches in height. The conical frustum supports the catalyst bed. In this setup, both gas and liquid flow concurrently and upward through the bed particles. For the experiments, tap water and oil-free compressed air were used as the liquid and gas feedstocks, respectively, sourced directly from the laboratory’s supply lines. The experimental conditions were carefully controlled, with the experiments being conducted at room temperature and pressure. A wide range of superficial gas velocities were tested, while the liquid superficial velocity was fixed based on the scaled-down velocity of an industrial hydrotreating unit, as summarized in Table 1. To obtain detailed measurements, gamma-ray densitometry (GRD) was employed at different axial heights of the bed. These included the bottom (Z/D = 0.3) and the middle (Z/D = 1) sections. The horizontal measurement step was set at 1 inch, including r/R = 0, 0.3, 0.5, 0.7, and 0.9, to cover the diameter profile along the bed under normal conditions, as shown in Figure 1. For quantitative analysis, each data point was measured thrice, and the average gamma-ray intensity value was recorded. The GRD system was moved horizontally for scanning once stable operation was achieved, performing scans along several chord lines parallel to the column’s diameter under various operating conditions, as illustrated in another figure. Eleven specified positions were evenly distributed along the column’s diameter, each separated by a 1-inch interval. The middle and bottom parts of the bed remained in a packed state. However, as observed visually, the top part may exhibit some catalyst movement [21,22]. The liquid holdup in the packed bed was evaluated using GRD at the same axial levels as the flow scans [23,24]. However, due to the dynamic movement of the three phases at the top section of the bed, dual sources were required for accurate measurement, highlighting the complexity of the experimental setup. The results for the liquid holdup, particularly at the bottom and middle sections of the bed, are detailed and discussed in the Results and Discussion Section.

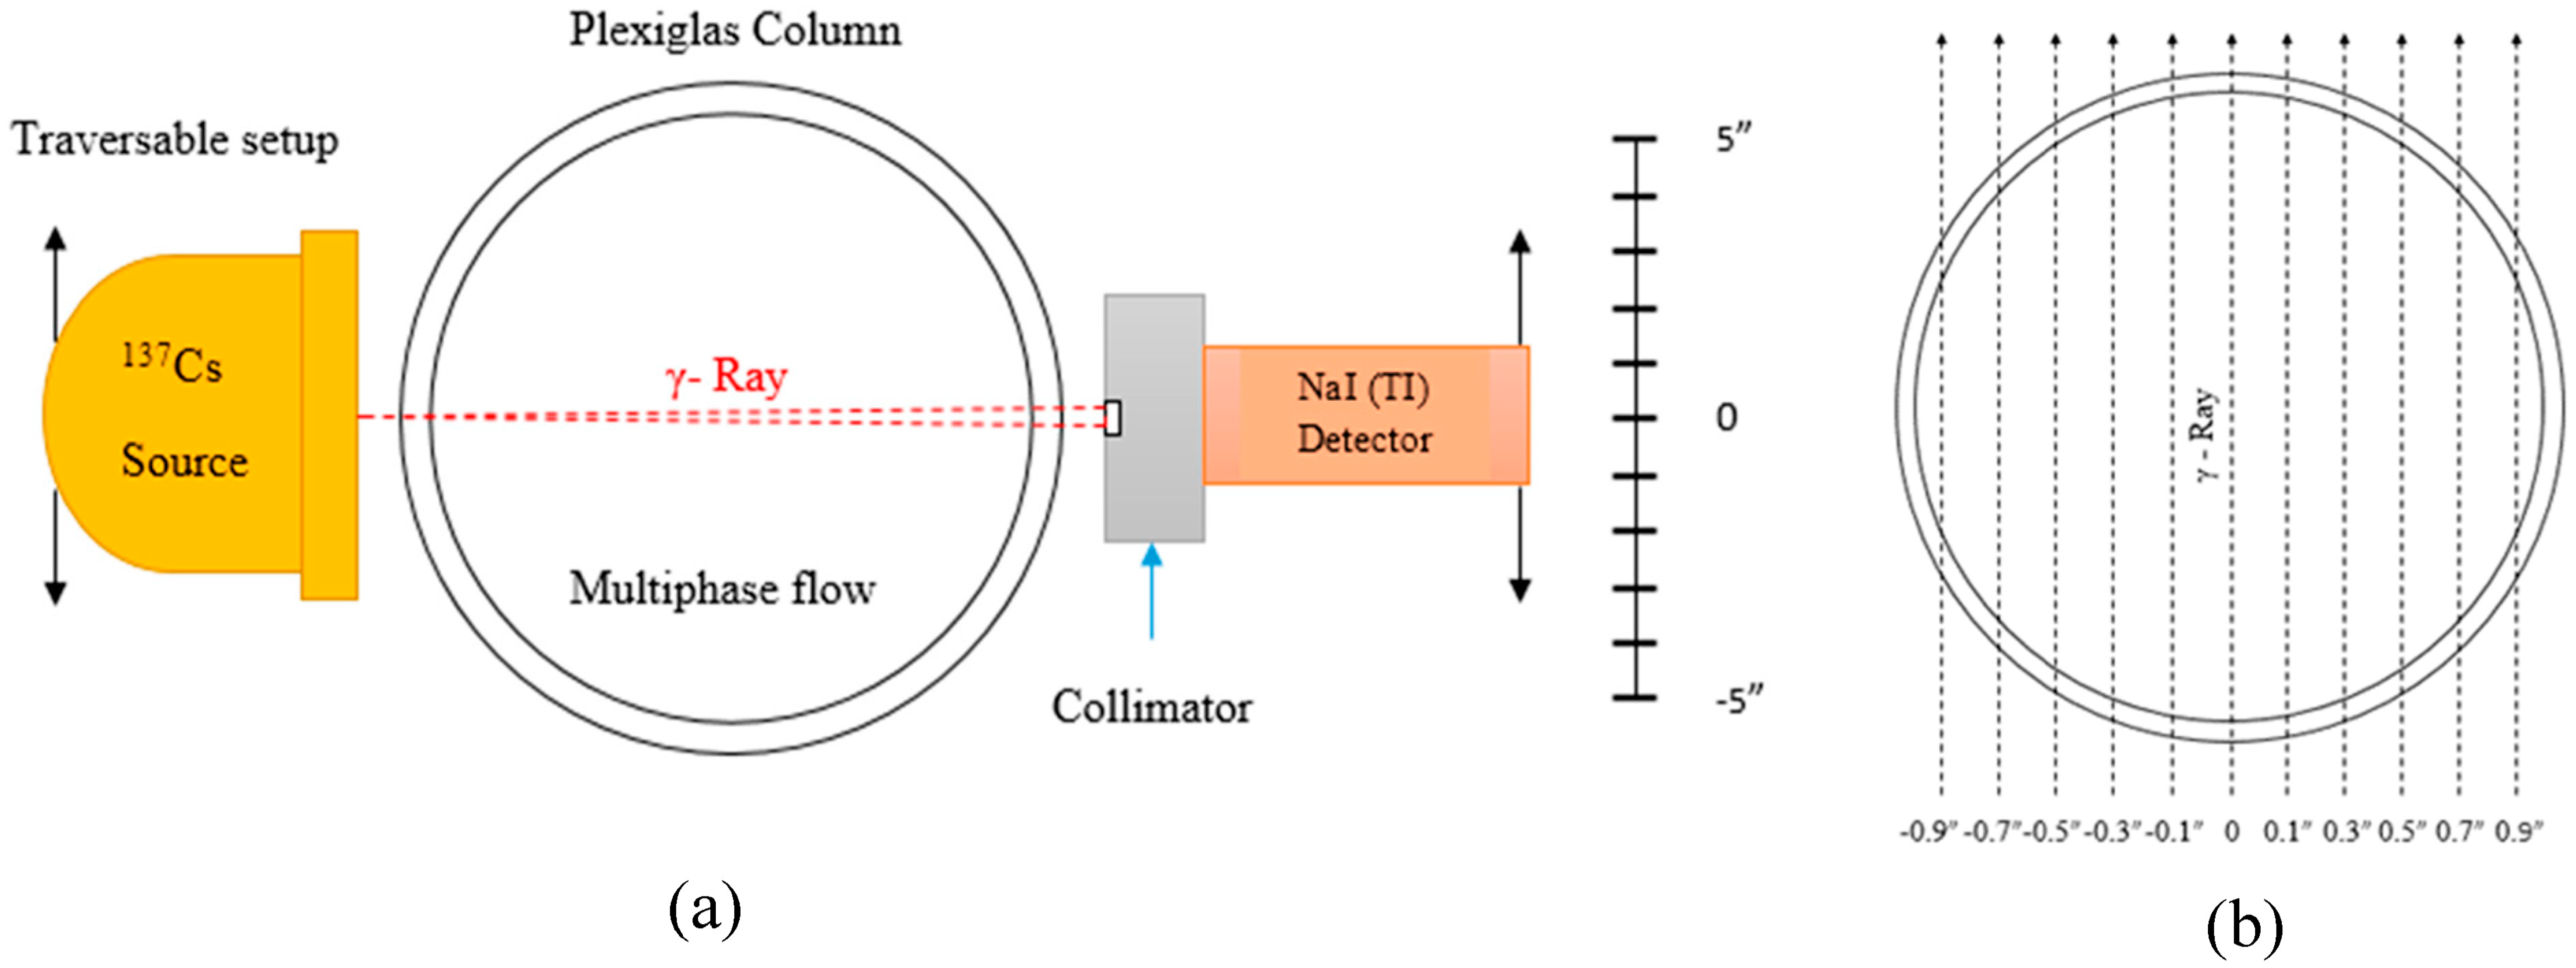
2.2. The Measurement Technique

Gamma-ray densitometry (GRD) was used in this work to obtain the line average phase holdups, enabling maldistribution identification and discerning various flow regimes. A comprehensive methodology for the GRD technique has been implemented for the measurement of the dynamic liquid holdup and static holdup integrated with the static holdup model. The GRD technique comprises an encapsulated 250 mCi Cs-137 gamma-ray source with an energy of 660 keV, a collimated NaI scintillation detector, and an online data acquisition system. The gamma-ray source and the detector face each other, and their positions can be adjusted both vertically and horizontally to span the column through a computerized system and structure, as shown in Figure 2. Collimation of the gamma-ray source is achieved through the use of a small aperture, creating a focused beam that penetrates the column section and is detected by the collimated detector, which utilizes a 1 mm aperture in a 1-inch-thick lead piece. The radiation that is transmitted and subsequently captured by the detector is integral to the measurements taken. For data acquisition, an Osprey USB interface is used, integrated with a higher-voltage power supply (HVPS), a preamplifier, and a digital multi-channel analyzer (MCA). Due to its favorable efficiency and energy resolution, a thallium-activated sodium iodide (NaI (Tl)) detector is widely employed for the detection of gamma-rays and other ionizing radiations. Photons imping on the scintillation detector induce impulse signals via a sensitive photomultiplier tube. Once collected, these signals are amplified and shaped by the amplifier and discriminated against by the MCA, which sets a specific threshold to translate radiation intensity into a measurable analog signal for further analysis. The ProSpect® Gamma Spectroscopy Software is then used to analyze the detector’s count data. The principle of the attenuation of gamma-rays in matter is harnessed by GRD, where the degree of residual radiation that reaches the detector is indicative of the material’s density through which the gamma-ray has passed. The principle suggests that a low-density absorber will attenuate less radiation compared to a high-density absorber due to a higher probability of interaction with the radiation. The variation in the amount of residual radiation that is detected is indicative of different flow regimes within the column, reflecting their unique properties. In our analysis, we collected photon count data over a 2 min duration at a sampling rate of 25 Hz, yielding around 3000 data points for each measurement. The attenuated radiation passing through the column material varying with the flow’s density was recorded, and valuable data on flow dynamics as phase distribution and holdups were measured, providing insights into the complex behaviors of multiphase flow within the reactor. Without flow (dry conditions), photon counts were relatively high, indicating lesser attenuation as the radiation was primarily absorbed by the solids and the column wall. Upon introducing flow, particularly increasing superficial gas velocities while maintaining a constant liquid velocity, the signal’s character shifted, showing wave-like fluctuations with photon counts ranging from 60 to 100. This variation is linked to the presence of gas and liquid phases and the transition to a pulse flow regime, where the interplay between gas and liquid phases creates more complex interactions, leading to signal instability. As the gas velocity rose, the signal exhibited larger fluctuations due to the increased presence and size of bubbles, which significantly affected the attenuated path of γ-rays. This nuanced response underlines the system’s sensitivity to changes in flow conditions and underscores the utility of photon count data in assessing flow behavior and properties. More details on the signal analysis supported by raw data can be found elsewhere [24,27]. The GRD technique has been rigorously validated and calibrated against a precisely designed phantom, consisting of three acrylic glass columns with predetermined wall thicknesses. This calibration process, facilitated by a bin, was essential for adjusting the detector’s signal and accurately estimating the total wall thickness. Similarly, a comparable phantom was employed in validating and calibrating gamma-ray computed tomography, as Qi et al. [25] detailed.

2.3. The Principle of the Holdups’ Measurements and the New Methodology for Measuring External and Internal Liquid Holdups and Catalyst Porosity

As mentioned earlier, the principle of the gamma-ray densitometry technique measurement for the holdups and bed structure is based on the absorption of gamma radiation along the beam path as it passes through the tested material [23]. The attenuation of the gamma-ray beam depends on the radiation energy of the source, the density and the thickness of the absorbing material that the radiation beam passes through, and the mass attenuation coefficient (Al-Dahhan 2009) [19,24]. This dependency of the reduction in the radiation intensity from I₀ (at the source) to I can be described by Beer–Lambert’s law according to the following equation [25].
I = I 0 e μ ρ L
This equation states that the intensity of the detected radiation I is directly proportional to the intensity of the incident radiation I 0 , and varies exponentially with the thickness of the absorbing medium L and its density ρ and the mass absorption coefficient μ . The attenuation ratio ( ln I 0 I ) is called ( A ), and can be calculated by the natural logarithm sum of the measured attenuation I and I 0 along the gamma-ray beam bath [28] as follows:
A = ln I I 0 = μ ρ L
A = ln I o I = μ ρ L
Equation (2) is the general form of the GRD beam attenuation by different materials. Hence, the attenuation ratio will be different by introducing two phases inside the column, where ( I 0 ) is the incident radiation intensity and ( I ) is the detected radiation intensity, which is different for each scan and depends on the constituting materials of the attenuating medium. Once the attenuation ratio ( A ) is obtained for each case, the line average holdup of the phases can be estimated as discussed below. As mentioned earlier, the study utilizes a three-phase system with a stationary solid catalyst and both gas and liquid phases flowing co-currently upward. Hence, the attenuation ratio ( A ) will be the summation of the line attenuation of the individual phases. For three phases in the operation of gas–liquid–solid system, the attenuation ratio ( A ) will be:
A s l g = ln I 0 I s l g = μ s ρ s l s + μ l ρ l l l + μ g ρ g l g
where
μ s , μ l , and μ g : mass attenuation coefficient of solid, liquid, and gas in ( c m 2 g ).
ρ s   ρ l , and ρ g : density of solid, liquid, and gas, respectively, in ( g c m 3 ).
l s = length occupied by solid (catalyst) among the total length ( c m ).
l l = length occupied by liquid (water) among the total length ( c m ).
l g = length occupied by gas (air) among the total length ( c m ).
L = total length that is occupied by the gas, liquid, and solid along the GRD beam path, including the length of air outside the column ( c m ) and the thickness of the column wall.
Since the path of air outside the column and the column wall are the same in each scan that we performed, and these will be canceled in the steps of manipulating the equations, the attenuation due to this medium and lengths are not included in the following equations. Therefore, in the following equation and their manipulation, only the materials inside the column of solid, gas, and liquid are included.
where: L = l s + l l + l g , l s = ε s L , l l = ε l L , and l g = ε g L ,
ε s , ε l , and ε g = the holdup for solid, liquid, and gas, respectively.
The attenuation ratio ( A ) for the two phases will be as follows:
  • Gas–solid system:
A g s = ln I 0 I g s = μ g ρ g l g + μ s ρ s l s
  • Liquid–solid system:
A l s = ln I 0 I l s = μ l ρ l l l + μ s ρ s l s
  • Gas–liquid system:
A g l = ln I 0 I g l = μ g ρ g l g + μ l ρ l l l
The attenuation ratio ( A ) for a single phase will be as follows:
  • Gas phase:
A g = ln I 0 I g = μ g ρ g l g
  • Solid phase:
A s = ln I 0 I s = μ s ρ s l s
  • Liquid phase:
A l = ln I 0 I l = μ l ρ l l l
In this study, a new methodology is developed for gamma-ray densitometry (GRD) to measure the line average external void space and catalyst bed external liquid holdup (dynamic liquid holdup with neglecting external static liquid holdup) in void space and the line average internal porosity with respect to the bed volume of the catalyst which is equivalent to the internal liquid holdup. All GRD measurements are carried out at the same axial and radial locations, as mentioned in the experimental setup section, with different materials inside the column, as described below. All GRD scans contain the attenuation value of the column wall, which is constant. We removed the wall attenuation by subtracting the wall attenuation ratio ( A w a l l ) from each attenuation ratio ( A ). The catalyst bed was fixed during our experiment except for the top of the bed, where the catalysts are fluidized. Therefore, the liquid holdup, the void holdup of the bed, and the internal liquid holdup and porosity of the catalyst were measured by performing the following GRD scans, which follow a similar procedure to Qi et al. [25], but a simpler one since the line beam is used where the static external liquid holdup would be neglected:
I.
Without column.
II.
The empty column for the wall attenuation.
III.
The column is filled only with water for the liquid attenuation.
IV.
The column is filled with packed bed for a dry catalyst representing the attenuation of the gas and solid phases.
V.
The packed column is filled with water first, then it is drained where the scan was for a wet catalyst attenuation (internal liquid holdup in the pores + static liquid holdup if any).
VI.
The packed bed is filled with water representing both liquid and solid attenuation.
VII.
Scanning the gas–liquid–solid flow under the desired operation at the same position where the holdups for all three phases can be obtained.
GRD scanning procedures for different constituting materials and flowrate conditions were followed as reported by [5,29,30]. A new simpler methodology for gamma-ray densitometry (GRD) has been developed following Qi et al.’s [25] approach for gamma-ray tomography (CT) to accurately measure the line average liquid holdup in void spaces, and the liquid holdup within catalyst pores. The new method is processed as follows:
I.
Scanning without column (absorbing medium) I 0 (i.e., air only). In this scanning case, the GRD beam passes through the atmosphere from the source to the detector without any absorbing medium in between them. The obtained attenuation I is due to air only ( I g ) which represents the incident radiation ( I 0 ) [31]. The gamma-ray source is placed on one side, and the scintillation detector is on the other side.
A g = ln I 0 I g = μ g ρ g l g = ln I 0 I 0 = ln 1 = 0
II.
Scanning the empty column for the wall attenuation A c of plexiglass (air inside only, baseline). In this scanning case, the GRD beam passes through the empty column, and the attenuation is due to the wall of the column and the gas (air) inside it. The obtained attenuation I c is due to wall column and air. The mass attenuation coefficient of the air ( μ g ) is negligible compared to the Plexiglas ( μ c ), due to less interaction of air in comparison with Plexiglas. Hence:
A c = ln I 0 I c = μ c ρ c l c + μ g ρ g l g
A c = ln I 0 I c = μ c ρ c l c
where
I c : represents the attenuation coefficient due to the column wall.
III.
Scanning the column full of water for liquid attenuation A l (i.e., water inside only, liquid phase). In this scanning case, the same packed column is filled with water only in which the GRD beam passes through the column wall and the water. The obtained attenuation is due to the wall of the column and the liquid inside it:
A l c = ln I 0 I l c = μ l ρ l l l + μ c ρ c l c
Subtracting (Equation (10)) from (Equation (11)) yields the net attenuation of liquid ( A l ):
A l = A l c A c
A l = μ l ρ l l l + μ c ρ c l c μ c ρ c l c
A l = μ l ρ l l l = μ l ρ l L
The attenuation of the gas phase, representing the air outside the packed column, is neglected as illustrated in step number II of the previous page. l l = L   in this case.
IV.
Scanning the column packed with dry solid catalyst as A d s   g   c (i.e., dry catalyst inside only, dry solid phase). In this scanning case, the same packed column was packed with dry solid particles only in which the GRD beam passes through the column wall, the dry catalyst, and the gas in voids of the bed. The obtained attenuation is due to the wall of the column, the dry solid catalyst, and the gas in voids between solid catalysts and in porosity, where the latter is negligible:
A d s   g   c = ln I 0 I d s   g   c = μ d s ρ d s l d s + μ c ρ c l c = A d s + A c
By subtracting (Equation (10)) from (Equation (15)), the net attenuation of dry solid catalyst ( A d s ) is obtained as follows:
A d s = A d s   g   c A c
A d s = μ s ρ s l s  
where I d s represents the attenuation coefficient due to dry solid catalyst, and μ d s > > μ g , and hence, μ g ρ g l g ≅ 0.
V.
Scanning the column packed with wet solid catalyst, A w s   g   c (i.e., wet catalyst inside only—wet solid phase). The same packed bed, which has the dry solid catalyst particles, was filled with water for a sufficient time and then the column was left to drain for a number of hours to ensure that the external static liquid became negligible. The external static liquid holdup in this step is negligible as proper draining ensures that there is no liquid outside of the catalyst pores present in the measured line-averaged location. Additionally, the measurement is conducted using a line beam gamma-ray, penetrating only through catalyst particles or spherical particles within certain contact points. Consequently, it is logical to either disregard external static liquid holdup or to consider its impact minimal. Or it could be lumped within the measured internal static liquid holdup in case there is a need to account for it, which can be reasonably estimated by correlations reported in the literature. However, the work of Qi et al. [25], where cross-sectional measurements of liquid holdup were conducted, indicate that external static liquid holdup should not be overlooked and is combined with the internal liquid holdup within the pores of the catalysts. This approach suggests that aggregating internal liquid holdup with external static conditions at the contact points may correspond to the actual conditions within the catalyst bed [25]. Hence, in this measurement, the only liquid left is detained inside the catalyst’s pores due to the capillary force [16]. In this scanning case, the GRD beam passes through the column wall, the wet catalyst, and the void space of gas. The obtained attenuation is due to the wall of the column, the solid catalyst, the liquid inside the catalyst (porous), and the gas in voids between solid catalysts, where the latter is negligible:
A w s   g   c = μ s ρ s l s + μ l ρ l l i n t .     c a t .     p o r e s + μ c ρ c l c
The obtained attenuation of the air is also neglected in this case, as illustrated in step II.
The net attenuation of wet solid catalyst ( A w s ) is obtained (from Equation (18) Ac = μ c ρ c l c ) by subtracting (Equation (10)) from (Equation (15)), where μ g ρ g l g 0 . By subtracting (Equation (10)) from (Equation (18)) Aws can be obtained (Equation (19))
A w s = A w s   g   c A c
A w s = μ s ρ s l s + μ l ρ l l i n t .     c a t .     p o r e s
VI.
Scanning the column packed with solid and liquid, A l s c (water—catalyst inside, liquid–solid phase). The same packed bed, which contains a wet solid catalyst inside, was filled with water, so the voids between the particles are currently filled with water. In this scanning case, the GRD beam passes through the column wall, the solid catalyst, and water. The obtained attenuation is due to the wall of the column, the solid catalyst, the liquid inside the catalyst (porous), and the liquid outside the catalyst in voids between solid catalysts:
A l   s   c = μ l ρ l l i n t .     c a t .     p o r e s + μ l ρ l l e x t .     v o i d + μ s ρ s l s + μ c ρ c l c
A l   s = A l   s   c A c
A l   s = μ l ρ l l i n t . c a t .     p o r e s + μ l ρ l l e x t .     v o i d + μ s ρ s l s
where here lext. void represents the whole void length occupied with liquid.
By subtracting (Equation (10)) from (Equation (21)), the net attenuation of liquid–solid ( A l s ) is obtained in Equations (23) and (24) and since l e x t . v o i d = ε β L . Also, here: μ g ρ g l g 0 . Therefore, Equation (23) can be rewritten as in Equation (24):
A l   s = μ l ρ l l i n t .     c a t .     p o r e s + μ l ρ l   ε β L + μ s ρ s l s
where ( ε β ) is the line average void holdup, which is completely occupied by the liquid, and is equal to the bed void, and l e x t . v o i d = ε β L .
VIII.
Scanning the column with the desired operation of gas and liquid phases, A l   s   g   c (air–water–catalyst, gas–liquid–solid). In this scanning case, the GRD beam passes through the column wall, catalyst, liquid, and gas as a three-phase liquid–solid–gas attenuation. The obtained attenuation is due to the wall of the column, the solid catalyst, the liquid inside the pore, the total liquid in the external void (dynamic + static), and the gas phase:
A l   s   g   c = μ l ρ l l i n t . c a t .     p o r e s + μ l ρ l l l   e x t .     v o i d + μ s ρ s l s + μ c ρ c l c
The partial length of the void is occupied by liquid here ( l l   e x t . v o i d ) , whereas the other partial length of the void is occupied by gas ( l g   e x t . v o i d ), where μ g ρ g l g   e x t . v o i d 0 .
Subtracting (Equation (10)) from (Equation (25)) yields the net attenuation of liquid–solid–gas ( A l   s   g ):
A l   s   g = A l   s   g   c A c
A l   s   g = μ l ρ l l i n t . c a t .     p o r e s + μ l   ρ l l l   e x t .   v o i d + μ s ρ s l s
where l s = ε s   L , l l   e x t . v o i d = ε l   L , and the μ g ρ g l g   e x t . v o i d gas is neglected.
A l   s   g = μ l ρ l l i n t .     c a t .     p o r e s + μ l ρ l   ε l L + μ s ρ s ε s   L
To measure the bed void distribution, subtract (Equation (20)) from (Equation (24)):
A l   s A w s = μ l ρ l ε β L = ε β A l
Bed void can then be estimated as follows:
where μ l ρ l L = A l (Equation (14))
ε β = A l   s A w s A l
This represents the void between the bed catalyst particles that are randomly packed. To measure the total liquid holdup in external void space (dynamic and static liquid holdup). Therefore, subtracting (Equation (20)) from (Equation (28)) yields the following:
A l   s   g A w s = μ l ρ l ε l L = ε l   A l
ε l = A l   s   g A w s A l
Due to the capillary force and in the absence of surface reactions, the catalyst pores are always intact (and filled) with the liquid (16). To measure the catalyst porosity fraction with respect to the total bed volume, which is equivalent to the internal liquid holdup inside the catalyst particle, the subtraction of (Equation (17)) from (Equation (20)) gives the following:
A w s A d s = μ l ρ l l i n t .     c a t .     p o r e s = μ l ρ l ε i n t .   L
A w s A d s = ε i n t .   A l
ε i n t . = A w s A d s A l
where ε i n t . is equivalent to the catalyst porosity fraction with respect to the bed volume.
The line average gas holdup can be measured by ε β ε l = ε g . Therefore, subtracting Equation (27) from Equation (24) gives the following:
A l   s A l   s   g = μ l ρ l l i n t .     c a t .     p o r e s + μ l ρ l   ε β   L + μ s ρ s l s μ l ρ l l i n t . c a t     p o r e s μ l ρ l   ε l   L μ s ρ s l s
A l   s A l   s   g = μ l ρ l   ( ε β L ε l L ) = μ l ρ l L   ( ε β ε l )
where
ε g   = ε β ε l
The attenuation will be different between the phases as the densities are different, which depends on the interaction of the gamma-ray with the absorbing material. By subtracting the attenuation of the liquid–solid phase from the attenuation of the three phases, we can get the gas holdup:
A l   s A l   s   g = μ l ρ l L   ( ε g )
ε g = A l   s A l   s   g A l
The solid holdup then can be obtained from the following:
ε s = 1 ε l ε g
It is important to highlight that the above-developed methodology has been validated by Qi et al. [25] since the measurement using gamma-rays in packed bed is applicable to any two-phase flow in packed beds, regardless of the mode of operation—whether downward, upflow, or countercurrent.

3. Results

In this section, the line average diameter distribution of the parameters like solid holdup and the internal liquid holdup inside the catalyst is presented. All these parameters are fixed for a packed bed unit irrespective of the operating conditions. The methods used to obtain these parameters have been discussed in the previous section of the principle of measurements.

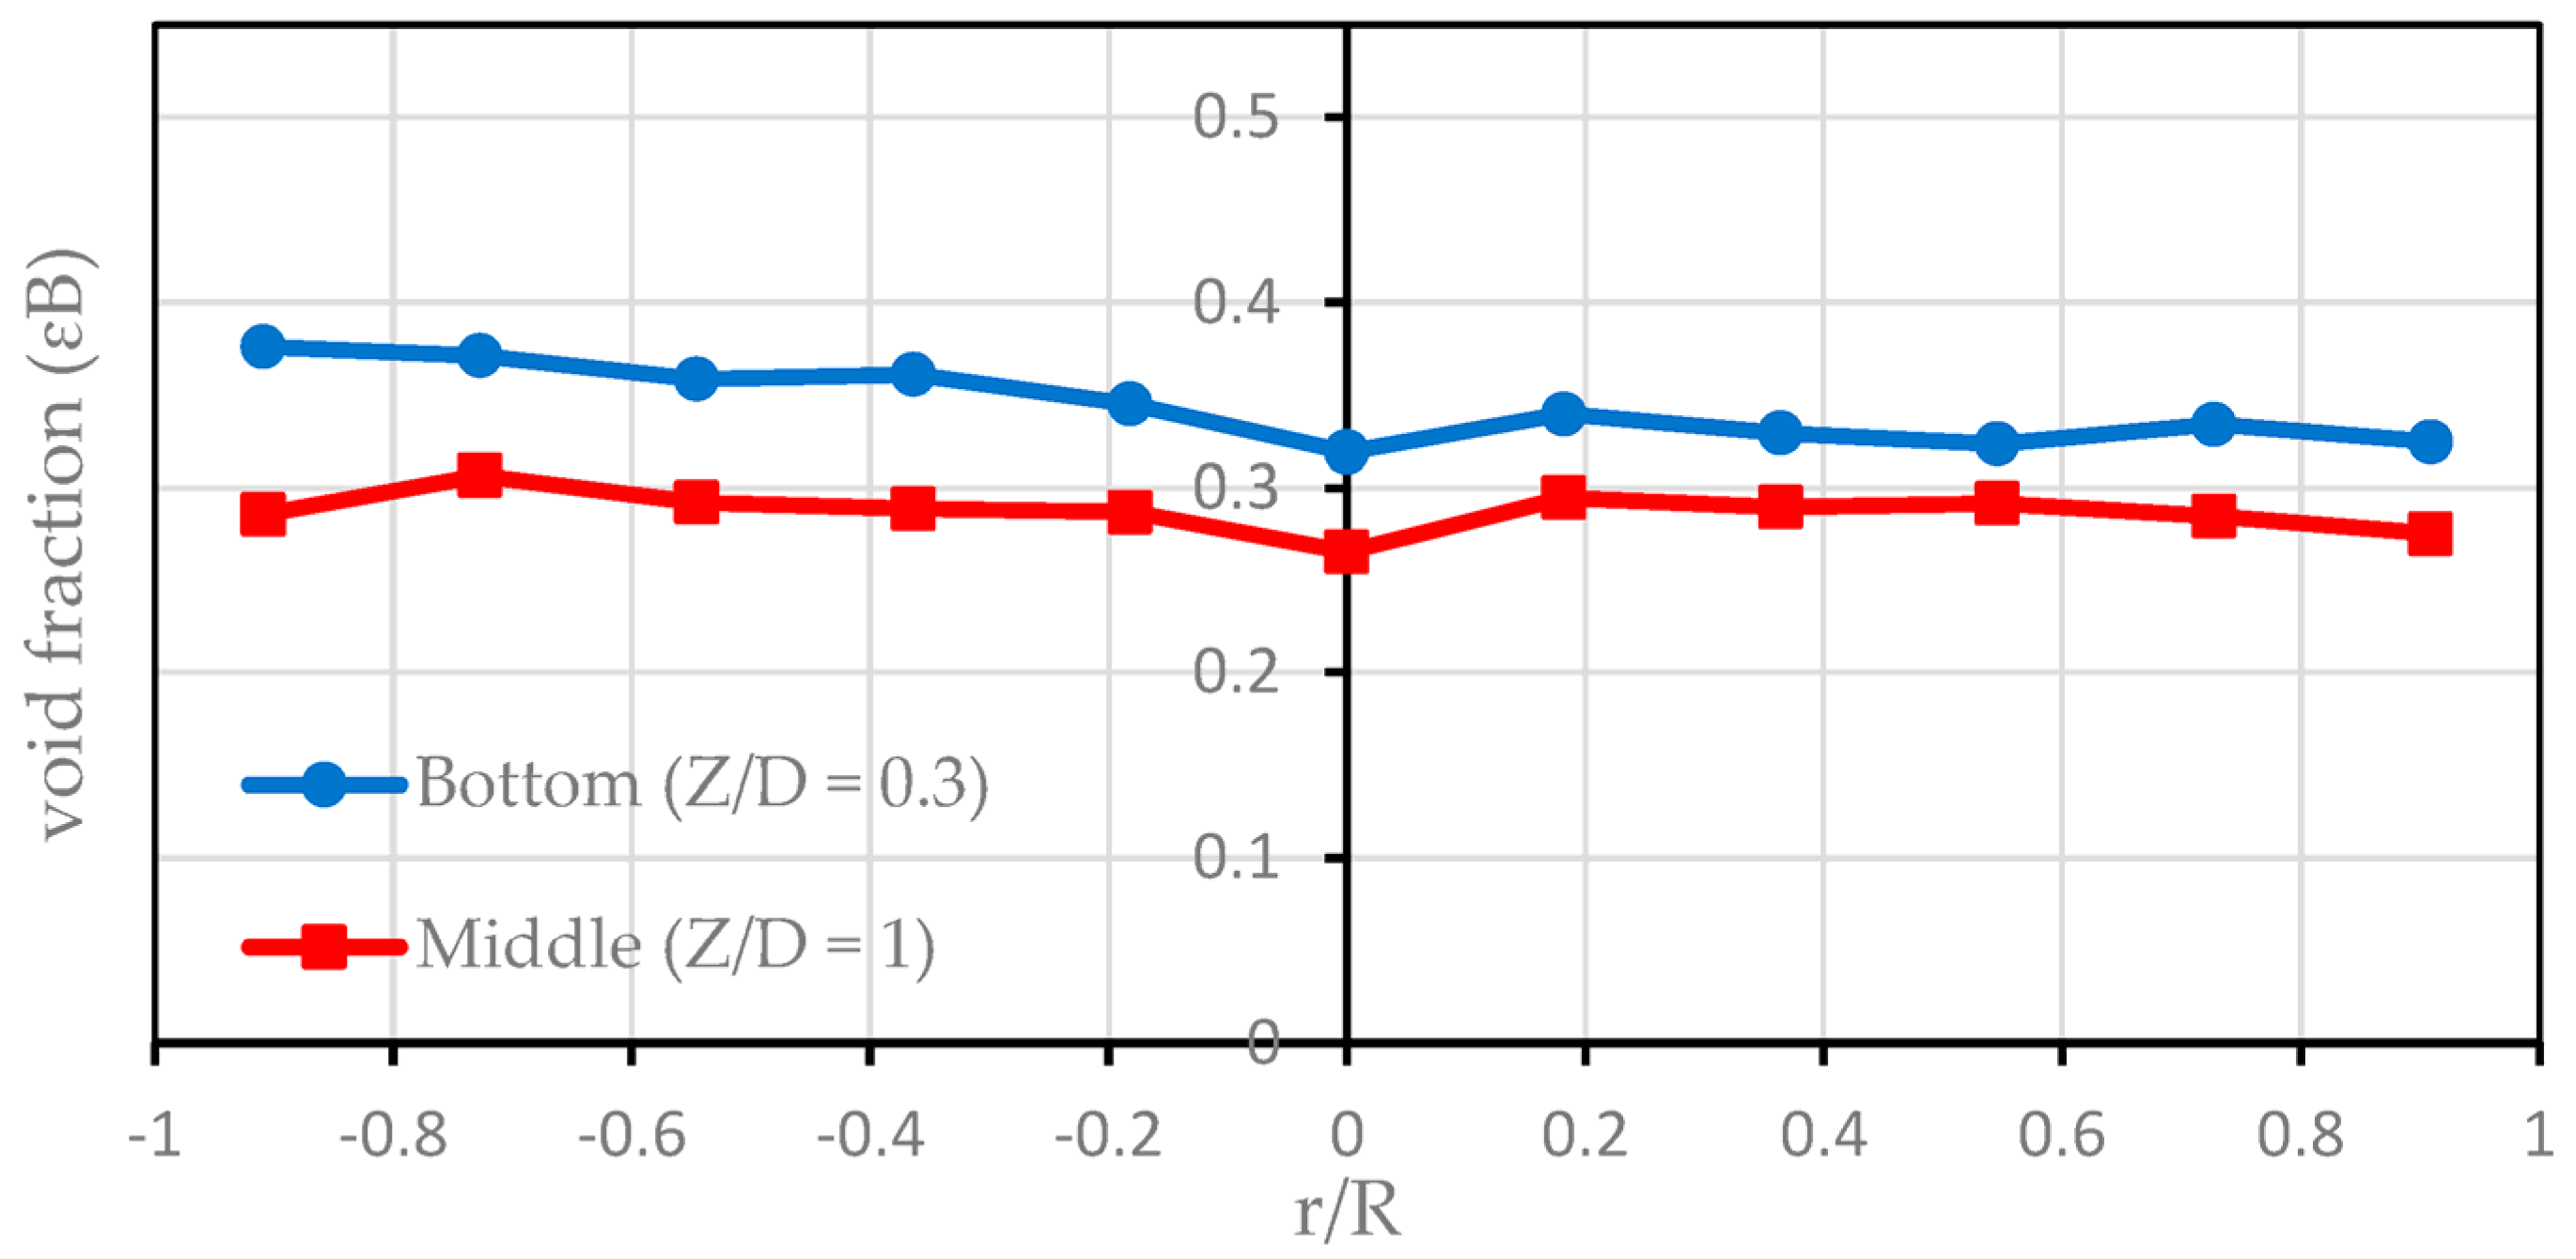
3.1. Diameter Profile of the Void Fraction with Wet Catalyst

Figure 3 presents the line-averaged radial profiles of the void fraction in a wet catalyst bed at two distinct axial locations, Z/D = 0.3 and Z/D = 1, following the water drainage in the pre-wetting stage. The bed’s random packing results in varying void fractions across the column’s diameter, indicating non-uniformity in the distribution of void spaces.
At the midpoint of the column (Z/D = 1), the void fraction profile diverges more noticeably from the bottom (Z/D = 0.3), suggesting a non-uniform distribution of the catalyst. The percentage deviation in the void fraction was calculated using the following formula:
p e r c e n t a g e   d e v i a t i o n = max r a d i a l min r a d i a l max r a d i a l
The analysis yielded a deviation of approximately 15% at the middle axial location and 13% at the bottom, highlighting the presence of radial non-uniformities that can significantly affect the flow distribution and catalyst efficiency. These variations are significant as they suggest the presence of flow maldistribution along the radial direction for both axial positions, which could potentially impact the flow distribution and, consequently, the catalyst’s efficiency. A higher voltage structure within the bed can lead to a path of less resistance, promoting a more streamlined flow. This, in turn, could mitigate the issues of channeling and bypassing, which are often precursors to flow maldistribution, as indicated in reference [29]. It is crucial to address these variations to enhance the reactor’s performance and ensure the even distribution of reactants across the catalyst bed.

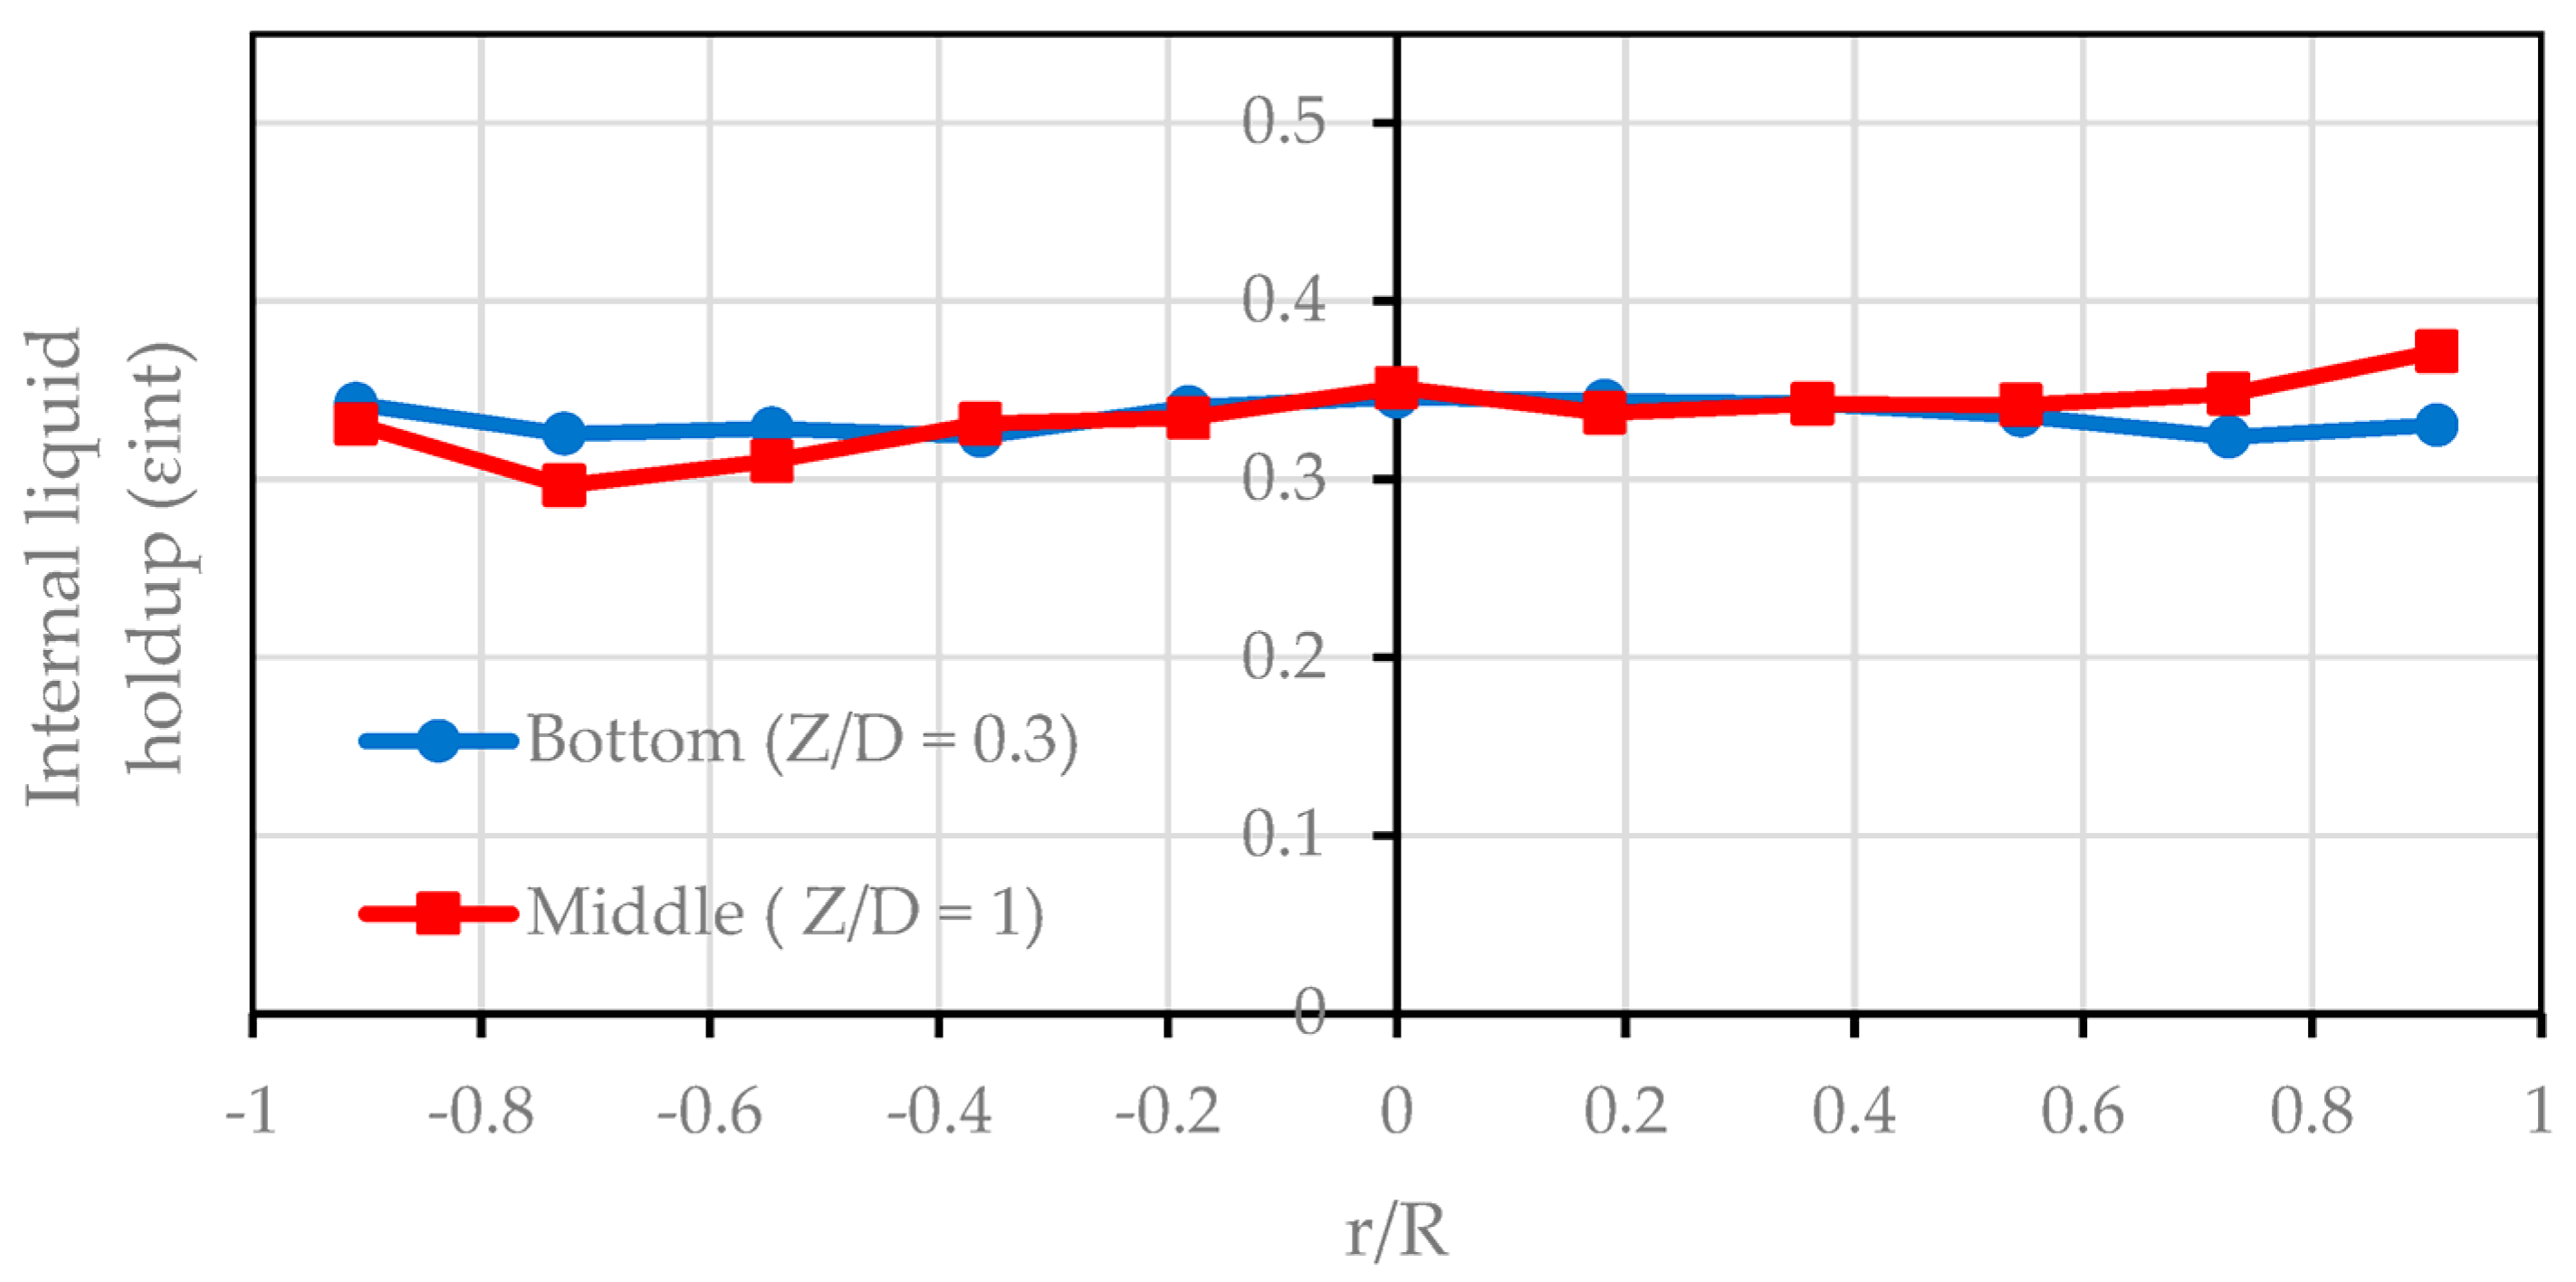
3.2. Diameter Profile of Line Average Internal Liquid Holdup

Figure 4 presents the line average internal liquid holdup related to the catalyst porosity since it is filled with liquid due to the capillary force [16]. The data reveal an uneven distribution of the internal static liquid holdup across the radial direction of the column. The percentage deviation shows a variation of about 18 percent at the middle axial location and approximately 8 percent at the bottom. These discrepancies are attributed to the assumed neglection of the static external liquid holdup, which assumes that the internal liquid holdup in the filled pores of the catalyst is lumped together with the static external liquid holdup relative to the random nature of the packed bed’s distribution [24]. The finding is consistent with the work of Qi et al. [25], which also confirms and validates the measurements. It is critical to note that this parameter is not dependent on the flow rate for a fixed bed reactor; rather, it is influenced by the catalyst’s characteristics and the arrangement of the bed material [13]. The averaged line value of the internal liquid holdup with respect to the bed volume is consistent with the catalyst porosity and density provided by the manufacturer if it is made with respect to the bed volume.

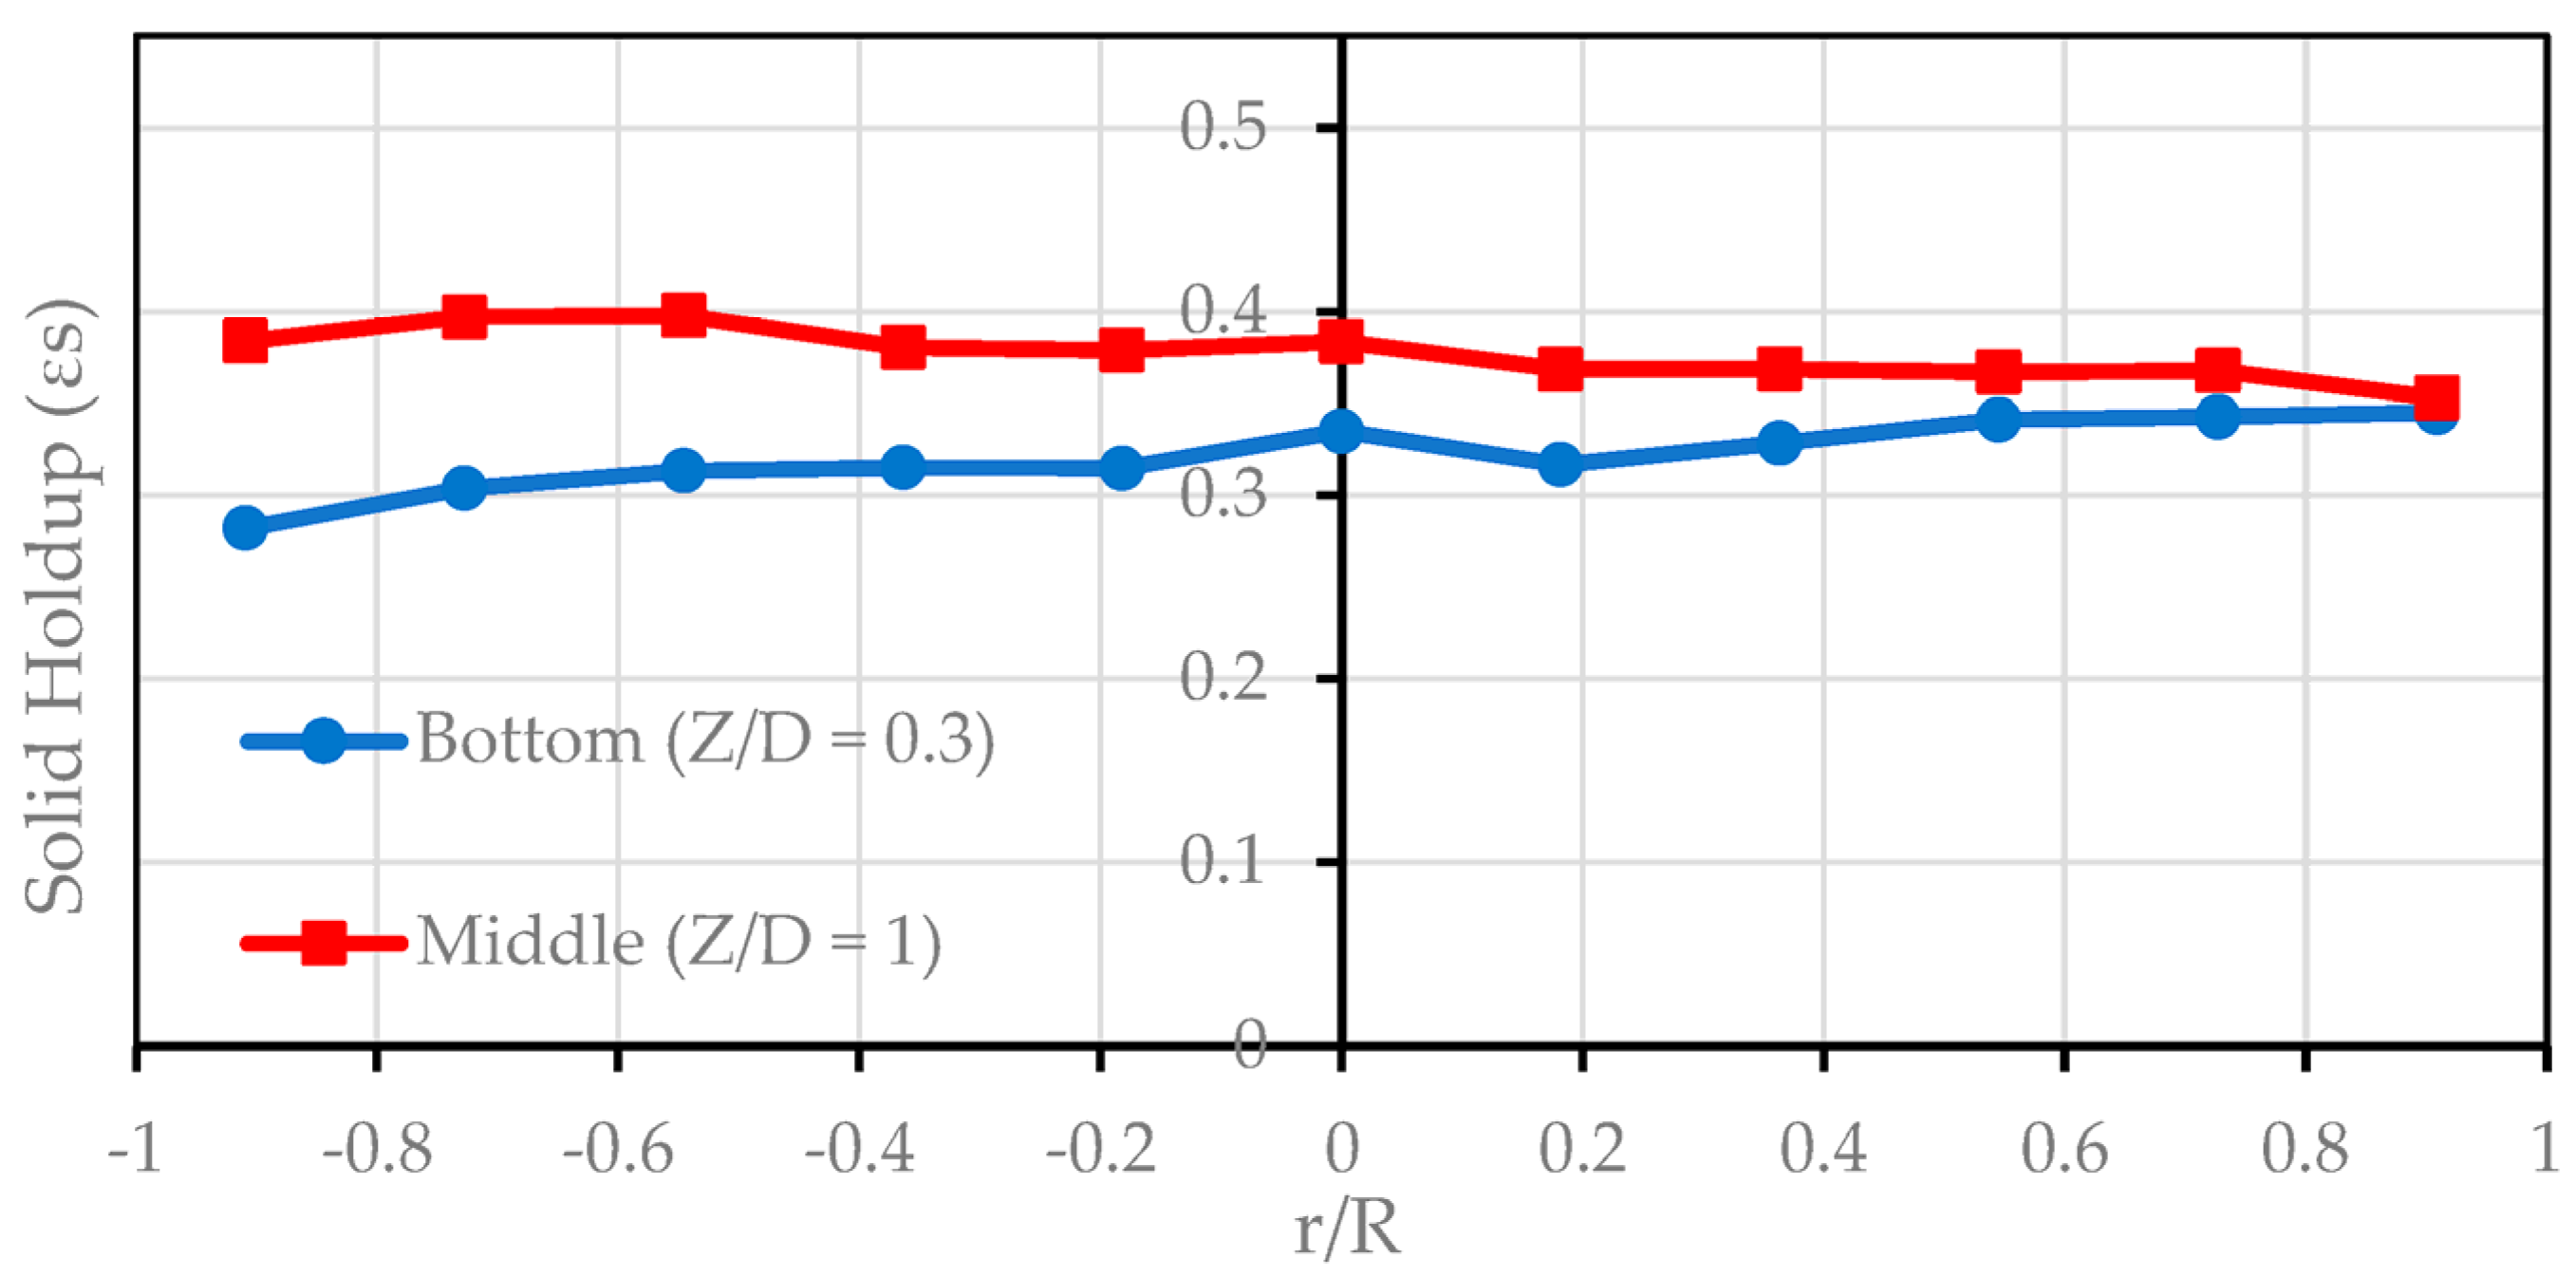
3.3. Radial Distribution of Solid Holdup ( ε s )

Figure 5 illustrates the line average radial profile of solid holdup, which exhibits a random distribution attributable to the bed’s random packing. The average solid holdup is approximately 0.348. The calculated percentage deviations show about 8 percent at the middle and around 17 percent at the bottom. When the solid holdup is combined with the average internal porosity (≈0.27), it gives a total of ≈0.62. This results in a bed voidage per unit bed volume of 0.38 (1 − 0.62 = 0.38), which aligns with the typical values for spherical bed voidage. A comparative study that measured line average solid holdup in a packed bed using GRD, employing a similar random bed structure in a 30 cm ID column with 3.2 mm alumina (nonporous) particles, reported an average solid holdup of approximately 0.66 [32]. It is important to note, however, that the catalyst referenced in this study was non-porous. This aggregate value ensures a geometric similarity between non-porous and porous catalysts. Also, it confirms further the validity of the developed methodology for measuring solid holdup, liquid holdup, and bed voidage per bed volume [24].

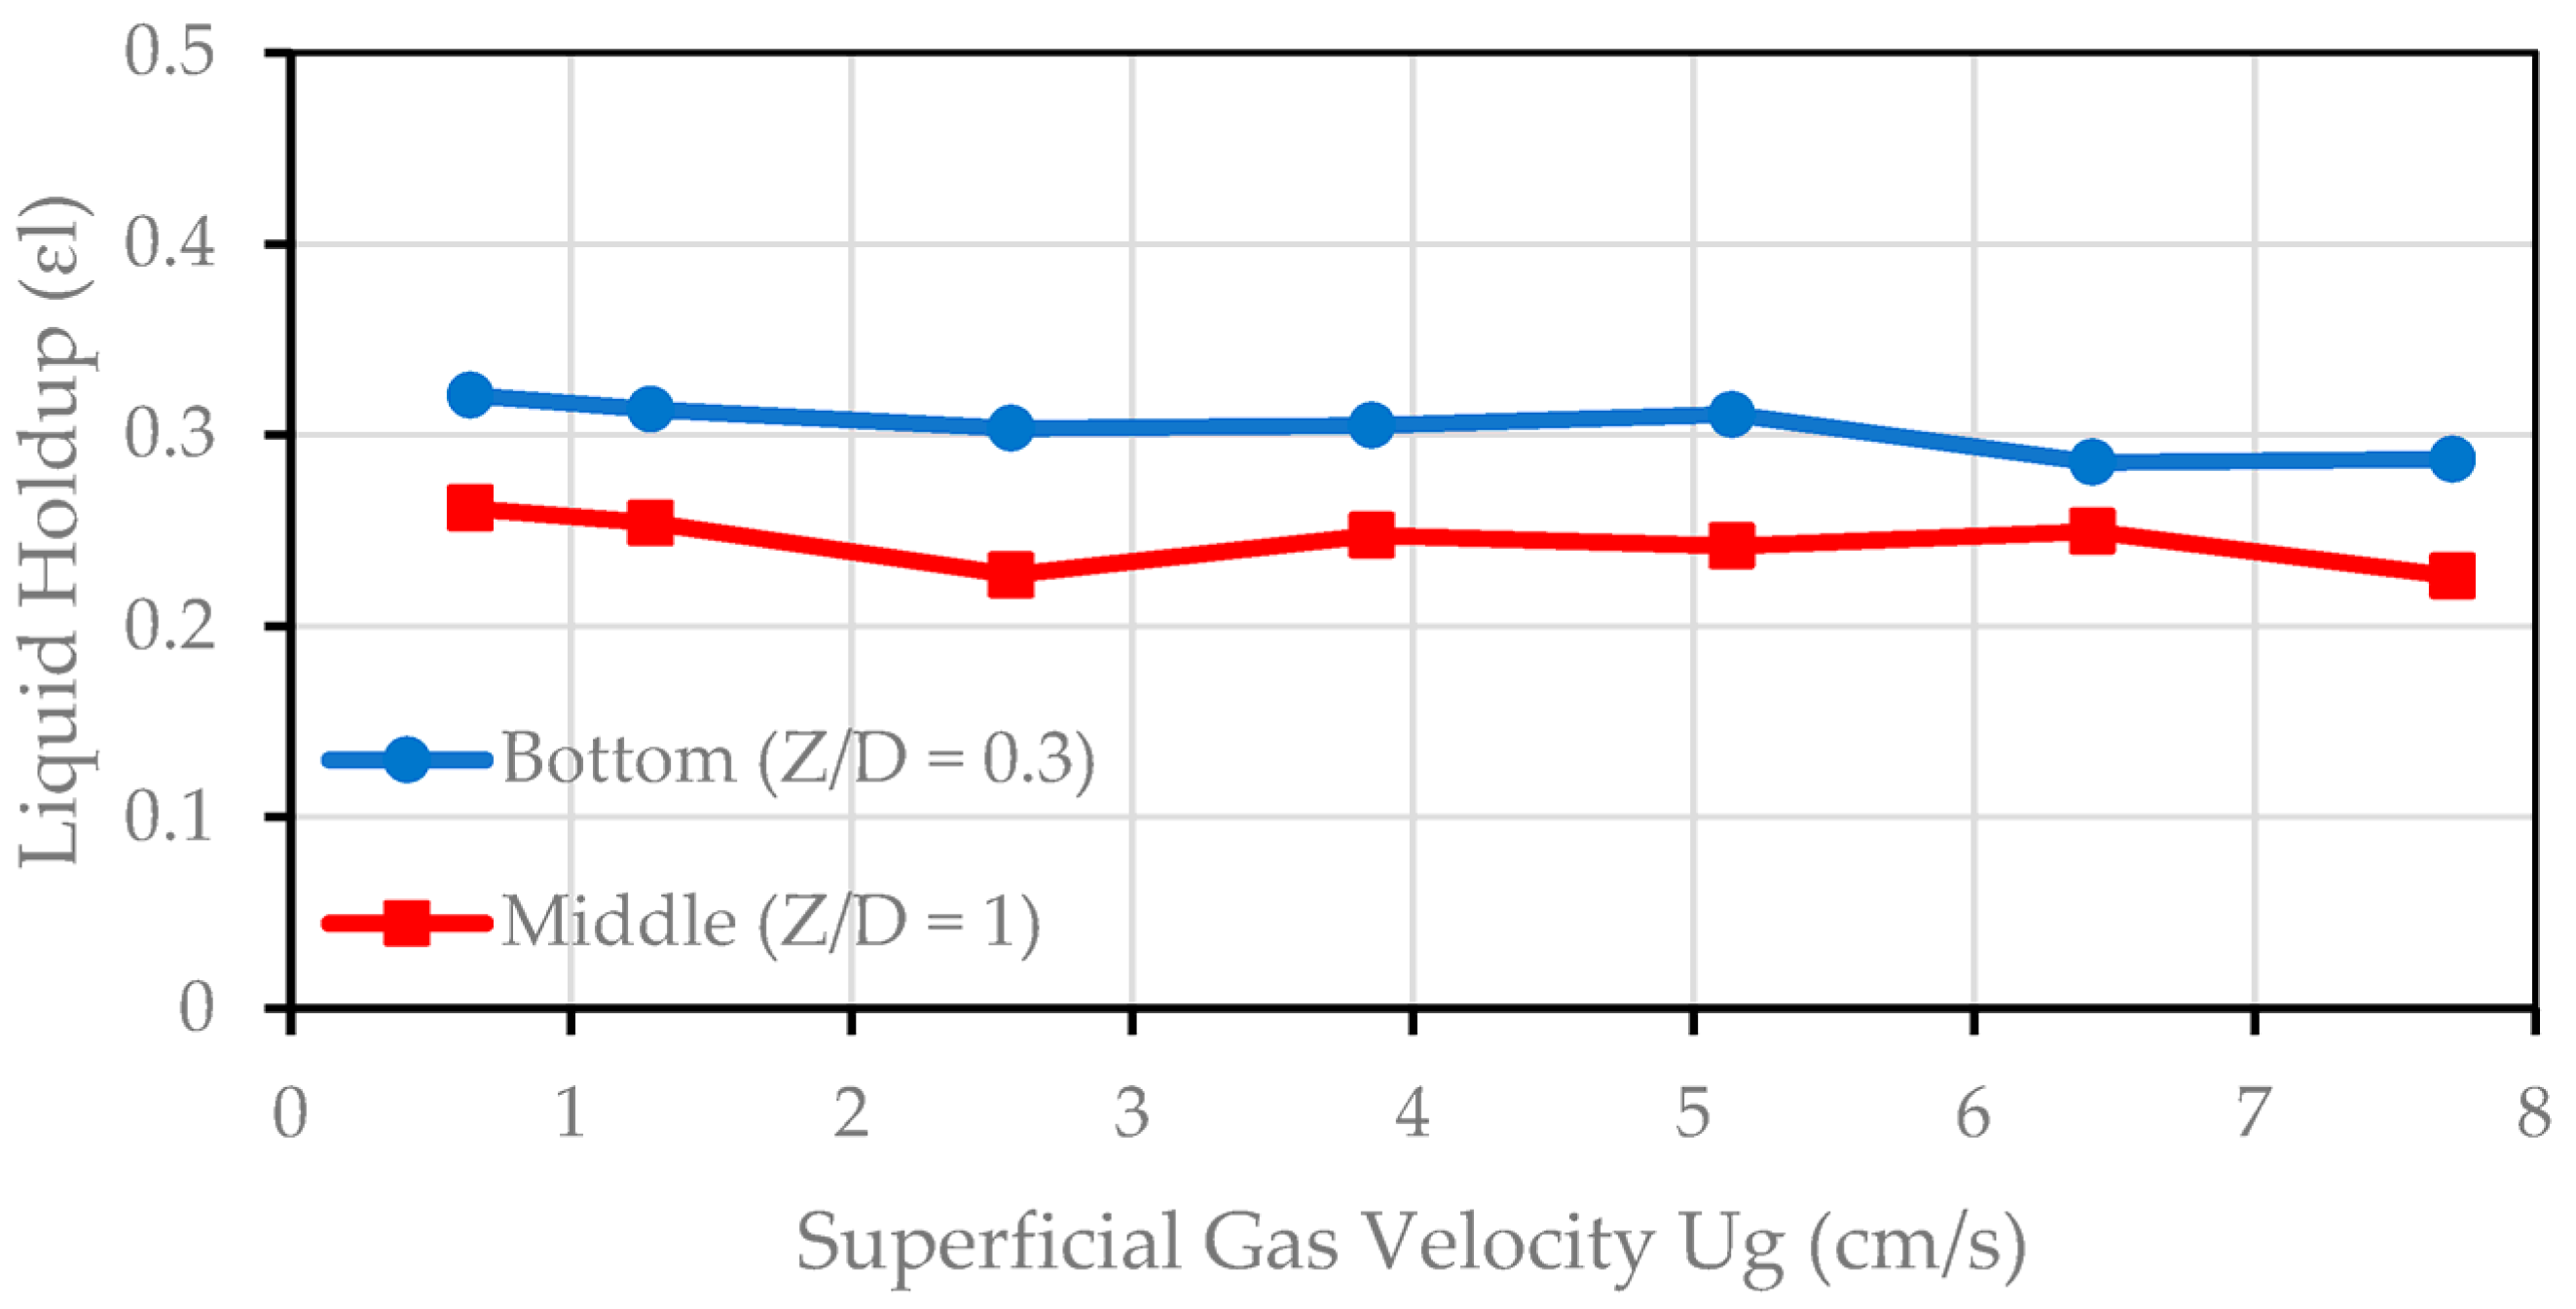
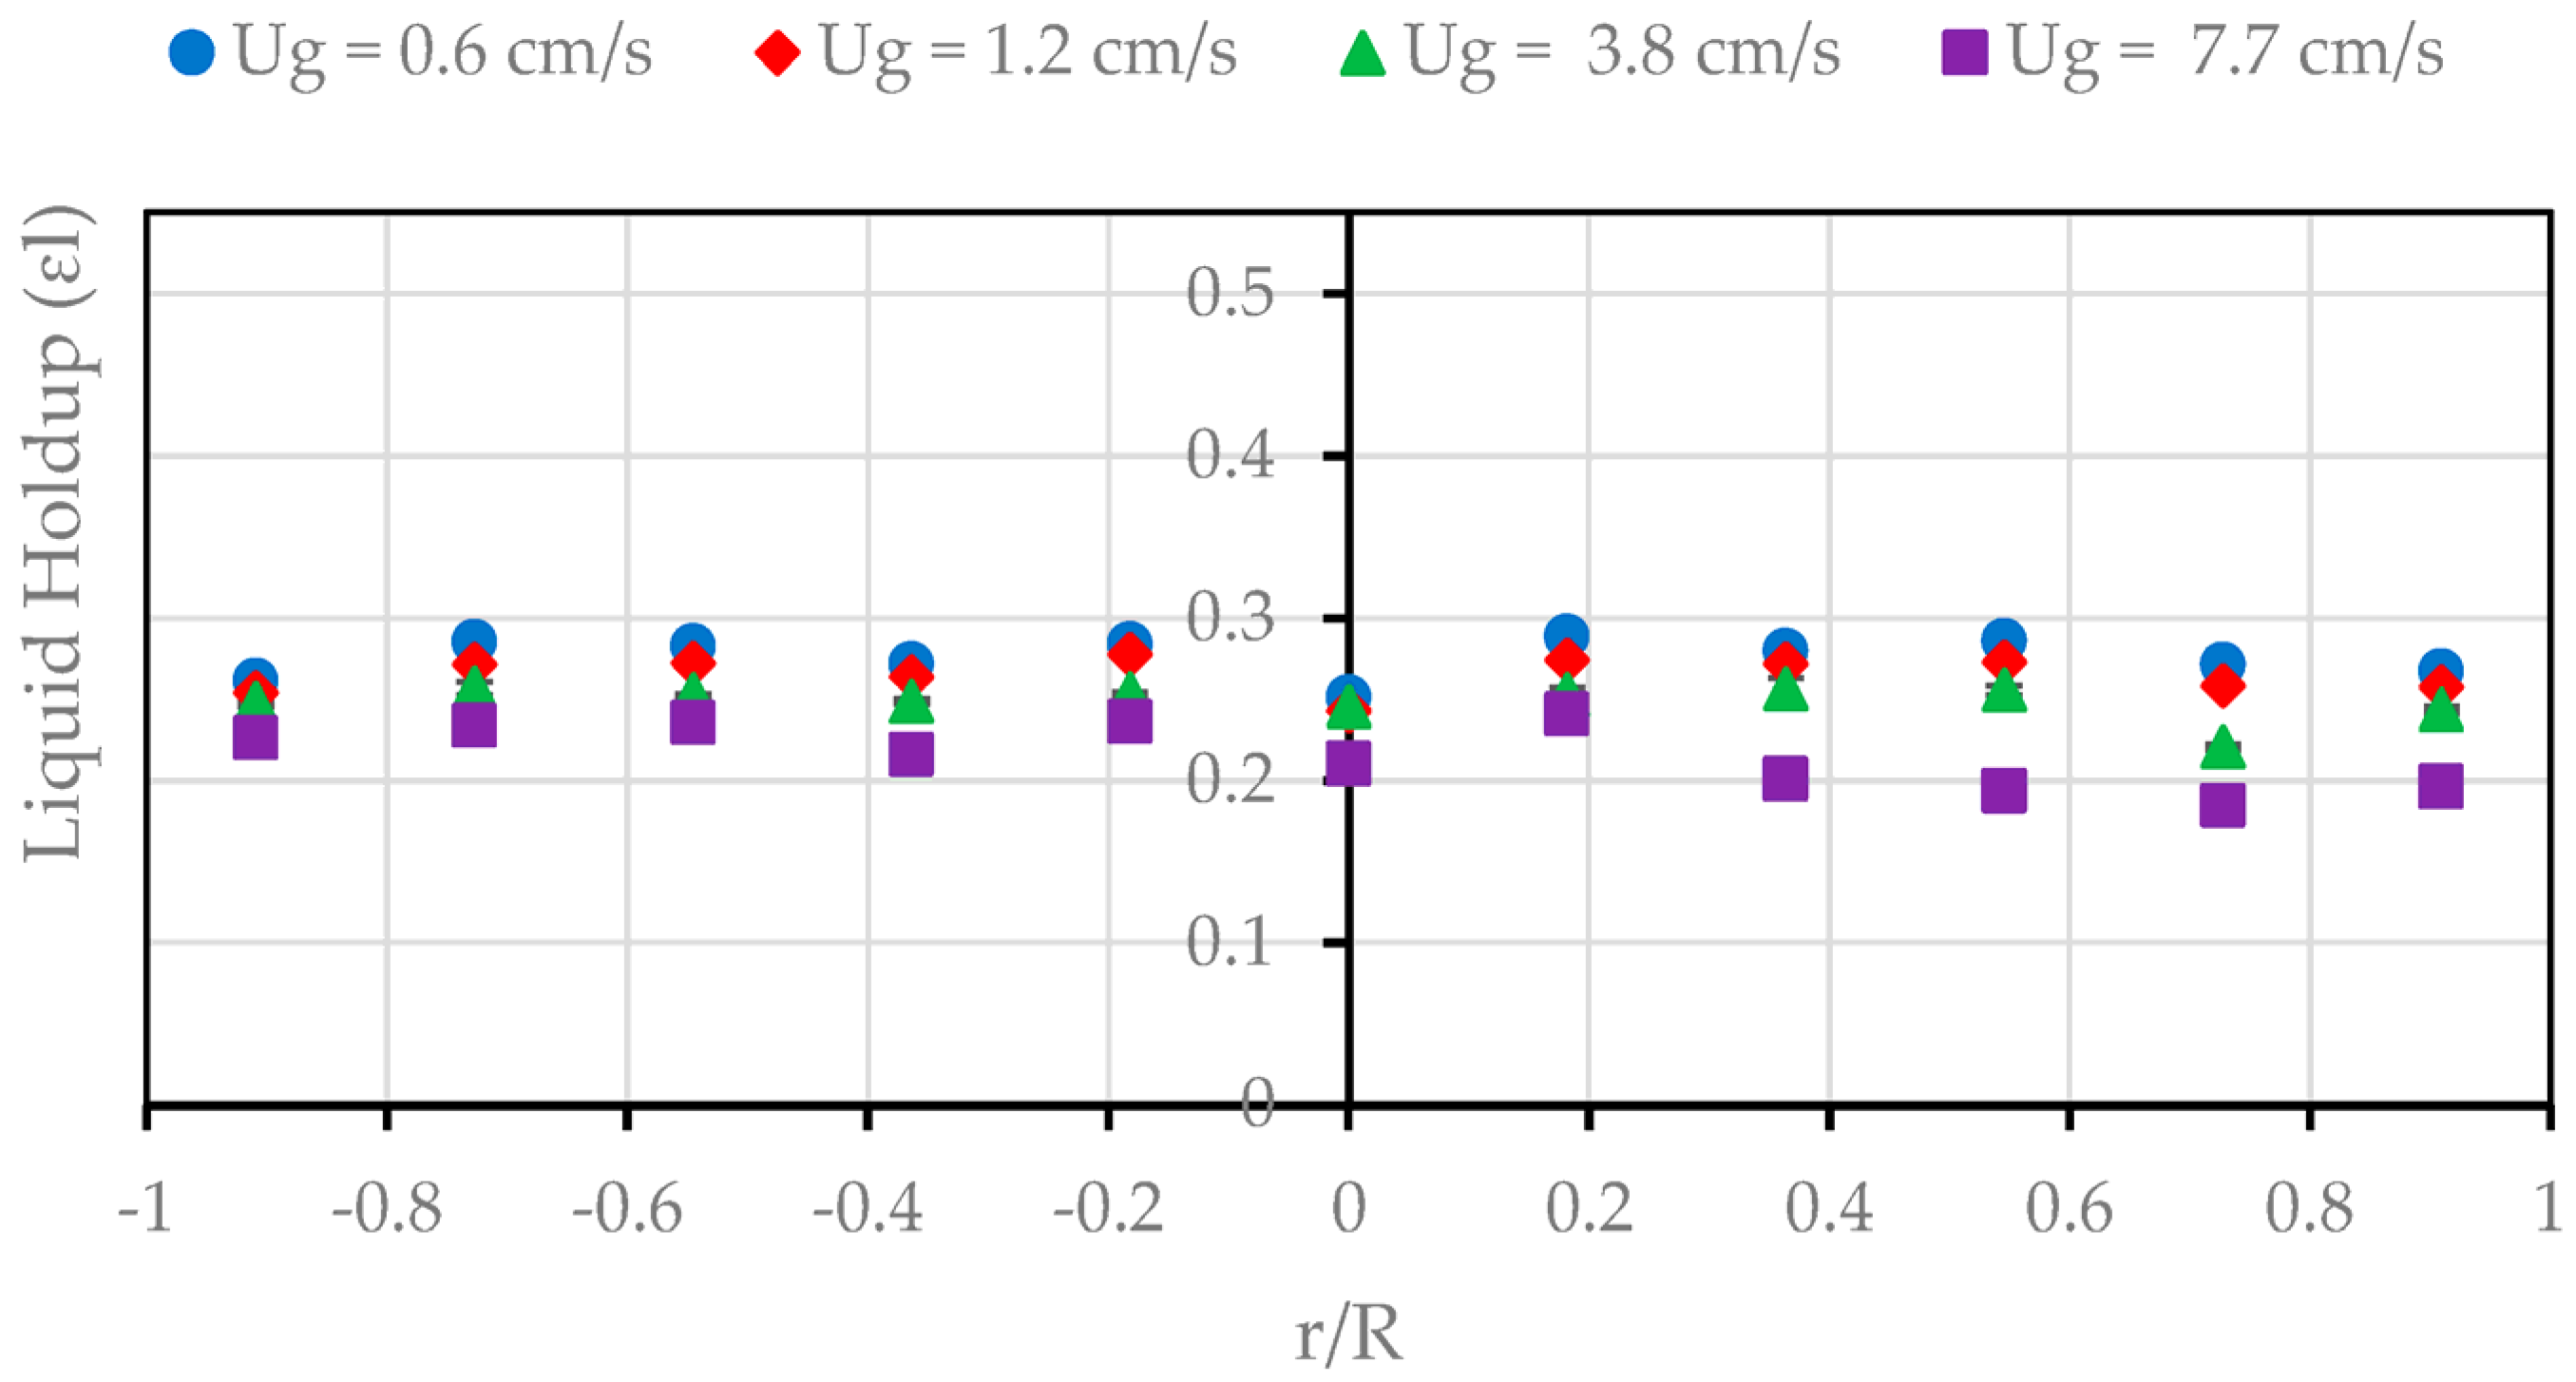
3.4. The Line Average Total External Liquid Holdup

In this methodology, the total external liquid holdup is defined as the sum of the static and dynamic liquid holdups. The static liquid holdup represents the volume of the liquid trapped within the interstices of the catalyst particles, while the dynamic liquid holdup pertains to the liquid flowing through the external void spaces of the catalyst bed. Considering the upflow reactor configuration, it is acknowledged that the static liquid holdup does not remain constant since the gas phase is dispersed, thus affecting the liquid distribution. The decision to report the total external liquid holdup, rather than separately detailing the static and dynamic components, stems from the scaled-down flow rates used in this study, which are reflective of industrial conditions [23]. The baseline operating condition was chosen to emulate industrial flow rates, with the gas flow rate adjusted to observe its impact on the total external liquid holdup, while the baseline liquid flow rate remained constant. The line average total external liquid holdup, as observed, indicates that the reactor’s flow dynamics are sensitive to gas flow rates, which can be pivotal in optimizing reactor performance. Figure 5, Figure 6, Figure 7, Figure 8, Figure 9 and Figure 10 show that the external line average liquid holdup (ε) at r/R = (0, +0.5, −0.5, +0.9, −0.9) and bottom and middle axial locations (Z/D = 0.3 and 1). It is observed that the liquid holdup is gradually decreasing, and the decreasing trend is sharp after 3.8 cm/sec for all the positions except at the wall (r/R = +0.9); it is a phenomenon usually seen in this reactor. The decrease in the average radial porosity with increased gas velocity can be attributed to the dynamic interactions between the gas and liquid phases within the packed bed. As the gas velocity increases, the local gas velocity within the bed also rises, leading to a greater displacement of the liquid phase by the gas phase. This displacement occurs because the gas phase, moving at higher velocities, occupies a larger volume of the bed, effectively reducing the volume available for the liquid phase and thus decreasing the dynamic liquid holdup. In addition, increasing the gas flow rate results in a transition in the flow regime from bubbly to pulse flow for the gas phase. In the bubbly flow regime, the reduction in liquid holdup is not sharp as this regime is characterized by a low interaction between bubbles themselves, bubbles and packing, and also a little effect of bed porosity and geometry on these quantities [31]. As gas velocity is increased, the fluid turbulence and the bubble number increase, and the interference between bubbles and the coalescence/re-split occurs, which reduces bubble size and increases the gas holdup in the reactor and then reduces the liquid holdup sharply with an increasing gas flow rate. All the locations, irrespective of the axial and radial location, showed a decreasing trend of the liquid holdup with an increasing gas flow rate, and the same trend is observed in [32,33,34]. The decreasing trend calculated with respect to maximum holdup ((max-min)/max) for all locations varies between 15 percent and 33 percent. The liquid holdup (which here is the dynamic liquid holdup and is equivalent to external liquid holdup since the static liquid holdup is negligible) (εl(r)) decreases with the increase in the gas velocity due to the increase in the local gas velocity that drags the local liquid velocity. In this case, the flowing gas phase occupies more volume of the void causing the dynamic liquid holdup to decrease in the bed. If the inlet and the outlet of the liquid flow are closed simultaneously and then the column is drained for a long time, the liquid holdup represents the dynamic liquid holdup and is less at higher gas velocity. At the wall (r/R = +0.9) the transition of the regime is not clear due to the significant wall effect. The trend at both sides of the column wall, as seen in Figure 9 and Figure 10, is quite different behavior and this can be directly linked to the effect of the conical bottom and the plenums. In all the cases, the liquid holdup is higher for the bottom part, and this is due to external bed voidage and external porosity of the bed structure, where the void space is higher for the bottom location compared to the middle section.

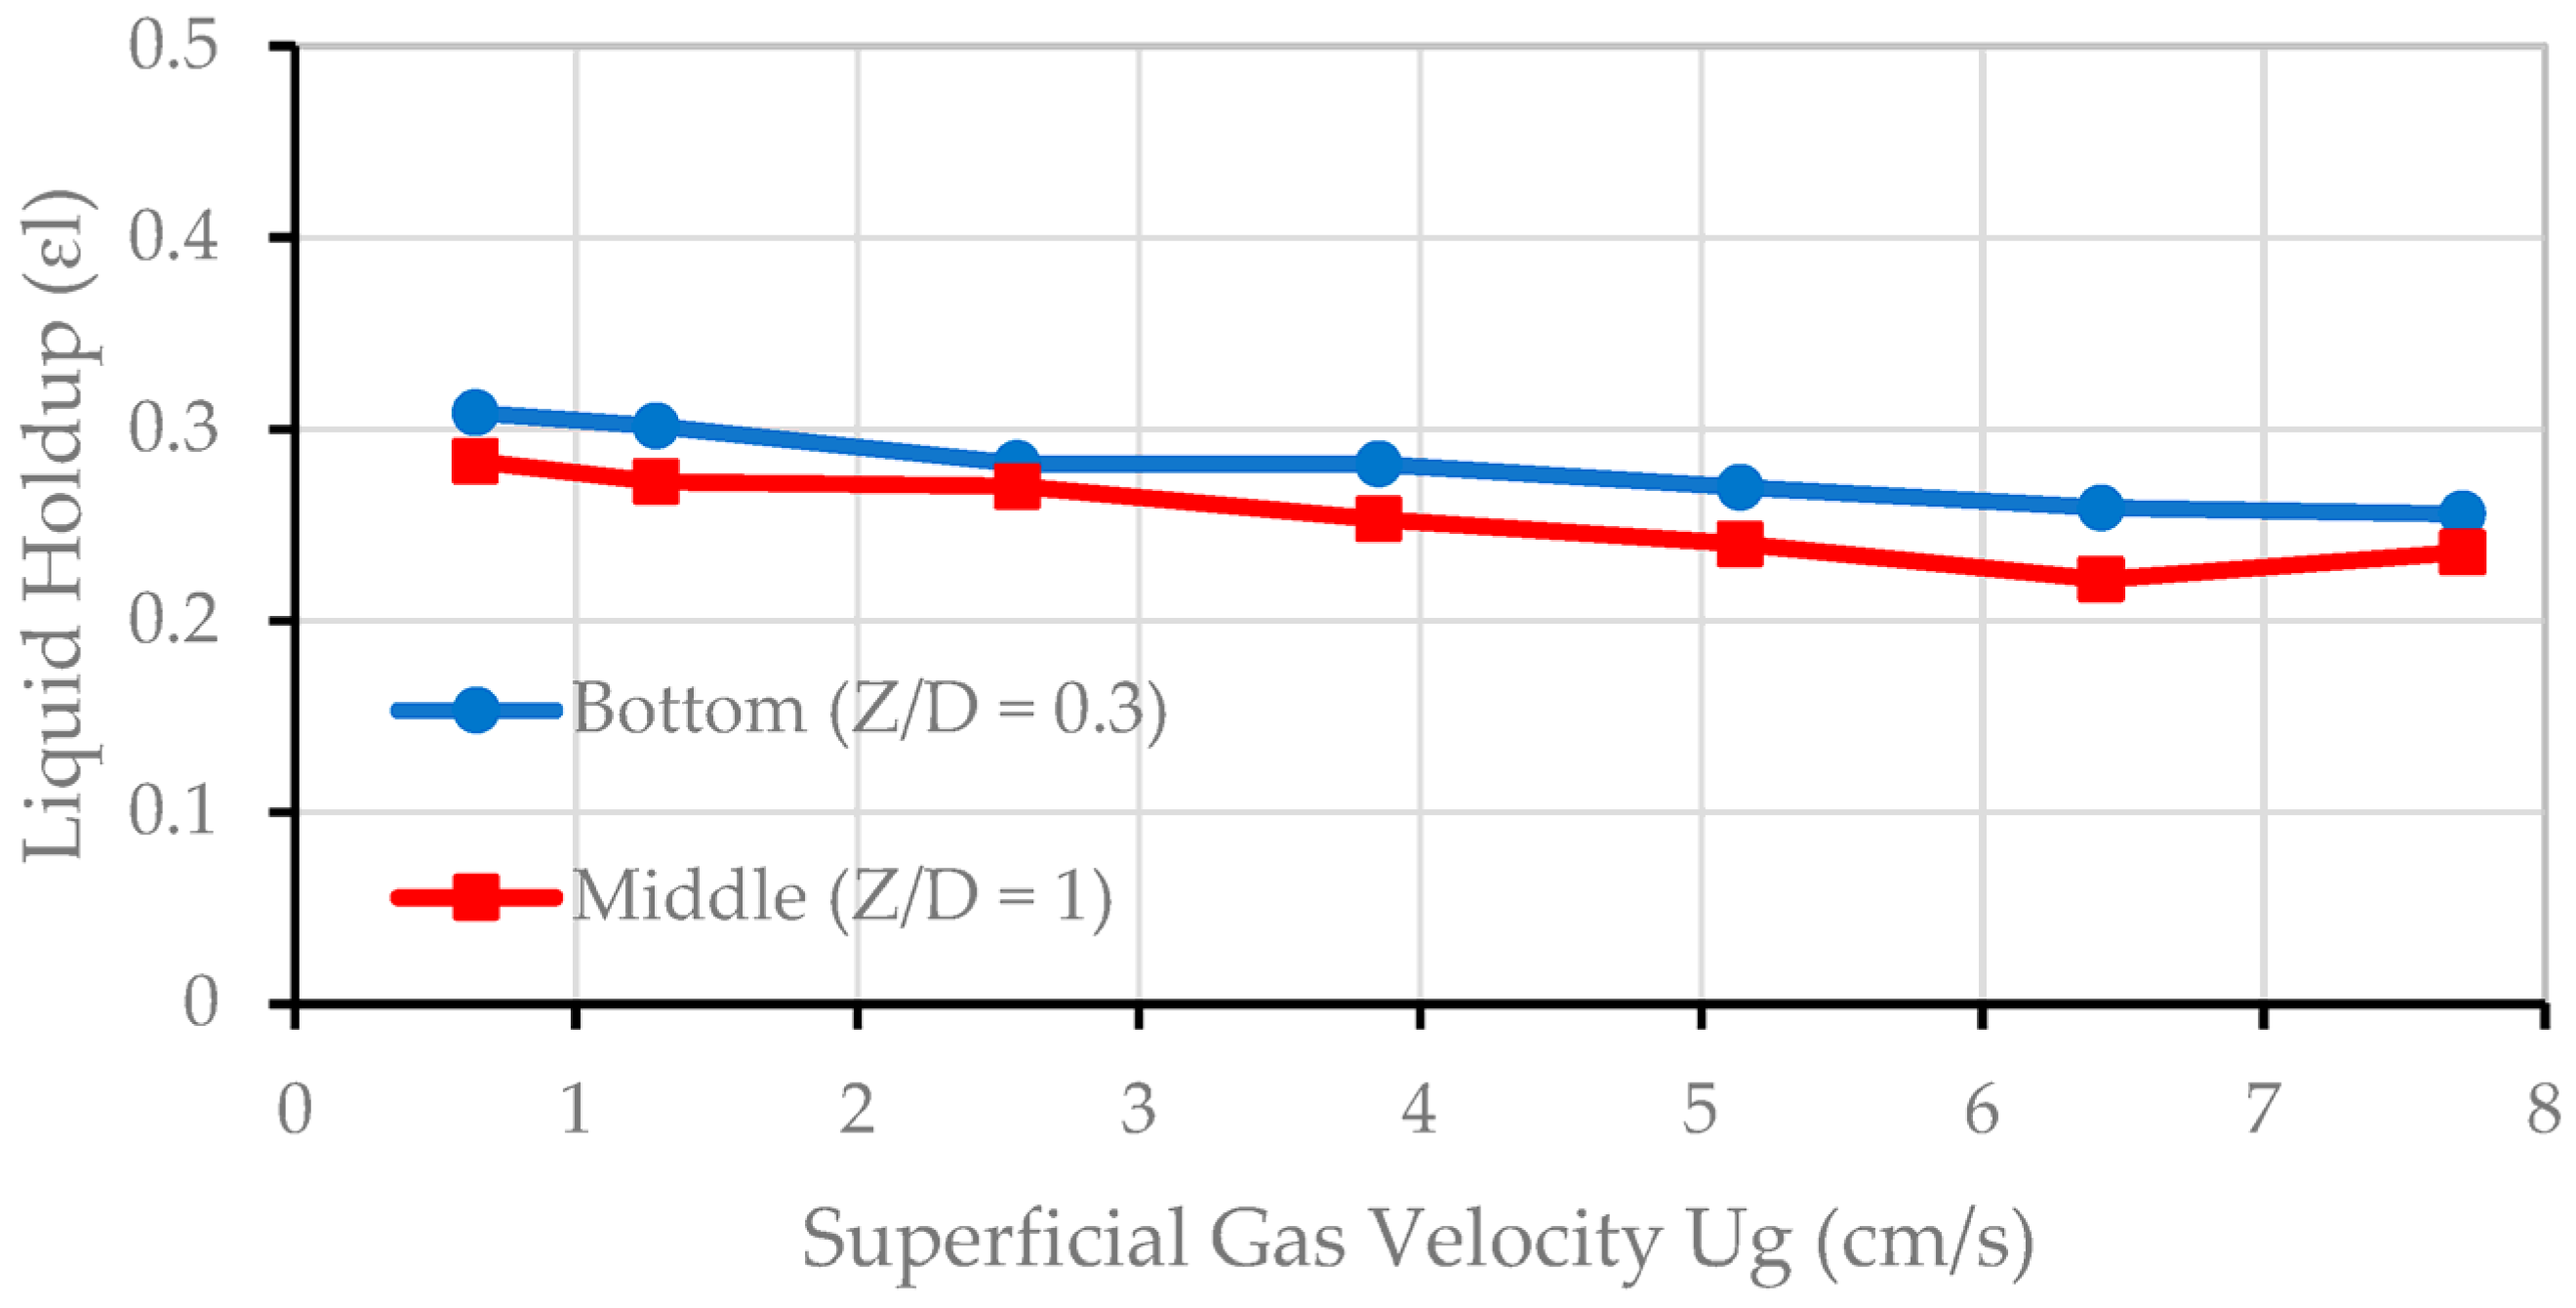
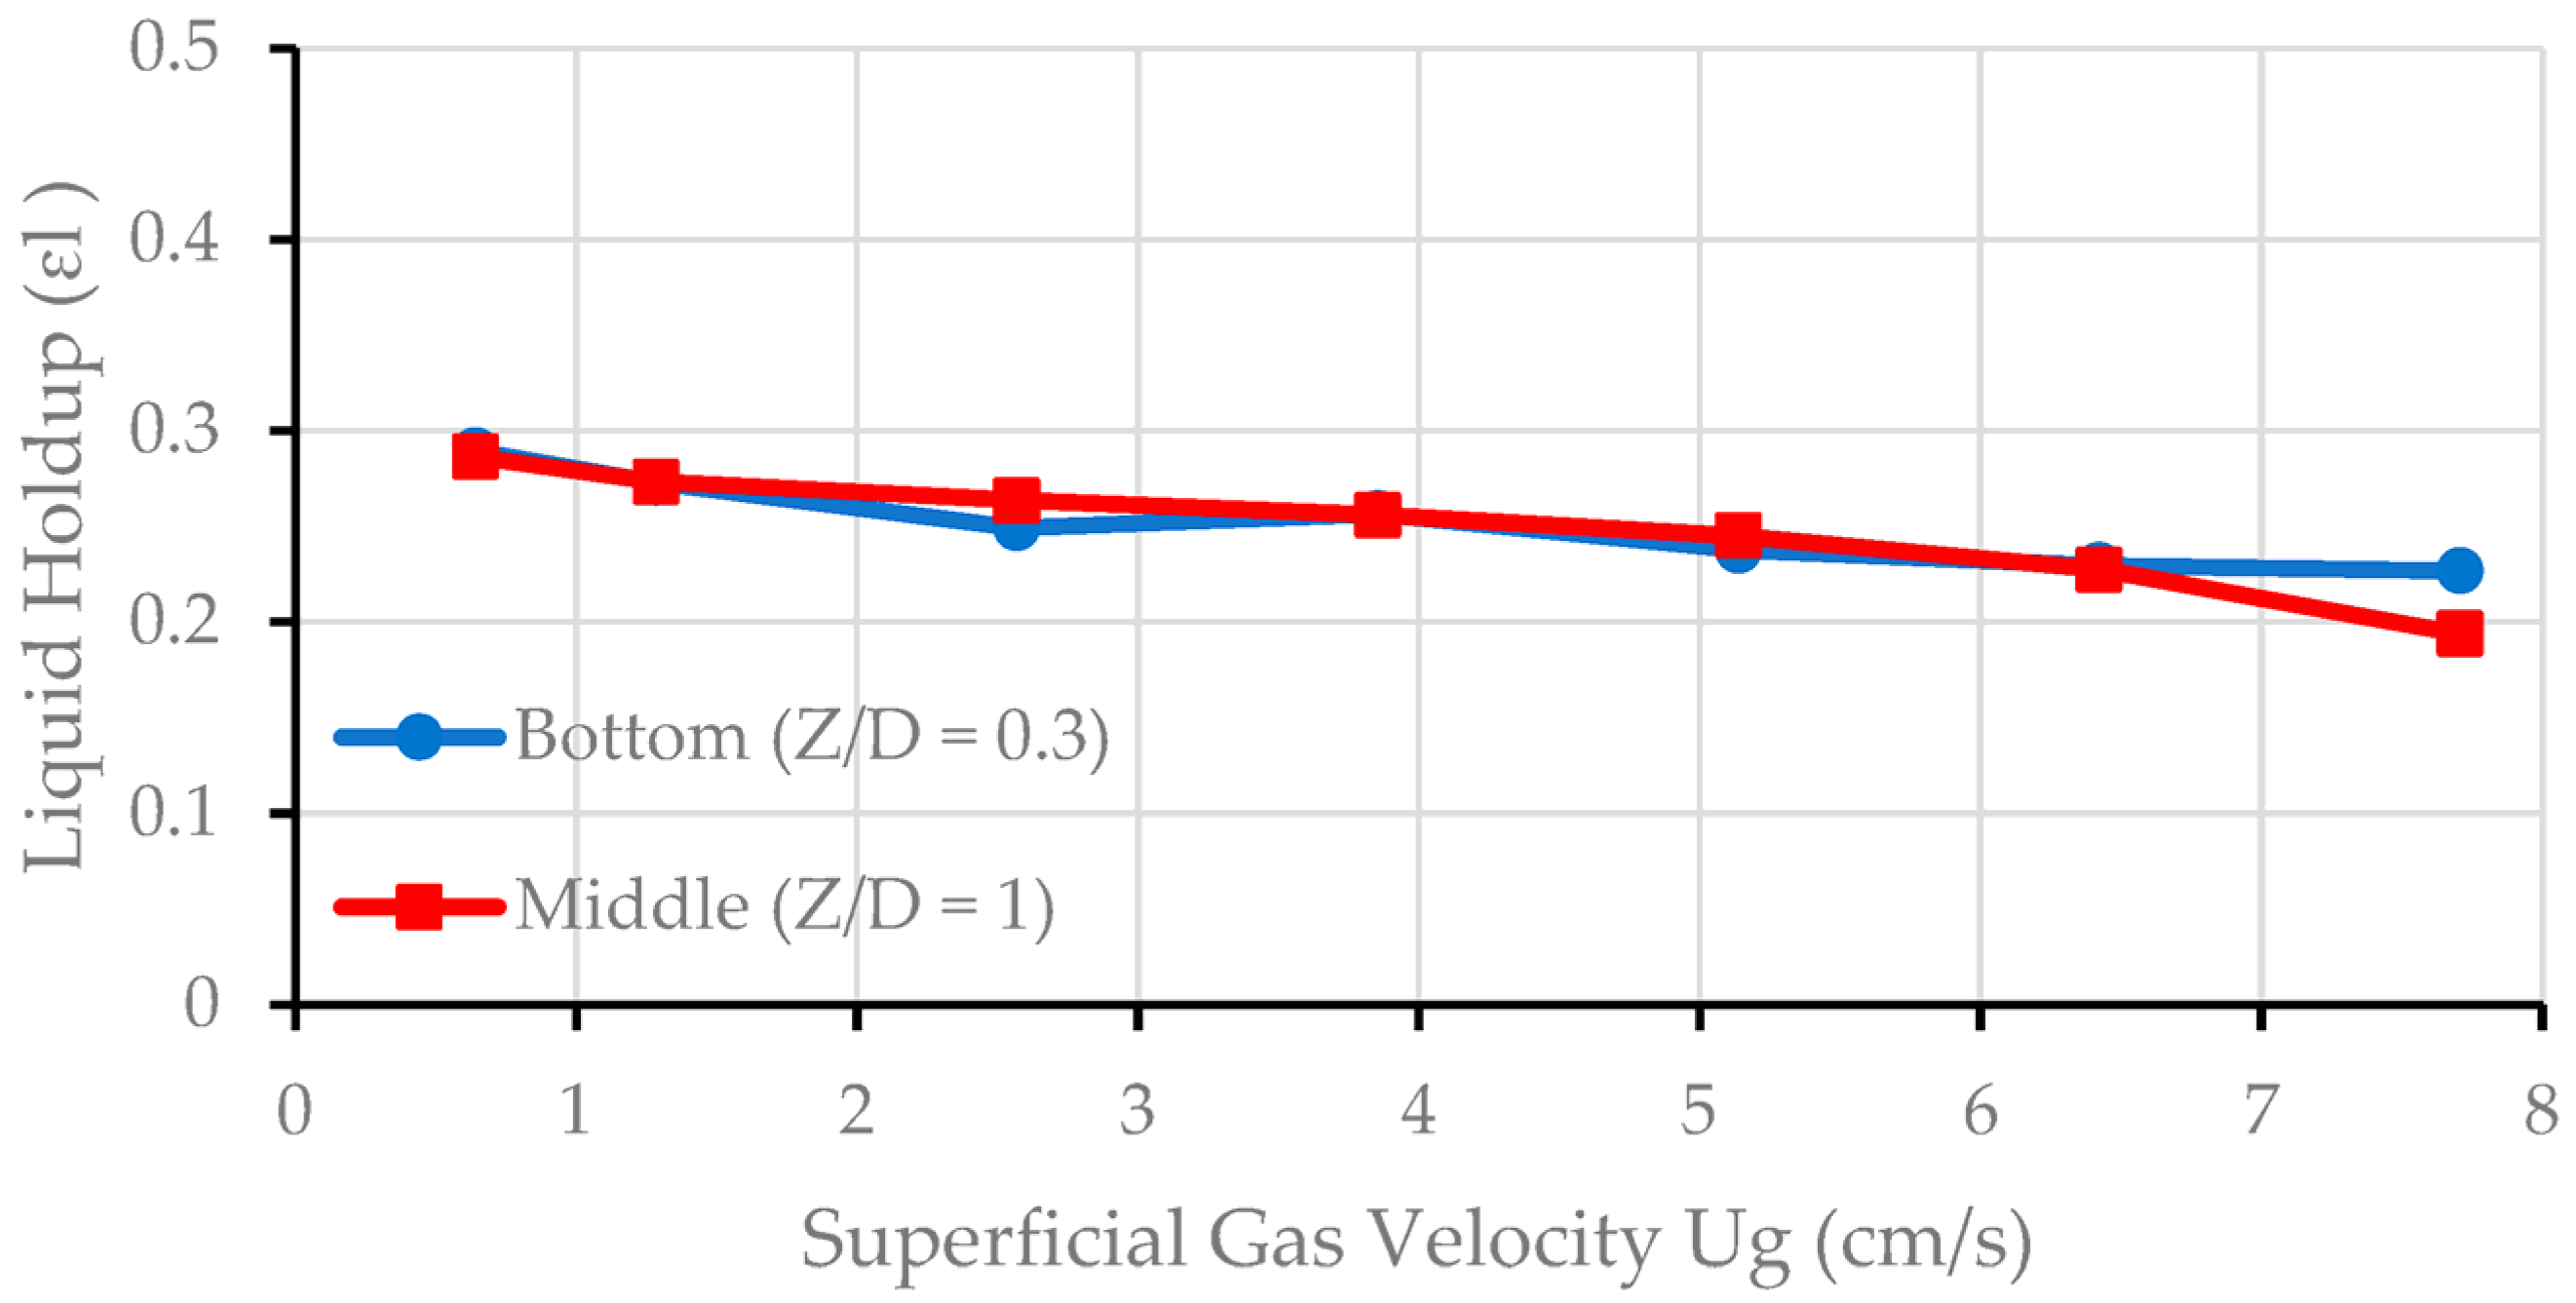
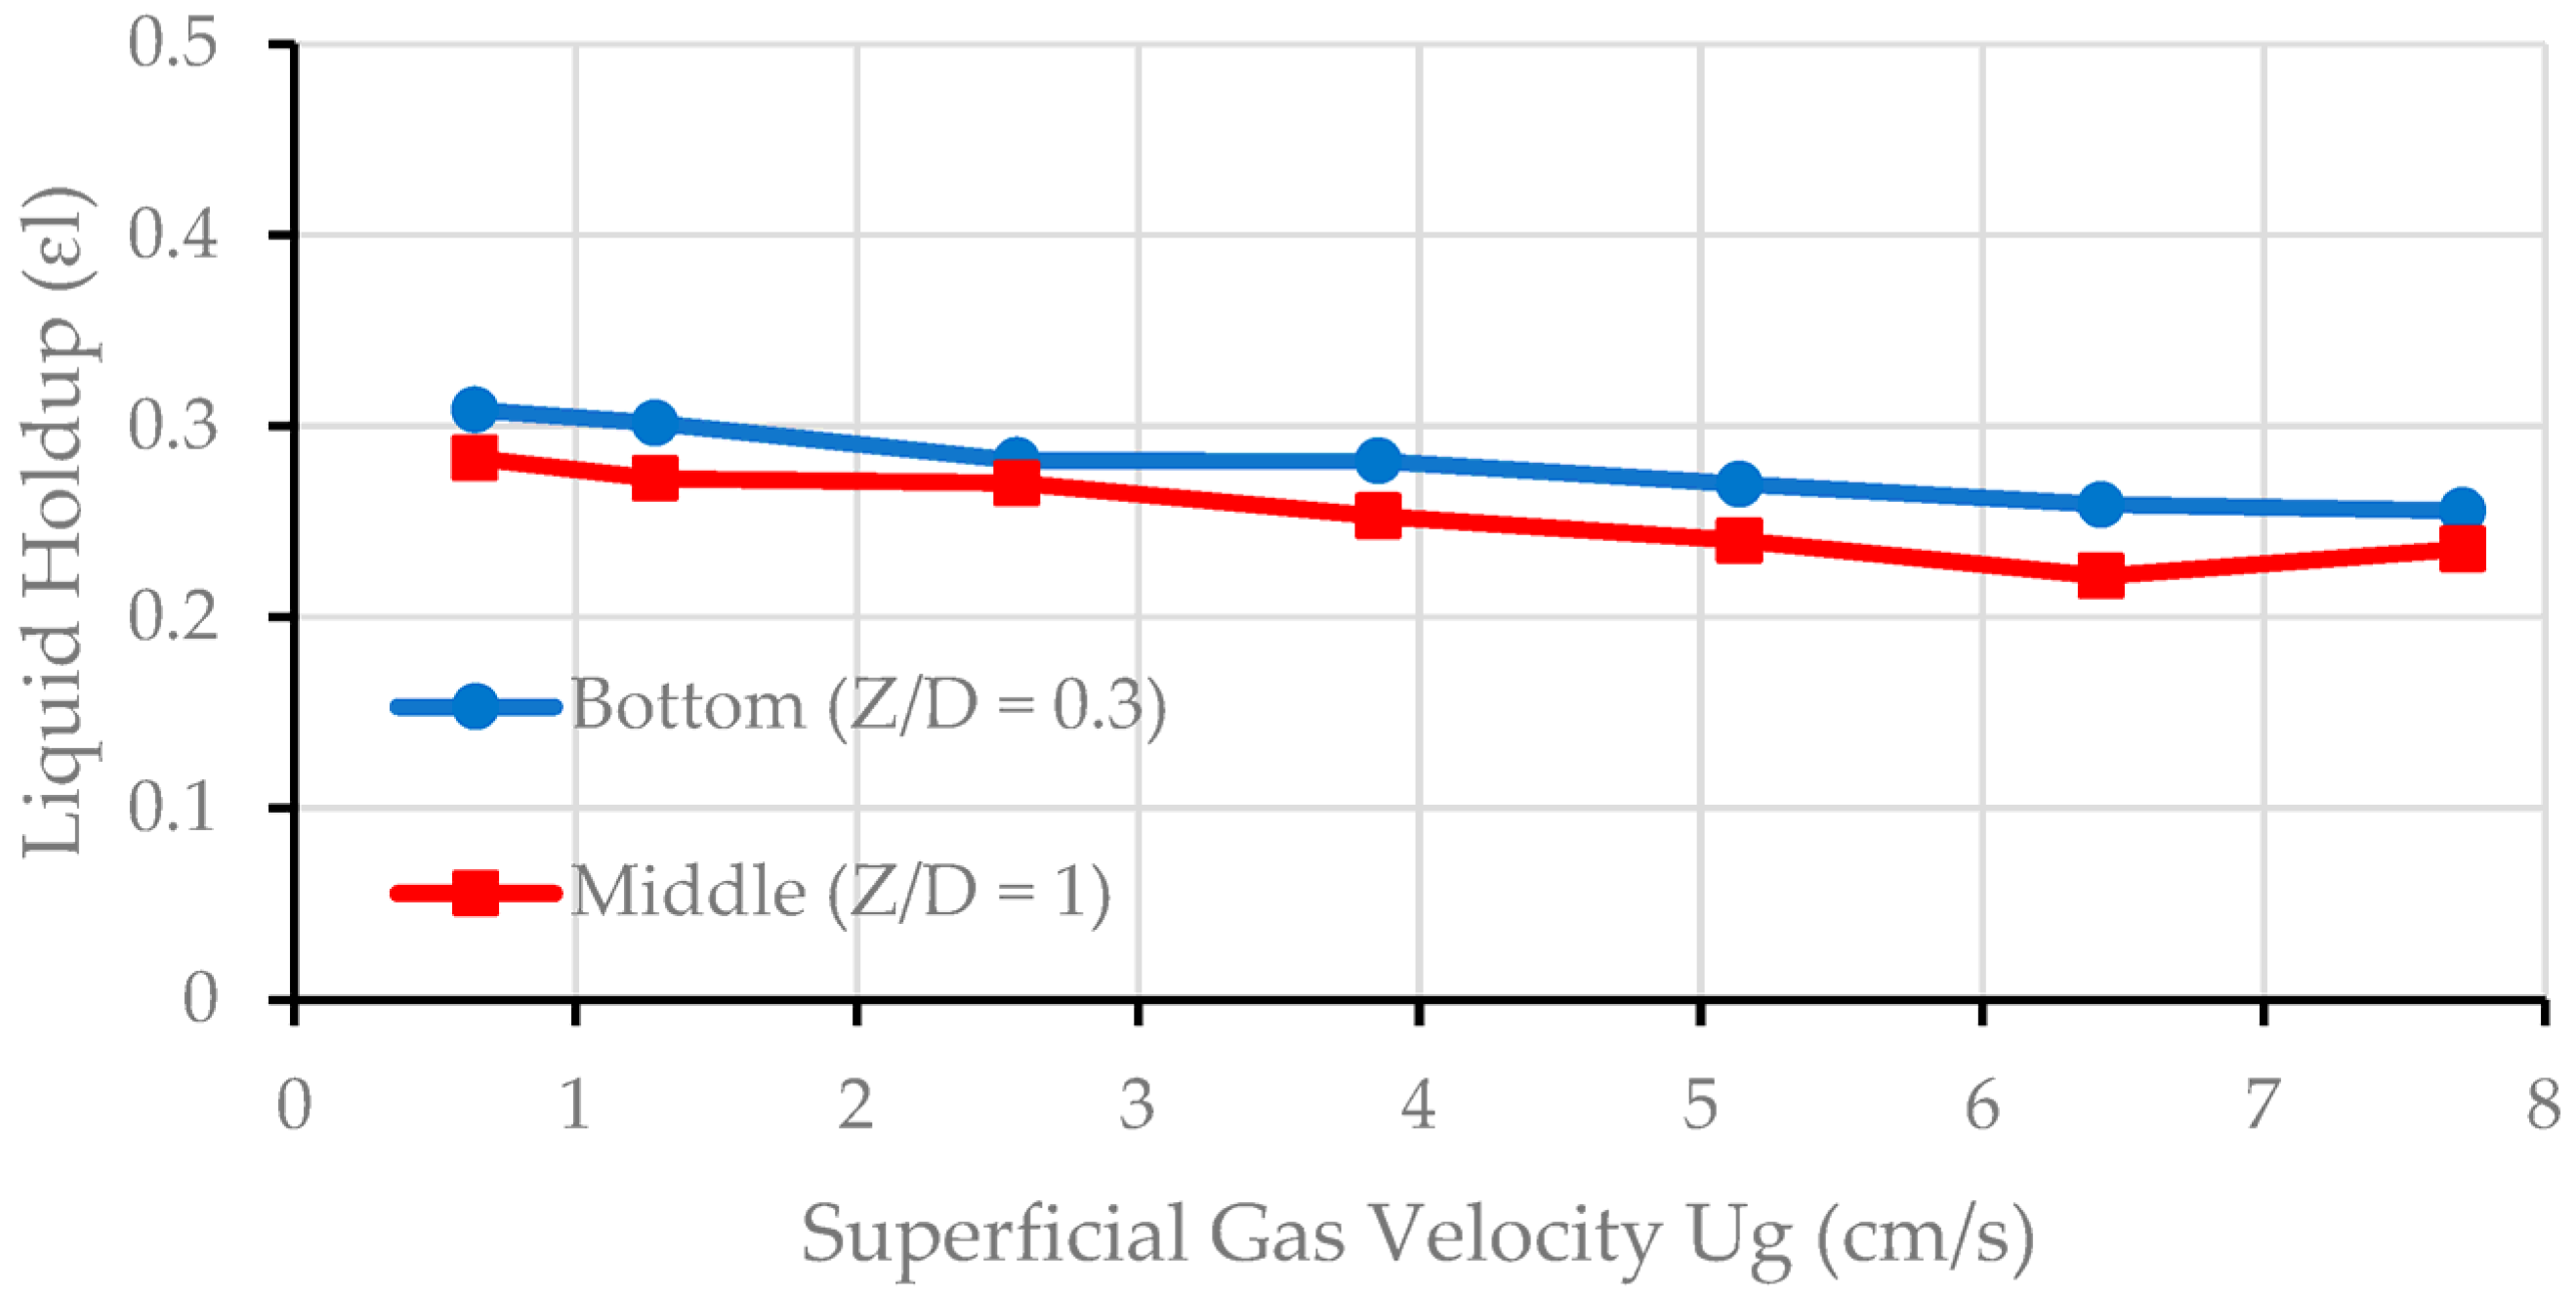
3.5. Effect of Superficial Velocity on the External Liquid Holdup

The radial distribution of the external liquid holdup at the bottom region (Z/D = 0.3) of the packed bed was analyzed across various superficial gas velocities (Ug = 0.6, 1.2, 3.8, and 7.7 cm/s) while maintaining a constant liquid velocity (Ul = 0.017 cm/s). The radial average liquid holdup was calculated for each gas velocity, showing a decreasing trend with increasing gas velocity, with averages of εr = 0.3, 0.29, 0.27, and 0.24, respectively, as showcased in Figure 11. This decline aligns with expectations, where higher gas velocities contribute to more pronounced deviations in liquid holdup. Specifically, the percentage deviations for increasing gas flow rates were approximately 11%, 12%, 13%, and 20%. Higher flow rates induce more chaotic behavior of the phases resulting in more random flow distributions. At lower superficial gas velocities, the external liquid holdup distribution tends to be relatively uniform. However, as the gas velocity increases, the distribution becomes skewed, often shifting towards one side of the column. This behavior may result from the combined influence of the column’s base and distributor designs, which can create preferential pathways for the flow, a phenomenon that is crucial to consider for reactor optimization [18,26].
The radial profile of the liquid holdup for the middle part (Z/D = 1) of the packed bed at superficial gas velocities (Ug = 0.6, 1.2, 3.8, and 7.7 cm/s) and at a constant liquid velocity (Ul = 0.017 cm/s) are shown in Figure 12. It appears in Figure 12 that with a slight decrease in the average, the liquid holdup values obtained for superficial gas velocities (Ug = 0.6, 1.2, 3.8, and 7.7 cm/s) are (εr = 0.27, 0.26, 0.24, and 0.21). In comparison to the average external liquid holdup values at Z/D = 0.3 and Z/D = 1 for respective liquid velocity, it is found to be quite similar but a little higher value for the bottom part. The percent deviation calculated for increasing flow rates is approximately as follows (10%, 11%, 11%, and 25%) and is seen to be increasing due to more random behavior due to the complex interaction of phases. At a lower flow rate the radial distribution is quite uniform as also observed for the bottom part. At a higher flow rate the flow distribution is better with respect to the bottom part, and this is due to the flow rearrangement along the axial height of the bed structure.

4. Remarks

The current study investigated the effect of varying superficial gas velocity at a constant superficial liquid velocity on the line average external liquid holdup (dynamic liquid holdup) in a co-current two-phase upflow moving packed bed reactor using gamma-ray densitometry (GRD). The line average internal porosity of the catalyst particles and line average external bed porosity have been measured also. The experiments were conducted in an upflow moving packed bed operated with an air–water system. The moving packed bed was packed randomly with 3 mm extrudate porous particles. The liquid holdup was measured based on the development of a new methodology for gamma-ray densitometry (GRD) using Beer–lambert’s equation. It has been found that the liquid holdup decreased as the superficial gas velocity increased at all axial and radial locations. The rate of decrease in liquid holdup at all locations except at walls is higher after 3.8 cm/sec and it is due to the transition from bubbly to pulse flow regime at this superficial gas velocity. The same trend was observed for reported studies on upflow packed bed reactors. The external liquid holdup is higher for the bottom part than the middle section of the packed bed for the same range of superficial gas velocities. At lower flow rates the liquid holdup distribution is quite uniform at both axial locations, but at higher flow rates the middle sections show better liquid flow distributions. The result shows that gamma-ray densitometry can indicate and measure the internal liquid holdup, and it is a reliable method for measuring the holdup inside packed beds with a thick wall. The comparison with available correlation on upflow packed bed showed a similar trend but a large absolute deviation. This necessitates further studies to develop predictable correlations for this kind of system.

Author Contributions

Conceptualization, A.T. and M.A.-D.; methodology, M.A.-D.; software, V.A.; validation, V.A., A.J. and M.A.-D.; formal analysis, A.T.; investigation, A.T.; resources, M.A.-D.; data curation, A.J.; writing—original draft preparation, A.T.; writing—review and editing, A.J.; visualization, A.J.; supervision, M.A.-D.; project administration, H.A.; funding acquisition, H.A. All authors have read and agreed to the published version of the manuscript.

Funding

This research received no external funding.

Data Availability Statement

The data presented in this study are available on request from the corresponding author.

Acknowledgments

The authors gratefully acknowledge the Higher Committee for Education Development in Iraq (HCED) for the financial support in the form of a scholarship, and Al-Dahhan for the funding provided for the experiments and the techniques and tools to perform this study in Multiphase Flows and Reactors Engineering and Education Laboratory (mFReel) at Missouri S&T.

Conflicts of Interest

The authors declare no conflicts of interest.

References

  1. Liu, Y.; Gao, L.; Wen, L.; Zong, B. Recent advances in heavy oil hydroprocessing technologies. Recent Pat. Chem. Eng. 2009, 2, 22–36. [Google Scholar] [CrossRef]
  2. Bartholomew, C. Catalyst Deactivation in Hydrotreating of Residua: A Review; Marcel Dekker: New York, NY, USA, 1994. [Google Scholar]
  3. Ancheyta, J.; Alvarez-Majmutov, A.; Leyva, C. Hydrotreating of oil fractions. In Multiphase Catalytic Reactors: Theory, Design, Manufacturing, and Applications; Wiley Online Library: Hoboken, NJ, USA, 2016; pp. 295–329. [Google Scholar]
  4. Scheuerman, G.L.; Johnson, D.R.; Reynolds, B.E.; Bachtel, R.W.; Threlkel, R.S. Advances in Chevron RDS technology for heavy oil upgrading flexibility. Fuel Process. Technol. 1993, 35, 39–54. [Google Scholar] [CrossRef]
  5. Yin, F.; Afacan, A.; Nandakumar, K.; Chuang, K.T. Liquid holdup distribution in packed columns: Gamma ray tomography and CFD simulation. Chem. Eng. Process. Process Intensif. 2002, 41, 473–483. [Google Scholar] [CrossRef]
  6. Reynolds, B.E.; Lam, F.W.; Chabot, J.; Antezana, F.J.; Bachtel, R.; Gibson, K.R.; Threlkel, R.; Leung, P.C. Upflow Reactor System with Layered Catalyst Bed for Hydrotreating Heavy Feedstocks; U.S. Patent and Trademark Office: Washington, DC, USA, 2003. [Google Scholar]
  7. Delmon, B. New technical challenges and recent advances in hydrotreatment catalysis. A critical updating review. Catal. Lett. 1993, 22, 1–32. [Google Scholar] [CrossRef]
  8. Jasim, A.A.; Sultan, A.J.; Al-Dahhan, M.H. Influence of heat-exchanging tubes diameter on the gas holdup and bubble dynamics in a bubble column. Fuel 2019, 236, 1191–1203. [Google Scholar] [CrossRef]
  9. Iliuta, I.; Larachi, F. Catalytic Wet Oxidation in Three-Phase Moving-Bed Reactors: Modeling Framework and Simulations for On-Stream Replacement of a Deactivating Catalyst. Ind. Eng. Chem. Res. 2013, 52, 370–383. [Google Scholar] [CrossRef]
  10. Chander, A.; Kundu, A.; Bej, S.K.; Dalai, A.K.; Vohra, D.K. Hydrodynamic characteristics of cocurrent upflow and downflow of gas and liquid in a fixed bed reactor. Fuel 2001, 80, 1043–1053. [Google Scholar] [CrossRef]
  11. Al-Dahhan, M.H.; Duduković, M.P. Catalyst Bed Dilution for Improving Catalyst Wetting in Laboratory Trickle-Bed Reactors. AIChE J. 1996, 42, 2594–2606. [Google Scholar] [CrossRef]
  12. Urrutia, G.; Bonelli, P.; Cassanello, M.C.; Cukierman, A.L. On dynamic liquid holdup determination by the drainage method. Chem. Eng. Sci. 1996, 51, 3721–3726. [Google Scholar] [CrossRef]
  13. Kumar, R.K.; Rao, A.R.; Sankarshana, T.; Khan, A. Liquid Holdup in Concurrent Gas Liquid Upflow Through Packed Column with Random and Corrugated Structured Packing. In Proceedings of the World Congress on Engineering and Computer Science, San Francisco, CA, USA, 24–26 October 2012. [Google Scholar]
  14. Guo, J.; Al-Dahhan, M. Liquid holdup and pressure drop in the gas-liquid cocurrent downflow packed-bed reactor under elevated pressures. Chem. Eng. Sci. 2004, 59, 5387–5393. [Google Scholar] [CrossRef]
  15. Hamidipour, M.; Larachi, F. Characterizing the liquid dynamics in cocurrent gas–liquid flows in porous media using twin-plane electrical capacitance tomography. Chem. Eng. J. 2010, 165, 310–323. [Google Scholar] [CrossRef]
  16. Al-Dahhan, M.; Highfill, W. Liquid holdup measurement techniques in laboratory high pressure trickle bed reactors. Can. J. Chem. Eng. 1999, 77, 759–765. [Google Scholar] [CrossRef]
  17. Hubers, J.L.; Striegel, A.C.; Heindel, T.J.; Gray, J.N.; Jensen, T.C. X-ray computed tomography in large bubble columns. Chem. Eng. Sci. 2005, 60, 6124–6133. [Google Scholar] [CrossRef]
  18. Boyer, C.; Duquenne, A.-M.; Wild, G. Measuring techniques in gas–liquid and gas–liquid–solid reactors. Chem. Eng. Sci. 2002, 57, 3185–3215. [Google Scholar] [CrossRef]
  19. Shi, W.; Yin, G.; Wang, M.; Tao, L.; Wu, M.; Yang, Z.; Bai, J.; Xu, Z.; Zhu, Q. Progress of Electrical Resistance Tomography Application in Oil and Gas Reservoirs for Development Dynamic Monitoring. Processes 2023, 11, 2950. [Google Scholar] [CrossRef]
  20. Wang, Q.; Polansky, J.; Wang, M.; Wei, K.; Qiu, C.; Kenbar, A.; Millington, D. Capability of dual-modality electrical tomography for gas-oil-water three-phase pipeline flow visualisation. Flow Meas. Instrum. 2018, 62, 152–166. [Google Scholar] [CrossRef]
  21. Park, H.-S.; Chung, C.-H. Design and application of a single-beam gamma densitometer for void fraction measurement in a small diameter stainless steel pipe in a critical flow condition. Nucl. Eng. Technol. 2007, 39, 349–358. [Google Scholar] [CrossRef]
  22. Shollenberger, K.A.; Torczynski, J.R.; Adkins, D.R.; O’Hern, T.J.; Jackson, N.B. Gamma-densitometry tomography of gas holdup spatial distribution in industrial-scale bubble columns. Chem. Eng. Sci. 1997, 52, 2037–2048. [Google Scholar] [CrossRef]
  23. Alexander, V.; Albazzaz, H.; Al-Dahhan, M. Gas phase dispersion/mixing investigation in a representative geometry of gas-liquid upflow Moving Bed Hydrotreater Reactor (MBR) using developed gas tracer technique and method based on convolution/regression. Chem. Eng. Sci. 2019, 195, 671–682. [Google Scholar] [CrossRef]
  24. Toukan, A.; Alexander, V.; AlBazzaz, H.; Al-Dahhan, M.H. Identification of flow regime in a cocurrent gas–Liquid upflow moving packed bed reactor using gamma ray densitometry. Chem. Eng. Sci. 2017, 168, 380–390. [Google Scholar] [CrossRef]
  25. Qi, B.; Farid, O.; Uribe, S.; Al-Dahhan, M. Maldistribution and dynamic liquid holdup quantification of quadrilobe catalyst in a trickle bed reactor using gamma-ray computed tomography: Pseudo-3D modelling and empirical modelling using deep neural network. Chem. Eng. Res. Des. 2020, 164, 195–208. [Google Scholar] [CrossRef]
  26. Wild, G.; Larachi, F.; Laurent, A. The hydrodynamic characteristics of cocurrent downflow and cocurrent upflow gas-liquid-solid catalytic fixed bed reactors: The effect of pressure. Oil Gas Sci. Technol. 1991, 46, 467–490. [Google Scholar] [CrossRef]
  27. Alexander, V. Hydrodynamics Related Performance Evaluation of Upflow Moving Bed Hydrotreater Reactor (MBR) Using Developed Experimental Methods and CFD Simulation. Ph.D. Thesis, Missouri University of Science and Technology, Rolla, MO, USA, 2018. [Google Scholar]
  28. Al-Dahhan, M.; Kemoun, A.; Cartolano, A. Phase distribution in an upflow monolith reactor using computed tomography. AIChE J. 2006, 52, 745–753. [Google Scholar] [CrossRef]
  29. Rados, N.; Shaikh, A.; Al-Dahhan, M. Phase distribution in a high pressure slurry bubble column via a single source computed tomography. Can. J. Chem. Eng. 2005, 83, 104–112. [Google Scholar] [CrossRef]
  30. Efhaima, A.; Al-Dahhan, M.H. Local time-averaged gas holdup in fluidized bed reactor using gamma ray computed tomography technique (CT). Int. J. Ind. Chem. 2015, 6, 143–152. [Google Scholar] [CrossRef]
  31. Schlieper, G. Principles of gamma ray densitometry. Met. Powder Rep. 2000, 55, 20–23. [Google Scholar] [CrossRef]
  32. Bouteldja, H.; Hamidipour, M.; Larachi, F. Hydrodynamics of an inclined gas–liquid cocurrent upflow packed bed. Chem. Eng. Sci. 2013, 102, 397–404. [Google Scholar] [CrossRef]
  33. Jasim, A.A.; Sultan, A.J.; Al-Dahhan, M.H. Impact of heat exchanging internals configurations on the gas holdup and bubble properties in a bubble column. Int. J. Multiph. Flow 2019, 112, 63–82. [Google Scholar] [CrossRef]
  34. Saroha, A.K.; Khera, R. Hydrodynamic study of fixed beds with cocurrent upflow and downflow. Chem. Eng. Process. Process Intensif. 2006, 45, 455–460. [Google Scholar] [CrossRef]
Figure 1. Experimental setup: (a) schematic representation, (b) photo of the setup, (c) lab-scale TBR, and (d) internals.
Chemengineering 08 00054 g001
Figure 2. (a) Schematic diagram of GRD showing the arrangement of source, the packed bed, the collimators, and the detector, and (b) radial scanning points.
Chemengineering 08 00054 g002
Figure 3. Diameter profile of external catalyst bed void space (εβ).
Chemengineering 08 00054 g003
Figure 4. Radial distribution of line average internal liquid holdup which is equivalent to the volume of the porosity of the catalysts with respect to the bed volume.
Chemengineering 08 00054 g004
Figure 5. Radial distribution of solid holdup (εs).
Chemengineering 08 00054 g005
Figure 6. Liquid holdup ( ε l ) at (r/R = 0), center.
Chemengineering 08 00054 g006
Figure 7. Liquid holdup ( ε l ) at (r/R = 0.5), right side.
Chemengineering 08 00054 g007
Figure 8. Liquid holdup ( ε l ) at (r/R = −0.5), left side.
Chemengineering 08 00054 g008
Figure 9. Liquid holdup ( ε l ) at (r/R = 0.9), right side of the packed bed.
Chemengineering 08 00054 g009
Figure 10. Liquid holdup ( ε l ) at (r/R = −0.9), left side of the packed bed.
Chemengineering 08 00054 g010
Figure 11. Effect of superficial gas velocity (Ug) on the liquid holdup.
Chemengineering 08 00054 g011
Figure 12. Effect of superficial gas velocity (Ug) on the liquid holdup at middle (Z/D = 1) of the packed bed at Ul = 0.017 cm/s.
Chemengineering 08 00054 g012
Table 1. Description of the experimental setup and conditions.
Column dimensions
Bed height57 inches
Column diameter (inner)11 inches
Dimensionless axial measurement positions (Z/L)Z/L = 0.38 (bottom), and Z/L = 1 (middle)
Dimensionless radial positions (r/R)0, +0.5, −0.5, +0.9, −0.9
Experimental conditions
Superficial gas velocity Ug = 0.6, 1.2, 3.8, 7.7 cm/s
Superficial liquid velocityUl = 0.017 cm/s (constant)
Catalyst properties
GeometrySpherical, 3 mm in diameter
Bulk density570 kg/m3
Disclaimer/Publisher’s Note: The statements, opinions and data contained in all publications are solely those of the individual author(s) and contributor(s) and not of MDPI and/or the editor(s). MDPI and/or the editor(s) disclaim responsibility for any injury to people or property resulting from any ideas, methods, instructions or products referred to in the content.

