3. Results
The chemical composition, determined by the ICP-OES method, and the specific surface area of the samples, determined by low-temperature nitrogen adsorption, are compared in
Table 1.
The content of the transition metals—cobalt and nickel separately and both cobalt and nickel in the bimetallic samples—is in the range of 5.41–5.68 wt.% (
Table 1), indicating their very similar loadings in the studied catalysts. The specific surface area (S
BET) values, determined for the samples calcined at 600 °C and shown in
Table 1, are significantly higher for the hydrotalcite-derived materials compared to MgO and γ-Al
2O
3. Interestingly, the calcined hydrotalcite-like samples containing transition metals presented a higher specific surface area compared to the calcined Mg-Al hydrotalcites without transition metals. The deposition of cobalt or nickel on γ-Al
2O
3 decreased its specific surface area by approximately 10%, while in the case of MgO, a significant increase in S
BET was observed after transition-metal deposition. This interesting effect could be explained by the formation of transition-metal-oxide aggregates on the MgO surface, which possibly contribute to the increased surface area of the catalysts. The specific surface area was also determined for the MgO and γ-Al
2O
3 supports, as well as for the calcined Mg-Al hydrotalcites at 800 °C (
Table 1, values in parentheses). The S
BET values of the samples calcined at 800 °C are lower than those determined for materials thermally treated at 600 °C. In the case of MgO and HT40, the specific surface area decreased by about 20%, while for γ-Al
2O
3 and HT20, it decreased by 9 and 4%, respectively.
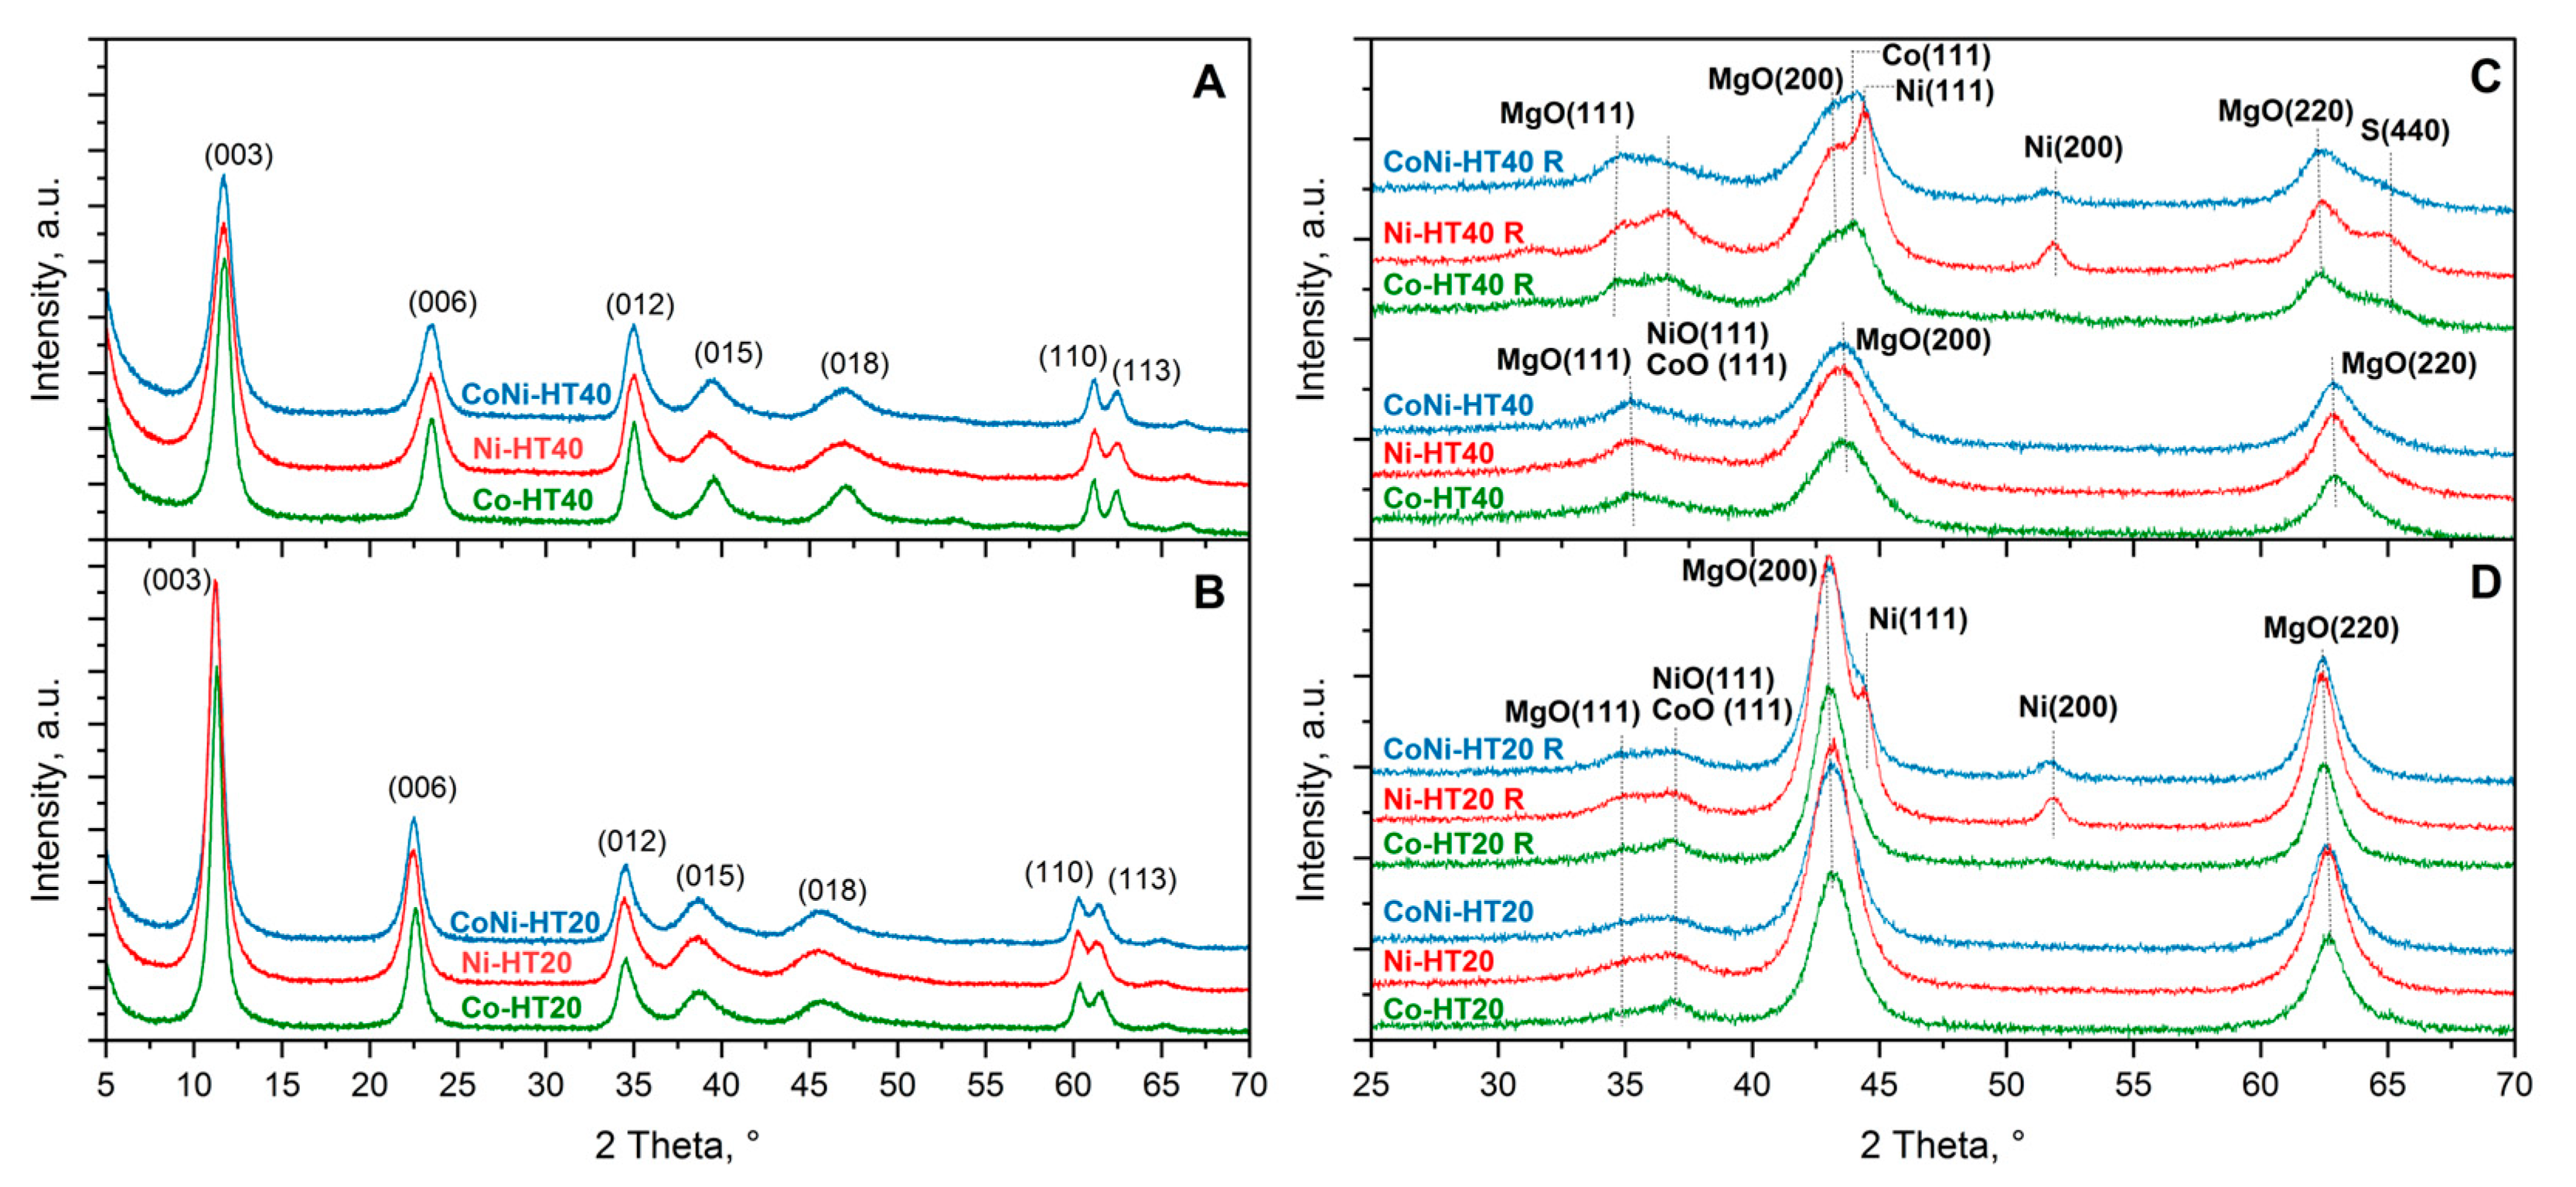
The structure of the catalytic materials was analysed by the X-ray diffraction method.
Figure 1 presents diffractograms recorded for the catalytic supports γ-Al
2O
3 and MgO, as well as for these supports after modification with cobalt and nickel deposited by the impregnation method. Apart from the characteristic diffraction peaks of alumina [
18] and magnesium oxides [
19], no other reflections were found. The deposition of cobalt on γ-Al
2O
3 followed by calcination at 600 °C resulted in the appearance of new reflections characteristic of CoO [
20] and spinel phases, possibly Co
3O
4 or CoAl
2O
4 [
21]. Neither the formation of NiO, nor that of any spinel phases, was detected for nickel-modified alumina support [
22]. Simultaneous deposition of cobalt and nickel into γ-Al
2O
3, in a process similar to that seen for the sample modified with cobalt, resulted in new diffraction peaks at positions characteristic of the CoO and spinel phases. Significant changes were observed in the diffractograms of the samples reduced in hydrogen flow at 800 °C (
Figure 1A). In the case of the Ni-A and Co-A samples, the characteristic reflections of metallic nickel [
23] and cobalt [
24] were identified. The intensity of the characteristic reflections of nickel is significantly higher compared to that of the reflections representing metallic cobalt. The positions of these reflections in diffractograms of the sample containing both nickel and cobalt, CoNi-A, are between the characteristic diffraction peaks of metallic nickel and cobalt in the diffractograms of Ni-A and Co-A, respectively (
Figure 1A), indicating the formation of bimetallic Ni-Co crystallites. The structure of γ-Al
2O
3 was not destroyed by thermal treatment in a hydrogen flow at 800 °C.
The diffractogram recorded for the MgO support is characterised by peaks typical of magnesium oxide diffraction [
19]. Any new reflections were observed after deposition of nickel, cobalt or both these metals on MgO, followed by calcination at 600 °C (
Figure 1B). However, the reduction of these samples in a hydrogen flow at 800 °C resulted in the appearance of new diffraction peaks characteristic of metallic nickel (Ni-M) [
23] and cobalt (Co-M) [
24]. The appropriate diffraction peaks recorded for the CoNi-M sample are located between the positions characteristic of metallic nickel and cobalt. Thus, the formation of bimetallic Ni-Co crystallites is supposed in the case of the CoNi-M sample (
Figure 1B).
The third series of catalysts was obtained by synthesis of hydrotalcite-like samples containing, apart from magnesium and aluminium, various contents of nickel, cobalt, or both of these metals. The diffractograms recorded for these samples prove that their structure is characteristic of hydrotalcite-like materials (
Figure 2A,B). Beyond the characteristic reflections of the hydrotalcite structure [
25], no other diffraction peaks were found, indicating the high phase purity of the obtained samples. Calcination of hydrotalcite-like samples at 600 °C resulted in their thermal decomposition into mixed metal-oxide systems (
Figure 2C,D). In diffractograms of samples with the lower Al/Mg ratio (HT20 series), only reflections characteristic of periclase [
26] could be identified. For samples with the higher Al/Mg ratio (HT40 series), additional broad reflections characteristic of NiO [
27] and CoO [
28] were detected. Thus, it seems that segregation of the transition-metal oxides under calcination conditions is more privileged in the Mg-Al oxide matrix with higher alumina content. Reduction of hydrotalcite-derived samples in a hydrogen flow at 800 °C resulted in the appearance of diffraction peaks characteristic of metallic nickel [
23]. Any reflections indicating metallic cobalt were found in the diffractogram of the reduced Co-HT20 sample, while in the case of Co-HT40, only a shoulder at 44°, possibly assigned to the plane (111) of metallic cobalt, was identified [
24] (
Figure 2C,D). Thus, the formation of metallic nickel crystallites is more privileged than the formation of metallic cobalt crystallites. The position of the metallic nickel reflections in diffractograms of CoNi-HT20 and CoNi-HT40 is slightly shifted to lower values of 2 theta angles compared to Ni-HT20 and Ni-HT40. Thus, the formation of bimetallic Ni-Co crystallites also cannot be excluded in this series of samples. Interestingly, for the reduced samples of this series, reflections characteristic of NiO and CoO, as well as those characteristic of spinel phases, were found. This finding could be related to the presence of nickel and cobalt species that are only slightly reduced and that are stabilised in the magnesium-aluminium oxide matrix.
The average sizes of transition-metal (TM) crystallites in the reduced samples are compared in
Table 1. The average size of the metallic nickel and cobalt deposited on Al
2O
3 and MgO was in the range of 10.6–17.3 nm. The most significant difference in the average crystallite size was observed for bimetallic samples: 10.4 nm for CoNi-A and 20.6 nm for CoNi-M. In the case of the hydrotalcite-derived samples, the estimated average sizes of Ni particles in the reduced catalysts were about 12 and 13 nm for Ni-HT20 and Ni-HT40, respectively. In diffractograms recorded for Co-HT20 and Co-HT40, either the reflection characteristics of metallic cobalt were not found, or the intensity of these diffraction peaks was too low to determine the size of the cobalt crystallites. The obtained results show that cobalt has a lower mobility and tendency to aggregation in the Mg-Al oxide matrix compared to nickel. In the case of bimetallic samples (CoNi-HT20 and CoNi-HT40) the estimated size of Ni-Co metallic crystallites was about 10 nm.
The surface area and content of the reduced metals were determined by pulse H
2 chemisorption for the bimetallic samples: CoNi-M, CoNi-A and CoNi-HT40 (
Table 2). The average size of metal particles, determined assuming a spherical model of such species, is about 2700 nm for CoNi-M, 700 nm for CoNi-A and 255 nm for CoNi-HT40. In general, the size of such metal particles is significantly larger than the average size of metal crystallites determined by the XRD method. Thus, it could be concluded that metal particles are composed of stuck-together metal crystallites. The smallest metal aggregates are formed in the case of hydrotalcite-derived samples and those containing only cobalt or nickel (345 nm for Co-HT40 and 175 nm for Ni-HT40). SEM micrographs of the studied samples are presented in
Figure 3. In the case of the CoNi-M sample, relatively large particles of aggregated crystallites of metal oxides, with the dominant size in the range 1800–3800 nm, can be distinguished (exemplary particles are indicated by white arrows). In general, the size of these aggregates correlates with their average size, as determined by H
2-pulse measurements (
Table 2). Much smaller metal-oxide aggregates were found in the CoNi-A sample. The dominant size of these aggregates is in the range 450–850 nm, which agrees with the results of the H
2-pulse measurements (
Table 2). The micrographs of hydrotalcite-derived materials show their cauliflower-like morphology composed of stuck-together crystallites and amorphous aggregates. In this case, it is difficult to distinguish metal-oxide aggregates. Possibly, they are much better dispersed and are partially occluded in the MgO-Al
2O
3 matrix.
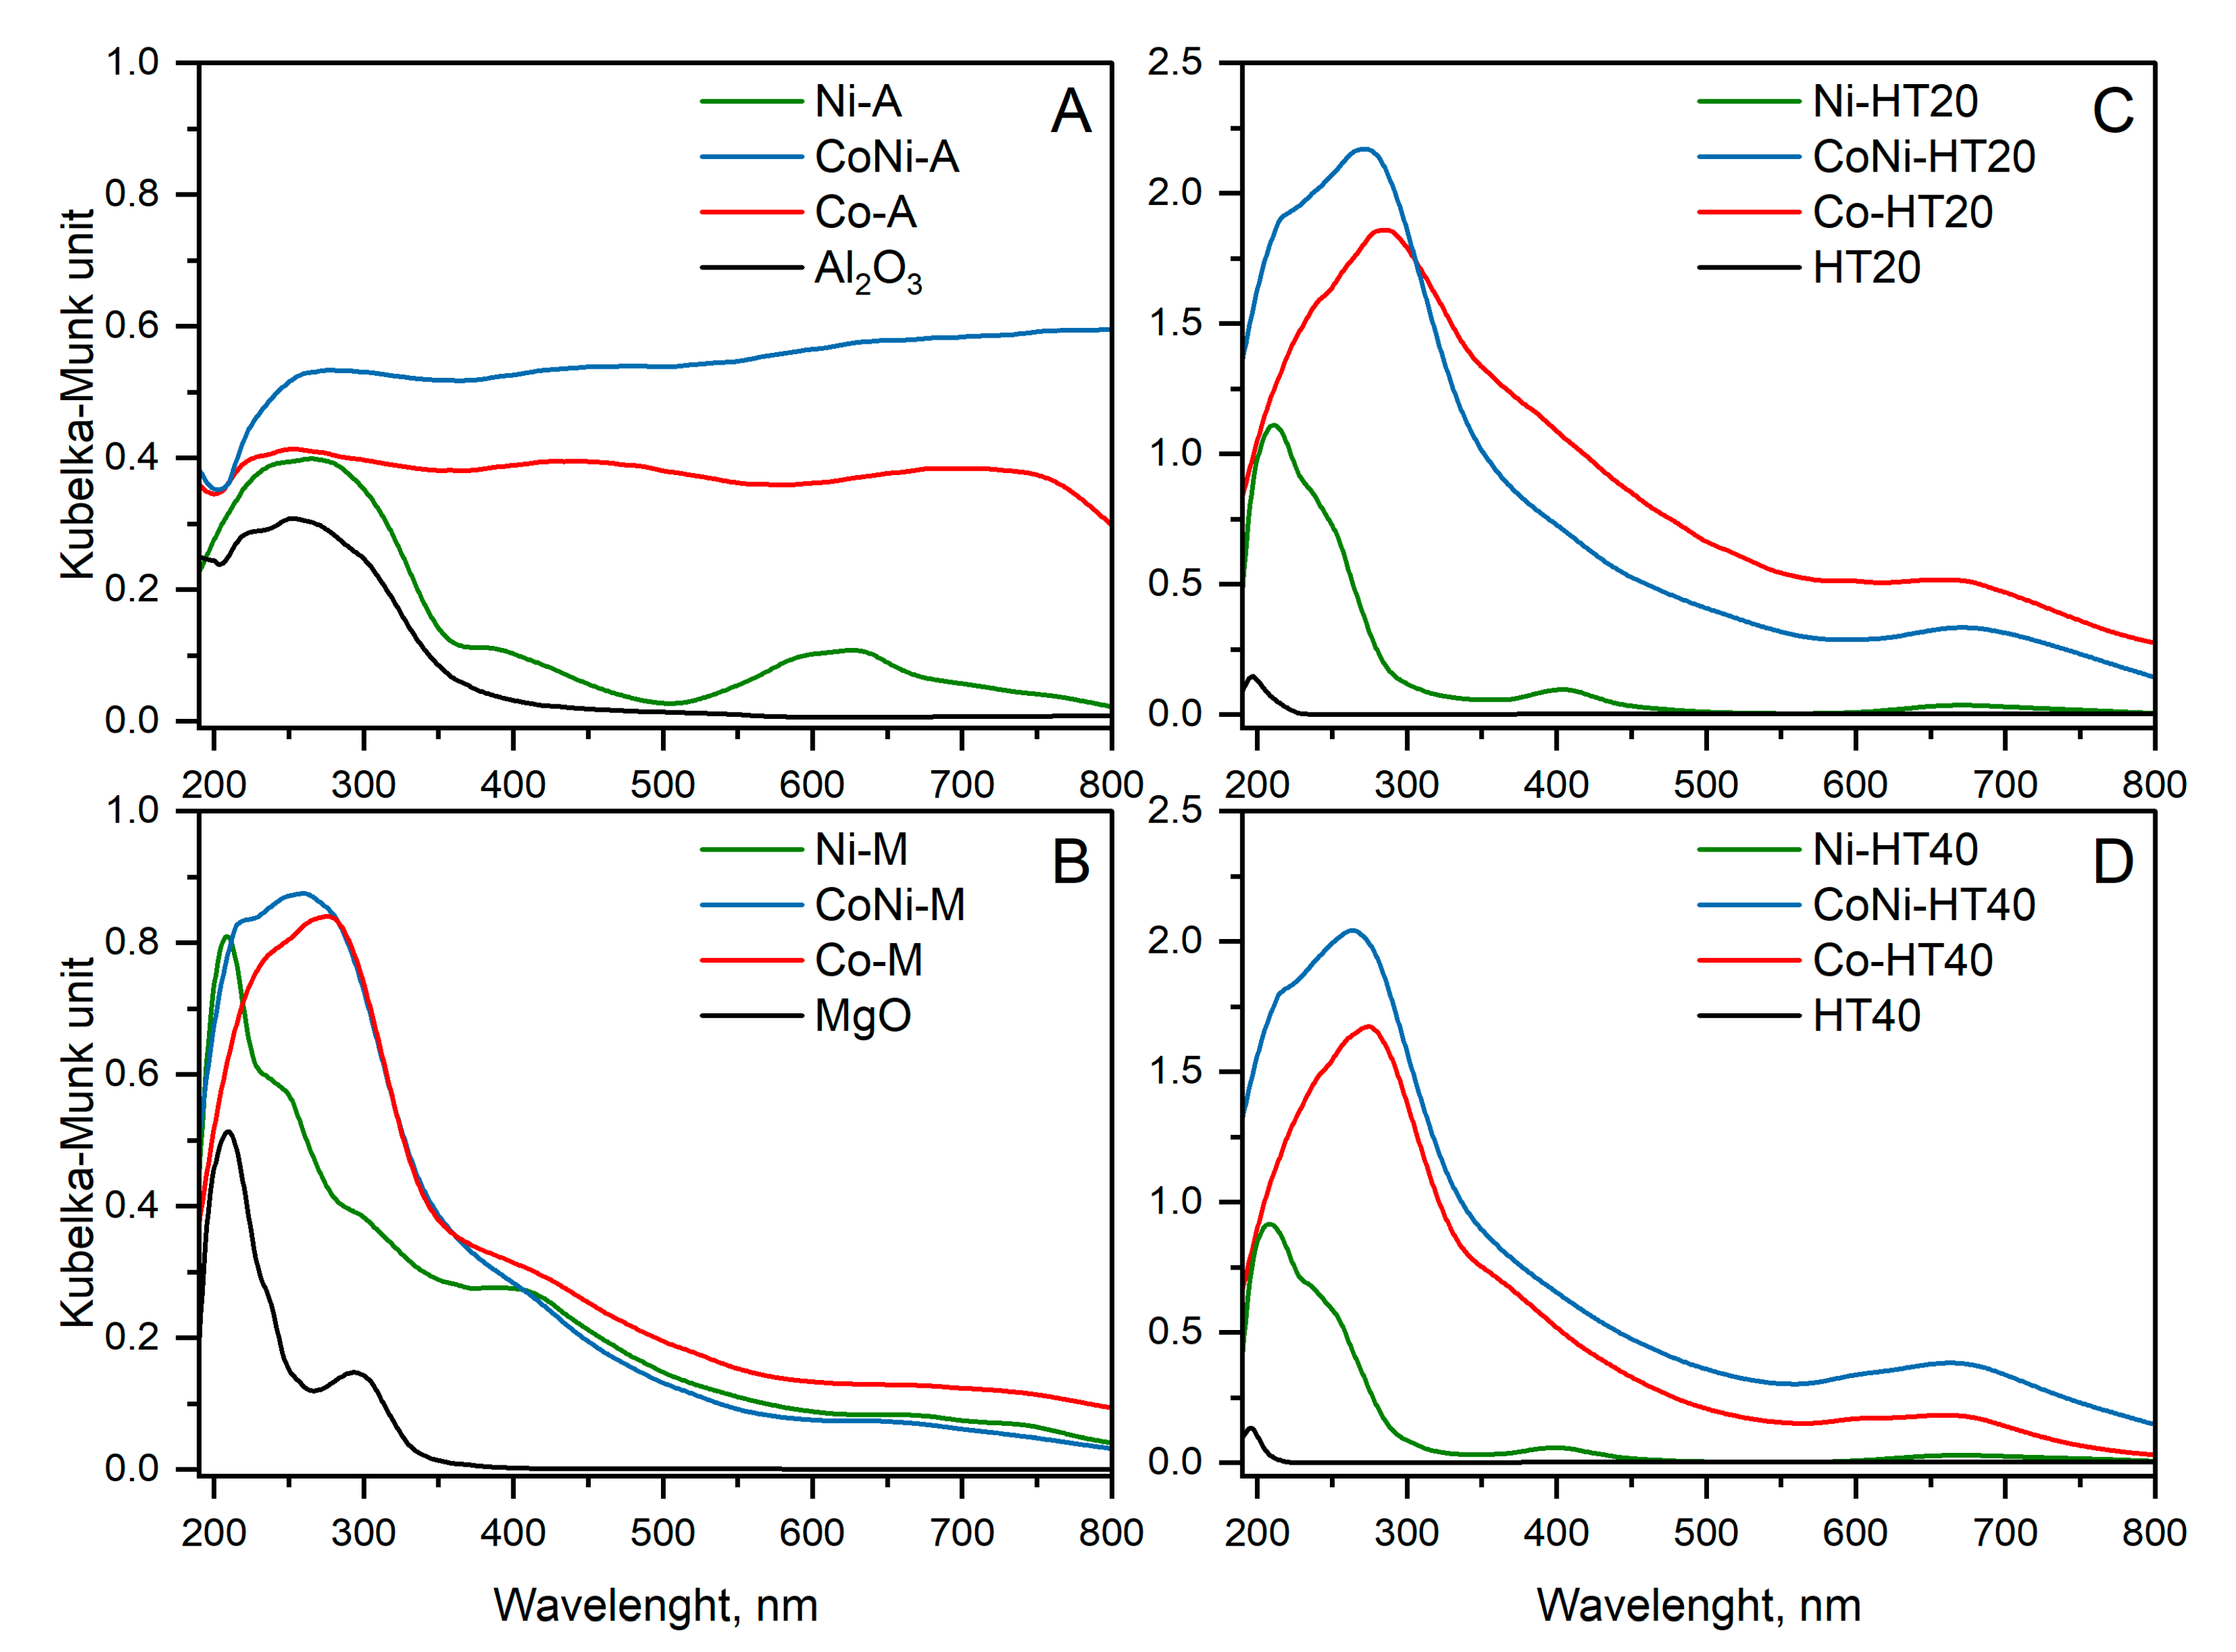
The form and aggregation of transition metals in catalysts was analysed by UV-VIS DRS studies (
Figure 4). The spectrum recorded for Al
2O
3 not modified with transition metals was characterised by a broad band centred at approximately 255 nm (
Figure 4A) associated with electronic-charge transfer and with the accumulation of defects in the structure of this material [
29]. In a spectrum of Ni-A, the absorption band at around 380 nm is assigned to octahedrally coordinated Ni
2+ cations. The band at about 600 nm corresponds to the tetrahedral Ni
2+ cations in the NiAl
2O
4 spinel, whereas that around 635 nm is due to the d-d transition of octahedral Ni
2+ in Ni-oxides [
30,
31,
32,
33,
34]. Thus, besides the nickel in NiO, there is also a significant contribution of nickel in the spinel phase formed by the interaction of deposited metal with the alumina support.
The absorption band located at about 210 nm in a pure MgO spectrum (
Figure 4B) is assigned to the excitation of five coordinated oxygen anions from the periclase structure [
35]. The absorption peak around 295 nm and the shoulder at approximately 235 nm are usually assigned to the excitation of defect states, which belong to O
2− surface anions at the edges and corners of the MgO nanocrystals [
36]. In a spectrum of Ni-M, the absorption band around 390 nm and the shoulder around 635 nm are assigned to octahedrally coordinated Ni
2+ cations in Ni-oxides [
32].
The spectra recorded for the calcined Mg-Al hydrotalcites (HT20 and HT40 in
Figure 4C,D) are characterised by a small peak at about 200 nm related to the excitation of five coordinated oxygen anions from the periclase structure [
35]. Periclase was identified as the dominant phase formed from the thermal decomposition of hydrotalcite (
Figure 2B). The spectra obtained for the calcined Ni-Mg-Al hydrotalcites, Ni-HT20 and Ni-HT40, show intense bands at 205–210 nm with a shoulder at about 235–250 nm, which possibly indicates the presence of defects related to O
2− surface anions at the edges and corners of the MgO nanocrystals [
36]. Thus, thermal decomposition of Ni-Mg-Al hydrotalcite results in a more defected periclase in comparison to the decomposition of Mg-Al hydrotalcite. The broad bands at around 400 nm and a shoulder around 650 nm are assigned to octahedrally coordinated Ni
2+ cations in Ni-oxides [
32].
The Co-A spectrum consists of three not-fully-resolved maxima centred at about 275, 405 and 675 nm (
Figure 4A). The first band is related to the alumina support; however, in this range, the band assigned to the O
2−→Co
2+ charge transition could also be expected [
37]. The bands at around 405 and 675 nm are related to coordination-metal charge transfer between O
2−→Co
2+ and O
2−→Co
3+ in Co
3O
4, respectively [
20]. The presence of a CoAl
2O
4 spinel phase also cannot be excluded in this case. Similar bands were identified for the Co-M sample; however, peaks at about 405 and 670 nm, assigned to the presence of Co
3O
4 spinel, are significantly less intense (
Figure 4B). On the other hand, the broad band at about 225 nm is a superposition of the bands assigned to MgO and to the O
2−→Co
2+ charge transition [
37]. Thus, in the Co-M sample, the contribution of the Co
3O
4 spinel is lower compared to that of the Co-A catalyst.
The spectra recorded for Co-Mg-Al hydrotalcite-derived samples are characterised by a broad maximum centred at about 275–285 nm with a shoulder around 400 nm and a band centred at about 675 nm (
Figure 4C,D). The first peak is a superposition of the bands characteristic of the periclase and the O
2−→Co
2+ charge transition [
35,
37], while the bands around 400 and 675 nm are assigned to the coordination-metal charge transfer between O
2−→Co
2+ and O
2−→Co
3+ in Co
3O
4, respectively [
20].
The spectrum of the bimetallic CoNi-A sample is very complex (
Figure 4A). The band around 260–280 nm is related to the alumina support, but in this range, the band indicating the O
2−→Co
2+ charge transition could also be present [
37]. At higher wavelength values, spectrum analysis is difficult and very speculative; however, it seems that the broad band centred at about 450–490 nm is related to coordination-metal charge transfer between O
2−→Co
2+ in Co
3O
4, while an increase in the light absorption above 550 nm is related to the O
2−→Co
3+ charge transfer in Co
3O
4 [
20]. The bands related to charge transitions in Co
3O
4 probably overlap with the band corresponding to the tetrahedral Ni
2+ cations in the NiAl
2O
4 and NiCo
2O
4 spinels, which are expected to be located at about 600 nm, as well as with the d-d transition in octahedral coordinated Ni
2+ (expected at about 630–650 nm) [
30,
31,
32].
The spectrum recorded for CoNi-M is very similar to the spectrum of Co-M (
Figure 4B). The broad maximum below 350 nm is a superposition of bands related to the excitation of the defect states of O
2− surface anions on the edges and corners of the MgO nanocrystals and of the band indicating the O
2−→Co
2+ charge transition in cobalt oxide species [
37]. The shoulder at about 380–560 nm is possibly a superposition of the band related to charge transfer between O
2−→Co
2+ in Co
3O
4 and that related to the octahedrally coordinated Ni
2+ cations in Ni-oxide species, while the shoulder above 600 nm is assigned to the O
2−→Co
3+ charge transfer in Co
3O
4 overlapping with the band associated with the presence of octahedrally coordinated Ni
2+ cations [20, 30–34,]. The spectra recorded for CoNi-HT20 (
Figure 4C) and CoNi-HT40 (
Figure 4D) are very similar to the CoNi-M spectrum (
Figure 4B), and the bands present in these spectra are assigned in the same way.
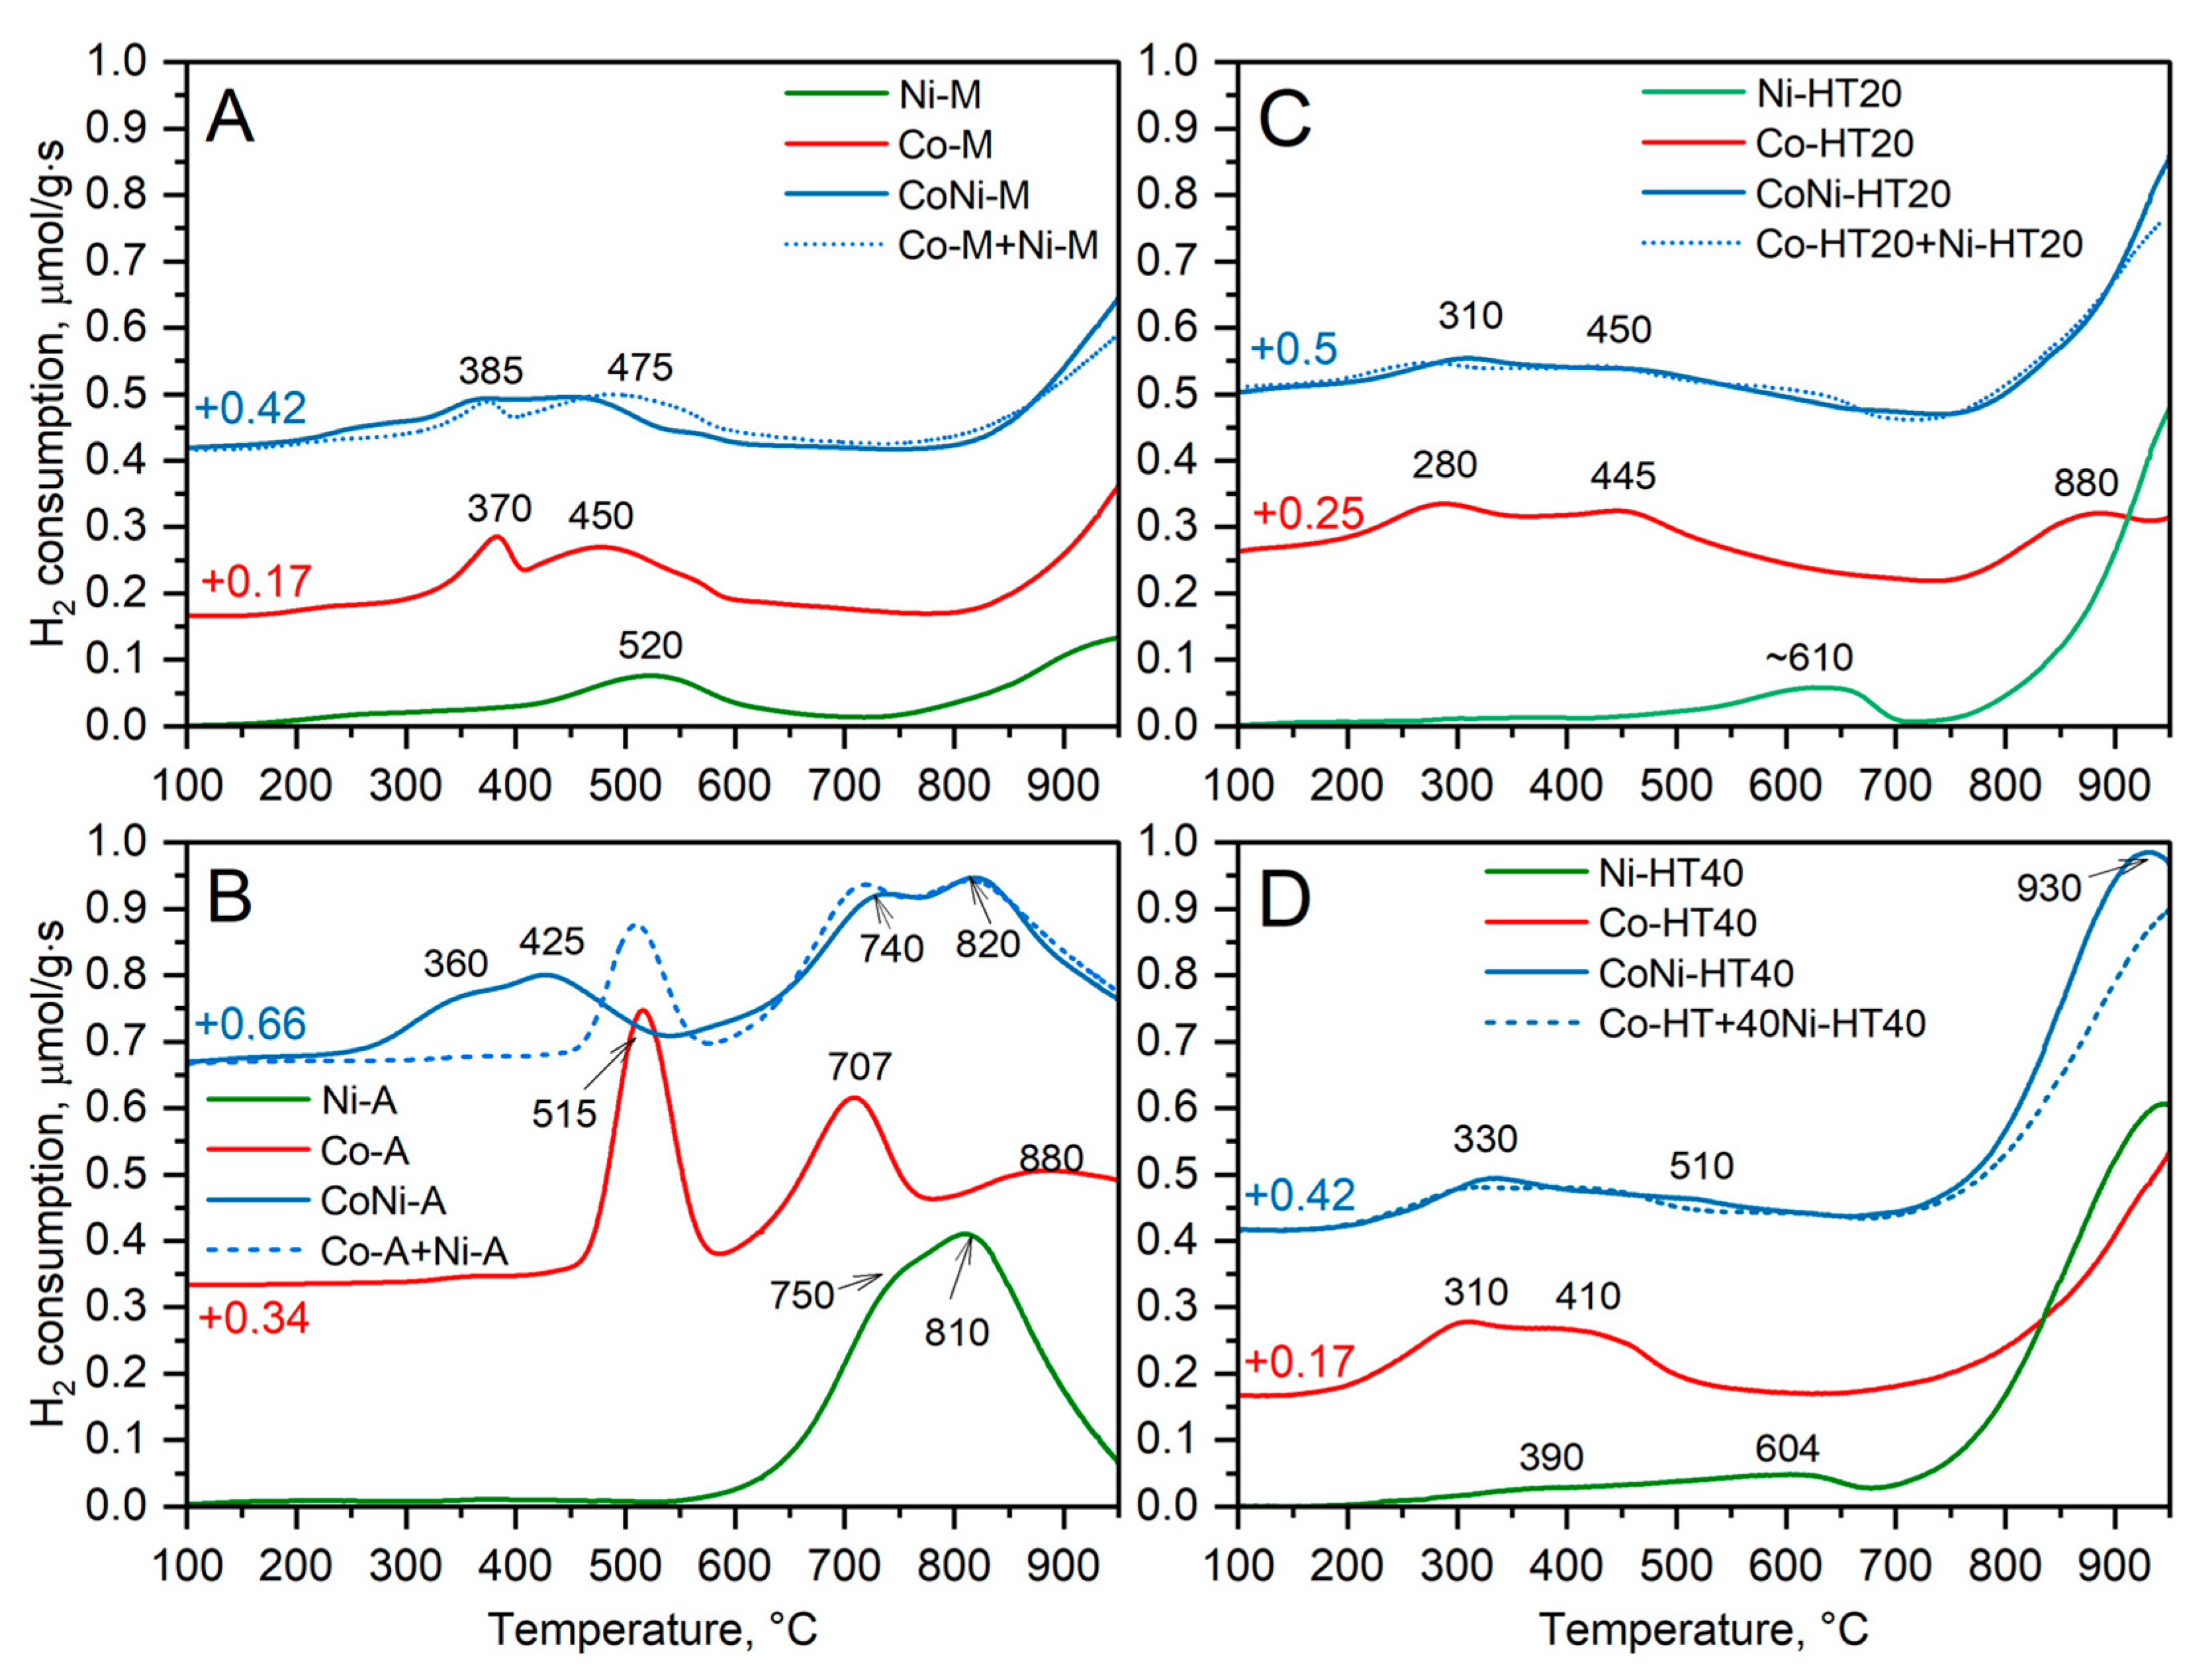
Figure 5 presents the results of the temperature-programmed reduction of the samples, with hydrogen used as a reducing agent (H
2-TPR). The reduction profile of the Ni-M sample consists of complex low-temperature maxima with a main peak at about 520 °C and a high temperature maximum above 900 °C (
Figure 5A). The low-temperature peaks are attributed to NiO species dispersed on MgO but weakly interacting with the support surface [
38]. On the other hand, interaction of nickel with MgO may result in the formation of a Ni
1−xMg
xO solid solution in which the reduction of Ni
2+ is possible above 700 °C [
38,
39].
The reduction of nickel species in the Ni-A sample started at about 550 °C and is represented by a double reduction peak with maximums at 750 and 810 °C (
Figure 5B), indicating stable nickel-oxide species. Such a stabilisation effect of nickel-oxide species deposited on alumina has been reported by many authors, including He et al. [
40] and Wu et al. [
41], who reported the formation of stable surface NiAl
2O
4 spinels under calcination conditions. Tillmann et al. [
42] demonstrated that nickel in NiAl
2O
4 spinels deposited on alumina was reduced at about 800 °C. It should be noted that the spinel phase was identified in the Ni-A sample by XRD measurement (
Figure 1A).
In the case of the Ni-HT20 and Ni-HT40 samples, only small amounts of Ni
2+ cations, possibly in the form of NiO aggregates that interact relatively easily with a magnesia-alumina matrix, were reduced below 650 °C (
Figure 5C,D). Most nickel-oxide species are reduced at temperatures above 700 °C. It indicates that nickel cations were incorporated into the Mg-Al-O matrix with the formation of mixed phases, such as Mg
xNi
1−xO and Mg
(1−y) Ni
yAl
2O
4. Reduction of Ni
2+ cations in such mixed phases occurs at relatively high temperatures. Villa et al. [
43] reported two reduction peaks centred at 720 and 1000 °C indicating the reduction of nickel cations in Mg
xNi
1−xO and Mg
(1−y)Ni
yAl
2O
4, respectively. Similarly, Apuzzo et al. [
38] demonstrated that the reduction of Ni
2+ cations in mixed phases with MgO and Al
2O
3 occurred in the higher temperature range and was not completed at 900 °C.
The reduction of cobalt species in the Co-M sample occurred in several steps (
Figure 5A). The peak at about 380 °C is related to the reduction of Co
3+ to Co
2+ in the Co
3O
4 spinel, which weakly interacts with MgO, while the maximum at about 480 °C is possibly related to the reduction of Co
3+ to Co
2+ in the Co
3O
4 and MgCo
2O
4 spinels interacting with the support surface [
44]. Reduction of Co
2+ to Co
0 in CoO and Co
xMg
1−xO occurred above 700 °C [
44]. It should be noted that both CoO and spinel phases were identified by XRD analysis of the Co-M sample (
Figure 1B).
In the case of the Co-A sample, the reduction of Co
3+ to Co
2+ in Co
3O
4 is possibly represented by a peak at approximately 515 °C (
Figure 5B). It should be noted that the reduction of cobalt in Co
3O
4 deposited on Al
2O
3 occurred at a significantly higher temperature than in the case of Co
3O
4 on MgO (
Figure 5A). Thus, it seems that the interaction of cobalt spinel species with alumina is stronger than that with magnesium oxide. The reduction of Co
2+ to Co
0 in CoO, as well as in cobalt aluminates, takes place above 600 °C [
45].
The low-temperature reduction maxima in TPR profiles of Co-HT20 (
Figure 5C) and Co-HT40 (
Figure 5D), which are located below 600 °C, are assigned to the reduction of Co
3+ to Co
2+ in cobalt aluminates, while the reduction of Co
2+ to Co
0 in CoO and cobalt aluminates takes place above 700 °C [
45,
46].
The reduction profiles of the hydrotalcite-derived bimetallic samples containing both nickel and cobalt, CoNi-HT20 and CoNi-HT40, are very similar to the superpositions of the monometallic samples, Co-HT20 + Ni-HT20 and Co-HT40 + Ni-HT40, respectively (
Figure 5C,D). The profiles representing the superposition of the monometallic samples (dashed lines) were generated by adding suitable profiles of the Co- and Ni-containing samples with a 50% contribution from each of them. The reduction profile of the CoNi-M sample is shifted to lower temperatures of about 30–60 °C compared to the superposition of the Co-M + Ni-M profiles (
Figure 5A). Furthermore, the decrease in the intensity of the peak located at about 450 °C in the case of the bimetallic sample indicates a lower contribution of cobalt in the Co
3O
4 and MgCo
2O
4 spinels interacting with the surface of MgO. The most significant differences were observed for the CoNi-A reduction profile and the superposition of the Co-A and Ni-A profiles (
Figure 5B). In this case, the low-temperature reduction process of bimetallic samples took place at a temperature almost 200 ° C lower than the first reduction peak from the sum of the reduction profiles of monometallic catalysts.. The reduction profiles for bimetallic and monometallic samples above 550 °C are very similar. Therefore, the main differences are observed in the region characteristic of the Co
3+-to-Co
2+ reduction in Co-containing spinel phases. The explanation of these effects could be the possible formation of multicomponent spinels, such as Mg
2+1−x−zNi
2+xCo
2+z Al
3+2−yCo
3+y O
4, with increased reducibility of Co
3+ cations.
It should be noted that the reduction of the samples was not completed below 950 °C, indicating the presence of stable nickel and cobalt oxide species (
Figure 5). The percentage contributions of the nickel and cobalt species reduced to the temperature 950 °C are presented in
Table 2. Transition metal species deposited on alumina are significantly more effectively reduced by hydrogen than those deposited on magnesia. It is in line with the results obtained for hydrotalcite-derived materials. In samples with a higher aluminium content (HT40 series), the contribution of the transition metal in the reduced form is significantly higher compared to that in the samples with a lower aluminium content (HT20 series,
Table 2). Thus, the support used significantly influenced the reducibility of the deposited transition-metal species.
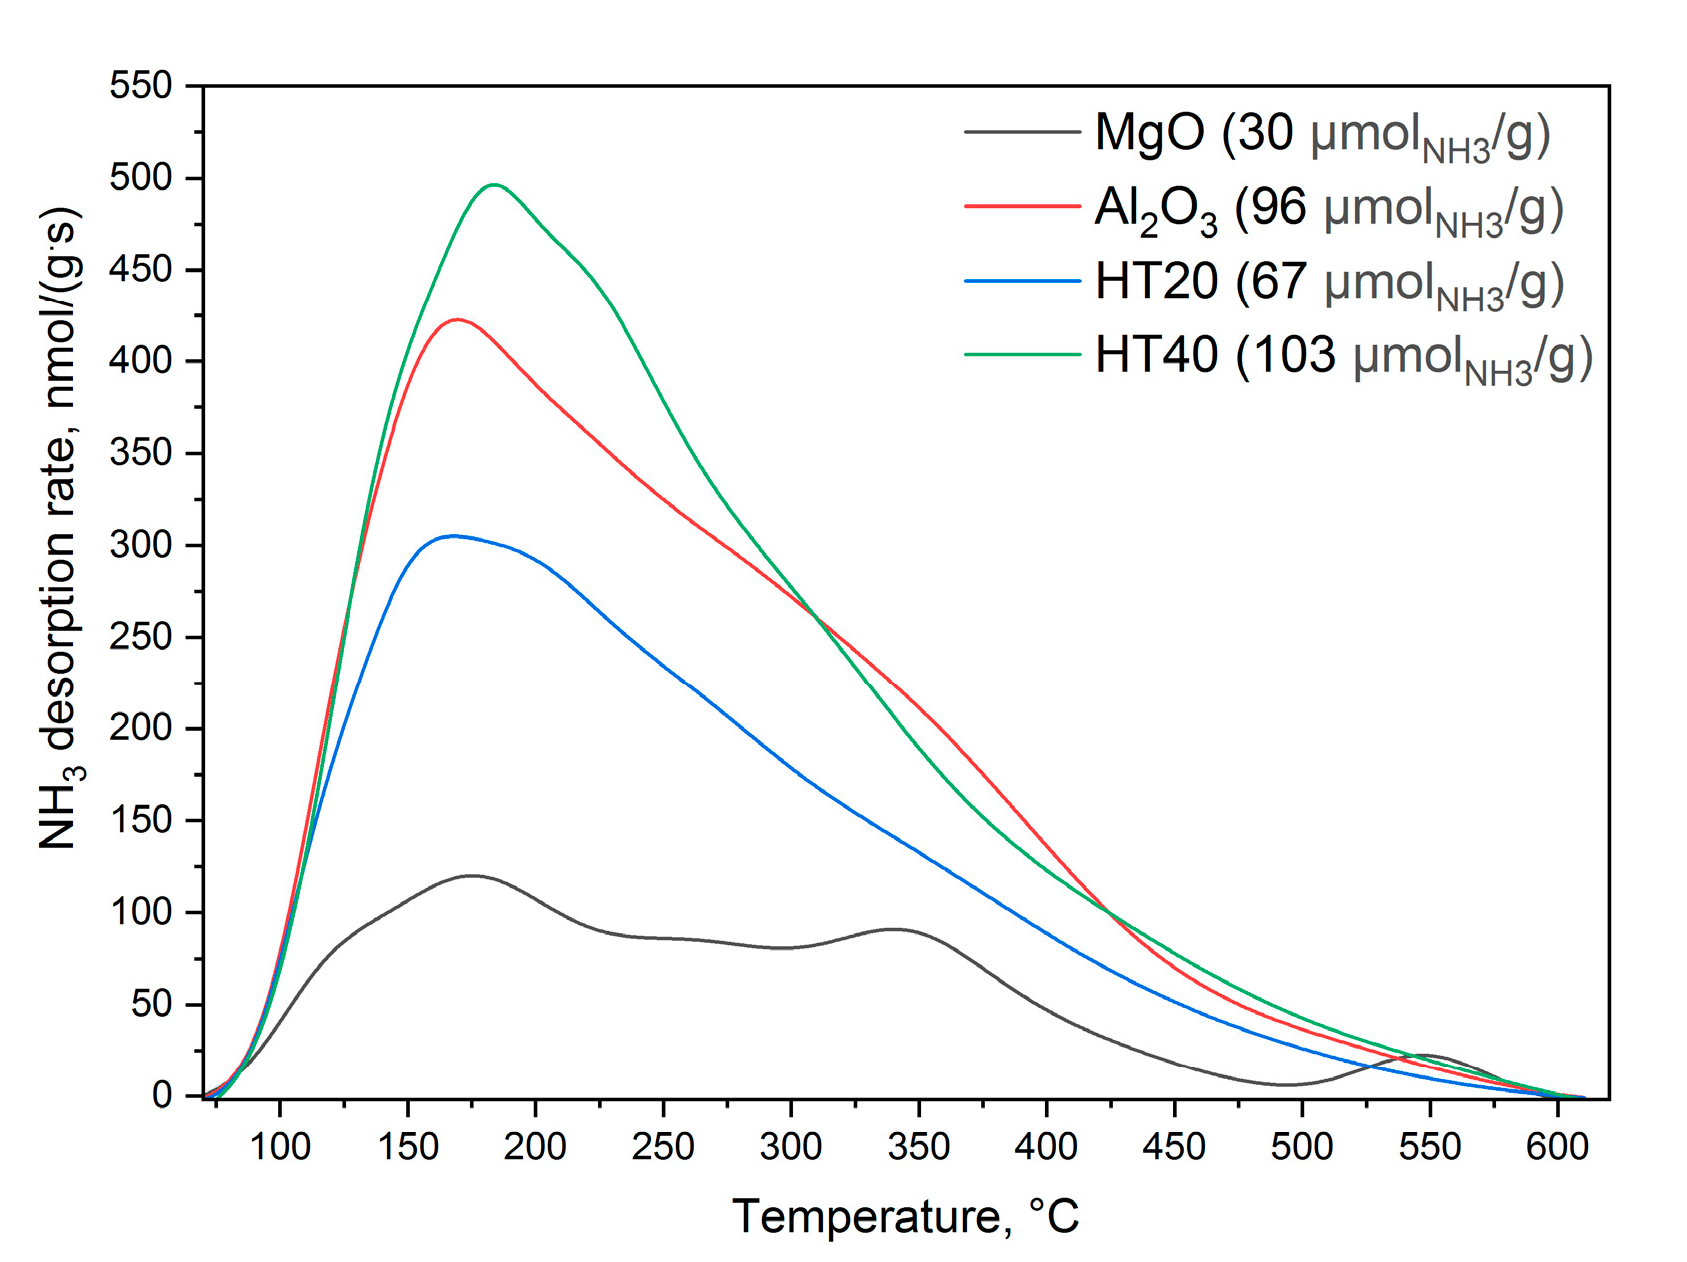
Ammonia-desorption profiles obtained for the MgO, Al
2O
3 and hydrotalcite-derived Mg-Al oxide systems are compared in
Figure 6. It was assumed that one ammonia molecule is chemisorbed at one acid site. Thus, the number of chemisorbed ammonia molecules is equal to the number of acid sites. All desorption profiles are spread in a relatively broad temperature range of 70–600 °C, indicating the presence of acid sites with the high heterogeneity of their acidic strength. The profile obtained for MgO consists of a small number of low-intensity unresolved maxima, indicating a relatively low concentration of various types of surface acid sites (30 μmol/g). Ammonia desorption profiles obtained for other studied samples are significantly more intense, indicating a higher surface concentration of acid sites. The main maximum in the ammonia desorption profile of Al
2O
3 is located at about 170 °C. Furthermore, for this sample, the shoulder at about 240–250 °C indicates the presence of stronger acid sites. The total number of acid sites determined for alumina is approximately 96 μmol/g. Desorption profiles of both hydrotalcite-derived Mg-Al oxides, HT20 and HT40, are characterized by a similar shape but significantly differ with respect to their intensity (
Figure 6). The main maxima are located at 170 and 185 °C for HT20 and HT40, respectively, indicating slightly stronger acid sites in the sample with higher alumina content (HT40). Moreover, the shoulders at about 220–230 and 310–320 °C indicate the presence of acid sites with stronger acidity. The number of acid sites for the samples with the higher aluminium content, HT40, is about 103 μmol/g, while that in the sample with the lower aluminium content was estimated to be 67 μmol/g. These differences are not surprising considering that alumina is responsible for the creation of acid sites.
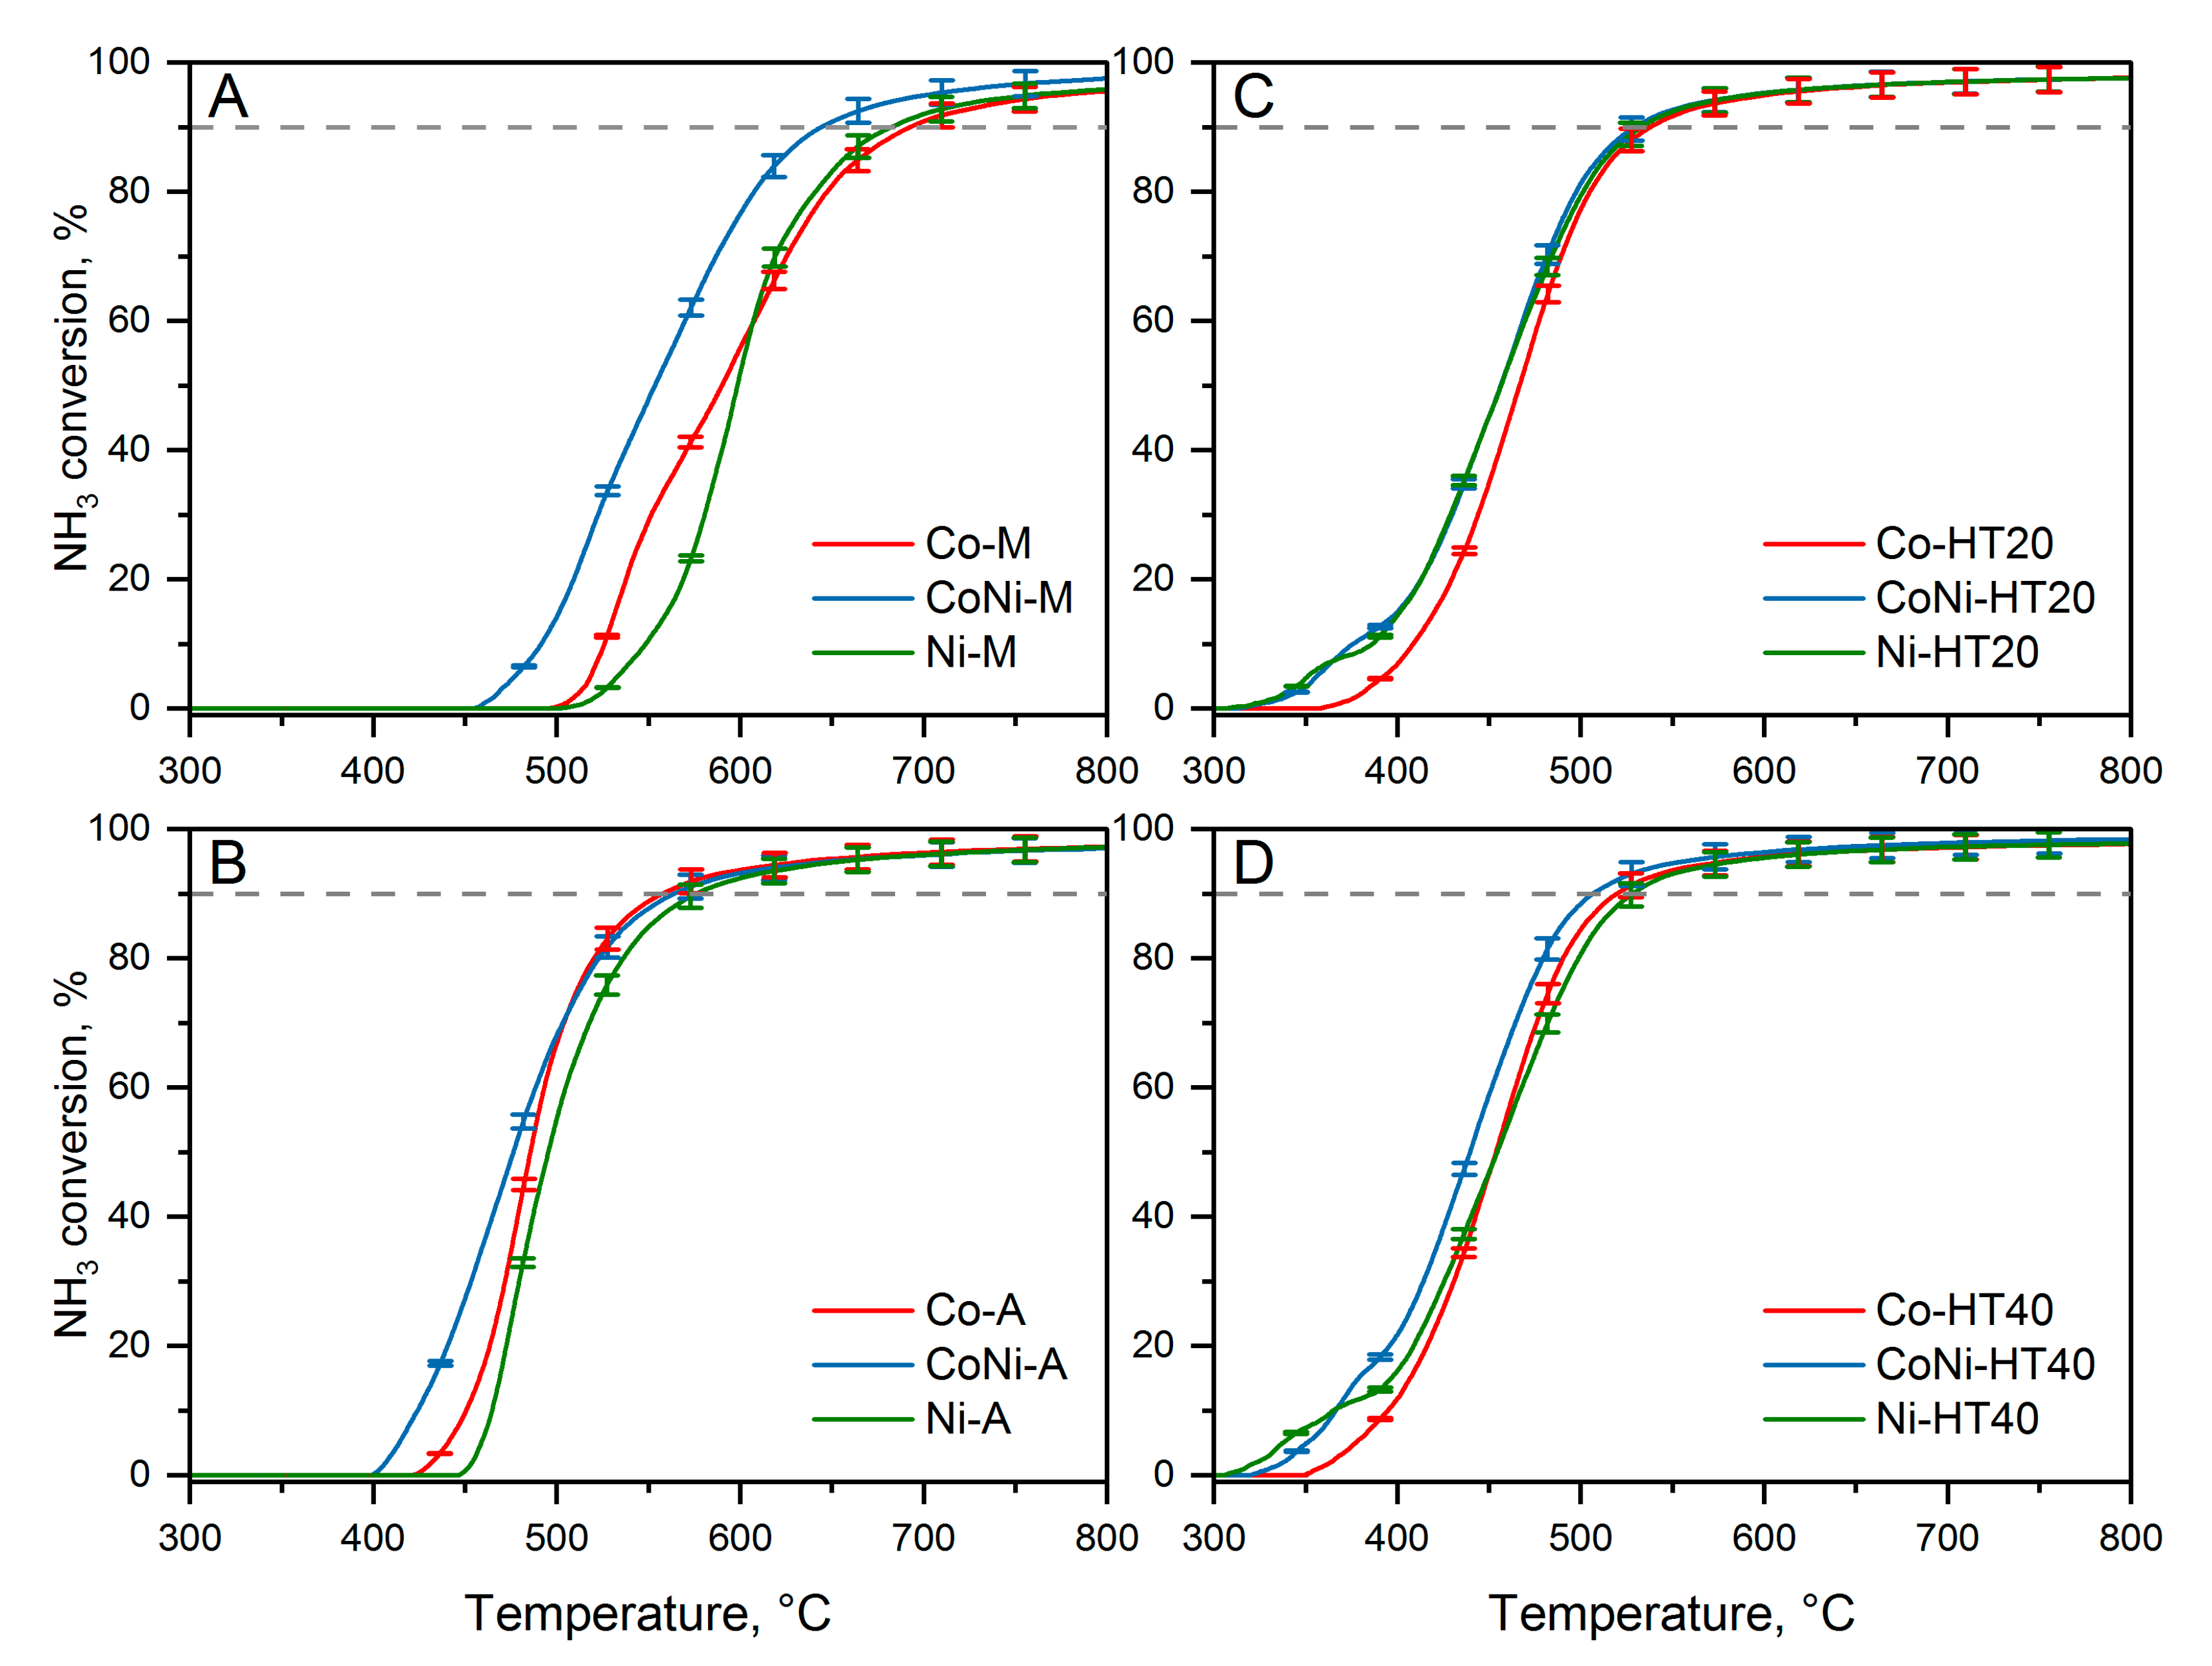
The results of the catalytic studies are shown in
Figure 7. The reproducibility of the catalytic tests was verified in three subsequent runs. Differences in the obtained results are in the range of the error bars determined by the propagation-error method. In the case of ammonia decomposition to hydrogen and nitrogen over cobalt (Co-M) and nickel (Ni-M) deposited on MgO, the reaction started above 500 °C and sharply increased reaching 90% of ammonia conversion at about 680–690 °C (
Figure 7A). At temperatures below 600 °C, Co-M showed higher ammonia conversion, while at higher temperatures, Ni-M was slightly more catalytically active. The bimetallic catalysts containing both cobalt and nickel (CoNi-M), with a total content of transition metals very similar to that of the monometallic samples, presented significantly improved catalytic activity. In this case, ammonia conversion started at about 455 °C and 90% conversion was obtained at about 645 °C. A similar effect was found for cobalt and nickel deposited on alumina (
Figure 7B). Also, in this case, ammonia conversion measured in the presence of a monometallic catalyst was lower compared to that in the bimetallic sample. Ammonia decomposition started at about 425 and 445 °C for the Co-A and Ni-A catalysts, respectively. Additionally, 90% ammonia conversion was obtained at 560 °C for Co-A and 580 °C for Ni-A. In the case of the bimetallic catalyst, CoNi-A, the reaction started at about 400 °C; however, at temperatures above 500 °C, the conversion profiles of CoNi-A and Co-A are very similar (
Figure 7B). Therefore, very significant differences in the activity of the catalysts were observed between the MgO and Al
2O
3 supports. Alumina is characterised by a significantly more acidic surface and therefore can more effectively adsorb ammonia molecules compared to the more basic MgO (
Figure 6). Pure alumina is not catalytically active in ammonia decomposition but may play the role of an ammonia reservoir for conversion over transition metals. Thus, one of the possible explanations for the better catalytic activity of the catalysts base on the alumina support could be its higher surface acidity in comparison to MgO-based catalysts. Of course, such differences in the ammonia-adsorption capacity can mainly be reflected in ammonia conversion at lower temperatures (ammonia was completely removed from the support surface at about 600 °C;
Figure 6), an explanation that agrees with the results presented in
Figure 7A,B.
Apart from significant differences in the ammonia-sorption capacities of Al
2O
3 and MgO, another important factor influencing the activities of various bimetallic catalysts could be the size of deposited transition crystallites and particles (
Table 1 and
Table 2). In the case of the CoNi-A catalyst, the average size of transition-metal crystallites was about 10.4 nm, while for CoNi-M the average size was determined to be 20.6 nm. On the other hand, it is suggested that these crystallites aggregated, leading to the formation of significantly larger particles (
Table 2). Assuming that active sites for ammonia decomposition are located on the surface of deposited and reduced transition-metal species, significantly more active sites are expected in the CoNi-A catalyst, which was found to be more catalytically active than CoNi-M. The ammonia decomposition over monometallic hydrotalcite-derived catalysts containing cobalt, Co-HT20 and Co-HT40, started at about 350 °C, and over these catalysts, 90% ammonia conversion was obtained at 540 and 520 °C, respectively (
Figure 7C,D). In the case of the catalysts containing monometallic nickel, Ni-HT20 and Ni-HT40, as well as in the case of the bimetallic samples, CoNi-HT20 and CoNi-HT40, the reaction started at about 300–320 °C; 90% ammonia conversion was reached at 515 °C for Ni-HT20 and CoNi-HT20, at 525 °C for Ni-HT40 and at 505 °C for CoNi-HT40. Thus, hydrotalcite-derived catalysts presented significantly improved catalytic activity in ammonia decomposition compared to supported catalysts based on cobalt and nickel deposited on magnesia or alumina (
Figure 7A,B). The hydrotalcite-derived catalysts are characterised by a significantly higher specific surface area than either MgO or Al
2O
3 have (
Table 1). The aluminium present in hydrotalcite-derived samples represents acid sites that can accumulate ammonia on the catalyst surface. As already postulated, such chemisorbed ammonia species could be a surface reservoir of this reactant. The comparison of the concentrations of chemisorbed ammonia, presented in
Figure 6, shows the highest value for HT40 (103 μmol/g), while for HT20 and Al
2O
3, the surface ammonia concentrations were 67 and 96 μmol/g, respectively.
It seems that the reducibility of catalysts could play an important role in catalyst activation. The reduction process in the case of CoNi-A was initiated at a slightly lower temperature and proceeded with significantly higher intensity than did the process for CoNi-M (
Figure 5A). Moreover, it started at significantly lower temperatures than the process for Co-A and Ni-A (
Figure 5B). Moreover, it was shown that the contribution of reduced cobalt and nickel species in the samples based on an alumina support is significantly higher than those of samples based on an MgO support (
Table 2). Similarly, in the case of the hydrotalcite-derived samples with higher aluminium content, the reduction of transition metals species was more effective compared to those with catalysts based on hydrotalcite-like samples with a lower aluminium content. Thus, assuming that reduced metal species play a role as catalytically active sites, the high reducibility of the catalysts is very important for catalyst activation.
To determine the catalytic activity of the individual active sites, the turnover frequency (TOF) values were determined for the selected most-active catalysts (
Table 2). It was assumed that each reduced surface contained exposed metal atoms, as determined by pulse H
2 chemisorption (
Table 2), which act as catalytically active sites. The highest TOF value was determined for the CoNi-A catalyst, with a value higher than that for the CoNi-M sample. The TOF values obtained for the hydrotalcite-derived catalysts were significantly lower than those for CoNi-A and CoNi-M. On the other side, the overall activity of the hydrotalcite-derived catalysts was better compared to that of other samples. However, it should be noted that the overall catalytic activity depends not only on the catalytic operation of the individual active site, but also on their surface concentration, which in the case of hydrotalcite-derived catalysts is significantly greater compared to those of other studied catalysts (
Table 2).
A very important observation is the increased activity of bimetallic Co-Ni compared to those of monometallic catalysts containing nickel or cobalt. This problem was analysed by Tabassum et al. [
12], who used Bader charge analysis to explain the synergistic cooperation of cobalt and nickel in ammonia decomposition. It was postulated that on the Co–Ni alloy surface, cobalt atoms are positively charged, whereas nickel atoms are negatively charged, resulting in the creation of localised charge polarisation. Such locally polarised sites are postulated to be more active in ammonia adsorption and dissociation. The suggested mechanisms of ammonia decomposition include its adsorption on the catalyst surface, N-H bond cleavage, retaliative fast recombination of hydrogen atoms and desorption of H
2 molecules, as well as re-combinative desorption of surface nitrogen atoms, which is the rate-determining step [
12]. The recombination of surface-bonded nitrogen atoms to form an N
2 molecule requires the diffusion of such surface N atoms at the metal or alloy surface. This step requires that the atoms overcome a significantly high activation-energy barrier. Tabassum at al. [
12] postulated that the more energetically favourable is the diffusion of N atoms toward the metal—oxide (support) interface followed by the recombination and desorption of the N
2 molecule. Such a positive effect of the catalytic support was shown for the Co-Ni alloy deposited on CeO
2 and MgO [
12]. The nitrogen recombination rate is also related to the size of the metal or alloy species dispersed on the support surface. In the case of small metal or alloy aggregates deposited on the support surface, the contribution of the metal—support interface is greater compared to those of bulkier aggregates, and therefore, the recombination rate of N atoms should be faster. Thus, the role of the support, as well as that of the dispersion of the catalytically active metals, is very important, as was shown also in the presented studies.
Fu et al. [
13] and Li et al. [
14] analysed the influence of the strength of the metal-ammonia bond (M–NH
3) on the efficiency of the ammonia decomposition to hydrogen and nitrogen. In the case of a too-weak M–NH
3 bond, desorption of ammonia is more likely than its dehydrogenation. On the other hand, if the M–N bond energy is too high, the desorption of N-species from the catalyst surface becomes difficult. Therefore, metals that are able to create a moderately strong M–N bond are favourable for catalytic ammonia decomposition. Hansgen at al. [
47] calculated that the binding energy of M–N necessary for the effective dissociative adsorption of NH
3 and the recombination and desorption of N
2 molecules should be approximately 134 kcal/mol, while for nickel and cobalt, these binding energies are 125 and 122 kcal/mol, respectively. Thus, in the case of these metals, the M–N binding energies are too weak for effective decomposition of ammonia. On the other hand, Fu et al. [
13] showed that the Co-Ni metal system is characterised by a moderately strong M–N interaction, which is suitable for effective ammonia decomposition. Similarly, Wu et al. [
15] compared the ammonia and nitrogen desorption profiles for nickel, cobalt and bimetallic Co-Ni systems deposited on silica. It was shown that both Ni and Co have M–N binding energies that are too weak to be suitable for the effective dissociative adsorption of ammonia. However, bimetallic Ni-Co/SiO
2 catalysts were characterised by moderate M–N binding energy, which is suitable for dissociative adsorption of ammonia, recombination of N atoms and desorption of N
2.
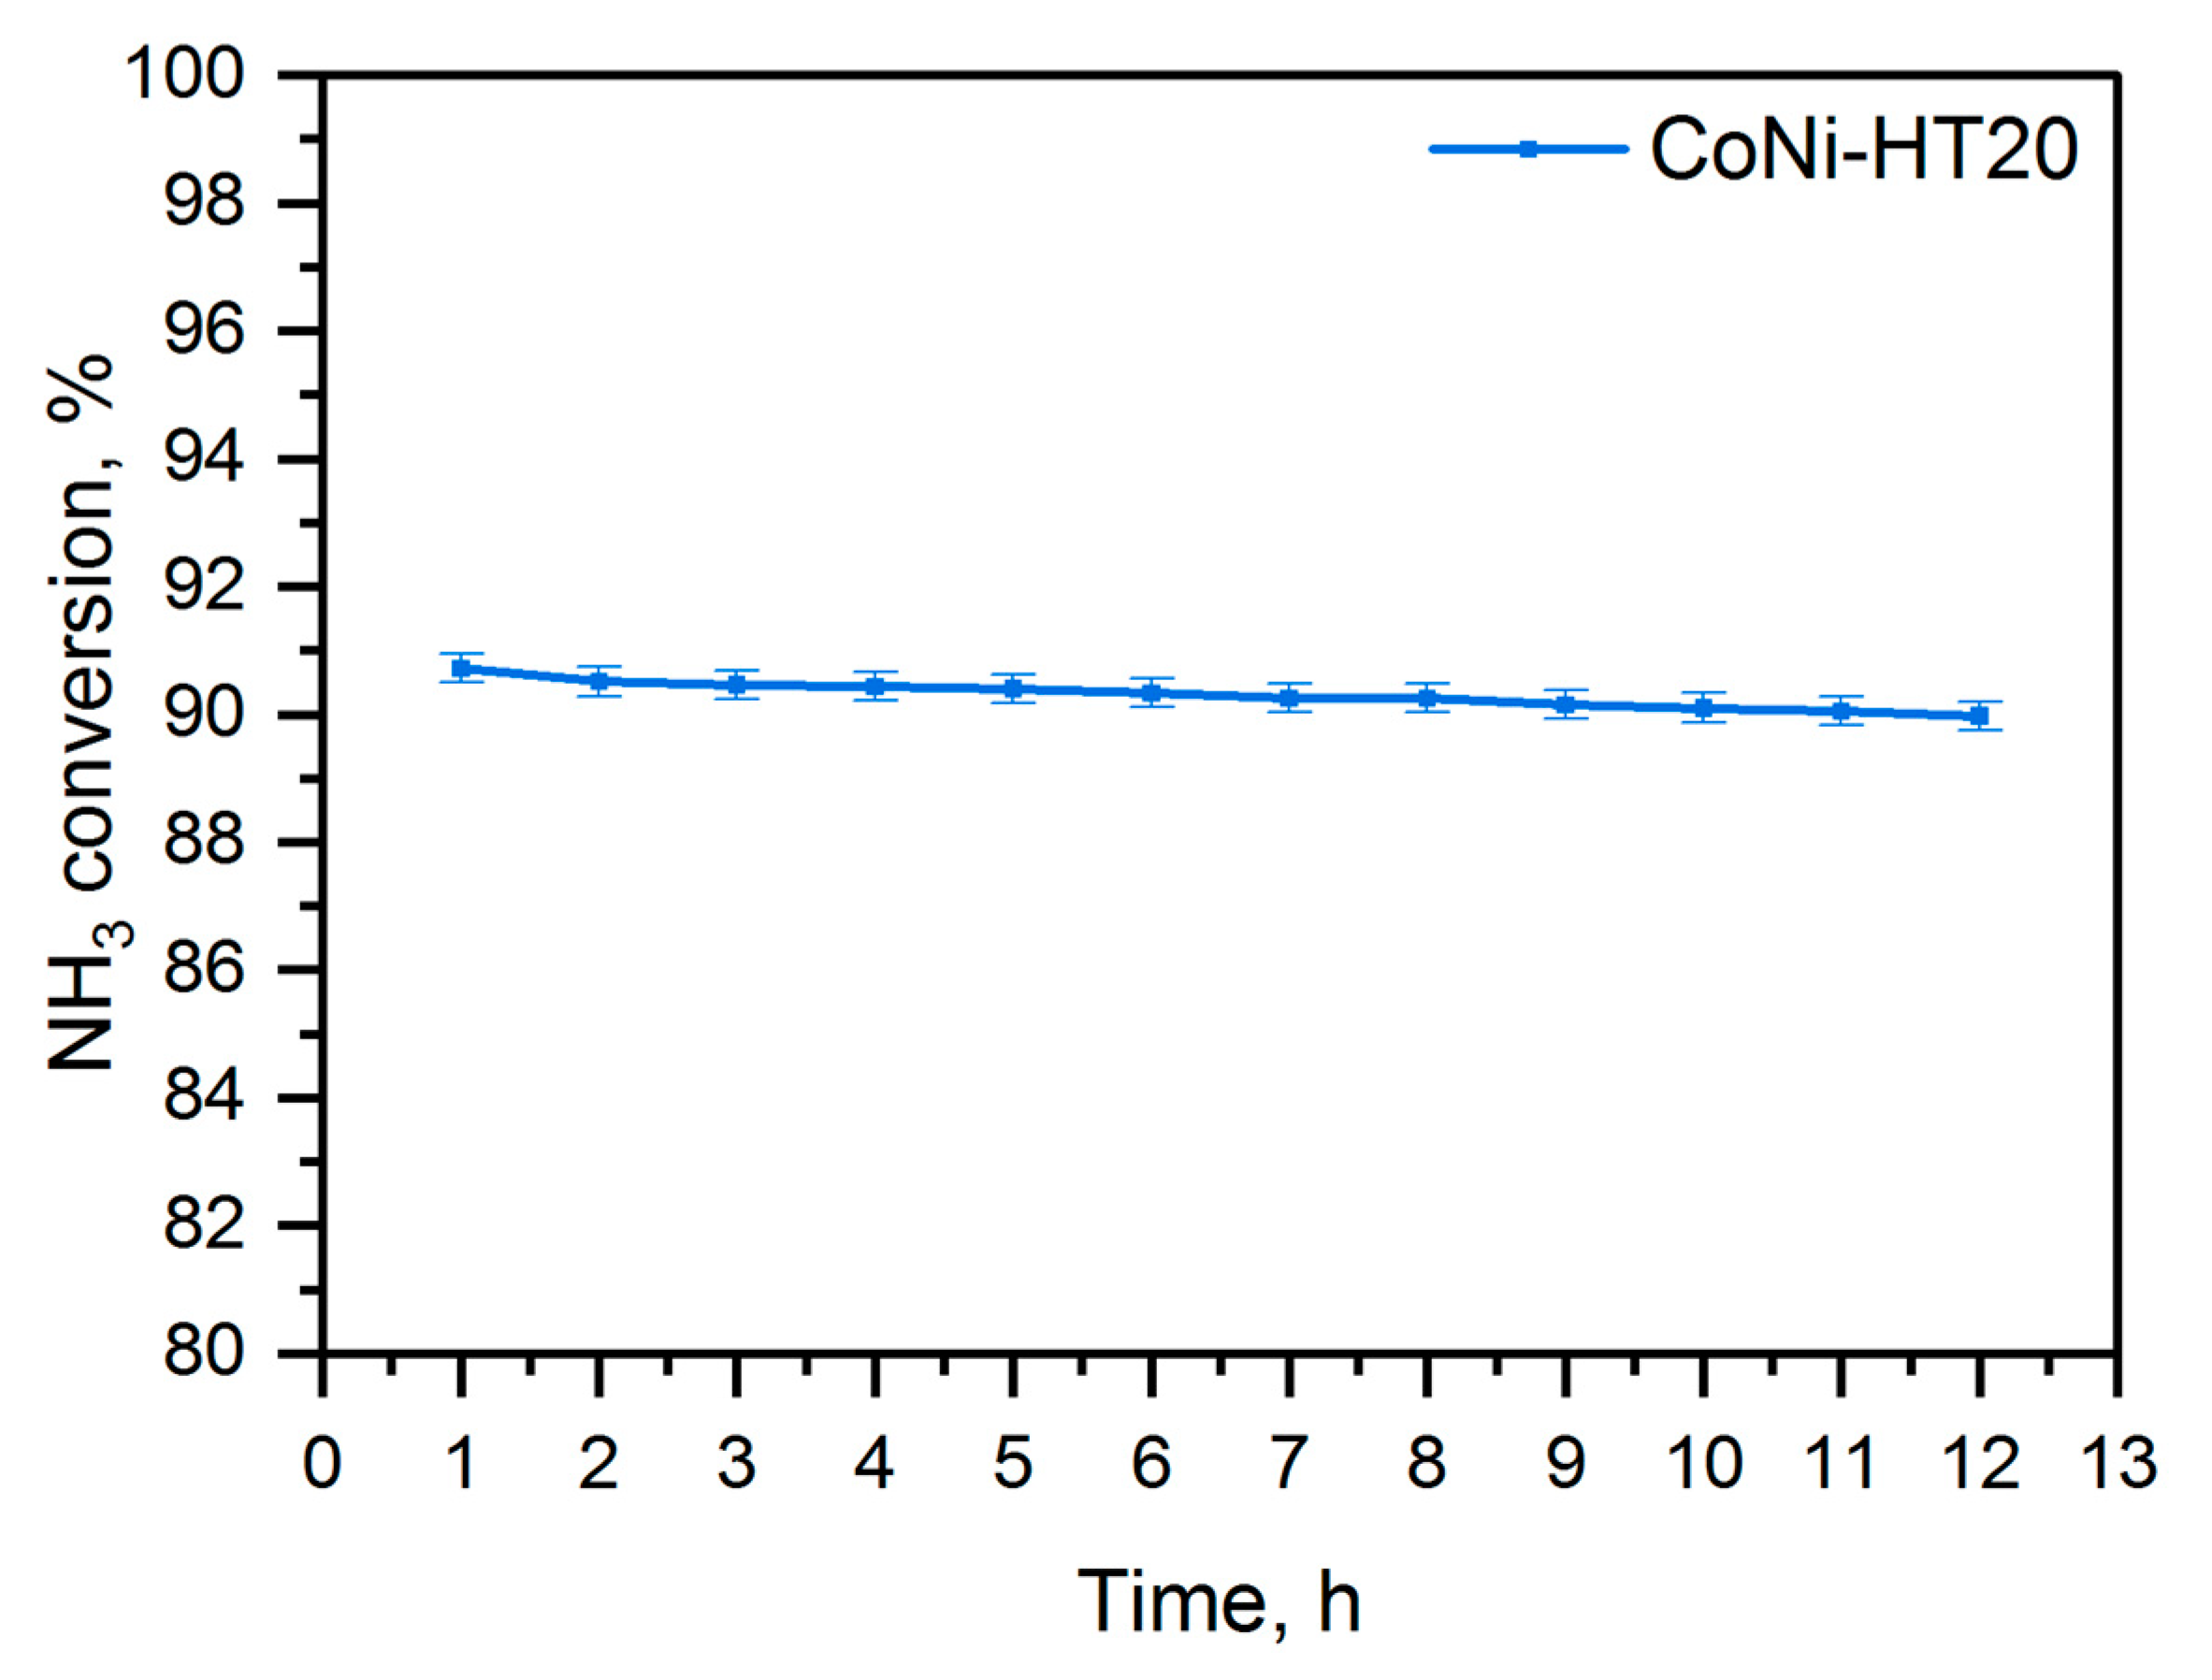
For the selected catalyst, CoNi-HT20, an additional isothermal stability test was conducted at 500 °C (
Figure 8). The test showed a decrease in ammonia conversion of less than 1% during the 12-h stability test, which seems to be a very good and promising result.

