Article

Electrokinetic Forces as an Electrical Measure of Chemical Aging Potential in Granular Materials

by
Miguel Castilla-Barbosa
1,*,
Orlando Rincón-Arango
2 and
Manuel Ocampo-Terreros
1,*
1
Departamento de Ingenieria Civil, Pontificia Universidad Javeriana, Bogota 110231, Colombia
2
Infrastructure Division, WSP Colombia, Bogota 111311, Colombia
*
Authors to whom correspondence should be addressed.
ChemEngineering 2023, 7(5), 91; https://doi.org/10.3390/chemengineering7050091
Submission received: 17 July 2023 / Revised: 6 September 2023 / Accepted: 13 September 2023 / Published: 1 October 2023

Abstract

:
The zeta potential of soils is an electric potential in the double-layer interface and is a physical property exhibited by any particle related to electrochemical attractive forces. On the other hand, the chemical aging phenomenon is seen as the chief mechanism of the aging of sands due to the dissolution and precipitation of minerals, resulting in the development of the cementation of particles in granular mediums. The present investigation focuses on determining whether granular materials can generate cementation due to electrokinetic forces, and if the zeta potential could be related as a measure of the potential of chemical aging. X-ray fluorescence and diffraction tests were performed to characterize four representative fractions of one kind of sand, and zeta potential studies were carried out to determine the electrical potential on the mineral surfaces of each one. Zeta potential analysis showed both dependence on the mineralogical content and the variation in the pH of the colloidal solution fluid because the increase in OH- ion concentrations increases the thickness of the diffuse double layer and the electrokinetic forces of attraction. Moreover, the zeta potential showed an increase in the thickness of the diffuse double layer, due to the electrokinetic forces, which can be associated with the development of cohesive forces with a dependence on the mineralogy of sands.

1. Introduction

Field evidence and laboratory studies have demonstrated that soil engineering properties change over time [1]. Aging phenomena can be described as time-dependent changes in the behavior of soils [2], which can be significant across periods of days to months, and can be presented as increases in small-strain stiffness, cone penetration resistance, liquefaction resistance (related to cyclic stress ratio—CSR), shear strength, shear wave velocity, and small-strain shear modulus in granular materials, such as sands [2,3,4,5,6,7,8,9,10,11].
Several authors have demonstrated the aging phenomena in different kinds of sands, and with different-size particles, from field to laboratory scales [1,2,3,6,10,12,13]. The causes or underlying mechanisms of the aging phenomena, as a relevant aspect in granular materials, are still unclear [14], generate uncertainty [3], or their verification remains inconclusive [1]. However, several studies have deduced that aging in soils can be presented as a chemical mechanism [1,3,10,12,13,15].
Some of these studies have suggested that the most probable cause is the precipitation of minerals in the voids and/or the formation of silica acid gel on the surface of the sand particles, which act as cementing agents between the particle contacts. Moreover, other authors have found traces of iron oxide on some of the sand particles, which may support a cementation mechanism between them, as an aging effect. It has been suggested by Joshi et al. (1995) and Bwambale & Andrus (2019) [4,10,16] that a factor that influences the aging phenomena is the submerged state of the samples, due to partial cementation, caused principally by the precipitation of salts and silica on the sand grains and in the pores. Thus, several authors have demonstrated that sand particles with different mineralogical compositions are materials that are subject to aging phenomena.
In this way, it is plausible to consider that aging phenomena may cause the cementation of particles in granular mediums [14] and could be interpreted as the chief mechanisms of the aging of sands, as presented by Mitchell et al. [17]. In general terms, the chemical mechanism of aging may be interpreted as the dissolution and precipitation of minerals [3,18]—specifically, silica or calcium carbonate. However, there is no incontrovertible evidence to validate this hypothesis, and some authors doubt that granular mediums have the ability to produce enough chemical forces between particles [2].
On the other hand, the zeta potential (ZP) or electrokinetic potential of soils—denoted as ζ since 1904—is an electric potential in the interface of the double layer in colloidal systems and is a physical property exhibited by any particle in suspension or in a material surface [19,20]. The zeta potential is commonly used as a way to explore phenomena such as the stability of colloids [20], and it can be interpreted as a physicochemical property of both magnitude and polarity forces between polar species and mineral surfaces [21]. Moreover, several factors are implicit in the estimation of the ZP, given its relationship to the repulsive and attractive forces of the model and to properties that could affect the stability of the colloidal system [22].
The zeta potential has gained importance in geotechnical engineering, particularly in the development of new remediation or soil improvement techniques based on the surface energy of minerals. Moreover, the zeta potential is a relevant measure of the electrical potential on mineral surfaces, and it controls the electrostatic interactions between the mineral surface and the polar species in an aqueous solution, i.e., water [23], between the mineral surface and other charged interfaces, or between mineral particles [24]. Several authors [20,21,22,23,25,26,27,28,29] have evaluated the incidence of factors such as temperature, pH, electrolytic concentration, and cation valency in the zeta potential on sandstones (as macroscopic objects) and fine particles that can be deposited in voids between soil grains.
Thus, an accurate description of the surface chemistry is essential to understanding the forces between soil particles and an aqueous medium, taking into account that water generates bonds between particles, and in analyzing the possibility of cementation at the microscale of the granular material [30]. This may help to integrate both aging and zeta potential and incorporate them in further modeling of soil behavior models, large-scale production, storage of materials, and slope stability. Based on the information above, this document aimed to evaluate whether granular materials can generate cementation due to electrokinetic forces and if the zeta potential is a measure of the potential of the chemical aging of granular materials.

2. Materials and Methods

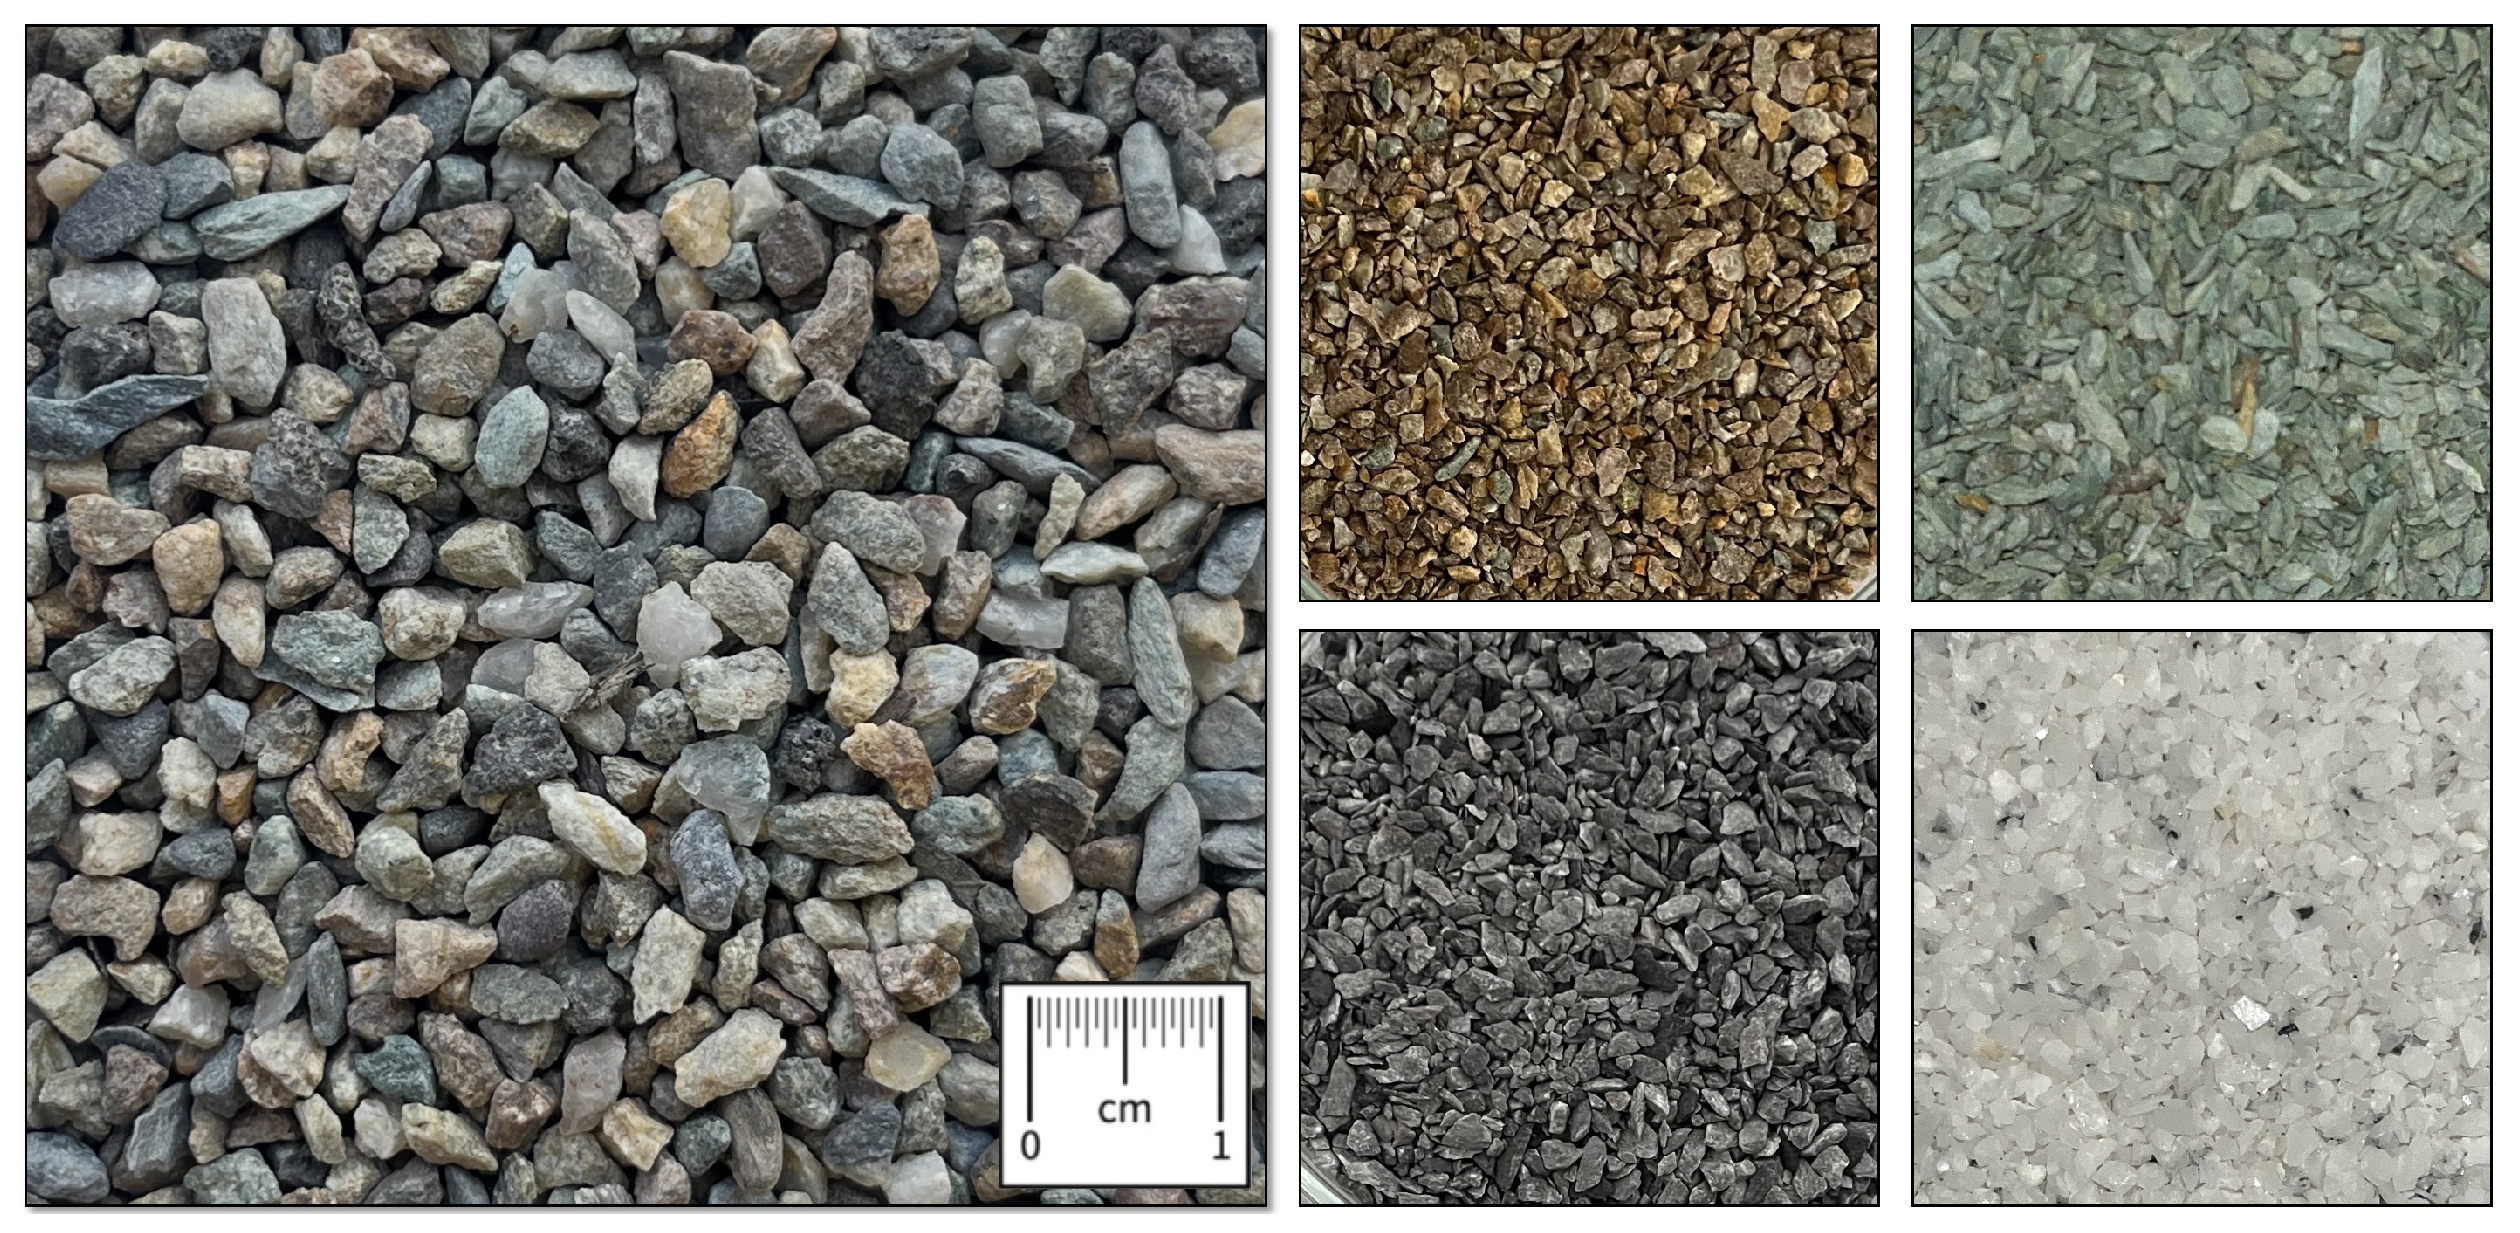
2.1. Specimen Selection

The present investigation focused on some sands of the Colombian Andes mountain range with high heterogeneity due to the presence of clasts of various sizes combined with a predominantly sandy matrix with different mineralogical compositions of sand particles, as well as sands from some areas with accumulations of fine material from upper soil horizons (materials that were possibly distributed by eluviation processes) across the soil deposit. The material under study was selected explicitly from one colluvial deposit on the Andes mountain range that forms a mass of highly steep slopes and is made up of deposits of materials with a fluvio–torrential origin, identified as clast-supported and matrix-supported by different evaluations and studies previously carried out [31]. Moreover, the sandy material has slopes up to 45° as an effect of aging phenomena, as presented by Castilla et al. (2022) [31], and previous investigations have demonstrated that the pH of the subsurface water can vary from acidic conditions (near 4.0) up to strong basic conditions (pH close to 12.0). Therefore, the materials under study were selected due to their ability to be subjected to changes in pH conditions that may induce aging effects and their potential to develop cementation over time.
The sands of the study area were initially classified according to the size distribution for particles between the 3 (76.20 mm) sieve up to particles in the No. 200 (75 mm) sieve, and they were visually separated based on the color of the particles (gray, green, reddish, and white). This allowed the chemical characterization and determination of the electrokinetic potential (zeta) for each representative fraction. Therefore, the samples were selected from a group of particles that passed through sieve No. 4 (4.75 mm) and were retained in sieve No. 10 (2.0 mm) for visual analysis and identification of representative fractions, as presented in Figure 1. Furthermore, a group of particles from sieve No. 16 (1.19 mm) to sieve No. 500 (25 μ m) were selected for SEM-EDS analysis, and a group of particles that passed sieve No. 200 (75 μ m), No. 400 (37 μ m), and No. 500 (25 μ m) were selected for thermogravimetric, XRF, XRD, and electrokinetic potential (zeta) analysis.

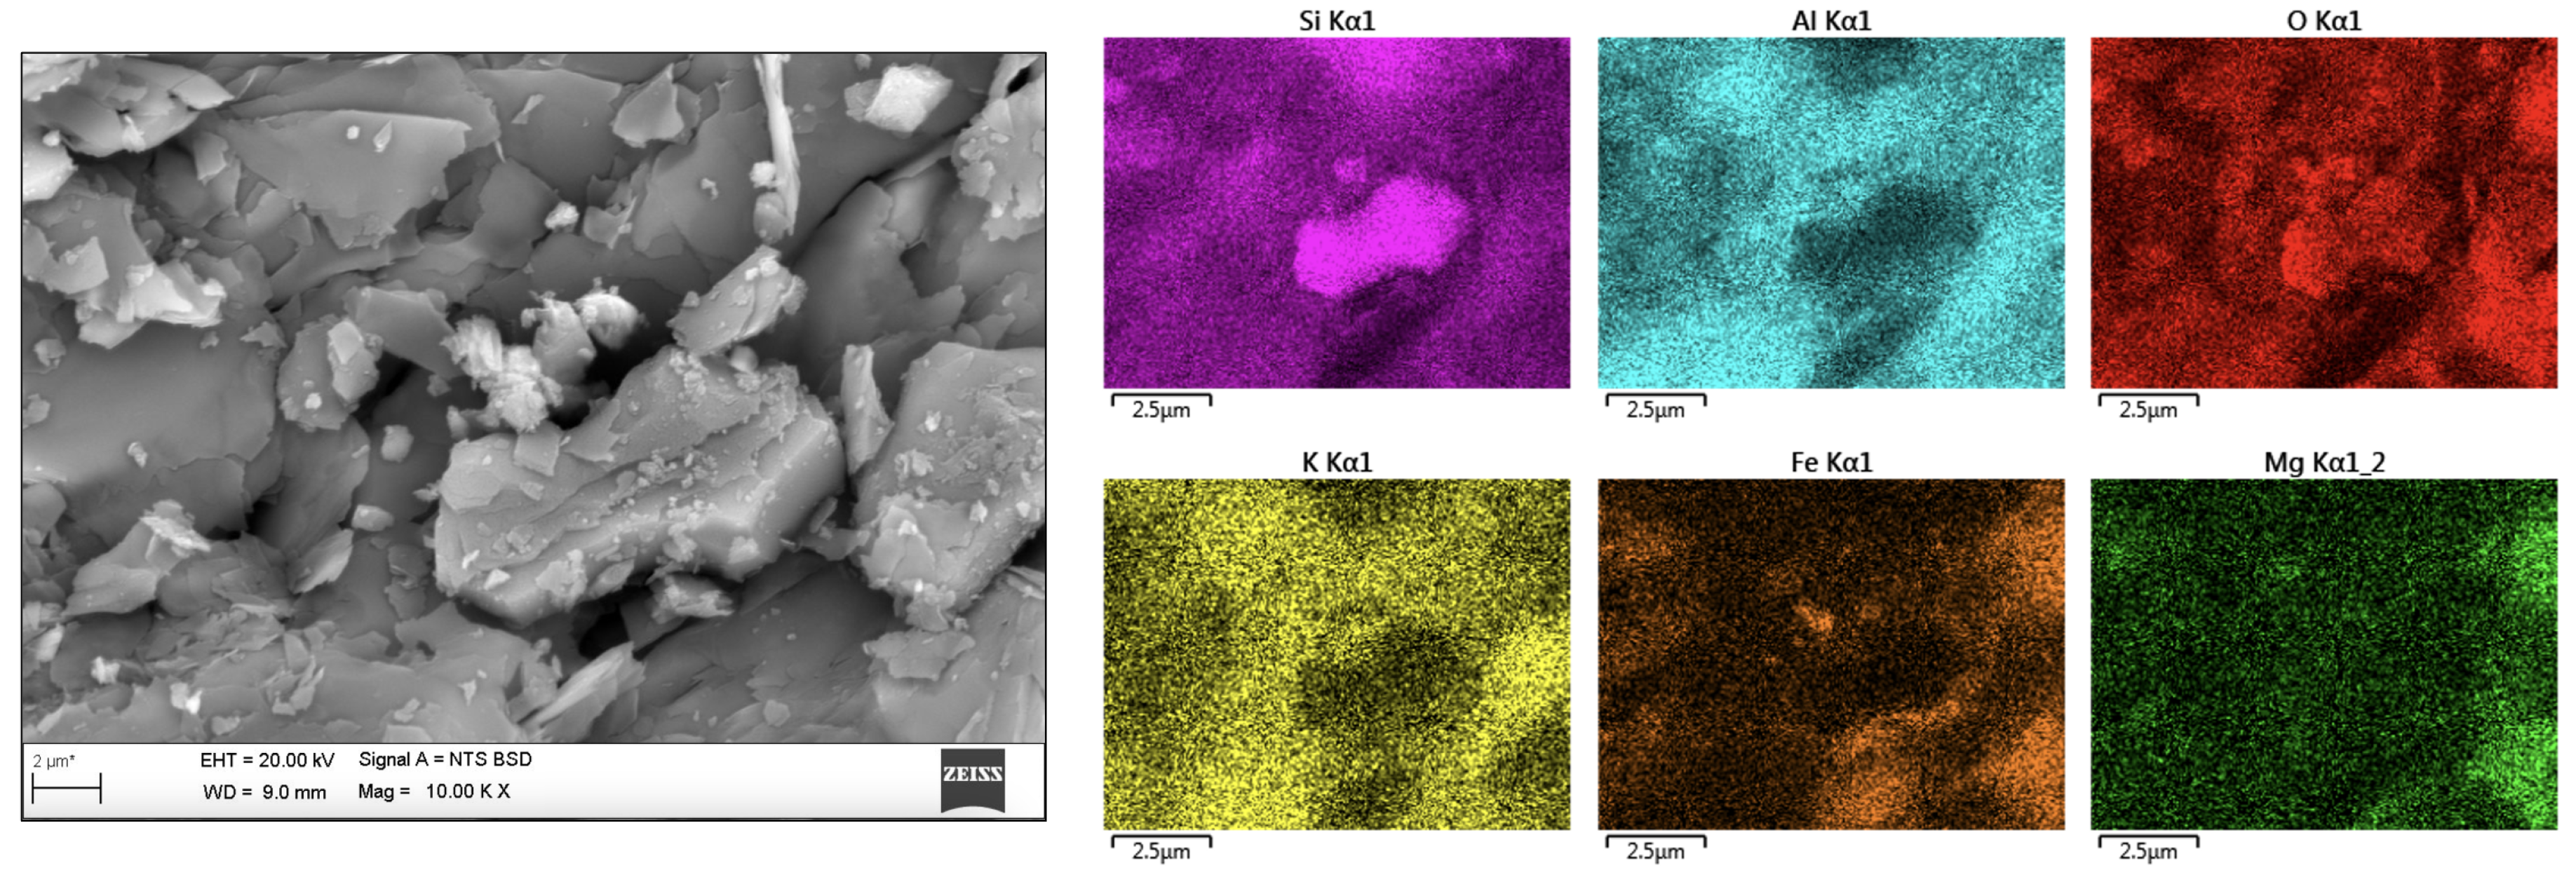
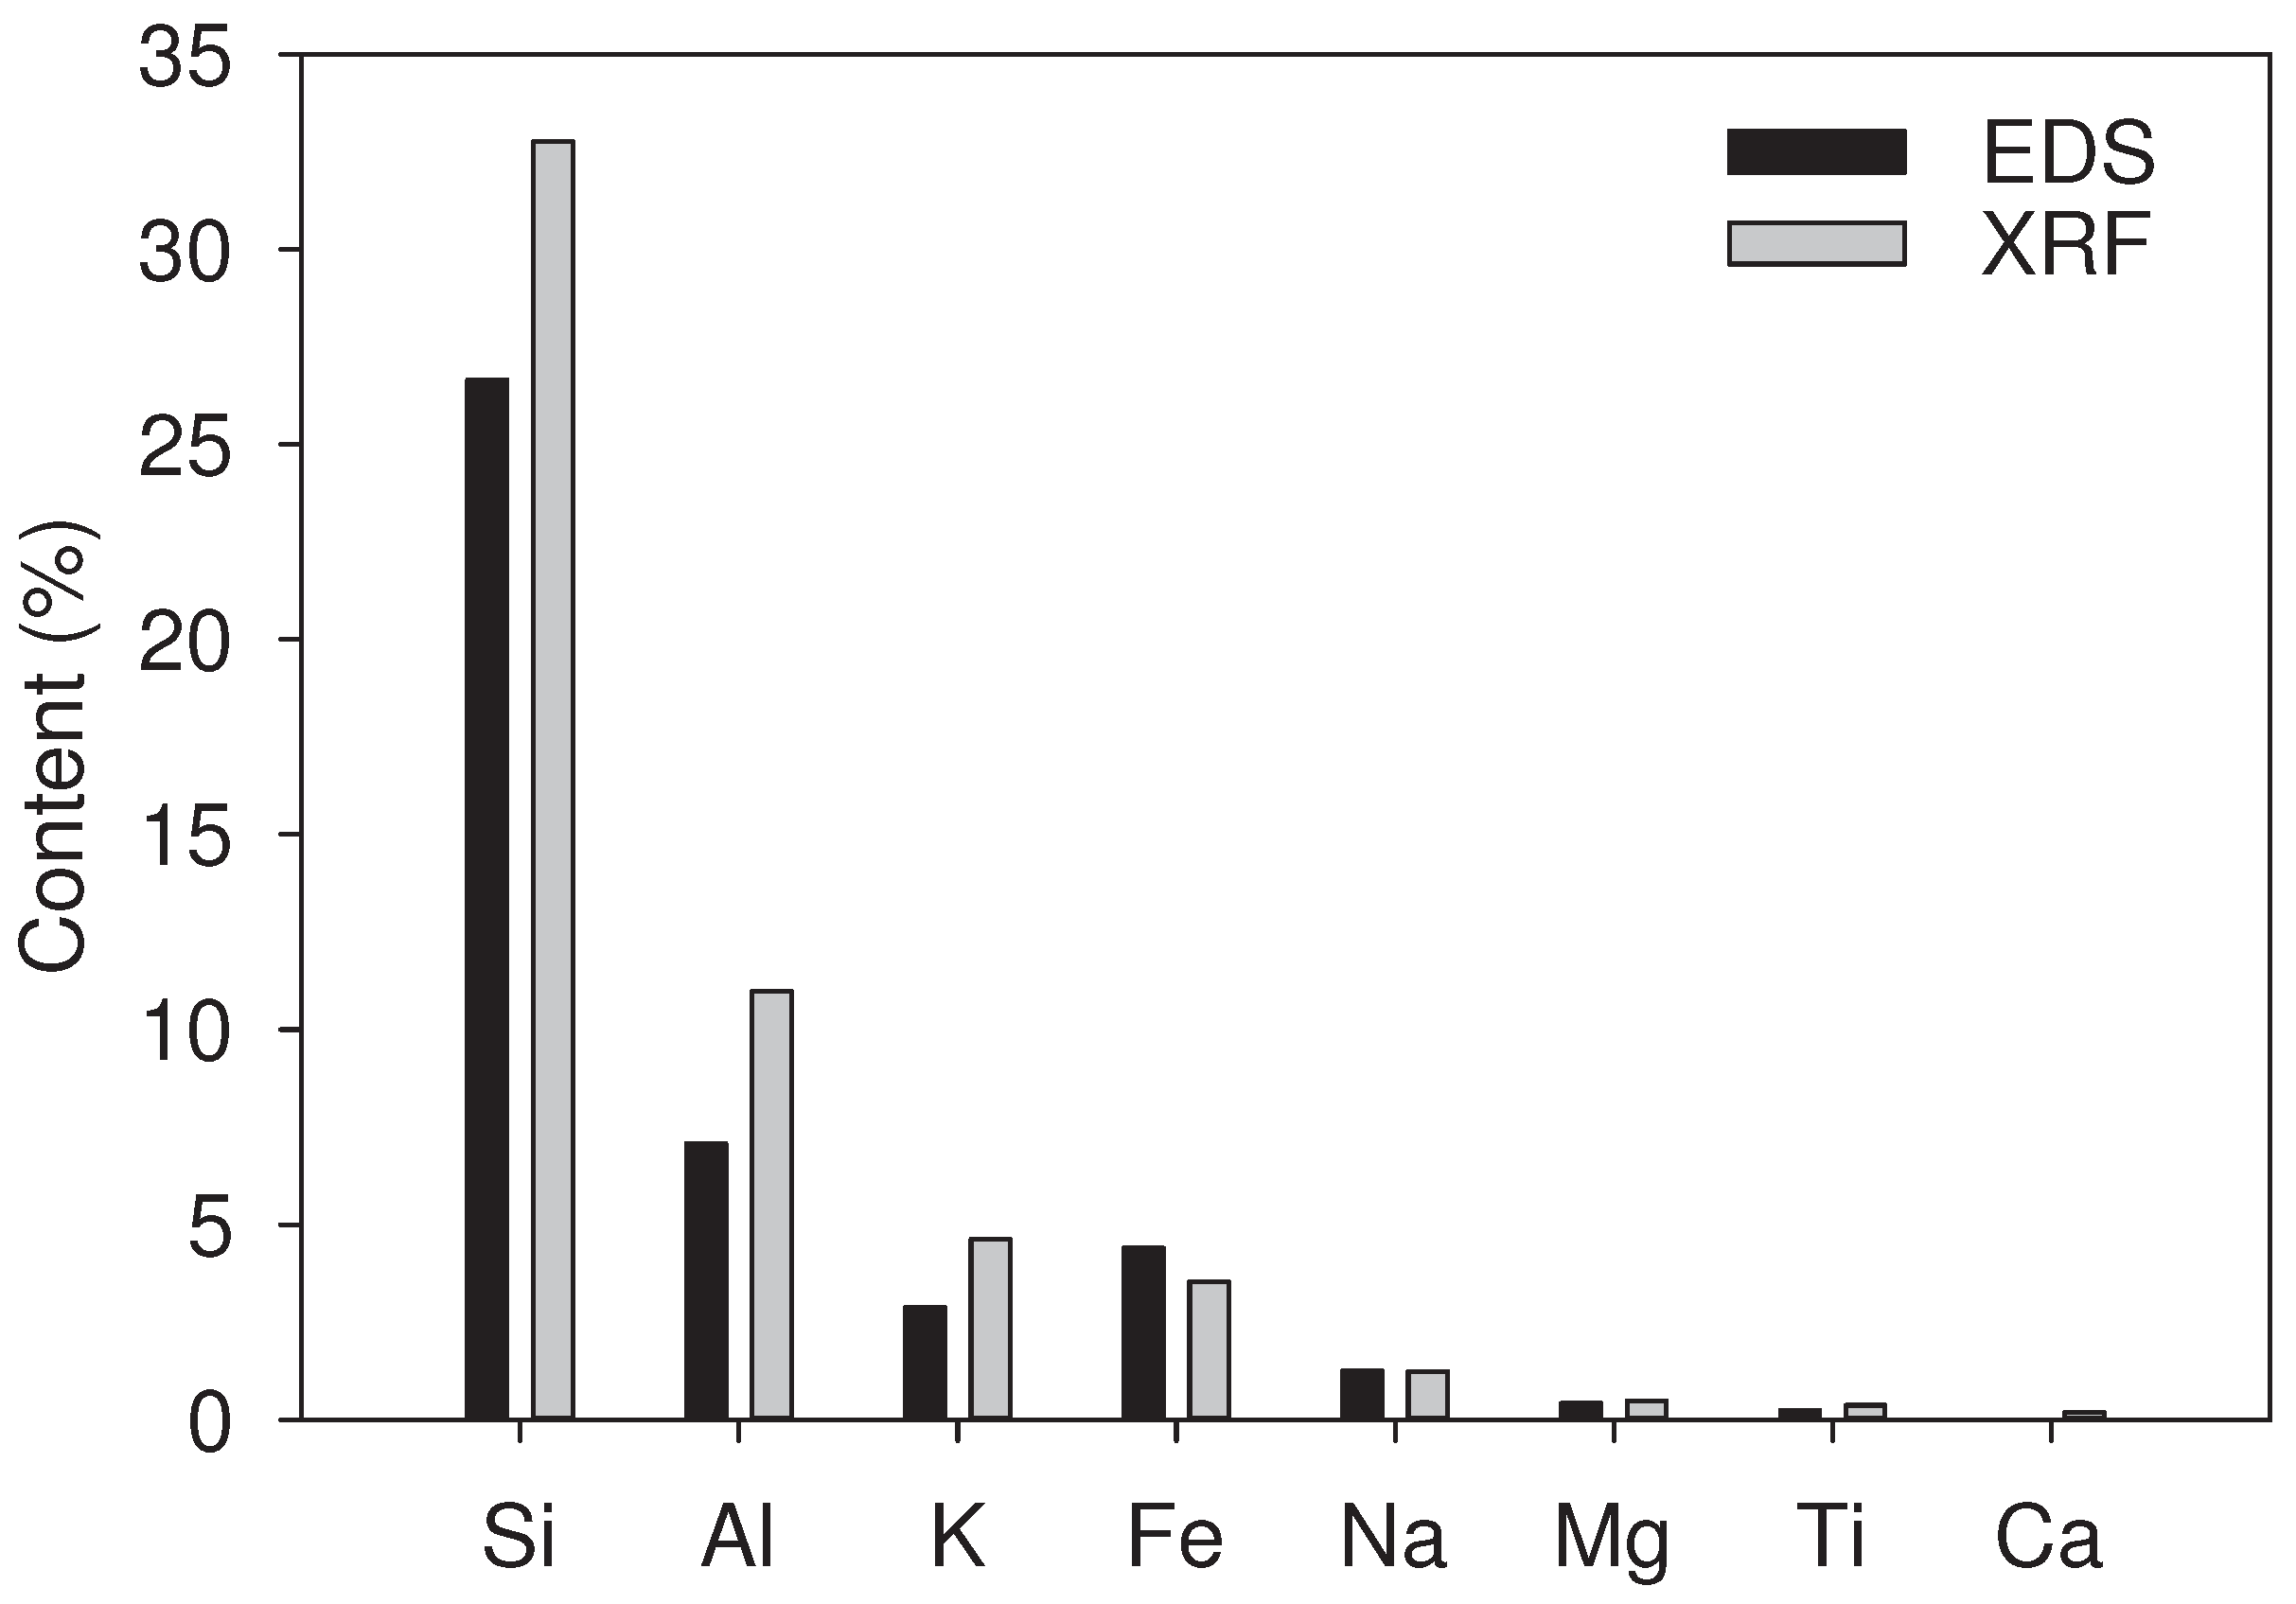
2.2. Scanning Electron Microscopy (SEM) and Energy Dispersive Spectroscopy (EDS)

As part of the identification of granular materials, SEM observations were executed to identify the chemical composition of the granular particles. It is relevant to highlight that, for the case of non-conductive samples such as sand particles, it was necessary to cover the surface of the sample with a very thin layer of gold (between 10 and 12 nm) using a Quorum Q150 R apparatus to make the sample conductive. This allowed the interaction with the electrons as a technique in which imaging is carried out by using the emission of secondary electrons and back-scattered electrons [32].
As part of the identification of sands under analysis, SEM observations were executed to carry out the EDS analysis, as one of the chemical characterization techniques. The particles were analyzed via EDS for different retained sizes, such as sieves No. 16 (1.19 mm), 40 (0.42 mm), 80 (0.18 mm), 200 (75 µm), and 500 (25 µm), to identify the chemical composition from sand sizes up to fine particles. The Scanning Electron Microscopy analysis was carried out under dry conditions with a Zeiss EVO HD15 Scanning Electron Microscope apparatus under electron high tension (EHT) voltage up to 20 kV, with a thin gold cover over the sand particles and high-vacuum condition. Moreover, EDS analysis was carried out with an Oxford Instruments X-Max 20 detector under an accelerating voltage of 20.0 kV, a working distance from 5 mm up to 9.5 mm, an energy range of 20.0 (keV), and an output rate from 8.000 to 12.000 cps.

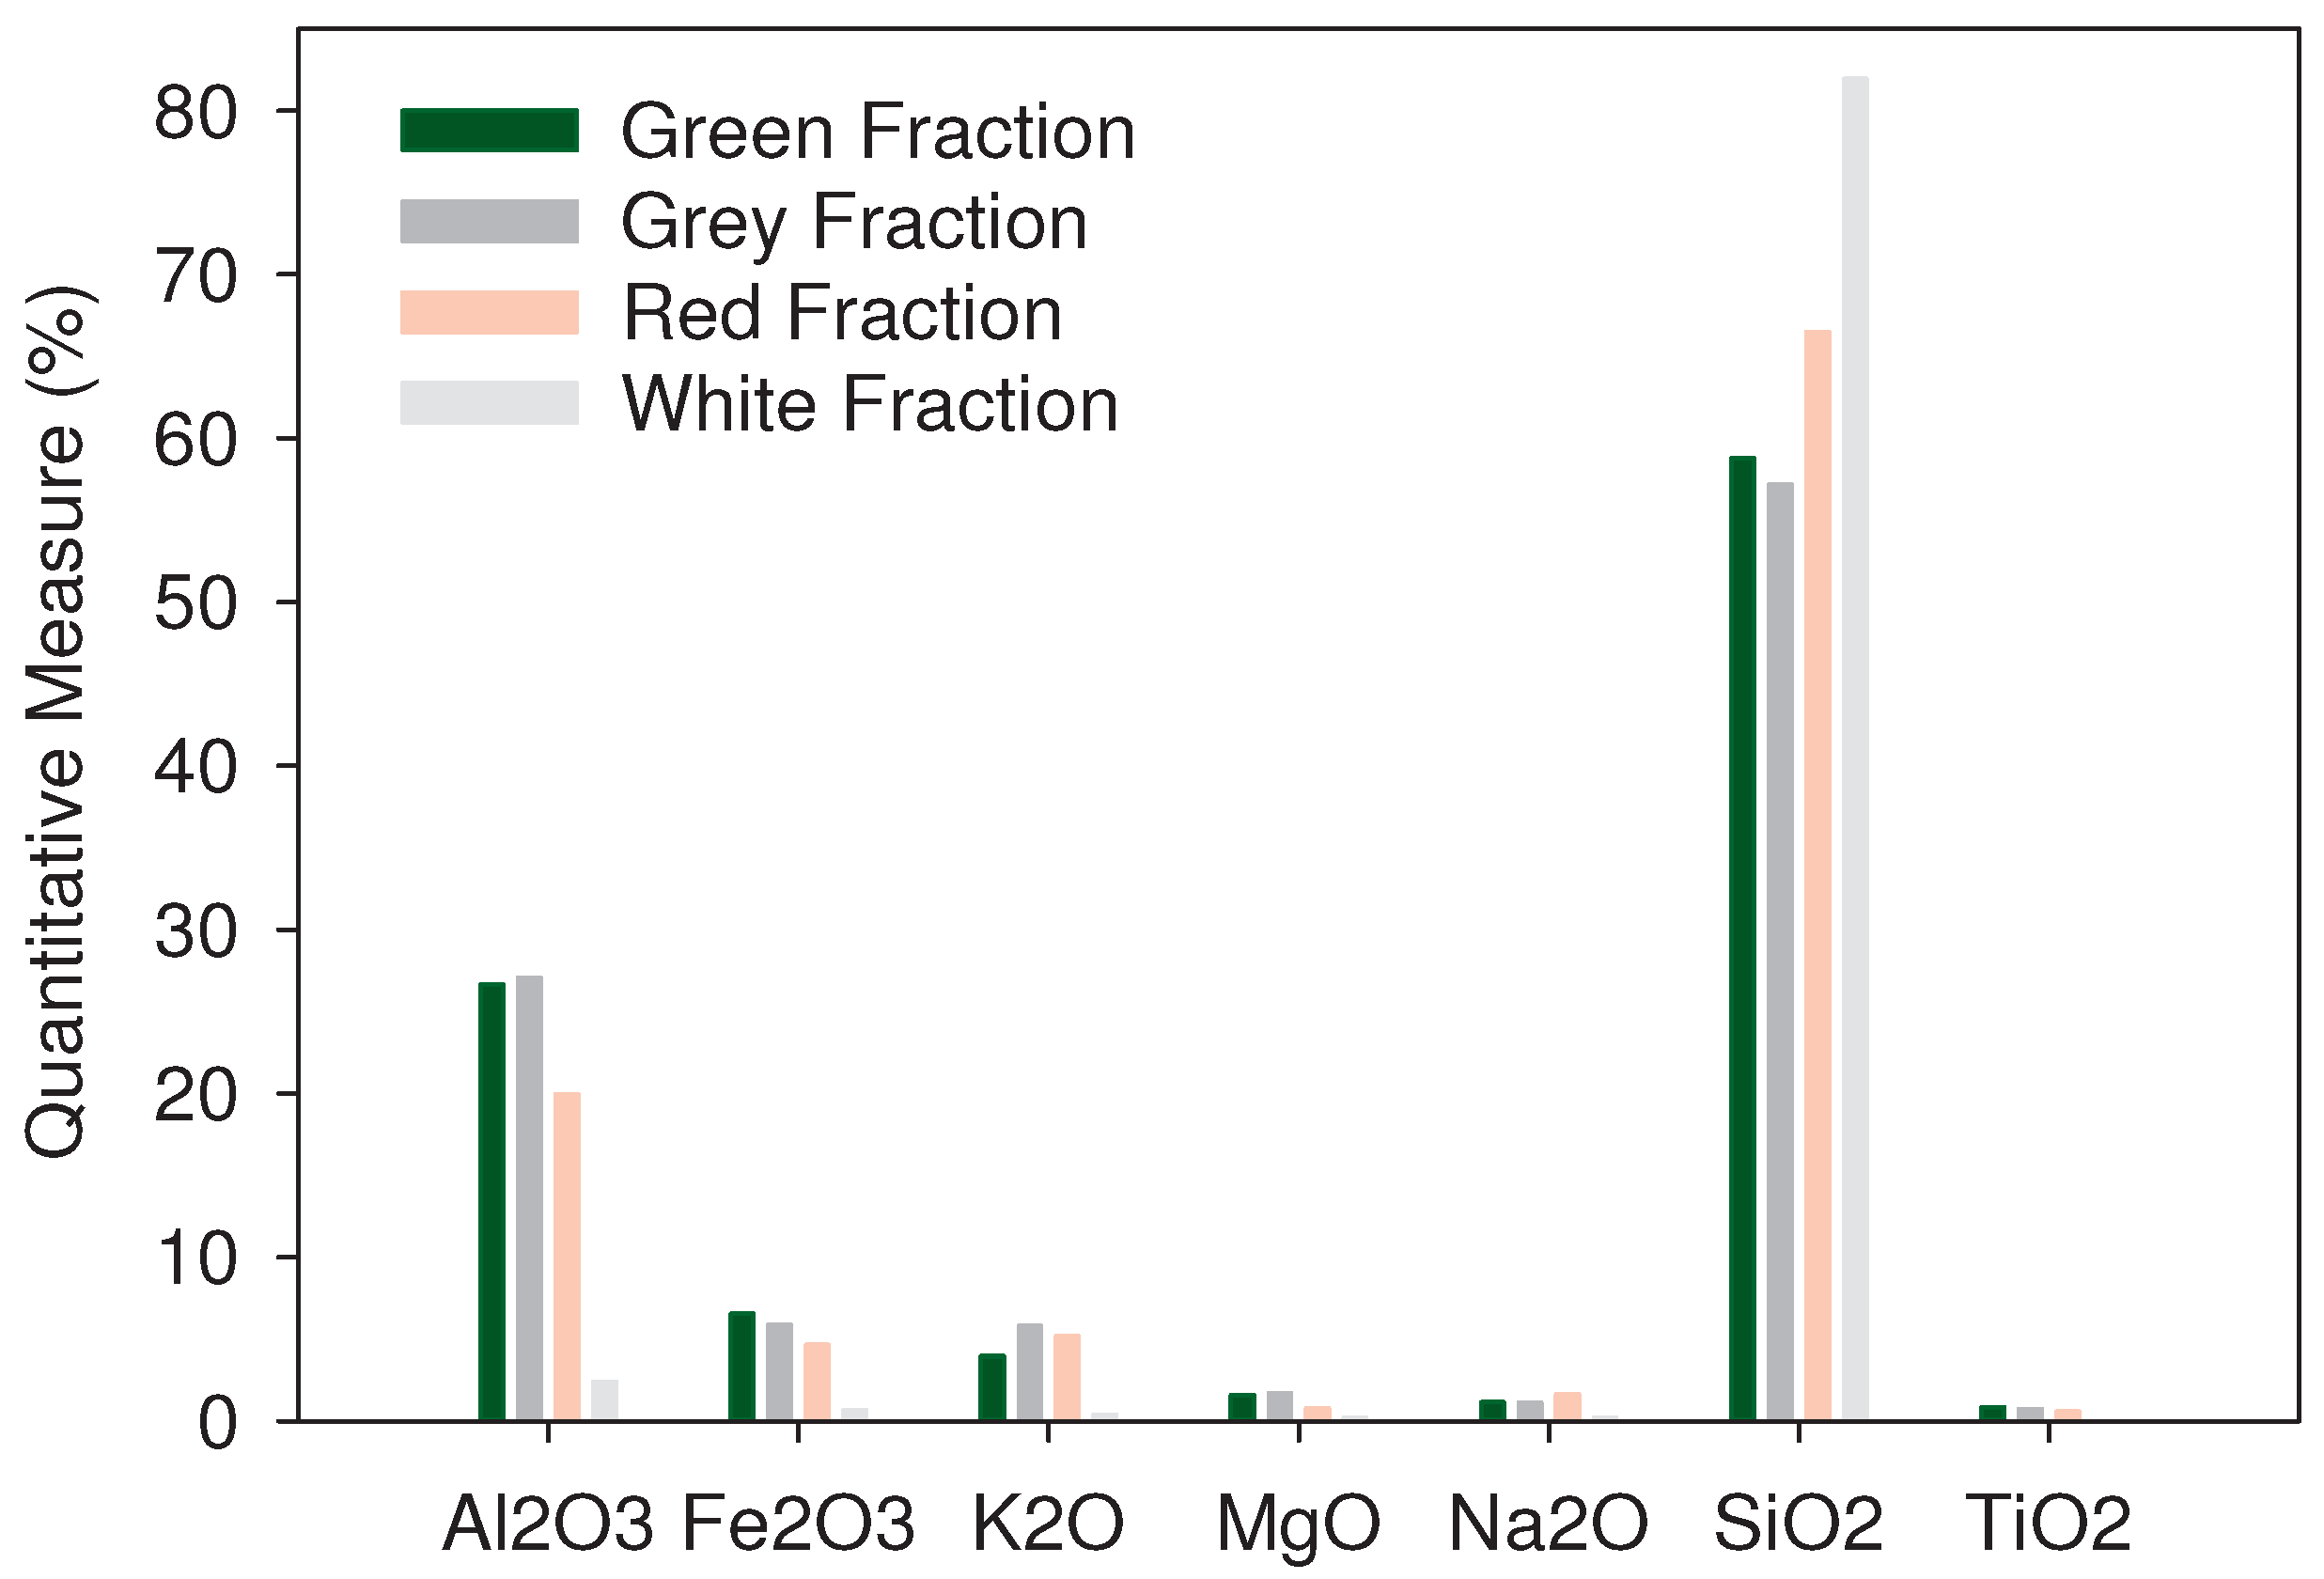
2.3. X-ray Fluorescence Analysis (XRF)

The X-ray fluorescence spectrometry is a common technique for the analysis of bulk specimens and for the identification of the major chemical elements in geological samples [33]. XRF analysis is one of the most used methods for mineral and rock analysis due to its ability to identify major elements, such as Na, Mg, Al, Si, P, Mn, and Fe, and trace elements, such as Zr, Zn, Ba, Pb, Ni, and Cu [34]. Moreover, XRF spectrometry is a powerful and highly used method due to its ability to determine chemical compositions of solid materials for geochemical analysis [35]. It is important to highlight that XRF uncertainties are commonly less than 0.2 to 0.4% for major elements. Furthermore, XRF allows analysis in parts per million (ppm) that cannot be measured using competitive techniques, such as EDS [34].
All the samples were prepared in compressed pellet discs under dry conditions for each representative fraction of sands by fracturing and pulverizing the particles to reach a size passing sieve No. 400 (37 μ m) and retained in sieve No. 500 (25 μ m). The samples were excited with X-ray radiation using an X-ray tube operated at a radiation of 40 kV and analyzed under 8 deg/min with a Shimadzu XRF 1800 sequential X-ray fluorescence spectrometer apparatus. The XRF spectrometer was calibrated against the standard sample of Ottawa sand, specially graded sand of naturally rounded silica particles of nearly pure quartz mined from Ottawa, Illinois.

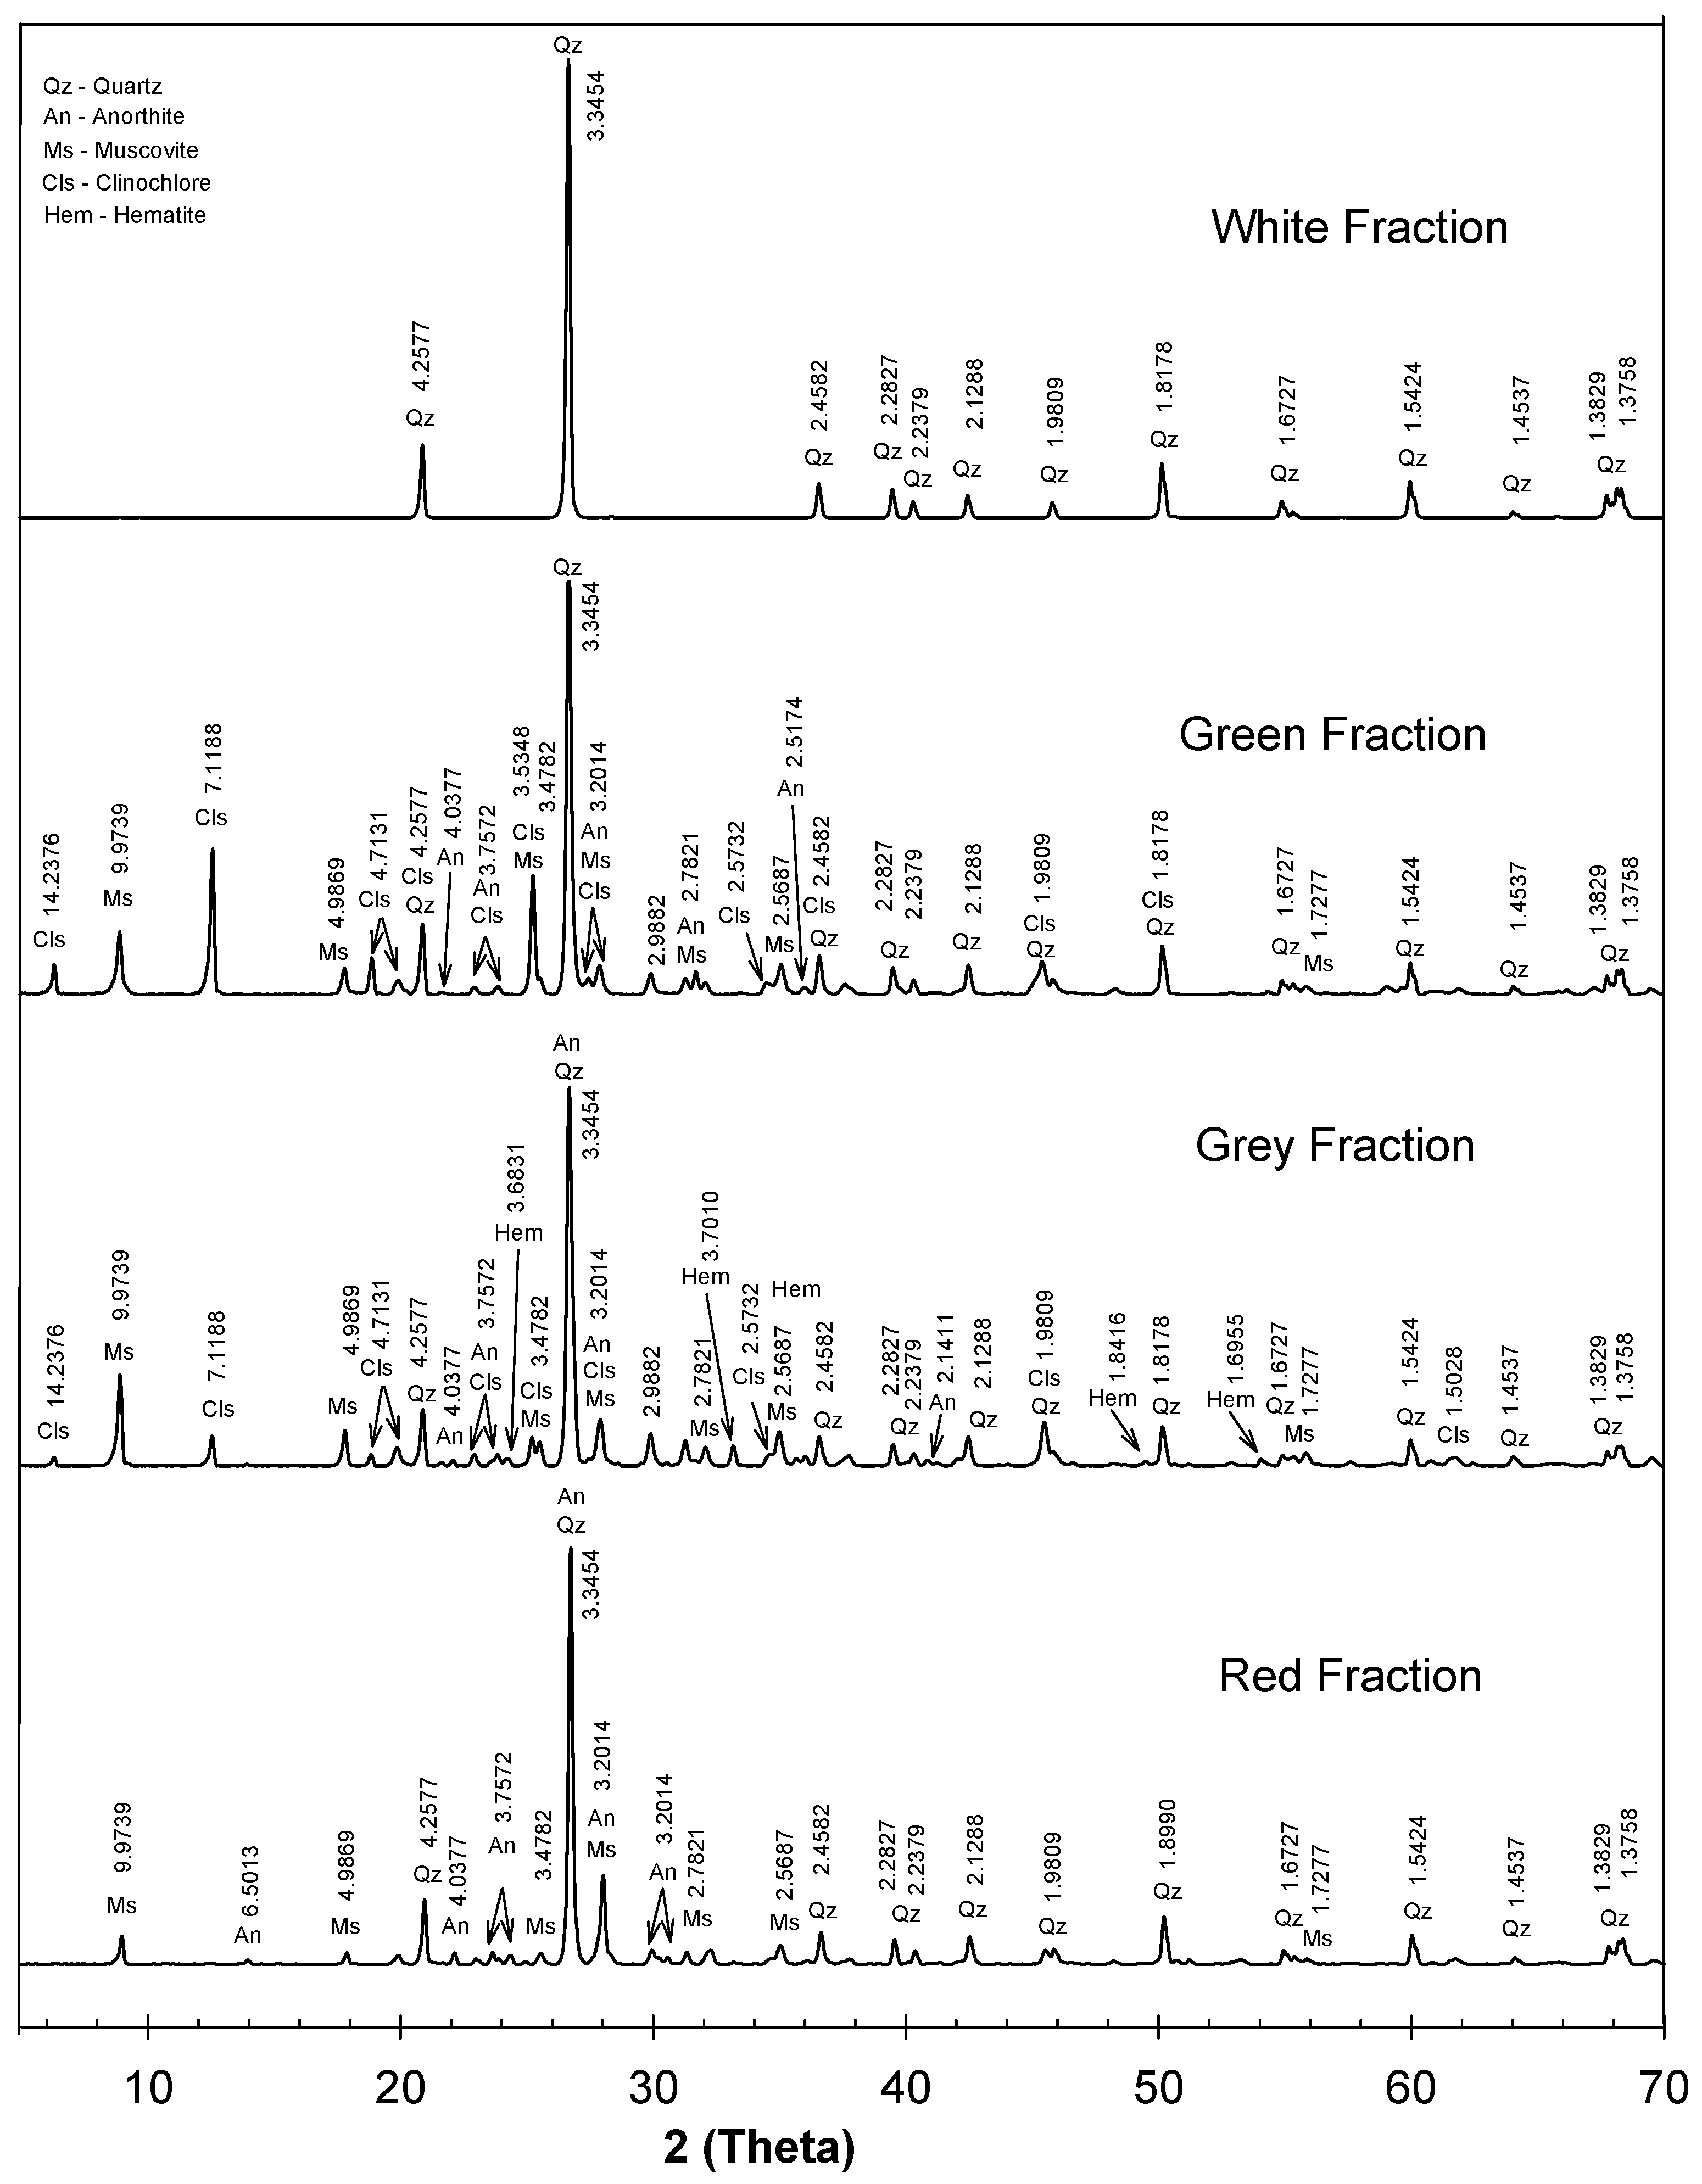
2.4. X-ray Diffraction Analysis (XRD)

On the other hand, the minerals that conform the soil structure were formed under certain thermodynamic and physicochemical conditions that influence the arrangement of atoms and the crystalline structure [36]. According to Ali et al. (2022) [36], minerals are usually classified and characterized based on their physical properties, such as hardness, crystallinity, and density. However, XRD is a non-destructive form of analysis that provides information about the crystallographic structure and crystalline phases [37]. As a technique, it requires the measurement of the angular relation between the incidence and the diffracted radiation [38]. Moreover, XRD is a non-destructive analysis in which X-rays are emitted via a goniometer to measure the diffracted X-ray intensities at different rotation angles of the sample, according to Bragg’s Law presented in Equation (1), where d is the distance between the atomic planes and θ is the diffraction beam angle. Peak positions and intensities allow qualitative analysis and the determination of both crystalline size and the degree of crystallization of samples.
λ = 2 · d · s i n ( θ )
Similar to XRF analysis, the samples were prepared in compressed pellet discs under dry conditions for each representative fraction of sand (with sizes from 37 μ m and up to 25 μ m). The samples were analyzed with X-ray radiation from 4.90 to 69.92 ( 2 θ ), a 0.020 step size, and a Cu-Ka 1 - 1.5406 (Å) wavelength using a Shimadzu XRD 7000 x-ray diffractometer apparatus. The XRD analyses were interpreted based on the Crystallography Open Database for the identification of the crystalline structures and the chemical compounds present in each representative fraction.

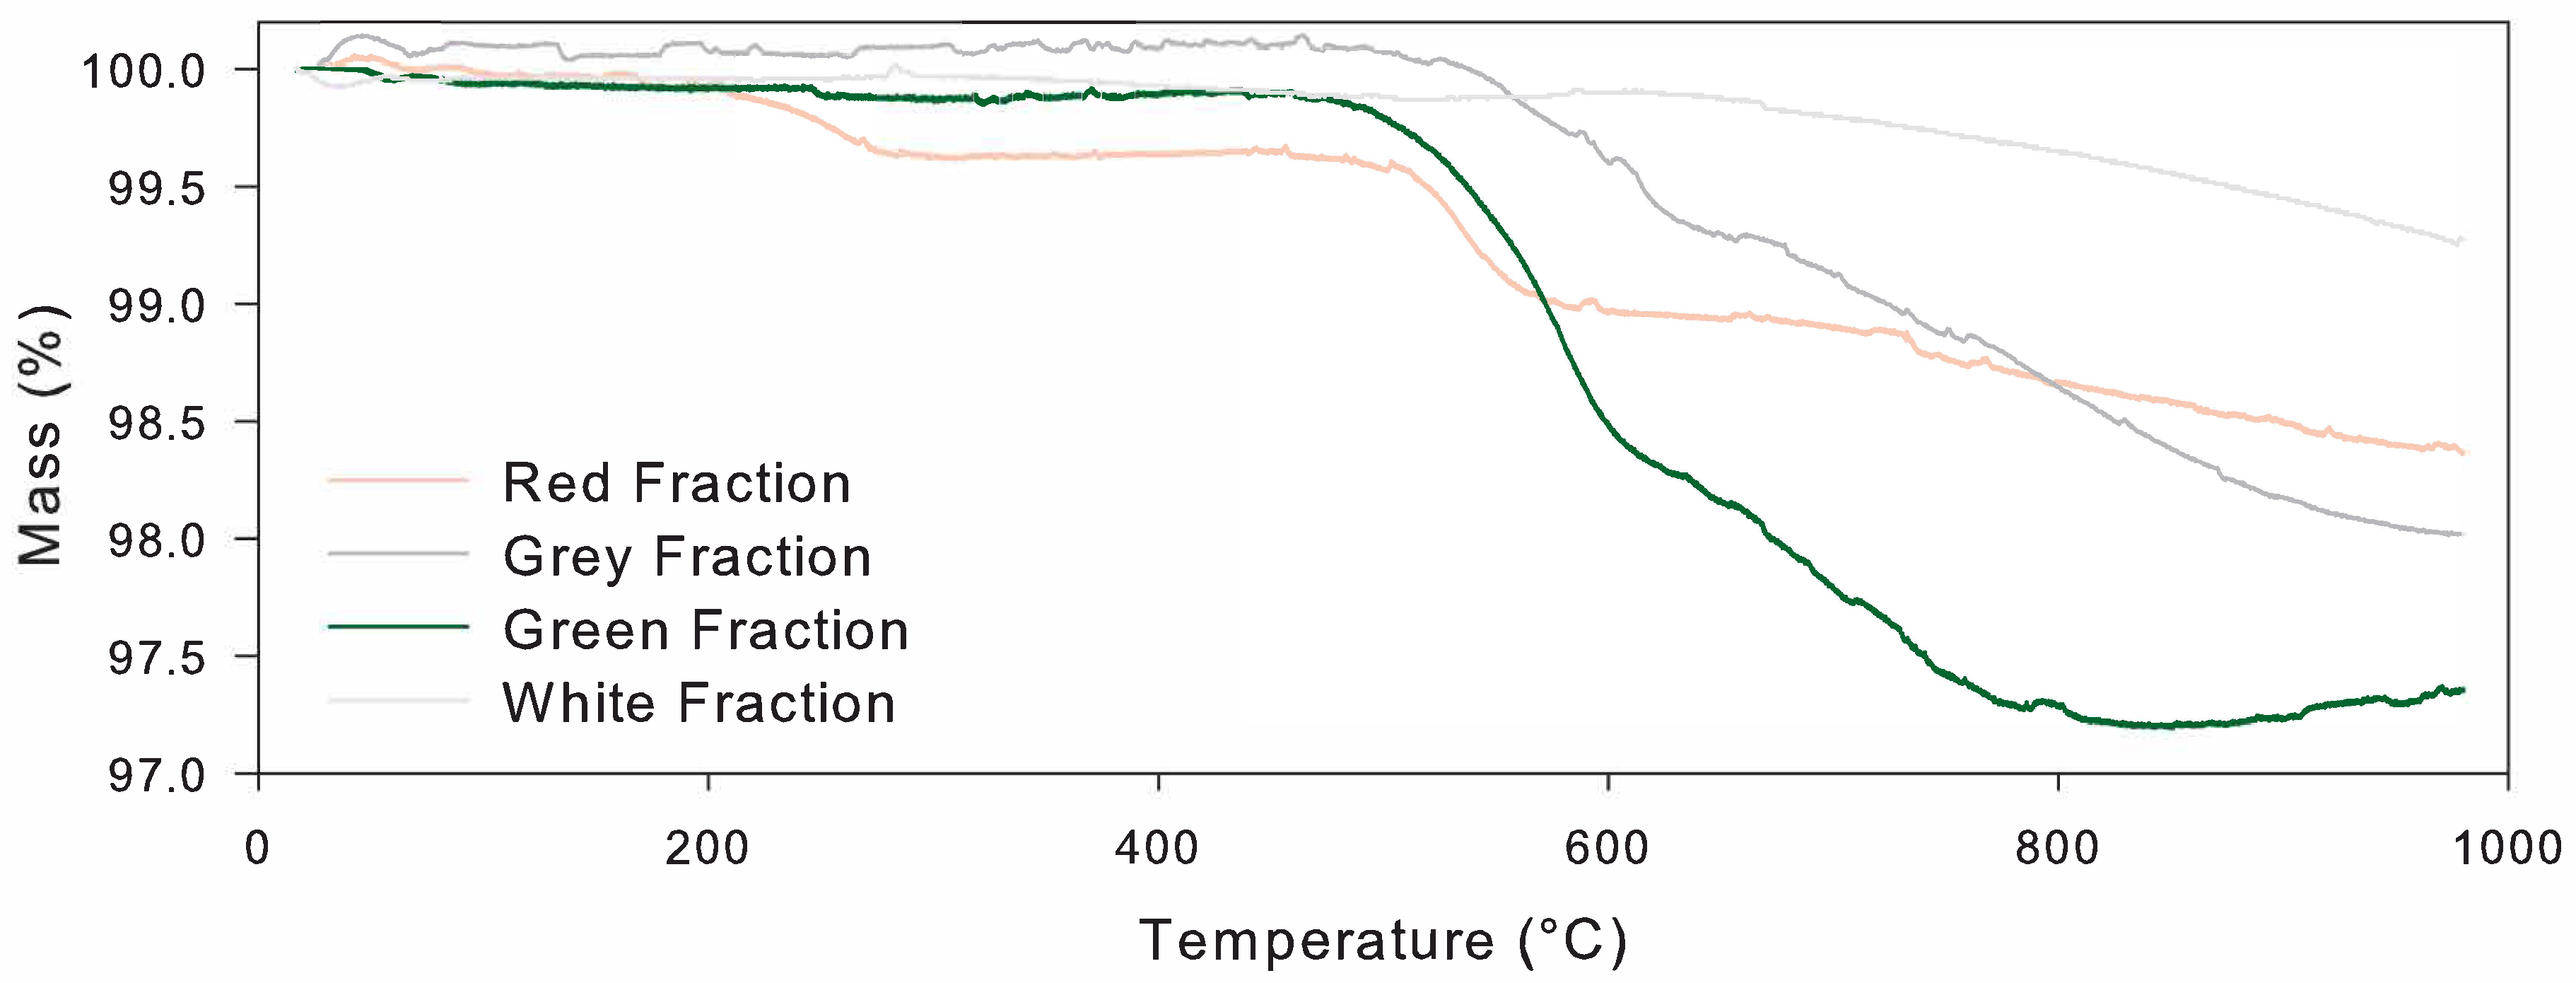
2.5. Thermogravimetric Analysis (TGA)

Another set of techniques that has gained importance for the quantitative and qualitative identification of minerals, whose potential is very high but is not fully used, is thermoanalytical studies [39]. As one of these methods, thermogravimetric analysis (TGA) is a technique in which the mass is measured as a function of temperature that rises in a controlled ramp. Furthermore, one of the most relevant aspects is that TGA analysis can only be applied to thermally active minerals, highlighting that the conditions under which most soil minerals were developed (temperature and pressure) determine their thermal activity. Therefore, most soil minerals only show small thermal reactions under the TGA temperature range (up to 1500 °C) [39].
The temperature increase could be related to three relevant processes: dehydroxylation (a process in which the hydroxyl group OH is released by forming a water molecule), calcination, and sulfate dissociation. All these processes have a strong dependence on the mineral cation and the temperature range. Furthermore, for the TGA analysis, as a process with a dependence on the cations, the temperature of the mass change (decomposition reaction) could be an accurate way to determine the presence of elements in the sands under study. Thus, TG analyses were performed for each of the representative fractions, using a Shimadzu TGA-50 apparatus, under controlled temperature increases of 10 °C/min up to 990 °C in a platinum pan with a diameter of 6 mm and a height of 2.5 mm. Furthermore, all the analyses were performed in a controlled nitrogen atmosphere, with samples ranging from 5 up to 10 milligrams (mg), under dry conditions for sizes between 37 μ m and 25 μ m.

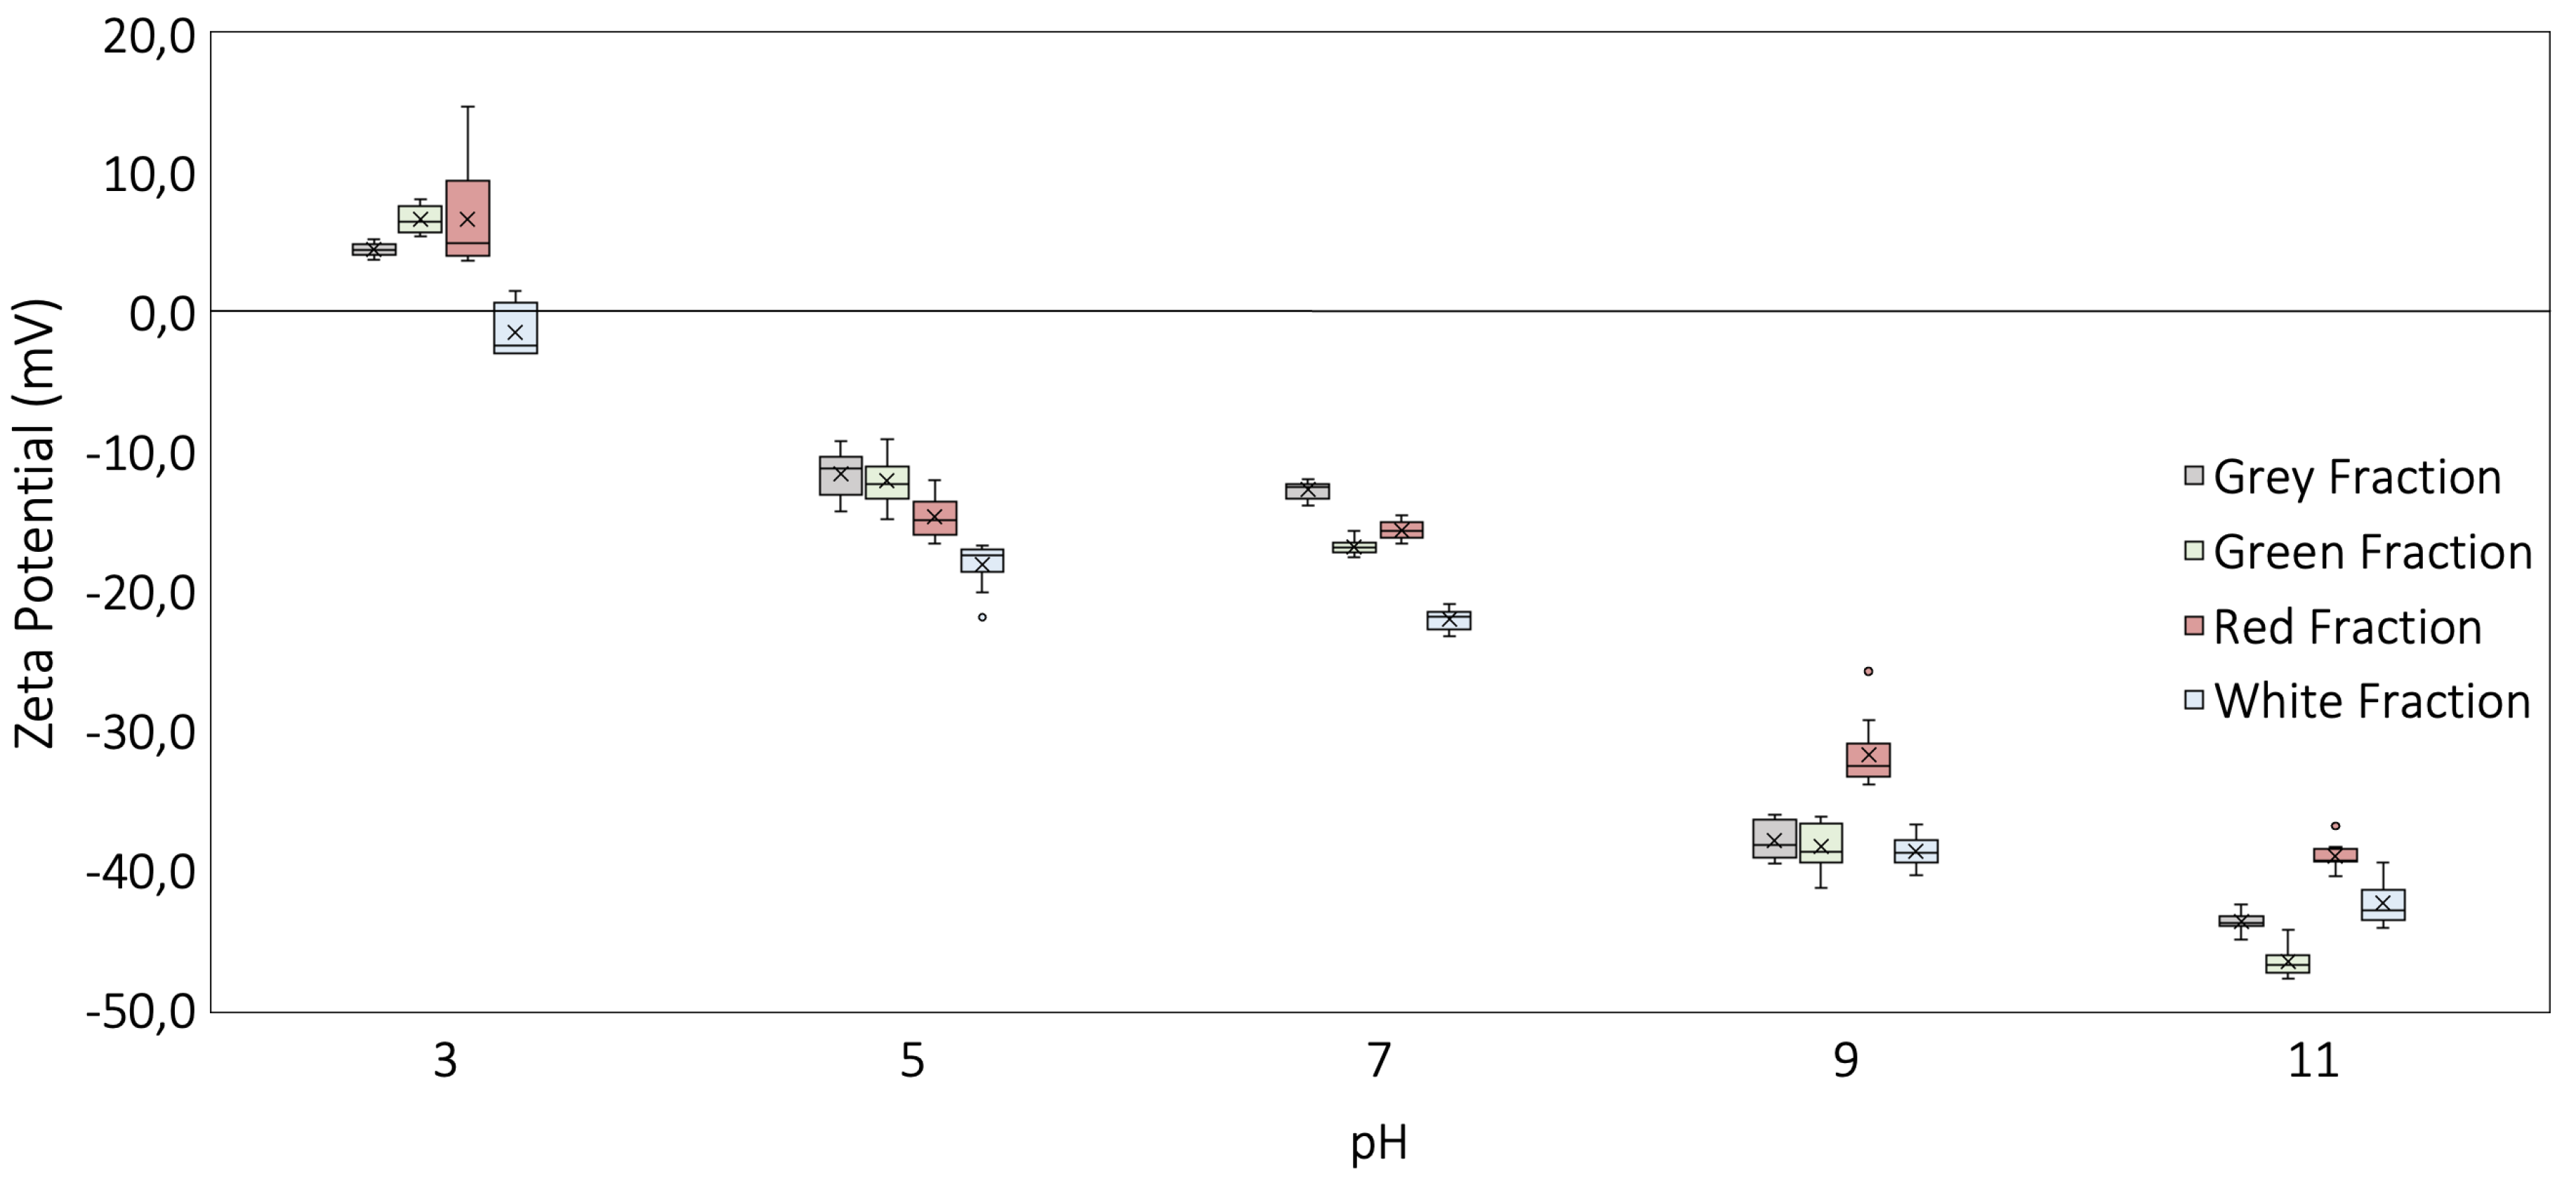
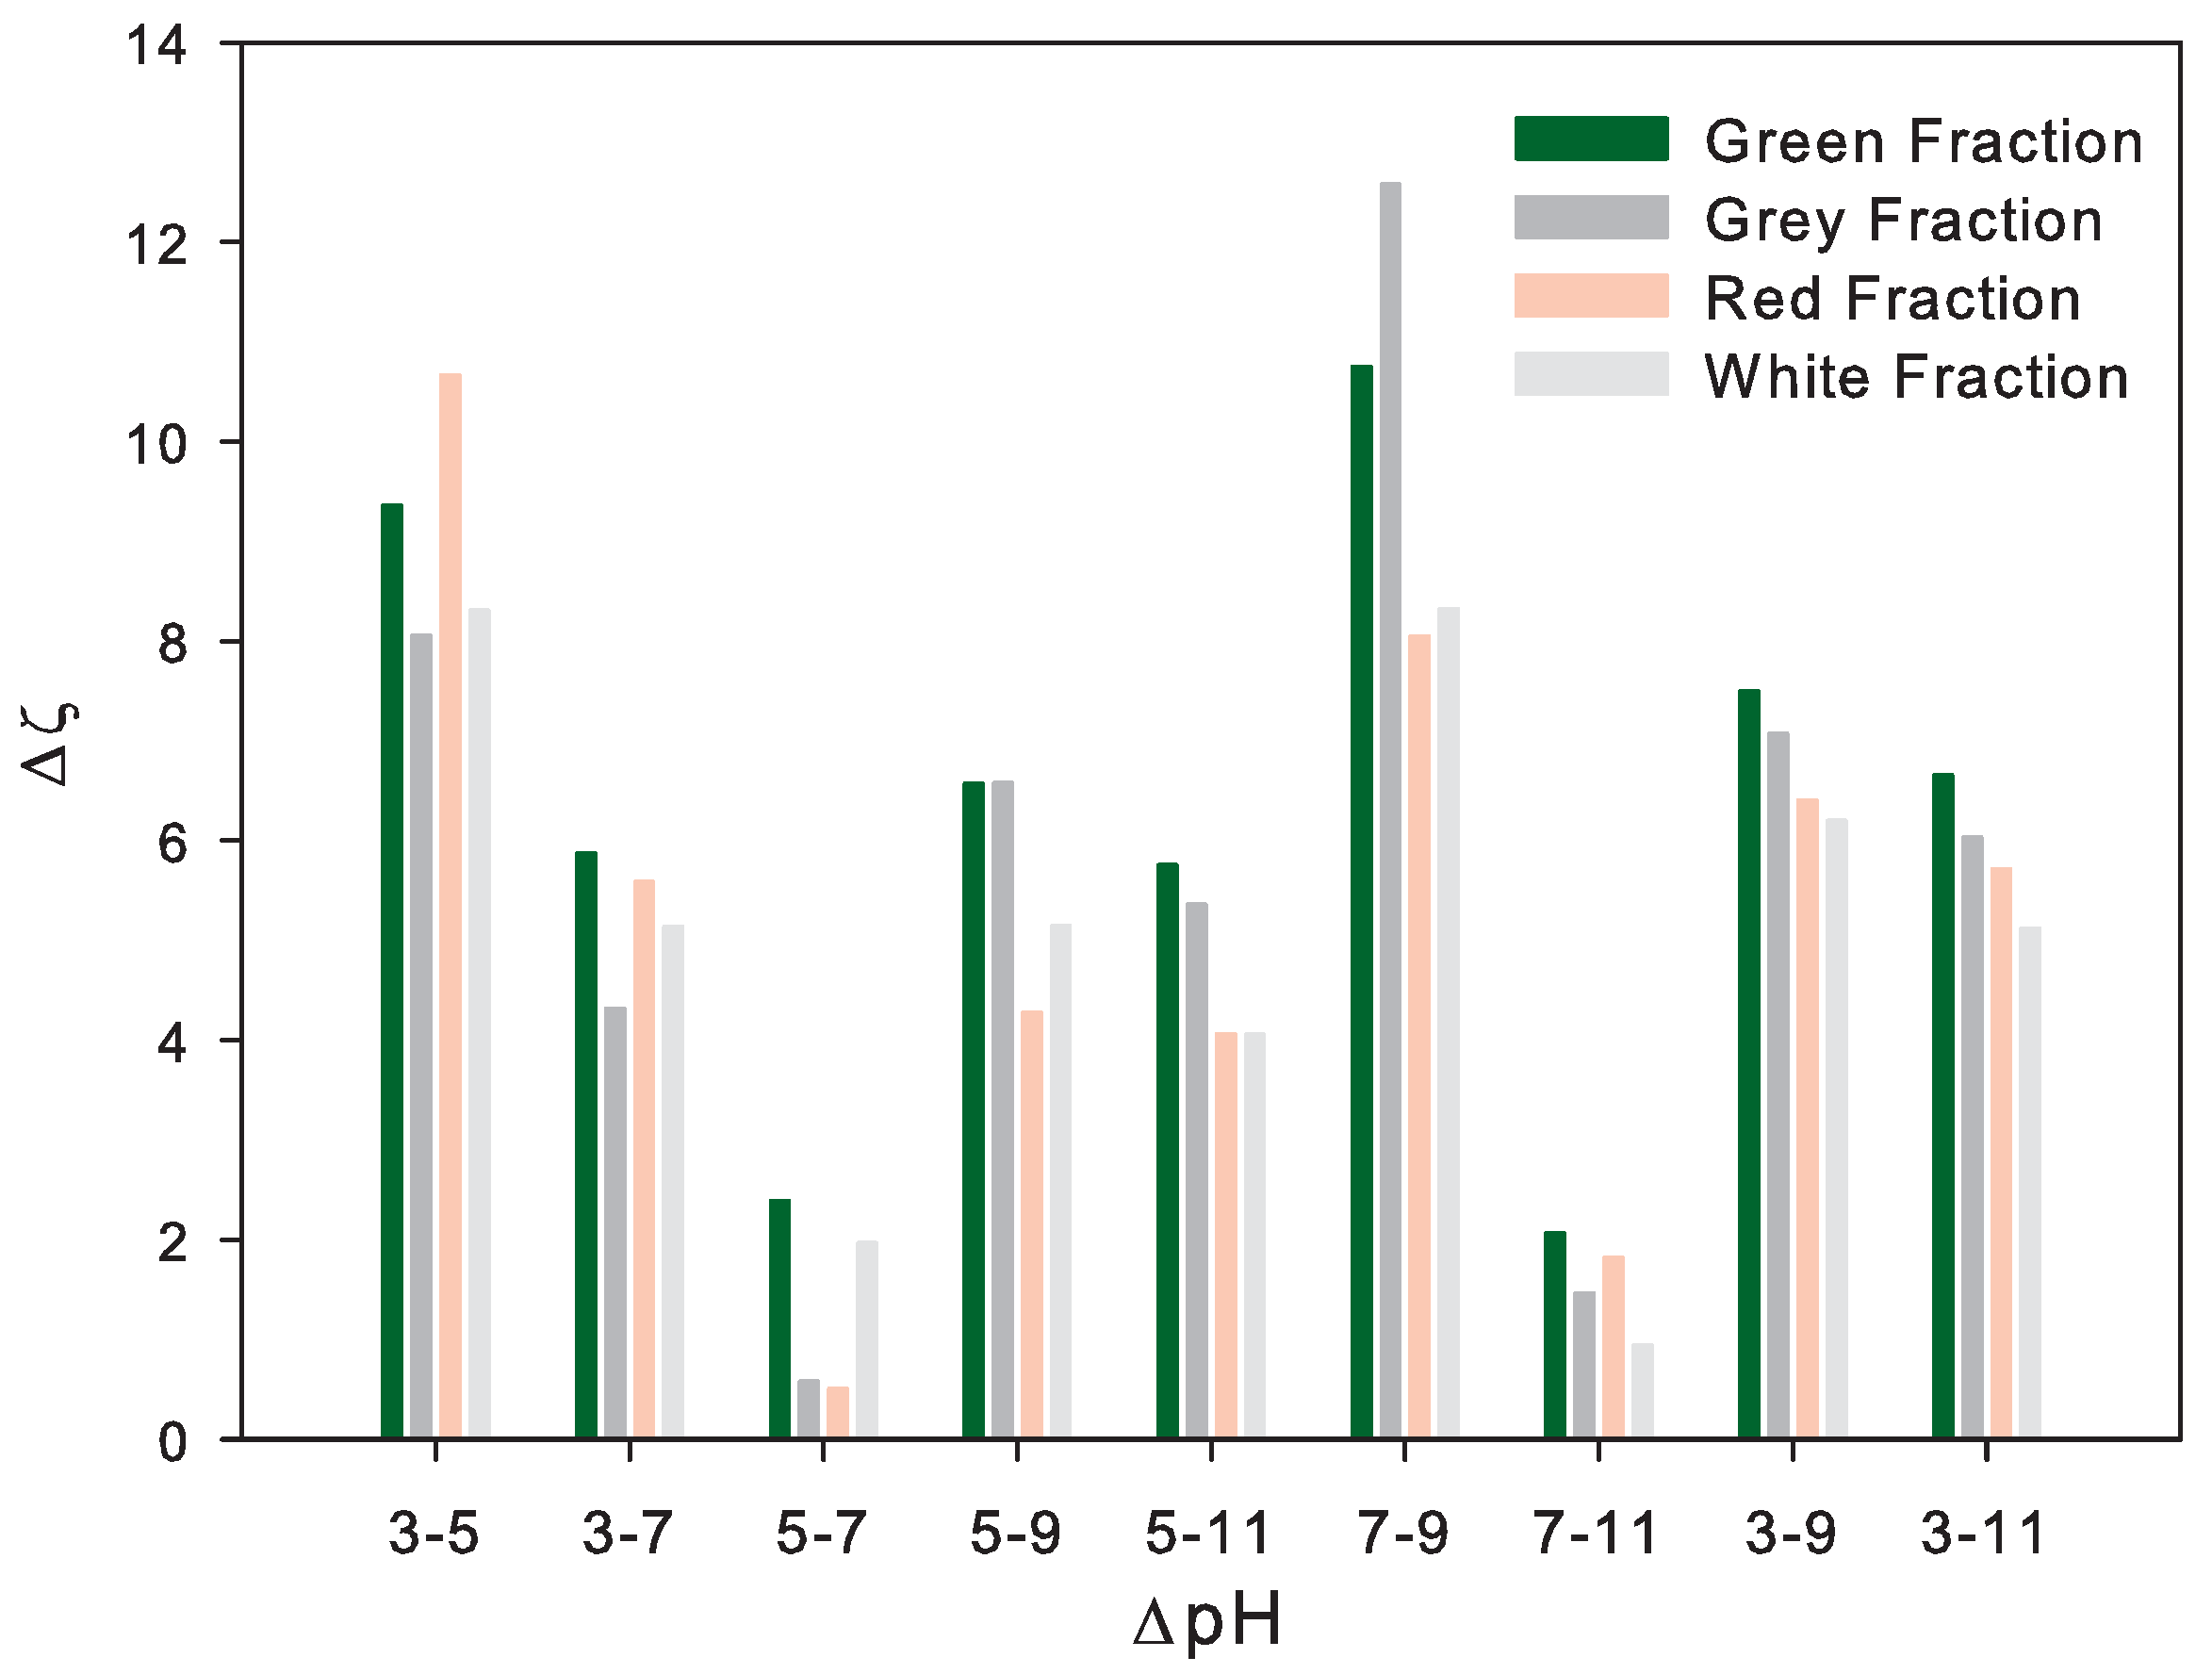
2.6. Zeta Potential of Soils

The zeta potential (ZP) or electrokinetic potential of soils, denoted as ζ , is an electric potential in the interface of the double layer in colloidal systems [19] and is a physical property exhibited by any particle in suspension or on a material’s surface [40]. On the other hand, colloids, in a soil context, are particles with diameters below 0.002 mm or 2 μ m formed principally by crystalline aluminum, silicates, and iron oxides [19]. Moreover, the ZP is a relevant measure of the electrical potential at the mineral surface [23] and controls the electrostatic interactions between the mineral surface and polar species in aqueous solution (i.e., water), and the mineral surface and other charged interfaces such as mineral particles [24]. The ZP can be measured by at least six different methods: the electroosmotic method, the electrophoresis method, the streaming potential technique, electrophoretic light scattering (ELS), laser doppler velocimetry, and electrokinetic sonic amplitude (ESA) [19].
However, the measurement of the ZP in soil materials is principally determined by electroosmotic or electrophoresis methods, and they will be the principal ways to ZP determination in this research. Therefore, understanding any process that could affect the ZP’s determination has relevance and should be considered before executing any process. In this way, the electrochemical properties at any material’s surface–liquid interface are critically dependent upon the dispersing agent, interfacial chemistry [41], the isothermal conditions [40], and the numerical approaches that are implicit in the process.
One of the main factors that affect the ZP is the pH of the sample, considering that if the suspension is more basic, the particles tend to be more negative (in terms of charge) and will reduce the ZP values [42]. Thus, the thickness of the double layer ( κ 1 ) depends upon the concentration of ions in the solution, which implies that the conductivity and the specific adsorption of ions onto a particle surface could have a dramatic effect on the ZP of the solution. As mentioned previously, the electrophoresis phenomena gained relevance in the present study, considering that the ZP ( ζ ) was determined by placing fine particles in an electric field and measuring their mobility ( υ E ) [43,44], as presented in Equation (2).
υ E = 4 π ε 0 ε r ζ 6 π μ ( 1 + κ r )
where ε 0 and ε r are the relative dielectric constant and the electrical permittivity of a vacuum, respectively; μ is the viscosity of the solution; r is the particle radius; and κ is the Debye–Huckel parameter. However, the Equation (2) was simplified with f( κ a) using “Henry’s function”, as presented in Equation (3).
υ E = 2 ε ζ f ( κ a ) 3 η
where υ E is the electrophoretic mobility, ε is the dielectric constant, ζ is the zeta potential, η is the viscosity, and f( κ a) is Henry’s function. As reported by Delgado et al. (2005) [25], f( κ a) depends of the solvent type (polar or non-polar) and can be presented with the Smoluchowski approximation. Therefore, in aqueous solutions of moderate electrolyte concentration, a Henry’s function value of 1.5 can be employed (Smoluchowski approximation), and it should be set to 1.0 in a non-polar solvent as in Huckel’s approximation. Some specific parameters of the sample and the solvent must be clear before the ZP’s estimation. In terms of the solvent, water, kerosene, ethylene glycol, or aqueous solutions such as KCl or LaCl 3 can be implemented for ZP determination. For the present investigation, the ZP analysis was carried out with a Zetasizer Nano Series from Malvern, under acidic conditions (pH 3 and 5) with HCl in a concentration of 0.001 mol, basic conditions (pH 9 and 11) with NaOH in concentrations of 0.001 mol, and with a reference solution with neutral pH (7) conditions. Moreover, the ZP analysis was carried out with 25 zeta runs per pH and per sample, with 100 internal sub-runs per zeta run to guarantee the stability of the measure, controlling mean values and deviation for each ZP point.
The ZP analysis was executed with a controlled temperature of 25 °C, a refractive index, as suggested by Abbate et al. (1978) [45] defined as 1.318 for a 1550 nm wavelength, a viscosity established as 0.0091 poise, and a dielectric constant ε defined as 78.4 [46]. Moreover, for soil samples, the refractive index (RI) must be defined for ZP estimation. The RI for soils was studied by Ishida et al. (1991) [47], who identified that the “real” value for soil particles could vary from 1.42 up to 1.73, according to the chemical composition of soil constitutions, based on Mie scattering theory and Delta–Ellington approximation.

3. Results and Discussion

Before the analysis of the particles under study, the XRD apparatus was calibrated with pure quartz/silica particles (Ottawa sand from Ottawa, Illinois, as an international standard, commonly showing up to 96.0% silicon dioxide, 2.0% aluminum oxide, 0.8% potassium, and some trace elements), as can be found in the state of the art. For the present analysis, the calibration of Ottawa sand showed contents of 98.14% silicon dioxide (SiO 2 ), 1.45% aluminum oxide (Al 2 O 3 ), 0.19% potassium oxide (K 2 O), and 0.09% of both ferric oxide (Fe 2 O 3 ) and titanium dioxide (TiO 2 ). The quantitative identification in each of the representative fractions from the EDS analysis allowed the identification of contents of up to 53% silica (Si) and oxygen (O) and of up to 15% aluminum (Al) in representative fractions; contents of iron (Fe) and potassium (K) of up to 5%; and magnesium (Mg) and sodium (Na) contents of up to 2%. It is important to highlight that the XRF analysis allowed the identification of trace elements such as phosphorus (P), nickel (Ni), and manganese (Mn) not identified by surface EDS measurements (Figure 2).
The identification of the present elements in the representative fractions was consistent with the results obtained via EDS, with some variations of up to 8% between both techniques, as presented in Figure 3. The values of the XRF analysis were higher than those obtained via EDS, an aspect attributed to the quantitative and non-superficial identification of the analysis technique, as it only happens with EDS. The estimation of the chemical compounds in their oxide form allowed the identification of silicon dioxide (SiO 2 ), or silica, as the major constituent for sands in proportions up to 85% for all the representative fractions, the identification of aluminum oxide (Al 2 O 3 ) in up to 28%, and the presence of ferric oxide (Fe 2 O 3 ) and potassium oxide (K 2 O) in up to 8% that could be related with the presence of muscovite (Ms), as presented in Figure 4. The sands under study showed a high presence of α quartz structures, a mineral that exhibits good resistance to weathering processes [48], and are commonly insoluble in water. Furthermore, XRF analysis showed the presence of Fe 2 O 3 in proportions up to 8% for the green and red representative fractions, considering that iron (III) oxide, in its hematite structure, could be attacked by acids with a predominantly low dissolution rate (over a high dissolution rate) based on the type of acid [49,50,51].
One of the relevant aspects for the interpretation of the diffractograms is the identification of major and minor phases, caused by intensity peaks, based on the relation with the diffraction angle (2 θ ) and the distance between atomic planes (d) expressed in Å. The identification of the XRD patterns demonstrates a strong relationship with α quartz structures (Qz), based on the peaks correlated with the presence of silicon dioxide (SiO 2 ) with a trigonal crystal system, with an acceptability of up to 98% (figure of Merit—FoM) for the white fraction and up to 88% for the green, gray, and red representative fractions.
Musvovite phases (Ms)—KAl 2 (AlSi 3 O 10 )(OH) 2 —were identified for three representative fractions (green, gray, and red) with an acceptability of up to 82% (figure of Merit—FoM). Furthermore, based on the Crystallography Open Database (COD), minor phases such as hematite (Hem) were identified in the gray fraction diffractograms, with a rhombohedral structure, with major peaks at 24.19°, 33.13°, and 35.63°; these findings are consistent with Xu et al. (2015) [52] and Zainuri et al. (2017) [53]. Minor phases of anorthite (An) were identified for the green, gray, and red representative fractions with a triclinic (anorthic) crystal system, with major peaks at 18.79°, 22.50°, 27.43°, and 27.87°. Moreover, phases of triclinic (anorthic) clinochlore, with major peaks at 6.29°, 12.59°, 19.83°, 34.59°, and 45.45°, were found in both the green and gray representative fractions as an aluminosilicate of magnesium, iron, and aluminum; these findings are consistent with the composition presented in the XRF tests.
All representative fractions showed consistent patterns with quartz peaks, presented at 26.625, 50.109, and 20.649 for 2 θ values, as presented in Figure 5, and were also consistent with the chemical compounds identified in the XRF analysis. The XRD identification was consistent with two major phases: quartz (Qz) and muscovite (Ms). For the white representative fraction, a pure quartz phase was identified, while quartz (Qz) and muscovite (Ms) phases were identified for the other representative fractions, and some traces of minor phases of clinochlore (Cls) and anorthite (An) were identified for the green and gray fractions, as presented in Figure 5. Furthermore, the peaks are well resolved in the patterns, especially at d-spacing of 3.34 Å, 4.25 Å, and 1.81 Å.
On the other hand, the TGA allowed a quantitative corroboration of the chemical elements and mineral structures presented in each of the representative fractions from the mass loss in specific temperature ranges. Therefore, Figure 6 shows the mass loss for the representative fractions in ranges up to 1000 °C, in which all representative fractions showed a loss of less than 3% in mass. All representative fractions showed a stable behavior, where the mass loss was less than 0.2% up to 200 °C due to the small quantities of sodium or magnesium oxides for the green, gray, and white representative fractions, in which the majority of the chemically bound water or absorbed water on the sand was removed [54,55]. Moreover, all representative fractions presented endothermic peaks near 50 °C that may be related to the to the dehydration of the minerals [56], with a small weight of 0.2%. However, the red representative fraction showed a mass loss (up to 0.7%) between 200 and 230 °C due to the significant presence of potassium oxide (K 2 O) and sodium, as shown in Figure 6.
One of the most significant thermal reactions of minerals in the study, presented as a mass loss, is presented at the range between 450 and 650 °C, in which iron, presented as ferric oxide (Fe 2 O 3 ) and magnesium oxide, showed a reduction in mass up to 2.2%. This mass loss could be related to the dehydroxylation processes of muscovites (Ms) [57,58], which start at 400 °C, as presented by Csáki et al. (2017) [54]. It is important to highlight that the red representative fraction showed less mass loss between 450 and 600 °C due to its smaller quantities of ferric oxide (up to 2% less than the other ones), and remained stable after 800 °C. Furthermore, due to the high contents of silicon dioxide (SiO 2 ), in the form of α quartz, all representative fractions exhibited a mass loss in temperatures over 600–700 °C [39], correlated with the α β quartz phase transformation [56]. Therefore, all the representative fractions exhibited a substantial mass loss in the temperature range above 600 °C, with a maximum mass loss up to 800 °C, consistent with quartz structures [55], and a small mass loss up to the limit of the apparatus at 1000 °C. In fact, all representative fractions exhibit a uniform mass loss (near 0.4%) for temperatures above 600 °C due to muscovite dehydroxylation [54,57,58], consistent with what was reported by Foldvari (2011) [39].
The ZP analysis shows consistent results with the state of the art based on the dependence on the variation in the pH of the colloidal solution fluid, as presented by several authors [20,21,43,59]. Moreover, the ZP analysis exhibited consistent trends with α quartz structures (Qz) predominant in the white representative fraction under study, with no isoelectric points (IEP) and more negative values with the increase in pH in the whole range from 3.0 to 11.0 [60,61]. Moreover, the values obtained in the study of the ZP showed negative values between −12 mV and −19 mV under increasingly acidic conditions (pH 5.0) and more negative values with the increase in pH (concentration of OH ) up to 11, as presented in Figure 7.
However, for muscovite–quartz structures (mica–silica systems) the ZP tends to be less negative, reaching values near or exceeding the zero charge point (ZPC) or the isoelectric point (IEP), as presented by Nishimura et al. (1992) [62]. That tendency was consistent with the results obtained for the green, gray, and red representative fractions under study at pH 3. It is important to highlight that the condition where the isoelectric point (IEP) was reached occurred under strongly acidic conditions, with pH values of 3.6 and 3.8 as the pH in which the point of zero charge (ZPC) is reached for the all representative fractions in this study. The determination of the IEP gained relevance as the point at which the zeta potential takes positive values, commonly associated with lower pH conditions, generating an electrical repulsion process with the mineral surface. Moreover, it could be related as a condition that does not allow the generation of bondings, associated with the cementation processes or cohesion in granular materials, as presented by Liu et al. [63], and with the the double layer’s expansion due to the adsorption of OH into the interface.
The ZP analysis for the sands under study showed a correlation with previous studies [64] and demonstrated negative values for the major constituent of sands. It exhibited correlation with the silicon dioxide SiO 2 (related to α quartz) [62] and oxides (MgO, Al 2 O 3 , K 2 O, and Fe 2 O 3 ) related to muscovite (Ms), clinochlore (Cls), and anorthite (An) structures [65,66,67]. It is important to highlight that the attraction of sand particles and the ZP value have an inverse relationship. Thus, a low ZP means stronger sand particle attraction, while a high ZP means the instability of sand particles and the increment in repulsion forces and does not allow sand particle aggregation.
All the representative fractions under analysis showed a similar behavior, given the similarity in the mineralogical composition, as presented in Figure 7. All samples showed a stable behavior in the pH transition between 5 and 7, with an increase in zeta potential (more negative values) with the increasing pH. Furthermore, it is important to highlight the variation at pH 9 and pH 11, where the green representative fraction presented more negative ZP values due to the greater presence of aluminum, as presented in Figure 4. Moreover, the valence (+3) resulted in a more negative ZP with the increase in pH, consistent with Erzin et al. [68]. Another factor that could affect the ZP is the presence of magnesium (valence of +2). However, all the fractions of the sands under study presented contents below 1%, as shown in Figure 4, and with variations of up to 0.5% between them. Therefore, it is determined that, due to the low magnesium content, it does not affect the ZP values obtained.
On the other hand, silicon dioxide (SiO 2 ) and aluminum oxide (Al 2 O 3 ) were common and predominant in all sand fractions. Therefore, the ZP (at basic or natural pH) was associated with the SiO 2 /Al 2 O 3 ratio, as presented in Figure 8. The Figure 8 shows a strong change in ZP ( Δ ζ ) at a pH between 3 and 5 (acid conditions) for all representative fractions, with a high analytical dispersion in the red fraction (see Figure 8) due to the possible degradation or repulsive forces of the predominant minerals. Furthermore, it is important to highlight the small change in ZP ( Δ ζ ) in variations between pH 5 and 7, as well as the similar trend between pH 9 and 11. The above indicate the relevance of monitoring the acidic conditions in the interstitial fluid due to the change in trend from repulsive to attractive forces between minerals, and therefore, between the particles. Moreover, the Δ ζ was associated with the SiO 2 /Al 2 O 3 , SiO 2 /Na 2 O, and SiO 2 /K 2 O ratio through a logarithmic model, with no correlation due to the high content of silica in the white representative fraction.

4. Conclusions

The characterization results from the XRF and EDS analyses allowed us to identify a predominance of silicon dioxide (SiO 2 ) and aluminum oxide (Al 2 O 3 ) in proportions of up to 68% and 30%, respectively, as a factor that induces negative zeta potential values near −50 mV, and which leads to increases in attractive forces between sand particles. Furthermore, XRD analysis allowed us to demonstrate a strong relationship between predominant mineral structures, such as α quartz, muscovite, and minor phases of hematite (Hem), anorthite (An), and clinochlore (Cls), consistent with the content of silicon dioxide (SiO 2 ), aluminum oxide (Al 2 O 3 ), and ferric oxide (Fe 2 O 3 ). Moreover, this allowed us to validate that the presence of the crystalline structures evidenced in the fractions under study induce strong thermal resistance at temperatures over 800 °C, related to a small mass loss near 1.0% over 800 °C, as well as to validate the quantitative estimation of chemical compounds from the XRF analysis.
The ZP analysis showed a dependence with the predominant mineralogical content and the variation in the pH of the colloidal solution fluid because the increase in OH ion concentrations increases the thickness of the diffuse double layer and the electrokinetic forces of attraction. The very fine sand particles under study, based on the Modified Udden–Wentworth grain-size scale, showed a predominance of elements with a high valence. Hence, the aluminum oxide (Al 2 O 3 ), related to a valence +3, induced more negative ZP values, in contrast to the red representative fraction, which exhibited lower values (up to 15 mV less) due to it having 9.0% less aluminum oxide content than the other fractions in basic solution fluids (pH 9 and 11). Moreover, the XRD patterns, as well as the XRF tests, allowed the identification of the presence of muscovite, hematite, anorthite, and clinochlore for the representative fractions under study. In this way, the lower presence of aluminum Al(III) and iron Fe(III) in the red representative fraction is considered to have induced an impact on higher (less negative) zeta potential values under basic pH conditions (9 and 11).
Ultimately, the ZP could be implemented to specify the repulsion force between nearby and similarly charged particles in a dispersion of colloids. As the value of the attractive force was calculated based on the measured ZP values, it can be directly interrelated to aging (bonding and apparent cohesion) through this parameter (ZP). Moreover, the attraction of the sand particles and the ZP value have an inverse relationship. Thus, particles showed very low ZP values, up to −48 mV for the green representative fraction, which means stronger sand particle attraction and increases in the diffuse double layer thickness. Based on the above, the increase in the number of particles with a predominance of high-valence chemical elements and the existence of conditions that raise groundwater pH values will increase attractive forces to generate enough cementation (apparent cohesion forces) due to the increase in the diffuse double layer and the increase in attractive forces between particles in contact. Furthermore, the ZP, as an indirect measure of the electric potential at the boundary of the diffuse double layer with a dependence on the conditions of electric charges in the mineral surface and the interstitial fluid, could be interpreted as a technique for the determination of the potential of electrical attraction. In this way, it could be associated with the development of cohesive forces (cementation) and, therefore, be used as a measure of the chemical aging potential in very fine sands.

Author Contributions

M.C.-B., M.O.-T. and O.R.-A. conceived and designed the research; M.C.-B. executed the methodology; M.C.-B. drafted the manuscript and prepared figures; M.C.-B., M.O.-T. and O.R.-A. discussed the results. All authors have read and agreed to the published version of the manuscript.

Funding

This research received no external funding.

Institutional Review Board Statement

Not applicable.

Informed Consent Statement

Not applicable.

Data Availability Statement

Not applicable.

Acknowledgments

The first author acknowledges the Faculty of Engineering from the Pontificia Universidad Javeriana for the financial support received through the Ph.D. scholarship program. The authors would like to give special thanks to Alejandro Perez Flórez from the Science Faculty of the Pontificia Universidad Javeriana for his help during the XRF and XRD analyses.

Conflicts of Interest

The authors declare no conflict of interest.

Sample Availability

Samples of the compounds are available from the authors.

Abbreviations

The following abbreviations are used in this manuscript:
ZPZeta potential
TGAThermogravimetric analysis
XRFX-ray fluorescence
XRDX-ray diffraction
EDSEnergy dispersive spectrometry

References

  1. Wang, Y.H.; Xu, D.; Tsui, K.Y. Discrete Element Modeling of Contact Creep and Aging in Sand. J. Geotech. Geoenviron. Eng. 2008, 134, 1407–1411. [Google Scholar] [CrossRef]
  2. Bowman, E.T.; Soga, K. Creep, ageing and microstructural change in dense granular materials. Soils Found. 2003, 43, 107–117. [Google Scholar] [CrossRef]
  3. Baxter, C.D.P.; Mitchell, J.K. Experimental Study on the Aging of Sands. J. Geotech. Geoenviron. Eng. 2004, 130, 1051–1062. [Google Scholar] [CrossRef]
  4. Joshi, C.; Achari, G.; Shenbaga, I.; Wijeweera, H. Effect of aging on the penetration resistance of sands. Can. Geotech. J. 1995, 782, 767–782. [Google Scholar] [CrossRef]
  5. Ltifi, M.; Abichou, T.; Tisot, J.P. Effects of Soil Aging on Mechanical and Hydraulic Properties of a Silty Soil. Geotech. Geol. Eng. 2014, 32, 1101–1108. [Google Scholar] [CrossRef]
  6. Nasiri, M.; Hajiazizi, M.; Jongpradist, P.; Mazaheri, A.R. Impact of natural environment on sand aging under static and dynamic conditions. Granul. Matter 2022, 24, 47. [Google Scholar] [CrossRef]
  7. Omunguye, I.W.; Howie, J.A.; Styler, M.A. Effects of Ageing on the Shear Modulus Degradation Curve of Loose Fraser River Sand. Geotech. Earthq. Eng. Soil Dyn. V GSP 293 2018, 70, 228–237. [Google Scholar] [CrossRef]
  8. Suarez, N.; Brandon, T.; Mitchell, J. Aging of Sands as a Micromechanical Process. In Proceedings of the Geo-Congress 2014: Geo-characterization and Modeling for Sustainability, Atlanta, GA, USA, 23–26 February 2014; Geotechnical Special Publication: Los Angeles, CA, USA, 2014; pp. 634–643. [Google Scholar] [CrossRef]
  9. Howie, J.A.; Shozen, T.; Vaid, Y.P. Effect of ageing on stiffness of very loose sand. Can. Geotech. J. 2002, 39, 149–156. [Google Scholar] [CrossRef]
  10. Mitchell, J.K. Aging of Sand—A Continuing Enigma? In Proceedings of the 6th International Conference on Case Histories in Geotechnical Engineering, Chicago, IL, USA, 11–16 August 2008; pp. 1–21. [Google Scholar]
  11. Kokusho, T.; Nagao, Y.; Ito, F.; Fukuyama, T. Aging effect on Sand Liquefaction Observed During The 2011 Earthquake and Basic Laboratory Studies. In Proceedings of the International Symposium on Engineering Lessons Learned from the 2011 Great East Japan Earthquake, Tokyo, Japan, 1–4 March 2012. [Google Scholar]
  12. Mesri, G.; Feng, T.W.; Benak, J.M. Postdensification penetration resistance of clean sands. J. Geotech. Eng. 1990, 116, 1095–1115. [Google Scholar] [CrossRef]
  13. Schmertmann, J.H.; Osterberg, J.O. An experimental study of the development of cohesion and friction with axial strain in saturated cohesive soils. In Proceedings of the Research Conference on Shear Strength of Cohesive Soils, Boulder, CO, USA, 13–16 June 1960; pp. 643–694. [Google Scholar]
  14. Toyota, H.; Takada, S. Mechanical properties of cementitious sand and sand with small cyclic shear strain to assess aging effects on liquefaction. Acta Geotech. 2022, 17, 2825–2840. [Google Scholar] [CrossRef]
  15. Nakarai, K.; Yoshida, T. Effect of carbonation on strength development of cement-treated Toyoura silica sand. Soils Found. 2015, 55, 857–865. [Google Scholar] [CrossRef]
  16. Bwambale, B.; Andrus, R.D. State of the art in the assessment of aging effects on soil liquefaction. Soil Dyn. Earthq. Eng. 2019, 125, 105658. [Google Scholar] [CrossRef]
  17. Mitchell, J.K.; Solymar, Z.V. Closure to “Time-Dependent Strength Gain in Freshly Deposited or Densified Sand”. J. Geotech. Eng. 1987, 113, 176. [Google Scholar] [CrossRef]
  18. Mitchell, J.K.; Solymar, Z.V. Time Dependent Strength Gain in Freshly Deposited or Densified Sand. J. Geotech. Eng. 1984, 110, 1559–1576. [Google Scholar] [CrossRef]
  19. Hajnos, M.; Cieśla, J. Electrokinetic (Zeta) Potential of Soils. In Encyclopedia of Earth Sciences Series; Springer: Dordrecht, The Netherlands, 2011; Volume Part 4, pp. 941–942. [Google Scholar] [CrossRef]
  20. Kamble, S.; Agrawal, S.; Cherumukkil, S.; Sharma, V.; Jasra, R.V.; Munshi, P. Revisiting Zeta Potential, the Key Feature of Interfacial Phenomena, with Applications and Recent Advancements. ChemistrySelect 2022, 7, e202103084. [Google Scholar] [CrossRef]
  21. Li, S.; Collini, H.; Jackson, M.D. Anomalous Zeta Potential Trends in Natural Sandstones. Geophys. Res. Lett. 2018, 45, 11068–11073. [Google Scholar] [CrossRef]
  22. John, K.N.; Arnepalli, D.N. Factors influencing zeta potential of clayey soils. In Geotechnical Characterisation and Geoenvironmental Engineering; Lecture Notes in Civil Engineering; Springer: Berlin/Heidelberg, Germany, 2019; Volume 16, pp. 171–178. [Google Scholar] [CrossRef]
  23. Alarouj, M.; Collini, H.; Jackson, M.D. Positive Zeta Potential in Sandstones Saturated With Natural Saline Brine. Geophys. Res. Lett. 2021, 48, e2021GL094306. [Google Scholar] [CrossRef]
  24. Mahrouqi, D.A.; Vinogradov, J.; Jackson, M.D. Zeta potential of artificial and natural calcite in aqueous solution. Adv. Colloid Interface Sci. 2017, 240, 60–76. [Google Scholar] [CrossRef] [PubMed]
  25. Delgado, A.V.; González-Caballero, F.; Hunter, R.J.; Koopal, L.K.; Lyklema, J. Measurement and interpretation of electrokinetic phenomena: (IUPAC technical report). Pure Appl. Chem. 2005, 77, 1753–1805. [Google Scholar] [CrossRef]
  26. Erzuah, S.; Aggrey, W.N.; Tetteh, J.T.; Bodi, V.; Adenutsi, C.D.; Sokama-Neuyam, Y.A.; Sarkodie, K.; Ampomah, W.; Ohemeng-Boahen, G.; Nyarko, K.B. Zeta potential prediction of dominant sandstone minerals via surface complexation modelling. Sci. Afr. 2023, 20, 01721. [Google Scholar] [CrossRef]
  27. Harris, J.C. Electrical Forces Affecting Soil and Substrate in the Detergency Process—Zeta Potential. Text. Res. J. 1958, 28, 912–928. [Google Scholar] [CrossRef]
  28. Marchuk, A.; Rengasamy, P.; McNeill, A.; Kumar, A. Nature of the clay-cation bond affects soil structure as verified by X-ray computed tomography. Soil Res. 2012, 50, 638–644. [Google Scholar] [CrossRef]
  29. Vinogradov, J.; Jackson, M.D. Zeta potential in intact natural sandstones at elevated temperatures. Geophys. Res. Lett. 2015, 42, 6287–6294. [Google Scholar] [CrossRef]
  30. Gómora-Herrera, D.; Bolaños, J.N.; Lijanova, I.V.; Olivares-Xometl, O.; Likhanova, N.V. Study of Surface Wettability Change of Unconsolidated Sand Using Diffuse Reflectance Infrared Fourier Transform Spectroscopy and Thermogravimetric Analysis. Appl. Spectrosc. 2018, 72, 562–572. [Google Scholar] [CrossRef] [PubMed]
  31. Castilla-Barbosa, M.; Ocampo-Terreros, M.; Rincon-Arango, O. A preliminary approach to interlocking phenomena for Colombian fluvio-lacustrine granular materials. In Proceedings of the 2022 Congreso Internacional de Innovacion y Tendencias en Ingenieria, CONIITI 2022—Conference Proceedings, Bogota, Colombia, 5–7 October 2022; Institute of Electrical and Electronics Engineers Inc.: Piscataway, NJ, USA, 2022. [Google Scholar] [CrossRef]
  32. Girão, A.V.; Caputo, G.; Ferro, M.C. Application of Scanning Electron Microscopy–Energy Dispersive X-Ray Spectroscopy (SEM-EDS). Compr. Anal. Chem. 2017, 75, 153–168. [Google Scholar] [CrossRef]
  33. Potts, P.J. X-ray fluorescence analysis: Principles and practice of wavelength dispersive spectrometry. In A Handbook of Silicate Rock Analysis; Springer: Dordrecht, The Netherlands, 1987; pp. 226–285. [Google Scholar] [CrossRef]
  34. Potts, P.J.; Webb, P.C. X-ray fluorescence spectrometry. J. Geochem. Explor. 1992, 44, 251–296. [Google Scholar] [CrossRef]
  35. Oyedotun, T.D.T. X-ray fluorescence (XRF) in the investigation of the composition of earth materials: A review and an overview. Geol. Ecol. Landsc. 2018, 2, 148–154. [Google Scholar] [CrossRef]
  36. Ali, A.; Chiang, Y.W.; Santos, R.M. X-Ray Diffraction Techniques for Mineral Characterization: A Review for Engineers of the Fundamentals, Applications, and Research Directions. Minerals 2022, 12, 205. [Google Scholar] [CrossRef]
  37. Raja, P.B.; Munusamy, K.R.; Perumal, V.; Ibrahim, M.N.M. Characterization of nanomaterial used in nanobioremediation. In Nano-Bioremediation: Fundamentals and Applications; Elsevier: Amsterdam, The Netherlands, 2022; pp. 57–83. [Google Scholar] [CrossRef]
  38. Harris, W.; White, G.N. X-ray Diffraction Techniques for Soil Mineral Identification. In Methods of Soil Analysis Part 5—Mineralogical Methods; SSSA Book Series; Soil Science Society of America, Inc.: Madison, WI, USA, 2008. [Google Scholar] [CrossRef]
  39. Földvári, M. Handbook of the Thermogravimetric System of Minerals and Its Use in Geological Practice; Geological Institute of Hungary: Budapest, Hungary, 2011; Volume 213, pp. 1–400. [Google Scholar]
  40. Limited, M.I. Zeta Potential—An Introduction in 30 Minutes; Technical report; Malvern Instruments Limited: Malvern, UK, 2015. [Google Scholar]
  41. Fairhur, D. An Overview of the Zeta Potential—Part 2: Measurement; Technical report; American Pharmaceutical Review: Fishers, IN, USA, 2013. [Google Scholar]
  42. Matsumoto, S.; Ogata, S.; Shimada, H.; Sasaoka, T.; Hamanaka, A.; Kusuma, G.J. Effects of ph-induced changes in soil physical characteristics on the development of soil water erosion. Geosciences 2018, 8, 134. [Google Scholar] [CrossRef]
  43. Sze, A.; Erickson, D.; Ren, L.; Li, D. Zeta-potential measurement using the Smoluchowski equation and the slope of the current-time relationship in electroosmotic flow. J. Colloid Interface Sci. 2003, 261, 402–410. [Google Scholar] [CrossRef]
  44. Markgrafa, W. Quantifying microstructural stability of South-Brazilian soils by the application of rheological techniques and zeta potential measurements. In Proceedings of the 19th World Congress of Soil Science: Soil Solutions for a Changing World, Brisbane, Australia, 1–6 August 2010; pp. 1–6. [Google Scholar]
  45. Abbate, G.; Bernini, U.; Ragozzino, E.; Somma, F. The temperature dependence of the refractive index of water. J. Phys. D Appl. Phys. 1978, 11, 1167–1172. [Google Scholar] [CrossRef]
  46. Moldoveanu, S.C.; David, V. Chapter 7—Mobile Phases and Their Properties. In Essentials in Modern HPLC Separations; Moldoveanu, S.C., David, V., Eds.; Elsevier: Amsterdam, The Netherlands, 2013; pp. 363–447. [Google Scholar] [CrossRef]
  47. Ishida, T.; Ando, H.; Fukuhara, M. Estimation of complex refractive index of soil particles and its dependence on soil chemical properties. Remote Sens. Environ. 1991, 38, 173–182. [Google Scholar] [CrossRef]
  48. Tan, K.H. Degradation of Soil Minerals by Organic Acids. In Interactions of Soil Minerals with Natural Organics and Microbes; SSSA Special Publications: Madison, WI, USA, 2015; Volume 17, pp. 1–27. [Google Scholar] [CrossRef]
  49. Lee, S.O.; Tran, T.; Jung, B.H.; Kim, S.J.; Kim, M.J. Dissolution of iron oxide using oxalic acid. Hydrometallurgy 2007, 87, 91–99. [Google Scholar] [CrossRef]
  50. Majima, H.; Awakura, Y.; Mishima, T. The Leaching of Hematite in Acid Solutions. Metall. Trans. B 1985, 16, 23–30. [Google Scholar] [CrossRef]
  51. Taxiarchou, M.; Panias, D.; Douni, I.; Paspaliaris, I.; Kontopoulos, A. Dissolution of hematite in acidic oxalate solutions. Hydrometallurgy 1997, 44, 287–299. [Google Scholar] [CrossRef]
  52. Xu, S.; Habib, A.H.; Gee, S.H.; Hong, Y.K.; McHenry, M.E. Spin orientation, structure, morphology, and magnetic properties of hematite nanoparticles. J. Appl. Phys. 2015, 117, 17. [Google Scholar] [CrossRef]
  53. Zainuri, M. Hematite from Natural Iron Stones as Microwave Absorbing Material on X-Band Frequency Ranges. In IOP Conference Series: Materials Science and Engineering; Institute of Physics Publishing: Bristol, UK, 2017; Volume 196. [Google Scholar] [CrossRef]
  54. Csáki, S.; Trnovcová, V.; Štubňa, I.; Ondruška, J.; Sunitrová, I.; Vozár, L.; Dobroň, P. AC conductivity of an illitic clay with zeolite addition after firing at different temperatures. In AIP Conference Proceedings; American Institute of Physics Inc.: College Park, MD, USA, 2017; Volume 1866. [Google Scholar] [CrossRef]
  55. Meradi, H.; Atoui, L.; Bahloul, L.; Boubendira, K.; Bouazdia, A.; Ismail, F. Characterization by Thermal Analysis of Natural Kieselguhr and Sand for Industrial Application. Energy Procedia 2015, 74, 1282–1288. [Google Scholar] [CrossRef]
  56. Aloulou, H.; Bouhamed, H.; Amar, R.B.; Khemakhem, S. New ceramic microfiltration membrane from tunisian natural sand: Application for tangential wastewater treatment. Desalin. Water Treat. 2017, 78, 41–48. [Google Scholar] [CrossRef]
  57. Gridi-Bennadji, F.; Beneu, B.; Laval, J.P.; Blanchart, P. Structural transformations of Muscovite at high temperature by X-ray and neutron diffraction. Appl. Clay Sci. 2008, 38, 259–267. [Google Scholar] [CrossRef]
  58. Guggenheim, S.; Chang, Y.H.; Groos, A.K.V. Muscovite Dehydroxylation: High-Temperature Studies. Am. Mineral. 1987, 72, 537–550. [Google Scholar]
  59. Vinogradov, J.; Jackson, M.D.; Chamerois, M. Zeta potential in sandpacks: Effect of temperature, electrolyte pH, ionic strength and divalent cations. Colloids Surf. A Physicochem. Eng. Asp. 2018, 553, 259–271. [Google Scholar] [CrossRef]
  60. Leroy, P.; Maineult, A.; Li, S.; Vinogradov, J. The zeta potential of quartz. Surface complexation modelling to elucidate high salinity measurements. Colloids Surf. A Physicochem. Eng. Asp. 2022, 650, 129507. [Google Scholar] [CrossRef]
  61. Zhou, F.; Liu, Q.; Liu, X.; Li, W.; Feng, J.; Chi, R.A. Surface Electrical Behaviors of Apatite, Dolomite, Quartz, and Phosphate Ore. Front. Mater. 2020, 7, 35. [Google Scholar] [CrossRef]
  62. Nishimura, S.; Tateyama, H.; Tsunematsu, K.; Jinnai, K. Zeta Potential Measurement of Muscovite Mica Basal Plane-Aqueous Solution Interface by Means of Plane Interface Technique. J. Colloid Interface Sci. 1992, 152, 359–367. [Google Scholar] [CrossRef]
  63. Liu, G.; Jiang, F.; Ge, L.; Zhang, Q.; Chen, X.; Fan, Z.; Wang, J. Investigation of salinity and ion effects on low salinity water flooding efficiency in a tight sandstone reservoir. Energy Rep. 2023, 9, 2732–2744. [Google Scholar] [CrossRef]
  64. Tabar, M.A.; Bagherzadeh, H.; Shahrabadi, A.; Dahim, S. A comprehensive research in chemical consolidator/stabilizer agents on sand production control. J. Pet. Explor. Prod. Technol. 2021, 11, 4305–4324. [Google Scholar] [CrossRef]
  65. Sides, P.J.; Faruqui, D.; Gellman, A.J. Dynamics of charging of muscovite mica: Measurement and modeling. Langmuir 2009, 25, 1475–1481. [Google Scholar] [CrossRef]
  66. Tang, J.; Zhang, Y.; Bao, S. The effect of Ca2+ and Mg2+ on the dispersion and flocculation behaviors of muscovite particles. Minerals 2016, 6, 93. [Google Scholar] [CrossRef]
  67. Filippov, L.O.; Duverger, A.; Filippova, I.V.; Kasaini, H.; Thiry, J. Selective flotation of silicates and Ca-bearing minerals: The role of non-ionic reagent on cationic flotation. Miner. Eng. 2012, 36–38, 314–323. [Google Scholar] [CrossRef]
  68. Erzin, Y.; Yukselen, Y. The use of neural networks for the prediction of zeta potential of kaolinite. Math. Geosci. 2009, 41, 779–797. [Google Scholar] [CrossRef]
Figure 1. Representative photography of Colombian Andes sands under study.
Chemengineering 07 00091 g001
Figure 2. Elemental mapping from the SEM-EDS analysis for a representative fraction under study.
Chemengineering 07 00091 g002
Figure 3. Comparison between EDS and XRF analyses for the representative red fraction.
Chemengineering 07 00091 g003
Figure 4. XRF analysis for representative fractions of sands under study.
Chemengineering 07 00091 g004
Figure 5. X-ray diffractograms for representative fractions of sands under analysis.
Chemengineering 07 00091 g005
Figure 6. Mass loss in TGA for Colombian Andes sands under study.
Chemengineering 07 00091 g006
Figure 7. Zeta potential analysis for representative fractions under variations in pH for Colombian Andes sands under study.
Chemengineering 07 00091 g007
Figure 8. Zeta potential change ( Δ ζ ) with pH change ( Δ pH).
Chemengineering 07 00091 g008
Disclaimer/Publisher’s Note: The statements, opinions and data contained in all publications are solely those of the individual author(s) and contributor(s) and not of MDPI and/or the editor(s). MDPI and/or the editor(s) disclaim responsibility for any injury to people or property resulting from any ideas, methods, instructions or products referred to in the content.

