Abstract
This study investigates the influence of photoperiod and wastewater concentration on the growth of microalgae and cyanobacteria for the removal of environmentally significant parameters (COD, BOD, Cr, Fe, color, chlorides, nitrogen compounds, and phosphates) from dyeing wastewater. A two-factor central composite design with surface response was employed, involving two algae species (Chlorella and Scenedesmus sp.) and two cyanobacteria species (Hapalosiphon and Oscillatoria sp.). The findings indicated that extended photoperiods (>13 h) and higher wastewater concentrations (70–80% v/v) enhanced biomass production across all strains. However, Hapalosiphon and Chlorella sp. (1.6 and 0.45 g/L) exhibited better tolerance to the wastewater’s high toxicity, resulting in higher biomass concentrations and improved COD and BOD removal by Hapalosiphon sp. (75% and 80%, respectively). Further analysis of the obtained biomass revealed their potential applications. Among the cyanobacteria, Hapalosiphon sp. synthesized the highest concentrations of total proteins and lipids (38% and 28% w/w, respectively), while Oscillatoria sp. displayed a high protein content (42% w/w). In contrast, the algae demonstrated a strong propensity for storing substantial quantities of total carbohydrates (65% and 57% w/w for Scenedesmus and Chlorella sp., respectively). These results signify the feasibility of cultivating photosynthetic microorganisms in industrial dyeing wastewater as a sustainable source of nutrients for targeted metabolite production.
1. Introduction
Dyeing wastewater is an effluent produced during the dyeing, dismantling, washing, and cleaning of garments in the textile industry. This industry uses large amounts of water and a wide range of dyes and synthetic chemicals at various stages of the production process [1]. This wastewater can contain multiple chemical substances, depending on the products used. They are characterized by high levels of pollutants and the presence of substances such as solvents, detergents, dyes, plasticizers, binders, volatile organic compounds, surfactants, chlorobenzenes, phenols, pentachlorophenols, bleaching agents, and heavy metals [2,3] which may pose risks to both human well-being and the natural environment. It has been reported that the chemical compounds in dyeing effluents can be toxic to aquatic life, negatively affecting marine ecosystems and reducing biodiversity. The effect on human well-being is substantial, resulting in liver and kidney impairment, skin inflammation, persistent bronchitis, nasal discomfort, the potential for cancer, and DNA harm. [4,5]. To minimize the impact of dyeing wastewater, it is essential to implement sound management practices, such as installing treatment systems. These systems can help eliminate or reduce wastewater pollutants before discharge, protecting the environment and public health [6]. Various treatment processes have been developed to treat this wastewater, including physical, chemical, and biological treatment processes to treat it economically and efficiently [7]. The main physical treatment processes include filtration, flocculation, and adsorption [8].
Methods based on filtration and flocculation are useful for effluents containing dispersed dyes. However, they are not very practical for wastewater containing reactive and vat dyes, and the solids generated during treatment are considerable [9,10]. Methods like reverse osmosis (RO), nanofiltration (NF), and ultrafiltration (UF) have been employed for the treatment of textile effluents, yielding favorable outcomes in the reduction in parameters such as biological oxygen demand (BOD), chemical oxygen demand (COD), and color [11]. However, these processes have the disadvantage of high investment and operating costs, the generation of other wastes, and the technological development necessary for their operation and maintenance, which are challenging to implement in less developed countries [12]. Adsorption processes have attracted much attention due to their efficiency in improving the decolorization of wastewater. The adsorbents’ high affinity and recombination ability are their most important properties. Some, such as activated carbon, have proven effective for dyes like Acid Blue 25 (AB25) [13], but the difficulty of their regeneration and their price limit their application [14].
Among chemical methods, oxidation processes are the most employed techniques for breaking down dyes. Under environmental conditions, these processes can either partially or entirely degrade the original toxicants and their chemical by-products, such as dyes, pesticides, etc. Oxidation processes such as UV/H2O2 have been shown to produce complete decolorization after 20 min and a 63% removal of total organic carbon in 90 min [15]; similarly, combinations of TiO2/UV/H2O2 have achieved decolorizations of up to 64% with illumination times of 100 min [16]. Other technologies, such as cavitation, can reduce color content and improve the biodegradation index (BI) (BOD5/COD ratio) [8]. According to Mishra et al. [17], high removal rates of rhodamine can be achieved by coupling cavitation with chemical reagents (H2O2, CCl4, and Fenton reagent). The disadvantage of using these methods is the generation of some by-products that cannot be recycled as waste or solids, and finally, the development of technologies that sometimes limit their application.
On the other hand, biological processes usually use microorganisms that can thrive under harsh conditions. The efficiency of elimination depends on the ratio between organic load and dye, as well as on the concentration of microorganisms, temperature, oxygen concentration in the system, and photoperiod [18]. The advantages of biological processes include environmental compatibility, competitive cost, non-hazardous metabolites, and reduced water consumption [19]. In recent times, microalgae and cyanobacteria have emerged as sustainable remedies for eliminating harmful substances present in various wastewater types, such as agricultural runoff [20], domestic wastewater [21], agroindustrial wastewaters [22,23,24,25], and landfill leachate [26]. It was reported that Cosmarium species could attenuate malachite green dye at temperatures of 5–45 °C and pH 9, demonstrating its ability to treat wastewater containing this pollutant [27].
Microalgae can remove total organic carbons, total nitrogen, and various dyes. Dhaouefi et al. [28] demonstrated a reduction of 80% of orange 3 disperse dye and 75% of blue 1 disperse dye using an anoxic/aerobic photobioreactor at a contact time of 10 days [28]. There is limited work on the cultivation of microalgae and cyanobacteria in real dyeing effluents, most being from synthetic effluents with a single dye; however, there are some reports on the use of Chlorella sp. and Oscillatoria sp. strains for the treatment of dyeing effluents. Nagaraj et al. [29] reported on the culture of S. pevalakii in textile wastewater at a concentration of 60% (v/v) and found that the highest percentage of metabolites was found in carbohydrates (50.1% w/w), followed by lipids (17.82% w/w), pigments (16.8% w/w), and proteins (13.2% w/w). On the other hand, it was found for cyanobacteria that the process of dye degradation involves several mechanisms that allow the decomposition and elimination of various dyes of natural and synthetic origin. One of these processes is extracellular degradation, in which the dye molecules are degraded to smaller and less polluting compounds with the help of extracellular enzymes produced by cyanobacteria [30]. It is clear that both microalgae and cyanobacteria play an important role in different aquatic ecosystems and can degrade various types of pollutants; however, effluent discharges with dyes can inhibit their growth. Hence, although they can grow under these conditions, it is possible that some dyes and compounds present in these effluents, given their low biodegradability, may remain in the water body or, as a result of degradation, intermediate compounds are generated that can affect aquatic life [31]. This aspect supports the need for studies to evaluate the effect of factors such as wastewater concentration on the growth and production of metabolites in microalgae and cyanobacteria in order to determine their effectiveness in biotreating dye wastewater.
Currently, there are no reports on the effects of photoperiod and effluent concentration using a response surface methodology on biomass production and recovery of metabolites of interest in real dying wastewater; therefore, this work aims to contribute to the knowledge of possible process optimization measures for variables such as photoperiod and biomass production in nutrient reduction using microalgae and cyanobacteria in recalcitrant effluents such as dying effluents.
2. Materials and Methods
2.1. Physicochemical Characterization of Dyeing Wastewater
The water sample was obtained from a textile and dyeing company in Cúcuta (Norte de Santander, Colombia). Sampling was performed during the operating day, and a composite sample was obtained. The sample was stored in 5 L amber bottles kept refrigerated at 4 °C and taken to the laboratory at Universidad Francisco de Paula Santander (Cúcuta, Colombia). The physicochemical characterization was done according to Standard Methods 23rd Edition [32]. The parameters analyzed are shown in Table 1.

Table 1.
Physicochemical characterization of dyeing effluents.
2.2. Microorganisms
Two algae (Scenedesmus and Chlorella sp.) and two cyanobacteria (Hapalosiphon and Oscillatoria sp.) were obtained from the INNOValgae collection (Universidad Francisco de Paula Santander, Cúcuta, Colombia). Both algae were grown in liquid bold basal medium, while the cyanobacteria were grown in liquid BG-11 medium. Every strain was grown in 1 L GL-45 flask with 600 mL of culture media under a 12–12 h photoperiod, 110 µmol m−2s−1, mixed with filtered air enriched with 1% (v/v) of CO2 at a flow of 0.6 vvm and 25 ± 2 °C [33].
2.3. Experimental Design
A central composite design (CCD) with two levels (Table 2) was created on Design Expert software (StatEase, Minneapolis, MN, USA, EEUU). The variables evaluated were wastewater concentration and photoperiod; the response variable was biomass. The experimental design resulted in 14 experiments conducted in triplicate. The dye water was sedimented for 30 min in a high-rate pilot settler in the UFPS unit operations laboratory and then used for cultivation with the different strains. A 500 mL GL-45 flask with 300 mL working volume (40 mL of algae plus 260 mL of wastewater) was used for each experiment. Each flask was grown for 20 days at 200 µmol m−2s−1, 25 ± 2 °C and mixed with filtered air enriched with 1% (v/v) CO2 (Figure 1).
Table 2.
Experimental design for microalgae and cyanobacteria.
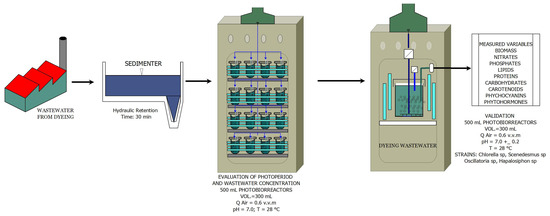
Figure 1.
Diagram of the experimental process.
2.4. Biomass Concentration and Nutrient Removal
Before inoculation, the wastewater was autoclaved and adjusted to pH 7.0. For each experiment, a 500 mL GL-45 flask with 250 mL of working volume was used (25 mL of algae plus 225 mL of wastewater). Each flask was grown for 20 days under 200 µmol m−2s−1, 25 ± 2 °C and mixed using filtered air enriched with 1% (v/v) of CO2 [33]. The wastewater concentrations and the light/dark cycles were adjusted according to the experimental design.
The ash-free biomass was determined according to Moheimani and Borowitzka [34].
After 20 days, the biomass produced was recovered through filtration in a 45 mm GFC fiber filter (5 mL per filter); each flask was filtered 6 times. The filters were dried on a silica bed (60 °C, 24 h). After drying, the filters were kept in the desiccator until they reached a constant weight (±2 h), and then weighed [35]. After reaching constant weight, the filters were incinerated in a muffle furnace (450 °C, 5 h). Nitrates, phosphates, and COD measurements were completed according to the standard methods for examining water and wastewater [32]. For PO4, the vanadomolybdophosphoric acid colorimetric method was used (SM-4500-P C). For nitrates, the spectrophotometric UV-VIS detection method was used (SM-4500-NO3-B). For COD, the closed reflux colorimetric method was used (SM-5220 D). The samples analyzed were taken in triplicate.
Total organic carbon (TOC) was determined using a TOC analyzer (Thermo Fisher Scientific, Waltham, MA, USA). The operating conditions were a sample volume of 0.5 mL, water chase volume of 1.0 mL, injection line rinse on, injection line rinse volume of 0.5 mL, acid volume of 0.5 mL, ICS parge flow 200 mL min−1, carrier gas delay time 0.40 min, ICS parge time 50 min, detector sweep flow 500 mL min−1, furnace sweep time 1.0 min, and system flow 200 mL min−1.
2.5. Carbohydrate Extraction and Quantification
A Falcon tube containing 0.5 mL of 1 M H2SO4 and a filter with known biomass was used for the experiment. The mixture was homogenized in a vortex for 2 min, and then 5 mL of 1 M H2SO4 was added to it. The mixture was incubated in a water bath at 100 °C for 1 h. After that, the sample was centrifuged at 4000 rpm for 10 min at five °C. In a glass tube, 2 mL of the supernatant was collected, and 1 mL of 5% phenol was added. The sample was shaken with a vortex at medium speed for 1 min and allowed to settle at room temperature for 30 min before scanning at 485 nm [34]. A calibration curve ranging from 0 to 1.5 mg L1 was constructed to determine the concentration, and Equation (1) was used to calculate total carbohydrates.
Total carbohydrates (mg × mL−1) = (0.0116 × OD485) + 0.0712
2.6. Total Lipids Extraction and Quantification
To determine the total lipid content of a sample, a filter with a known amount of biomass was heated at 100 °C for 10 min in a mixture of 100 mL ultrapure water and 2 mL concentrated H2SO4. Then, freshly prepared sulfo-phospho-vanillin (SPV) was added to the mixture and incubated at 37 °C and 200 rpm for 15 min. Finally, the mixture was read at a wavelength of 530 nm [35]. The entire process was repeated three times and a calibration curve ranging from 0 to 1.5 mg L1 was generated. Equation (2) was used to calculate the total lipid content of the sample.
Total lipids (µg) = (OD530 − 0.0236)/0.0106
2.7. Protein Extraction and Quantification
Total protein content was measured according to Slocombe et al. [36]. Three milliliters of 24% trichloroacetic acid (TCA) wase added to a Falcon tube containing a filter with known biomass. The mixture was heated at 95 °C for 15 min in a water bath. After adding 9 mL of ultrapure water, the mixture was centrifuged (5000 rpm, 20 min, 4 °C). The pellet was then reconstituted in 0.5 mL of Lowry-D reagent and heated in a water bath (55 °C, 60 min). Samples were centrifuged twice at (4500 rpm, 15 min). A total of 175 µL of the supernatant was mixed with 3325 µL of Lowry D and incubated at room temperature for 10 min. Finally, 350 µL of Folin–Ciocalteu reagent was added and the sample stood at room temperature for 30 min. Samples were read at 600 nm. Protein quantification was performed according to Equation (3), and a calibration curve ranging from 0 to 5000 µg L−1 was constructed.
Total protein (mg L−1) = (2038.5 × OD600) + 59.706
2.8. Total Carotenoids Extraction and Quantification
Falcon tubes containing filters with a fixed amount of biomass were utilized. To each sample, 1 cm3 of 0.5 mm glass beads and 5 mL of ketone vehicle were added. The samples were then homogenized for 3 min in a vortex at 100 rpm and centrifuged at 4500 rpm for 10 min at 4 °C. The resultant supernatant was collected, and its absorbance was measured at a wavelength of 450 nm [37]. By using Equation (4), the total concentration of carotenoids was calculated.
Total carotenoids (mg/mL) = (OD450 × sample volume × 10)/2500
2.9. Phycobiliproteins Extraction and Quantification
To determine the phycocyanin concentration, filters containing known cyanobacterial biomass were placed in Falcon tubes and suspended in 10 mL of a 0.15 M phosphate-buffered solution with a pH of 7.0. Then, 2 g of glass beads were added, and the samples were allowed to rest for 1 min before being shaken three times for 2 min each at maximum speed. The samples were then stored at 4 °C for 24 h, followed by centrifugation at 3400 rpm for 15 min. Finally, the absorbance was measured at 620, 652, and 562 nm, and Equations (5)–(7) were used to calculate the phycocyanin concentration as explained in [38].
C-PC (g L−1) = {[OD620 − (0.474 × OD652)]}/5.34
A-PC (g L−1) = {[OD652 − (0.208 × OD620)]}/5.09
PE (g L−1) = {[OD562 − (2.41 × C-PC) − (0.849 × APC)]}/9.62
3. Results and Discussions
3.1. Physicochemical Characterization of Dyeing Wastewater
Dyeing wastewater characterization is essential for ensuring compliance with environmental regulations and protecting public health. In recent years, several studies have been conducted to analyze the composition of dyeing wastewater and develop effective treatment methods [36,37,38]. Table 3 shows the physicochemical characterization of the dyeing effluents.
Table 3.
Results of physicochemical characterization of wastewater.
The physicochemical characterization of the dyeing effluents shows low biodegradability (0.29 BOD/DQO), a phenomenon similar to other reported studies [36,39,42]; similarly, the concentrations of nitrogen compounds (nitrates, nitrites, and ammonia nitrogen) were similar to the average ranges reported in other studies (Table 3). Phosphate concentrations are within the range of other studies, where average phosphate concentrations of 10–45.5 mg × L−1 were reported. Dyeing effluents can vary in their composition and concentration of contaminants, depending on the processes and chemicals used during the dyeing process [39,43]. However, several studies have pointed to common physicochemical characteristics of these effluents: in terms of pH, depending on the use of different salts, bases, and acids, the pH can vary between acidic values (<5) and alkaline values (>9) [36,44]; the COD concentration can range from 750 to 13,000 ppm, and most authors cite BOD/CBD ratios of 0.15–0.4. These results are like those found in this work, indicating a higher concentration of recalcitrant compounds that are not readily biodegradable by microorganisms; therefore, the search for microorganisms that can degrade this type of wastewater is a biotechnological potential not only for the treatment of these wastewaters, but also for their use. The concentration of nitrogen compounds is related to the use of dyes and nitrogen-containing chemicals in textile dyeing processes; nitrate concentrations have been reported to be in the range of 35 to 80 ppm, and ammonium nitrogen concentrations are usually between 25 and 65 ppm [45]. As for the concentration of phosphates, they are typically present in dyeing wastewater at relatively low concentrations, generally ranging from 0.5 to 20 mg × L−1. The phosphates present in dyeing effluents are due to the use of chemicals such as phosphate-based dyes, dyeing auxiliaries, detergents, and other additives used during the process that contain these compounds.
3.2. Biomass Production and Nutrient Removal
The growth of both algae and cyanobacteria in textile wastewater can be influenced by several factors that can favor or inhibit growth; much of this process depends on the physicochemical properties of the wastewater, especially the availability of nutrients such as NO3− and PO4−3, which are necessary for their growth [46]. The presence of dyes in these effluents can reduce the ability of algal strains to grow; compounds such as aromatic amine, benzidine, and its derivatives can affect the growth rate, just as the concentration of the dye affects the availability of light for microalgal species [47,48].
Cyanobacteria have been shown to grow at a higher rate than microalgae; these organisms’ ability to fix nitrogen may enable their development, as physicochemical characterization results showed low nitrate availability, explaining the low biomass concentration of microalgae. There is limited work on bioremediation of actual dye wastewater by microalgae and cyanobacteria. There are no reports on using Hapalosiphon sp. in these processes. However, some authors have indicated that the process of degradation of these dyes by cyanobacteria may involve absorption processes, extracellular binding by electrostatic interactions or van der Waals forces, and enzyme-mediated intracellular metabolism in which the dye may be broken down into other, less toxic compounds, providing a mechanism of detoxification of these compounds in terms of their cellular function [49,50]. In this study, the cyanobacteria showed more significant degradation and adjustment of dyes in the residual water than the microalgae.
Table 4 presents the results of the ANOVA analysis for the four strains. In the case of Chlorella sp., an F-value of 34.17 suggests that the model is significant, which implies that such a large F-value cannot be due to the noise of the experiments. For Chlorella sp., wastewater concentration and photoperiod are the most significant variables (p-value < 0.05). On the other hand, the lack of fit F-value of 2.06 implies that the lack of fit is not significant relative to the pure error. There is a 25.11% chance that such a large F-value for lack of fit is due to noise.
Table 4.
ANOVA analysis for biomass of evaluated strains.
For Scenedesmus sp. (Table 4), the photoperiod and residual water concentration with the linear trend is significant, and the photoperiod with the quadratic trend is significant in the model. Values greater than 0.1000 indicate that the model terms are not significant. If there are many non-significant model terms (not counting those needed to support the hierarchy), model reduction may improve the model. A lack of fit F-value of 0.04 implies that the lack of fit is insignificant relative to the pure error. There is a 98.97% chance that such a large F-value for lack of fit is due to noise.
In the case of cyanobacteria, Oscillatoria sp. showed that the model’s F-value of 85.89 is significant, indicating that there is only a 0.01% chance that this large F-value is due to noise. If the p-value is less than 0.0500, the model terms are significant. For the case of Oscillatoria sp., the residual water concentration and photoperiod are significant model terms. Values greater than 0.1000 indicate that the terms used in the model are not statistically significant. The lack of fit F-value of 0.56 suggests that the lack of fit is not significant compared to the pure error. This means there is a 75.09% chance that such a high F-value for lack of fit is due to random variation or noise.
Finally, the model for Hapalosiphon sp. was discovered to be significant (Table 4), with an F-value of 206.30. This means there is only a 0.01% possibility that such a large F-value is due to noise. When p-values are less than 0.0500, it indicates that the model terms are significant. Both wastewater concentration and photoperiod, and the interaction between these variables, were determined to be significant model terms. Values greater than 0.1000 indicate that the model terms are not significant. Similarly, the F-value for lack of fit of 5.73 implies that the lack of fit is not significant. There is only a 5.77% chance that such a large F-value for lack of fit is due to noise.
Figure 2 shows the surface analysis for each of the microalgae and cyanobacteria strains in relation to the effects of photoperiod and effluent concentration on biomass production. It can be concluded that the best growth concentration is above the 50% mark (v/v) for all strains evaluated. The photoperiod also shows that the optimal growth ranges could be 10 to 21 h of light/darkness. Based on the results obtained, a new experimental design was carried out using the results of the original experimental design, which is presented in Section 3.3.
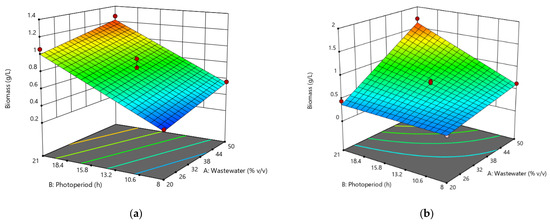
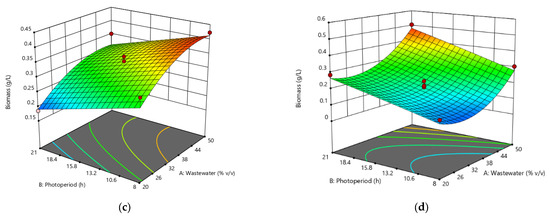
Figure 2.
Response surface analysis for biomass production of (a) Chlorella sp., (b) Scenedesmus sp., (c) Oscillatoria sp., and (d) Hapalosiphon sp.
3.3. Validation of the Optimal Conditions
According to the response surface analysis results, the initial values were optimized using a central composite design (CCD) with two levels of response surface analysis for each of the strains studied. The values of the optimization design are shown in Table 5.
Table 5.
Optimal initial conditions and conditions for the optimization design.
With the optimization experimental design results, ANOVAs were obtained for each of the strains evaluated and are presented in Table 6. The ANOVA results for Chlorella sp. indicate significance; the large F-value is unlikely due to noise. Additionally, p-values less than 0.05 indicate significant model terms. In this case, the linear behavior of the wastewater and photoperiod and the quadratic behavior of the wastewater are significant model terms. Values above 0.1000 indicate that the model terms are not significant. With regard to the fit, the F-value for lack of fit of 2.06 implies that the lack of fit is not significant in relation to the pure error. There is a 25.11% chance that such a large F-value for lack of fit is due to noise, indicating a positive and non-significant lack of fit. As for Scenedesmus sp., an F-value of 115.03 implies that the model is significant; there is only a 0.01% chance that such a large F-value is due to noise. In this case, the linear and quadratic behavior of the variables wastewater concentration and photoperiod are significant terms of the model. The F-value for misfit of 5.04 implies a 7.62% chance of a misfit F-value due to noise.
Table 6.
ANOVA analysis for biomass of the studied strains.
In Oscillatoria sp., it is evident that the model F-value of 133.19 implies that the model is significant; there is only a 0.01% chance that such a large F-value is due to noise. In this case, the linear and quadratic behavior of the wastewater concentration and photoperiod are significant terms of the model. In this case, the F-value for lack of fit of 1.91 implies that the lack of fit is not significant in relation to the pure error. There is a 26.87% chance that such a large F-value of misfit is due to noise. Finally, for Hapalosiphon sp., the model F-value of 115.03 indicated that the model is significant; there is only a 0.01% chance that such a large F-value is due to noise. It was found that the linear and quadratic behavior of wastewater concentration and photoperiod are significant terms of the model. The lack of fit F-value of 5.04 implies a 7.62% chance of such a significant lack of fit F-value being due to noise.
Figure 3 shows the results of the response surface analysis for the optimization of the data obtained in the original experimental design.
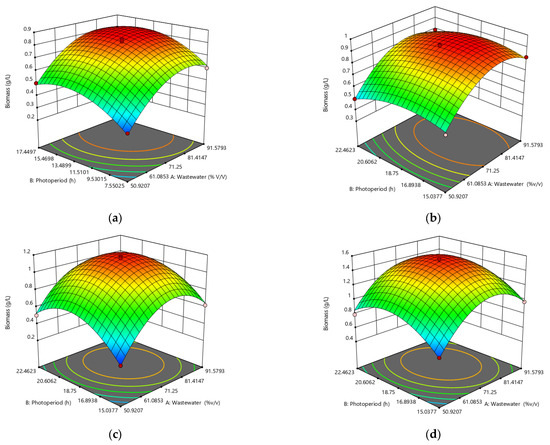
Figure 3.
Optimization of wastewater concentration and photoperiod via response surface analysis for biomass production for (a) Chlorella sp., (b) Scenedesmus sp., (c) Oscillatoria sp., and (d) Hapalosiphon sp.
The response surface allowed us to obtain the variables to confirm the process conditions (Table 7).
Table 7.
Optimal conditions were obtained from response surface analysis using Design Expert software.
Ten replicates were performed to confirm the conditions described in Table 7, and a T-Test Student ANOVA statistical analysis was performed using Prism-GraphPad software. Figure 4 shows the results of the verification of the optimal conditions.
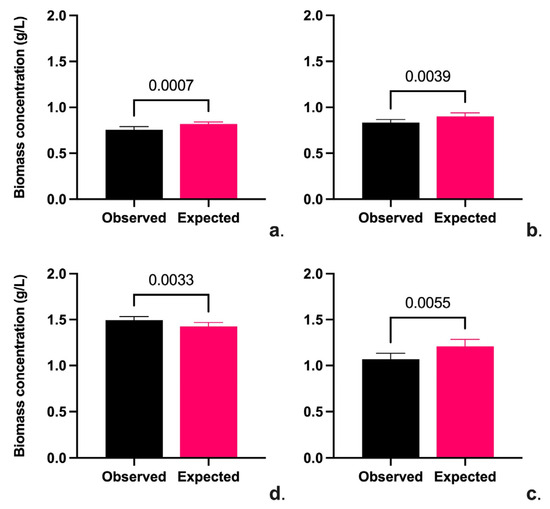
Figure 4.
Validation of optimal conditions for biomass production on Chlorella sp. (a), Scenedesmus sp. (b), Hapalosiphon sp. (c), and Oscillatoria sp. (d).
Biomass production is generally related to the dye degradation rate; the type and concentration of dye significantly affects biomass production. However, textile effluents have different types and concentrations of dyes that affect the biomass of microalgae and cyanobacteria [51]. Although there are few studies on real dye effluents, reports on the use of microalgae and cyanobacteria in textile effluents have shown that the concentration of dye in the system improves the removal rate due to the increased contact opportunities between the dye molecules and the microalgae and cyanobacteria cells during the biosorption process and is also a driving force for overcoming all the barriers for mass transfer of the dye molecules between the cells [28,50]. Degradation of dyes requires a source of nitrogen and phosphorus and, depending on the type of metabolism (autotrophy, mixotrophy, and heterotrophy), a source of organic carbon [40,52]. In this work, it was shown that nitrate concentration in wastewater affects the growth of Scenedesmus and Chlorella sp., while it has no effect in the case of cyanobacteria since they can fix nitrogen. Finally, it has been pointed out that the effluent concentration and light cycle affect the biomass production process of both microalgae and cyanobacteria [53]; this work has shown that the optimization of these parameters increased the biomass production in all the strains evaluated. Figure 5 shows the removal of contaminants from the conditions by each strain.
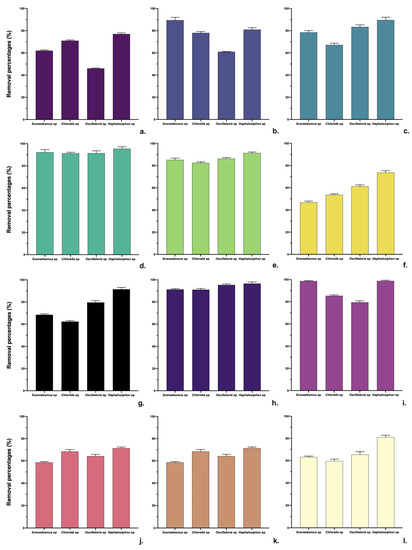
Figure 5.
Contaminant removal percentage of COD (a), BOD (b), NO3 (c), NO2 (d), NH4 (e), PO4 (f), TSS (g), Fe (h), Cr (i), and Cl (j). Total hardness (k) and conductivity (l).
As shown in Figure 5, the removals of most parameters were above 50%, and the strain with the best pollutant removal was Hapalosiphon sp. (Figure 5) which effectively removed COD (75%), nitrates (97%), ammonium (88%), TDS (90%), Fe (91.4), and Cr (92.3%). COD, nitrogen, and phosphorous are critical indicators for evaluating the quality of dyeing wastewater; the assimilation of nitrogen and phosphorous compounds by microalgae cyanobacteria helps the metabolism and growth of these organisms and, therefore, consumes any organic substrate and reduces the COD present in the wastewater [54]. This work demonstrated 85% higher removals of nitrogen and phosphorus compounds, leading to COD removals above 65% for the evaluated strains.
3.4. Production of Metabolites of Interest
Figure 6 shows the percentage of metabolites produced by Scenedesmus, Chlorella, Oscillatoria, and Hapalosiphon sp. grown in industrial dyeing wastewater according to the biomass production optimization conditions obtained. Evidently, the highest production was obtained in the strains of cyanobacteria: 38.5% for Hapalosiphon sp. and 42.3% for Oscillatoria sp.; in carbohydrates, the microalgae strains obtained the highest production percentages: 65. 38% for Scenedesmus sp. and 57.68% for Chlorella sp. For lipids, the strain Hapalosiphon sp. showed the highest accumulation (25.88%), and finally, the cyanobacteria showed the highest pigment concentration. The variation in metabolite production rates between microalgae and cyanobacteria primarily arises from the distinct metabolic traits exhibited by these organisms [55]. Factors such as biomass density, molecular weight, the type of algal biomass, species variations, metabolic activity, growth stage, environmental circumstances, and the presence of nutrients in the wastewater can influence the levels and buildup of metabolites [56]. There are few studies on the cultivation of microalgae and cyanobacteria in real dyeing effluents, while most studies are on synthetic effluents using a single dye; however, there are some reports on the use of Chlorella sp. and Oscillatoria sp. strains for the treatment of dyeing effluents.
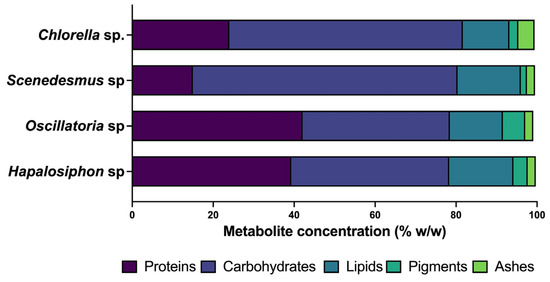
Figure 6.
Metabolite production of Chlorella sp., Scenedesmus sp., Oscillatoria sp., and Hapalosiphon sp.
Nagaraj et al. [29] reported on the cultivation of S. pevalakii in textile wastewater at a concentration of 60% and found that the highest percentage of metabolites was found in carbohydrates (50.1% w/w), followed by lipids (17.82% w/w), pigments (16.8% w/w), and proteins (13). In this work, proteins were found to be the metabolite with the highest production for Oscillatoria sp. (42.4% w/w), while for the other metabolites, the results were similar, except for pigments, where the concentration of Oscillatoria was lower. In the case of Chlorella, Tamil et al. [57] reported the highest biomass production of C. vulgaris in a 50% dilution of textile effluent, achieving carbohydrate production percentages of 34.6% w/w and lipid percentages of 13.88% w/w. Compared with the results obtained in this study, it was found that the accumulation of carbohydrates (54.7% w/w) was higher, and the concentration of lipids was similar. Regarding Scenedesmus, the existing reports refer to biomass production; however, Selvan et al. [58] reported on the growth of Scenedesmus sp. and Desmosdesmus sp. strains in synthetic water with dyes, where the percentage of protein achieved was 1.8% w/w for Scenedesmus sp. and 1.5% w/w; in this study, the percentage of protein production was higher than that (10.05% w/w); Arutselvan et al. [59] reported a lipid accumulation of 39% w/w for S. dimorphus strain, a higher value than that achieved in this study for the Scenedesmus sp. strain (15.63% w/w). Regarding Hapalosiphon sp., there are still no reports in the literature about its use in the treatment of wastewater from the dyeing and textile industries. It is worth highlighting the enrichment of proteins (39.3% w/w) and lipids (25.88% w/w), which reached the highest concentration in this study. Some studies have reported that the production of biomass and metabolites in microalgae and cyanobacteria largely depends on the degradation capacity of the various dyes that make up the dyeing effluent and become sources of nitrogen, carbon, and phosphorus [56]. In genera such as Chlorella sp. and Scenedesmus sp., it has been found that degradation of dyes can occur in two ways: a phase I involving hydrolysis reactions, oxidation, or reduction processes involving enzymes such as hydroxylases, carboxylases, monooxygenases, dioxygenases, and decarboxylases, And a phase II including biodegradation reactions by enzymes such as hydrolases, catalase transferases, glutamyl-tRNA dehydrogenase, malate/pyruvate mono(di)-oxygenase, dehydratases, catalases, reductases, glutathione S-transferases, and pyrophosphate carboxylase/decarboxylase [58,60]. With respect to cyanobacteria, it was found that the process of dye degradation involves several mechanisms that allow the degradation and elimination of various dyes of natural and synthetic origin. One of the processes is extracellular degradation, in which the dye molecules are degraded to smaller and less contaminating compounds with the help of extracellular enzymes produced by cyanobacteria. Another process is intracellular degradation, in which enzymes of the genus azoreductases attack the azo bonds present in the dyes and decompose the dye molecules [30,51].
4. Conclusions
Recently, microalgae and cyanobacteria have been proposed as sustainable solutions for removing pollutant compounds in wastewater. Studies have also been initiated on using these microorganisms in dyeing wastewater due to their ability to tolerate extreme environments, assimilate compounds in sewage, and utilize the biomass produced due to the metabolites produced: lipids, proteins, phytohormones, carbohydrates, and pigments. In this study, the use of microalgal strains (Scenedesmus sp. and Chlorella sp.) and cyanobacteria (Oscillatoria sp. and Hapalosiphon sp.) for bioremediation of dyeing wastewater, biomass production, and metabolites of interest were tested, analyzing the effects of the photoperiod and wastewater concentration. The results showed that for most of the strains studied, longer light cycles of more than 18 h favored growth, except for Chlorella sp., whose photoperiod was 13 h/11 h light/dark. A residual water concentration of 75% v/v proved optimal for the studied strains’ growth. The strain exhibiting the best pollutant removal was Hapalosiphon sp., which effectively removed COD (75%), nitrates (97%), ammonium (88%), TDS (90%), Fe (91.4), and Cr (92.3%). In terms of metabolite production, the highest production of proteins was obtained in the cyanobacterial strains, 38.5% for Hapalosiphon sp. and 42.3% for Oscillatoria sp.; in the case of carbohydrates, the microalgae strains obtained the highest production percentage, 65.38% for Scenedesmus sp. and 57.68% for Chlorella sp. Regarding lipids, the strain Hapalosiphon sp. showed the highest accumulation (25.88%), and finally, in terms of pigment concentration, the cyanobacteria showed the highest accumulation. The cyanobacteria have greater adaptability due to their ability to fix nitrogen. Their potential use depends on the metabolite to be recycled, so this work provides a basis for further research on the utilization of this wastewater through optimization processes to obtain a metabolite of interest. It is, therefore, necessary to continue researching the use of these microorganisms as a biotechnological strategy for the treatment of dyeing effluents; it is essential to evaluate the treated effluent by investigating the compounds that may remain as residual or intermediate products generated during the treatment bioprocess, to determine not only the use of the biomass generated, but also the possibility of reincorporating the treated effluents into the production process, guaranteeing the sustainability of the process.
Author Contributions
Conceptualization, F.M.-M.; Data curation, A.F.B.-S., J.B.G.-M., N.A.U.-S. and G.L.L.-B.; Funding acquisition, F.M.-M.; Investigation, N.A.U.-S. and C.J.S.-P.; Resources, A.F.B.-S. and F.M.-M.; Software, J.E.C.-R., N.A.U.-S., J.B.G.-M. and A.F.B.-S.; Supervision, A.F.B.-S. and F.M.-M.; Writing—original draft, N.A.U.-S. and C.J.S.-P.; Writing review and editing, A.F.B.-S., G.L.L.-B. and F.M.-M. All authors have read and agreed to the published version of the manuscript.
Funding
This research was supported by Universidad del Valle (Colombia) with the project “Evaluation of a coupled system for advanced oxidation of industrial effluents and production of microalgae to obtain high value-added metabolites. ID CI 21144” and Newton Fund Institutional Links, ID 527624805.
Data Availability Statement
Not applicable.
Acknowledgments
We would like to express our sincere gratitude to Universidad del Valle and Universidad Francisco de Paula Santander for the equipment for this research.
Conflicts of Interest
The authors declare no conflict of interest.
References
- Ceretta, M.B.; Vieira, Y.; Wolski, E.A.; Foletto, E.L.; Silvestri, S. Biological Degradation Coupled to Photocatalysis by ZnO/Polypyrrole Composite for the Treatment of Real Textile Wastewater. J. Water Process Eng. 2020, 35, 101230. [Google Scholar] [CrossRef]
- Hubadillah, S.K.; Othman, M.H.D.; Tai, Z.S.; Jamalludin, M.R.; Yusuf, N.K.; Ahmad, A.; Rahman, M.A.; Jaafar, J.; Kadir, S.H.S.A.; Harun, Z. Novel Hydroxyapatite-Based Bio-Ceramic Hollow Fiber Membrane Derived from Waste Cow Bone for Textile Wastewater Treatment. Chem. Eng. J. 2020, 379, 122396. [Google Scholar] [CrossRef]
- Yuan, Y.; Ning, X.A.; Zhang, Y.; Lai, X.; Li, D.; He, Z.; Chen, X. Chlorobenzene Levels, Component Distribution, and Ambient Severity in Wastewater from Five Textile Dyeing Wastewater Treatment Plants. Ecotoxicol. Environ. Saf. 2020, 193, 110257. [Google Scholar] [CrossRef] [PubMed]
- Chhikara, S.; Hooda, A.; Rana, L.; Dhankhar, R. Chromium (VI) Biosorption by Immobilized Aspergillus Niger in Continuous Flow System with Special Reference to FTIR Analysis. J. Environ. Biol. 2010, 31, 561–566. [Google Scholar] [PubMed]
- Daneshvar, E.; Zarrinmehr, M.J.; Kousha, M.; Hashtjin, A.M.; Saratale, G.D.; Maiti, A.; Vithanage, M.; Bhatnagar, A. Hexavalent Chromium Removal from Water by Microalgal-Based Materials: Adsorption, Desorption and Recovery Studies. Bioresour. Technol. 2019, 293, 122064. [Google Scholar] [CrossRef] [PubMed]
- Chung, K.T. Mutagenicity and Carcinogenicity of Aromatic Amines Metabolically Produced from Azo Dyes. J. Environ. Sci. Health Part C 2008, 18, 51–74. [Google Scholar] [CrossRef]
- Kumar, P.; Sumangala, B. Decolorization of Azo Dye Red 3BN by Bacteria. Int. Res. J. Biol. Sci. 2012, 1, 46–52. [Google Scholar]
- Holkar, C.R.; Jadhav, A.J.; Pinjari, D.V.; Mahamuni, N.M.; Pandit, A.B. A Critical Review on Textile Wastewater Treatments: Possible Approaches. J. Environ. Manag. 2016, 182, 351–366. [Google Scholar] [CrossRef]
- Liang, C.Z.; Sun, S.P.; Li, F.Y.; Ong, Y.K.; Chung, T.S. Treatment of Highly Concentrated Wastewater Containing Multiple Synthetic Dyes by a Combined Process of Coagulation/Flocculation and Nanofiltration. J. Membr. Sci. 2014, 469, 306–315. [Google Scholar] [CrossRef]
- Yeap, K.L.; Teng, T.T.; Poh, B.T.; Morad, N.; Lee, K.E. Preparation and Characterization of Coagulation/Flocculation Behavior of a Novel Inorganic–Organic Hybrid Polymer for Reactive and Disperse Dyes Removal. Chem. Eng. J. 2014, 243, 305–314. [Google Scholar] [CrossRef]
- Chollom, M.N.; Rathilal, S.; Pillay, V.L.; Alfa, D. The Applicability of Nanofiltration for the Treatment and Reuse of Textile Reactive Dye Effluent. Water SA 2015, 41, 398–405. [Google Scholar] [CrossRef]
- Koyuncu, I.; Güney, K. Membrane-Based Treatment of Textile Industry Wastewaters. Encycl. Membr. Sci. Technol. 2013, 1–12. [Google Scholar] [CrossRef]
- Auta, M.; Hameed, B.H. Preparation of Waste Tea Activated Carbon Using Potassium Acetate as an Activating Agent for Adsorption of Acid Blue 25 Dye. Chem. Eng. J. 2011, 171, 502–509. [Google Scholar] [CrossRef]
- Galán, J.; Rodríguez, A.; Gómez, J.M.; Allen, S.J.; Walker, G.M. Reactive Dye Adsorption onto a Novel Mesoporous Carbon. Chem. Eng. J. 2013, 219, 62–68. [Google Scholar] [CrossRef]
- Zuorro, A.; Lavecchia, R. Evaluation of UV/H2O2 Advanced Oxidation Process (AOP) for the Degradation of Diazo Dye Reactive Green 19 in Aqueous Solution. New Pub Balaban 2014, 52, 1571–1577. [Google Scholar] [CrossRef]
- Gupta, V.K.; Jain, R.; Mittal, A.; Saleh, T.A.; Nayak, A.; Agarwal, S.; Sikarwar, S. Photo-Catalytic Degradation of Toxic Dye Amaranth on TiO(2)/UV in Aqueous Suspensions. Mater. Sci. Eng. C Mater. Biol. Appl. 2012, 32, 12–17. [Google Scholar] [CrossRef] [PubMed]
- Mishra, K.P.; Gogate, P.R. Intensification of Degradation of Rhodamine B Using Hydrodynamic Cavitation in the Presence of Additives. Sep. Purif. Technol. 2010, 75, 385–391. [Google Scholar] [CrossRef]
- Wang, Z.; Xue, M.; Huang, K.; Liu, Z.; Wang, Z.; Xue, M.; Huang, K.; Liu, Z. Textile Dyeing Wastewater Treatment. Adv. Treat. Text. Effl. 2011, 5, 91–116. [Google Scholar] [CrossRef]
- Hayat, H.; Mahmood, Q.; Pervez, A.; Bhatti, Z.A.; Baig, S.A. Comparative Decolorization of Dyes in Textile Wastewater Using Biological and Chemical Treatment. Sep. Purif. Technol. 2015, 154, 149–153. [Google Scholar] [CrossRef]
- Castellanos-Estupiñan, M.A.; Carrillo-Botello, A.M.; Rozo-Granados, L.S.; Becerra-Moreno, D.; García-Martínez, J.B.; Urbina-Suarez, N.A.; López-Barrera, G.L.; Barajas-Solano, A.F.; Bryan, S.J.; Zuorro, A. Removal of Nutrients and Pesticides from Agricultural Runoff Using Microalgae and Cyanobacteria. Water 2022, 14, 558. [Google Scholar] [CrossRef]
- Zuorro, A.; García-Martínez, J.B.; Barajas-Solano, A.F. The Application of Catalytic Processes on the Production of Algae-Based Biofuels: A Review. Catalysts 2021, 11, 22. [Google Scholar] [CrossRef]
- Guiza-Franco, L.; Orozco-Rojas, L.G.; Sanchez-Galvis, M.; Garcia-Martinez, J.B.; Barajas-Ferreira, C.; Zuorro, A.; Barajas-Solano, A.F. Production of Chlorella Vulgaris Biomass on UV-Treated Wastewater as an Alternative for Environmental Sustainability on High-Mountain Fisheries. Chem. Eng. Trans. 2018, 64, 517–522. [Google Scholar] [CrossRef]
- Quintero-Dallos, V.; García-Martínez, J.B.; Contreras-Ropero, J.E.; Barajas-Solano, A.F.; Barajas-Ferrerira, C.; Lavecchia, R.; Zuorro, A. Vinasse as a Sustainable Medium for the Production of Chlorella Vulgaris UTEX 1803. Water 2019, 11, 1526. [Google Scholar] [CrossRef]
- García-Martínez, J.B.; Sanchez-Tobos, L.P.; Carvajal-Albarracín, N.A.; Barajas-Solano, A.F.; Barajas-Ferreira, C.; Kafarov, V.; Zuorro, A. The Circular Economy Approach to Improving CNP Ratio in Inland Fishery Wastewater for Increasing Algal Biomass Production. Water 2022, 14, 749. [Google Scholar] [CrossRef]
- García-Martínez, J.B.; Contreras-Ropero, J.E.; Urbina-Suarez, N.A.; López-Barrera, G.L.; Barajas-Solano, A.F.; Kafarov, V.; Barajas-Ferreira, C.; Ibarra-Mojica, D.M.; Zuorro, A. A Simulation Analysis of a Microalgal-Production Plant for the Transformation of Inland-Fisheries Wastewater in Sustainable Feed. Water 2022, 14, 250. [Google Scholar] [CrossRef]
- Aragaw, T.A.; Asmare, A.M. Phycoremediation of Textile Wastewater Using Indigenous Microalgae. Water Pract. Technol. 2018, 13, 274–284. [Google Scholar] [CrossRef]
- Daneshvar, N.; Ayazloo, M.; Khataee, A.R.; Pourhassan, M. Biological Decolorization of Dye Solution Containing Malachite Green by Microalgae Cosmarium sp. Bioresour. Technol. 2007, 98, 1176–1182. [Google Scholar] [CrossRef]
- Dhaouefi, Z.; Toledo-Cervantes, A.; García, D.; Bedoui, A.; Ghedira, K.; Chekir-Ghedira, L.; Muñoz, R. Assessing Textile Wastewater Treatment in an Anoxic-Aerobic Photobioreactor and the Potential of the Treated Water for Irrigation. Algal Res. 2018, 29, 170–178. [Google Scholar] [CrossRef]
- Nagaraj, S.; Sagaya, J.P.J.; Anand, J.; Malairaj, S.; Lakshmaiah, B.; Sathya, R.; MubarakAli, D. A Cyanobacterium Treated Textile Wastewater for the Plant Growth Enhancement: Experimental Study. Appl. Biochem. Biotechnol. 2022. [Google Scholar] [CrossRef]
- Sharif, A. Microbial Degradation of Textile Industry Effluents: A Review. Pure Appl. Biol. 2020, 9, 2361–2382. [Google Scholar] [CrossRef]
- Al-Tohamy, R.; Ali, S.S.; Li, F.; Okasha, K.M.; Mahmoud, Y.A.G.; Elsamahy, T.; Jiao, H.; Fu, Y.; Sun, J. A Critical Review on the Treatment of Dye-Containing Wastewater: Ecotoxicological and Health Concerns of Textile Dyes and Possible Remediation Approaches for Environmental Safety. Ecotoxicol. Environ. Saf. 2022, 231, 113160. [Google Scholar] [CrossRef] [PubMed]
- Lipps, W.C.; Braun-Howland, E.B.; Baxter, T.E. Standard Methods for the Examination of Water and Wastewater, 23rd ed.; American Public Health Association: Washington, DC, USA, 2017; ISBN 0875532993. [Google Scholar]
- Urbina-Suarez, N.A.; Ayala-González, D.D.; Rivera-Amaya, J.D.; Barajas-Solano, A.F.; Machuca-Martínez, F. Evaluation of the Light/Dark Cycle and Concentration of Tannery Wastewater in the Production of Biomass and Metabolites of Industrial Interest from Microalgae and Cyanobacteria. Water 2022, 14, 346. [Google Scholar] [CrossRef]
- Moheimani, N.R.; Borowitzka, M.A.; Isdepsky, A.; Sing, S.F. Standard Methods for Measuring Growth of Algae and Their Composition BT—Algae for Biofuels and Energy; Borowitzka, M.A., Moheimani, N.R., Eds.; Springer: Dordrecht, The Netherlands, 2013; pp. 265–284. ISBN 978-94-007-5479-9. [Google Scholar]
- Moheimani, N.R.; Webb, J.P.; Borowitzka, M.A. Bioremediation and Other Potential Applications of Coccolithophorid Algae: A Review. Algal Res. 2012, 1, 120–133. [Google Scholar] [CrossRef]
- Urbina-Suarez, N.A.; Rivera-Caicedo, C.; González-Delgado, Á.D.; Barajas-Solano, A.F.; Machuca-Martínez, F. Bicarbonate-Hydrogen Peroxide System for Treating Dyeing Wastewater: Degradation of Organic Pollutants and Color Removal. Toxics 2023, 11, 366. [Google Scholar] [CrossRef] [PubMed]
- Slavov, A.K. General Characteristics and Treatment Possibilities of Dairy Wastewater—A Review. Food Technol. Biotechnol. 2017, 55, 14. [Google Scholar] [CrossRef] [PubMed]
- Urbina-Suarez, N.A.; Barajas-Solano, A.F.; Zuorro, A.; Machuca, F. Advanced Oxidation Processes with Uv-H2O2 for Nitrification and Decolorization of Dyehouse Wastewater. Chem. Eng. Trans. 2022, 95, 235–240. [Google Scholar] [CrossRef]
- Silva, L.G.M.; Moreira, F.C.; Cechinel, M.A.P.; Mazur, L.P.; de Souza, A.A.U.; Souza, S.M.A.G.U.; Boaventura, R.A.R.; Vilar, V.J.P. Integration of Fenton’s Reaction Based Processes and Cation Exchange Processes in Textile Wastewater Treatment as a Strategy for Water Reuse. J. Environ. Manag. 2020, 272, 111082. [Google Scholar] [CrossRef]
- Urbina-Suárez, N.A. Different Effect of Nitrogen Sources in Autotrophic and Mixotrophic Culture of Scenedesmus sp. for Biomass and Carotenoids Production Using Acidic Coal Mine Drainage Effluents. Ing. Y Compet. 2022, 24. [Google Scholar] [CrossRef]
- Esther Baby, J.; Jaambavi, I.; Rajeswari, G.; Akshaya, T. Optimization Removal of Colour and Organic Solid Pollutants from Textile Industry Wastewater by Electrocoagulation. Mater. Today Proc. 2021. [Google Scholar] [CrossRef]
- Subashini, P.S.; Rajiv, P. An Investigation of Textile Wastewater Treatment Using Chlorella Vulgaris. Orient. J. Chem. 2018, 34, 2517–2524. [Google Scholar] [CrossRef]
- Hussain, Z.; Arslan, M.; Shacir, G.; Malik, M.H.; Mohsin, M.; Iqbal, S.; Afzal, M. Remediation of Textile Bleaching Effluent by Bacterial Augmented Horizontal Flow and Vertical Flow Constructed Wetlands: A Comparison at Pilot Scale. Sci. Total Environ. 2019, 685, 370–379. [Google Scholar] [CrossRef] [PubMed]
- Roy, M.; Saha, R. Dyes and Their Removal Technologies from Wastewater: A Critical Review. Intell. Environ. Data Monit. Pollut. Manag. 2021, 127–160. [Google Scholar] [CrossRef]
- Yao, J.; Mei, Y.; Xia, G.; Lu, Y.; Xu, D.; Sun, N.; Wang, J.; Chen, J. Process Optimization of Electrochemical Oxidation of Ammonia to Nitrogen for Actual Dyeing Wastewater Treatment. Int. J. Environ. Res. Public Health 2019, 16, 2931. [Google Scholar] [CrossRef] [PubMed]
- de Carvalho, J.C.; Borghetti, I.A.; Cartas, L.C.; Woiciechowski, A.L.; Soccol, V.T.; Soccol, C.R. Biorefinery Integration of Microalgae Production into Cassava Processing Industry: Potential and Perspectives. Bioresour. Technol. 2018, 247, 1165–1172. [Google Scholar] [CrossRef] [PubMed]
- Gita, S.; Shukla, S.P.; Saharan, N.; Prakash, C.; Deshmukhe, G. Toxic Effects of Selected Textile Dyes on Elemental Composition, Photosynthetic Pigments, Protein Content and Growth of a Freshwater Chlorophycean Alga Chlorella Vulgaris. Bull. Environ. Contam. Toxicol. 2019, 102, 795–801. [Google Scholar] [CrossRef] [PubMed]
- Javed, F.; Rashid, N.; Fazal, T.; Hafeez, A.; Rehman, F. Integration of Real Industrial Wastewater Streams to Enhance Chlorella Vulgaris Growth: Nutrient Sequestration and Biomass Production. Water Air Soil Pollut. 2023, 234, 1–11. [Google Scholar] [CrossRef]
- El-Sheekh, M.M.; El-Shanshoury, A.R.; Abou-El-Souod, G.W.; Gharieb, D.Y.; El Shafay, S.M. Decolorization of Dyestuffs by Some Species of Green Algae and Cyanobacteria and Its Consortium. Int. J. Environ. Sci. Technol. 2021, 18, 3895–3906. [Google Scholar] [CrossRef]
- Shetty, K.; Krishnakumar, G. Algal and Cyanobacterial Biomass as Potential Dye Biodecolorizing Material: A Review. Biotechnol. Lett. 2020, 42, 2467–2488. [Google Scholar] [CrossRef]
- Dellamatrice, P.M.; Silva-Stenico, M.E.; de Moraes, L.A.B.; Fiore, M.F.; Monteiro, R.T.R. Degradation of Textile Dyes by Cyanobacteria. Braz. J. Microbiol. 2017, 48, 25. [Google Scholar] [CrossRef]
- Kumar, A.; Bera, S. Revisiting Nitrogen Utilization in Algae: A Review on the Process of Regulation and Assimilation. Bioresour. Technol. Rep. 2020, 12, 100584. [Google Scholar] [CrossRef]
- Cuellar-Bermudez, S.P.; Aleman-Nava, G.S.; Chandra, R.; Garcia-Perez, J.S.; Contreras-Angulo, J.R.; Markou, G.; Muylaert, K.; Rittmann, B.E.; Parra-Saldivar, R. Nutrients Utilization and Contaminants Removal. A Review of Two Approaches of Algae and Cyanobacteria in Wastewater. Algal Res. 2017, 24, 438–449. [Google Scholar] [CrossRef]
- Fazal, T.; Rehman, M.S.U.; Javed, F.; Akhtar, M.; Mushtaq, A.; Hafeez, A.; Alaud Din, A.; Iqbal, J.; Rashid, N.; Rehman, F. Integrating Bioremediation of Textile Wastewater with Biodiesel Production Using Microalgae (Chlorella vulgaris). Chemosphere 2021, 281, 130758. [Google Scholar] [CrossRef] [PubMed]
- Gonçalves, A.L. The Use of Microalgae and Cyanobacteria in the Improvement of Agricultural Practices: A Review on Their Biofertilising, Biostimulating and Biopesticide Roles. Appl. Sci. 2021, 11, 871. [Google Scholar] [CrossRef]
- Touliabah, H.E.S.; El-Sheekh, M.M.; Ismail, M.M.; El-Kassas, H. A Review of Microalgae- and Cyanobacteria-Based Biodegradation of Organic Pollutants. Molecules 2022, 27, 1141. [Google Scholar] [CrossRef] [PubMed]
- Tamil Selvan, S.; Dakshinamoorthi, B.M.; Chandrasekaran, R.; Muthusamy, S.; Ramamurthy, D.; Balasundaram, S. Integrating Eco-Technological Approach for Textile Dye Effluent Treatment and Carbon Dioxide Capturing from Unicellular Microalga Chlorella Vulgaris RDS03: A Synergistic Method. Int. J. Phytoremediat. 2023, 25, 466–482. [Google Scholar] [CrossRef] [PubMed]
- Selvan, B.K.; Pandiyan, R.; Vaishnavi, M.; Das, S.; Thirunavoukkarasu, M. Ameliorative Biodegradation of Hazardous Textile Industrial Wastewater Dyes by Potential Microalgal sp. Biomass Convers. Biorefinery 2022, 1–12. [Google Scholar] [CrossRef]
- Arutselvan, C.; Narchonai, G.; Pugazhendhi, A.; kumar Seenivasan, H.; LewisOscar, F.; Thajuddin, N. Phycoremediation of Textile and Tannery Industrial Effluents Using Microalgae and Their Consortium for Biodiesel Production. J. Clean. Prod. 2022, 367, 133100. [Google Scholar] [CrossRef]
- Ding, T.; Yang, M.; Zhang, J.; Yang, B.; Lin, K.; Li, J.; Gan, J. Toxicity, Degradation and Metabolic Fate of Ibuprofen on Freshwater Diatom Navicula sp. J. Hazard. Mater. 2017, 330, 127–134. [Google Scholar] [CrossRef]
Disclaimer/Publisher’s Note: The statements, opinions and data contained in all publications are solely those of the individual author(s) and contributor(s) and not of MDPI and/or the editor(s). MDPI and/or the editor(s) disclaim responsibility for any injury to people or property resulting from any ideas, methods, instructions or products referred to in the content. |
© 2023 by the authors. Licensee MDPI, Basel, Switzerland. This article is an open access article distributed under the terms and conditions of the Creative Commons Attribution (CC BY) license (https://creativecommons.org/licenses/by/4.0/).