Abstract
Drag reduction in turbulent flow may be significantly reduced by adding tiny quantities of fiber, polymer, and surfactant particles to the liquid. Different drag-reduction agents have proven to be effective in enhancing the flowability of the liquid when added. This study investigated the potential of decreasing the drag, turbulent flow, and pressure drop in horizontal pipe flow by using a mixture of modified xanthan gums (XGs). Xanthan gums are an environmentally friendly natural polymer complex. They can be extracted from xanthan gum plants and utilized to formulate different concentrations of complexes. The flowability of the xanthan gum was experimentally investigated in a 1-m-long pipe by using addition concentrations of 300 to 950 ppm, an inner diameter of 0.254 inches, and four different flow rates. The results revealed that the pressure drop was reduced considerably with an increase in the concentration of the additives. The mixture (xanthan gums plus water) resulted a favorable reduction in the pressure, which reached 65% at a concentration of 950 ppm. The results of the computational fluid dynamic simulation using the COMSOL simulator showed a change in the fluid velocity profiles, which became more parabolic. This occurred because of an increase in the mean fluid velocity due to the addition of the drag-reducing polymers.
1. Introduction
In an accidental discovery in 1948, Tom observed a notable decrease in the pressure drop when tiny quantities of viscoelastic materials were injected into the main core of a turbulent flow system. The phenomenon resulted in active drag reduction which led to the first practical application in the early 1950s. Since then, several scientists have tested, assessed, and presented a range of soluble and insoluble drag reduction agents (DRAs). These additives can generally be divided into three categories: suspended particles, polymers, and surfactants. From an industrial perspective, polymeric DRAs are the most efficient and practical from a commercial standpoint. These long-chained polymeric additives’ viscoelastic properties give them the distinct ability to interact and interfere with turbulent flow medium, which allows them to reduce the turbulent structures (eddies) created in the pipe. Various types of polymeric additives have been used to improve the flow of crude oil in pipelines. The majority of these additives were synthesized and thereby classified [1,2,3,4].
Tabor and De Gennes believed that polymers were able to decrease drag due to their elastic properties even when they were in their least diluted form [5]. Polymers are also known as viscoelastic fluids because they can store elastic energy. This causes them to be able to create shearing waves that naturally truncate at high frequency, which calms down small eddies and reduces skin friction. As a result of his investigation, Lumley concluded that the process results from the polymer’s molecules stretching the chains of coiled polymers. The wall goes through effective viscosity because of the straining. Because of this, the tiny vortices are dampened and the skin’s resistance to the wall is reduced. Sher and Hetsroni [6] provided an alternative model using additives in their 2008 work on polymer elasticity, comparing their findings to those of Virk’s experiment [7]. To better understand the drag reduction techniques, the next section outlines the underlying concepts of the idea.
Polymeric drag reducers are expected to work better than DRs because of their long chains and extremely high molecular weight, which ranges from 1 to 10 million. Water or oil can dissolve these polymers. They are incorporated into the system in parts per million, and they are effective in lowering turbulent bursts that are brought on by turbulent eddies that propagate in the buffer zone. This will enable the pump’s hydraulic energy to be focused more on fluid flow in the pipes with little chaotic or random motion when the fluid has to be transported [8]. These polymers are introduced into the system due to the frequent flow of oil, water, and gas in the petroleum industry. In order to avoid static pressure losses, it may be essential to introduce gas into the well tube when attempting to collect only oil [9,10,11]. Consequently, a multiphase mixture is pushed across a long distance to separating or processing terminals, resulting in a substantial pressure drop and a cost-effective technique. However, this is extremely costly and often not practical at well sites [12]. As a result, modest quantities of drag-reducing chemicals, such as polymers, are introduced to decrease the current frictional pressure losses. This results in increased output flow rates at reduced prices, as well as other benefits, including lower operational costs, greater productivity, quicker loading and uploading procedures, and more powerful pumps in the refineries. The effect of polymer addition on the waveform of stratified flows has also been explored. In 2003, Baik and Hanratty discovered that when polymers were added to the stratified flow, the wave shapes changed. The flow behavior can be modeled using computational fluid dynamics [13].
With the advancement of fluid mechanics theory, computer technology, and numerical simulation techniques, computational fluid dynamics has become a crucial tool for simulating turbulent flow. Computational fluid dynamics (CFD), which has been widely used in other sectors for many years, is becoming more and more accepted. Using numerical techniques for a specific geometry with specific boundary conditions, CFD aims to solve transport equations that can accurately describe the conservation of mass, momentum, energy, and other flow-related properties. It does this by utilizing models for turbulence or heat and mass transfer that are pertinent to the task at hand. Since single-phase flows are more common in these applications, it has long since largely supplanted the time-consuming, expensive wind tunnel experiments that were formerly a key tool in the aerospace and automotive industries. The majority of fluid applications involve multiphase flows, which provide extra modeling and numerical treatment issues. Since more computer power has been accessible in the last 10 years, theoretical and numerical studies of hydrodynamics, heat transfer, and mass transfer for the design and optimization of two-phase or multiphase fluid flow have drawn a lot of interest [14]. Using horizontal flow, Jiatong Tan et al. conducted an experiment on the impacts of A-110 anionic polyacrylamide on flow behavior, pressure drop, and the drag reduction ratio (oil–water) [15]. The outcomes demonstrated a strong correlation between the oil and water velocities and the drag reduction impact. The slide between the water and oil was also enhanced by the inclusion of the DRP. Experimental research on the potential of three different types of drag reduction agents (DRAs) to enhance flow in a horizontal pipe has been conducted [16]. The authors employed different concentrations of drag-reducing agents, i.e., between 50 and 1200 ppm. The results suggested that by lowering the drag reduction rate to 47%, flow in the pipe might be improved. A small amount of GAL surfactant (few ppm) was used by Alsaedi et al. [17] to minimize drag forces. The GAL solution was tested experimentally at varying concentrations. Experiments were conducted at low and high XG dosages to examine the impact on the flow characteristics. Various speeds between 50 and 3000 rpm were used with a rotating disc apparatus (RDA). Torque values were determined in the GAL solution and in water. The findings demonstrated that Glycolic Acid Lauryl Ether (GAL) in a range of dosages is an efficient drag-reduction tool, with notable torque measurement disparities. Additionally, the GAL solutions showed the same pattern at all concentrations. As the concentration increase, the torque results improved.
In this study, a new polymer additive was synthesized using well-known polymeric drag-reducing chemicals. The polymer additive was initially tested as a DRA. The first phase investigated the performance of this polymer additive in the pipeline with and without flow enhancement. In the subsequent stage, experimental and numerical studies were used to examine the single-phase flow in a horizontal pipe. The drag reduction was calculated using COMSOL. In this research, the flow distribution of a polymer additive in a horizontal pipe was examined using COMSOL.
2. Experimental Setup
Linear flexible polymers, polyacrylamide, polyethylene oxide (PEO), and XG as rigid polymers were selected for this study. The molecular weight range of PAM was 4–8 × 10⁶ kg/mol. PEO had an average molecular weight of 8 × 10⁶ g/mol, and the molecular weight of the XGs was 2.0 × 10⁶ g/mol. All polymers were obtained from Sigma Aldrich and utilized in the experimental study without any further modifications.
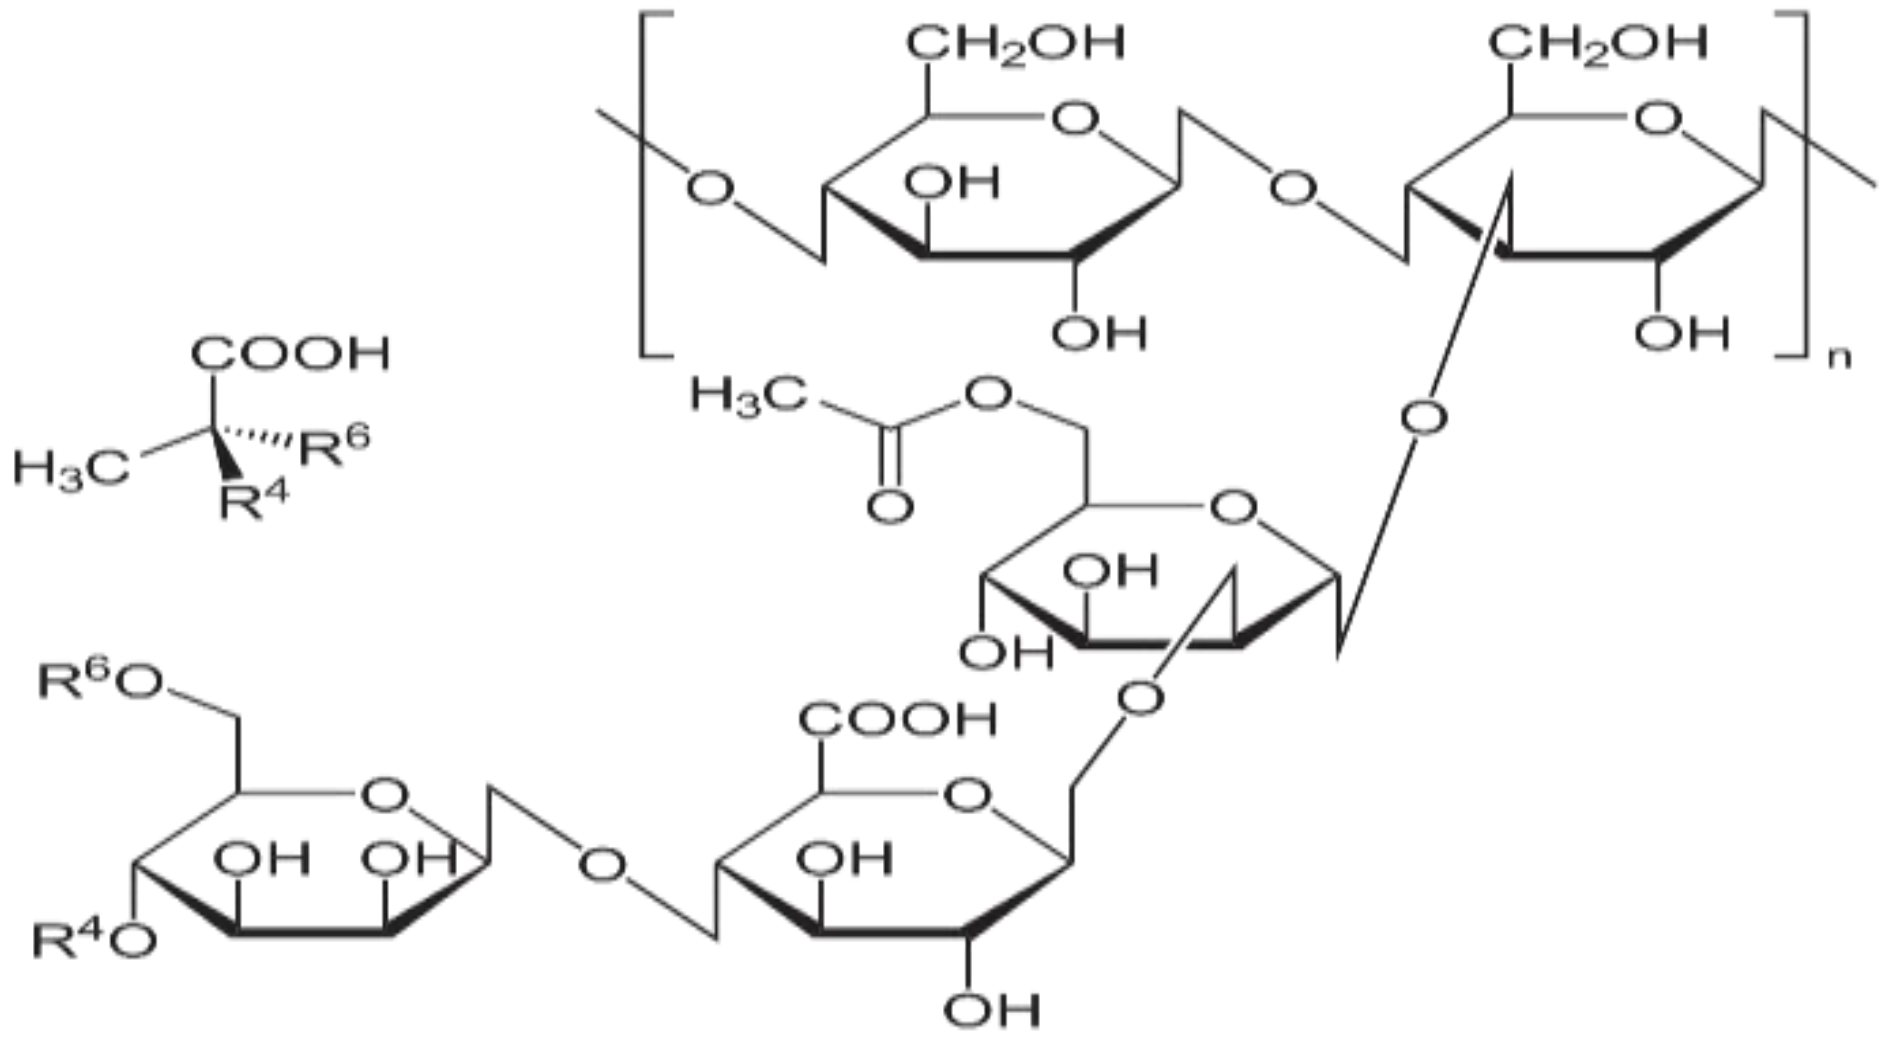
Each of the used polymers is water soluble. The most significant property of the final solution of xanthan is its ability to significantly enhance viscosity. Even a tiny amount of PAAM, PEO, and XG added to liquids can cause the solution to become very viscous. However, when shear rates drop, the viscosity decreases, which makes the solution thin or behave like a pseudo-plastic. As soon as the shear is removed, the solution returns to its former properties and dragging decreases. The greater the weight ratio of the XG components in a liquid, the thicker it becomes. The molecular makeup of the XGs is depicted in Figure 1.
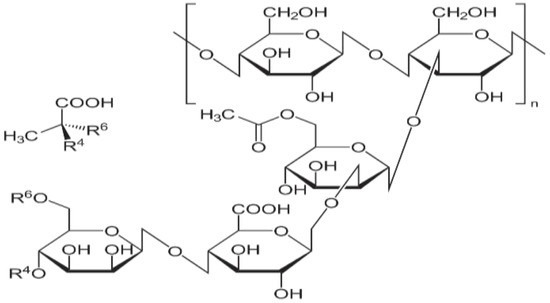
Figure 1.
Molecular structures of xanthan gums [18].
2.1. Preparation of the Modified XG Solutions
Different concentrations (300, 600, and 950 ppm) of solutions of modified XGs were investigated. The modified XG solution was prepared by dissolving 30 mg of each of PAA and PEO separately in 1 L of distilled water; swirling was conducted for 5 h at a very low speed using a mechanical stirrer (to prevent polymer degradation). The stirred solution was left for 12 h. The undissolved portion was xanthan, which was then dissolved in 1 L of distilled water and stirred for 24 h with a mechanical stirrer at a very low speed (to avoid degradation of the polymer), and the solution was left for 24 h. After the master solution was prepared by combining the prepared solutions, the mixture was fully homogenized. The entire mixture was kept in the tank for one day to reach solution equilibrium.
2.2. Experimental Process
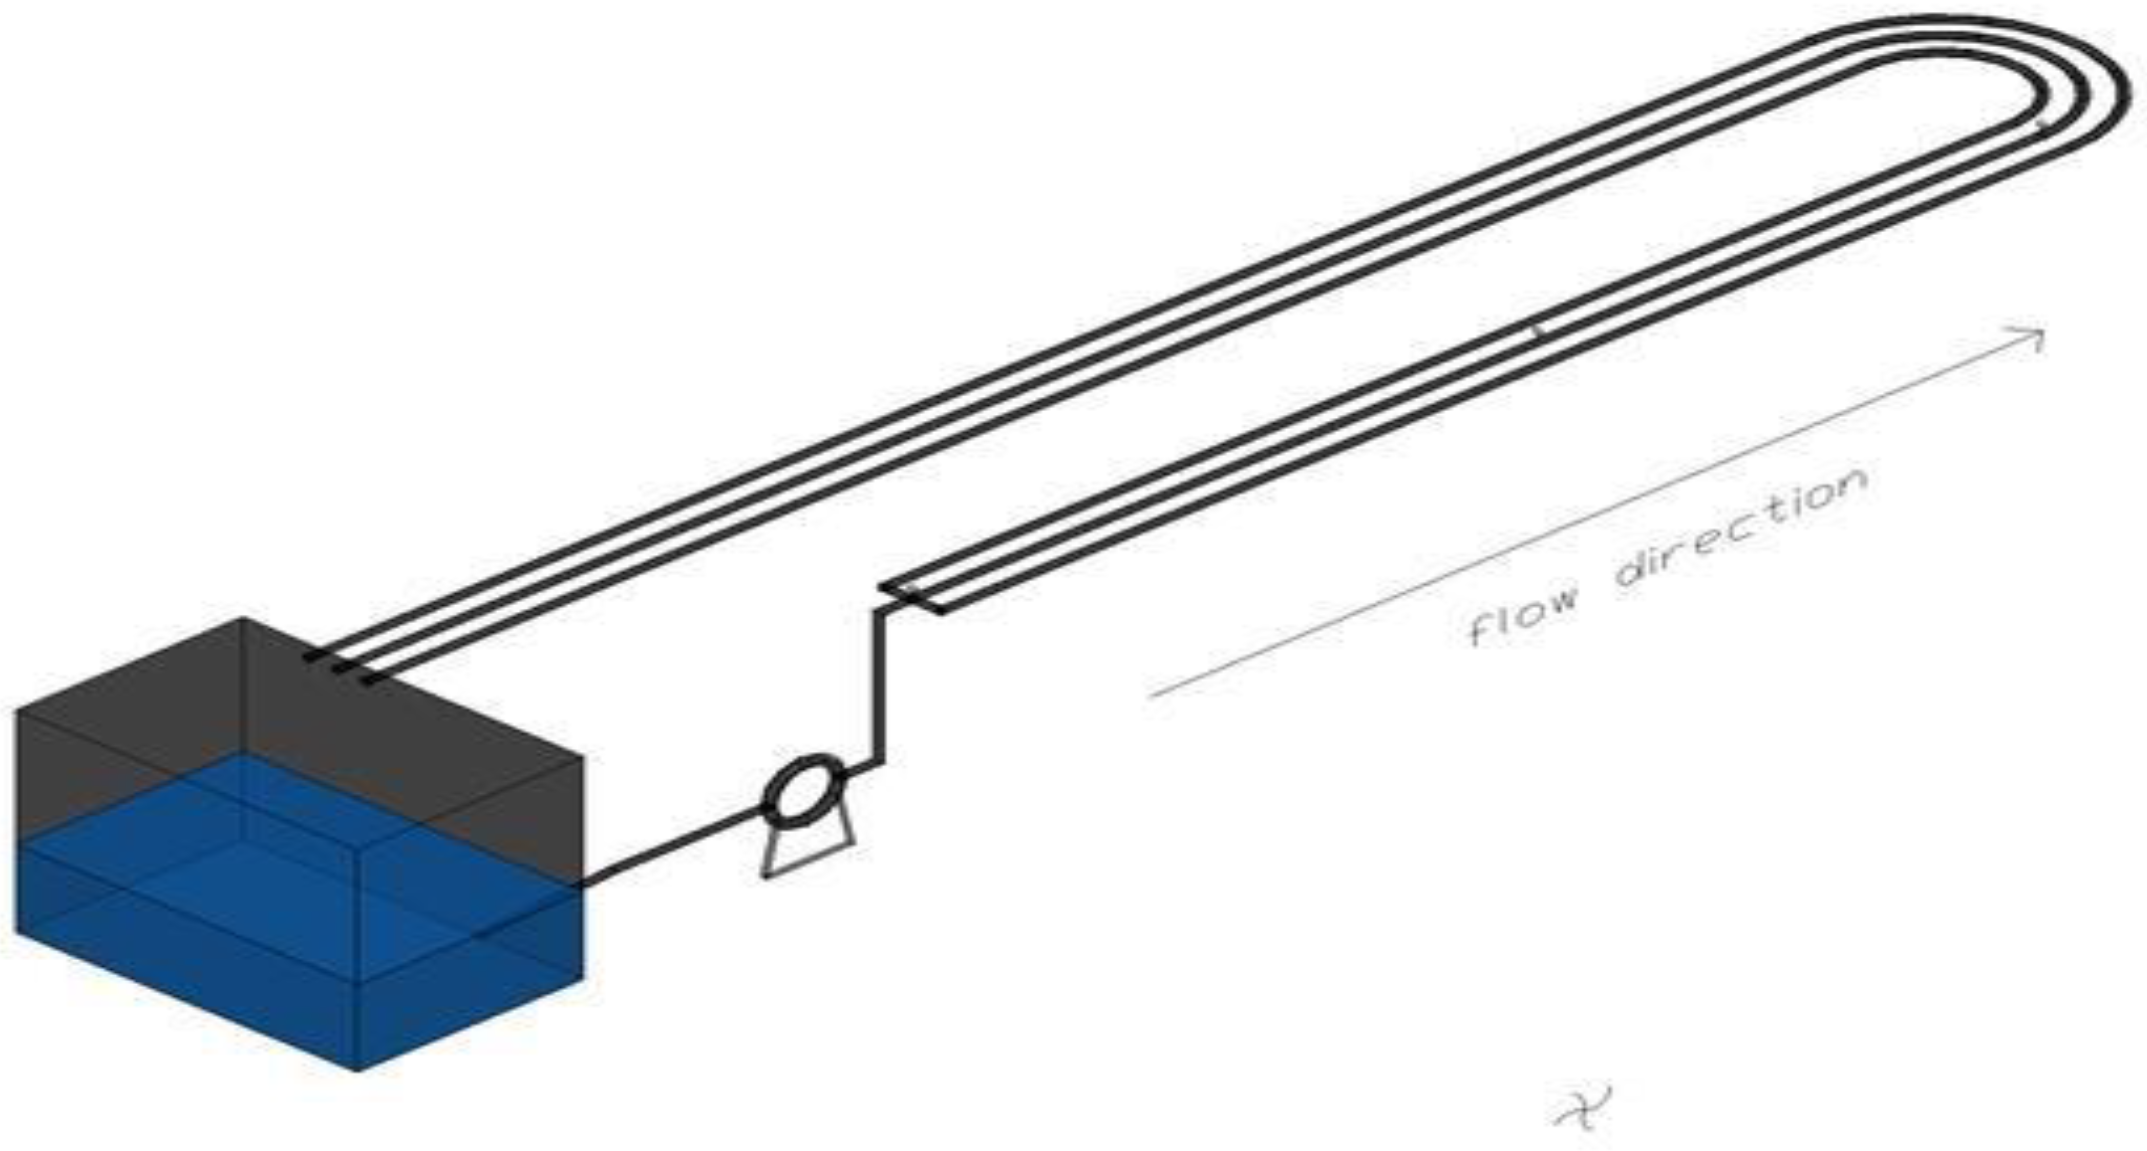
The experiment included a flow loop test and the creation of a modified XG mixture for aqueous drag reduction. To reduce drag, RXG solutions of a certain concentration were made. The desired concentration of the modified XG mixture was added to water and stirred at a high speed of 1200 rpm for 30 s to produce stock solutions of the modified XG mixture with concentrations of 300, 600, and 950 ppm. After that, additional water was added, and the mixture was agitated for 5 h at a slower speed of 100 rpm, after which it was left for 24 h for the complete equalization of the stock solution and the creation of aqueous xanthan. To begin the flow loop test, the water pump was turned on. As shown in Figure 2, the modified XG mixture passed through the flow meter and pump before entering the test section of the pipeline through the intake. Thereafter, the test pipeline’s observation and test portions began receiving water. The experimental parameters were recorded, and photographs were taken after the flow stabilized and the pressure gradient fluctuated by 5%. When passing through pumps in experimental applications, polymers degrade under shear. Mechanical deterioration causes the molecular weights to decrease and the drag reduction efficiency to decrease [19]. This issue may be avoided by using a one-pass method, which ensures that the polymers behind the injection point are always new and undamaged and the XGs are continually injected into the flow. Experimental research can use a one-pass system, but it might not be practical.
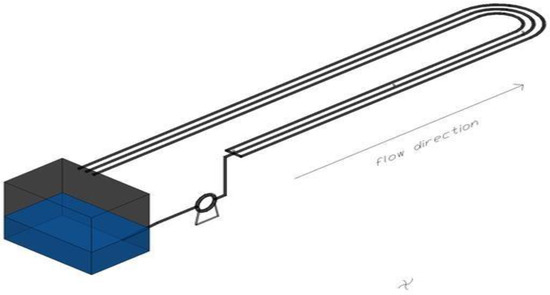
Figure 2.
Schematic of the experimental rig.
3. Numerical Simulation
3.1. Assumptions
All assumptions and boundary conditions are summarized in Table 1.

Table 1.
Boundary conditions and assumptions.
3.2. Governing Equation
The fundamental equations describing the flow field of the study, the 2D form of the continuity equation, and two momentum equations (Naiver–Stokes), are presented in Equations (1)–(5) [20].
- Continuity equation (mass conservation)
- 2.
- Momentum equation (Navier–Stokes equation)
u—Momentum (x-direction)
v—Momentum (r-direction)
The skin terms Su and Sv in the above momentum equations can be calculated as follows:
3.3. Turbulence Model
The function of a turbulence model is to convert the Reynolds stresses into a set of auxiliary differential and algebraic equations that represent the time-mean properties of the flow. The eddy or turbulent viscosity and eddy turbulent diffusivity provide the foundation of the bulk of turbulence models used in solving real-world fluid flow issues.
The typical model is used to predict the bulk of engineering flow computations that occur in the real world [21]. In this model, the solution of two differential transport equations , one for turbulent kinetic energy () and the other for energy dissipation, () determines the eddy viscosity. The model is sometimes classified as a two-equation model as a result of two differential transport phenomena. The model is the most widely used due to its adaptability to a variety of flow issues, which makes it easy to handle using COMSOL Multiphysics simulation software and the CFD Module.
The transport equation (k) can be written as
where pk is the production term and is expressed in the following equation:
The transport equation (ε) is represented as
The constant values, which are the standard values for homogeneous systems, were quantified as
Cμ = 0.09, Cε1 = 1.44, Cε2 = 1.92, σk = 1.00 and σε = 1.30,
The turbulent intensity (IT) and the turbulent length (LT) were calculated according to the following equations:
The effective viscosity used in the momentum equations is
The turbulent viscosity was obtained from the following equation:
in which Cμ represents the model constant.
3.4. Geometry and Mesh
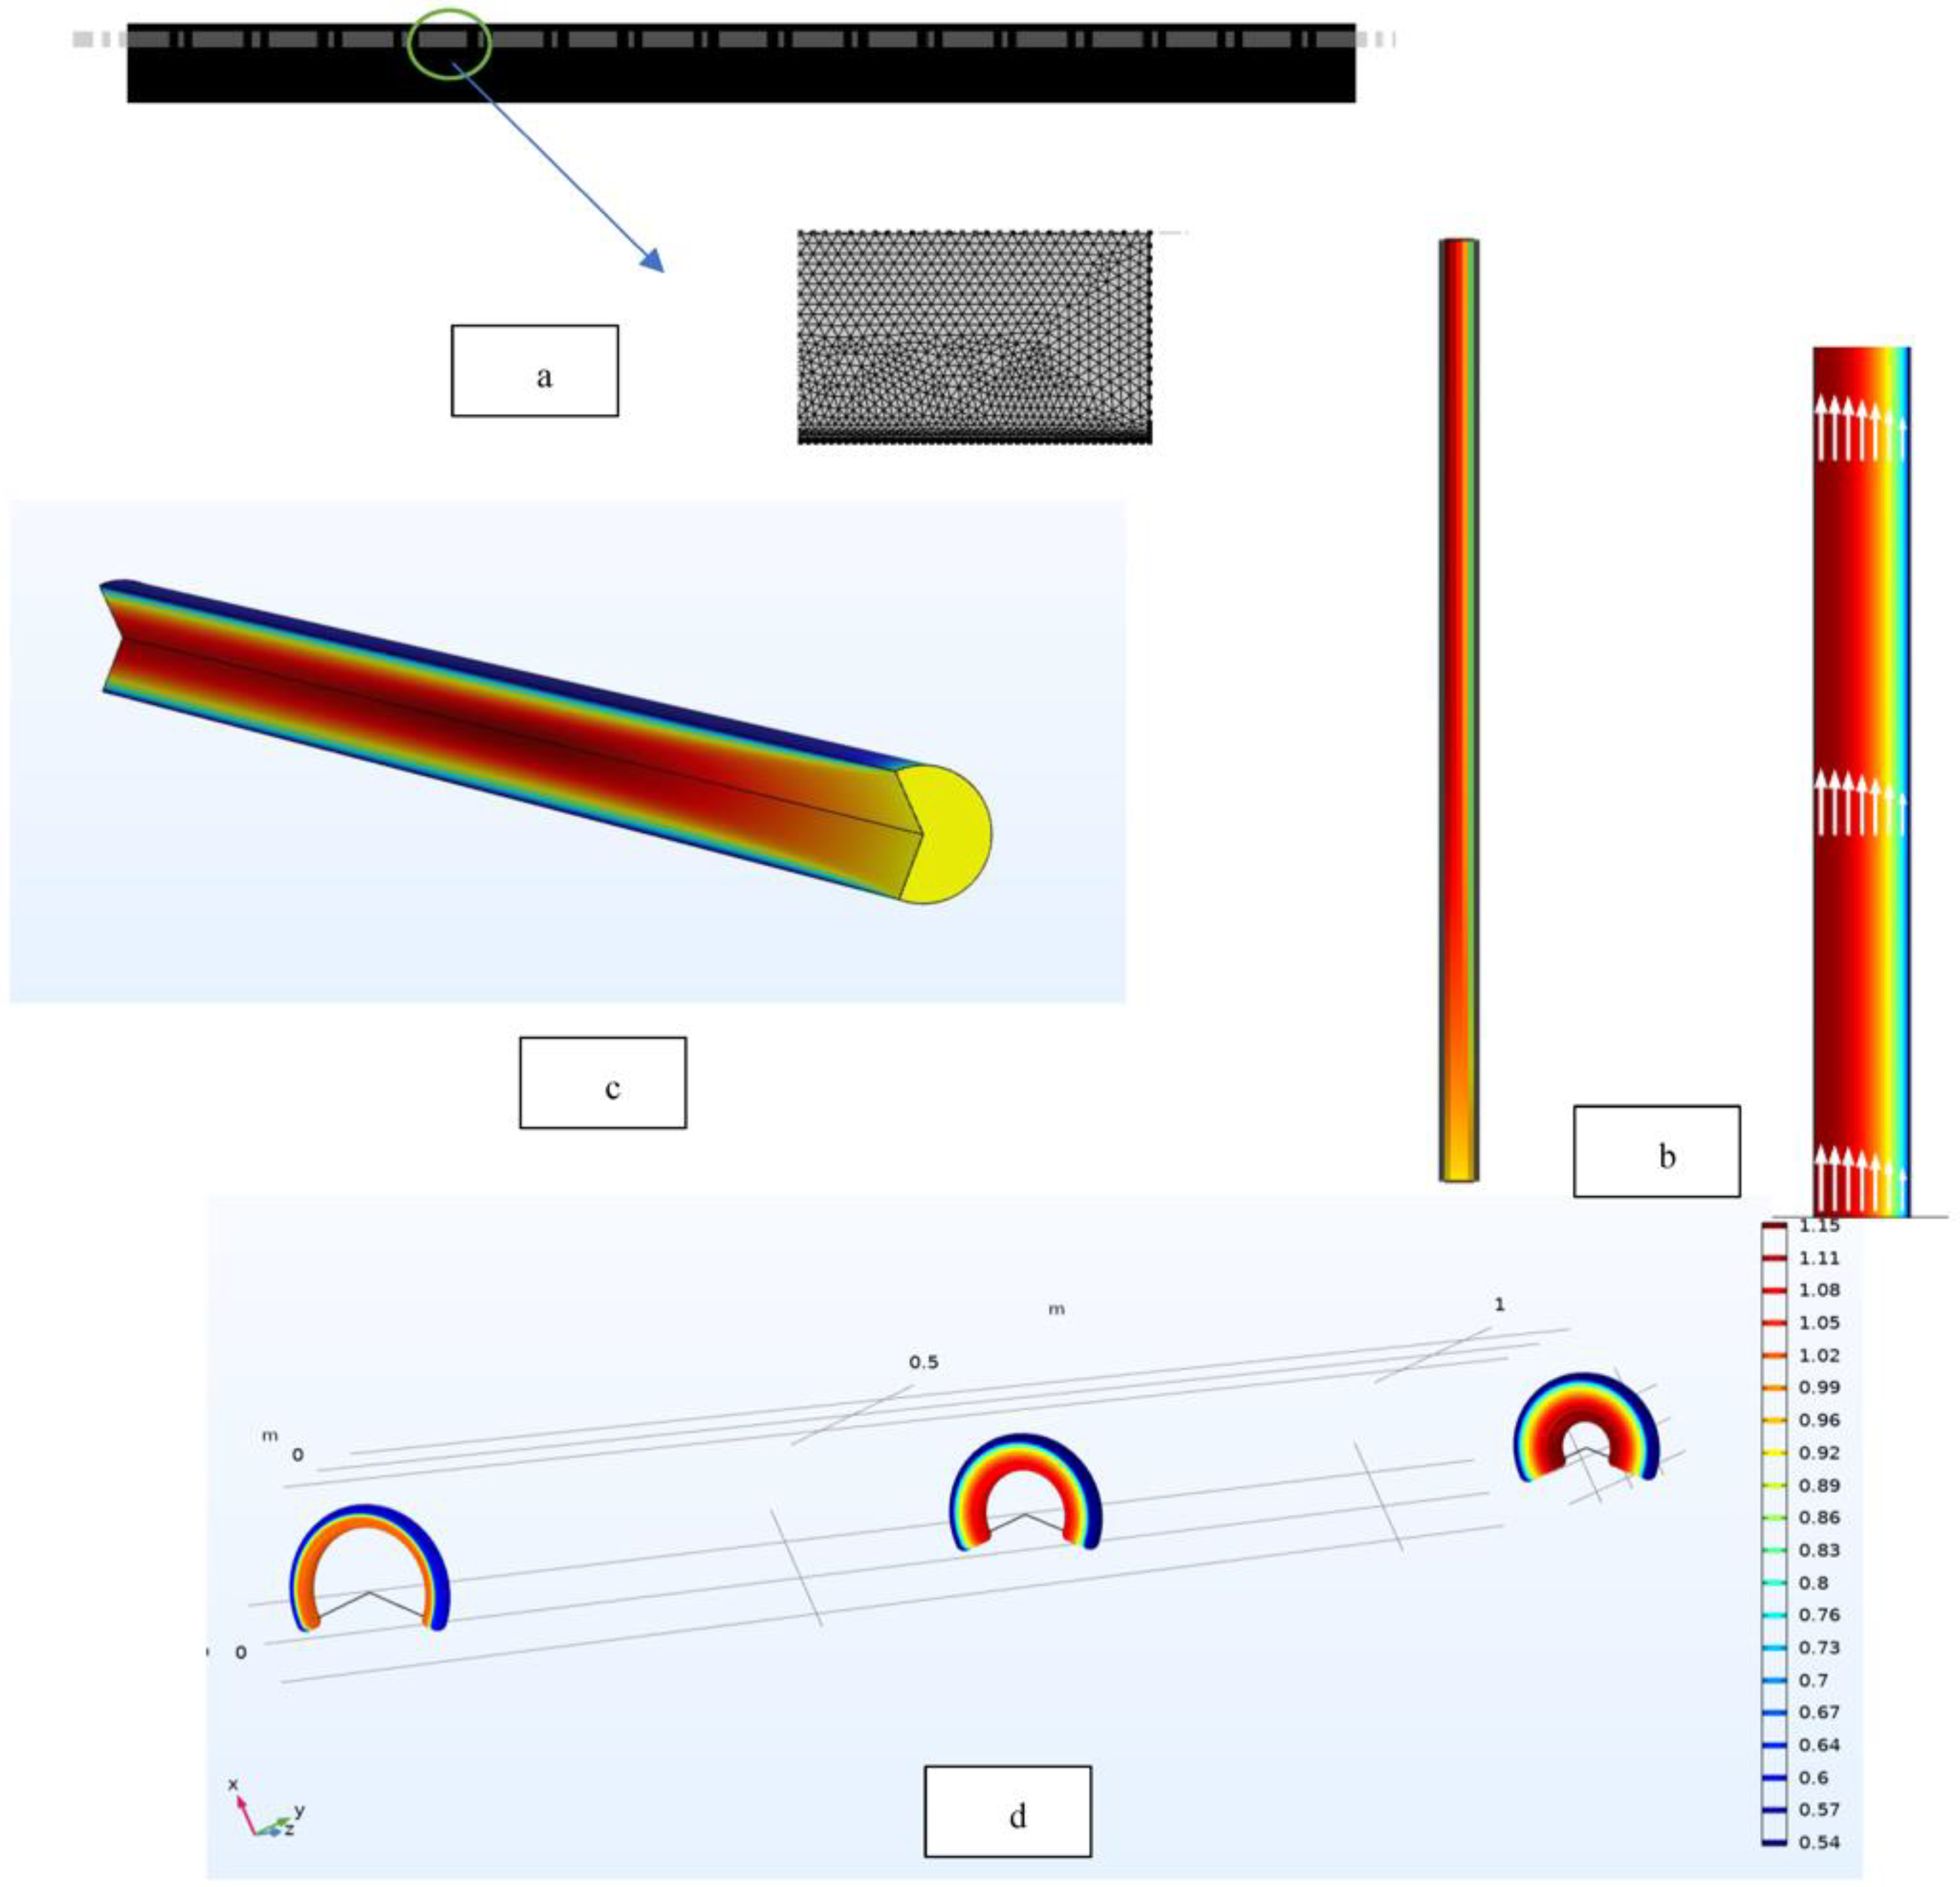
Based on the shapes of the individual pieces, meshes can be categorized into three primary categories: structured, unstructured, and hybrid. Mesh is a crucial component in mathematical computation. It is common knowledge that a finer mesh will produce more precise results, lowering rounding errors to produce a smaller step size. It will increase the accuracy and effectiveness of the interpolation. The pipeline’s actual dimensions, as illustrated in Figure 3a, were used to develop the geometry. The setting of the mesh cell is illustrated in Table 2. The maximum cell size of 0.00142 m, the lowest cell size of 2.03 × 10⁻⁵ m, and the curvature factor of 0.25 were obtained in medium smoothing, and the average skewness of the surface mesh should be as optimal as possible. The total number of elements is presented in Figure 3b for the pipeline mesh.
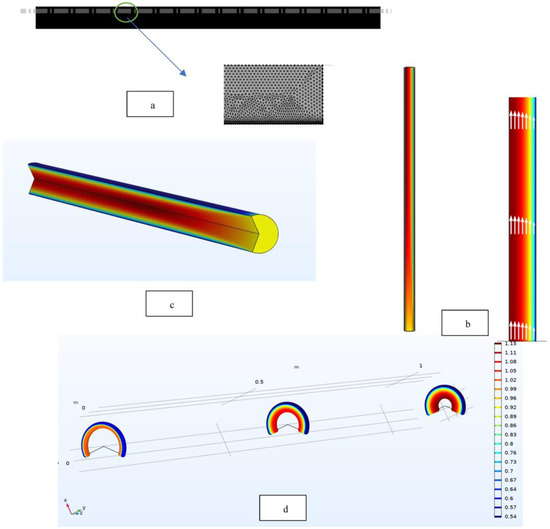
Figure 3.
Dynamic simulation pattern (a) Geometry of the pipeline, (b) Pipeline meshing, (c) Velocity disruption, (d) Velocity development along the 1-m-long pipeline.

Table 2.
The setting of mesh cells.
3.5. Mesh Sensitivity
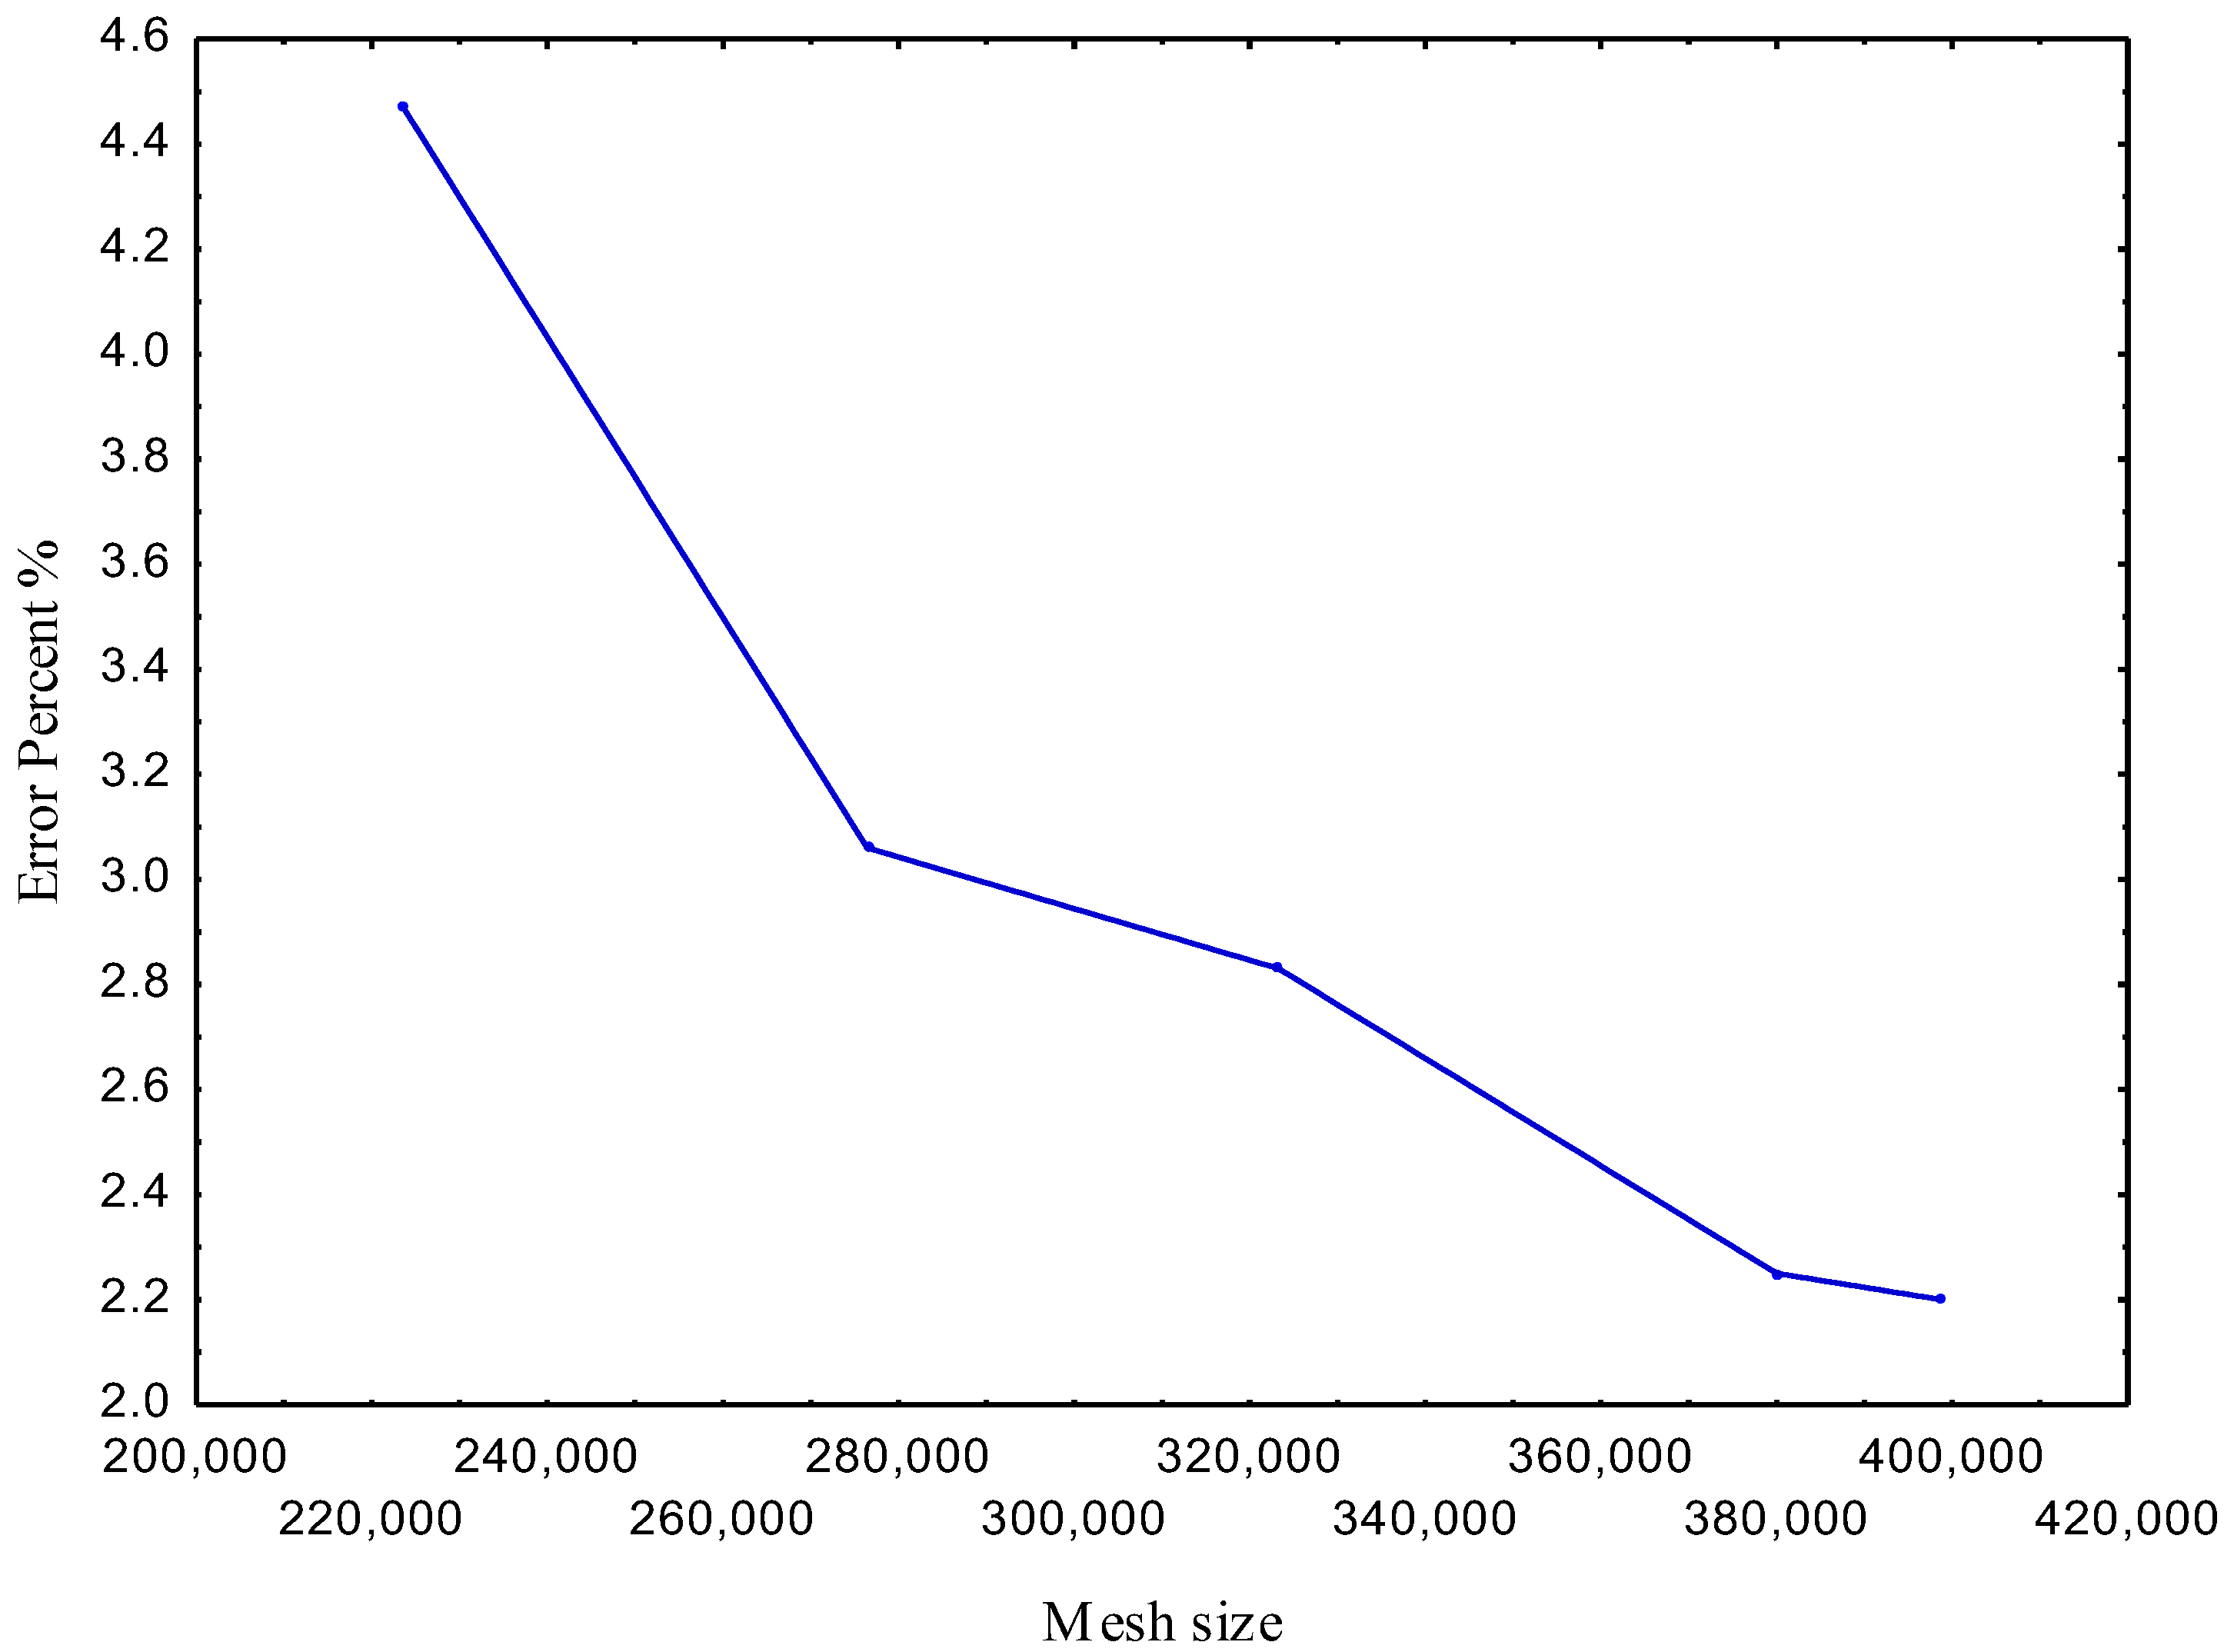
To test the mesh sensitivity, various grid systems were used. The test analysis depended on the percentage error between the experimental and theoretical values of the pressure drop. The mesh number ranged between 230,000 and 400,000. The analysis demonstrated that the results of the pressure drop errors were unaffected by mesh counts greater than 350,000, as shown in Figure 4. Hence, a mesh size of 398,733 was used to obtain more accurate findings.
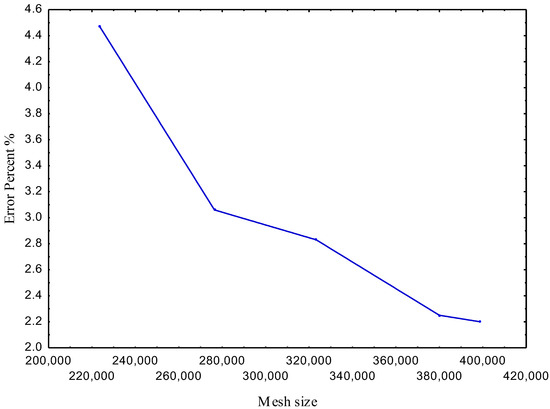
Figure 4.
The mesh sensitivity.
3.6. Numerical Simulation Models
To examine the flow behavior of water in the pipeline with RXGs of various concentrations, the CFD Module of the COMSOL Multiphysics simulation software solver was used in conjunction with the 2D model. The purpose of the CFD Module was to characterize the phase flow’s fluid and the XG polymer. The pressure solvers in the COMSOL Multiphysics settings use an absolute velocity formulation. A model is a common model with an easy solution formula. The implementation of the level set model included the first-order turbulent kinetics, standard pressure discretization, and second-order upwind momentum. Due to the solubility of xanthan gums in water, it is believed that they are in equilibrium with the fluid phase. A single-phase Navier–Stokes equation may be applied, and the relative velocity between phases can be ignored. Experimental measurements were made and incorporated into the model to determine the liquid characteristics for water with the modified XG mixtures and the viscosities of the solution at each concentration. In total, 398,733 degrees of freedom were resolved (plus 1 internal DOF).
4. Results and Discussion
4.1. Experimental Results
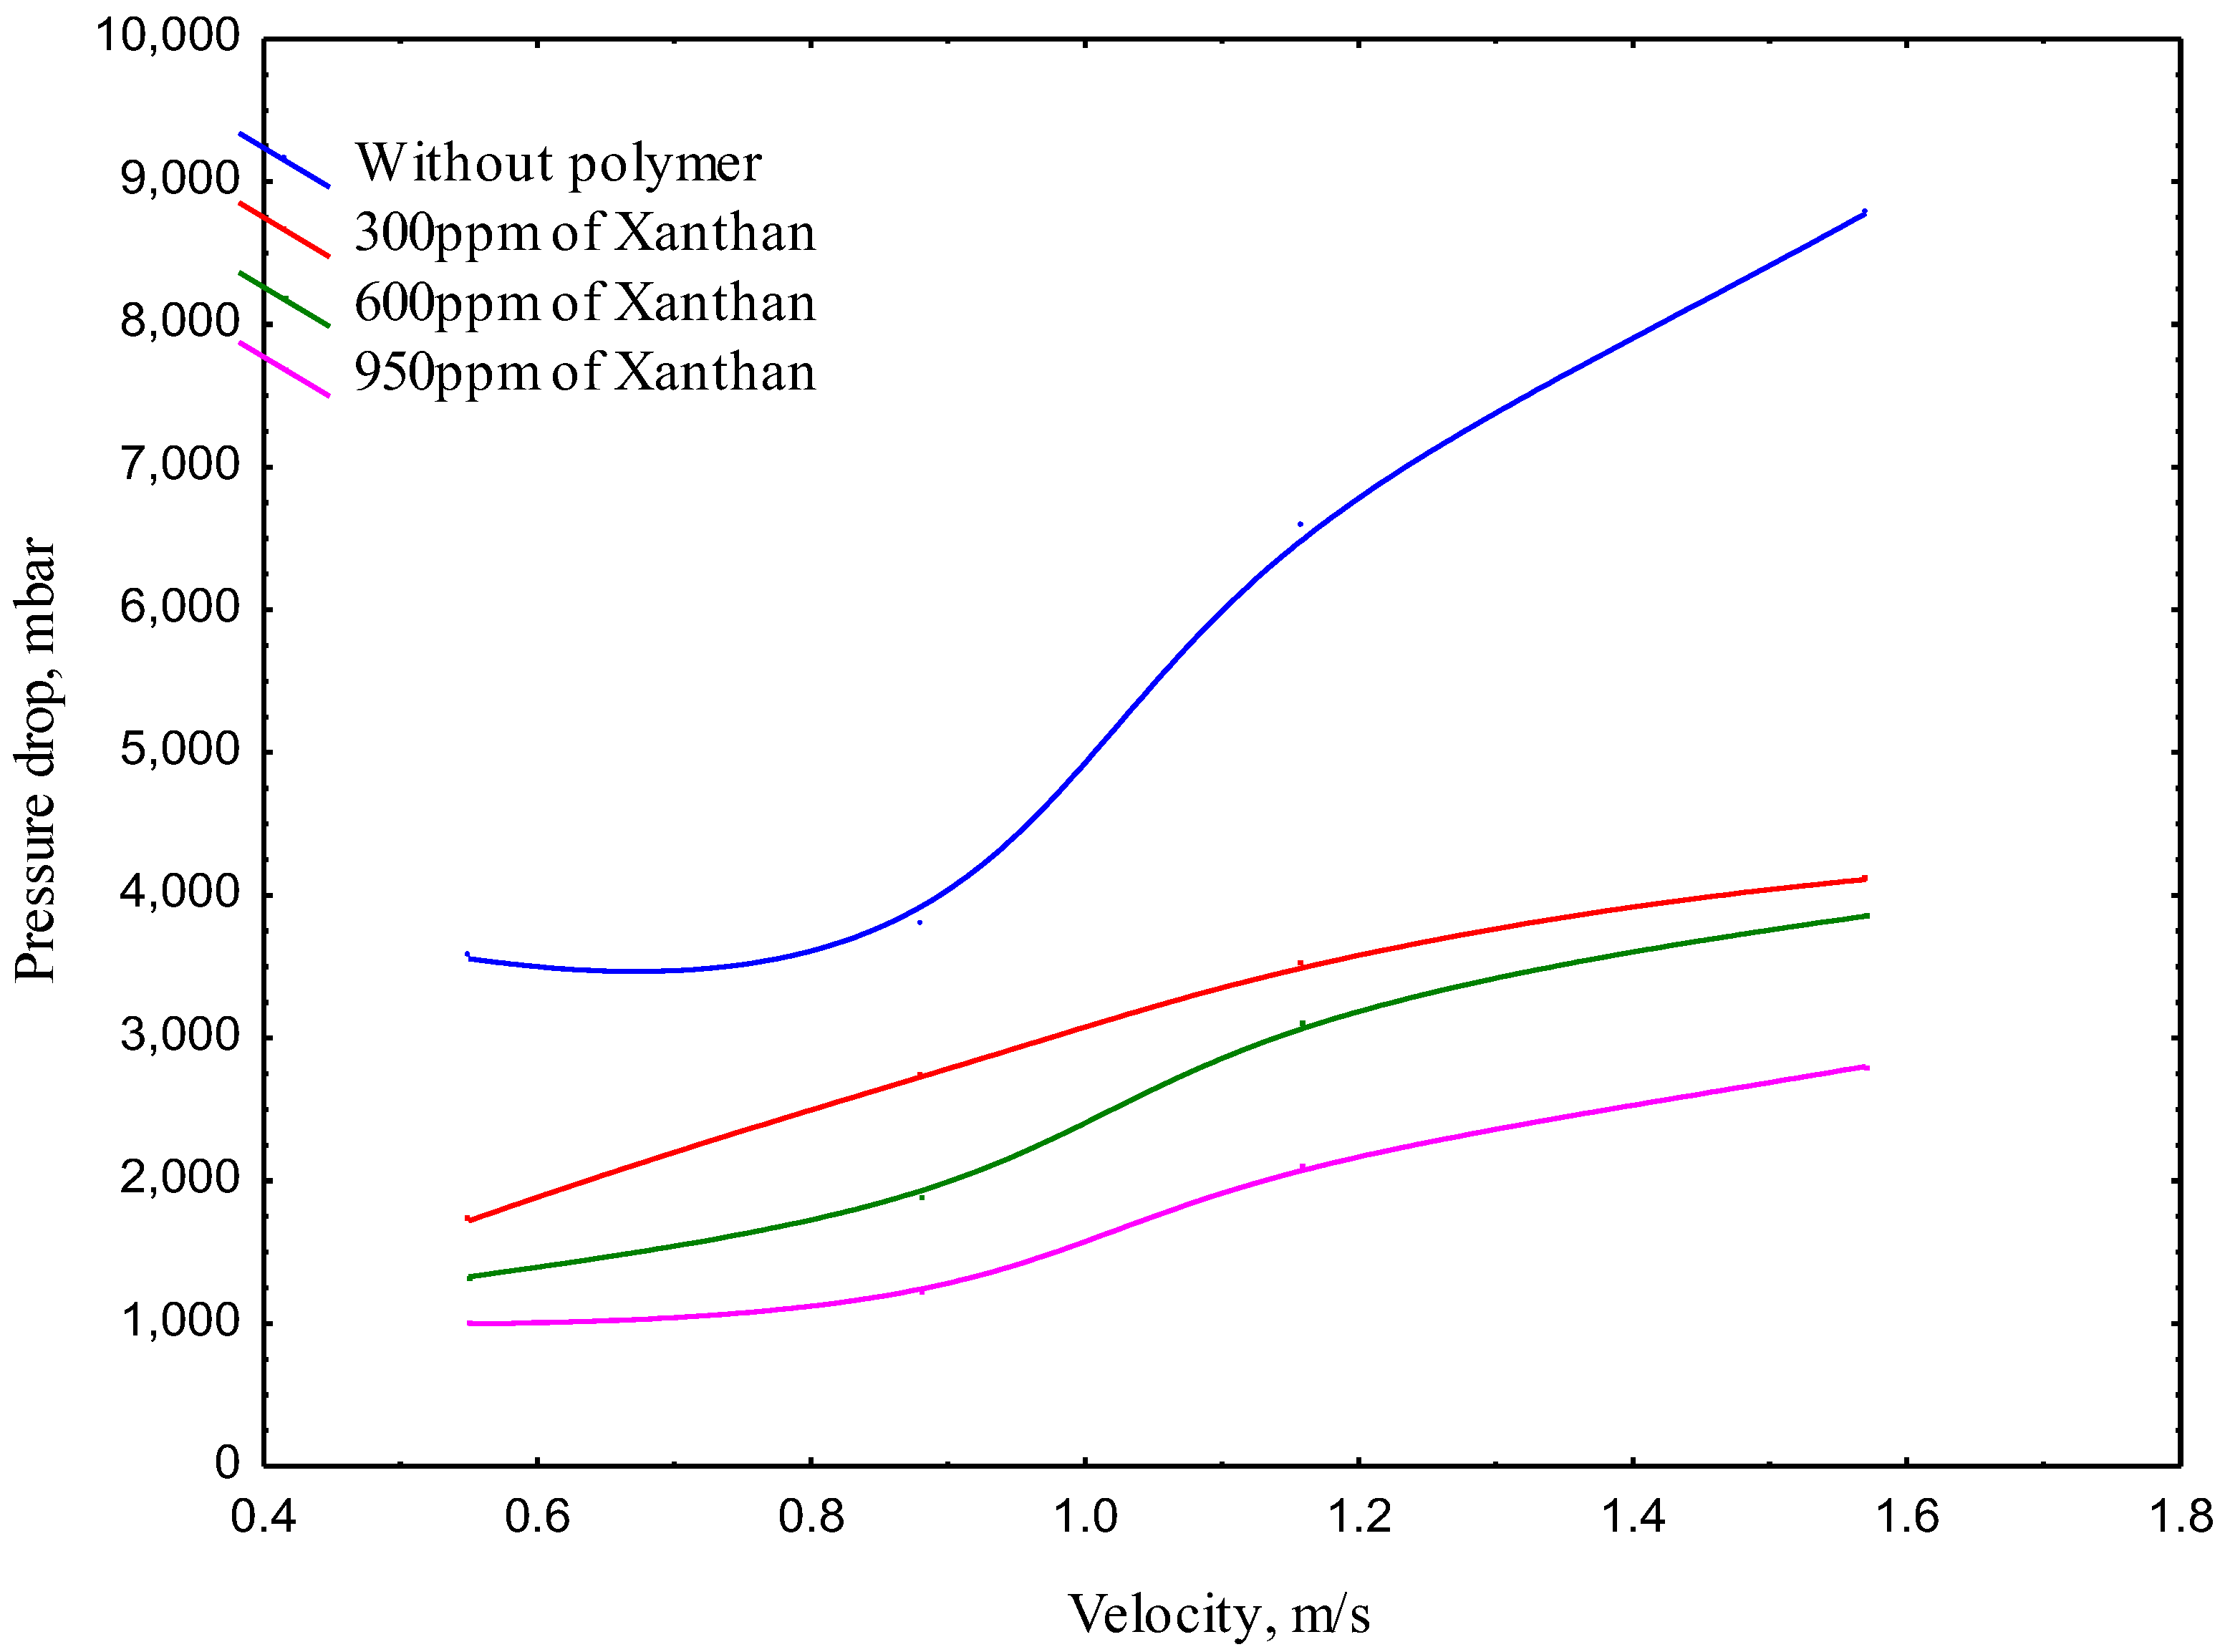
The DRP used in this study was a modified XG mixture. Three xanthan gum concentrations were evaluated for their drag-reduction effect. The experimental results of the pressure drop values along the total length of the pipe with and without the modified XG mixture are shown in Figure 5. The figure clearly shows that with an increase in the velocity of the mixture from 0.55 m/s to 1.57 m/s, the pressure drop decreased from 3562 mbar to 1720 mbar for 300ppm addition and the same trend as that of other additives. This was due to the increasing kinetic energy of the liquid inside the pipe, especially near the wall, which led to an increase in the pressure drop.
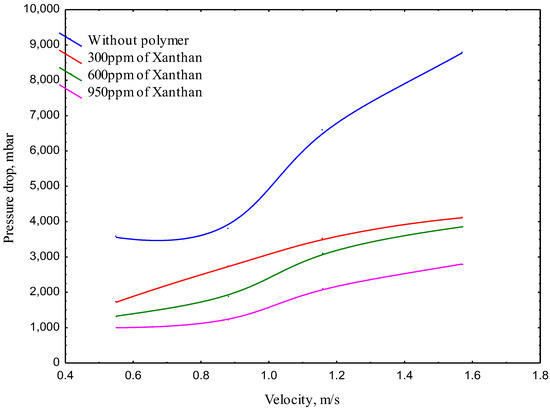
Figure 5.
The pressure drop with different xanthan concentrations and water velocities.
Polymer addition caused a decrease in the pressure drop at all concentrations. The mechanism can be explained according to elastic theory. In other words, the high kinetic energy of the turbulent flow near the wall will be adsorbed by polymer molecules and converted into elastic energy, and this elastic energy near the wall will be lifted by the wall vortices and dissipated in the buffer region. Hence, the polymer actively affects the energy system. Thus, to transfer the elastic energy from the near-wall, the polymer should be long enough to transfer the elastic energy into the buffer region.
The drag reduction effect of the modified XG mixture concentrations of 300, 600, and 950 ppm was determined using Equation (13)
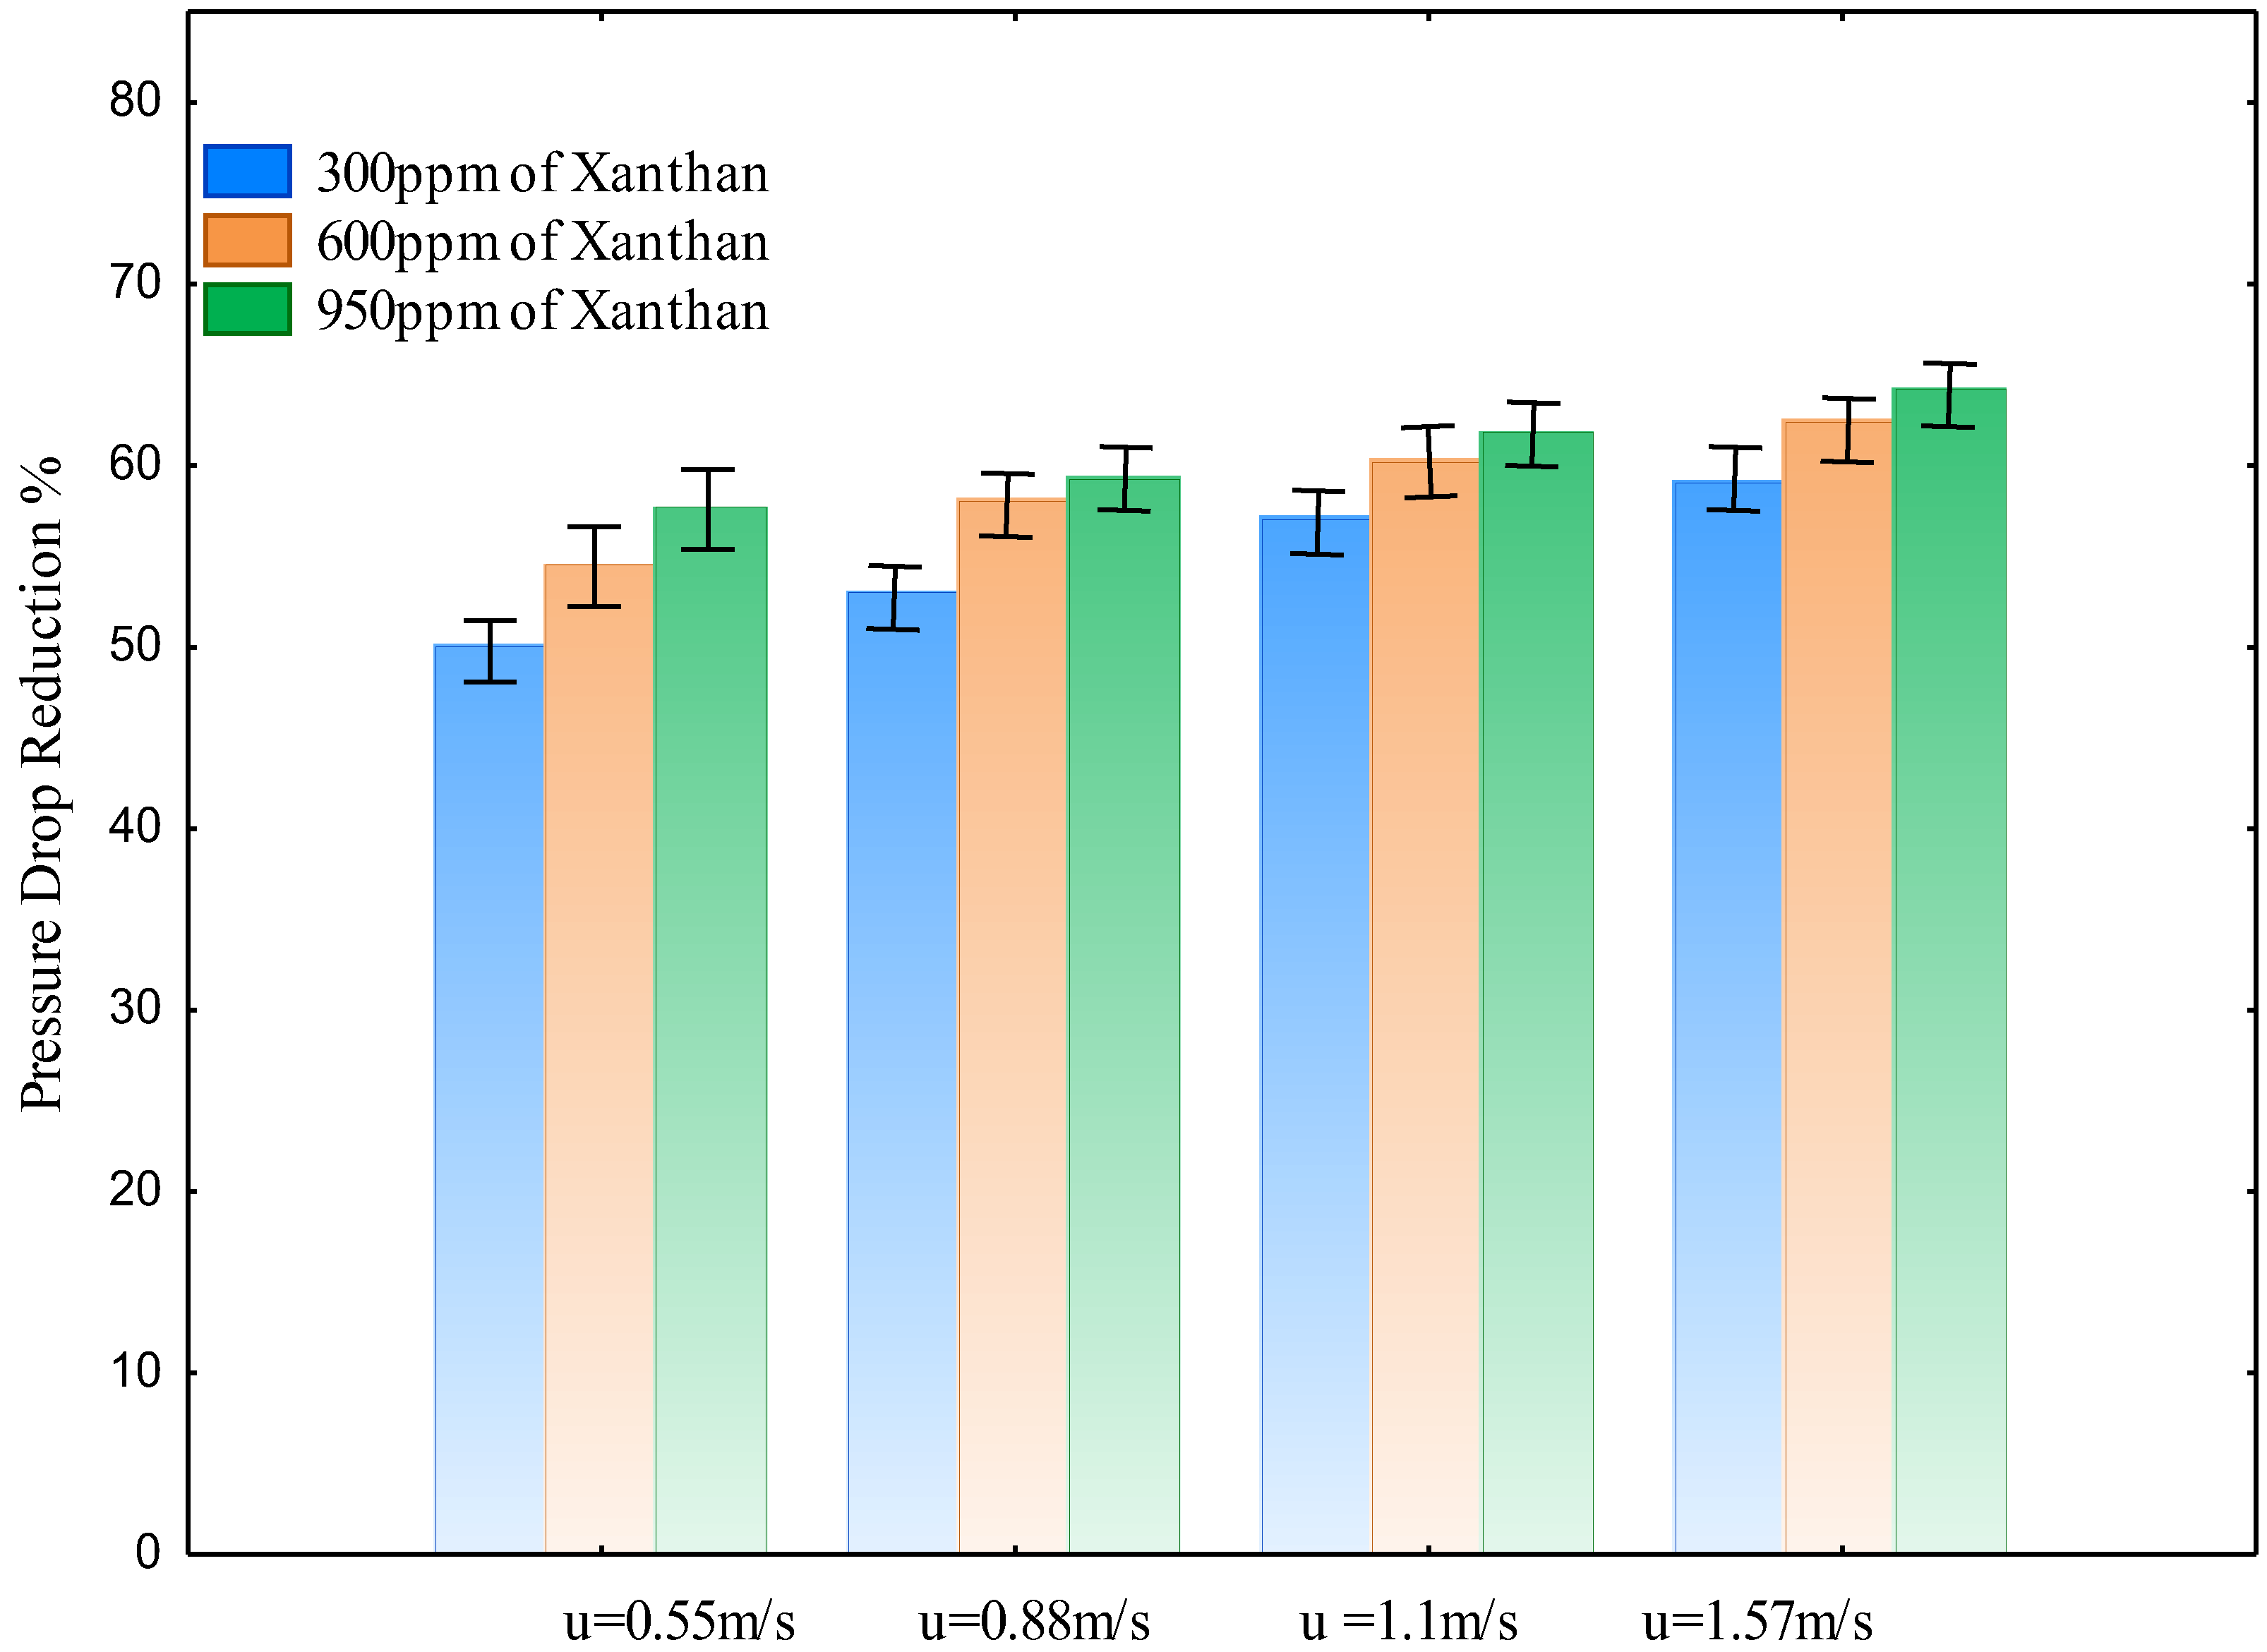
The results are shown in Figure 6. The figure shows that the 300 and 950 ppm XGs had obvious drag reduction effects in increasing the pressure drop reduction. This increase can occur with the use of a smaller pump to transport the same amount of mixture.
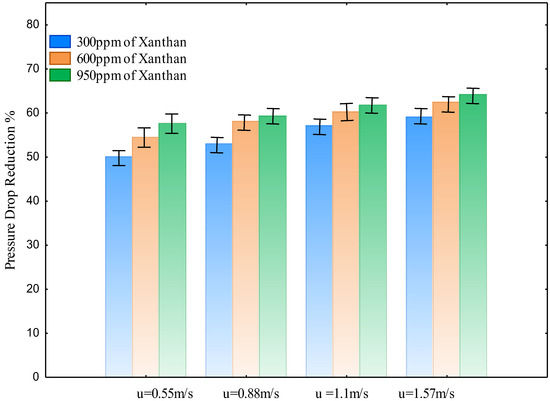
Figure 6.
The pressure drop reduction with different xanthan concentrations and water velocities.
The mechanism of drag reduction can be explained according to [22], in which the polymer molecules are stretched by the high flow. Under this particular condition, the turbulent structures interact with the molecules, causing a decrease in the pressure drop and an increase in the drag reduction.
Further, the increase in pressure drop saving increased with increasing total mixture velocity for all concentrations of the polymer, which means that the activity of these additives increases with increasing velocity, and this might be due to their effect on the wall shear. A similar finding was reported by [23,24], who showed that increasing velocity resulted in increasing drag reduction.
The increase in the pressure drop reduction varied with concentration: 950 ppm resulted in a higher value in the pressure drop reduction at all values of velocity (58–65)%, which could be due to the strong emulation that this concentration can cause. However, 300 ppm of XGs resulted in a lower value of reduction (50–59)% at all velocity ranges, while the use of 600 ppm resulted in a reduction of (54–62)%. Based on the experimental results, the polymer with a concentration of 950 ppm was selected. This result is similar to other workers who showed that an increase in the polymer concentration causes an increase in the reducing pressure drop [25,26]. However, this result differs from that obtained by [27], who showed a decrease in reduction with an increase in the polymer addition, which may be due to the type of polymer used.
4.2. Simulation Results
4.2.1. Velocity Distribution
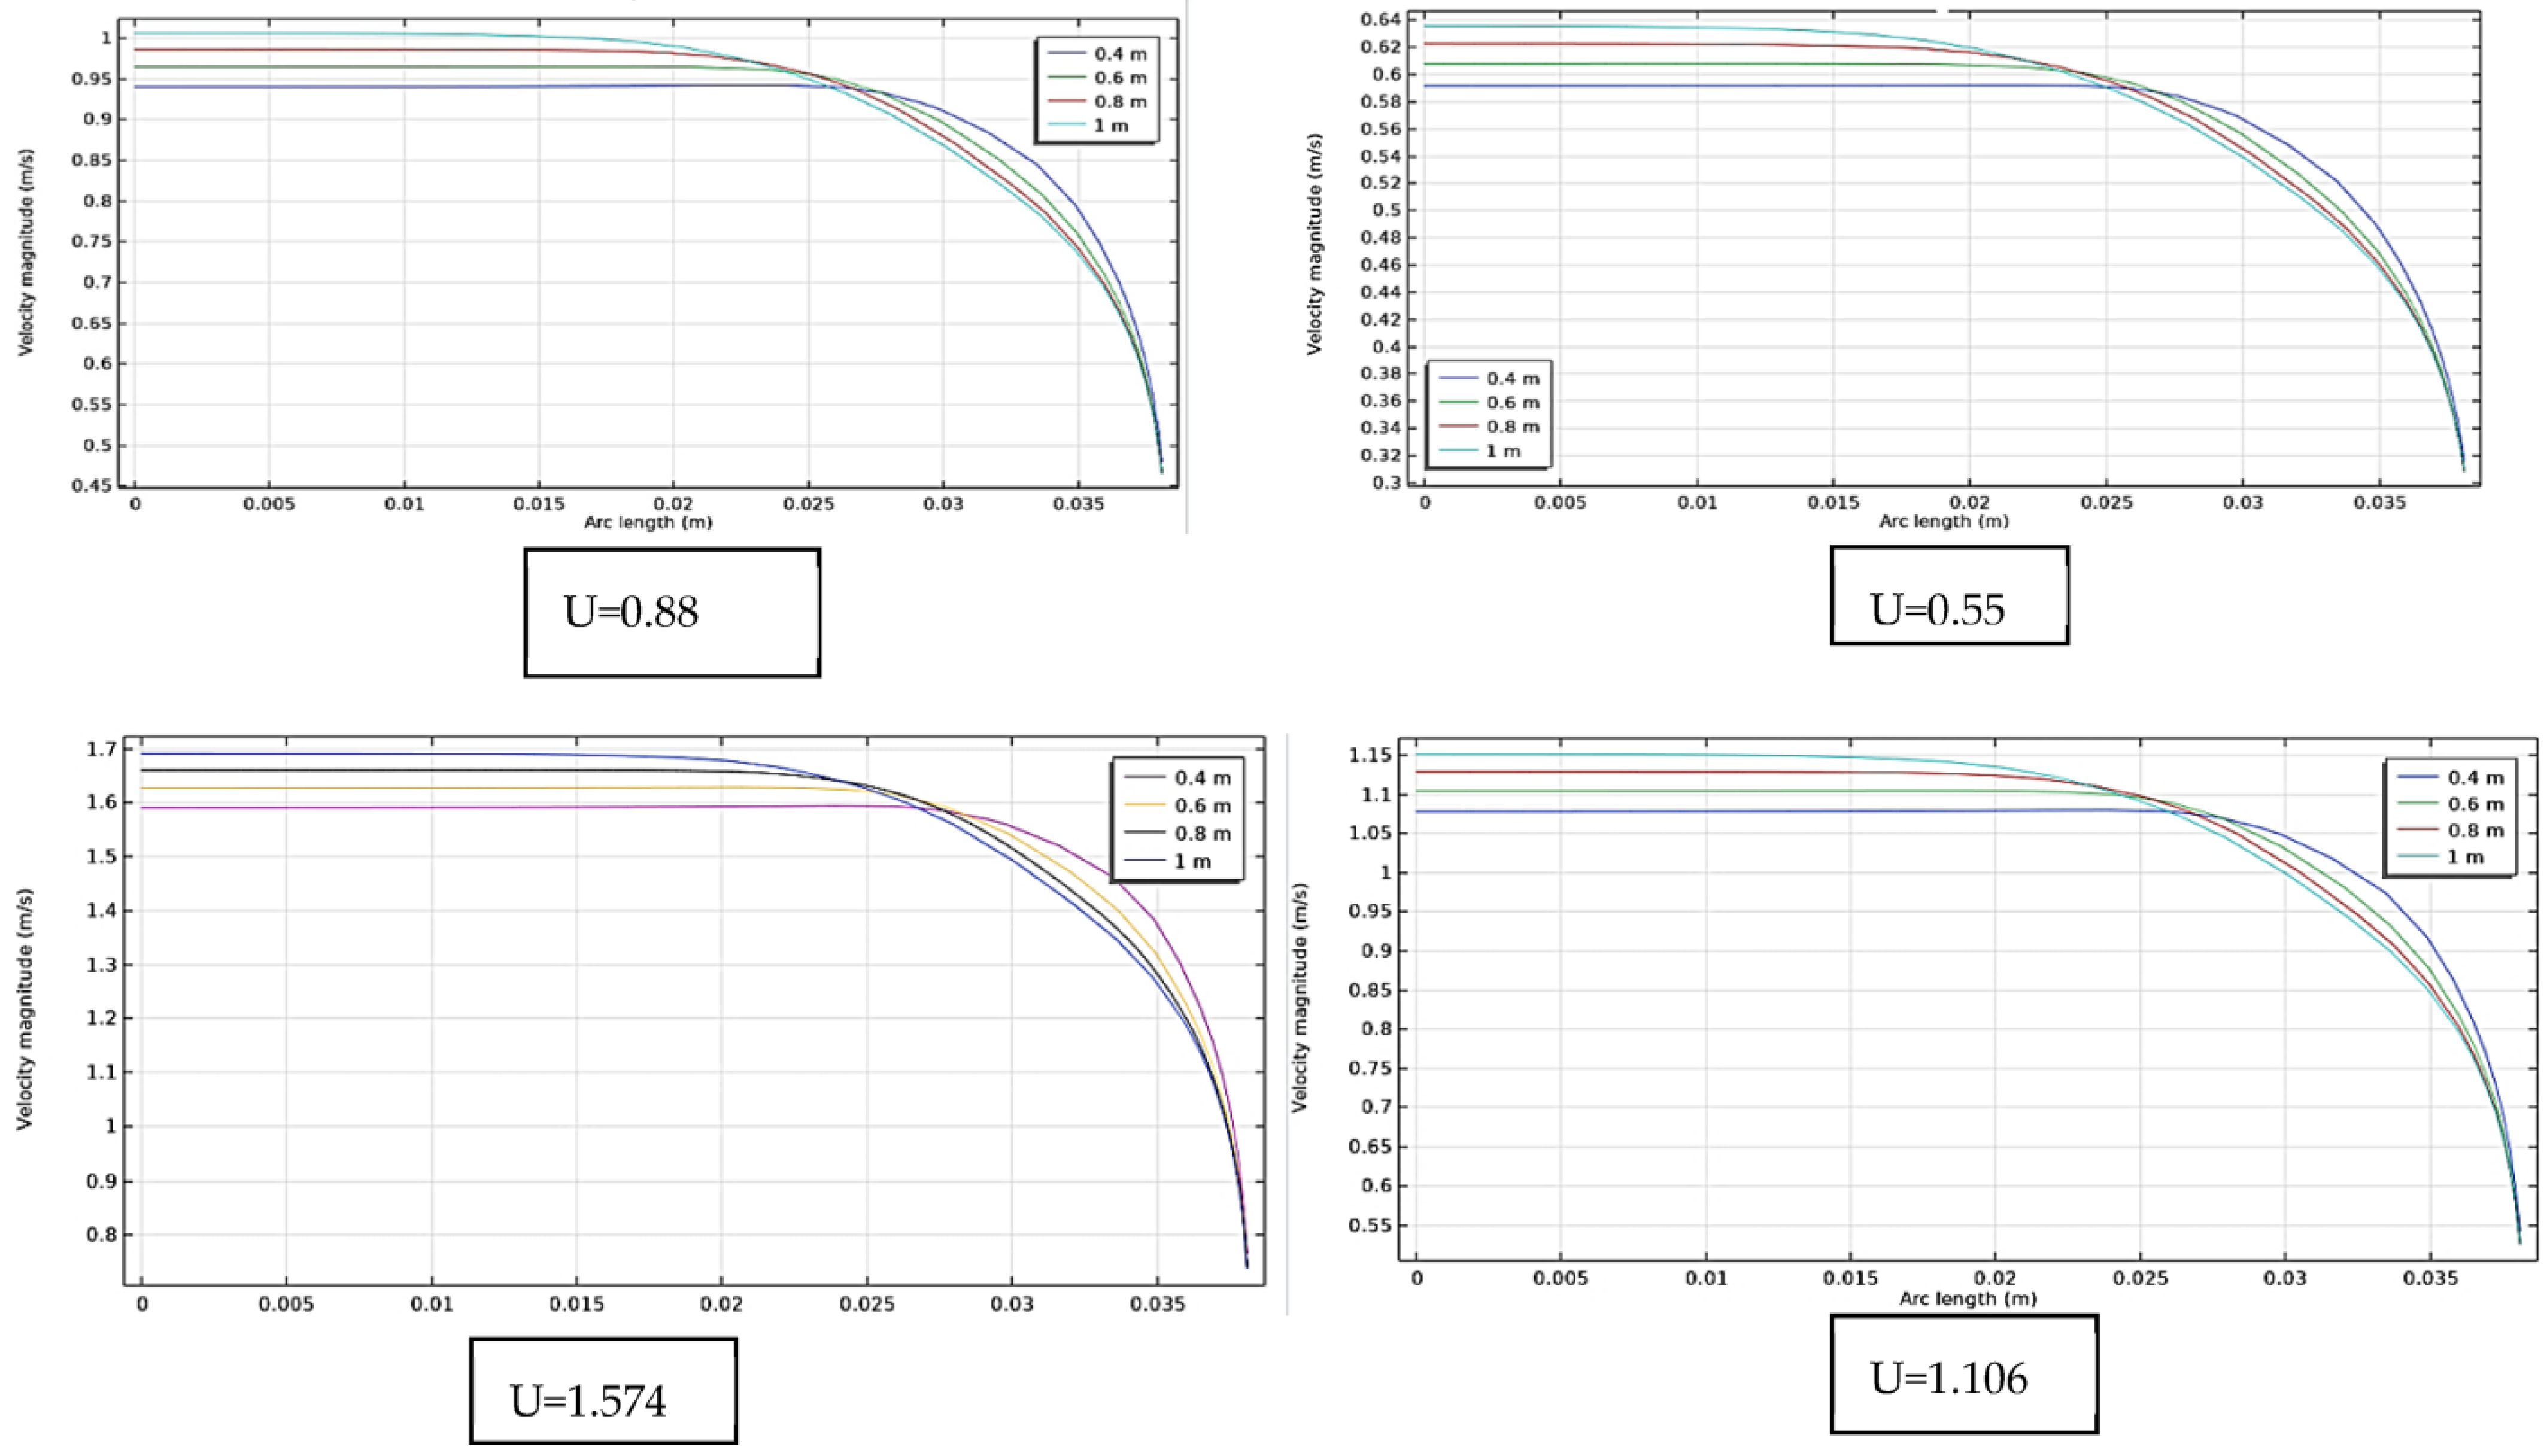
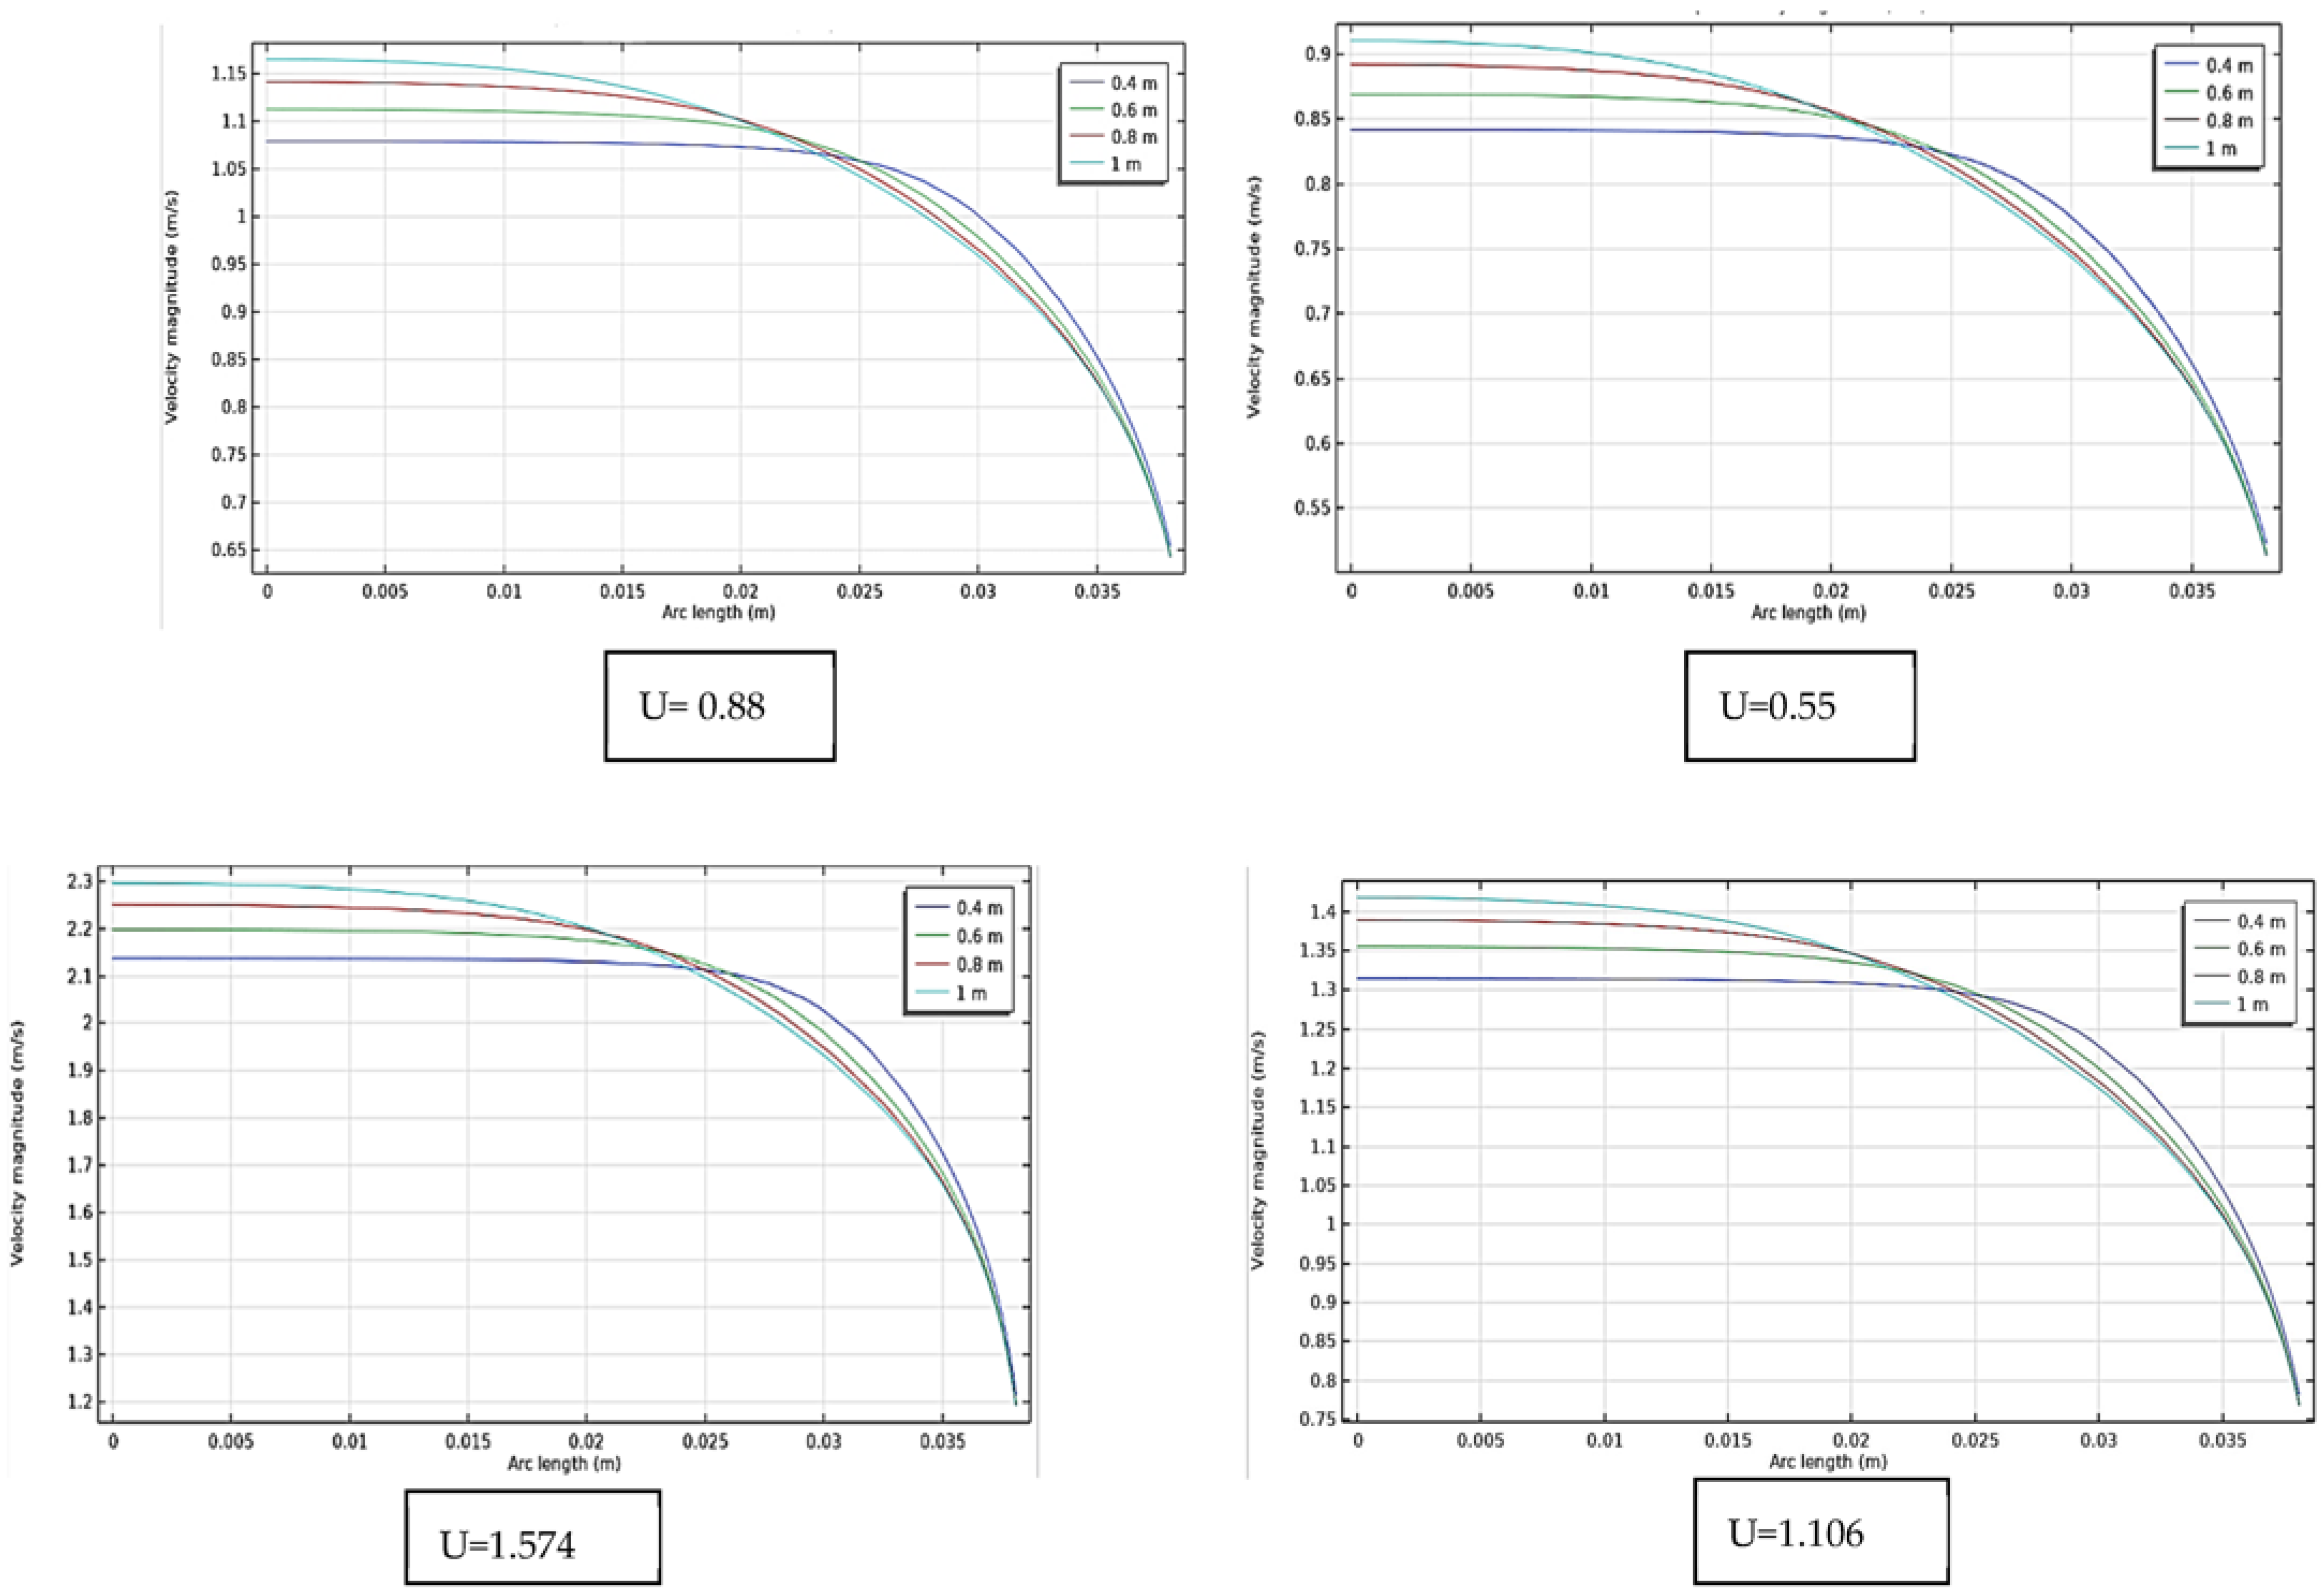
The COMSOL Multiphysics simulation created the velocity distribution variation throughout the pipe for all modified XG mixture concentrations, and the results are depicted in Figure 7, Figure 8, Figure 9 and Figure 10. Figure 7a–d shows the velocity behavior of flow at different positions inside the pipeline, namely (0.4, 0.6, 0.8, 1 m) and four different flow speeds, namely (0.55, 0.88, 1.106, 1.574 m/s) without additives. There were distinct changes in the velocity magnitudes at each flow speed, where the velocity magnitudes increased as the flow speed increased, versus differences in the length’s positions.
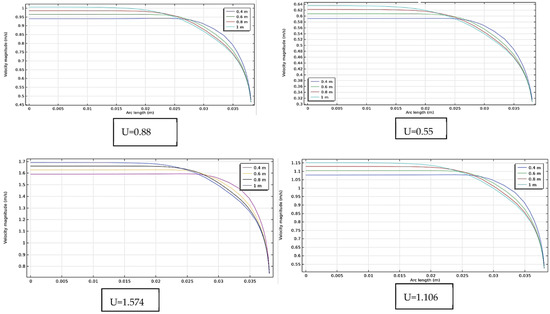
Figure 7.
Velocity variation along the 1-m-long pipeline without XGs.
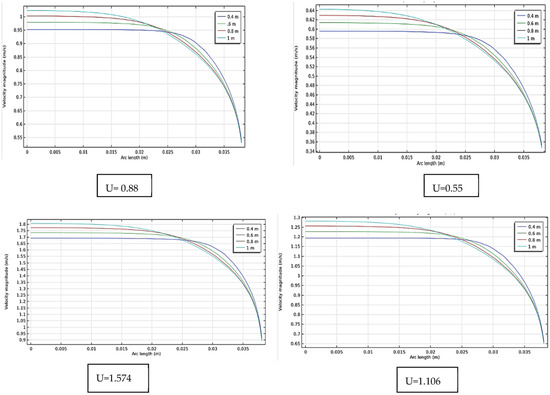
Figure 8.
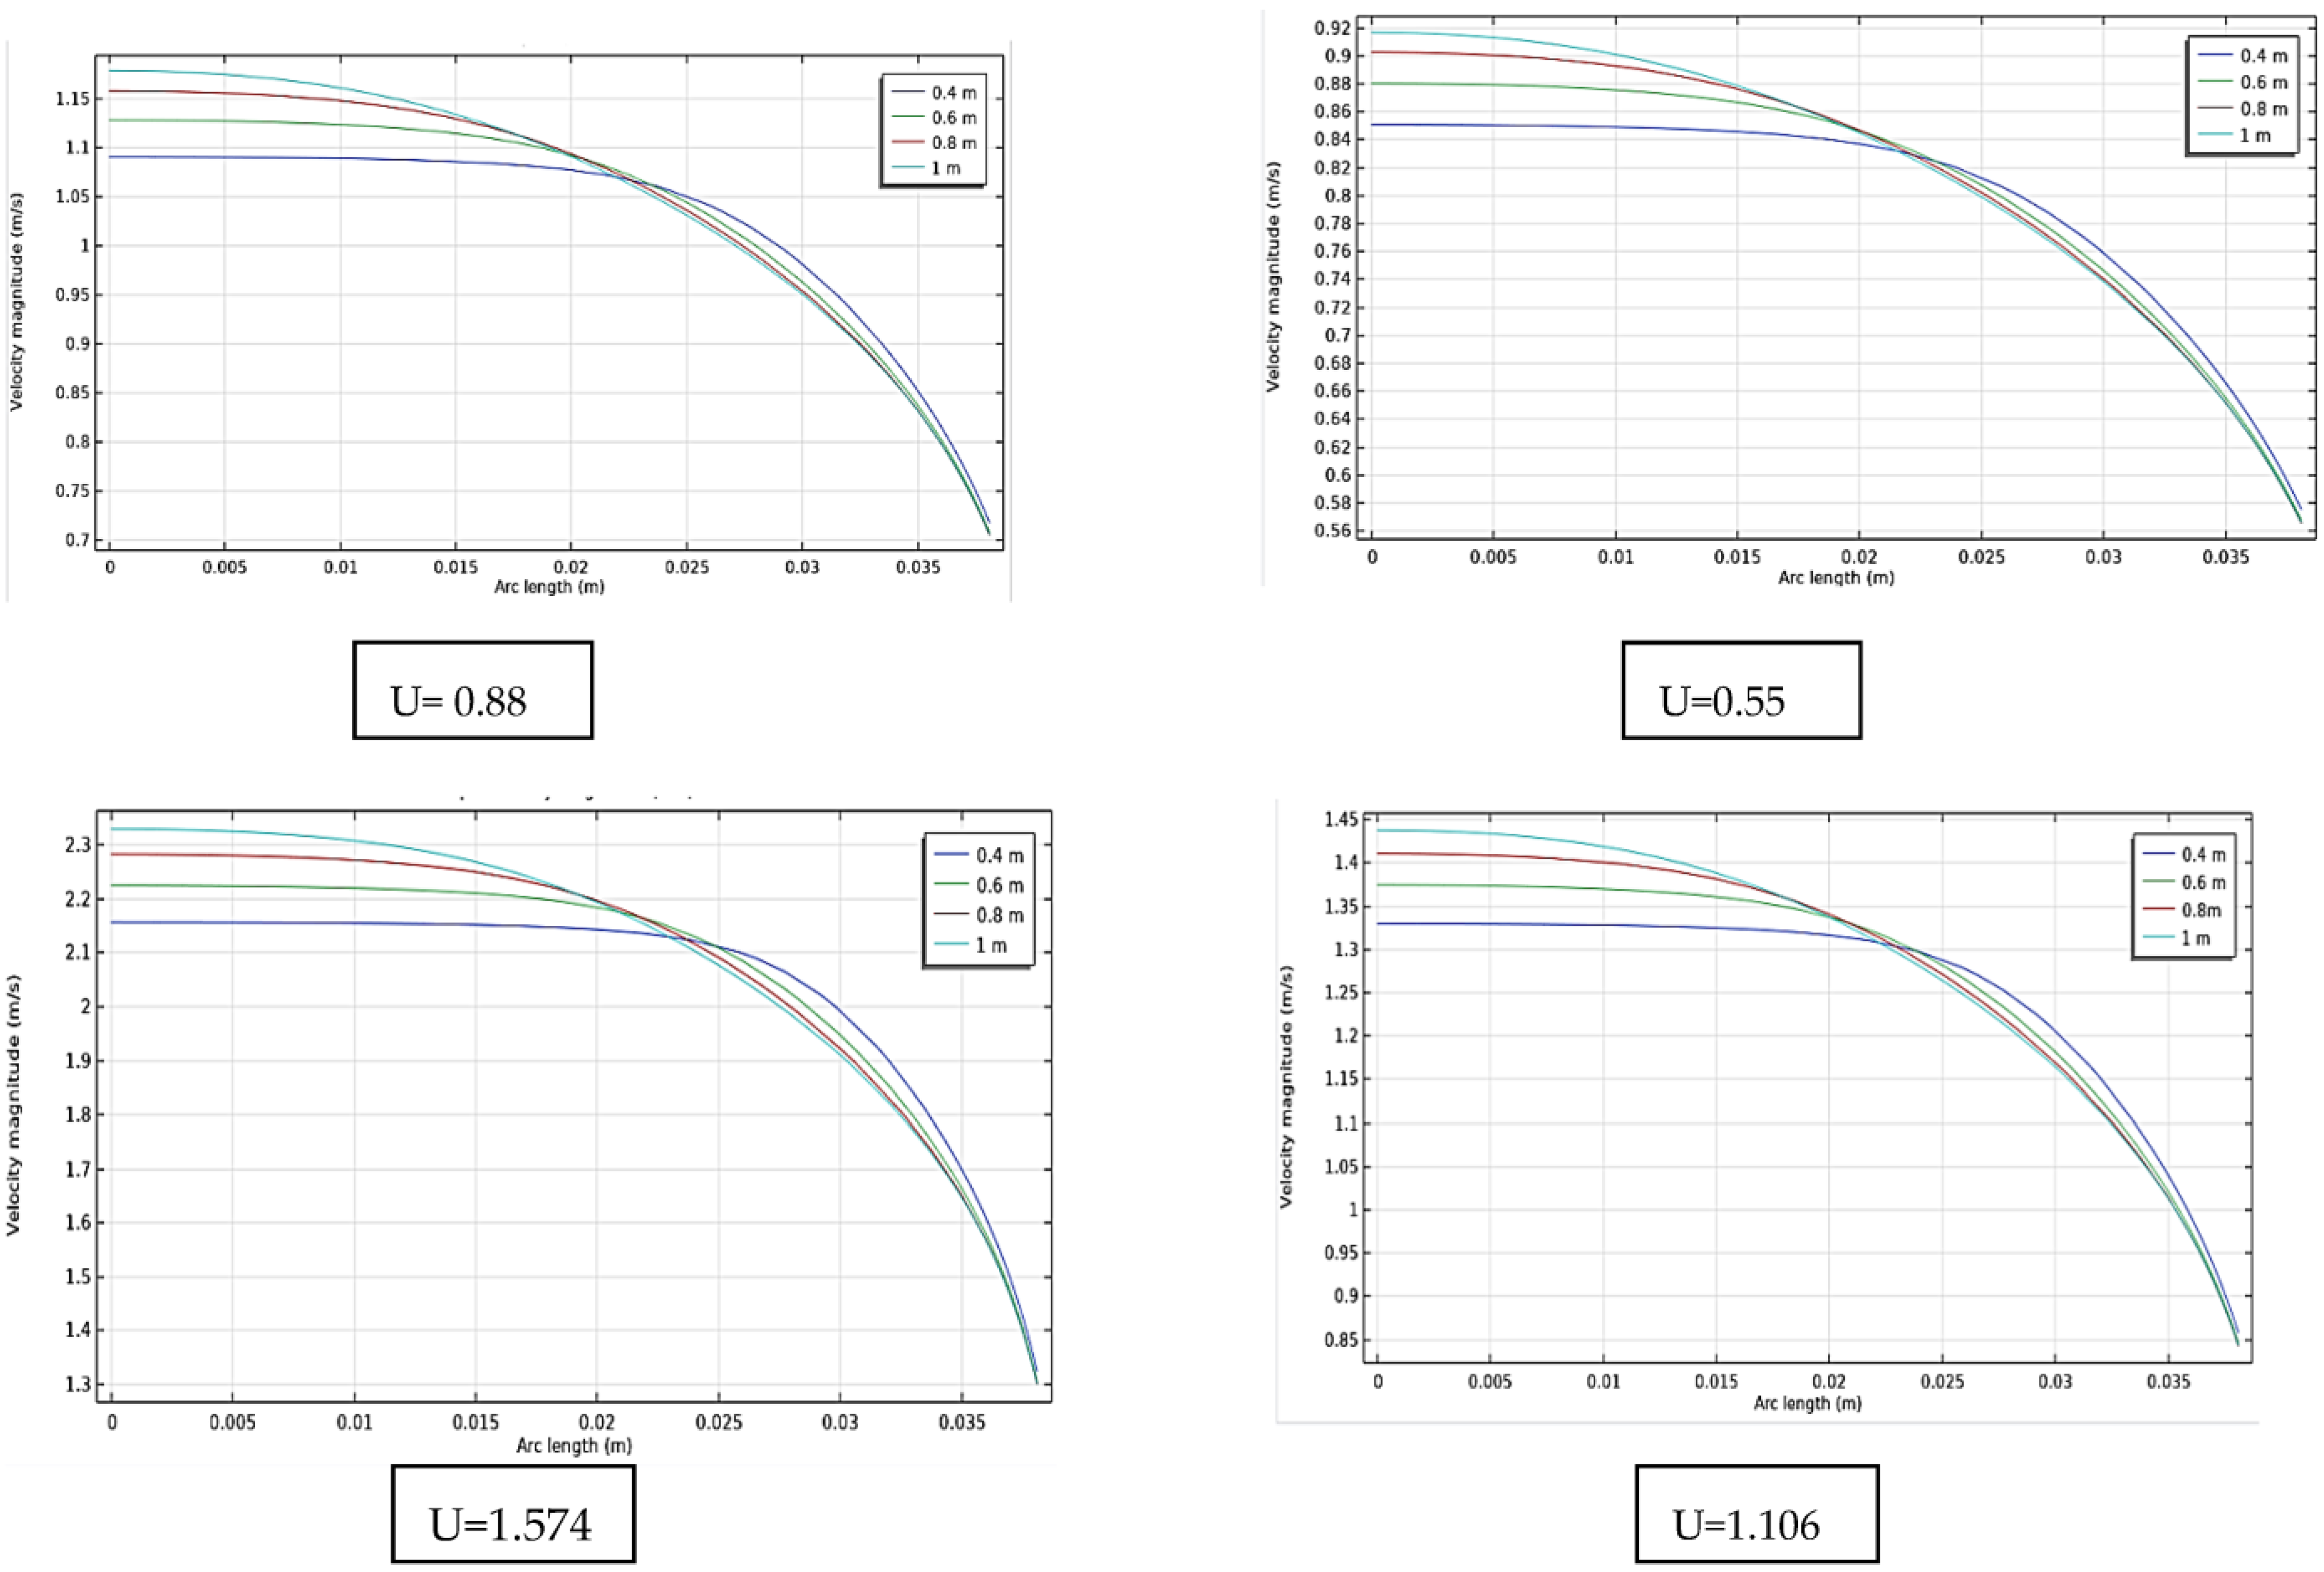
Velocity variation along the 1-m-long pipeline with 300 ppm XGs.
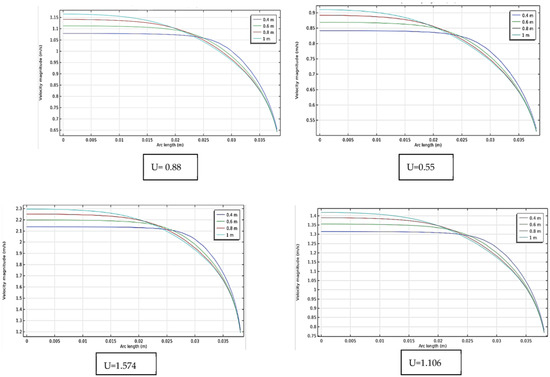
Figure 9.
Velocity variation along the 1-m-long pipeline with 600 ppm XGs.
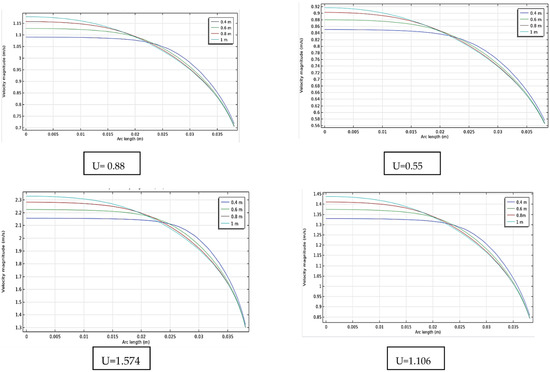
Figure 10.
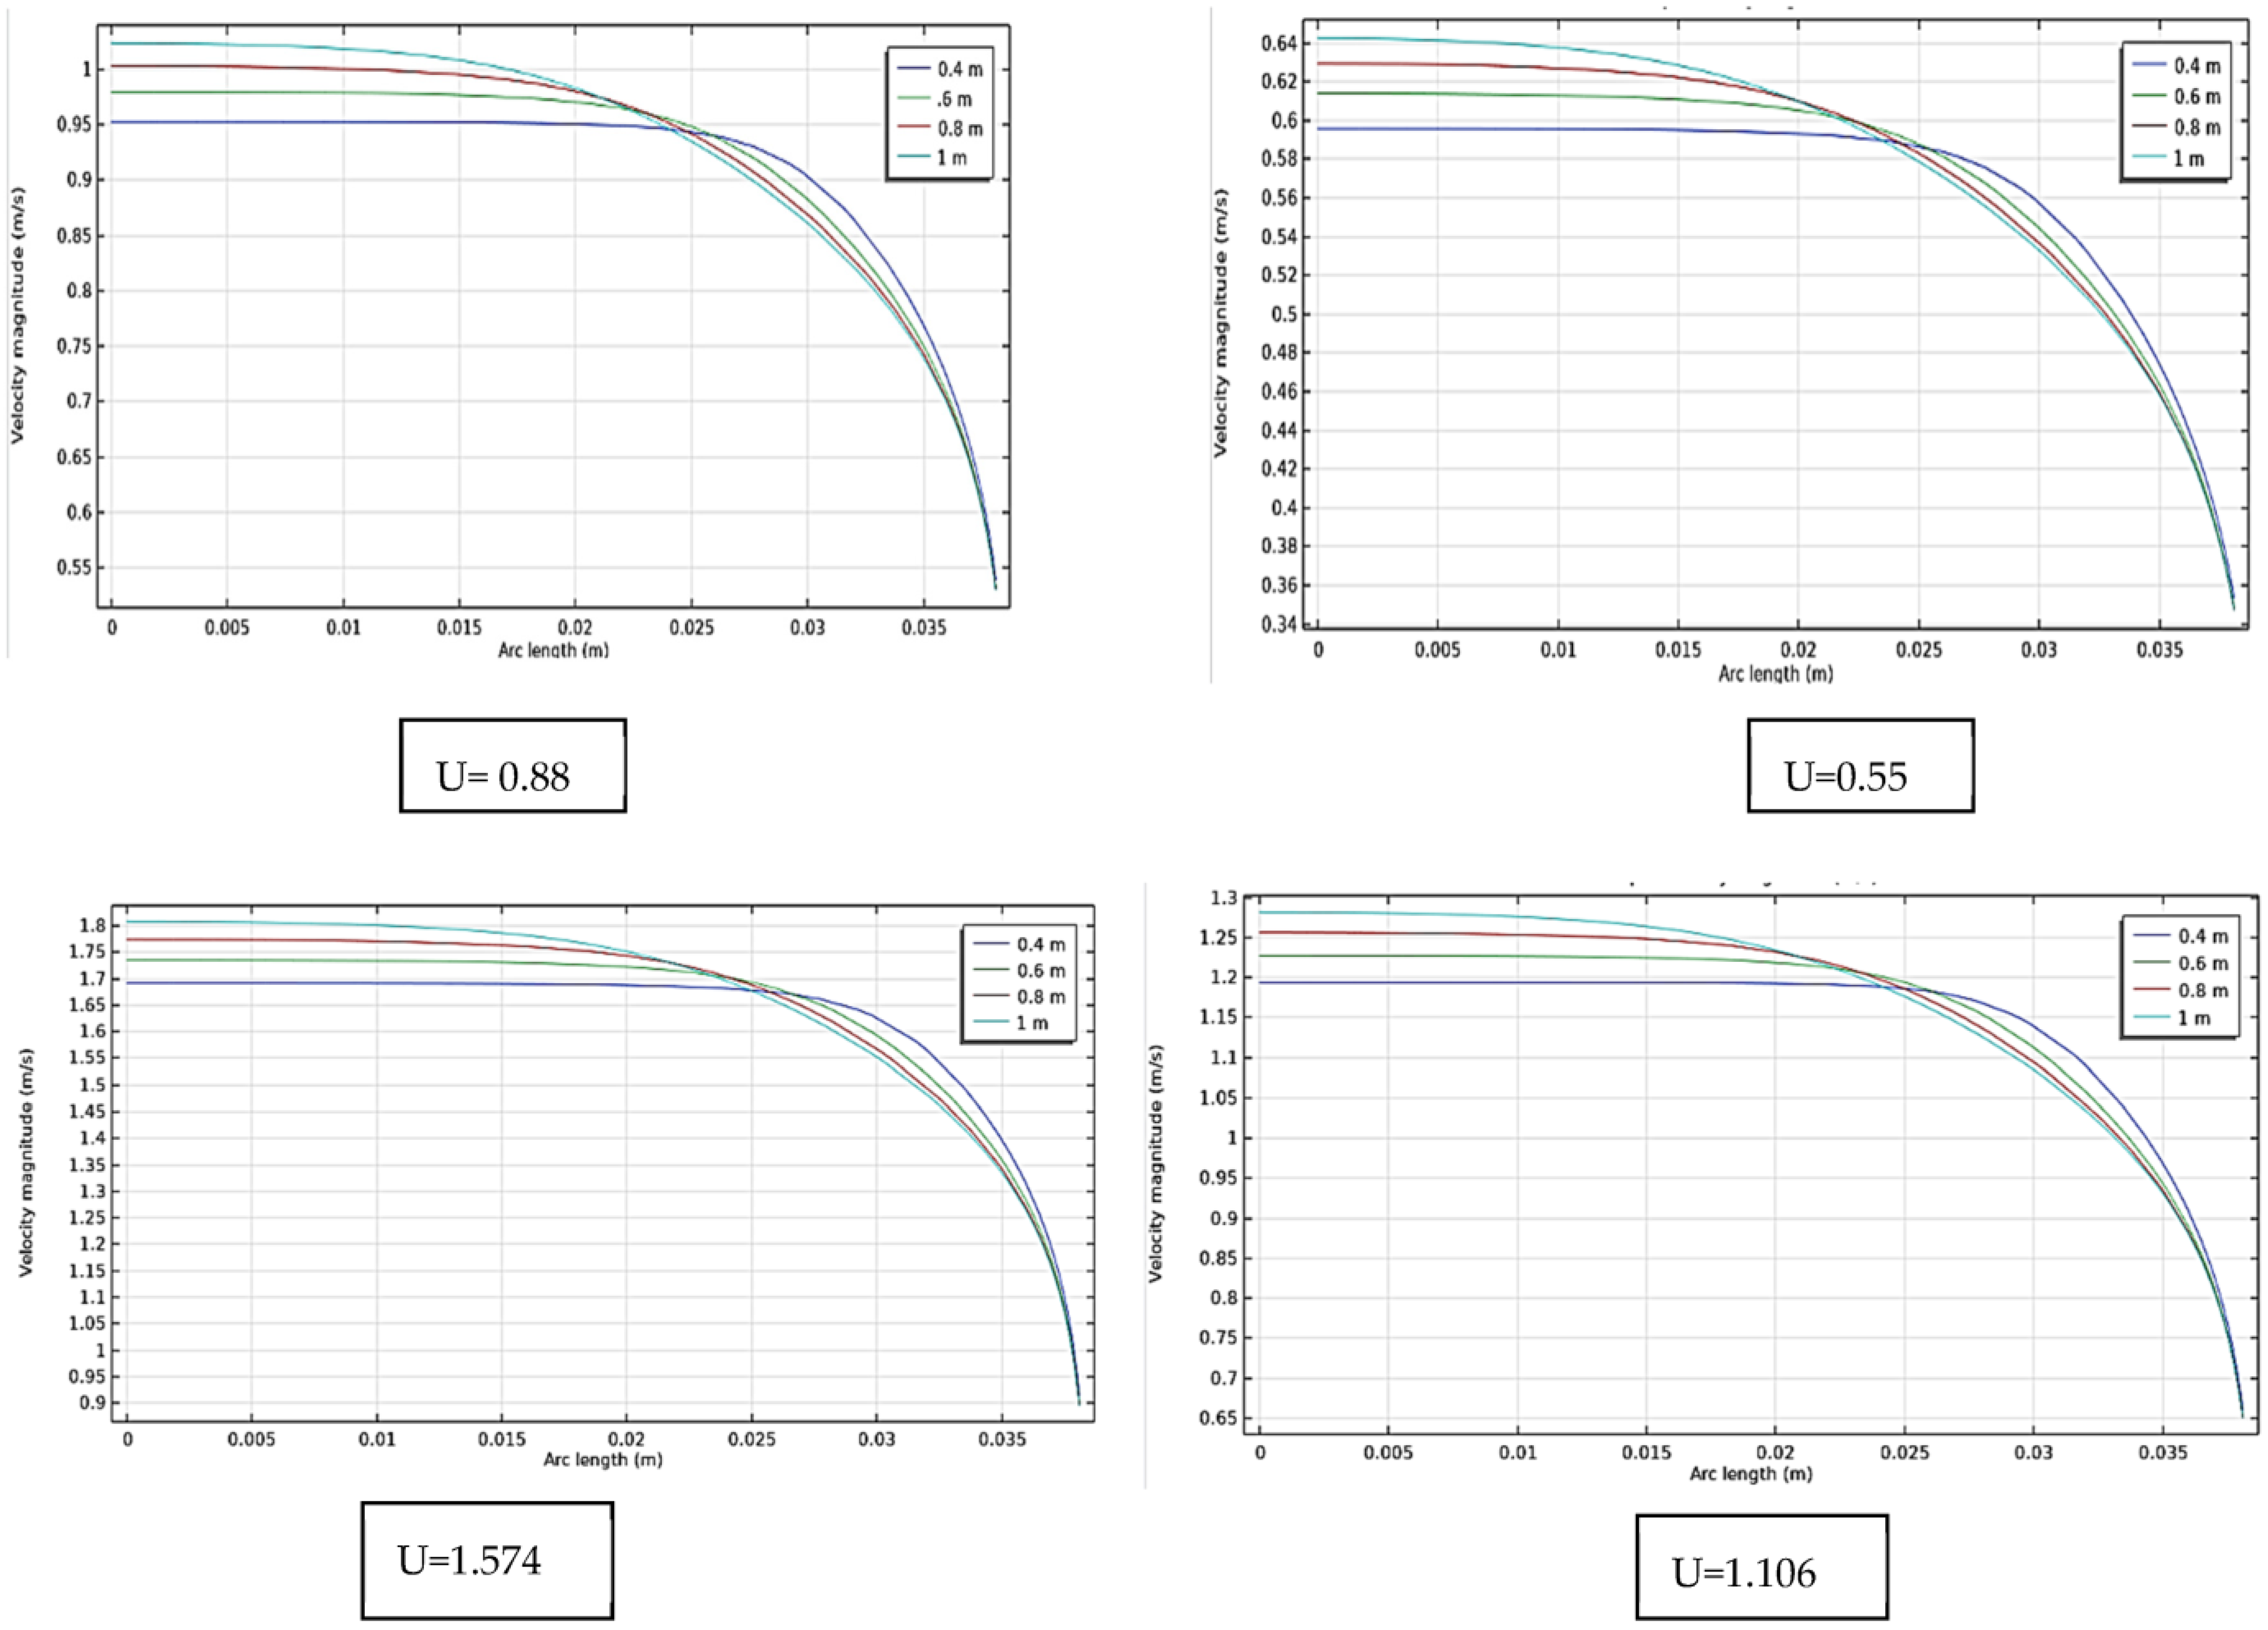
Velocity variation along the 1-m-long pipeline with 950 ppm XGs.
Figure 8a–d illustrates the velocity behavior of flow at several locations inside the pipeline (0.4, 0.6, 0.8, 1 m) at four different flow speeds (0.55, 0.88, 1.106, 1.574 m/s) with the addition of xanthan gum (300 ppm). In all speed scenarios, the velocity magnitudes at each flow speed changed somewhat from the flow without xanthan gums, even though the velocity magnitudes increased as the flow speed increased, as opposed to the length positions.
The same trend of the effect of xanthan addition on velocity behavior was also observed for other concentrations, as shown in Figure 9 and Figure 10. When xanthan was added to the water, the distribution velocity for the 1-m-long pipe increased from (0.64, 1, 1.15, and 1.7) m/s with no addition to (0.92, 1.2, 1.45, and 2.3) m/s with 950 ppm xanthan.
The figures demonstrate that the velocity was lower at the pipe wall due to the no-slip boundary condition and was constant at the pipe core. Moreover, the whole velocity profile appeared 0.4 m away from the pipe’s entrance. The behavior of the velocity distribution in which the entire distribution arose following the addition of the polymer was dramatically altered by the presence of the polymer. With the addition of the polymer, the velocity values at the wall increased for all velocities; for instance, at 1.57 m/s and 0.4 m, the values increased from 0.78 to 1.3 m/s with the addition of 950 ppm of the polymer. This can be linked to the water layer near the wall as was previously mentioned.
As shown in the above figures, the flows with RXGs exhibited more parabolic profiles. Turbulent flow has a characteristic of a ‘flat’ velocity profile, as the distribution of momentum, mass, and energy transfer perpendicular to the wall is very chaotic, resulting in a ‘mixing’ effect and thus reducing the efficiency of the energy to move the fluid forward. A more parabolic profile indicates better distribution within the fluid layer and better flow efficiency. This is related to the fact that there is an increase in the average velocity magnitude. The outcomes are identical to those found in other studies [28,29].
4.2.2. Validation of Performance
The suggested model in this work was tested experimentally and analytically using all of the assumptions and boundary conditions mentioned in Table 1.
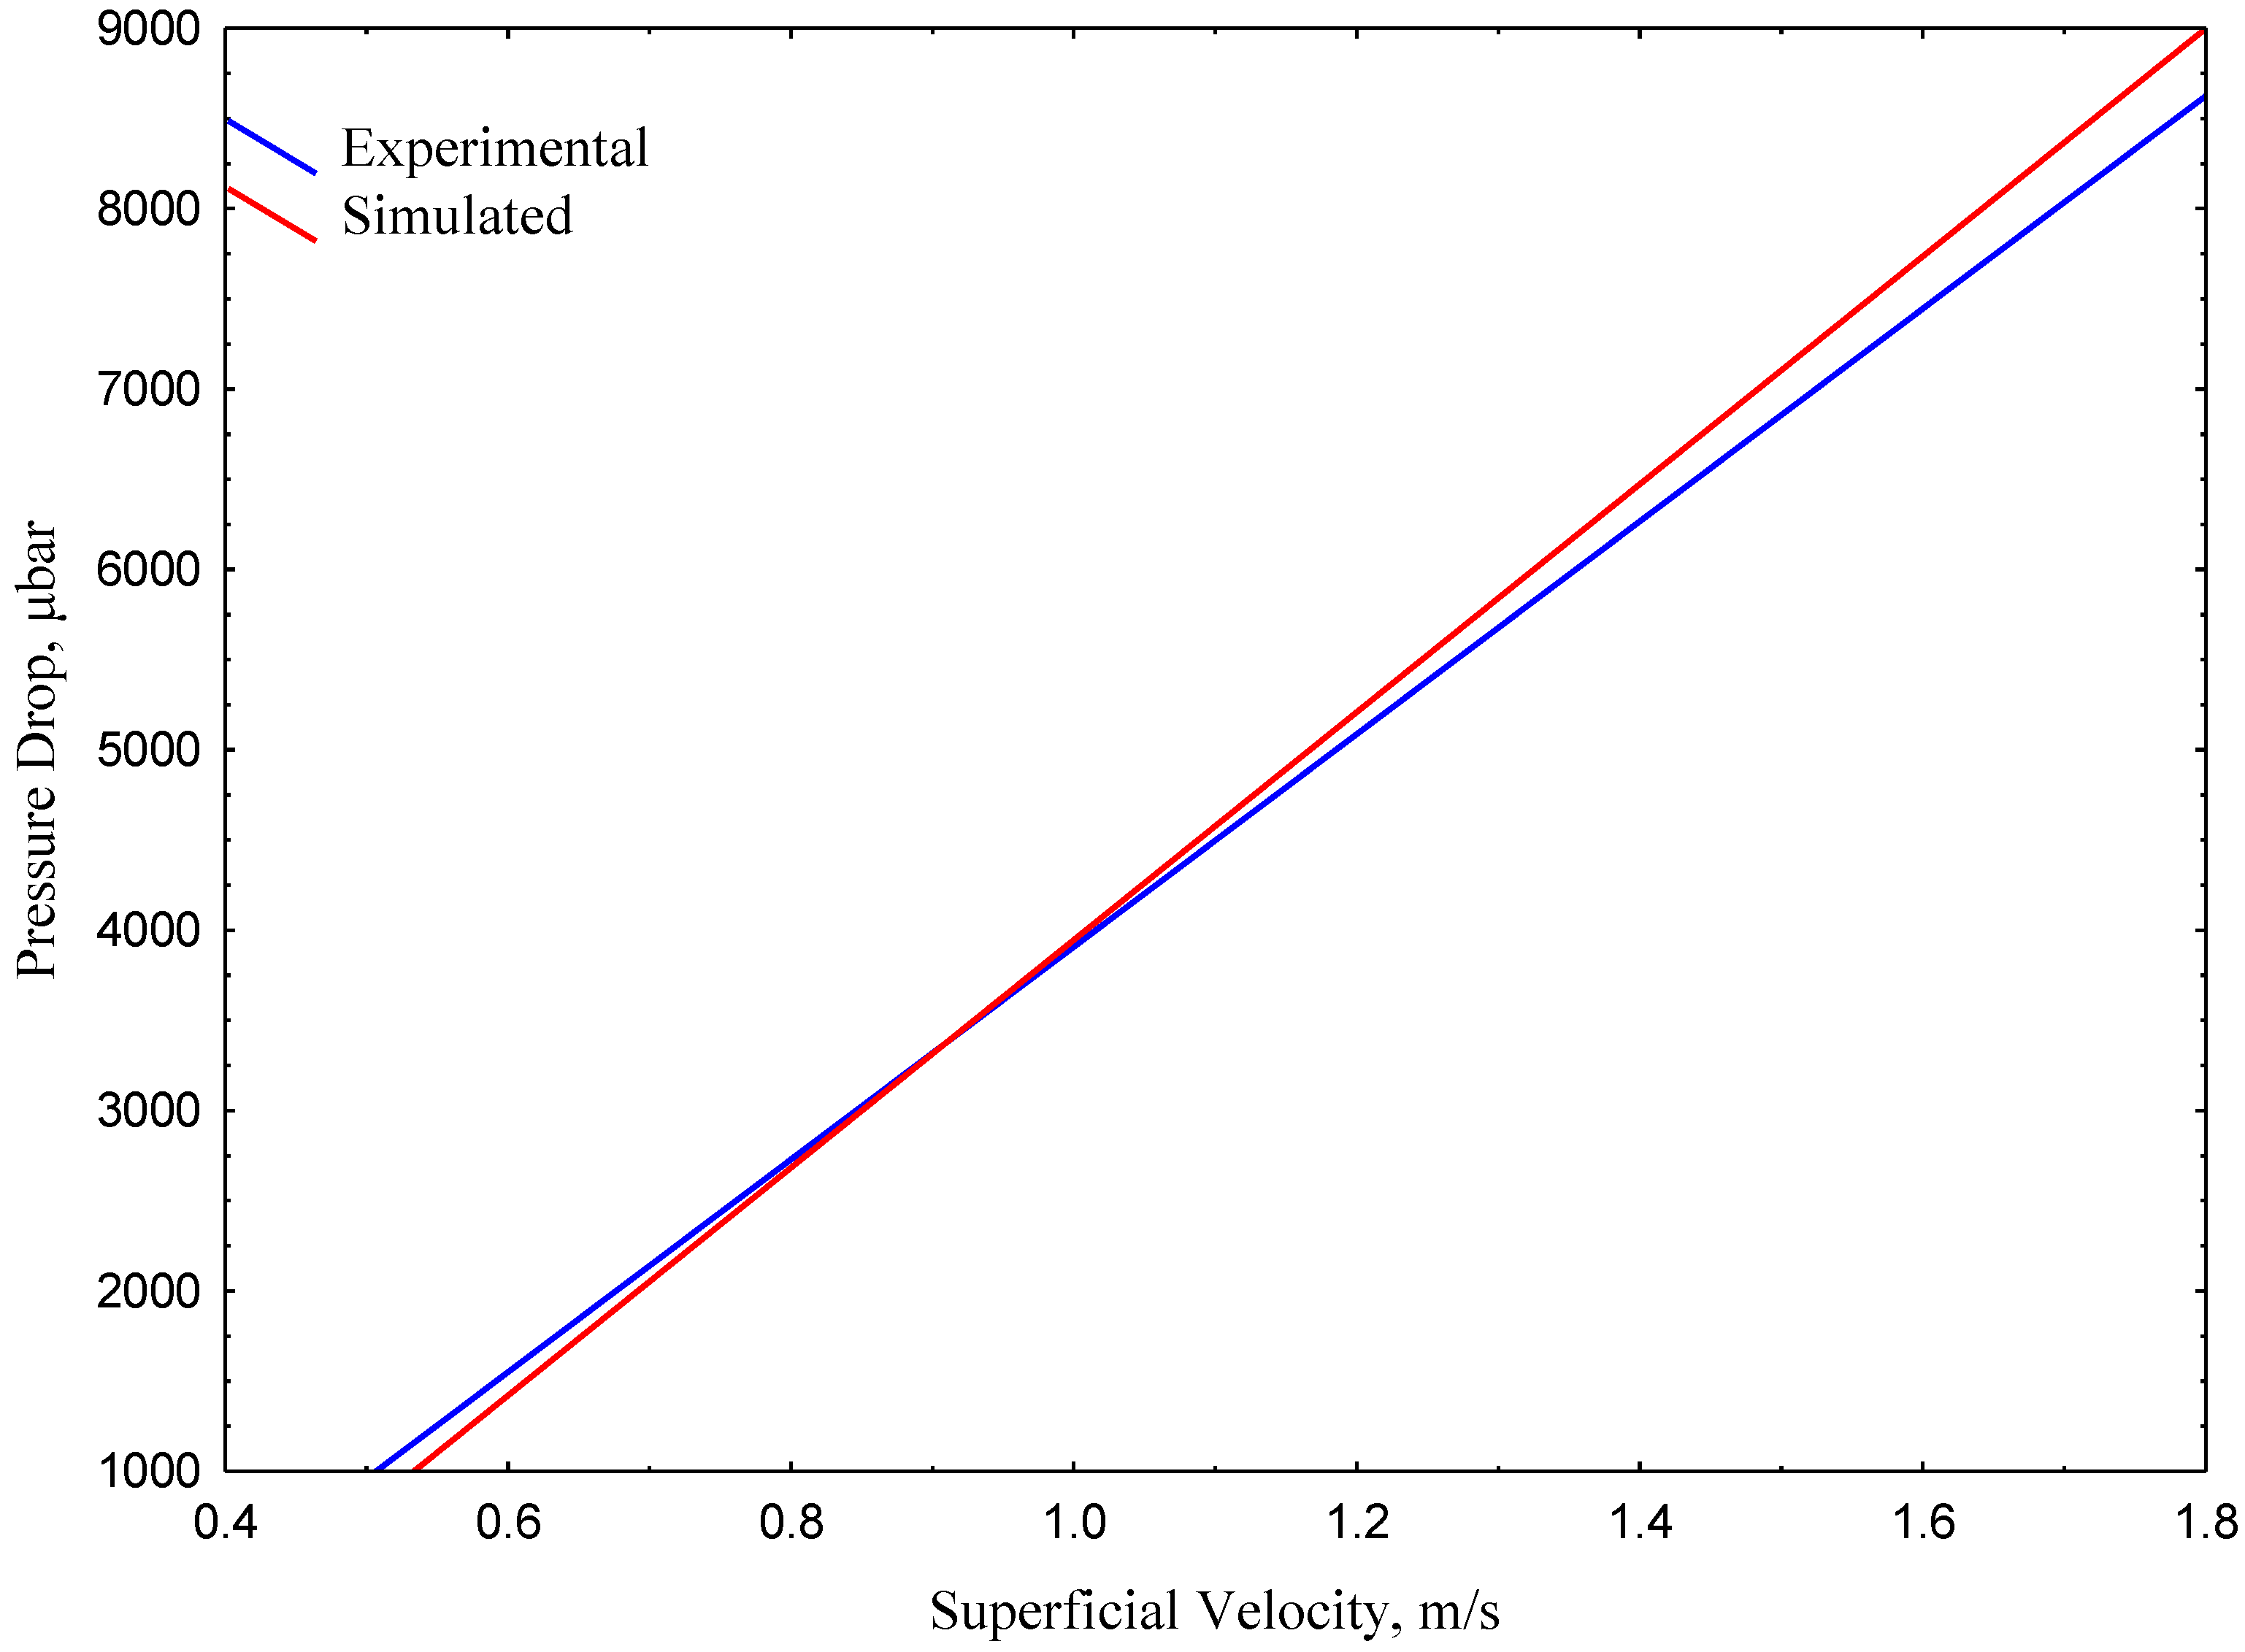
The results of the k-ε model were validated and compared with the experimental results of a smooth pipe (1 m in length) as shown in Figure 11. The figure shows good agreement between the experimental and the predicted values with an error of less than 6%.
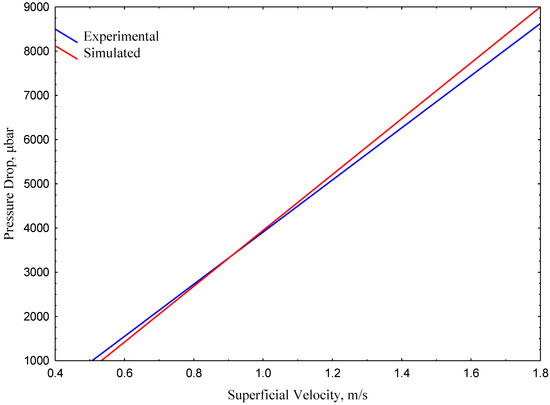
Figure 11.
Pressure values were validated experimentally and numerically using COMSOL Multiphysics simulation.
The model showed comparable results, with the k-ε showing slightly better performance, and was thus designated to perform the current study.
5. Conclusions
The effects of utilizing modified xanthan gums mixtures for drag reduction in water flow in horizontal pipes were examined. The effects of the RXG velocity and water velocity on the flow pattern, pressure gradient, and drag reduction rate were analyzed. The following conclusions can be drawn from this study:
- The addition of the RXGs efficiently affected and was appropriate in improving the fluidity of mixture solutions at constant environmental conditions of 24 °C.
- The pressure drop reduction differed with polymer concentration, and the best dose (high concentration) resulted in a lower pressure drop that was reduced by 65% compared to that without the modified XG mixture.
- The drag reduction was affected by water velocity, which increased with increasing velocity.
- In the numerical part, the flow patterns were quite accurately depicted by the level set model and the k-turbulence model in the COMSOL simulator. Quantitatively, maximum variations of 6% between the simulated and experimental pressure drop values showed that the model accurately explained this kind of flow.
Author Contributions
Conceptualization and writing—original draft preparation, A.A.A. (Asawer A. Alwaiti); software, B.J.K. validation, S.S.A.; methodology, Z.Y.S.; investigation, A.A.A. (Adnan A. AbdulRazak); resources, O.S.M.; funding acquisition, H.S.M. All authors have read and agreed to the published version of the manuscript.
Funding
This research received no external funding.
Institutional Review Board Statement
Not applicable.
Informed Consent Statement
Not applicable.
Data Availability Statement
Not applicable.
Acknowledgments
The authors would like to thank the Chemical Engineering Department at the University of Technology as well as the Department of Chemical Engineering and Petroleum Industries at the Al-Mustaqbal University College their support.
Conflicts of Interest
The authors declare no conflict of interest.
References
- Shnain, Z.Y.; Alwasiti, A.A.; Rashed, M.K. Applying Carbon Nanotubes for Enhancing Fluid Flow. Mater. Sci. Eng. 2020, 881, 012094. [Google Scholar] [CrossRef]
- Shnain, Z.Y.; Mageed, A.K.; Majdi, H.S.; Mohammadi, M.; AbdulRazak, A.A.; Abid, M.F. Investigating the effect of TiO2-based nanofluids in the stability of crude oil flow: Parametric analysis and Gaussian process regression modeling. J. Pet. Explor. Prod. Technol. 2022, 12, 2429–2439. [Google Scholar] [CrossRef]
- Sreedhar, I.; Reddy, N.S.; Rahman, S.A.; Govada, K.P. Drag reduction studies in water using polymers and their combinations. Mater. Today Proc. 2020, 24, 601–610. [Google Scholar] [CrossRef]
- Kotenko, M.; Oskarsson, H.; Bojesen, C.; Nielsen, M.P. An experimental study of the drag reducing surfactant for district heating and cooling. Energy 2019, 178, 72–78. [Google Scholar] [CrossRef]
- Tabor, M.; de Gennes, P.G. A Cascade Theory of Drag Reduction. EPL Europhys. Lett. 1986, 2, 519–522. [Google Scholar] [CrossRef]
- Sher, I.; Hetsroni, G. A mechanistic model of turbulent drag reduction by additives. Chem. Eng. Sci. 2008, 63, 1771–1778. [Google Scholar] [CrossRef]
- Virk, P.S. Drag reduction fundamentals. AIChE J. 1975, 21, 625–656. [Google Scholar] [CrossRef]
- Abubakar, A.; Al-Wahaibi, T.; Al-Hashmi, A.; Al-Ajmi, A. Roles of drag reducing polymers in single- and multi-phase flows. Chem. Eng. Res. Des. 2014, 92, 2153–2181. [Google Scholar] [CrossRef]
- Alwasiti, A.A.; Shneen, Z.Y.; Ibrahim, R.I.; Al Shalal, A.K. Energy Analysis and Phase Inversion Modeling of Two-Phase Flow with Different Additives. Ain Shams Eng. J. 2021, 12, 799–805. [Google Scholar] [CrossRef]
- Shnain, Z.Y.; Almukhtar, R.S.; Mahdi, M.S.; Alwaiti, A.A.; Shakor, Z.M. Experimental study and implementation of supervised machine learning algorithm to predict the flowability of two-phase water-oil in pipeline. Pet. Sci. Technol. 2022, 61, 1–16. [Google Scholar] [CrossRef]
- Shnain, Z.Y.; Alwaiti, A.A.; Rashed, M.K.; Shakor, Z.M. Experimental and Data-driven approach of investigating the effect of parameters on the fluid flow characteristic of nanosilica enhanced two phase flow in pipeline. Alex. Eng. J. 2021, 61, 1159–1170. [Google Scholar] [CrossRef]
- Al-Sarkhi, A. Drag reduction with polymers in gas-liquid/liquid-liquid flows in pipes: A literature review. J. Nat. Gas Sci. Eng. 2010, 2, 41–48. [Google Scholar] [CrossRef]
- Baik, S.; Hanratty, T.J. Effects of a drag reducing polymer on stratified gas–liquid flow in a large diameter horizontal pipe. Int. J. Multiph. Flow 2003, 29, 1749–1757. [Google Scholar] [CrossRef]
- Darmana, D.; Deen, N.; Kuipers, J. Detailed modeling of hydrodynamics, mass transfer and chemical reactions in a bubble column using a discrete bubble model. Chem. Eng. Sci. 2005, 60, 3383–3404. [Google Scholar] [CrossRef]
- Tan, J.; Hu, H.; Vahaji, S.; Jing, J.; Tu, J. Effects of drag-reducing polymers on the flow patterns, pressure gradients, and drag-reducing rates of horizontal oil–water flows. Int. J. Multiph. Flow 2022, 153, 104136. [Google Scholar] [CrossRef]
- Alsaedi, S.S.; Shnain, Z.Y.; Rashed, M.K.; Filip, P. Triple Solutions of Nanoparticle plus Polymer-Surfactant compound for Enhancing the Drag Reduction Using a Rotational Disk Apparatus. Mater. Sci. Eng. 2020, 881, 012079. [Google Scholar] [CrossRef]
- Alsaedi, S.S.; Yousif, Z.; Alazzawi, S.; Filip, P. Effect of Glycolic Acid Ethoxylate Lauryl Ether (GAL) Surfactant Solutions among Low and High Concentrations on Drag Reduction to Progress Flow in the Pipeline Networks Using RDA. J. Pet. Res. Stud. 2022, 12, 364–380. [Google Scholar] [CrossRef]
- Tiong, A.N.T.; Kumar, P.; Saptoro, A. Reviews on drag reducing polymers. Korean J. Chem. Eng. 2015, 32, 1455–1476. [Google Scholar] [CrossRef]
- Ideriah, F.J.K. Prediction of Turbulent Cavity Flow Driven By Buoyancy and Shear. J. Mech. Eng. Sci. 1984, 22, 287–295. [Google Scholar] [CrossRef]
- Awbi, H.B.; Setrak, A.A. Numerical Solution of Ventilation Air Jet. In Proceedings of the Fifth International Symposium on the Use of Computer for Environmental Engineering Related to Building, Bath, UK, 7–9 July 1986. [Google Scholar]
- Patanker, S.V. Numerical Heat Transfer and Fluid Flow; McGraw-Hill: New York, NY, USA, 1980. [Google Scholar]
- Terrapon, V.E.; Dubief, Y.; Moin, P.; Shaqfeh, E.S.G.; Lele, S.K. Simulated polymer stretch in a turbulent flow using Brownian dynamics. J. Fluid Mech. 2004, 504, 61–71. [Google Scholar] [CrossRef]
- Peixinho, J.; Nouar, C.; Desaubry, C.; Théron, B. Laminar transitional and turbulent flow of yield stress fluid in a pipe. J. Non-Newtonian Fluid Mech. 2005, 128, 172–184. [Google Scholar] [CrossRef]
- Lescarboura, J.A.; Culter, J.D.; Wahl, H.A. Drag Reduction with a Polymeric Additive in Crude Oil Pipelines. Soc. Pet. Eng. J. 1971, 11, 229–235. [Google Scholar] [CrossRef]
- Andrade, R.M.; Pereira, A.S.; Soares, E.J. Drag increase at the very start of drag reducing flows in a rotating cylindrical double gap device. J. Non-Newtonian Fluid Mech. 2014, 212, 73–79. [Google Scholar] [CrossRef]
- Japper-Jaafar, A.; Escudier, M.; Poole, R. Turbulent pipe flow of a drag-reducing rigid “rod-like” polymer solution. J. Non-Newtonian Fluid Mech. 2009, 161, 86–93. [Google Scholar] [CrossRef]
- Choueiri, G.H.; Lopez, J.M.; Hof, B. Exceeding the Asymptotic Limit of Polymer Drag Reduction. Phys. Rev. Lett. 2018, 120, 124501. [Google Scholar] [CrossRef]
- Liu, Z.-H.; Liao, L. Forced convective flow and heat transfer characteristics of aqueous drag-reducing fluid with carbon nanotubes added. Int. J. Therm. Sci. 2010, 49, 2331–2338. [Google Scholar] [CrossRef]
- Dianita, C.; Saputra, A.H.; Khairunissa, P.A. Simulation of Drag Reducer Polymer (DRP) for Single and Annular Two Phase Flow in Horizontal Pipe. J. Rekayasa Kim. Lingkung. 2018, 13, 154–164. [Google Scholar] [CrossRef]
Disclaimer/Publisher’s Note: The statements, opinions and data contained in all publications are solely those of the individual author(s) and contributor(s) and not of MDPI and/or the editor(s). MDPI and/or the editor(s) disclaim responsibility for any injury to people or property resulting from any ideas, methods, instructions or products referred to in the content. |
© 2023 by the authors. Licensee MDPI, Basel, Switzerland. This article is an open access article distributed under the terms and conditions of the Creative Commons Attribution (CC BY) license (https://creativecommons.org/licenses/by/4.0/).

