1. Introduction
One of the most commonly detected contaminants in groundwater is 1,2-dibromoethane (1,2-DBE) Today, 1,2-DBE can still persist in groundwater at high levels at some contaminated sites, even though its usage was banned in gasoline and agriculture in the 1980s in Canada, Sweden, and the USA [
1].
1,2-DBE was used primarily as an antiknock additive to gasoline and is one of the most effective and widely used pesticide soil fumigants [
2]. However many years after its last known application as a soil fumigant, residual 1,2-DBE is still found at remarkably high concentrations in soil because it strongly interacts with the soil matrix [
3,
4]. 1,2-DBE can slowly leak from such contaminated soils to groundwater over exceedingly long periods, and because of its slow chemical conversion in an aqueous milieu, it is a continuous source of contamination of water supplies [
4], even decades after its last use [
4,
5]. More than 100 formulated pesticides contain 1,2-DBE. In 1977, 120 million kilograms were produced in the United States.
1,2-DBE is highly toxic and probably carcinogenic in humans, and it can lead to damage to the stomach, reproductive system, respiratory system, and nervous system in mammals [
6]. 1,2-Dibromoethane affects liver microsomes, DNA, and sperm. Human exposure to 1,2-DBE can cause eye, skin, and respiratory irritation as well as damage to the liver, kidney, spleen, and lungs [
7].
1,2-DBE can be characterized by relative hydrophilia, poor bioavailability, and extremely low natural attenuation rate (t
1/2 = 17.33 years) in groundwater [
8].
1,2-Dibromoethane is one of many potentially carcinogenic compounds to which humans are exposed. The purpose of the study [
9] was to evaluate biochemical mechanisms by which 1,2-dibromoethane might be acting as a carcinogen and by which it might be activated and inactivated.
The Agency for Toxic Substances and Disease Registry maintains a prioritized list of the compounds most commonly found at Superfund sites that pose the most significant potential threat to human health. 1,2-Dibromoethane (ethylene dibromide) ranks sixth among halogenated aliphatic compounds, while 1,2-dichloroethane (1,2-DCA) ranks fourteenth. 1,2-DBE has the second lowest maximum contaminant level (MCL = 0.05 μg/L) in drinking water among all organic compounds after dioxin [
10].
The biological degradation of 1,2-DBE has been studied under both aerobic [
11,
12,
13,
14] and anaerobic conditions [
15]. It was established that 1,2-dibromoethane and its products, particularly 2-bromoethanol, are toxic to
Xanthobacter autotrophicus, GJ10 being the most exploited strain for 1,2-dichloroethane biodegradation [
8,
9]. For the success of any bioremediation process, it is necessary to understand the behavior of microbial populations responsible for the degradation of the targeted contaminants.
In the study by Skopelitou et al. [
16], different
Rhizobium strains were screened for their ability to produce stable and active 1,2-dibromoethane-degrading dehalogenase. Among them,
Bradyrhisobium japonicum appears to produce the most stable enzymes for 1,2-DBE biodegradation [
17]. We shall assume the following main scheme of 1,2-DBE biodegradation shown below.
The biodegradation passes through very toxic intermediates, e.g., 2-bromoethanol and bromoacetaldehyde (cf.
Scheme 1) and that is why the complete biodegradation was not observed at higher substrate concentrations above 0.1 g/L. Full dehalogenation was observed below this concentration corresponding to stoichiometric values of released bromide ions.
In a previous study, we investigated the biodegradation of 1,2-dibromoethane with
Bradyrhizobium japonicum 273 cells in presence of a constant electric field [
18]. The electric field was applied in order to accelerate the process of oxidation of the intermediate product 2-dibromoethanol. The positive effect of the electric field was proved on the basis of biomass growth and the release rate of bromine for a certain period of time. When no electric field was applied the biodegradation was impeded. It stopped before one bromide atom in the substrate molecule was released completely, i.e., before the complete conversion of 1,2-DBE into 2-bromoethanol. The constant electric field leads to complete degradation and the concentration of bromide ions in the medium reaches stoichiometric values. However, a question arises on the nature of this effect: suppression of product inhibition of microbial growth, enhanced removal of the inhibitor, i.e., 2-bromoethanol by its depletion to further products because of electrochemical oxidation (cf.
Scheme 1), or something else, such as some kind of bioelectrochemical stimulation of enzyme activities. The data processing by Faraday’s law shows that in the case of biodegradation of 1,2-DBE the calculated degraded amounts by the measured electric current are comparable to the determined ones by chemical analyses. It means that there is an electrochemical component in the enhanced biodegradation or consecutive anode oxidation of 2-bromoethanol to bromo-acetaldehyde and mono-bromoacetic acid cf.
Scheme 1.
It is interesting to find out the reasons for this effect. The first step for clarification of the mechanism of this enhanced biodegradation is the mathematical processing of the experimental data by unstructured models. A reasonably good fit of experimental data with the modeling results will be an indication of the adequacy of the model presumptions and for clarification of the nature of the constant electric field impact by comparison of the evaluated kinetic constants in the used models. This impact can be on microbial growth and the associated growth inhibition by intermediate products, on the yields of biomass and products, the enhanced product oxidation, etc. The comparison of the estimated kinetic parameters by mathematical processing of the experimental data obtained with and without the application of a constant electric field can give an answer to these questions. The present paper is an attempt to evaluate these effects by means of mathematical models by processing the experimental data on 1,2-DBE biodegradation obtained with and without the application of the electric field.
We shall consider the case of 1,2-DBE biodegradation by the strain Bradyrhizobium japonicum 273 in the constant electric field at constant anode potential and for cases when no electric field was applied. The experimental data will be processed by two kinetic mathematical models to establish the reasons for the effect of the constant electric field for the considered case.
2. Materials and Methods
2.1. Bacterial Strain, Media and Experimental Conditions
The strain Bradyrhizobium japonicum 273 was obtained from the National Bank for Industrial Microorganisms and Cell Cultures, Bulgaria (NBIMCC). The strain was grown in mineral medium (MMY) containing (per liter): 1 g of yeast extract, 0.2 g of NaCl, 0.2 g of MgSO4, 0.5 g of K2HPO4, 10 g of Glucose, and 1 L of tap water. The medium pH was adjusted to 7.2 before being autoclaved.
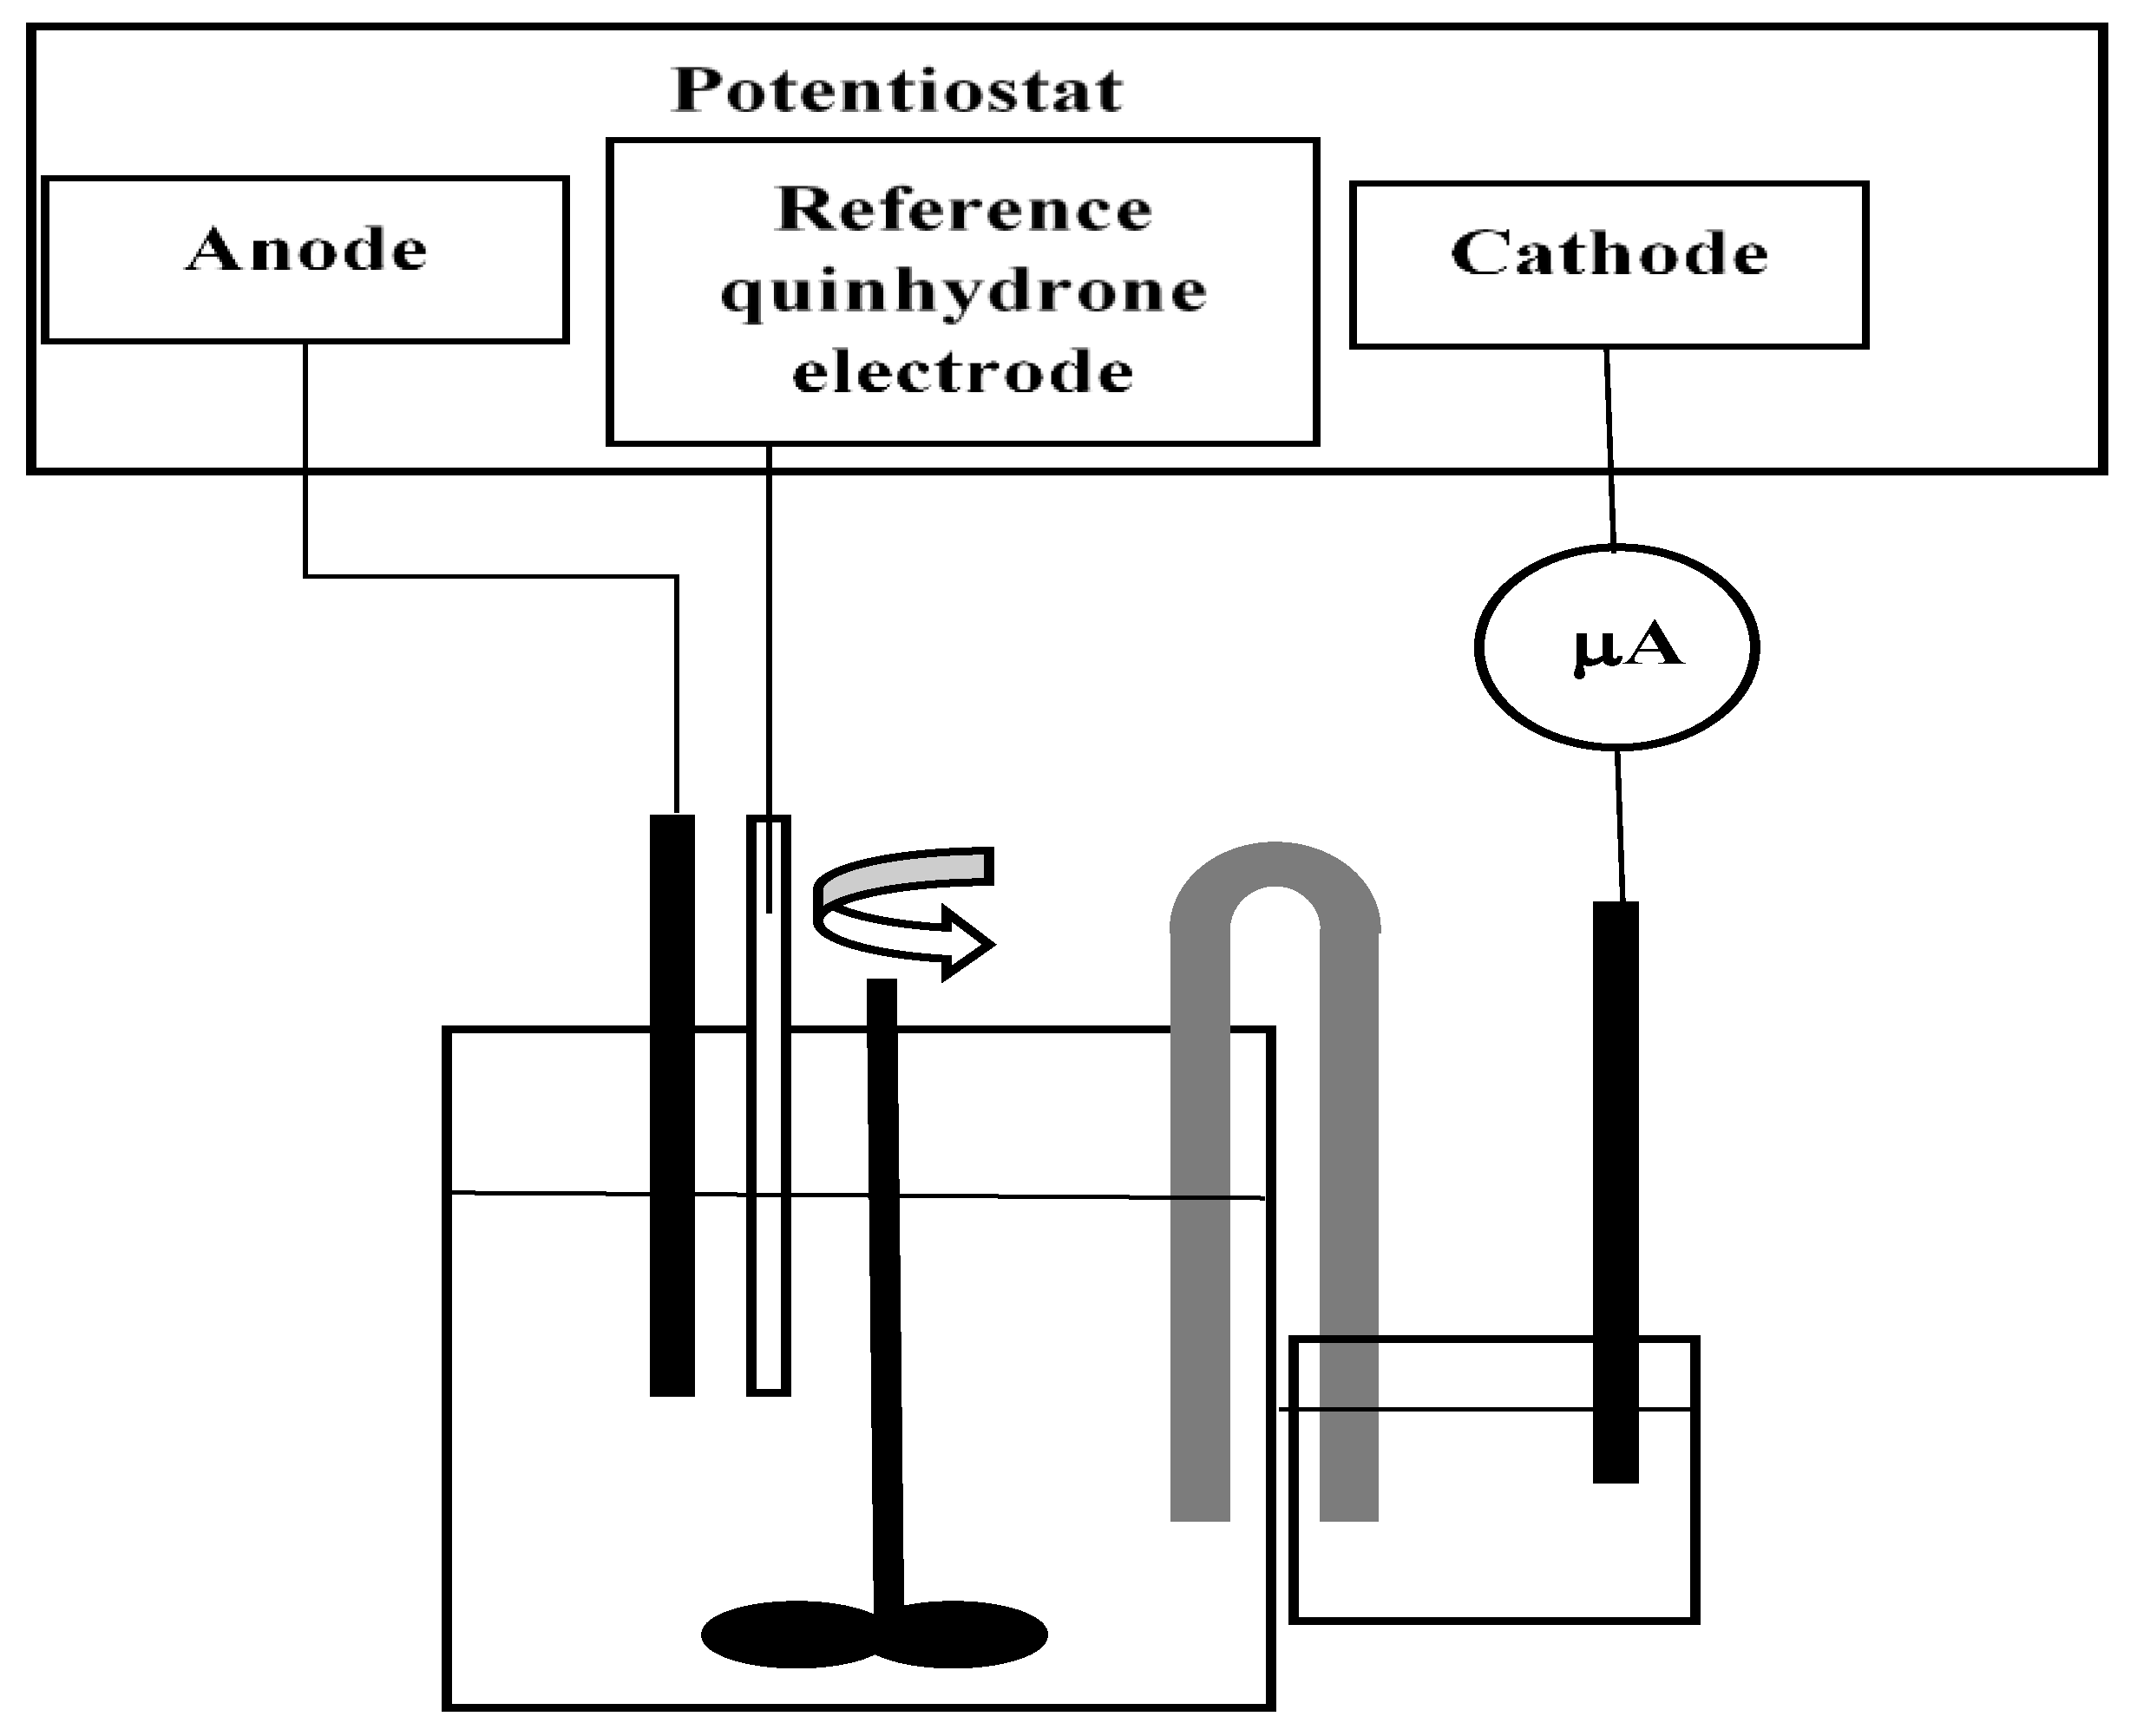
The experiments have been carried out under batch conditions in a 0.5 L Bioflo fermentor (New Brunswick Scientific, Edison, NJ, USA). The installation was loaded with substrate solution in nutritive medium and inoculum, which was 10% of the reactor volume, i.e., 50 mL. Temperature was measured by thermocouple and it is maintained constant at 30 °C by thermostat. The agitation speed of 400 rpm by magnetic stirrer was maintained constant. Processes of dehalogenation have been carried out with different initial substrate concentrations (0.05, 0.1, and 0.15 g/L) 1,2-DBE in presence and absence of constant electric field. For experiments with electric field, we used the following experimental set-up (
Figure 1).
These experiments were made at three different anode potentials: 0.05, 0.1, and 0.15 V vs. reference quinhydrone electrode. Best results have been obtained at 0.1 V vs. the reference quinhydrone electrode. Therefore, our further considerations will be limited to this value of anode potential.
When applying electric field, one of the stainless steel baffles of the fermentor was used as an anode (with surface of 13 cm2). The anode potential was maintained constant by a potentiostat at the value of 0.1 V vs. quinhydrone electrode, (i.e., 0.8 V/SHE) at 30 °C. The abbreviation SHE denotes standard hydrogen electrode.
The cathode was coupled to the system by an agar salt bridge, outside the fermentor, in order to avoid undesired cathode processes in the broth. One end of the salt bridge was submerged in a beaker with sodium chloride solution, while the other end was submerged in the fermentor. The salt bridge was made of KCl and agar. At this temperature, the operating cell voltage was +0.6029 V. The current strength was measured by microammeter.
2.2. Analytical Methods
Samples from the broth were taken periodically and analyzed for biomass, 2-bromoethanol, and bromide ions. The biomass growth was monitored by the optical density of the broth. The light absorption was measured at a wavelength of 600 nm using a spectrophotometer. Calibration line was drawn by measuring the optical densities of dried samples of centrifuged biomass.
Bromides were analyzed by the colorimetric method of Bergman and Sanik, 1957 [
19]. An aliquot of centrifuged sample (2.5 mL) was mixed with 1 mL of Fe (III) solution (8 g (NH
4)Fe(SO
4)·12H
2O in 100 mL of 6 M HNO
3) and 3 mL saturated solution of 1.5 g Hg(SCN)
2 in 500 mL of 98% ethanol. The mixture was shaken and after 10 min was filtered through a 0.2 μm filter. The light absorption was measured at a wavelength of 460 nm using a spectrophotometer. The concentrations of bromide ions were calculated from the optical density, using a calibration curve with correlation coefficient R
2 = 0.9996.
The presence of aldehydes was monitored qualitatively by the reaction of 2,4-dinitrophemyl-hydrazine (2,4-DNPH) with aldehydes. Carboxylic acids were monitored by HPLC.
In all photometrical determination, a UV–Vis spectrophotometer UV-1600 PC (a Shanghai Mapada Instuments Co. production, Shanghai, China) was used.
2.3. Mathematical Modeling
In this research, mathematical models of 1,2-dibromoethane biodegradation were composed. The used mathematical models are based on two kinetics of microbial growth involving competitive product inhibition. The first model is based on microbial growth, described by modified Monod equation for the specific growth rate [
20]. The second one is based on inhibited growth by the product described by Levenspiel-type kinetics [
21].
For the purpose of the modeling, own experimental data were used [
17,
18]. The effect of the electric field was estimated by the kinetic constants in the models for different initial substrate concentrations. Complete biodegradation was observed in cases of electric field application.
The mathematical description of the biodegradation process, using the modified Monod equation for the specific growth rate proposed by Yerusalimskii and Neronova [
20], has the form:
The second model equations are based on inhibited growth by the product described by Levenspiel-type kinetics [
21]:
where
Pcrit is a critical product concentration above which no growth is possible. In addition to product inhibition, the latter equation introduces product toxicity by the limiting value of
Pcrit. All used symbols are listed at the end of the paper.
The number 0.63971 is the stoichiometric ratio between the atomic mass of bromine and the molecular mass of 2-bromoethanol.
We did not detect aldehydes or carboxylic acids in the samples of the broth. An explanation for 1,2-DBE biodegradation, in this case, is the validity of a second mechanism of oxidative biodegradation, i.e., 2-bromoethanol is directly converted into ethylene oxide and further mineralized [
11]. In any case, we restricted ourselves to evaluation of depletion of the first product, i.e., 2-bromoethanol to all other products in
Scheme 1. Next, 2-bromoethanol will be considered the main inhibitor of bacterial growth.
The minimization of the least square function will be used for parameter identification.
There are six parameters for evaluation:—
µmax,
kS,
YX/S,
YP/S,
kP, and
γ for the system (1) and seven for the Levenspiel model:
µmax,
kS,
YX/S,
YP/S,
Pcrit,
n, and
γ, cf. Equation (2). For this purpose of the experiment, experimental data were processed by minimization procedure of the target function
Q, being the sum of the squares of the differences between the measured biomass and bromide concentrations (
Xexp and
Brexp) and the model values:
where
i = 1, 2, 3, …,
m are the numbers of the taken samples at moments
ti of the experiments. The concentration of the bromide anions is an indication of the progress of the substrate and product biodegradation. The attainment of a stoichiometric concentration of bromide in the broth means total conversion of 1,2-1,2-DBE to glycolic acid.
Model parameters identification in this case is a difficult task, because of the multi-extremal least square function or because some minima are ravine type. The solution to the problem needs very well parameter initial value approximations (in the global minimum area) for minimum searching procedure. This is the main problem in the multi-extremal function minimization is solved on the base of a hierarchical approach by using the experimental data or its spline approximations for solutions to the model equations [
22]. In the present case, the identification problem for the biodegradation systems (1, 2) is solved using real experimental data [
17,
18].
A polynomial approximation of the experimental data is used for obtaining good initial values for the kinetic parameters (in the global minimum area) for the least square function minimization. The determination of the model parameters was made by minimization of the function, Equation (3) using the procedure fminsearch of MATLAB. This procedure finds minimum of unconstrained multivariable function using derivative-free method by algorithm “Nelder-Mead simplex direct search” [
23].
3. Results
3.1. Experimental Data
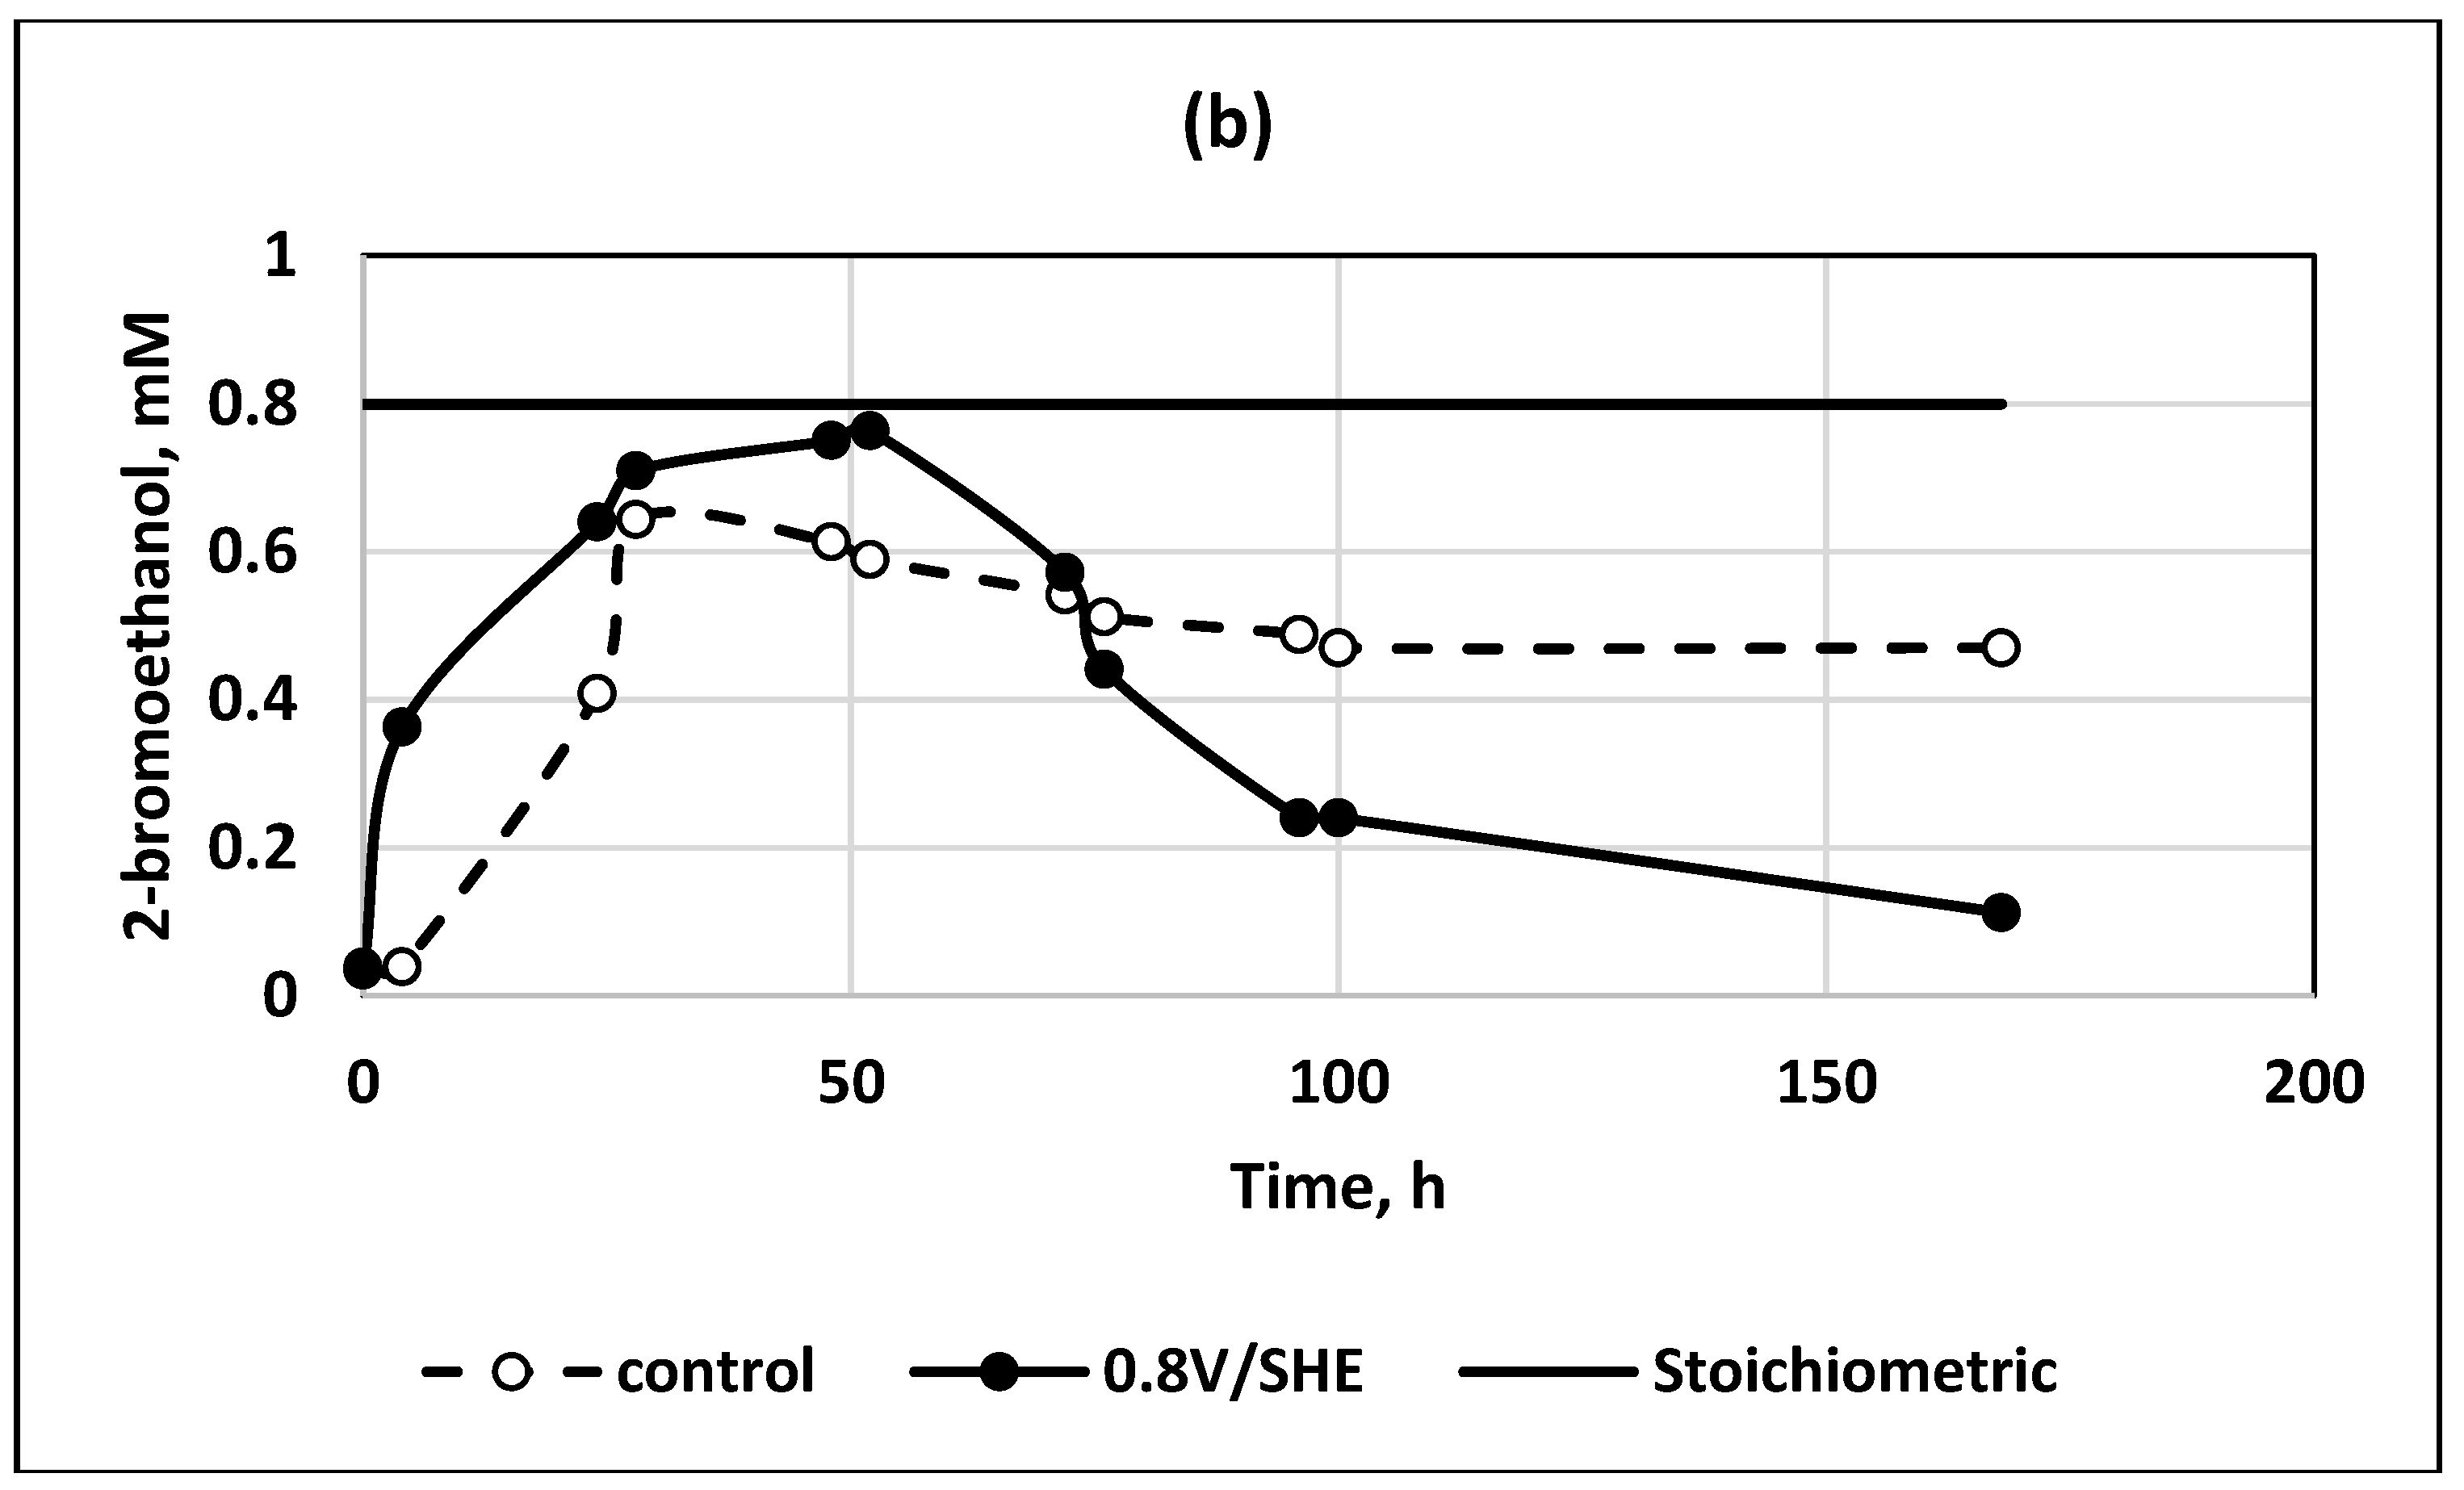
An illustration of the positive effect of the applied electric field on bromide release and 2-bromoethanol depletion is shown in
Figure 2.
It is visible, that when electric field was applied bromide and 2-bromoethanol approached their stoichiometric values with much faster depletion of 2-bromoethanol. In the control experiment, its concentration remains constant for a long time.
3.2. Mathematical Modeling
The model curves for biomass growth and bromine release are almost identical for both models with the corresponding set of determined kinetic parameters. The obtained results for the values of kinetic parameters in models (3) and (4) for experiments with and without an electric field for two initial substrate concentrations are shown in
Table 1 and
Table 2.
In all the cases the minimum sums of the squares Qmin were quite low and comparable for both models. That is why it is difficult to judge previously which model was more suitable to describe the studied processes.
The standard deviations calculated by the sums of the squares are less than 0.003 g dm−3. Note that the measured concentrations of bromide and 2-bromoethanol are within 0.05 to 0.09 g dm−3.
In the control experiments, the estimated maximum growth rates are almost equal for both models. The calculation shows for μmax = (0.39 ± 0.04) h−1. The other common parameters, i.e., the saturation constant kS, the yield coefficients YX/S and YP/S are also similar and the product yield coefficient is approaching its stoichiometric value, i.e., the ratio of the molecular masses of 2-bromoethanol and 1,2 dibromoethane, namely 0.665. The best results for the effect of an electric field are obtained at an initial concentration of 0.1 g dm−3.
The estimated rate constant γ for the product decay takes almost equal values by the two kinetic models.
On the other hand, it is evident that for the model of Monod–Yerusalimsky the effect of the electric field is strong for the maximum specific growth rate, for the growth inhibition constant kP, for the product yield coefficient YP/S, and particularly for the rate constant for the product decay γ.
The data obtained by the Levenspiel model shows similar results for the maximum specific growth rate, the product yield coefficient, and the rate constant of the product decay except for the ones for the product inhibition. The values of the critical product concentration, Pcrit, beyond which no microbial growth exists are practically equal for both cases. Next, the powers n are also too close considering the estimated scatter. Numerical computation of the product inhibition term in Equation (2) for the highest substrate concentration shows that there is negligible difference in their numerical values for the cases with and without electric field application, i.e., Levenspiel’s model cannot distinguish the product inhibition for these two cases.
One more general conclusion can be drawn. That is, the main effect of the electric field is due to the increase in product depletion rate, γ. It is evident in both kinetic models. Obviously, it reflects on the product yield coefficient, even when the product inhibition on microbial growth is not pronounced, cf. the data for Levenspiel’s model.
3.3. Experimental Data and Model Curves
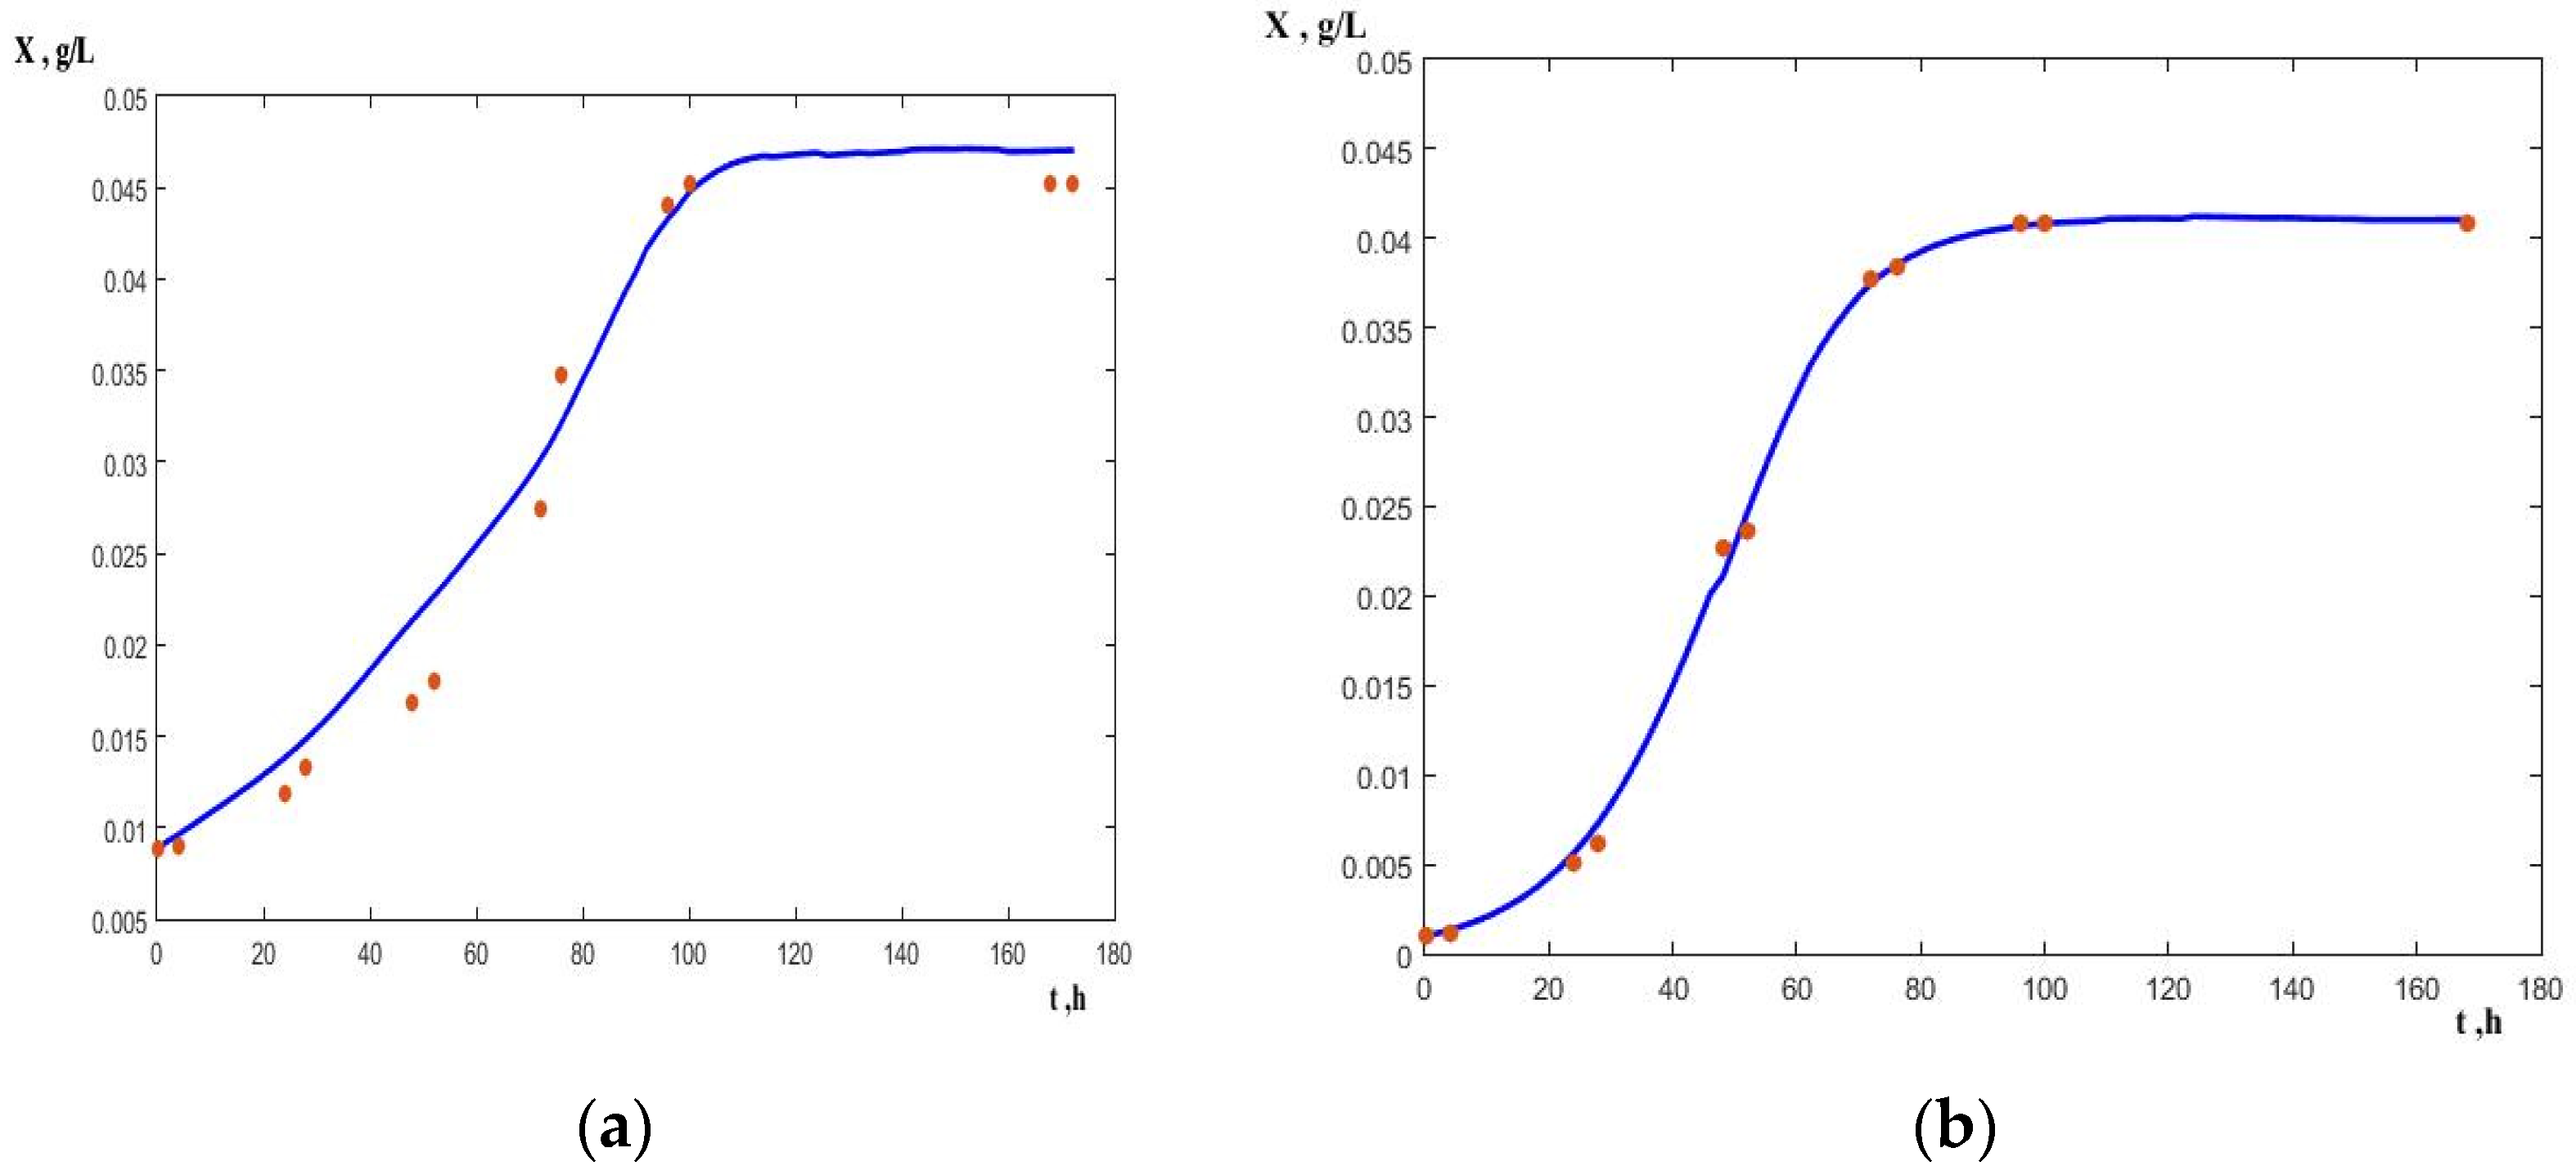
A comparison of the experimental data and the model curves according to the Monod–Yerusalimsky model for microbial growth with and without the electric field for an initial concentration of 0.15 g dm
−3 is shown in
Figure 3. It is seen that in the case of electric field stimulation the steady state in microbial growth is attained at about the 70th hour, whereas it is attained at the 90th hour in the control experiment. A similar result is obtained at an initial concentration of 0.1 g dm
−3.
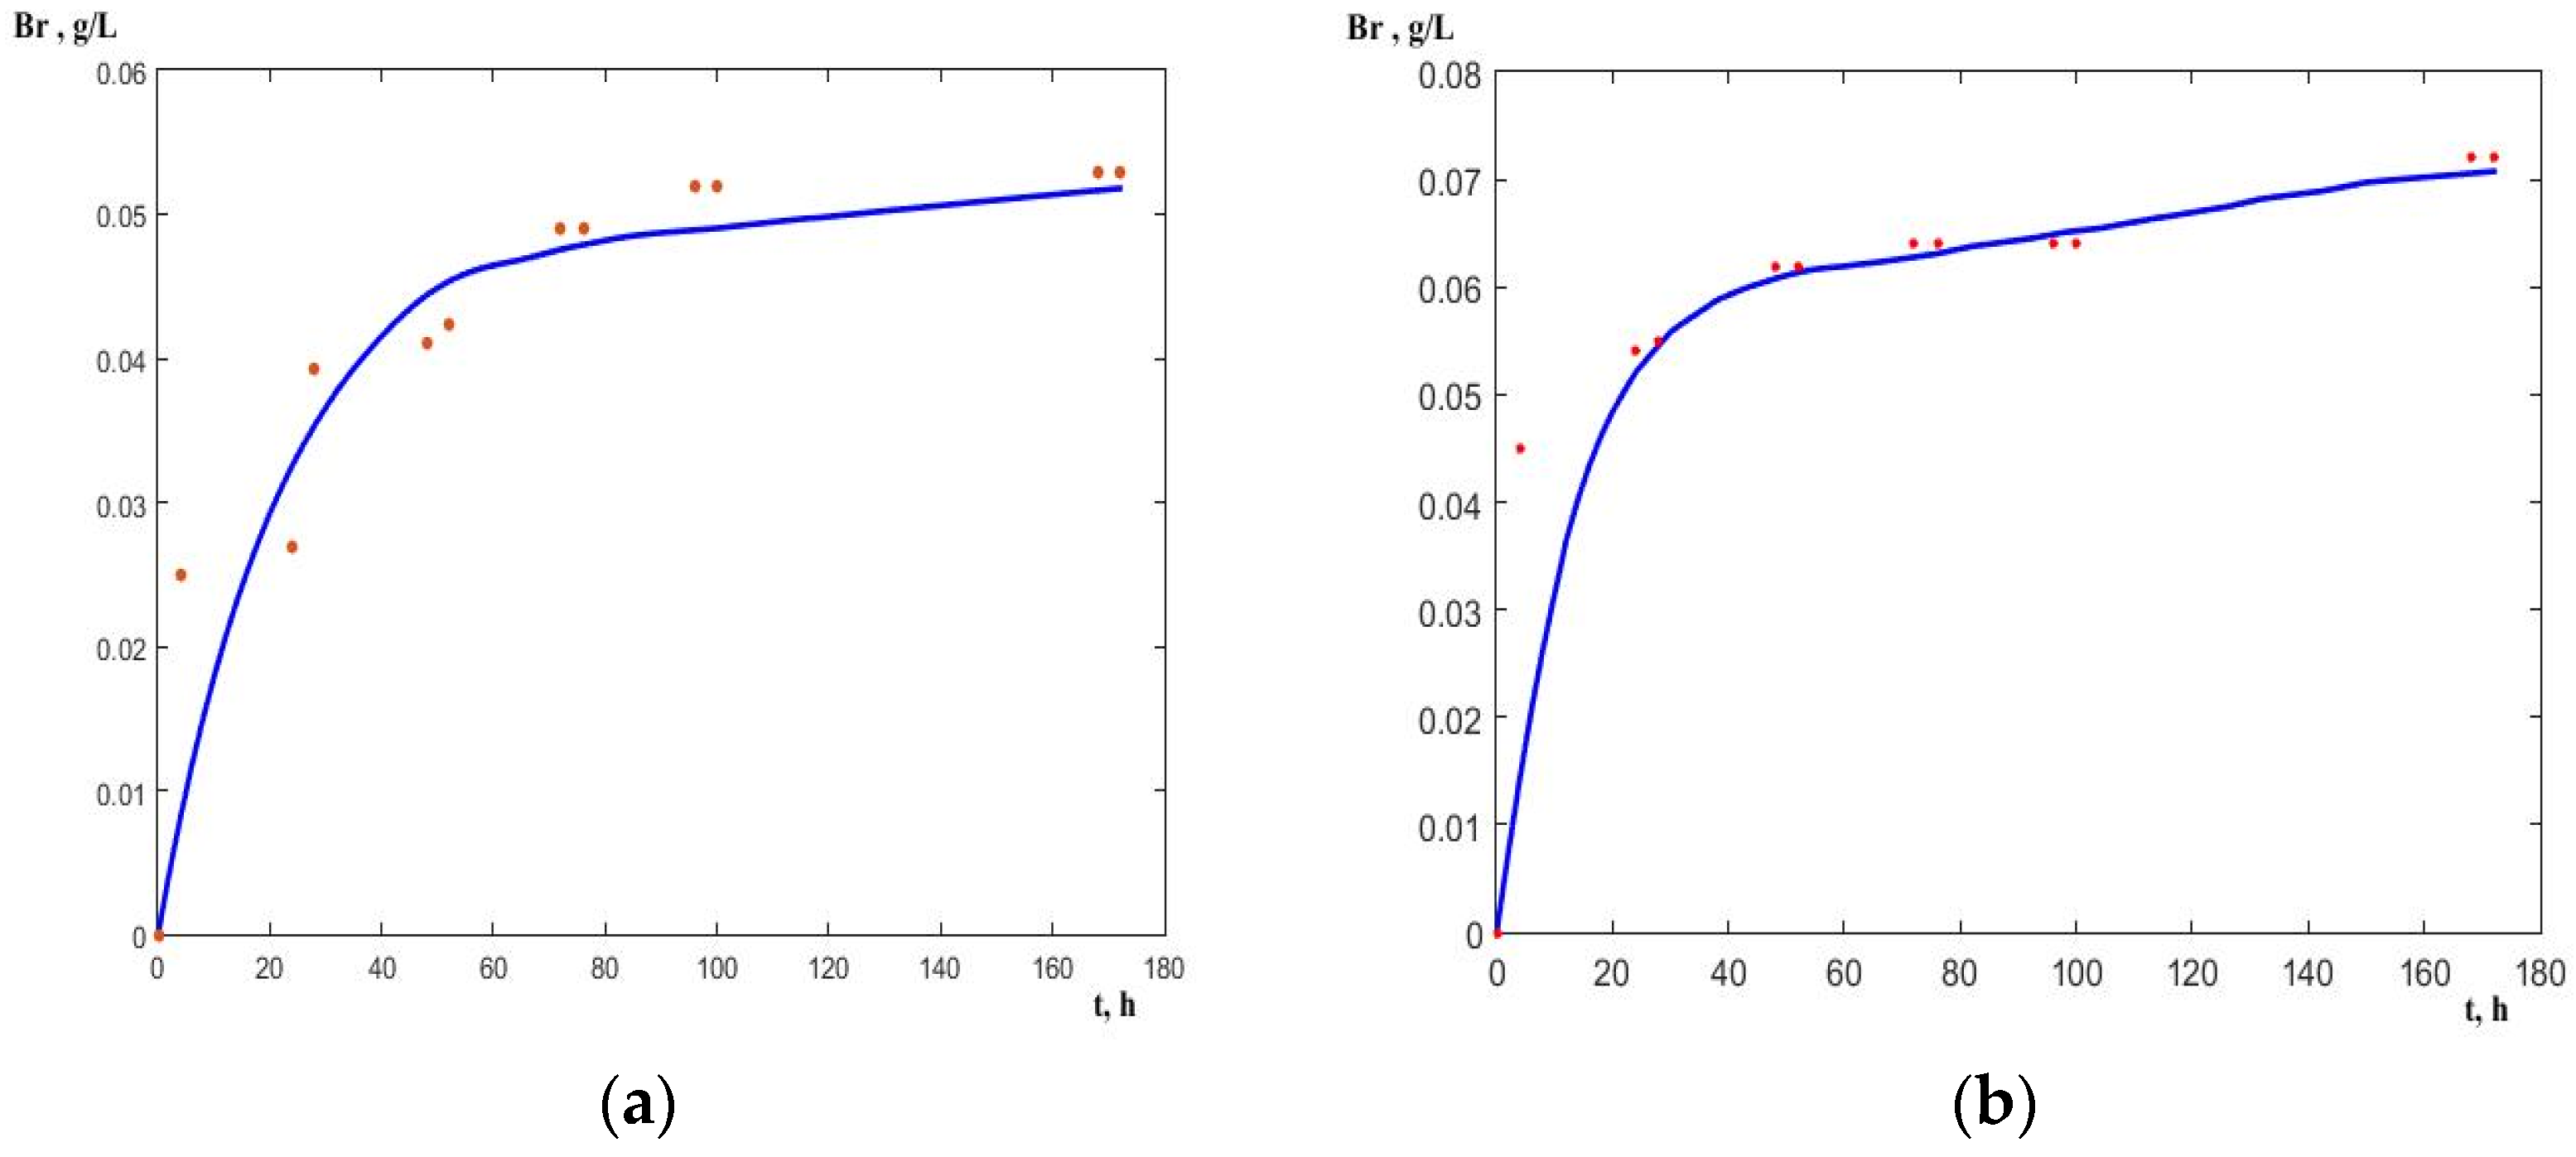
A comparison of the model curves with the experimental data for bromide release is shown in
Figure 4 and
Figure 5. The review of the experimental data in
Figure 4 shows that the release of the second bromine atom is retarded in the control run (
Figure 4a) compared to the one with an electric field (
Figure 3b). At the initial substrate concentration of 0.1 g dm
−3, the release of the first bromine atom, (i.e., the complete depletion of the substrate) ends approximately at the 52nd hour in the control run with a bromide concentration of 0.0423 g dm
−3, whereas the release of the second one reached 0.0525 g dm
−3 to the 170th hour. As a reference, the stoichiometric bromide concentration after complete dehalogenation must be 0.085 g dm
−3 for this initial concentration.
When the electric field was applied, the release of the first bromine atom ended at the 4th hour at the same initial concentration, cf.
Figure 4b. The second bromine atom was almost completely released at the 172nd hour (bromide concentration reached 0.072 g dm
−3) whereas it did not happen in the control experiment.
These effects are not so evident at the higher substrate concentration, i.e., 0.15 g dm
−3. Probably, it is because of the stronger product inhibition, cf.
Figure 5. The first bromine atom was not completely released in the control experiment where the bromine concentration reached 0.0525 g dm
−3 (
Figure 5a). At this initial substrate concentration, a complete release of the first bromine atom the bromide concentration must be 0.064 g dm
−3. It was attained at the 80th hour when the electric field was applied,
Figure 5b.
The release of the second bromine atom was strongly impeded at this initial concentration of 1,2 = dibromoethane. It corresponds to the lower values of the rate of product decay coefficient
γ for this initial concentration, cf.
Table 1 and
Table 2.
4. Discussion
A comparison of averaged values of the estimated parameters for the studied concentrations by the two models is shown in
Table 3. The data scatter shows in which cases we can consider the effect of the electric field as significant and when, in case of scattering overlapping, such an effect is not significant.
There is a clear effect of the electric field on the kinetic constants determined by the use of both models, cf.
Table 3. The main effects are in the maximum specific growth rate,
µmax = (0.45 ± 0.012) h
−1. It is approximately 12% higher than in the case of no electric field application. The effect of the electric field on the inhibition constant, estimated by the model of Monod–Yerusalimsky is also better pronounced.
Some of the estimated parameters are not affected by the electric field. They are the saturation constants kS for both of the used models, the yield biomass coefficients YX/S, the critical product values, and the exponent n for the Levenspiel model. The overlapping of the scatters for these estimated parameters shows that there are no significant differences between the ones estimated for the control experiments and those obtained at the applied constant electric field.
The most significant effect of the electric field is the rate constant for the product decay γ. It is from 23 to 236% higher than in the control experiments with the highest value estimated by the Monod–Yerusalimsky model at an initial substrate concentration of 0.05 g dm−3.
There is also a strong effect on the product yield coefficient YP/S, tending to reach the stoichiometric value of 0.665 for an initial concentration of 0.1 g dm−3 when the electric field is applied.
5. Conclusions
The mathematical modeling of experimental data for 1,2-dibromoethane biodegradation in a constant electric field by bacterial cells of Bradyrhizobium japonicum 273 shows that the main effect of the electric field is due to the enhanced product removal from the broth by electrochemical oxidation. This product, namely 2-bromoethanol, is an inhibitor and its removal facilitates microbial growth and the substrate to product conversion, reaching a yield coefficient close to the stoichiometric one.
In the considered case, the Monod–Yerusalimsky model is more sensitive to the evaluation of the effect of the electric field on microbial growth inhibition than the model of Levenspiel.
Based on the obtained results of mathematical modeling one can draw the following conclusions.
One of the most sensitive effects of the constant electric field on biodegradation of 1,2-bromoethanol is the enhancement of microbial growth, expressed by the increase in the maximum specific growth rate µmax and the increase in the inhibition constant when the model of Monod–Yerusalimsky is applied.
The main effect of the electric field is in the increase in the rate constant of 2-bromoethanol removal by electrochemical oxidation, enabling the enhancement the microbial growth and substrate conversion to the product. Next, the oxidation of 2-bromoethanol results in almost complete substrate depletion with the release of bromine.
The model of Levenspiel is not so sensitive to the effects of the electric field on production inhibition and the electrochemical oxidation of 2-bromoethanol.
This approach of mathematical processing of experimental data of fermentation processes can be successfully applied for determining the microbial growth pattern and inhibition processes caused by higher substrate concentrations, based on the selected mathematical models.


