Article

Advanced HRT-Controller Aimed at Optimising Nitrogen Recovery by Microalgae: Application in an Outdoor Flat-Panel Membrane Photobioreactor

by
Juan Francisco Mora-Sánchez
1,2,
Josué González-Camejo
1,3,*,
Aurora Seco
1 and
María Victoria Ruano
1
1
CALAGUA—Unidad Mixta UV-UPV, Departament d’Enginyeria Química, Universitat de València, Avinguda de la Universitat s/n, 46100 Valencia, Spain
2
Direcció General de Canvi Climàtic, Generalitat Valenciana, C/Democràcia 77, 46018 Valencia, Spain
3
Department of Science and Engineering of Materials, Environment and Urban Planning-SIMAU, Università Politecnica delle Marche, Via Brecce Bianche 12, 60131 Ancona, Italy
*
Author to whom correspondence should be addressed.
ChemEngineering 2022, 6(2), 24; https://doi.org/10.3390/chemengineering6020024
Submission received: 20 December 2021 / Revised: 5 March 2022 / Accepted: 14 March 2022 / Published: 16 March 2022

Abstract

:
A fuzzy knowledge-based controller of hydraulic retention time (HRT) was designed and tested in an outdoor membrane photobioreactor (MPBR) to improve nitrogen recovery from a microalgae cultivation system, maintaining the algae as photosynthetically active as possible and limiting their competition with other microorganisms. The hourly flow of the MPBR system was optimised by adjusting the influent flow rate to the outdoor environmental conditions which microalgae were exposed to at any moment and to the nitrogen uptake capacity of the culture. A semi-empirical photosynthetically active radiation (PAR) prediction model was calibrated using total cloud cover (TCC) forecast. Dissolved oxygen, standardised to 25 °C (DO25), was used as an on-line indicator of microalgae photosynthetic activity. Different indexes, based on suspended solids (SS), DO25, and predicted and real PAR, were used as input variables, while the initial HRT of each operating day (HRT0) and the variation of HRT (ΔHRT) served as output variables. The nitrogen recovery efficiency, measured as nitrogen recovery rate (NRR) per nitrogen loading rate (NLR) in pseudo-steady state conditions, was improved by 45% when the HRT-controller was set in comparison to fixed 1.25-d HRT. Consequently, the average effluent total soluble nitrogen (TSN) concentration in the MPBR was reduced by 47%, accomplishing the discharge requirements of the EU Directive 91/271/EEC.

1. Introduction

Due to its capacity to assimilate nutrients from wastewater and carbon dioxide from the atmosphere, microalgae biotechnology has been used to treat wastewater for decades [1] and nowadays represents a key technology to develop water resource recovery facility (WRRF) schemes [2,3]. The first studies related to microalgae were based on extensive waste stabilisation ponds (WSP) [4]. WSP consist of large shadow basins where wastewater is treated and aerated. These systems are simple and low-cost (with minimal civil works), but their biological activity is often limited and entail huge land requirements, i.e., in the order of hundreds of hectares [5]. As a consequence, microalgae cultivation in WSP is usually limited to small rural areas where huge land surfaces are available [6,7].
As an enhanced version of WSP, high-rate algal ponds (HRAPs) are designed to increase microalgae performance by improving the reactor’s mechanical and structural characteristics [8,9,10]. In this respect, Morillas-España et al. [11] reported maximum nitrogen and phosphorus removal of 29.1 mg N·L−1·day−1 and 1.5 mg P·L−1·day−1, respectively, at a hydraulic retention time (HRT) of 5 days, which is much lower than those reported by Abis and Mara [6], i.e., 11–86 days. Despite this improvement, land requirements of HRAP reactors can still be as high as 10 m2 per equivalent person [12]. Consequently, most existing HRAPs are small or medium scale, i.e., in the range 1–50 hectares [13]. Alternatively, closed photobioreactors (PBRs), such as tubular, vertical and flat-panel PBRs are engineer-based microalgae cultivation systems designed to improve microalgae photosynthetic efficiency by isolating the culture from outer contamination and better controlling the factors that affect microalgae growth, such as temperature, pH and light distribution [8,10,14]. However, the operational costs of PBRs are considerably higher than HRAPs, which makes wastewater treatment not economically competitive [12,15]. As a next step, membrane photobioreactor (MPBR) systems have recently been developed to increase nutrient loading rates to PBRs while maintaining microalgae biomass inside the reactors for longer. This is attained by decoupling the HRT and the solids retention time (SRT), enabling reduction in land requirements while maintaining (or even improving) microalgae activity [16,17,18,19]. Some recent advances have been made in the application of MPBR systems for wastewater treatment. As an example, González-Camejo et al. [20] obtained a high-quality effluent (which met legal requirements) in an outdoor MPBR system which operated at constant HRT of 1.25 days. However, these conditions were only maintained for 25 days. After this period, microalgae activity fell due to unfavourable climatic conditions and, in consequence, nutrient effluent concentrations surpassed legal limits. Moreover, the photosynthetic efficiency of the system was only in the range of 5.40–5.68%, with maximum theoretical photosynthetic efficiencies up to 12% [21]. Finally, the operational (OPEX) and capital expenditures (CAPEX) in this study still remained high. All these drawbacks could be improved by using monitoring tools and instrumentation, control and automation (ICA) systems that can help to improve the efficiency and robustness of the system.
There are some examples of control strategies based on dynamic modelling of data to predict microalgae behaviour. For instance, Pawlowski et al. [22] described a model-based control to regulate pH by CO2 addition in open microalgae cultivation ponds. Robles et al. [23] used pH and dissolved oxygen (DO) sensors to assess microalgae performance during the start-up of a raceway pond. In addition, Foladori et al. [24] evaluated the nitrogen and phosphorus removal of a laboratory-scale microalgae-bacteria culture using pH, DO and oxidation-reduction potential (ORP) sensors, while Hossain et al. [25] developed empirical models to predict nitrogen and phosphorus removal from a microalgae-based municipal wastewater treatment system. Other authors have used artificial neural networks (ANN) to model and predict the microalgae biological activity according to the input data [26]. These control systems obtained valuable information about microalgae performance. However, they cannot accurately predict how the variability of ambient parameters and the biochemical state of the culture can affect microalgae in the next hours or days, which can have significant consequences on the process robustness. In this respect, approaches using weather forecasts coupled to detailed predictive models of microalgae productivity have been used by other authors [27,28]. The relation between microalgal growth, nitrogen uptake and storage, and dissolved oxygen production in a polyculture cultivated in open algal ponds has also been established [29]. All these authors have been faced with the complexity of modelling variable environmental conditions and their effects on biological cultures. Further research on this topic is therefore needed to obtain proficient ICA controllers that can improve the performance of microalgae-based wastewater treatment systems.
Fuzzy logic appears to be a useful tool to control wastewater treatment operations. In this kind of process, conditions depend not only on physical conditions but also on microbiological activities that are usually related to culture inertia (apart from the variability in physical and chemical conditions) [30]. There are plenty of successful examples of optimised wastewater complex processes using this kind of advanced controller [31,32,33]. However, little information can be found regarding advanced control in microalgae cultivation systems, the majority being used to increase biofuel production from microalgae biomass rather than improving microalgae-based wastewater treatment performance [34,35,36]. Consequently, there is huge potential for advanced control in microalgae-based wastewater treatment technology. Proficient ICA systems require appropriate monitoring to gather all the relevant information about the process. With respect to microalgae-based wastewater treatment process basic parameters, such as photosynthetically active radiation (PAR), temperature, pH and dissolved oxygen are usually monitored on-line since they are widely known to affect microalgae [15,37,38,39,40,41,42]. However, to gain comprehensive knowledge of these systems and to provide relevant information to operators about microalgae biological activity (and that of their competitors), nutrient consumption, etc., other parameters are needed [43,44,45]. Off-line laboratory-based measurements (for instance, suspended solids (SS) and nutrient concentrations) are often employed to gather this information, but the data obtained from them is limited since punctual performance variations and decays due to limiting and inhibitory conditions cannot be assessed. Moreover, they entail expensive and time-consuming analyses that require a certain delay [24,46]. Finding performance indicators (PI) of microalgae activity (that overcome these hurdles) can help to develop models and tools which, in turn, can serve to monitor and control microalgae-based systems. As an example, González-Camejo et al. [30] developed an on-line monitoring system based on data obtained from pH data dynamics. They showed that the first derivate of pH data variations (pH’) could be correlated (over both short- and long-term) with microalgae photosynthetic activity. However, this pH’ depends on several factors. The model has, thus, to be adapted to each cultivation system and to treatment conditions, limiting its applicability.
The aim of this study was to use an ICA system based on a knowledge-based fuzzy logic approach to increase the performance of a pilot-scale MPBR system in terms of nitrogen recovery from sewage by hourly modification of the operating HRT according to variations in ambient conditions, with the goal of improving the feasibility and competitiveness of microalgae-based wastewater treatment systems.

2. Materials and Methods

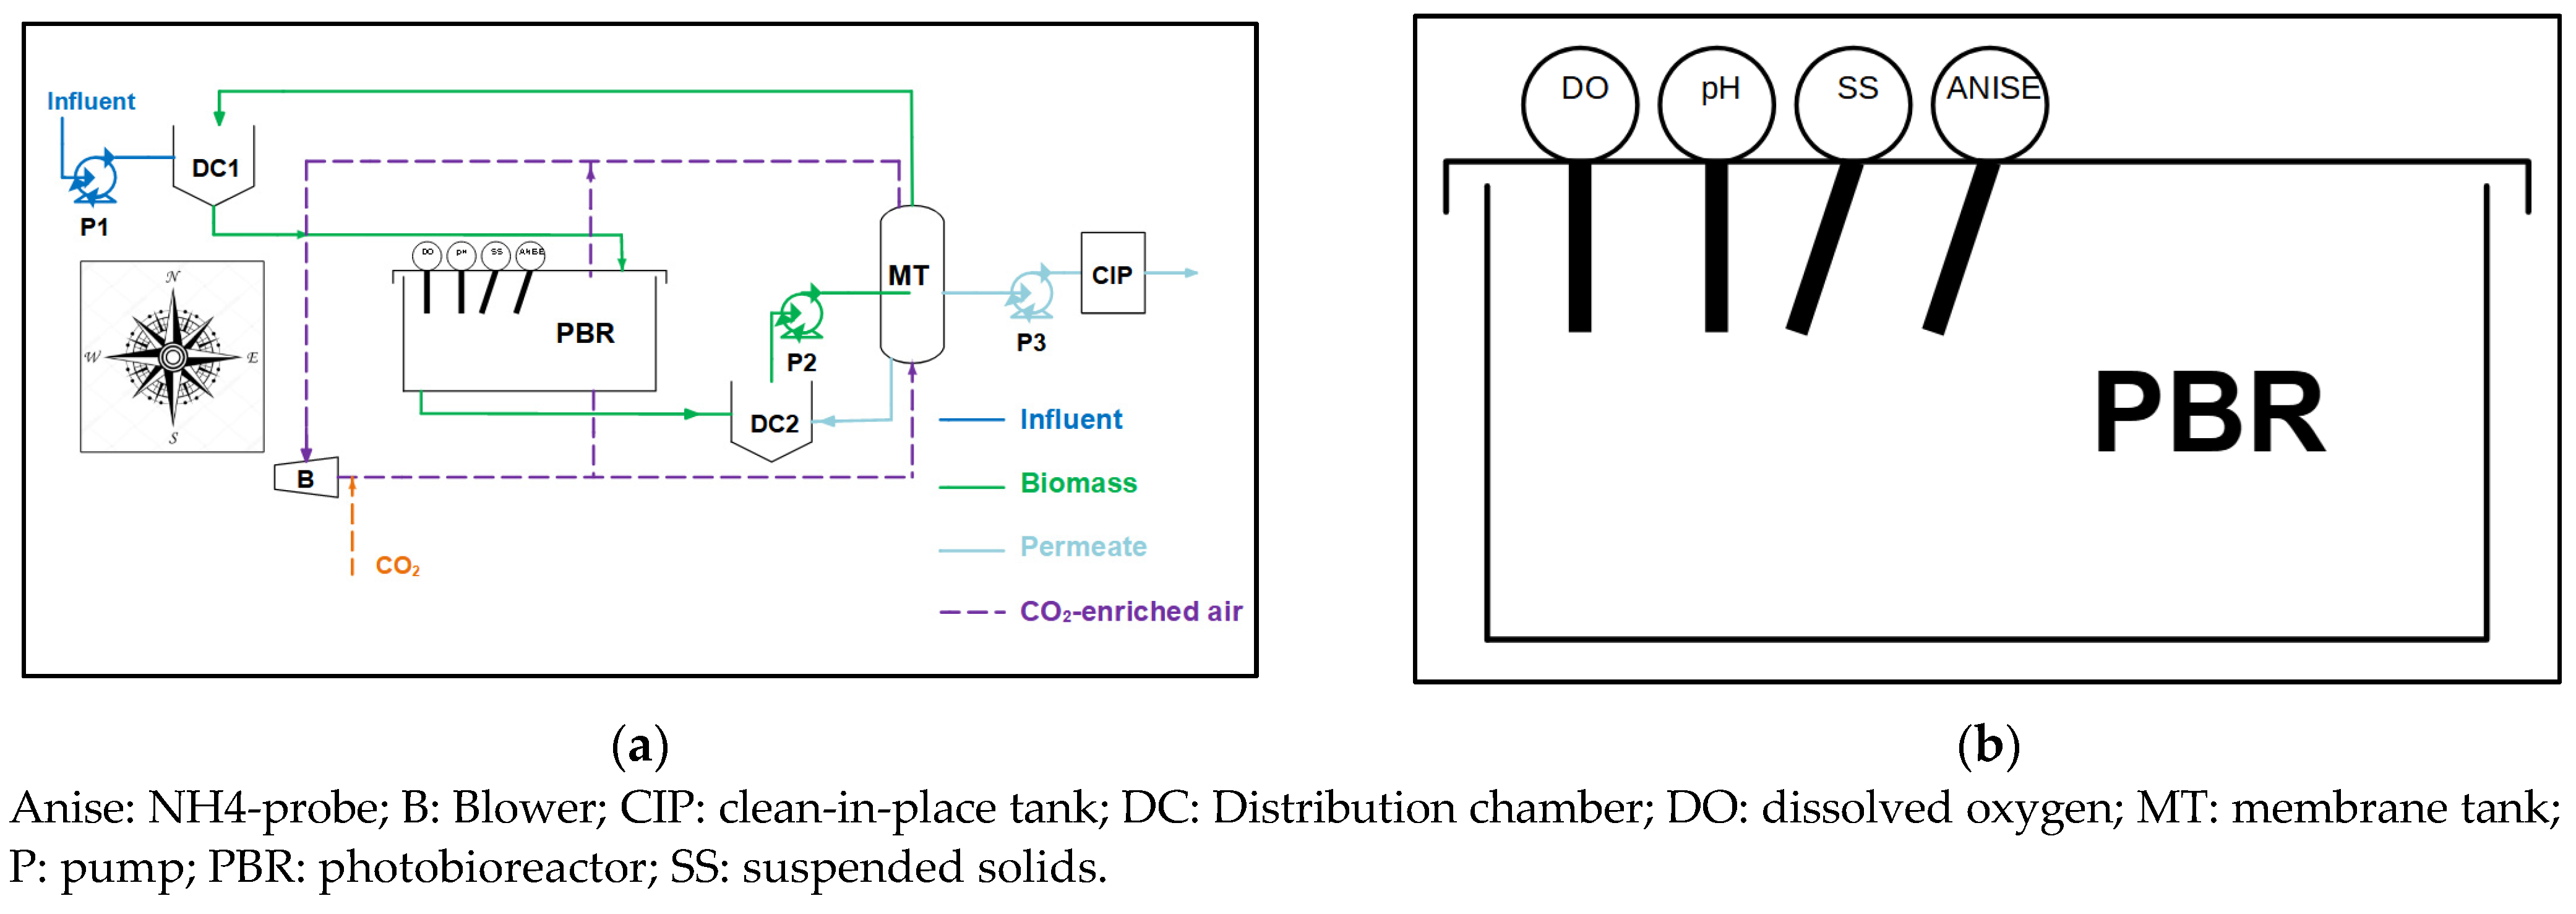
2.1. MPBR Pilot Plant

The MPBR plant (Figure 1) was set out as a side nitrogen recovery system in a water resource recovery facility (WRRF) scheme. It was placed in the facilities of the Carraixet WWTP (Valencia, Spain) and consisted of a flat-plate PBR connected to an ultrafiltration membrane tank (MT). This allowed the separation of microalgae biomass from the water permeate, enabling decoupling of the SRT from the HRT. The PBR was closed to the atmosphere and perfectly mixed by air at 0.2–0.25 vvm. pH was controlled by injecting pressurised CO2 (99.9%) into the air stream when the pH value was over the setpoint of 7.5. Twelve white LED lamps (Unique Led IP65 WS-TP4S-40W-ME) were installed at the dark surface of the PBR, offering a continuous irradiance of 300 μmol·m−2·s−1 with the goal to avoid possible side effects and to ensure the results were comparable to those obtained (at fixed HRT) in a previous study [20].

2.1.1. Instrumentation and Automation

The following on-line sensors were installed: (i) one pH-temperature sensor (pHD sc DPD1R1, Hach Lange); (ii) one dissolved oxygen sensor (LDO sc LXV416.99.20001, Hach Lange); (iii) one irradiation sensor (Apogee Quantum SQ-200) on the PBR front surface to measure the PAR; (iv) one ammonium-nitrate sensor (AN-ISE sc LXV440.99.00001, Hach Lange) to measure the concentration of NH4+ and NO2 + NO3; and (v) one suspended solids sensor (SOLITAX ts-line sc LXV423.99.00100) to monitor the suspended solids (SS) concentration. Probes (i), (ii), (iv) and (v) were submerged into the left side of the PBR, 20 to 40 cm from the top surface. Figure 1 shows a scheme of the system including the probe locations.
The regular maintenance of the pH sensors consisted of replacing the salt bridge and the buffer once a year and calibrating them with a frequency of two weeks. In the case of the oxygen and ammonium sensors, the membrane was replaced every three months. Oxygen sensors were calibrated in saturated air every two weeks, while the ammonium sensor was calibrated every week with the results obtained in the laboratory from grab samples following the method described in Section 2.3. The SS sensor was calibrated in an analogous way to the ammonium sensor.
To achieve representative values of SS and total soluble nitrogen (TSN), previous experience in the use of SOLITAX probes for SS concentration measurements and ANISE probes to monitor NH4+ and NO2 + NO3 concentrations was considered. The SOLITAX probe was equipped with colour correction and an automatic wiper, which improved probe accuracy. An exhaustive cleaning protocol was established for both probes, and they were both installed with a 30-degree deviation from the regular perpendicular angle to the PBR surface (Figure 1b) as this was found to prevent probe fouling and to obtain more stable data. Sensors were connected to a PLC to perform the process control and data acquisition. The PLC was connected to a PC provided with supervisory control and data acquisition (SCADA) software to view the process parameters and store the signals. Other transmitters were installed to measure the flow rate, level, pressure, etc. Further information about this control system was reported in Viruela et al. [41].

2.1.2. Microalgae Substrate and Inoculum

The microalgae substrate consisted of filtrated (pore size 0.03 µm) wastewater from the effluent of Carraixet WWTP where nutrients were added (nitrogen, phosphorus and carbon) to achieve similar nutrient concentrations to those of an AnMBR pilot plant that treated real sewage [47]. To do this, the following reagents were added to the substrate: 210 mg·L−1 of NH4Cl, 24 mg·L−1 of KH2PO4, and 85 mg·L−1 of NaHCO3. The average characteristics of the nutrient-enriched substrate (MPBR influent) during the operation can be seen in Table 1.
The microalgae culture was obtained from a previous experiment [20]. Originally, microalgae were derived from the walls of the secondary clarifiers of the Carraixet WWTP [48]. As a consequence, the culture was composed of a mix of green microalgae (mainly Coelastrella and Scenedesmus) and heterotrophic and nitrifying bacteria. To favour microalgae growth with respect to their competitors, the startup procedure described in González-Camejo et al. [18] was followed.
To avoid the side-effects of nitrification on the process, allylthiourea (ATU) was added to the culture to inhibit nitrifier activity [49]. This practice would not be feasible at industrial scale (due to its associated costs and environmental impacts), but it was considered necessary for comparison with previous results.

2.1.3. Operation of the Pilot Plant

The experiment was performed for 55 days in spring. The pilot plant was operated at a fixed SRT of 2.25 days, but under variable ambient conditions (Table 2). At the beginning of each hourly cycle of the controlling period, the corresponding amount of culture volume was automatically purged and refilled to maintain this fixed SRT. Afterwards, the HRT was calculated each hour by the fuzzy logic controller (see Section 2.2.2) and then the corresponding amount of water was automatically permeated to maintain this calculated HRT. Only light hours were considered for this operation.

2.2. HRT Controller and Meteorological Model

2.2.1. Monitoring Parameters and HRT Controller Indexes

To control and monitor microalgae performance, the data obtained from the monitoring sensors (Section 2.1.1) was used. From this data, the following parameters were calculated: (i) the dissolved oxygen standardised to 25 °C (DO25) (1); (ii) the first derivative of DO25 variations for the previous hour (DO25′) (2); (iii) the DO25′ normalised by microalgae biomass measured as SS (monitored by the sensor) (DO25′:SS) (3); (iv) the nitrogen recovery rate (NRR) (mgN·L−1·day−1) normalised by microalgae biomass (NRR:SS) (4); (v) the biomass productivity (BP) (mgSS·L−1·day−1) normalised by microalgae biomass (BP:SS) (5); (vi) the slope of the relation between DO25and PAR (DO25sl) (6); (vii) an index combining the average SS of the previous day (SS_YD_AV) and the average predicted PAR of the operating day (HRT_I1) (7); (viii) the PAR predicted according to the meteorological model based on the total cloudiness forecast (Section 3.2) as moving average for the following 60 min (PAR_MA60_FW); (ix) the PAR moving average for the previous 60 min (PAR_MA60_FB); and (x) the slope of the relation between DO25 and PAR standardised with SS (DO25sl:SS) (8):
DO 25 = DO DOsat DO 25 sat
DO 25 = d DO 25 dt
DO 25 : SS = DO 25 SS · 10 3
NRR : SS = NRR SS · 10 3
BP : SS = BP SS · 10 2
DO 25 sl = Δ DO 25 Δ PAR · 10 5
HRT _ I 1 = 0.5 · SS _ YD _ AV + PAR _ TDA _ AV
DO 25 sl : SS = DO 25 sl SS
where DO (mg O2·L−1) is the dissolved oxygen concentration measured by the sensor; DOsat is the saturation concentration of dissolved oxygen at the microalgae culture temperature and DO25sat is the saturation concentration of dissolved oxygen at 25 °C, both calculated by the procedure described in Sander [50]; SS (mg·L−1) is the suspended solids concentration monitored by the sensor; NRR is the nitrogen recovery rate measured in the system and BP is the biomass productivity, both calculated by the equations reported by González-Camejo et al. [20]; ΔDO25 is the variation of DO25 in a defined period of time, and ΔDO25_YD is the daily variation of ΔDO25 in the previous day; ΔPAR is the variation of PAR in a defined period of time (one day in this case), and ΔPAR_YD is its daily variation from the previous day; DO25sl_YD is the daily DO25sl from the previous day; PAR_TDA_AV (µmol·m−2·s−1) is the daily average predicted PAR for the operating day (Section 3.2); and SS_YD_AV (mg·L−1) is the daily average of SS measured by the sensor on the previous day.

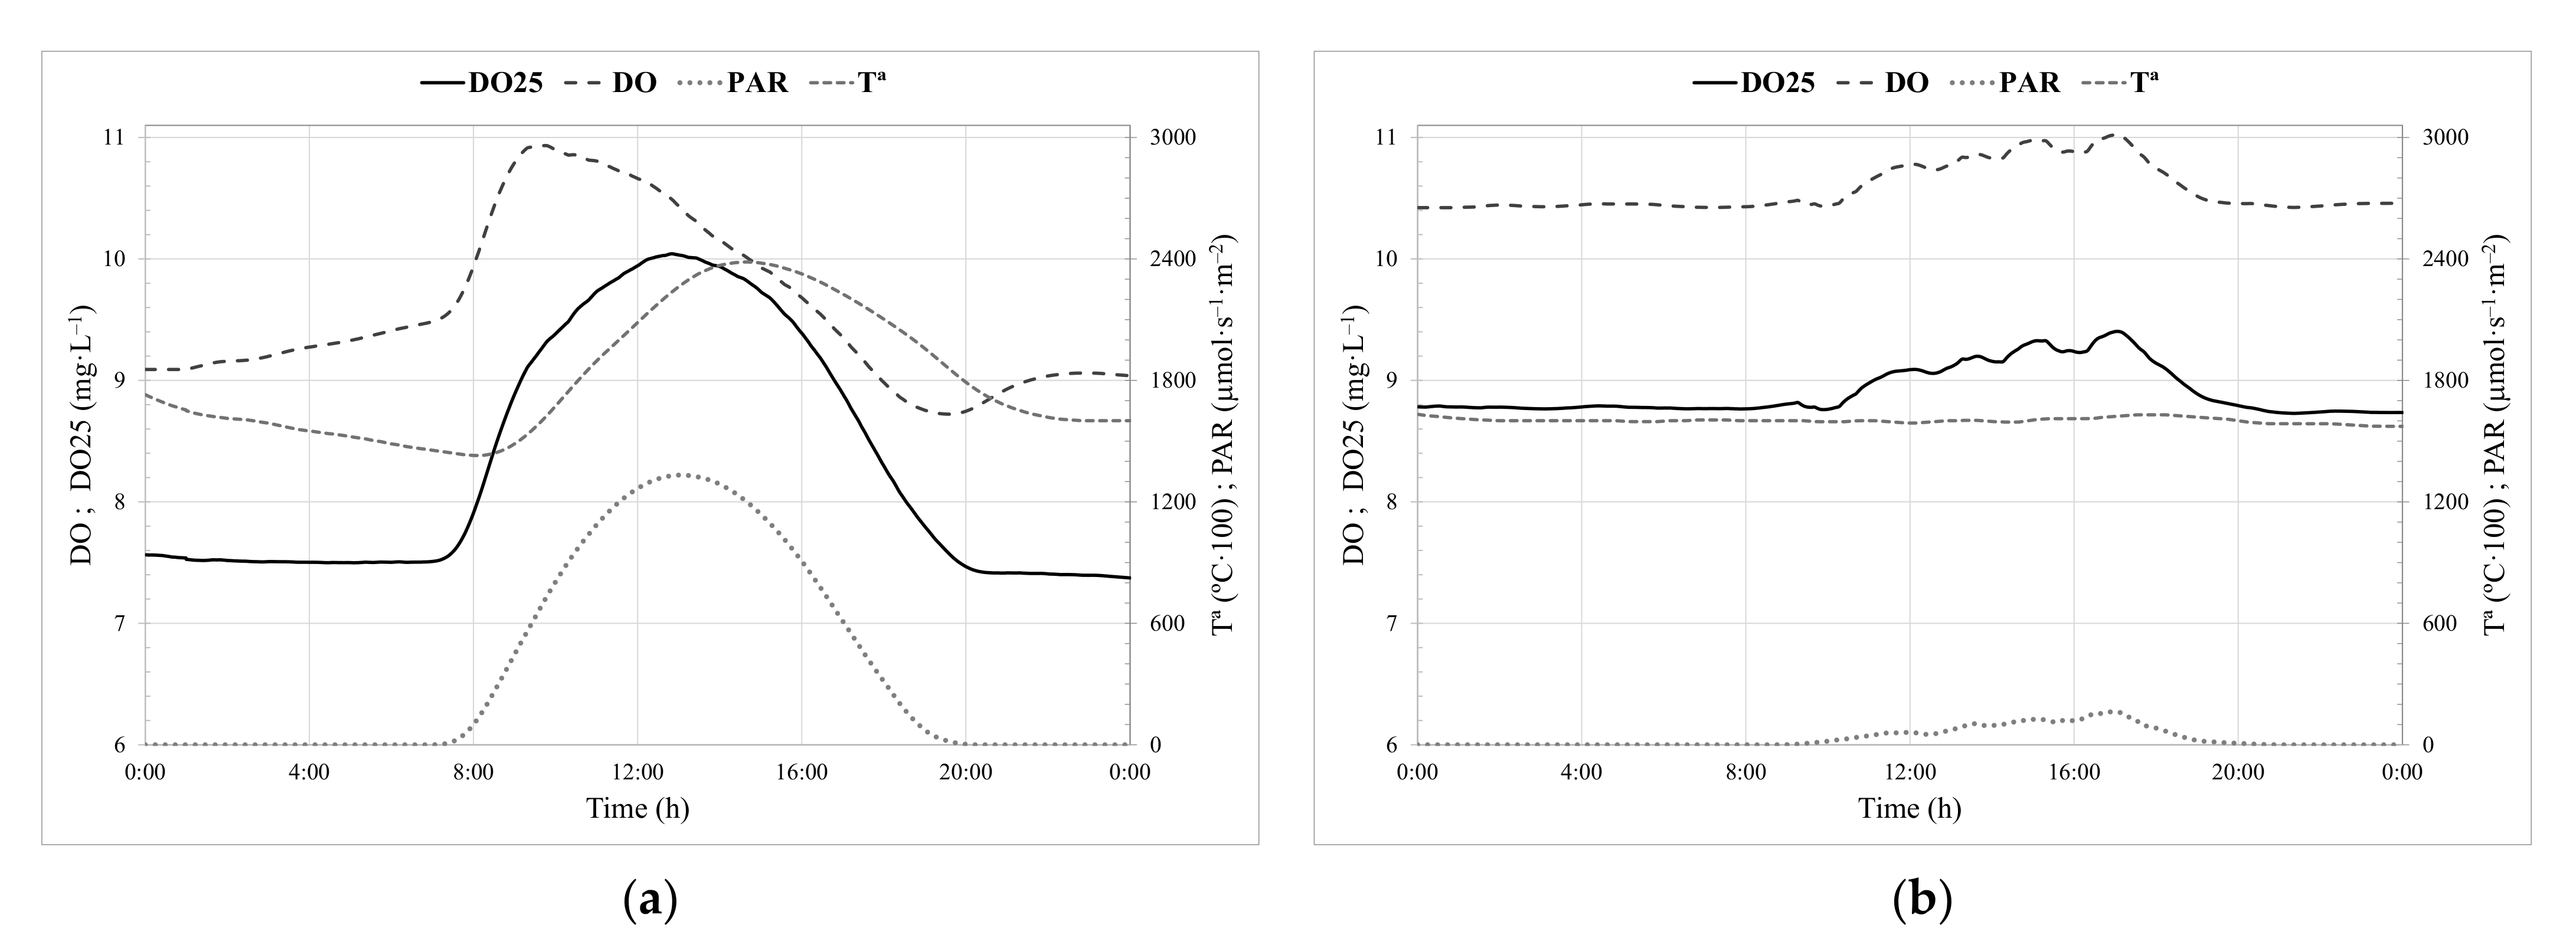
Dissolved Oxygen Standardised to 25 °C (DO25)

In this closed MPBR system, DO concentration would depend on air flow rate and mixing, temperature and microalgae photosynthetic activity [30]. Air flow and mixing were kept constant, so were their effects over DO. To directly correlate DO to microalgae activity, the temperature effect must be neglected by standardising to a reference temperature (25 °C), obtaining the DO25 parameter. This standardisation was achieved by subtracting the difference between the saturation concentration of dissolved oxygen at the microalgae culture temperature and the saturation concentration of dissolved oxygen at 25 °C.

HRT_I1 Index

NRR is related to the culture photosynthetic activity (indirectly measured by DO25sl), biomass concentration (SS) and light conditions (PAR). A normalised multivariable correlation was performed with historical database daily average values, using SS, PAR and DO25sl to correlate them with NRR (R2 = 0.4955; p-value < 0.05). The resulting weights of the parameters were 18%, 34% and 48%, for SS, PAR and DO25sl, respectively, which was very close to a 1:2:3 relation. To simplify, it was decided to combine SS and PAR in a single parameter, i.e., HRT_I1, defined in (7), by adjusting the weight of SS at half of its value. This parameter was used to calculate an appropriate initial HRT (HRT0) (Section 2.2.3) before the daytime operation started, using SS_YD_AV and predicted PAR_TDA_AV as the most accurate values related to biomass and light irradiance, respectively.

2.2.2. Auxiliar Meteorological Model for the HRT Controller

A fuzzy knowledge-based controller of HRT was developed to regulate the influent wastewater flow to the MPBR system according to its instantaneous treatment capacity. For this, the time of sunrise, culmination and sunset were established by means of a meteorological model simulated for the PAR prediction. In this model, the first hour after sunrise and the last hour before sunset were not considered, establishing a daily working interval between those points, where the number of hourly cycles was fixed around the culmination time.
The first step of the model for the PAR prediction was based on establishing the PAR_MAX in cloudless conditions as a correlation was found between experimental data and the cosine of maximum daily solar altitude angle (γs_MAX) (Section 3.2), which was easily obtained using the methodology from Page [51].
Latitude (φ) and longitude (λ) positions, together with the day number of the year, allowed the astronomical calculation of some variables of interest for each moment of the daytime, using the methodology of Page [51], including: declination (δ), hour angle (ω), solar altitude angle (γs), azimuth angle of the sun (αs), sunrise hour, and culmination and sunset hours. As already stated, the PBR was vertical, which implied a slope angle (β) of 90°, oriented to the south. By convention in the Northern Hemisphere, the azimuth angle of the surface (α) was thus 0°.
The astronomical variables showed, for a full sunny day, a Gaussian-like distribution of PAR between PAR = 0 at sunrise time and PAR = 0 at sunset, i.e., increasing PAR values to PAR_MAX at culmination hour, and decreasing PAR values after that to zero values. The distribution was directly proportional to cos ν, where ν was the angle of incidence between the sun and normal to the PBR’s surface. It was calculated by the methodology from Page [51] adapted to a vertical surface (9):
cos ν = cos γ s · cos α s α
cos ν (9) had a minimum value at sunrise and sunset hours, and a maximum at culmination hour. A normalisation was therefore made to establish the values between 0 (minimum) and 1 (maximum) along daytime (10):
( cos ν ) N = cos ν min ( cos ν ) day max ( cos ν ) day min ( cos ν ) day
PAR for full sunny days (cloudless) was calculated at any moment of the daytime (11):
PAR Cloudless = PAR MAX · ( cos ν ) N
The cloudiness factor was included using a Haurwitz-type Equation (12):
PAR(Cloudiness)/PAR(Cloudless) = (1 − a·(% TCC)/100)b
As this model is semi-empirical, a calibration stage was needed (Section 3.2).

2.2.3. Initial HRT Controller

As at nighttime the MPBR system was not fed (i.e., HRT was infinite), an initial HRT (HRT0) was needed. HRT0 was calculated using DO25sl_YD and HRT_I1 as controller inputs. At the beginning of each cycle, the controller inputs were DO25′:SS and PAR_MA60_FW. The controller output was ΔHRT, i.e., the difference between the previous HRT (applied to the previous daylight hour) and the following HRT. This calculated HRT was applied to the reaction volume divided by the number of cycles in the following hour of operation. In consequence, a different HRT was used for each cycle of the day according to the estimated treatment capacity. There were some heuristic rules in order to narrow the application range to an appropriate one or to correct the effect of significative differences between predicted and real PAR registered.
For each operating day, the controller set an initial HRT (HRT0) from which the controller action started. HRT0 cannot be constant since different conditions of the culture photosynthetic activity, biomass concentration and light conditions would define different starting points. The hourly HRT controller (see Section 2.2.4) was designed to last a few hours to progressively increase the treatment capacity in a sunny day, but it barely actuated in extremely cloudy conditions. Consequently, fixing an initial and appropriate HRT0 was needed to allow the wide or narrow hourly variation, relating it to an average treatment capacity represented by HRT0, that would be smaller on cloudy days to allow some action and larger on sunny days to allow for progressive action.
HRT0 depended on the culture biomass concentration (SS_YD_AV), the light forecast for the whole day (PAR_TDA_AV), and the culture photosynthetic activity (measured as DO25sl_YD). These three variables were related to NRR, as has already been explained (Section 2.2.2), combining SS_YD_AV and PAR_TDA_AV in the HRT_I1 parameter. In summary, the input variables for stage 1 of setting the HRT0 controller were: (i) HRT_I1, and (ii) DO25sl_YD.
The methodology was based on Ruano et al. [33]. In stage 2, the so-called “fuzzification”, the input variables were converted into linguistic variables (fuzzy set), which are represented in this study by Gaussian shape membership functions and defined by the Equation (13):
μ p = e p c 2 2 · σ 2
where p is the numerical value of the variable; and c and σ are the centre and amplitude of the Gaussian membership functions to fuzzify each input variable (“Large” L, “Medium” M, “Small”, S).
The output variable is HRT0. To defuzzify it, five Gaussian membership functions were used (“Extra Large” XL, “Large” L, “Medium” M, “Small” S, “Extra Small” XS). In stage 3, the so-called inference engine, a set of rules was applied to the fuzzy set obtained in stage 2. They are presented in Table 3. The output linguistic variables were obtained in this stage by the Max-Prod operator, following Larsen’s [52] fuzzy inference method, and applying the operator (14) for each rule defined in Table 3:
μ rule , i = 1 j μ j
where j represents each of the input fuzzy sets involved in the rule i.
Similarly, in order to establish only one output linguistic value when the consequences of different rules were the same, the operator (15) was applied as follows:
μ k = Max μ rule , i
In stage 4, the so-called “defuzzification”, these linguistic variables needed to be converted numerically into the corresponding control actions. In Mendel [53], the height defuzzifier method was described, and was used in this study in order to obtain a single output value (P), as expressed in (16):
P = i = 1 n c i · μ p i i = 1 n μ p i
Stage 5, finally, corresponded to the output stage, where the HRT0 was established as the starting point for the operation of the HRT controller.

2.2.4. Hourly HRT Controller

Once HRT0 was fixed, the daytime operation time began, divided into equal hourly cycles. At the beginning of each cycle, as described before, the corresponding amount of culture volume was purged and refilled to maintain a fixed SRT of 2.25 days. The purged volume established the maximum applicable HRT. Consequently, if the output of the HRT controller was bigger than SRT, it adopted the SRT value.
Increasing or decreasing HRT hourly depended on the light forecast for the following hour (PAR_MA60_FW), and the photosynthetic activity of the culture (measured as DO25′:SS). Both variables were inversely related to HRT. If both increased, the capacity of the system also increased and consequently, HRT was shortened. Hence, the input variables for stage 1 of the hourly HRT controller feed-forward action were: (i) PAR_MA60_FW; (ii) DO25′:SS.
The methodology was again based on Ruano et al. [33]. In stage 2, fuzzification, the input variables were converted into linguistic variables using (13) to fuzzify each input variable (“Large” L, “Medium” M, “Small”, S for PAR_MA60_FW; “Large Positive” LP; “Small Positive” SP; “Zero” ZE; “Small Negative” SN, “Large Negative” LN for DO25′:SS). The output variable was ΔHRT. To defuzzify it, five Gaussian membership functions were used (“Large Positive” LP; “Small Positive” SP; “Zero” ZE; “Small Negative” SN, “Large Negative” LN). In stage 3, inference engine, a set of rules was applied to the fuzzy set obtained in stage 2, which are displayed in Table 4. The output linguistic variables were obtained in this stage once again by (14) and (15). In stage 4, defuzzification, these linguistic variables needed to be converted numerically into the corresponding control actions, using (16). Finally, stage 5 corresponded to the output stage of the controller, where the ΔHRT was established and added to HRT0 if the cycle was the first, or to the previous HRT for the rest of cycles.
To prevent the effect of big differences between PAR predicted and real PAR due to forecast failures, when the cycle was over, and before establishing the next cycle conditions, the measured PAR moving average for the last 60 min (PAR_MA60_FB) was calculated and the ΔHRT was recalculated as a feedback action of the hourly HRT controller. If the difference between the applied and recalculated ΔHRT was longer than 0.05 day, a correction was applied to the feed-forward action for the next cycle.

2.2.5. Comparison with Fixed-HRT Calculation

In a previous study, the MPBR system of this study was operated at different SRT/HRT values, fixing diverse conditions in different stages of the study, but in the operating ranges of this study. The database of González-Camejo et al. [20] was used to interpolate MPBR performance at a fixed-HRT of 1.25 days continuously, with the goal of comparing it with the real MPBR performance under the operation of the fuzzy-logic HRT controller developed in this study.

2.3. Sampling and Methods

Grab samples were collected in duplicate from the influent and effluent streams of the MPBR pilot plant twice a week. Ammonium (NH4), nitrite (NO2), and nitrate (NO3) were continuously monitored in the plant with the sensors described in Section 2.1. To calibrate these sensors, these nitrogen compounds were analysed in a Smartchem 200 analyser (WestcoScientific Instruments, Westco, Danbury, CT, USA) according to methods 4500-NH3-G, 4500-NO2-B, and 4500-NO3-H of Standard Methods [54]. Suspended solids of the microalgae culture (from grab samples) were analysed according to Standard Methods [54]: method 2540 E. These values were used to correlate with the SS monitored with the SOLITAX probe (R2 = 0.9903; p-value < 0.05; n = 17).

3. Results and Discussion

3.1. Obtaining the Control Parameters

Since oxygen results from microalgae photosynthesis, oxygen concentration can act as an indicator of microalgae activity [24,55]. In this respect, a previous study of González-Camejo et al. [20] showed a significant correlation between DO concentration and NRR and biomass productivity (p-value < 0.01). However, correlation between DO and PAR was not found. It should be noted that in this previous study, correlations were calculated from average daily values, i.e., considering both daily and night data as a whole, rather than analysing instantaneous changes. In addition, DO should be standardised to constant temperature (in this case, 25 °C) to normalise the parameter. If instantaneous data is analysed, it can be observed that DO25 and PAR evolution during daily hours follow the same trend on both sunny (Figure 2a) and cloudy days (Figure 2b), but for the case of DO (not standardised) on the sunny day, they do not follow the same trend due to the variation of the temperature throughout the day (Figure 2a). Since temperature on the cloudy day was almost constant, the trend of DO and DO25 were similar.
The difference between DO25 during daylight hours and DO25 at night is assumed to be related to microalgae activity. Although DO25 during light hours is influenced by both heterotrophic and nitrifying bacteria activities [56], previous studies in this MPBR plant showed that bacterial activity only accounted for around 4–5% of the microalgae activity [30]. Consequently, the first derivative of the variation of DO25 (DO25′) was calculated as an indicator of microalgae activity. To normalise DO production with biomass, SS concentration values (532 ± 78 mg·L−1 in average) were used as a proxy for microalgae biomass. This was considered a good approximation since a previous study showed a high correlation between suspended solids and microalgae cell concentrations [44]. To corroborate the relationship between DO25′ and microalgae activity, a linear correlation between the daily average DO25sl:SS of the previous day (DO25sl:SS_YD) and NRR:SS (NRR:SS_YD) was obtained, as shown in Figure 3a. The correlation was statistically significant (R2 = 0.5534; p-value < 0.05). Consequently, DO25′:SS appeared to be a good indicator of photosynthetic activity and followed the instantaneous and continuous trend of NRR:SS, as shown in Figure 3b. Analogous parameters based on pH data were found to be correlated with microalgae performance in this MPBR system [30]. However, the normalised parameter based on pH (pH’) can only be obtained if the pH control of the system is turned off, which limits microalgae activity. Nevertheless, the correlation between BP:SS and DO25′:SS presented a much lower R2 value, i.e., 0.2889. This was not surprising since previous studies also showed that the response of the system to variations in operating and ambient conditions was observed more in nitrogen recovery than in biomass productivity [20,44]. Changes in biomass not only depend on instantaneous changes in nutrient assimilation but are also influenced by factors such as cell size, the shadow effect due to biomass, chlorophyll and other substances present in the culture, cell viability, the proliferation of competing and predating organisms, etc. [57,58,59,60]. The normalised parameters based on dissolved oxygen concentration were thus selected to be used in the HRT fuzzy controller (Section 3.3), together with a model to forecast solar irradiance according to total cloud cover (Section 3.2).

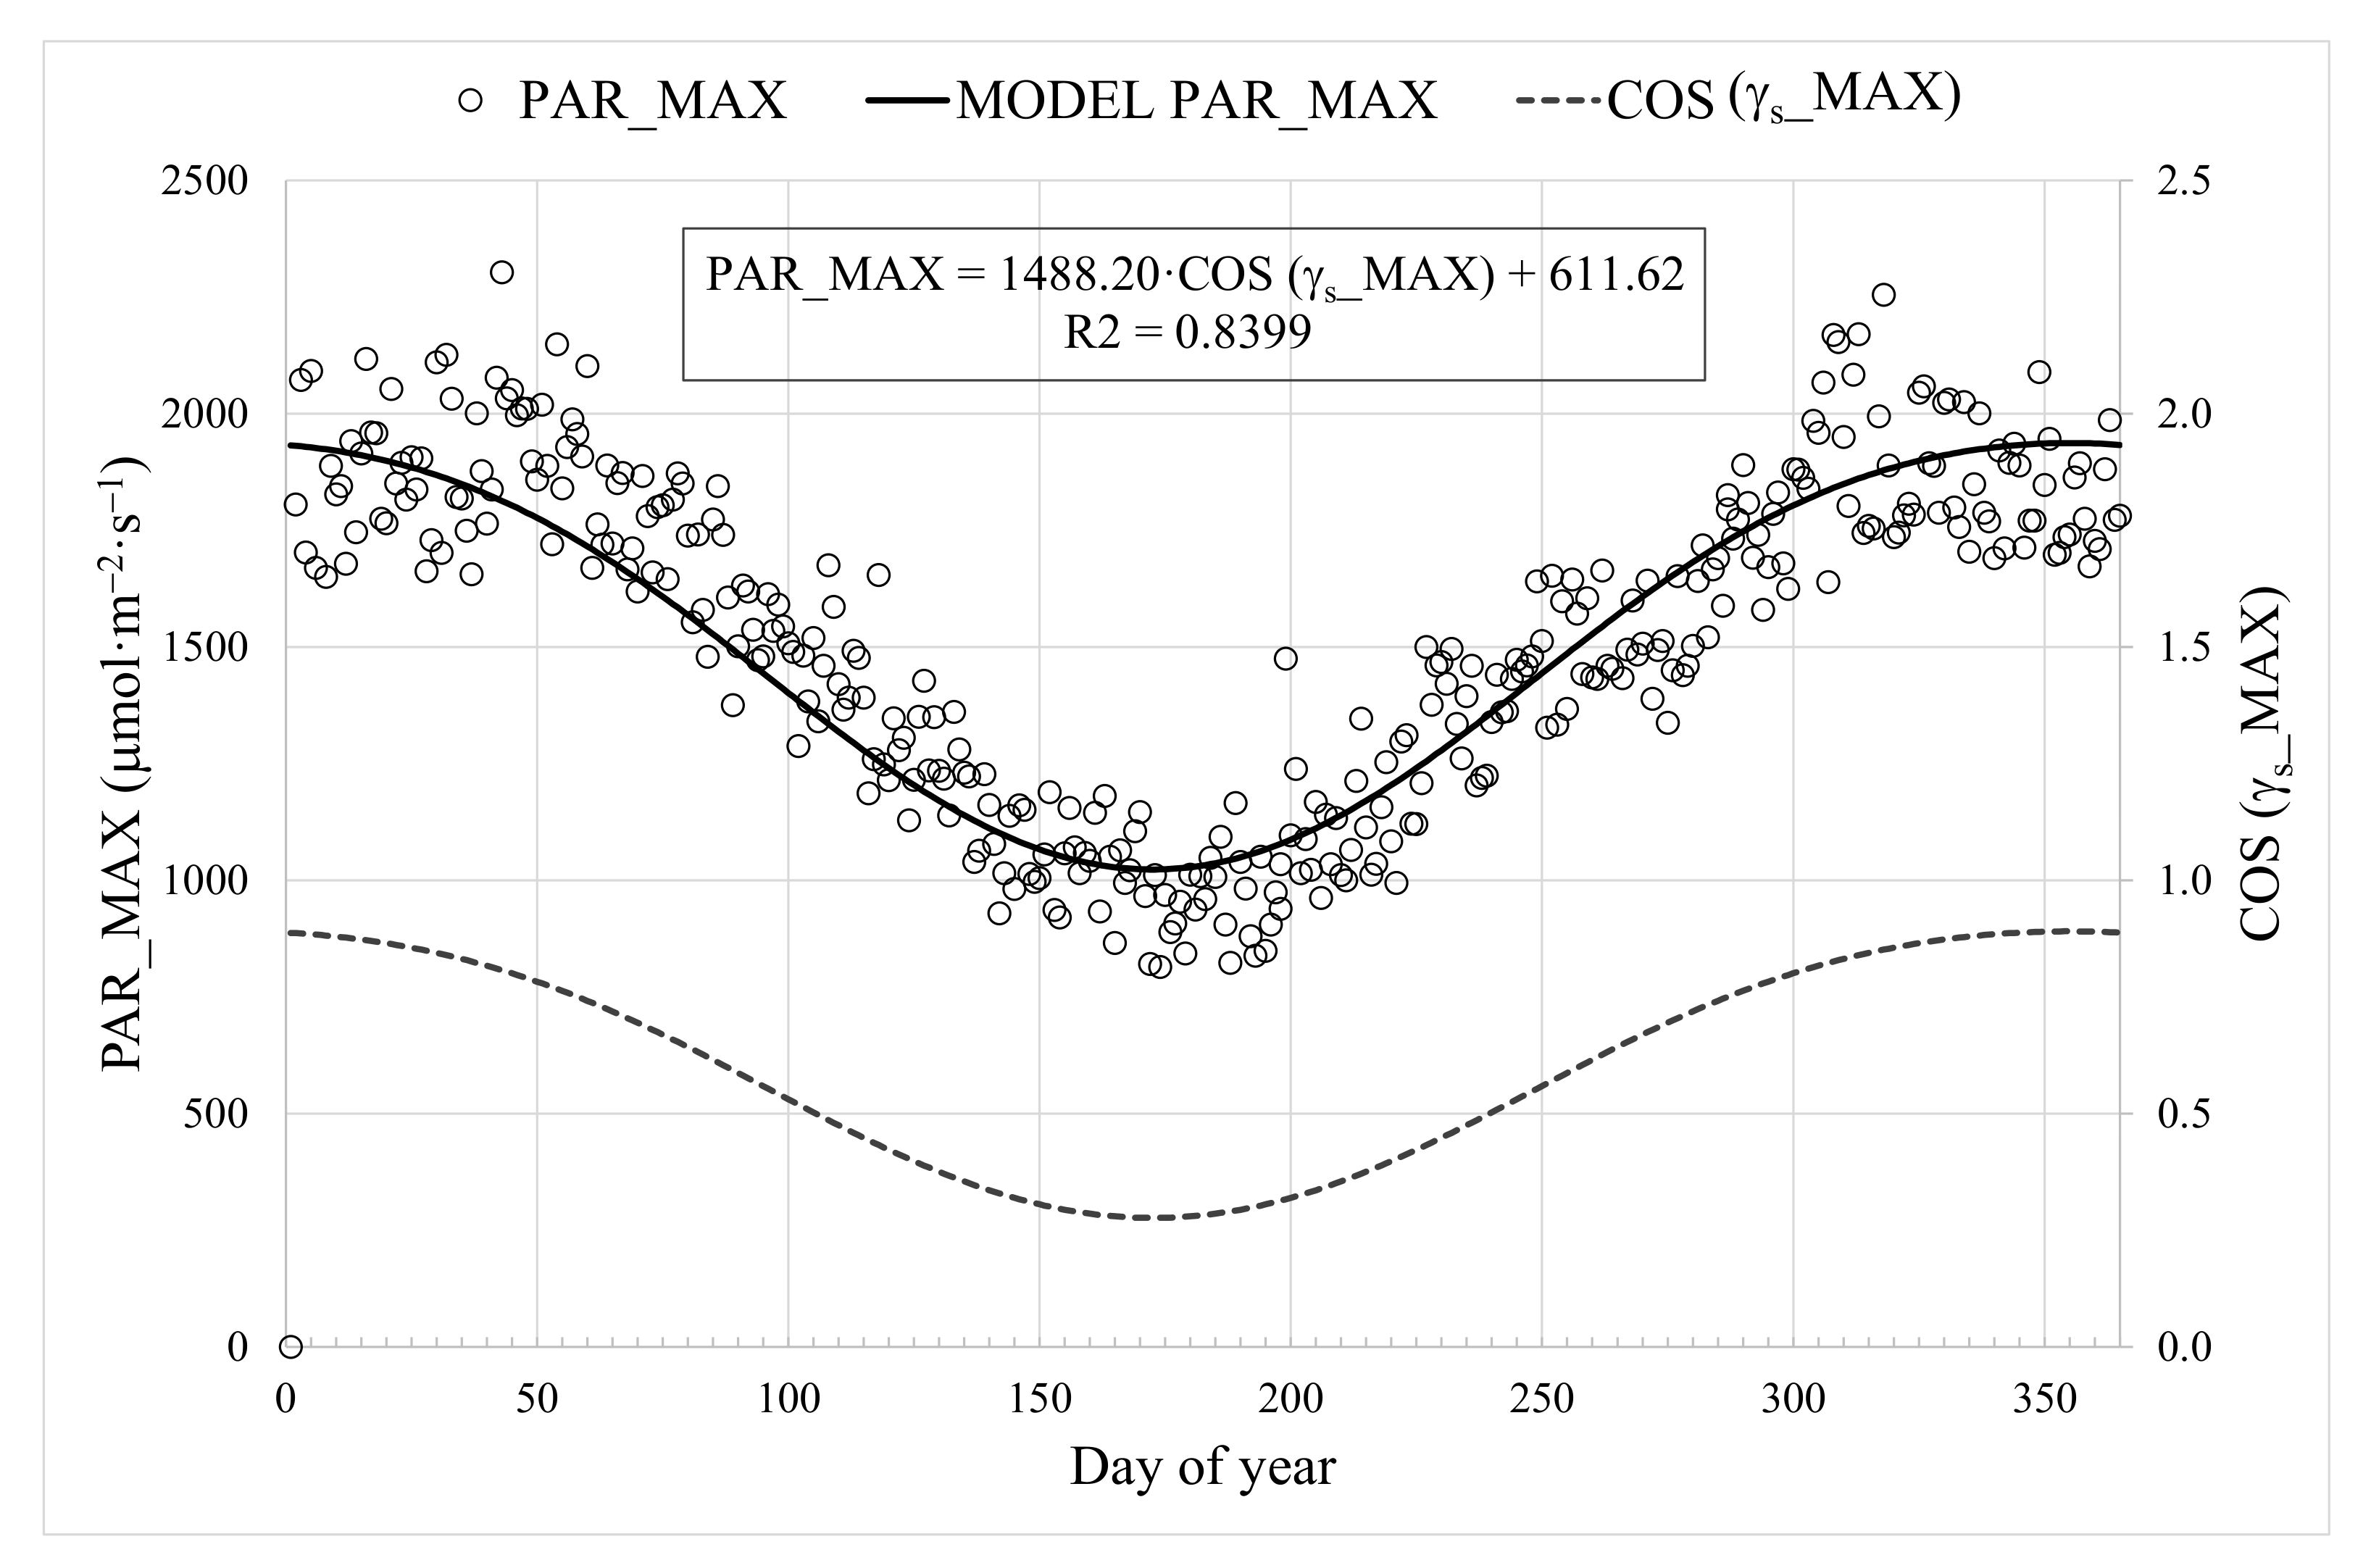
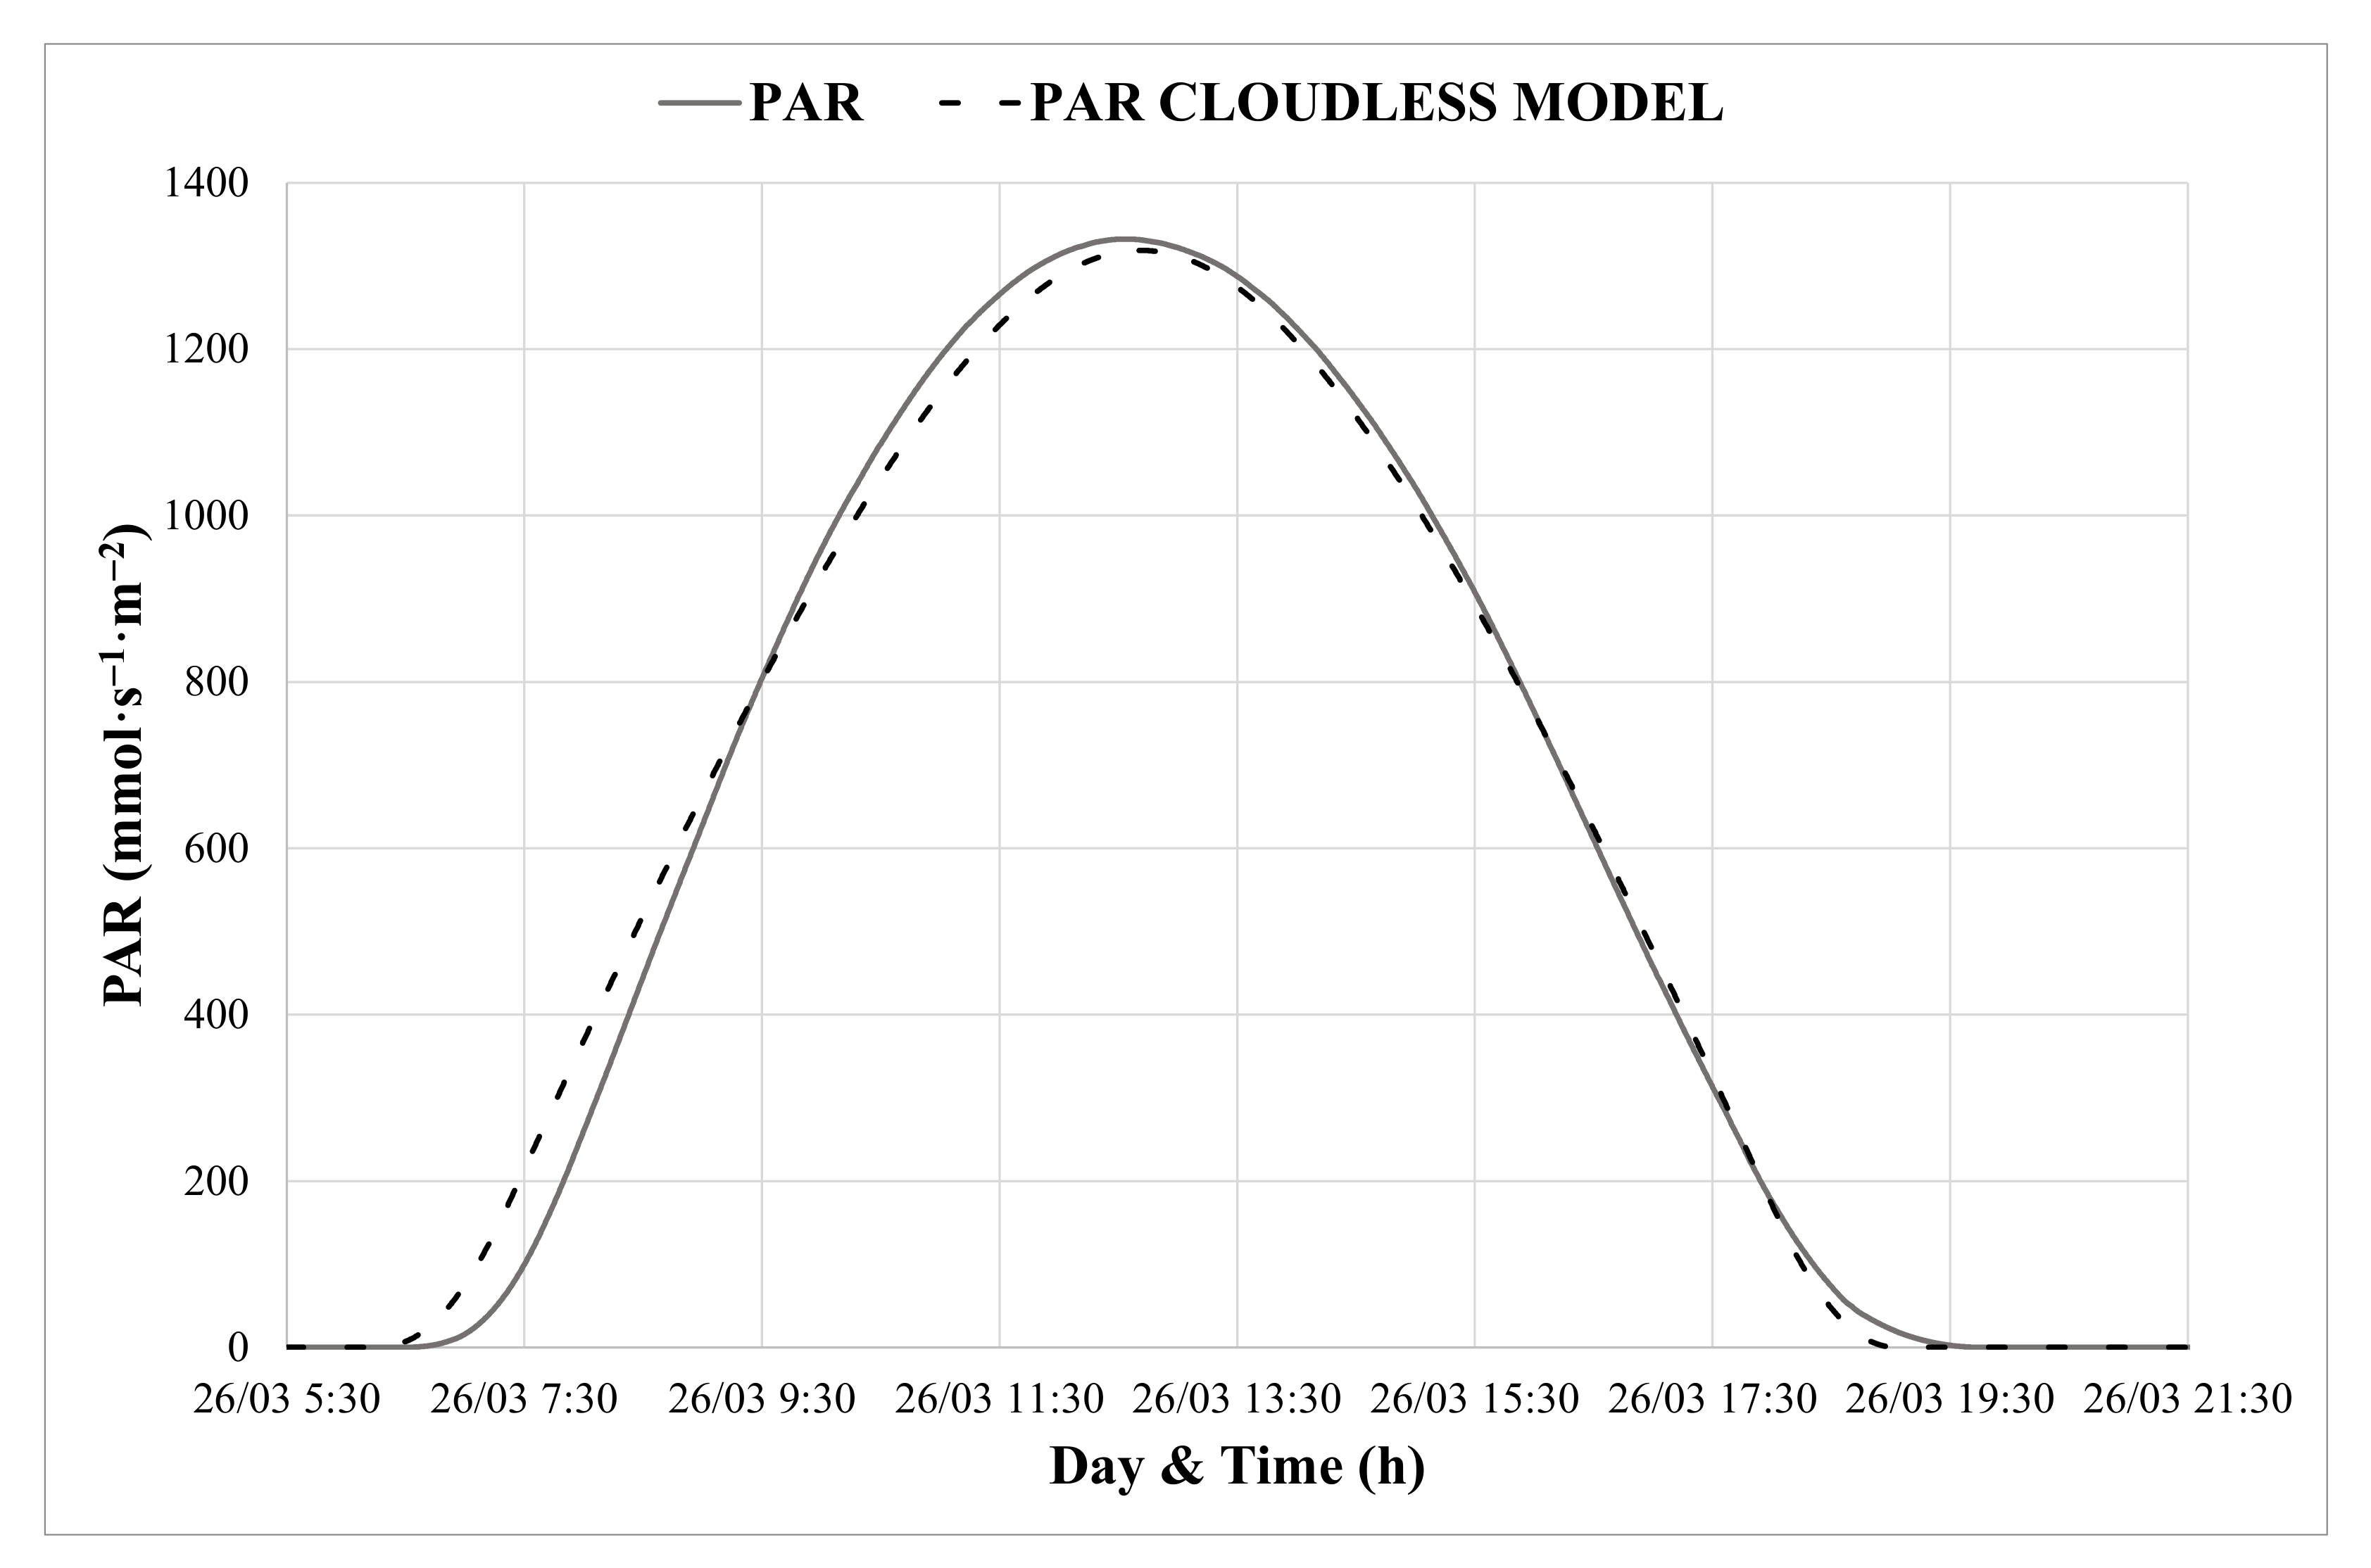
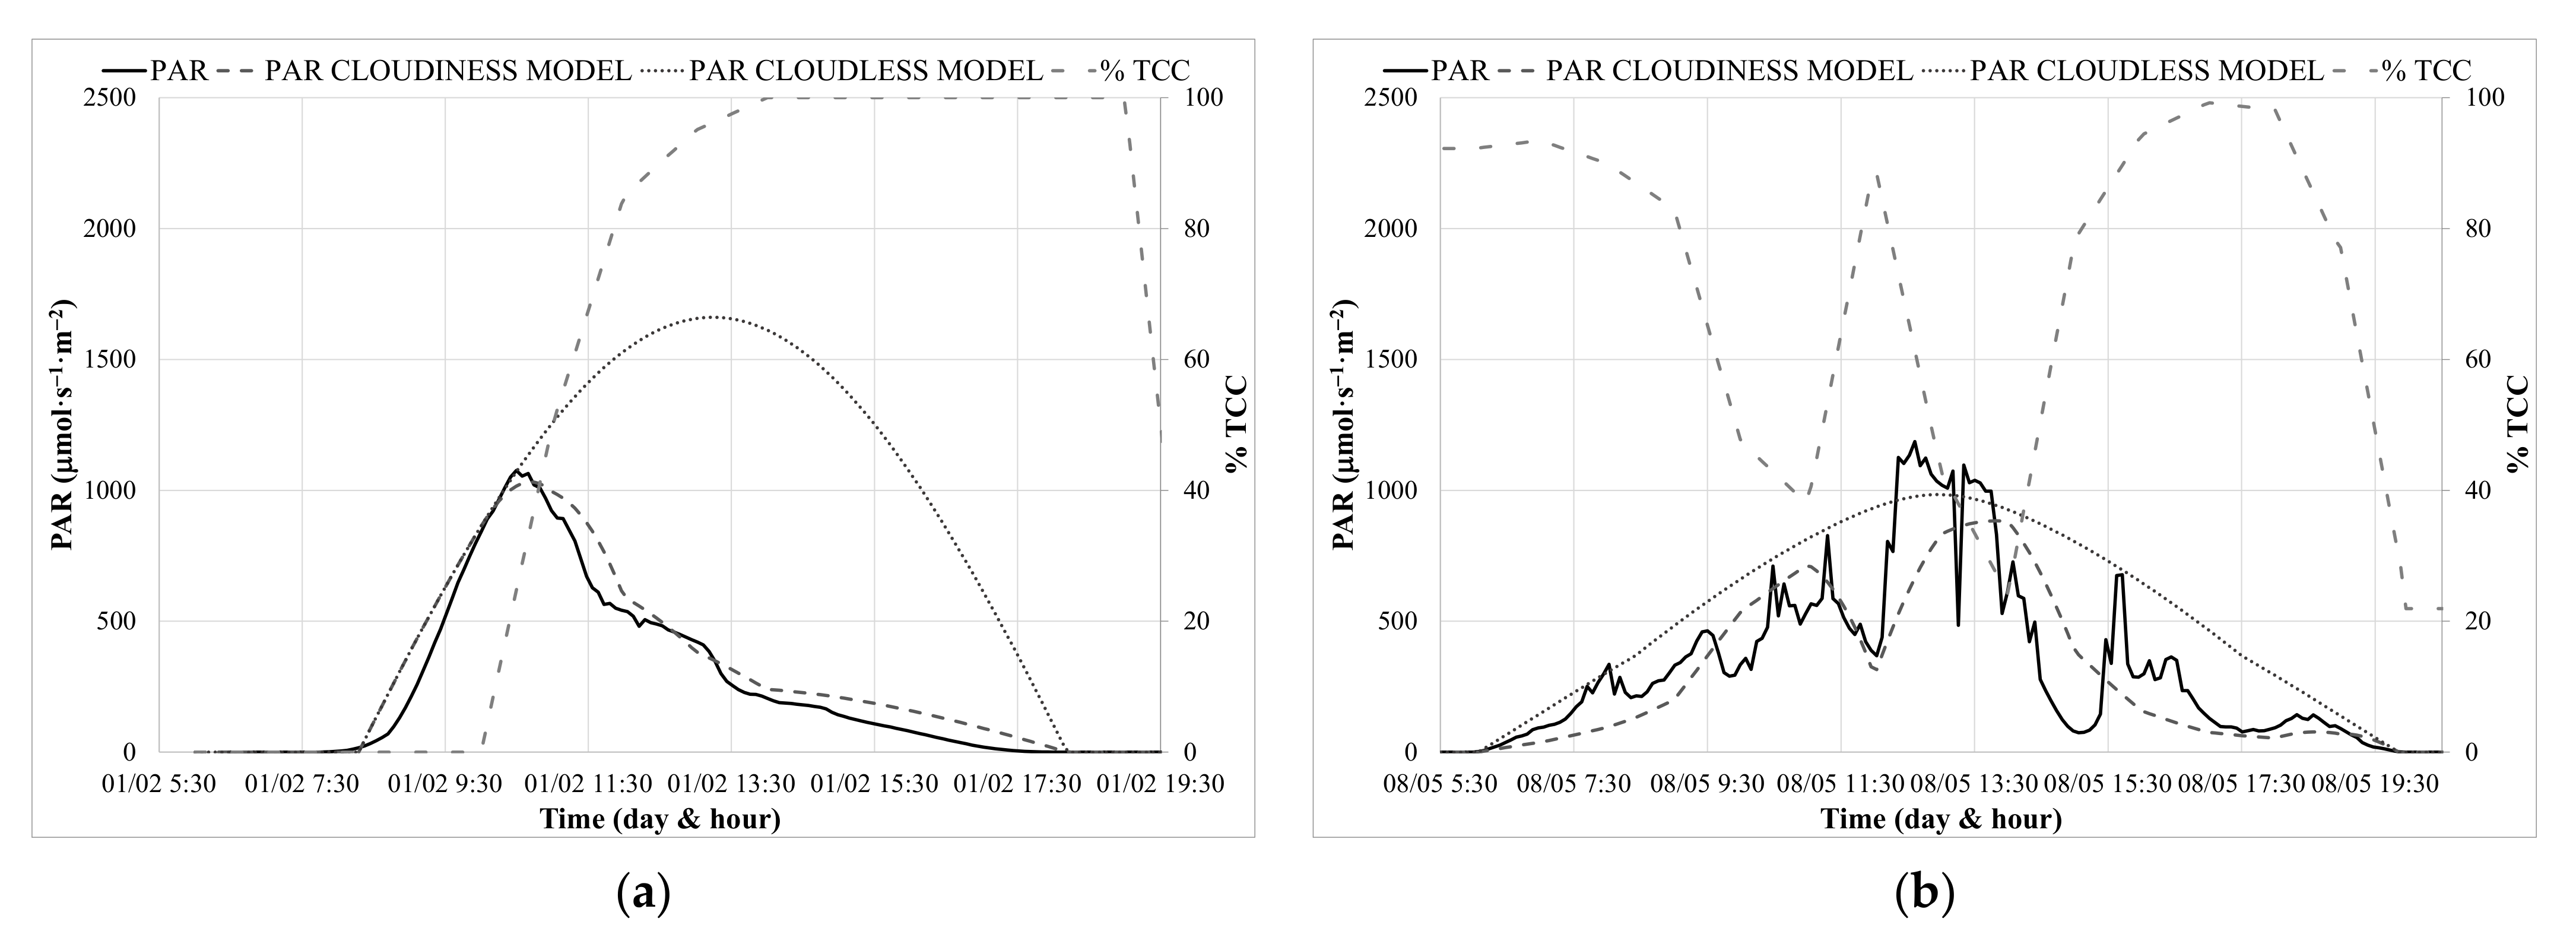
3.2. Calibration of PAR Prediction
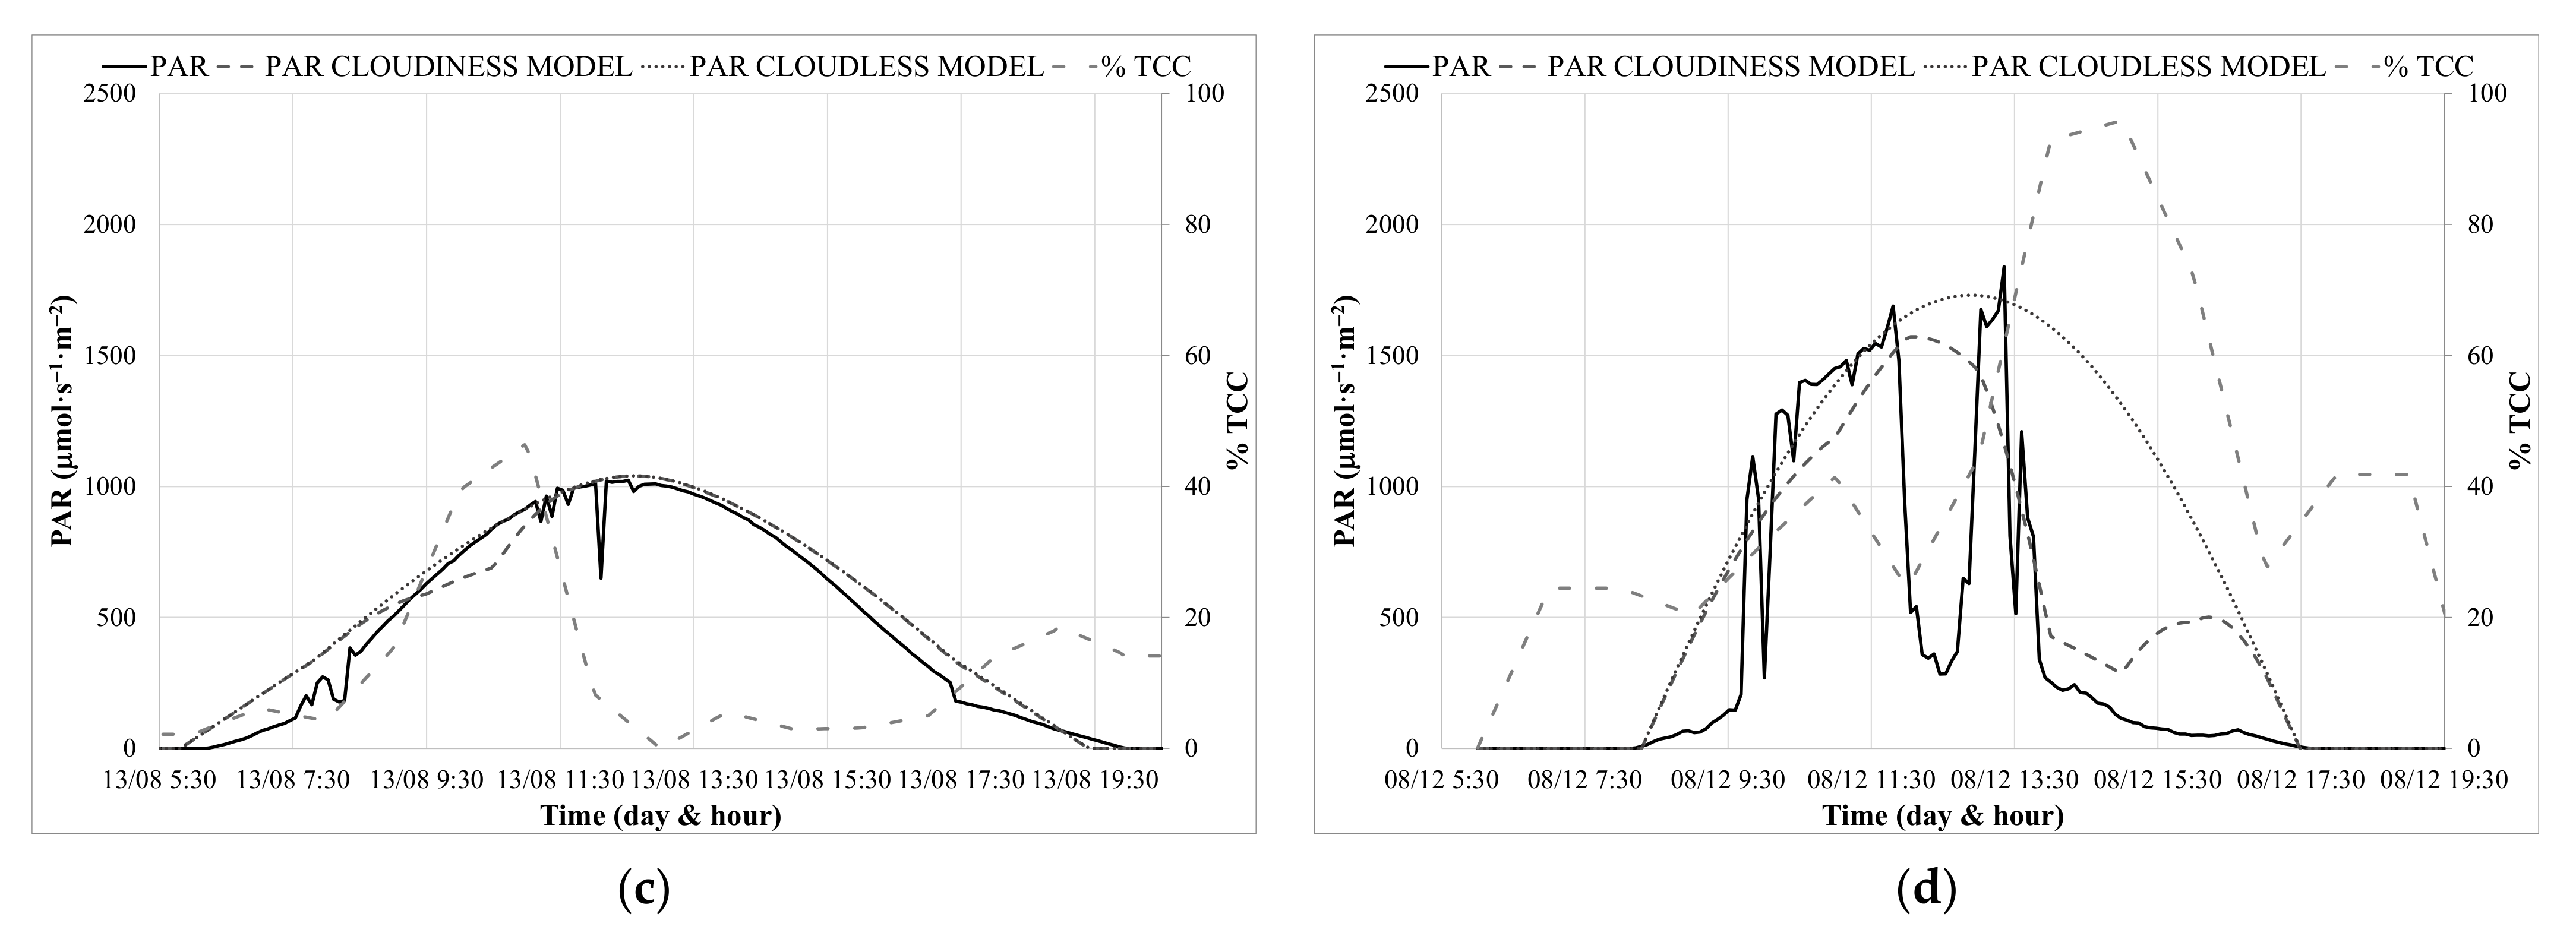
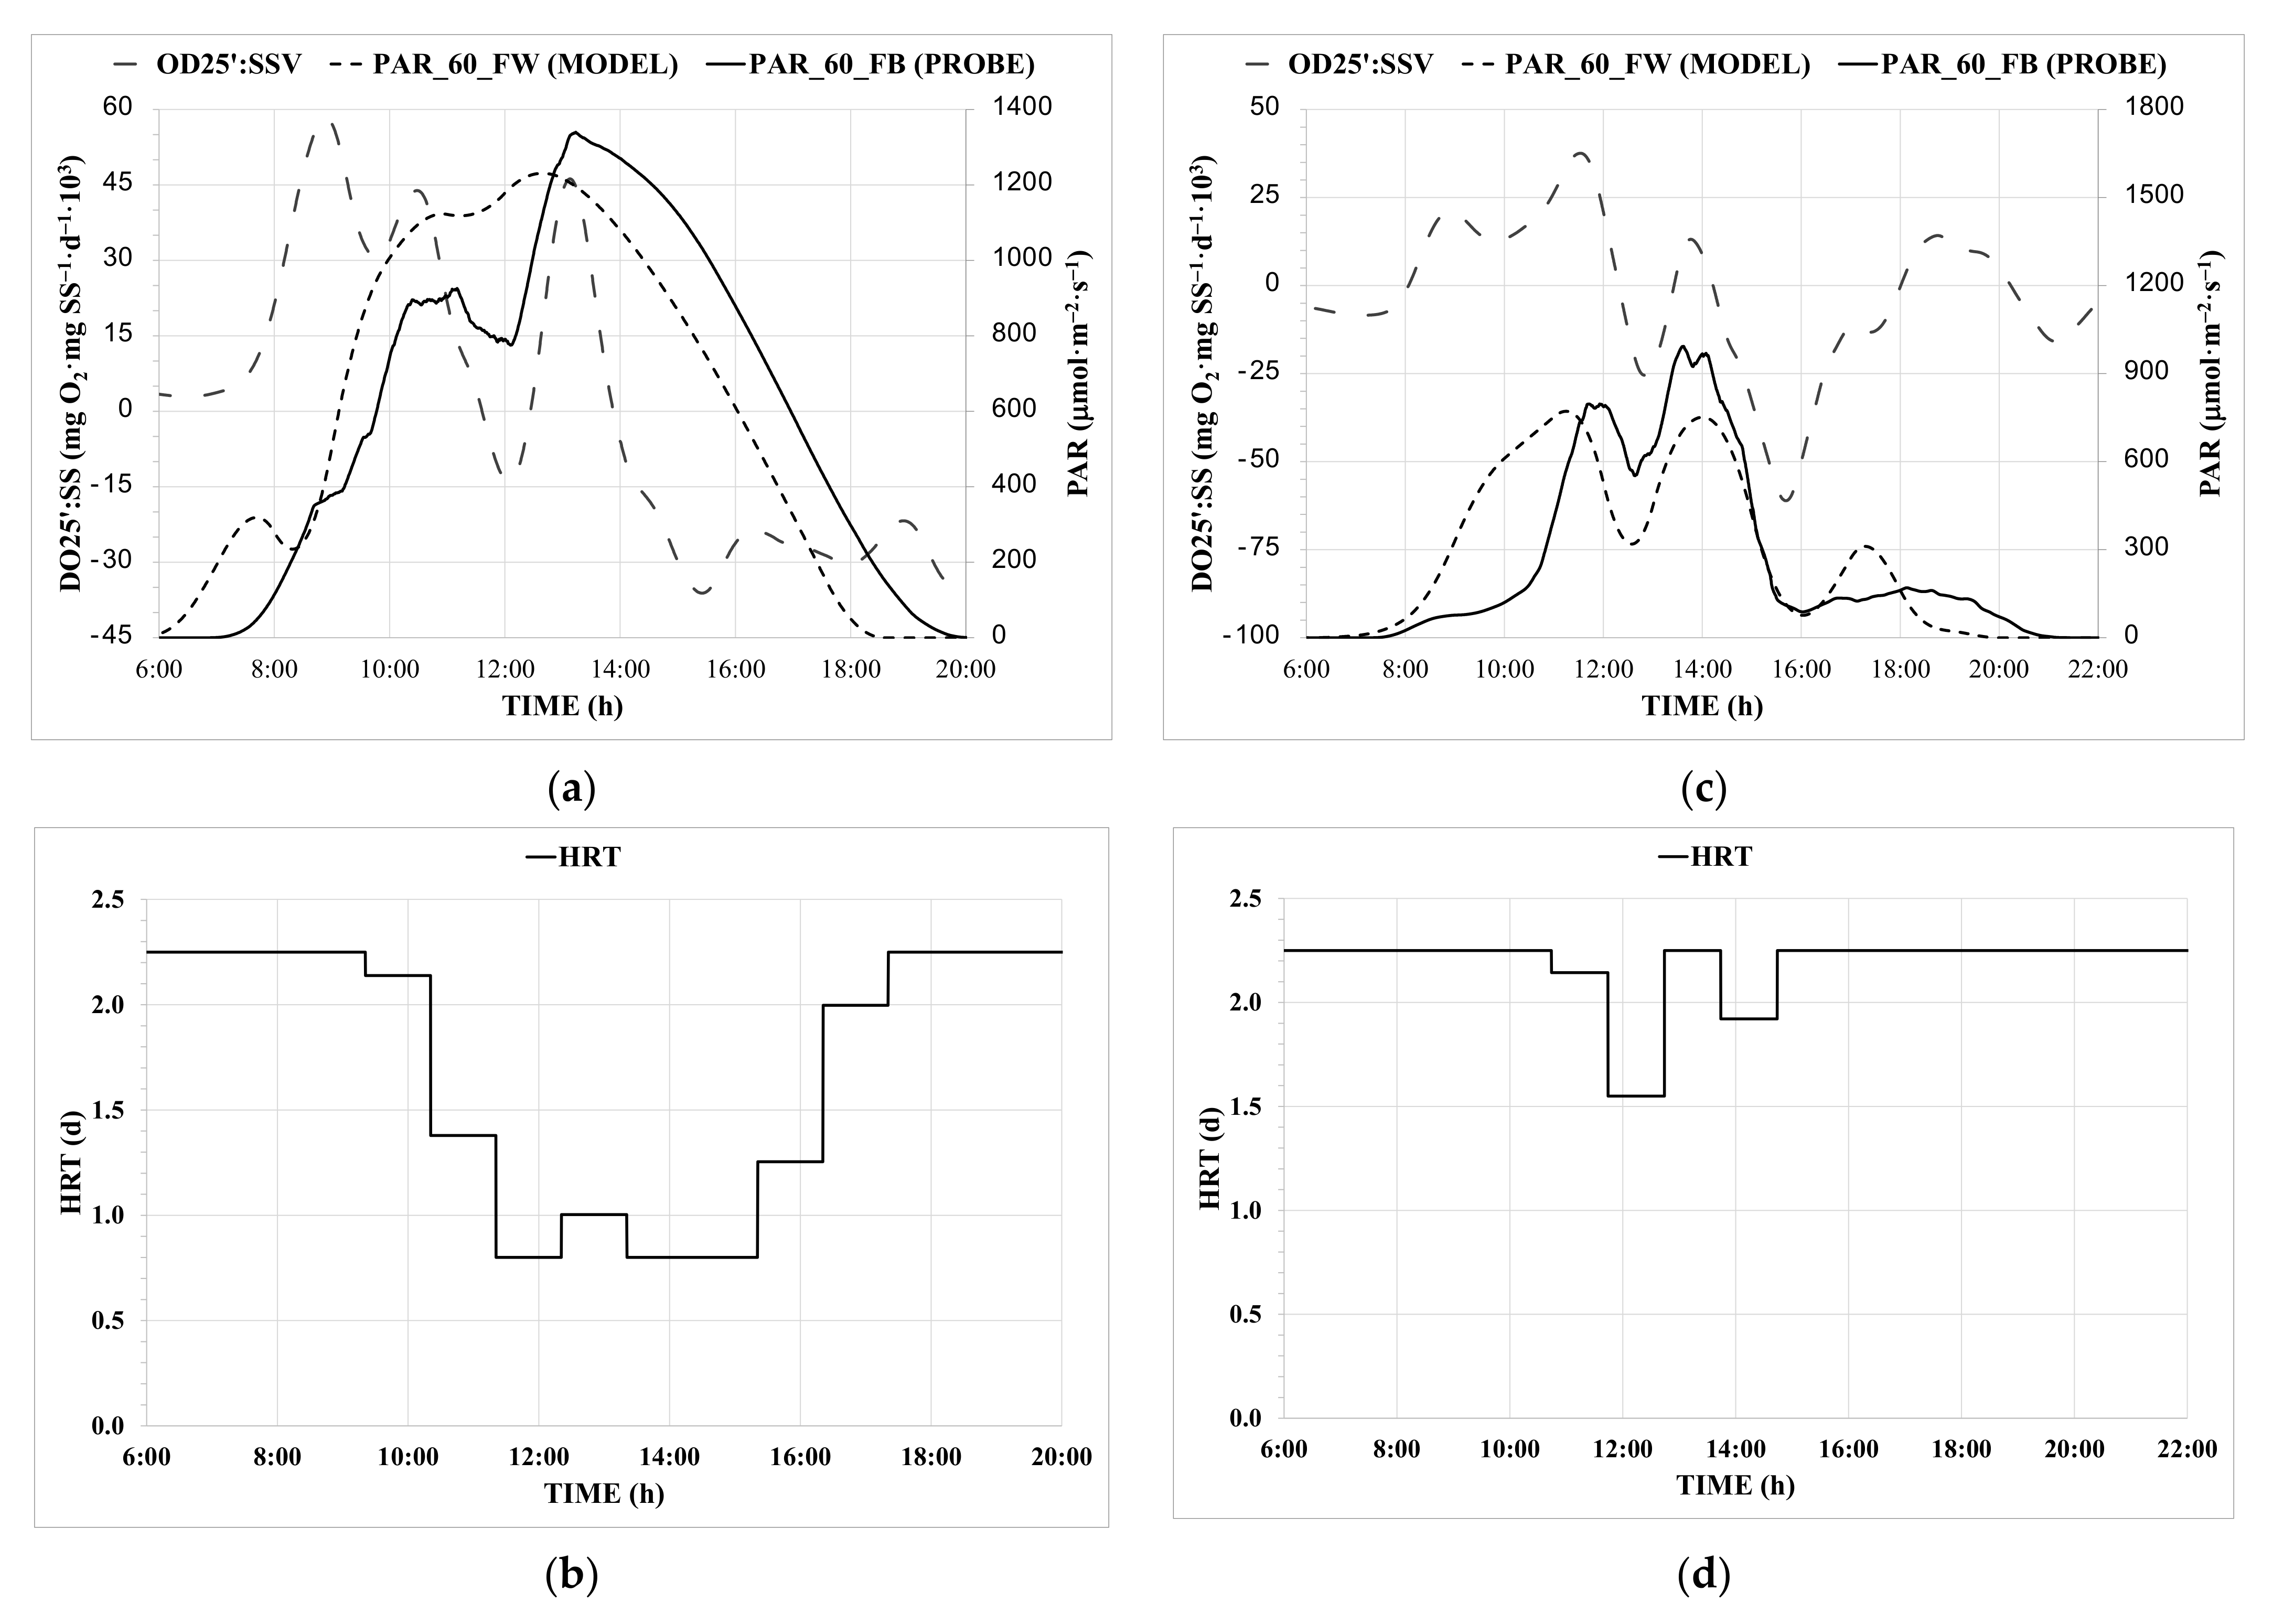
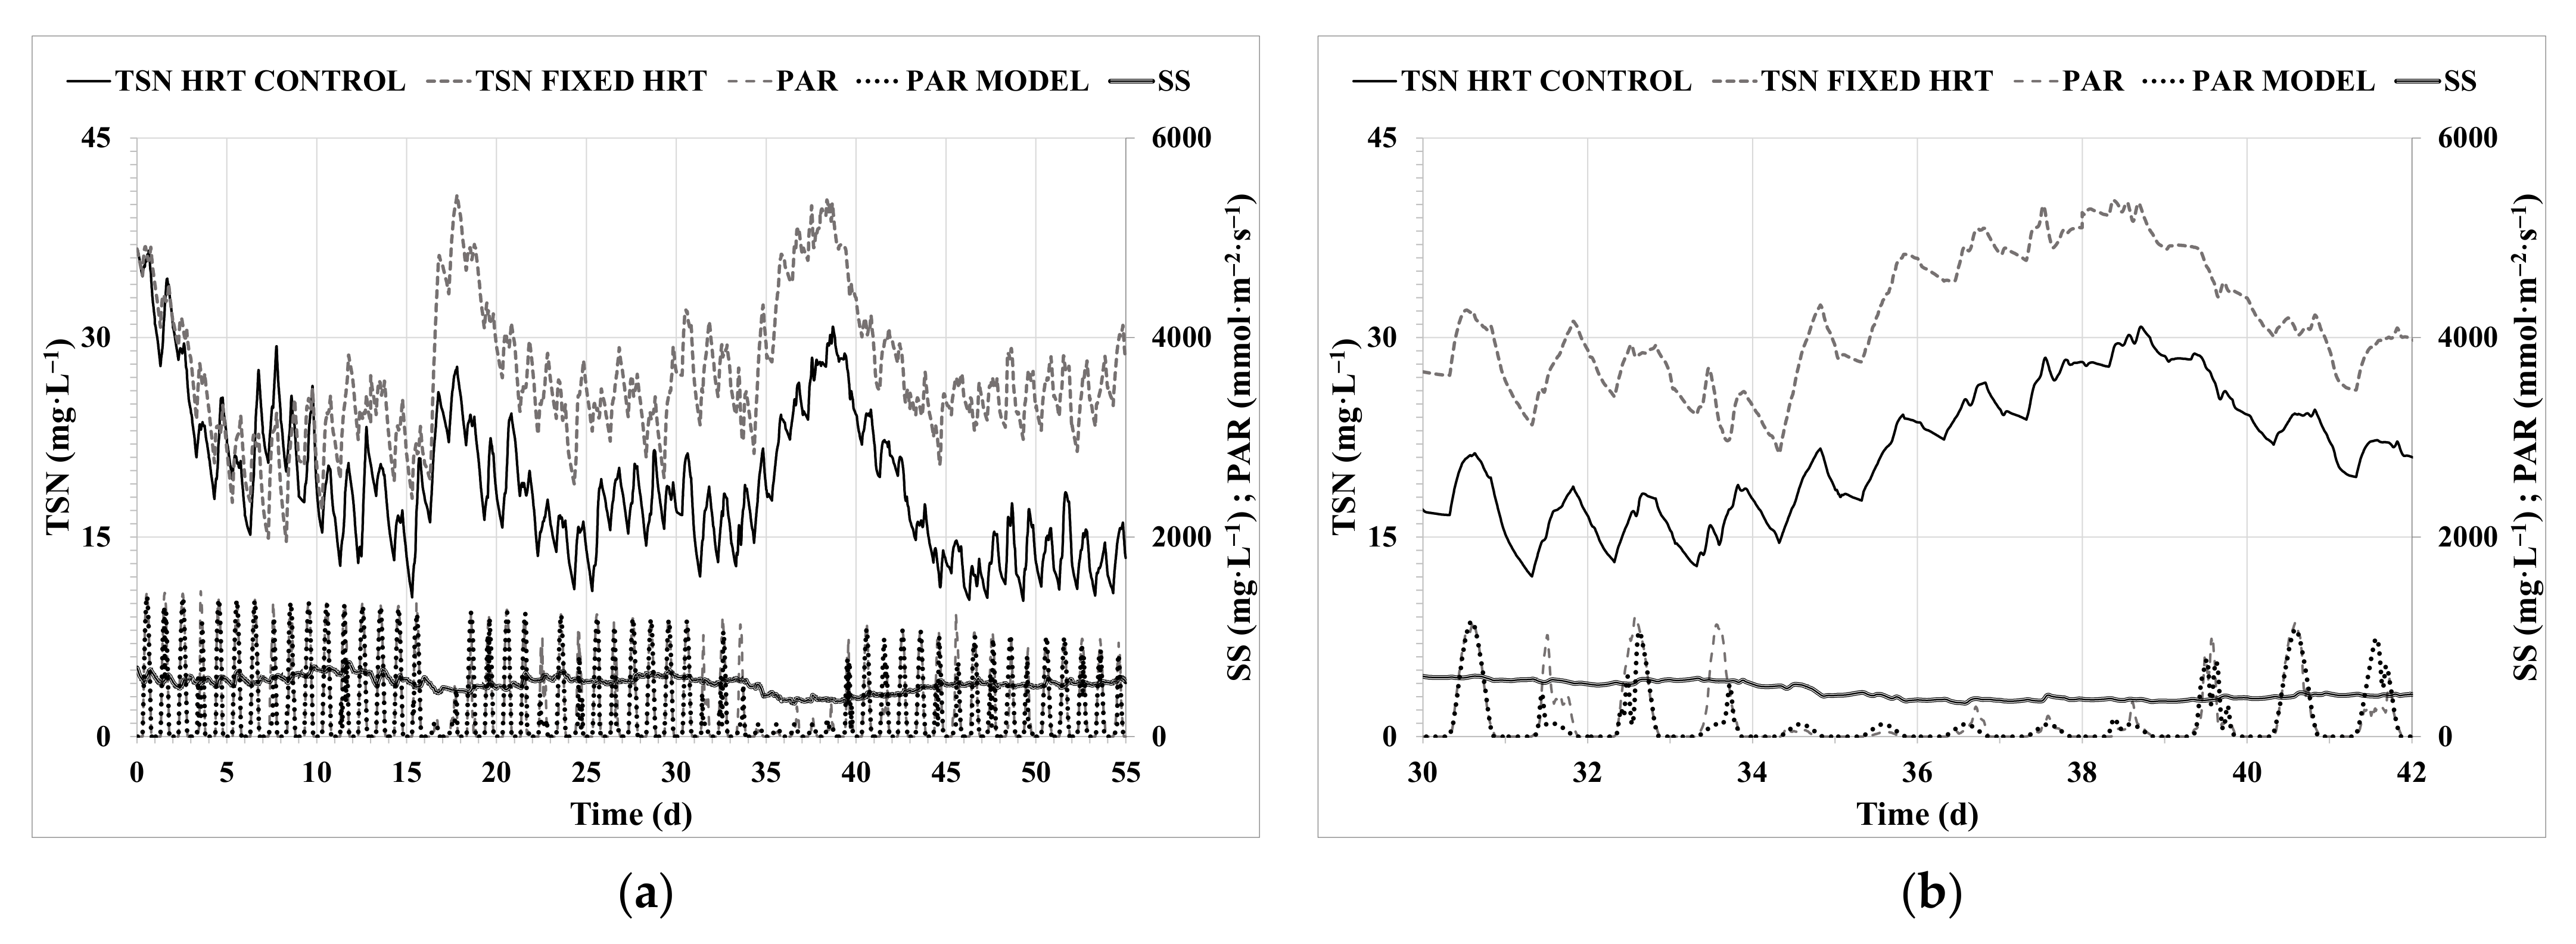
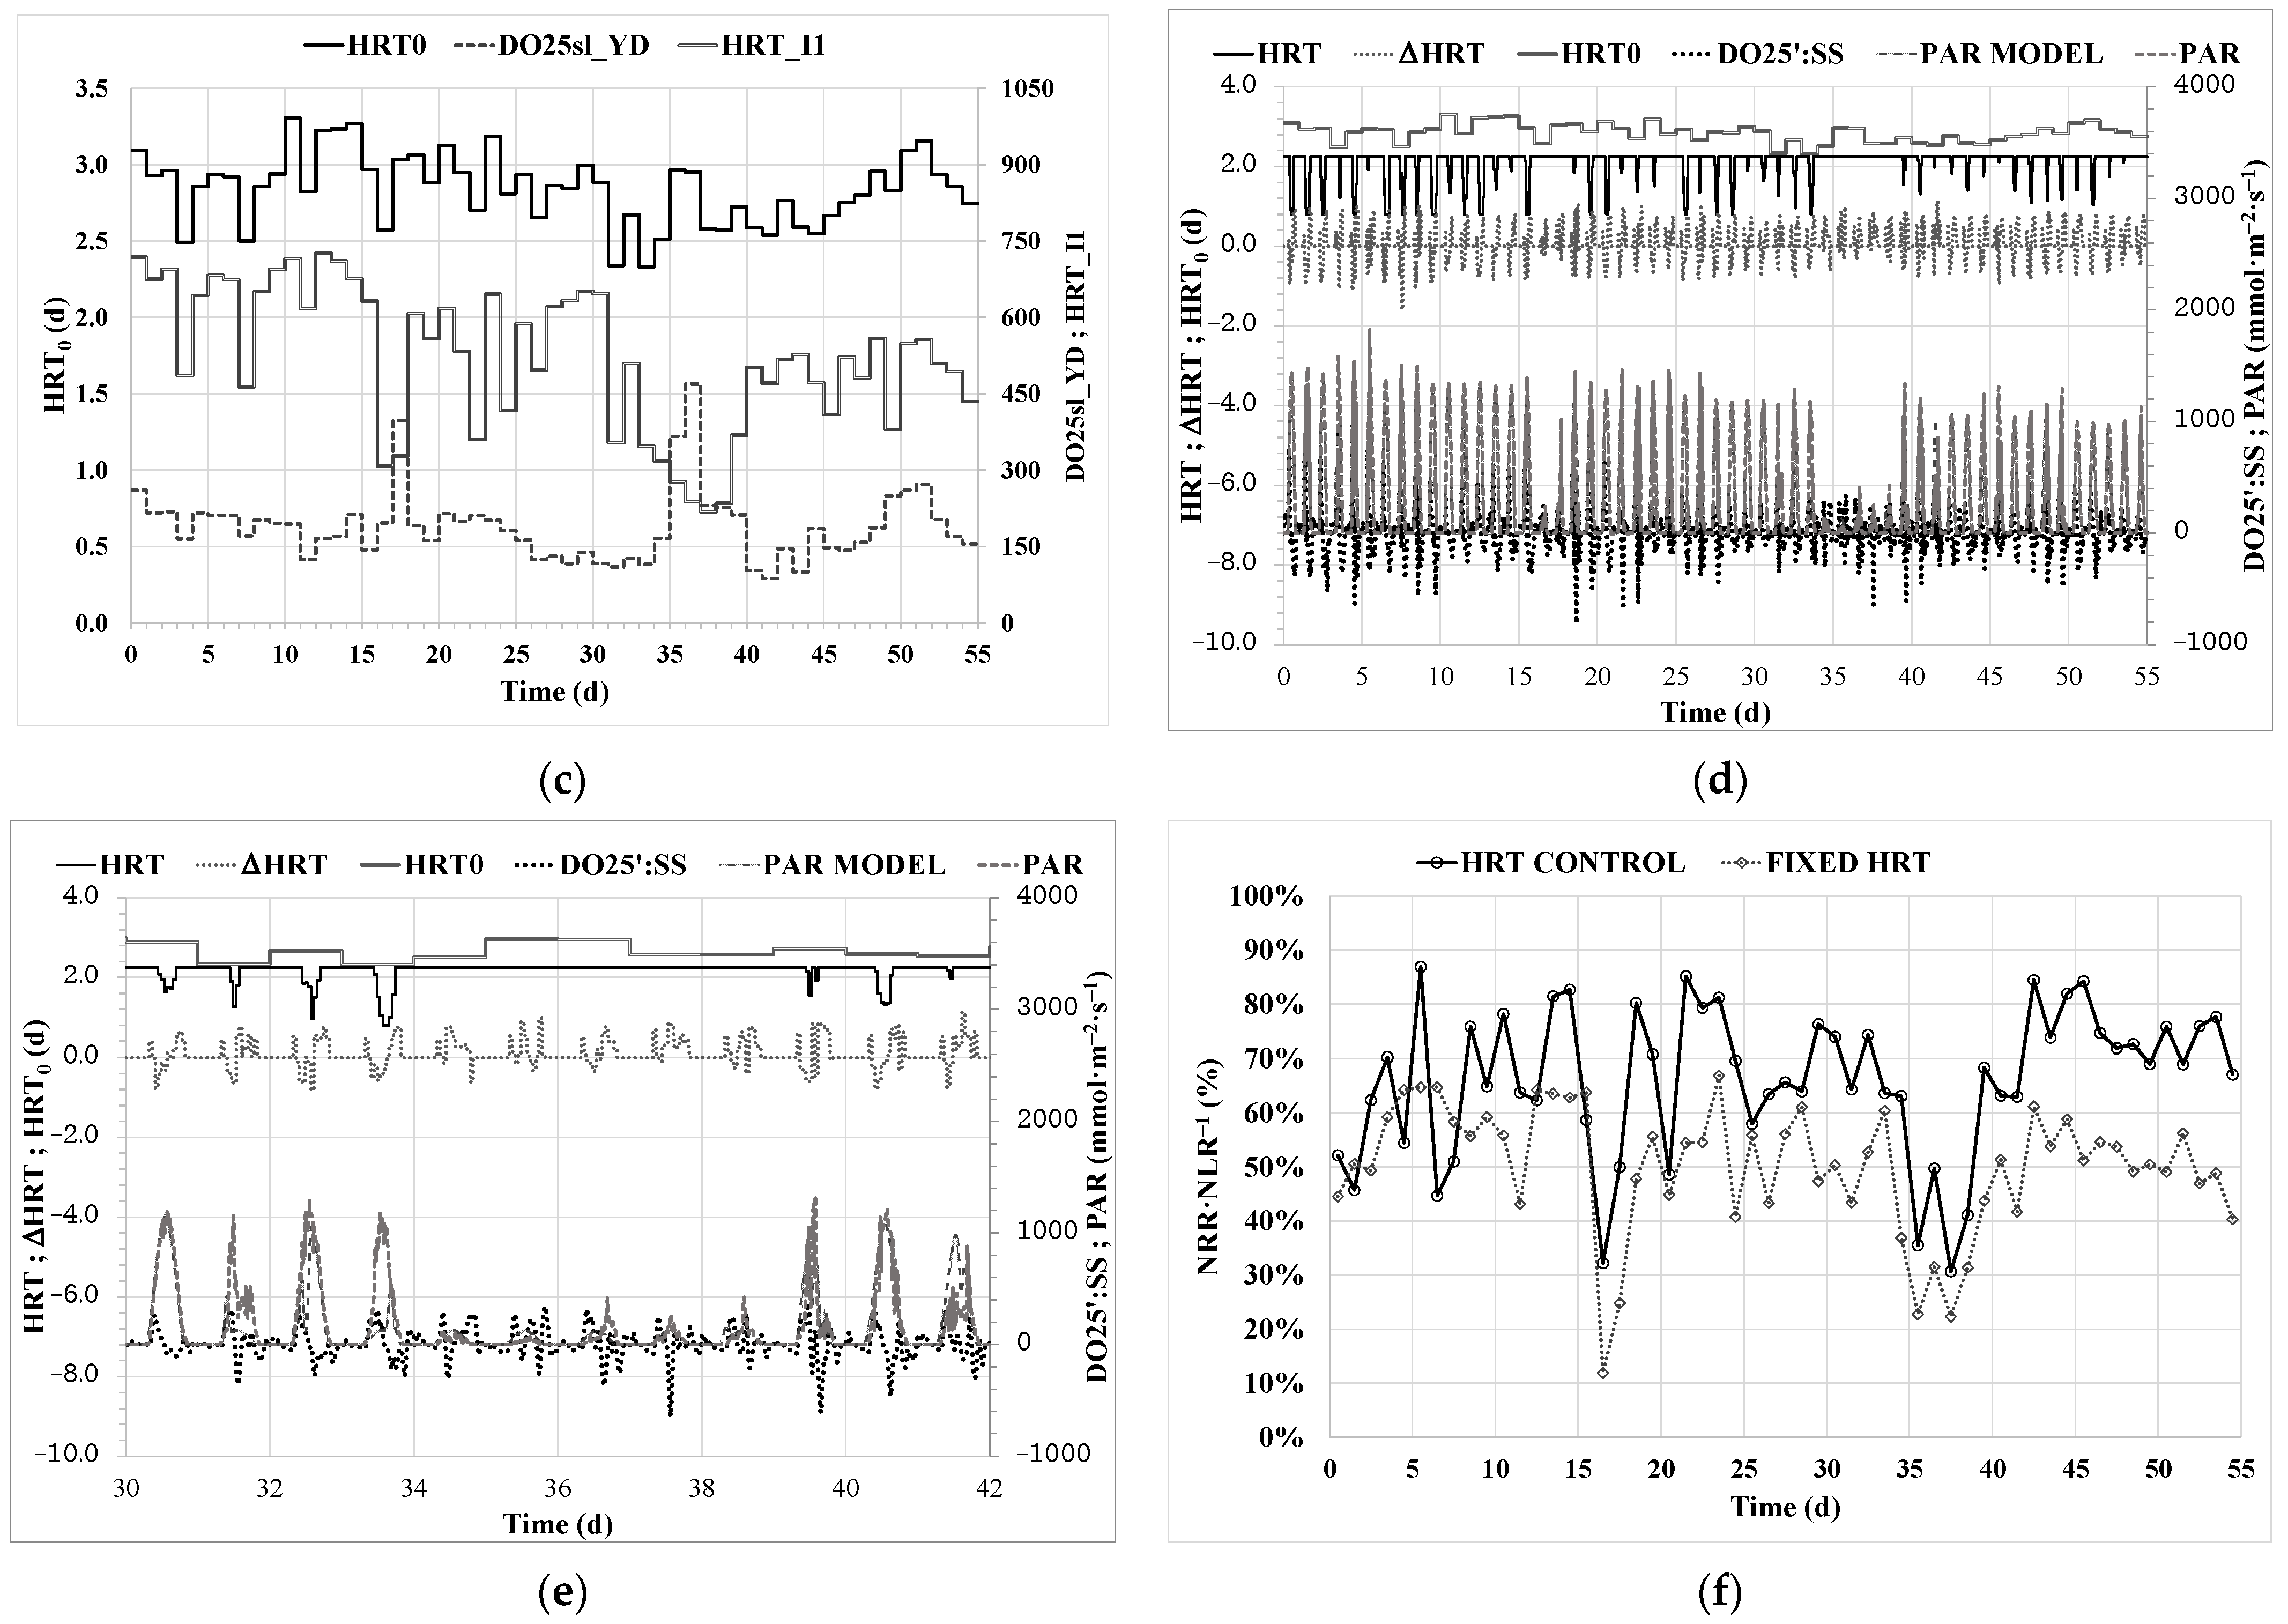
To predict maximum solar PAR applied to the MPBR during continuous operation, a correlation equation was obtained using historical data of TCC from the METEOBLUE database for the region of Alboraya (Valencia) and experimental PAR data obtained over four years on a vertical south-oriented surface.
First, maximum daily solar altitude angle (γs_MAX) was obtained using the methodology from Page [51]. A significant correlation between the cosine of γs_MAX and the experimental data for PAR_MAX was found, as shown in Figure 4.
As explained in Section 2.2.2, PAR (Cloudless) could be easily calculated for every moment of the day using (11). This model performance is shown in Figure 5, in comparison to real PAR data for a full sunny day.
To calibrate (12), three days a month during the previous four years of the operation were chosen: one fully cloudy, another medium cloudy and the other a little cloudy. The Solver-Excel tool was applied to (12) using the chosen historical data to adjust the a and b constants. A = 0.85 and b = 2.01 were then obtained. As an example, Figure 6 shows the adjustment of the simulated PAR value to the real data obtained during the four seasons of the year. The more accurate the %TCC values, the more accurate the PAR modelled will be.
After calibration, the adjusted Haurwitz-type Equation (12) was considered to be a valuable tool to predict the irradiance availability for the microalgae culture. Since light irradiance is the main factor affecting microalgae photosynthetic activity [21,61], this tool could be very helpful in predicting the maximum activity that microalgae could attain at any time. This is essential to predict the treatment capacity limit of the system at any time, which could improve the robustness of the process and avoid undesirable phenomena, such as washout, proliferation of competing organisms, etc. [8,49].

3.3. HRT Control

The action of the HRT controller, as assessed by its input and output values, is shown in Figure 7. As an example, operating day 16 (Figure 7a,b) and 40 (Figure 7c,d) were chosen. In these figures, it can be observed that when OD25′:SS and predicted PAR increased, HRT decreased, allowing treatment of more influent wastewater. On the other hand, when both OD25′:SS and predicted PAR decreased, HRT increased. This can be observed in Figure 7a,b, where HRT decreased in the first hours of the day, when light was increasing with a good performance of the DO25′:SS, but, after midday, a significant reduction in the predicted light led to increasing HRT. After culmination time, the trend was increasing HRT due to general OD25′:SS and PAR reduction. In Figure 7c,d, performance on a cloudy day is shown. It can be observed that the controller action was narrower, HRT was thus at its maximum value for the majority of the day and only reduced in the most favourable conditions of the day.
A comparison between real MPBR performance of this study and the interpolated performance from the database from a previous study at fixed 1.25-days HRT [20] can be seen in Figure 8. In Figure 8a, the continuous registration of the total soluble nitrogen (TSN, measured as the sum of NH4, NO2 and NO3 in the effluent), SS and PAR for the entire experimental period is shown, along with PAR from the meteorological model and TSN interpolated at fixed 1.25-days HRT. A zoom is applied in Figure 8b for the operating period 30–42 days. In Figure 8c, the action of the HRT0 controller (once a day) can be observed. In Figure 8d the action of the HRT controller (hourly in the daytime) is displayed, with the input and output variables, with a zoom for the operating period 30–42 days (Figure 8e). In Figure 8f, the ratio between the biologically removed nitrogen with respect to the nitrogen fed to the system (NRR·NLR−1) can be observed for all the experimental period, as well as registered values from the HRT controller versus interpolated values from the fixed HRT database. Average results for the entire experiment and for the last 10 days of the period (which was considered as the most representative period) are displayed in Table 5.
In Figure 8a, it is evident that after the first 10 days (considered as the start-up phase), a general trend of decreasing TSN in sunny days and increasing TSN in cloudy days was obtained, which is in accordance with previous studies that reported the highly significant influence of light irradiance on microalgae activity [21,44,56,57,61]. A certain stability in SS was observed, except for a period when several cloudy days were concatenated, leading to a partial biomass washout since the SRT of the system was relatively short (fixed at 2.25 days).
In Figure 8c, the HRT0 controller performance can be observed, showing a general direct relation between input and output variables. For instance, low values of both input variables on day 7 led to a short HRT0 value. The opposite situation was observed on day 51. In the period 30–42 days (Figure 8b,e), it was observed that corrective feedback action was able to compensate for the differences between modelled and real PAR due to an inappropriate TCC forecast, particularly for days 31 and 33, by adjusting the feed flow to the real capacity and maintaining the TSN in low ranges. However, TSN increased for the period 34–39 days due to a concatenation of several extremely cloudy days, showing the upper limitation of the controller with SRT, that was fixed, and limiting the action of the controller to HRT = SRT instead of the controller output. Consequently, the associated feed flow exceeded the instantaneous system capacity in these low-light conditions, leading to TSN accumulation in the system. Further investigation is needed to design an SRT controller and to couple it to the HRT controller of this study to improve the MPBR performance on extremely cloudy days and under other possible stress conditions.
In conclusion, for the entire experimental period, the nitrogen recovery efficiency (measured as NRR·NLR−1) was improved from 50.0 to 66.0% using the HRT controller, and consequently, the average effluent TSN concentration in the MPBR system was reduced by 30%. If only the last 10 days of the operation are considered (to minimise the effect of the start-up phase and the concatenation of extremely cloudy days), the improvement was significantly higher, i.e., 48% for both NRR·NLR−1 and TSN, also meeting the discharge requirements of the EU-Directive 91/271/EEC, which limits effluent nitrogen to 15 mgN·L−1 for 10,000–100,000-p.e. WWTPs. The fuzzy HRT controller was able to improve the nitrogen recovery efficiency of the MPBR system in the mid-term. These results show a promising application of fuzzy logic control that could be developed at industrial scale for a side microalgae-based process for nitrogen recovery in future WRRFs [2,42,62].
For the entire experimental period, the average HRT was 1.84 days, equivalent to an influent wastewater flow of 128 L·day−1, while the 1.25-days fixed HRT accounted for 188 L·day−1. The controller thus significantly improved the nitrogen recovery efficiency but reduced the volumetric treatment capacity. However, this larger treatment capacity of the fixed 1.25-days HRT implies that more nitrogen was wasted with the effluent instead of being recovered by microalgae biomass [2], as can be observed by the significant difference of the TSN effluent concentration in both cases (Figure 8f). In fact, a reduction of nitrogen losses with the wastewater effluent of 47% was achieved when the HRT controller was used.

4. Conclusions

This paper has proposed a fuzzy logic knowledge-based controller based on the application of DO, SS and PAR sensors combined with an astronomic-plus-cloud-cover forecast meteorological model to control nitrogen recovery from microalgae in an outdoor MPBR, adjusting the hourly HRT of the plant to improve the instantaneous recovery capacity of the system. The results showed that this HRT control improved the ratio of nitrogen biologically removed to nitrogen fed to the system by 45% when compared to fixed HRT. Moreover, when the fuzzy logic HRT control was used, a reduction in nitrogen losses with the wastewater effluent of 47% was achieved. Overall, the results obtained show a promising application of an ICA system to improve microalgae-based wastewater treatment as a side nitrogen recovery process in a WRRF scheme.

Author Contributions

Conceptualisation, J.F.M.-S. and M.V.R.; methodology, J.F.M.-S. and M.V.R.; validation, J.F.M.-S., J.G.-C. and M.V.R.; formal analysis, J.F.M.-S.; resources, J.F.M.-S. and J.G.-C.; data curation, J.F.M.-S.; writing—original draft preparation, J.F.M.-S. and J.G.-C.; writing—review and editing, A.S. and M.V.R.; visualisation, J.F.M.-S. and J.G.-C.; supervision, A.S. and M.V.R.; project administration, A.S.; funding acquisition, A.S. All authors have read and agreed to the published version of the manuscript.

Funding

This research has been supported by the Spanish Ministry of Economy and Competitiveness (MINECO, Projects CTM2014-54980-C2-1-R and CTM2014-54980-C2-2-R) jointly with the European Regional Development Fund (ERDF), both of which are gratefully acknowledged. In addition, the author J.F. Mora-Sánchez was supported by Generalitat Valenciana via a research fellowship (APOTI/2016/056) and the author J. González-Camejo was also supported by Generalitat Valenciana and the European Social Fund via a post-doctoral grant (APOSTD/2021/175).

Institutional Review Board Statement

Not applicable.

Informed Consent Statement

Not applicable.

Data Availability Statement

Not data reported.

Acknowledgments

The support from Entitat Pública de Sanejament d’Aigues Residuals (EPSAR) of Comunitat Valenciana is gratefully acknowledged.

Conflicts of Interest

The authors declare no conflict of interest. The funders had no role in the design of the study; in the collection, analyses, or interpretation of data; in the writing of the manuscript, or in the decision to publish the results.

Glossary

AnMBRAnaerobic membrane bioreactor
ATUAllylthiourea
BPBiomass productivity
BP:SSBiomass productivity normalised by suspended solids
BP:SS_YDBiomass productivity normalised by suspended solids of the previous day
cCentre of a Gaussian membership function
CAPEXCapital expenditures
(cos ν)NCosine of angle ν normalised to 0–1 range
DODissolved oxygen at culture temperature
DOsatDissolved oxygen concentration at saturation
DO25Dissolved oxygen standardised to 25 °C
DO25satDissolved oxygen concentration at saturation at 25 °C
DO25′ First derivative of the variation of DO25
DO25′:SSDO25′ normalised by SS (monitored by the sensor)
DO25slSlope of the relation DO25 vs. PAR
DO25sl_YDSlope of the relation DO25 vs. PAR of the previous day
DO25sl:SSDO25sl standardised with suspended solids
DO25sl:SS_YDDO25sl standardised with suspended solids of the previous day
HRAP High-rate algal pond
HRT Hydraulic retention time
HRT0Initial hydraulic retention time
HRT_I1Index combining average SS from previous day with today average predicted PAR
LLarge
LNLarge Negative
LPLarge Positive
MMedium
MPBRMembrane photobioreactor
NH4Ammonium
NLRNitrogen loading rate
NO2Nitrite
NO3Nitrate
NRRNitrogen recovery rate
NRR_AVAverage nitrogen recovery rate
NRR:SSNitrogen recovery rate normalised by SS
NRR:SS_YDNitrogen recovery rate normalised by SS of the previous day
N:PNitrogen-phosphorus molar ratio
OPEXOperational expenditures
ORPOxidation-reduction potential
PPhosphorus
PARDaily average photosynthetically active radiation
PAR_AVAverage PAR
PAR_MAX Daily maximum photosynthetically active radiation
PAR_MA60_FBPAR moving average for the last 60 min
PAR_MA60_FWPAR predicted from the model as moving average for the next 60 min
PAR_TDA_AVPAR predicted from the model as today daily average
PBRPhotobioreactor
pH’First derivate of pH data dynamics
SSmall
SDStandard deviation
SCADASupervisory control and data acquisition
SNSmall Negative
SPSmall Positive
SRTSolid retention time
SSSuspended solids
SS_AVAverage suspended solids
SS_YD_AVDaily average of the suspended solids of the previous day
TCCTotal cloud cover
Temp Temperature
TSNTotal soluble nitrogen in the effluent
UF-MTUltrafiltration membrane tank
WRRFWater resource recovery facility
WSPWaste stabilisation pond
WWTPWastewater treatment plant
XLExtra Large
XSExtra Small
ZEZero
αAzimuth angle of PBR surface exposed to light
αsAzimuth angle
βSlope angle of PBR surface exposed to sun light
γsSolar altitude angle
γs _MAXDaily maximum solar altitude angle
δDeclination
ΔDO25Variation of DO25 with time
ΔDO25_YDDaily variation of DO25 of the previous day
ΔHRTController output, i.e., the difference between the previous HRT and the following HRT
ΔPARVariation of PAR with time
ΔPAR_YDDaily variation of PAR of the previous day
λLongitude
μFuzzy membership value using a Gaussian membership function
σAmplitude of a Gaussian membership function
νAngle of incidence between sun and normal to PBR surface
φLatitude
ωHour angle

References

  1. Paddock, M.B. Microalgae Wastewater Treatment: A Brief History. Preprints 2019. [Google Scholar] [CrossRef] [Green Version]
  2. Seco, A.; Aparicio, S.; González-Camejo, J.; Jiménez-Benítez, A.; Mateo, O.; Mora, J.F.; Noriega-Hevia, G.; Sanchis-Perucho, P.; Serna-García, R.; Zamorano-López, N.; et al. Resource recovery from sulphate-rich sewage through an innovative anaerobic-based water resource recovery facility (WRRF). Water Sci. Technol. 2018, 78, 1925–1936. [Google Scholar] [CrossRef]
  3. Hasport, N.; Krahe, D.; Kuchendorf, C.M. The potential impact of an implementation of microalgae-based wastewater treatment on the energy balance of a municipal wastewater treatment plant in Central Europe. Bioresour. Technol. 2022, 347, 126695. [Google Scholar] [CrossRef]
  4. Oswald, W.J.; Gotaas, H.B. Photosynthesis in sewage treatment. Trans. Am. Soc. Civ. Eng. 1957, 122, 73–97. [Google Scholar] [CrossRef]
  5. Wallace, J.; Champagne, P.; Hall, G. Time series relationships between chlorophyll-a, dissolved oxygen, and pH in three facultative wastewater stabilization ponds. Environ. Sci. Water Res. Technol. 2016, 2, 1032–1040. [Google Scholar] [CrossRef]
  6. Abis, K.L.; Mara, D.D. Primary facultative ponds in the UK: The effect of operational parameters on performance and algal populations. Water Sci. Technol. 2005, 51, 61–67. [Google Scholar] [CrossRef]
  7. Faleschini, M.; Esteves, J.L.; Camargo Valero, M.A. The Effects of Hydraulic and Organic Loadings on the Performance of a Full-Scale Facultative Pond in a Temperate Climate Region (Argentine Patagonia). Water Air Soil Pollut. 2012, 223, 2483–2493. [Google Scholar] [CrossRef]
  8. González-Camejo, J.; Ferrer, J.; Seco, A.; Barat, R. Outdoor microalgae-based urban wastewater treatment: Recent advances, applications, and future perspectives. Wiley Interdiscip. Rev. Water 2021, 8, e1518. [Google Scholar] [CrossRef]
  9. Inostroza, C.; Solimeno, A.; García, J.; Fernández-Sevilla, J.M.; Acién, F.G. Improvement of real-scale raceway bioreactors for microalgae production using Computational Fluid Dynamics (CFD). Algal Res. 2021, 54, 102207. [Google Scholar] [CrossRef]
  10. Mohsenpour, S.F.; Hennige, S.; Willoughby, N.; Adeloye, A.; Gutierrez, T. Integrating micro-algae into wastewater treatment: A review. Sci. Total Environ. 2021, 752, 142168. [Google Scholar] [CrossRef]
  11. Morillas-España, A.; Lafarga, T.; Sánchez-Zurano, A.; Acién-Fernández, F.G.; Rodríguez-Miranda, E.; Gómez-Serrano, C.; Gonzalez-López, C.V. Year-long evaluation of microalgae production in wastewater using pilot-scale raceway photobioreactors: Assessment of biomass productivity and nutrient recovery capacity. Algal Res. 2021, 60, 102500. [Google Scholar] [CrossRef]
  12. Acién Fernández, F.G.; Gómez-Serrano, C.; Fernández-Sevilla, J.M. Recovery of Nutrients from Wastewaters Using Microalgae. Front. Sustain. Food Syst. 2018, 2, 59. [Google Scholar] [CrossRef] [Green Version]
  13. Acién, F.G.; Reis, A.; Wijffels, R.H.; Barbosa, M.; Verdelho, V.; Llamas, B. The role of microalgae in the bioeconomy. New Biotechnol. 2021, 61, 99–107. [Google Scholar] [CrossRef]
  14. Priyadharshini, S.D.; Babu, P.S.; Manikandan, S.; Subbaiya, R.; Govarthanan, M.; Karmegam, N. Phycoremediation of wastewater for pollutant removal: A green approach to environmental protection and long-term remediation. Environ. Pollut. 2021, 290, 117989. [Google Scholar] [CrossRef]
  15. Assunção, J.; Malcata, F.X. Enclosed “non-conventional” photobioreactors for microalga production: A review. Algal Res. 2020, 52, 102107. [Google Scholar] [CrossRef]
  16. Barbera, E.; Sforza, E.; Grandi, A.; Bertucco, A. Uncoupling solid and hydraulic retention time in photobioreactors for microalgae mass production: A model-based analysis. Chem. Eng. Sci. 2020, 218, 115578. [Google Scholar] [CrossRef]
  17. Gao, F.; Cui, W.; Xu, J.P.; Li, C.; Jin, W.H.; Yang, H.L. Lipid accumulation properties of Chlorella vulgaris and Scenedesmus obliquus in membrane photobioreactor (MPBR) fed with secondary effluent from municipal wastewater treatment plant. Renew. Energy 2019, 136, 671–676. [Google Scholar] [CrossRef]
  18. González-Camejo, J.; Jiménez-Benítez, A.; Ruano, M.V.; Robles, A.; Barat, R.; Ferrer, J. Optimising an outdoor membrane photobioreactor for tertiary sewage treatment. J. Environ. Manag. 2019, 245, 76–85. [Google Scholar] [CrossRef] [Green Version]
  19. Luo, Y.; Le-Clech, P.; Henderson, R.K. Assessment of membrane photobioreactor (MPBR) performance parameters and operating conditions. Water Res. 2018, 138, 169–180. [Google Scholar] [CrossRef]
  20. González-Camejo, J.; Aparicio, S.; Jiménez-Benítez, A.; Pachés, M.; Ruano, M.V.; Borrás, L.; Barat, R.; Seco, A. Improving membrane photobioreactor performance by reducing light path: Operating conditions and key performance indicators. Water Res. 2020, 172, 115518. [Google Scholar] [CrossRef] [Green Version]
  21. Raeisossadati, M.; Moheimani, N.R.; Parlevliet, D. Luminescent solar concentrator panels for increasing the efficiency of mass microalgal production. Renew. Sustain. Energy Rev. 2019, 101, 47–59. [Google Scholar] [CrossRef]
  22. Pawlowski, A.; Guzmán, J.L.; Berenguel, M.; Acién, F.G. Control system for pH in Raceway Photobioreactors based on Wiener Models. IFAC-PapersOnLine 2019, 52, 928–933. [Google Scholar] [CrossRef]
  23. Robles, A.; Capson-Tojo, G.; Galés, A.; Ruano, M.V.; Sialve, B.; Ferrer, J.; Steyer, J.P. Microalgae-bacteria consortia in high-rate ponds for treating urban wastewater: Elucidating the key state indicators during the start-up period. J. Environ. Manag. 2020, 261, 110244. [Google Scholar] [CrossRef]
  24. Foladori, P.; Petrini, S.; Andreottola, G. Evolution of real municipal wastewater treatment in photobioreactors and microalgae-bacteria consortia using real-time parameters. Chem. Eng. J. 2018, 345, 507–516. [Google Scholar] [CrossRef]
  25. Hossain, S.M.Z.; Sultana, N.; Jassim, M.S.; Coskuner GHazin, L.M.; Razzak, S.A.; Hossain, M.M. Soft-computing modeling and multiresponse optimization for nutrient removal process from municipal wastewater using microalgae. J. Water Process Eng. 2022, 45, 102490. [Google Scholar] [CrossRef]
  26. Liyanaarachchi, V.C.; Nishshanka, G.K.S.H.; Sakarika, M.; Nimarshana, P.H.V.; Ariyadasa, T.U.; Kornaros, M. Artificial neural network (ANN) approach to optimize cultivation conditions of microalga Chlorella vulgaris in view of biodiesel production. Biochem. Eng. J. 2021, 173, 108072. [Google Scholar] [CrossRef]
  27. De-Luca, R.; Trabuio, M.; Barolo, M.; Bezzo, F. Microalgae growth optimization in open ponds with uncertain weather data. Comput. Chem. Eng. 2018, 117, 410–419. [Google Scholar] [CrossRef]
  28. De-Luca, R.; Bezzo, F.; Béchet, Q.; Bernard, O. Meteorological Data-Based Optimal Control Strategy for Microalgae Cultivation in Open Pond Systems. Complexity 2019, 2019, 4363895. [Google Scholar] [CrossRef]
  29. Lage, S.; Toffolo, A.; Gentili, F.G. Microalgal growth, nitrogen uptake and storage, and dissolved oxygen production in a polyculture based open pond fed with municipal wastewater in northern Sweden. Chemosphere 2021, 276, 130122. [Google Scholar] [CrossRef]
  30. González-Camejo, J.; Robles, A.; Seco, A.; Ferrer, J.; Ruano, M.V. On-line monitoring of photosynthetic activity based on pH data to assess microalgae cultivation. J. Environ. Manag. 2020, 276, 111343. [Google Scholar] [CrossRef]
  31. Vijayaraghavan, G.; Jayalakshmi, M. A Quick Review on Applications of Fuzzy Logic in WasteWater Treatment. Int. J. Res. Appl. Sci. Eng. Technol. 2015, 3, 421–425. [Google Scholar]
  32. Robles, A.; Capson-Tojo, G.; Ruano, M.V.; Latrille, E.; Steyer, J.-P. Development and pilot-scale validation of a fuzzy-logic control system for optimization of methane production in fixed-bed reactors. J. Process Control 2018, 68, 96–104. [Google Scholar] [CrossRef]
  33. Ruano, M.V.; Ribes, J.; Seco, A.; Ferrer, J. An advanced control strategy for biological nutrient removal in continuous systems based on pH and ORP sensors. Chem. Eng. J. 2012, 183, 212–221. [Google Scholar] [CrossRef] [Green Version]
  34. Kushwaha, O.S.; Uthayakumar, H.; Kumaresan, K. Modeling of carbon dioxide fixation rate by micro algae using hybrid Artificial Intelligence and Fuzzy Logic methods and optimization by Genetic Algorithm. Res. Sq. 2021; pre-printed. [Google Scholar] [CrossRef]
  35. Nassef, A.M.; Sayed, E.T.; Rezk, H.; Abdelkareem, M.A.; Rodriguez, C.; Olabi, A.G. Fuzzy-modeling with Particle Swarm Optimization for enhancing the production of biodiesel from Microalga. Energy Sources Part A Recov. Util. Environ. Eff. 2019, 41, 2094–2103. [Google Scholar] [CrossRef]
  36. Naeini, M.A.; Zandieh, M.; Najafi, S.E.; Sajadi, S.M. Analyzing the development of the third-generation biodiesel production from microalgae by a novel hybrid decision-making method: The case of Iran. Energy 2020, 195, 116895. [Google Scholar] [CrossRef]
  37. García, J.; Ortiz, A.; Álvarez, E.; Belohlav, V.; García-Galán, M.J.; Díez-Montero, R.; Álvarez, J.A.; Uggetti, E. Nutrient removal from agricultural run-off in demonstrative full scale tubular photobioreactors for microalgae growth. Ecol. Eng. 2018, 120, 513–521. [Google Scholar] [CrossRef] [Green Version]
  38. Iasimone, F.; Panico, A.; De Felice, V.; Fantasma, F.; Iorizzi, M.; Pirozzi, F. Effect of light intensity and nutrients supply on microalgae cultivated in urban wastewater: Biomass production, lipids accumulation and settleability characteristics. J. Environ. Manag. 2018, 223, 1078–1085. [Google Scholar] [CrossRef]
  39. Pawlowski, A.; Frenández, I.; Guzmán, J.L.; Berenguel, M.; Acién, F.G.; Dormido, S. Event-based selective control strategy for raceway reactor: A simulation study. IFAC-PapersOnLine 2016, 49, 478–483. [Google Scholar] [CrossRef]
  40. Ras, M.; Steyer, J.P.; Bernard, O. Temperature effect on microalgae: A crucial factor for outdoor production. Rev. Environ. Sci. Biotechnol. 2013, 12, 153–164. [Google Scholar] [CrossRef] [Green Version]
  41. Viruela, A.; Robles, A.; Durán, F.; Ruano, M.V.; Barat, R.; Ferrer, J.; Seco, A. Performance of an outdoor membrane photobioreactor for resource recovery from anaerobically treated sewage. J. Clean. Prod. 2018, 178, 665–674. [Google Scholar] [CrossRef]
  42. Singh, V.; Mishra, V. Evaluation of the effects of input variables on the growth of two microalgae classes during wastewater treatment. Water Res. 2022, 213, 118165. [Google Scholar] [CrossRef]
  43. Collao, J.; Morales-Amaral, M.M.; Acién-Fernández, F.G.; Bolado-Rodríguez, S.; Fernandez-Gonzalez, N. Effect of operational parameters, environmental conditions, and biotic interactions on bacterial communities present in urban wastewater treatment photobioreactors. Chemosphere 2021, 284, 131271. [Google Scholar] [CrossRef]
  44. González-Camejo, J.; Barat, R.; Aguado, D.; Ferrer, J. Continuous 3-year outdoor operation of a flat-panel membrane photobioreactor to treat effluent from an anaerobic membrane bioreactor. Water Res. 2020, 169, 115238. [Google Scholar] [CrossRef] [PubMed] [Green Version]
  45. Singh, V.; Mishra, V. Exploring the effects of different combinations of predictor variables for the treatment of wastewater by microalgae and biomass production. Biochem. Eng. J. 2021, 174, 108129. [Google Scholar] [CrossRef]
  46. Ruano, M.V.; Ribes, J.; Seco, A.; Ferrer, J. Low cost-sensors as a real alternative to on-line nitrogen analysers in continuous systems. Water Sci. Technol. 2009, 60, 3261–3268. [Google Scholar] [CrossRef]
  47. Durán, F.; Robles, A.; Giménez, J.B.; Ferrer, J.; Ribes, J.; Serralta, J. Modeling the anaerobic treatment of sulfate-rich urban wastewater: Application to AnMBR technology. Water Res. 2020, 184, 116133. [Google Scholar] [CrossRef]
  48. González-Camejo, J.; Barat, R.; Pachés, M.; Murgui, M.; Ferrer, J.; Seco, A. Wastewater Nutrient Removal in a Mixed Microalgae-bacteria Culture: Effect of Light and Temperature on the Microalgae-bacteria Competition. Environ. Technol. 2018, 39, 503–515. [Google Scholar] [CrossRef]
  49. González-Camejo, J.; Aparicio, S.; Pachés, M.; Borrás, L.; Seco, A. Comprehensive assessment of the microalgae-nitrifying bacteria competition in microalgae-based wastewater treatment systems: Relevant factors, evaluation methods and control strategies. Algal Res. 2022, 61, 102563. [Google Scholar] [CrossRef]
  50. Sander, R. Compilation of Henry’s law constants (version 4.0) for water as solvent. Atmos. Chem. Phys. 2015, 15, 4399–4981. [Google Scholar] [CrossRef] [Green Version]
  51. Page, J. Chapter IIA-1—The Role of Solar-Radiation Climatology in the Design of Photovoltaic Systems. In Practical Handbook of Photovoltaics, 2nd ed.; Academic Press: Cambridge, MA, USA, 2012; pp. 573–643. ISBN 9780123859341. [Google Scholar] [CrossRef]
  52. Larsen, P.M. Industrial application of fuzzy logic control. Int. J. Man.-Mach. Stud. 1980, 12, 3–10. [Google Scholar] [CrossRef]
  53. Mendel, J.M. Fuzzy logic systems for engineering: A tutorial. Proc. IEEE 1995, 83, 345–376. [Google Scholar] [CrossRef] [Green Version]
  54. American Public Health Association (APHA); American Water Works Association; Water Environment Federation. Standard Methods for the Examination of Water and Wastewater, 22nd ed.; American Public Health Association: Washington, DC, USA; American Water Works Association: Denver, CO, USA; Water Environment Federation: Alexandria, VA, USA, 2012. [Google Scholar]
  55. Otondo, A.; Kokabian, B.; Stuart-Dahl, S.; Gude, V.G. Energetic evaluation of wastewater treatment using microalgae Chlorella vulgaris. J. Environ. Chem. Eng. 2018, 6, 3213–3222. [Google Scholar] [CrossRef]
  56. Rossi, S.; Sforza, E.; Pastore, M.; Bellucci, M.; Casagli, F.; Marazzi, F.; Ficara, E. Photo-respirometry to shed light on microalgae-bacteria consortia—A review. Rev. Environ. Sci. Biotechnol. 2020, 19, 43–72. [Google Scholar] [CrossRef]
  57. González-Camejo, J.; Viruela, A.; Ruano, M.V.; Barat, R.; Seco, A.; Ferrer, J. Effect of light intensity, light duration and photoperiods in the performance of an outdoor photobioreactor for urban wastewater treatment. Algal Res. 2019, 40, 101511. [Google Scholar] [CrossRef]
  58. González-Camejo, J.; Aparicio, A.; Ruano, M.V.; Borrás, L.; Barat, R.; Ferrer, J. Effect of ambient temperature variations on an indigenous microalgae-nitrifying bacteria culture dominated by Chlorella. Bioresour. Technol. 2019, 290, 121788. [Google Scholar] [CrossRef]
  59. Lehmuskero, A.; Chauton, M.S.; Boström, T. Light and photosynthetic microalgae: A review of cellular- and molecular-scale optical processes. Prog. Oceanogr. 2018, 168, 43–56. [Google Scholar] [CrossRef] [Green Version]
  60. Martínez, C.; Mairet, F.; Bernard, O. Theory of turbid microalgae cultures. J. Theor. Biol. 2018, 456, 190–200. [Google Scholar] [CrossRef] [Green Version]
  61. Shoener, B.D.; Schramm, S.M.; Béline, F.; Bernard, O.; Martínez, C.; Plósz, B.G.; Snowling, S.; Steyer, J.P.; Valverde-Pérez, B.; Wágner, D.; et al. Microalgae and cyanobacteria modeling in water resource recovery facilities: A critical review. Water Res. X 2019, 2, 100024. [Google Scholar] [CrossRef]
  62. Mantovani, M.; Marazzi, F.; Fornaroli, R.; Bellucci, M.; Ficara, E.; Mezzanotte, V. Outdoor pilot-scale raceway as a microalgae-bacteria sidestream treatment in a WWTP. Sci. Total Environ. 2020, 710, 135583. [Google Scholar] [CrossRef]
Figure 1. (a) Outdoor MPBR system scheme. (b) Detail of probe locations.
Chemengineering 06 00024 g001
Figure 2. Daily evolution of dissolved oxygen (DO) concentration, dissolved oxygen concentration, standardised at 25 °C (DO25), and PAR during: (a) a sunny day (operating day 12); and (b) a cloudy day (operating day 17).
Chemengineering 06 00024 g002
Figure 3. (a) Correlation between NRR:SS and BP:SS related to DO25sl:SS. All variables are calculated as daily average values. (b) Continuous distribution of DO25′:SS and NRR:SS.
Chemengineering 06 00024 g003
Figure 4. Correlation between experimental maximum PAR (PAR_MAX) and cosine of maximum solar altitude angle (cos (γs_MAX)).
Chemengineering 06 00024 g004
Figure 5. PAR model performance for a sunny day.
Chemengineering 06 00024 g005
Figure 6. PAR TCC model performance for several days: (a) winter; (b) spring; (c) summer; and (d) autumn.
Chemengineering 06 00024 g006aChemengineering 06 00024 g006b
Figure 7. Hourly HRT controller action. Day 16: (a) Input variables; (b) Output settings; Day 40: (c) Input variables; (d) Output settings.
Chemengineering 06 00024 g007
Figure 8. Continuous HRT controller action. (a) MPBR performance; (b) MPBR performance in days 30–42; (c) HRT0 controller action; (d) Hourly HRT controller action; (e) Hourly HRT controller action in days 30–42; (f) NRR·NRL−1 (%) operating at fixed-HRT and HRT control.
Chemengineering 06 00024 g008aChemengineering 06 00024 g008b
Table 1. Substrate (MPBR influent) characteristics.
ParameterUnitMean ± SD
NH4-Nmg N·L−153.7 ± 2.2
NO2-N + NO3-Nmg N·L−10.5 ± 0.7
Pmg P·L−15.2 ± 0.4
N:P molar ratio23.3 ± 1.6
NH4: ammonium; NO2: nitrite; NO3: nitrate; P: phosphorus; N:P: nitrogen:phosphorus molar ratio.
Table 2. Operation and outdoor conditions of the MPBR operating period.
ParameterUnitMean ± SD
Average solar PARµmol·m−2·s−1275 ± 112
Average maximum solar PARµmol·m−2·s−11218 ± 388
Average Temperature°C18.6 ± 1.5
Average DOmg O2·L−110.7 ± 0.5
SRTd2.25 ± 0.01
HRTd1.8 ± 0.4
NLRg N·day−17.3 ± 2.0
DO: dissolved oxygen; HRT: hydraulic retention time; NLR: nitrogen loading rate; PAR: photosynthetically active radiation; SRT: solids retention time.
Table 3. Fuzzy control rules HRT0 controller.
Inference Rules:
IF HRT_I1 is S and DO25sl_YD is S, THEN HRT0 is XS
IF HRT_I1 is M and DO25sl_YD is S, THEN HRT0 is S
IF HRT_I1 is S and DO25sl_YD is M, THEN HRT0 is S
IF HRT_I1 is S and DO25sl_YD is L, THEN HRT0 is M
IF HRT_I1 is M and DO25sl_YD is M, THEN HRT0 is M
IF HRT_I1 is L and DO25sl_YD is S, THEN HRT0 is M
IF HRT_I1 is M and DO25sl_YD is L, THEN HRT0 is L
IF HRT_I1 is L and DO25sl_YD is M, THEN HRT0 is L
IF HRT_I1 is L and DO25sl_YD is L, THEN HRT0 is XL
Table 4. Fuzzy control rules hourly HRT controller.
Inference Rules:
IF PAR_60_FW is S and DO25′:SS is LN, THEN ΔHRT is LP
IF PAR_60_FW is M and DO25′:SS is LN, THEN ΔHRT is LP
IF PAR_60_FW is S and DO25′:SS is SN, THEN ΔHRT is LP
IF PAR_60_FW is L and DO25′:SS is LN, THEN ΔHRT is SP
IF PAR_60_FW is M and DO25′:SS is SN, THEN ΔHRT is SP
IF PAR_60_FW is S and DO25′:SS is SN, THEN ΔHRT is ZE
IF PAR_60_FW is L and DO25′:SS is SN, THEN ΔHRT is ZE
IF PAR_60_FW is M and DO25′:SS is ZE, THEN ΔHRT is ZE
IF PAR_60_FW is S and DO25′:SS is SP, THEN ΔHRT is ZE
IF PAR_60_FW is L and DO25′:SS is ZE, THEN ΔHRT is SN
IF PAR_60_FW is M and DO25′:SS is SP, THEN ΔHRT is SN
IF PAR_60_FW is S and DO25′:SS is LP, THEN ΔHRT is SN
IF PAR_60_FW is L and DO25′:SS is SP, THEN ΔHRT is LN
IF PAR_60_FW is M and DO25′:SS is LP, THEN ΔHRT is LN
IF PAR_60_FW is L and DO25′:SS is LP, THEN ΔHRT is LN
Table 5. Average results for the HRT controller and the fixed HRT.
ParameterHRT ControllerFixed HRT (1.25 days)
NRR·NLR−1 (%) [1–55 days]66.0 ± 13.850.0 ± 11.9
NRR·NLR−1 (%) [46–55 days]73.8 ± 5.150.8 ± 4.7
NST (mgN·L−1) [1–55 days]19.0 ± 5.427.1 ± 5.0
NST (mgN·L−1) [46–55 days] *13.4 ± 1.925.9 ± 1.9
* 46–55 days: Operating period after recovering from extreme cloudy days.
Publisher’s Note: MDPI stays neutral with regard to jurisdictional claims in published maps and institutional affiliations.

