Article

A Newly Developed Empirical Predictive Model for the Dispersed Phase (DP) Holdup in Rotating Disc Contactors

1
Department of Engineering, GUtech, P.O. Box 1816, Muscat 130, Oman
2
Chemical Engineering Department, University of Technology, Alsinaa Street No. 52, B. O., Baghdad 35010, Iraq
3
Department of Chemical Engineering and Petroleum Industries, Al-Mustaqbal University College, Babylon 51001, Iraq
4
Department of Petroleum and Chemical Engineering, Sultan Qaboos University, P.O. Box 33, Muscat 123, Oman
*
Author to whom correspondence should be addressed.
ChemEngineering 2021, 5(4), 79; https://doi.org/10.3390/chemengineering5040079
Submission received: 11 October 2021 / Revised: 3 November 2021 / Accepted: 5 November 2021 / Published: 15 November 2021

Abstract

:
Newly novel developed correlations were derived to predict the dispersed phase (DP) holdup in a rotating disc contactor (RDC) extraction column. DP holdup is one of the significant parameters in the design of liquid–liquid contactors and for calculating their production capacity. Despite the availability of quite a large number of holdup prediction correlations for the RDC, most of these correlations are either general in nature or valid for a limited range of operating conditions. This study conducted an experimental and theoretical investigation of the RDC holdup under the influence of varying geometries, including variations in the dispersed phase distributor, speed of the disc, flow rate, and physical characteristics of the system. The analysis revealed that the holdup decreased with an increasing distributor hole diameter and increased with an increasing disc speed and total flow rate. The effect of the physical properties on the holdup was larger than the effect of the disc speed. Using the measurements of over 150 runs, two RDC column holdup predictive models were proposed and evaluated. The first correlation was derived in terms of the distributor hole diameter, operating parameters, system physical properties, and column geometry. The second correlation excluded the column geometry. These correlations, which consider the distributor hole inlet diameter in predicting the DP holdup for an RDC column, were presented for the first time in this study. The predictive capability of these correlations was evaluated via their standard deviation (SD) and mean average percentage error (MAPE). The respective SD and MAPE of the two correlations were 1.7 and 5.2% for the first correlation and 1.6 and 11.4% for the second.

1. Introduction

Liquid–liquid extraction is increasingly utilized in chemical, pharmaceutical and petrochemical applications for recovering of large- and medium-sized solutes, which are difficult to separate by other techniques. The state of the art for the extraction columns design is to predict the dispersed phase holdup (DP) and include it in the forward or back mixing models, where this parameter accounts for deviations from the ideal plug flow behavior. Acquiring highly efficient counter-current liquid–liquid extraction columns design depends mainly on an excellent mixing in the continuous phase and perfect dispersed drop size distribution. This is challenged by the nature of the dispersed phase holdup which is an essential parameter in the design of extraction columns was reported by Al Rahawi and Al Dawery [1]. They reported the importance of dispersed phase inlet distributor on controlling the droplet size and holdup, which finally affect quantitatively the mass transfer rate inside the column. Al-Aswad et al. [2], checked the application of drop size distribution and mass transfer on column performance, using a large, 45 cm-diameter rotating disc contactor (RDC) column, on the column performance. Kirou et al. [3] studied the hydrodynamics of a column extractor using a toluene/water system, to monitor the holdup profile in the proximity of flooding. This leads to formulate criteria for the prediction of flooding in the extractor. Slater M. J. [4] reported that the holdup is a main factor required to determine the relationships between the phase flow rates, the interfacial area and the internal capacity of the columns. Kalaichelvi and Murugesan [5], used a large bank of published literature, from 13 different sources with a wide range of variables, to estimate the different regions of effective operation in extraction column, in terms of rotor critical speed, along with the effect of the geometry factor and no holdup and solute transfer in the column. Korchinsky and Ismail [6] used experimental data from two rotating-disc contactors to study the influence of different variables on the generating of the dispersed phase and continuous-phase mass-transfer coefficients, using the forward-mixing model. Only disc speed was proved to have a significant influence on the interfacial area and the hydrodynamics of the columns in the small column, whereas the larger column mainly depended on flow rate and the distributor used to control drop size. The flow capacity and nature of the mixing of the two phases in the extraction column plays a role in determining the column’s size. Increasing the mixing level results in an increase in the residence time of droplets inside the column due to the radial non-uniformity flow of the droplets [7]. Significant errors occur when conventional design correlations derived for the homogenous flow model are used to describe a non-uniform flow pattern with circulating droplets in heterogeneous flow contactors. Therefore, new models are needed to describe the non-uniform flow patterns in the liquid–liquid extractors [8].
Kumar and Hartland [9] used 611 experimental results for 29 liquid–liquid systems from 15 published data sources to derive four correlations to estimate DP holdup in rotating disc extractors in the presence and absence of mass transfer. The suggested correlations take the following general form shown in Equation (1):
= [ k 1 + k 2 ( D N 2 g ) n 1 ] ( D s 2   C h   ρ c   g D c 2   σ ) n 2 ( ρ ρ c ) n 3   ( μ c   g 0.25 ρ c 0.25   σ 0.75 ) n 4 ( V d 4   ρ c g   σ ) 0.22   ( 1 + V c V d ) 0.35
The values of k1, k2, n1, n2, n3 and n4 constants are given in Table 1, for three cases of; (1) no solute transfer, (2) solute transfer from the continuous to the dispersed phase (c–d) and (3) in the opposite direction (d–c). In addition, the authors also proposed a single general equation to be utilized to depict the cases mentioned above in the presence and absence of mass transfer. They claimed that the equations were more precise compared with those previously reported based on the concept of characteristic velocity.
The same authors [10] also reported that distributor hole size and continuous phase density were not included in the analysis, since they did not vary appreciably in the experiments. The effect of interfacial tension was investigated and found to be insignificant, even over a wider range of operating conditions.
In another related study, Kumar and Hartland [11] used published experimental results for eight different types of extraction column. Namely the rotating disk, asymmetric rotating disk, Wirz-11, pulsed perforated-plate, Karr reciprocating-plate, packed, and spray columns, in order to derive a unified correlation for the determination of dispersed-phase holdup. Analysis of the data shows that the holdup can be expressed in terms of the mechanical power dissipation, phase flow rates, physical properties, and column geometry. The average error on the entire data set is 18.1%, which is better than that achieved by most researchers in attempting to correlate their own experimental results. The highest error recorded, was 22.7%, for rotating disk and asymmetric rotating disk columns. The lowest error of 14.1% was achieved for the spray columns. Korchinsky [12] reports that the accuracies of the literature correlations used in the “axial dispersion model” and the more complex “forwarding mixing model models, for prediction of the hydrodynamic and mass transfer parameter in an RDC column, includes holdups that are generally poor, especially for the low interfacial tension system of n-butanol–succinic acid–water. Murakami et. al. [13] proposed a correlation to predict dispersed phase holdup in a rotating disc extraction column which is primarily based on the system physical properties and column geometry:
= 3.3 ( ρ ρ c ) 0.13 ( D N 2 V c ) 0.55 (   V d V c ) 0.8 ( D c   V c 2 ρ c     σ ) 0.18 ( V c 2   g   D c   ) 0.6 (   D D c ) 0.4 (   C h D c ) 0.6 (   D c 2 D 2 D c 2   ) 0.3
Hemmati, et al., [14] investigated the behavior of dispersed phase holdup and flooding point in a pilot plant scale, perforated rotating disc contactor (PRDC), using three different liquid–liquid systems. They derived empirical correlation for a dispersed phase holdup based on operating variables as follows:
= 0.089 ( N 2 D r g ) 0.254 ( D r   C h ) 0.256   ( μ d   μ c   ) 0.272   ( 1 + V c V d ) 1.04
The proposed empirical correlation was validated by comparing it with experimental data. It was reported that the predictive correlation can be utilized for the perforated rotating disc contactors design [13]. Al Rahawi, A.M. [15] insisted that besides the calculation of the holdup, the calculation of the droplet size along the column height is decisive to describe the nature and behaviour of mass transfer and hydrodynamics parameters in liquid extraction column. Sá et al. [16] measured the dispersed phase holdup in a liquid–liquid extraction column using two columns with the same diameter (0.092 m) but with different lengths. The first had a height of 0.70 m with three stages, while the second had a height of 0.90 m with four stages. An empirical correlation was proposed for calculating the DP holdup in terms of column height and operating conditions. Shahrokh et al. [17] investigated the impact of operating parameters on the dispersed phase holdup in a liquid–liquid Scheibel extraction column. Three chemical systems (butyl acetate/H2O, toluene/H2O, and n-butanol/H2O) were used to study the holdup characteristics. Another empirical correlation calculated the DP holdup with an average absolute relative error of 8.72%. Mirmohammadi et al., [18] investigated the effects of operational parameters on the mean drop diameter, the dispersed phase holdup and the slip velocity a horizontal pulsed sieve plate column. It was found that an increase in the pulsation intensity led to a decrease in holdup and d32, and an increase in the phase flowrates cause an increase in both holdup and d32, although the impact of the flow rates on the mean drop diameter was much milder than the pulsation intensity. Also, it was observed that the slip velocity increases by increasing the pulsation intensity and the phase flowrates. They proposed three experimental-theoretical correlations for predicting mean drop diameter, the dispersed phase holdup and the slip velocity based on the experimental results and dimensional analysis. The average absolute relative errors (AARE) of these parameters were 9.90%, 14.45%, and 8.58%, respectively, signifying their accuracy and usefulness for scaling up a horizontal pulsed sieve plate column. Moreover, the hydrodynamic behavior of the reactive extraction system in a horizontal pulsed sieve-plated column was also studied by Khanramakia et al. [19]. The effects of operating parameters and reactive condition were investigated. It was showed that an increase in pulse intensity caused the decrease of dispersed phase holdup and increase slip velocity. They demonstrated from the comparison between their experimental holdup results with the proposed correlations obtained from the previous studies that the previous correlations have reasonable accuracy to prognosticate the holdup as well as the characteristic and slip velocities in this column. The novel correlations were offered to prognosticate the holdup of the dispersed phase as well as to the characteristic and slip velocities for the reactive uranium extraction situations in the horizontal column, as functions of the physical properties of systems and operating conditions. They found that the AAREs of these parameters were 9.87%.
According to the aforementioned, comparison between the operating conditions of the RDC of the present study and various studies found in the literature are summarized in Table 2.
From the above, the available reported correlations for DP holdup are specific to the column type and geometry. More studies need to be conducted for better holdup modeling. Therefore, an experimental and theoretical investigation was conducted to study the holdup in an RDC under the influence of varying geometries, including the following: DP distributor, disc speed, flow rate, and physical characteristics of the system. Two RDC column holdup predictive models were proposed and evaluated. In this study, new correlations for calculating the DP holdup in the RDC column were developed and presented.

2. Experimental Method

The objective of the present work is to develop a correlation that predicts the DP holdup in RDC columns. To generate the data required to determine the most significant variables, experiments were designed that controlled the holdup in an RDC, so that these variables could be used to examine the validity of the proposed correlations. In this work, over 150 experimental runs were conducted. Most of these runs were performed in both the presence and also the absence of mass transport. Most runs used a toluene–water–acetone system. For experiments with mass transfer, acetone as a solute was transported from a continuous water phase to the dispersed phase of toluene. However, for the experiments without mass transfer, the toluene was dispersed into water (continuous phase). For both cases, toluene was dispersed into water to prevent the adhesion of large or small drops dispersed in the aqueous phase. A sample of the data is provided in the supplementary file (Appendix A).

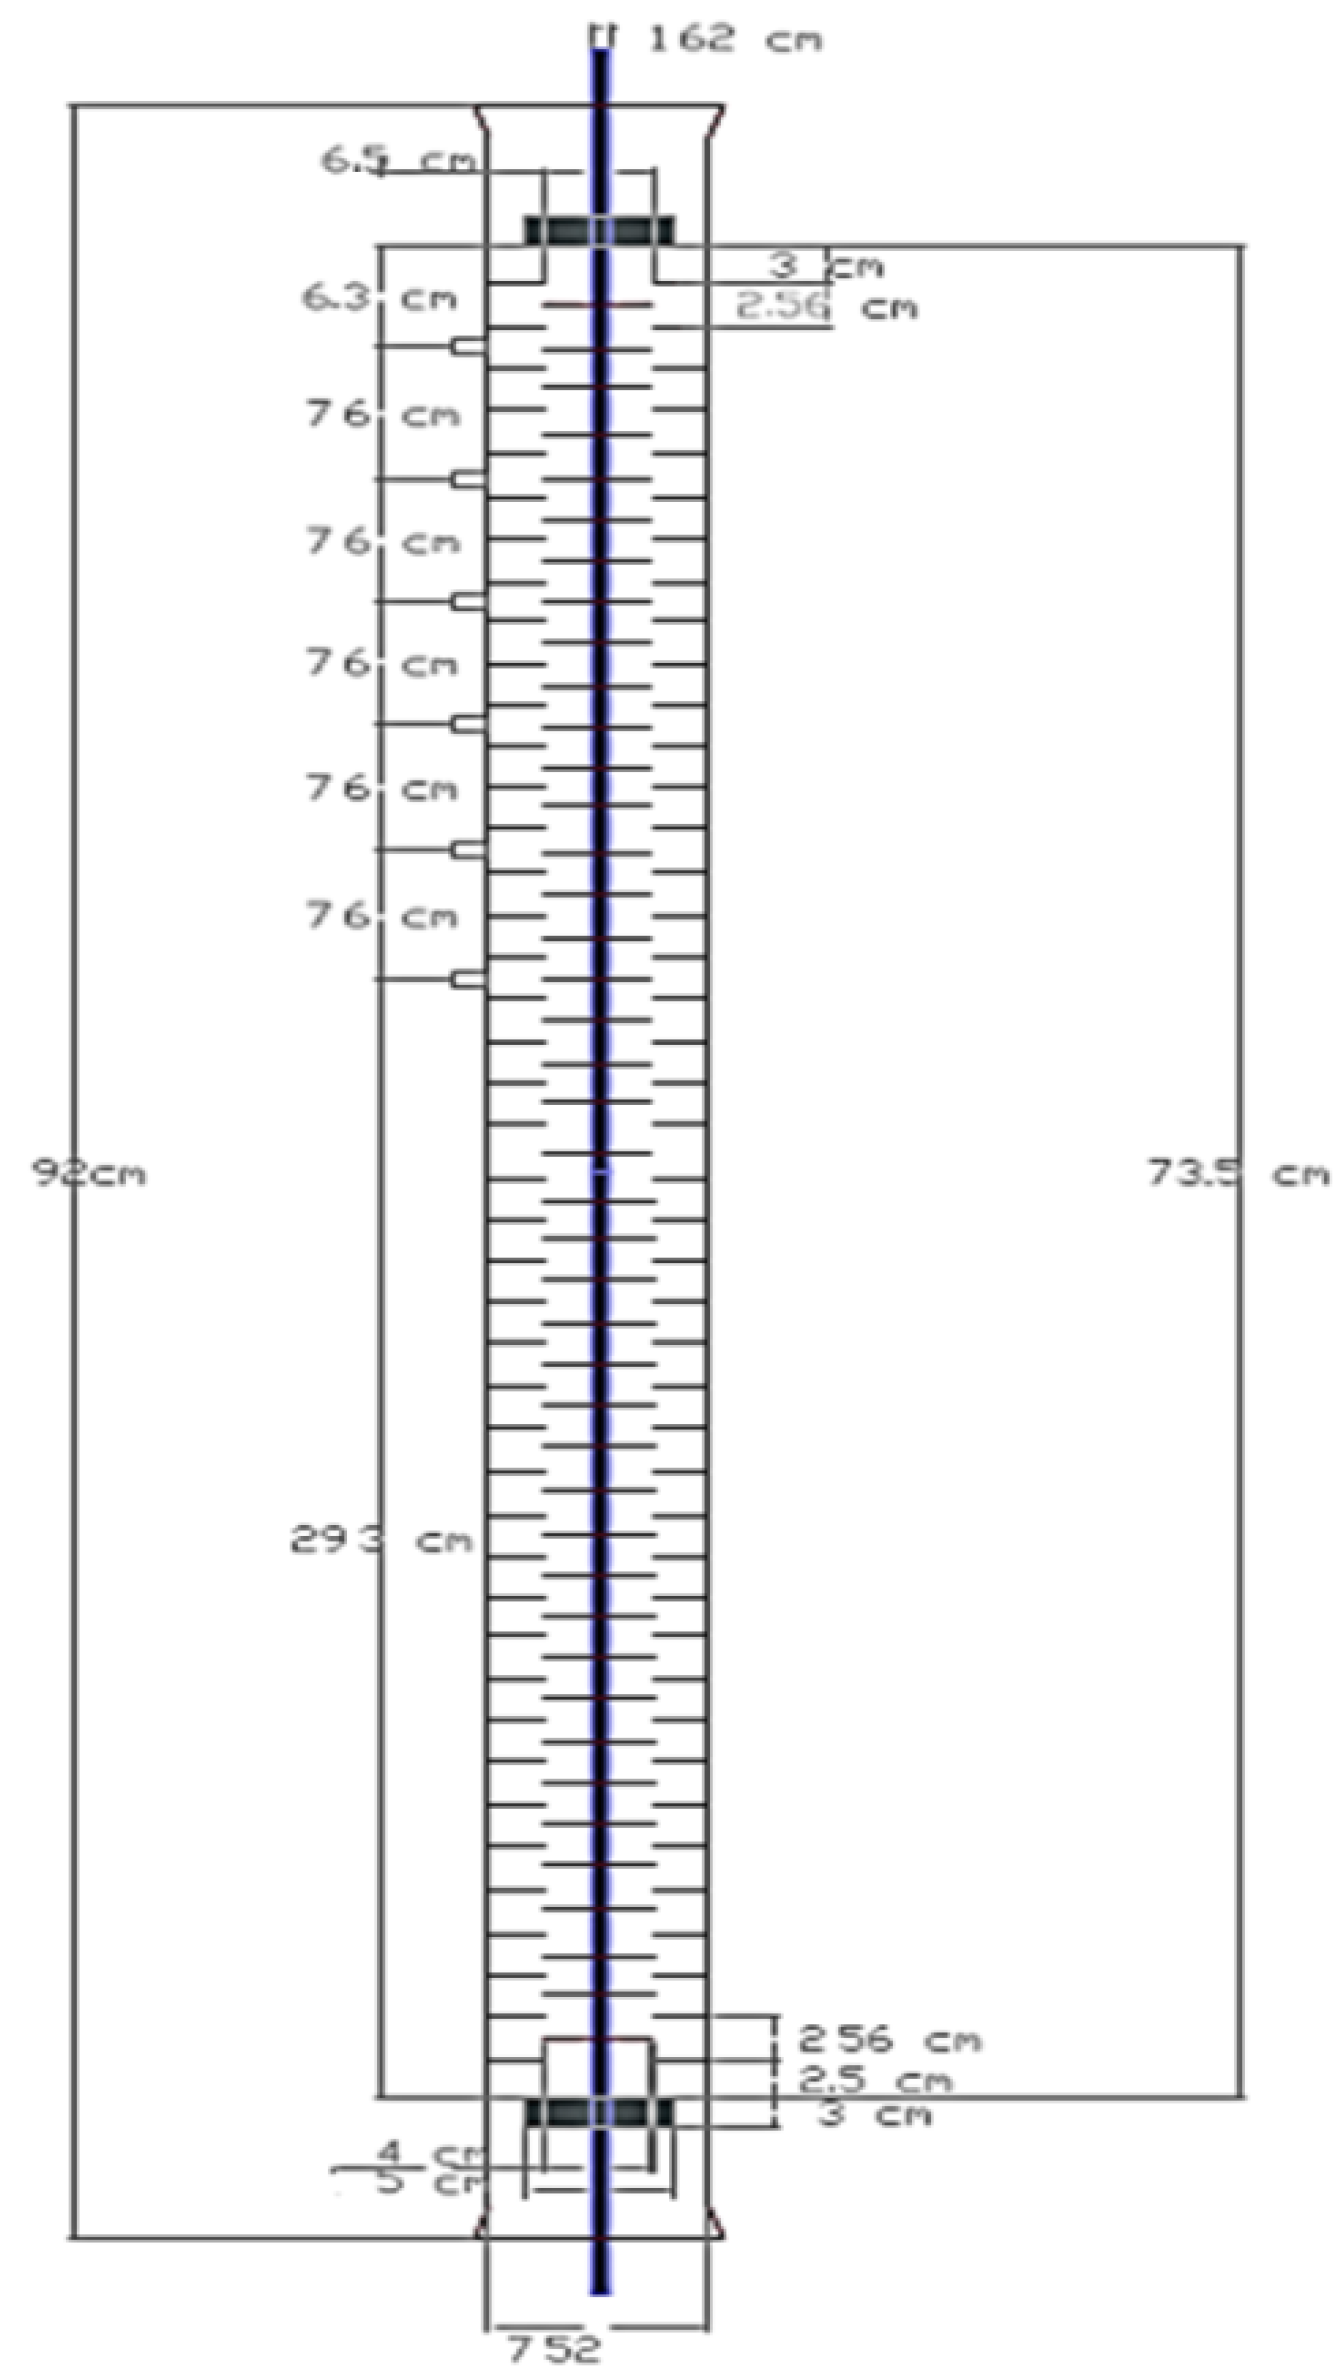
2.1. Experimental Setup

Two pilot plant liquid–liquid extraction RDC columns with diameters of Dc = 7.62 cm and 21.9 cm for small and large columns, respectively, were used to collect data. The dimensions of the small column were: stator ring diameter (Ds) of 4.5 cm, disc diameter (D) of 4.0 cm, compartment height (hc) of 2.54 cm, and column working height (Z) of 73 cm, whereas the large column dimensions were: stator ring diameter (Ds) of 12.934 cm, disc diameter (D) of 11.496 cm, compartment height (hc) of 7.3 cm, and column working height (Z) of 150 cm. Each column consisted of a QVF® glass column shell equipped with two cribriform stainless steel distributors for the continuous and dispersed phases, placed at opposite ends of the column. The flow diagram of the equipment and the dimension of the RDC column are given in Figure 1.
The small column was fitted with two stainless steel perforated-distributor plates placed at opposite ends of the column, one for the dispersed phase and the other for the continuous phase A description of the four various distributors used in this effort is presented in Table 3.

2.2. Experimental Procedure

The DP holdup was measured by shutting off all valves around the column simultaneously; therefore, water and toluene were trapped in the column. The displaced dispersed phase fraction was collected and we measured its volume.
To validate the proposed correlations, the results of this study were compared with data from two previous works that employed a similar experimental operating conditions, procedure, and technique. The first set of data was reported by Korchinsky and Bastani [20], who used an n-butanol–succinic acid–water system with a low surface tension value. These data were chosen to investigate the impact of the physical characteristics on the holdup. At the same time, the data of Korchinsky and Al-Husseini [21], who used a bigger column of 219 mm diameter, were chosen to test the impact of the column diameter on the holdup.

3. Results and Discussion

Quantifying the holdup in the RDC column is a key step in the design of the contactor. This is because holdup represents the active portion of the dispersed phase in contact with the continuous phase.
One of the study’s goals was to examine the influence of the column geometry, operating conditions, and physical properties on the dispersed phase holdup. Two new correlations to calculate the DP holdup in the RDC liquid–liquid extraction column were developed and tested with two-column geometries for the two systems.
To obtain a uniform initial drop size and size distribution in the continuous countercurrent extraction columns, the phase being dispersed is invariably introduced as the continuous phase via a distributor plate unit. These distributors were reported to mainly control the hydrodynamics and mass transfer parameters, including the holdup in the RDC [1,15].

3.1. Correlations Proposed

It is obvious that measuring the DP holdup in a liquid–liquid extraction column at an industrial scale is challenging, costly, and burdensome. There are many reasons for the lack of a fundamental theoretical correlation to predict the holdup. One of the reasons is the complex nature of the multiphase flow within the RDC column resulting from the many interactions between the phases. Most of the available holdup correlations ignored the distributor hole diameter or the drop sizes, and some other correlations were based on the characteristic velocity, which can only be evaluated by trial and error. This forced the designer to expend extra effort to minimize the prediction error.
The objective of this study was to obtain a reliable correlation for the calculations of DP holdup based on the distributor hole diameter, geometry of the column, disc speed, flow nature, and physical characteristics of the system.
Different statistical methods were used to derive the new correlations. The matrix method was used to obtain the values of the correlation’s constant and exponents. Meanwhile, to determine the essential parameters which influence the holdup in the RDC column, the upper triangle of Spearman’s method and lower triangle of Kendall’s method were utilized. The DP hole distributor, flow rate, disc speeds, and physical properties were mainly found to control the holdup values. Neglecting any one of these variables can cause serious prediction errors. The methods of regression analysis and the least square method were employed to determine the correlation’s constant and exponents.
Multiple linear regression was used to generate prediction equation for DP holdup from the most effective independent variables pointed out in the statistical analysis.
The minimum sum of squared differences obtained, based on all data, was below 1 × 10⁻⁶. This minimum was obtained with the number of iterations varying between 33 and 89.
Precise correlations were proposed for the prediction of the DP holdup in the RDC extraction columns. The first was derived in terms of the distributor hole diameter, column geometry, disc speed, physical properties of the system, and operating conditions. The proposed Equation (4) can be used to estimate the dispersed phase holdup data for existing RDC columns. It was validated for RDC columns up to 22 cm in diameter.
ϕ = 0.037 ( U d 1.05 U c 0.2 ) ( N h d ) 0.325 ( Q d + Q c ) 0.175 ( σ g Δ ρ ) 0.25 Q D 0.028 Q C 0.001 C h 0.04 ( D c D ) 0.3
Similar variables were considered in the second correlation Equation (5), except that the column dimensional terms are lacking. This correlation can be used for design purposes as it is based on variables that are known in advance, such as flow rate and physical properties:
ϕ = 0.0038 ( Q d 1.065 Q c 0.901 ) ( N 0.5 h d 0.25 ) ( σ g Δ ρ ) 0.205 ( Q d + Q c ) 0.01
The proposed correlations are the first of their kind that account for the distributor inlet hole diameter in the RDC column. The distributor hole diameter proved to primarily control the drop size but also the holdup [15]. This parameter was neglected by previous investigators.
The first term in the new correlation ( V d 1.05 / V c 0.2 ) represents the ratio of the superficial velocities of the two phases. The dispersed phase velocity Vd provides information about the time the drops need to travel through the continuous phase. The continuous phase will increase the drag force on the dispersed phase droplets and slightly decrease their velocity, which consequently increases the dispersed phase holdup.
The term (N/hd)0.325 in the first correlation represents the ratio of the disc speed to the dispersed phase hole of the distributor. In the literature [1], there have been few attempts to quantify the importance of the DP inlet distributor, which was reported to control the DP drop sizes [14]. The disc speed is known to decrease the drop size and increase the drop rotation within each compartment of the column, which leads to an increase in the drop residence time and eventually increases the holdup. The smaller inlet distributor hole generates smaller drops with lower velocities.
In this study, the influence of the physical properties was represented by the third term in the derived equations, ( σ / g Δ ρ )0.05. This term correlates the system properties to the disc speed and column geometry. Furthermore, it reflects the importance of the physical properties on the drop size, drop size distribution and finally on the nature of the two phases flow within the column. Small density differences would result in a very high holdup as well as low drop velocities; such a situation overestimates the needed column volume, causing a design flaw. Nonetheless, experimentally, Rincon-Rubio et al. [22] reported that there is an insignificant impact of the difference in density ( Δ ρ ) on the size distribution. The effect of integrating physical property relationships, mainly surface tension ( σ ) and the difference in density ( Δ ρ ), into the equations is to increase the reliability and accuracy of the correlation.
There was a limited variation in the effect of the magnitude of the last term ( C h 0.04 / ( D c D ) 0.3 ) on the geometry of the column. As seen in the second correlation, Equation (5), it seems that this effect can be ignored to simplify the equation in the design phase. This will prevent the designer from assuming the column diameter and having to follow a tiresome iteration process. Korchinsky and Ismail [6] and Al-Rahawi [15] showed that the impact of column diameter on d32 was trivial.
The mean absolute percentage error (MAPE) is employed in this work to measure the prediction accuracy of the proposed holdup models. The MAPE is a statistical validation method for trend estimation. It expresses accuracy as a percentage and is defined by the following formula:
M A P E = 100 n i = 1 n | A i F i A i |
where Ai is the measured holdup value, and Fi is the predicted value [20].
Finally, the data for the regression analysis were the confidence index for Equations (4) and (5) which was 95 and 85, respectively.The correlation coefficient was +9 and +0.85, for Equations (4) and (5), respectively, and the regression coefficient was 0.9 and 0.8, for Equations (4) and (5), respectively.

3.2. Applicability of the Proposed Correlations

One of the criteria used in this work to check the reliability of the present correlations depended on the ability of the correlation to reproduce the experimental results with a minimum relative deviation of less than 5% under all conditions. To check the applicability and reliability of the proposed correlations, they were examined with four various distributors, using two column sizes and systems.

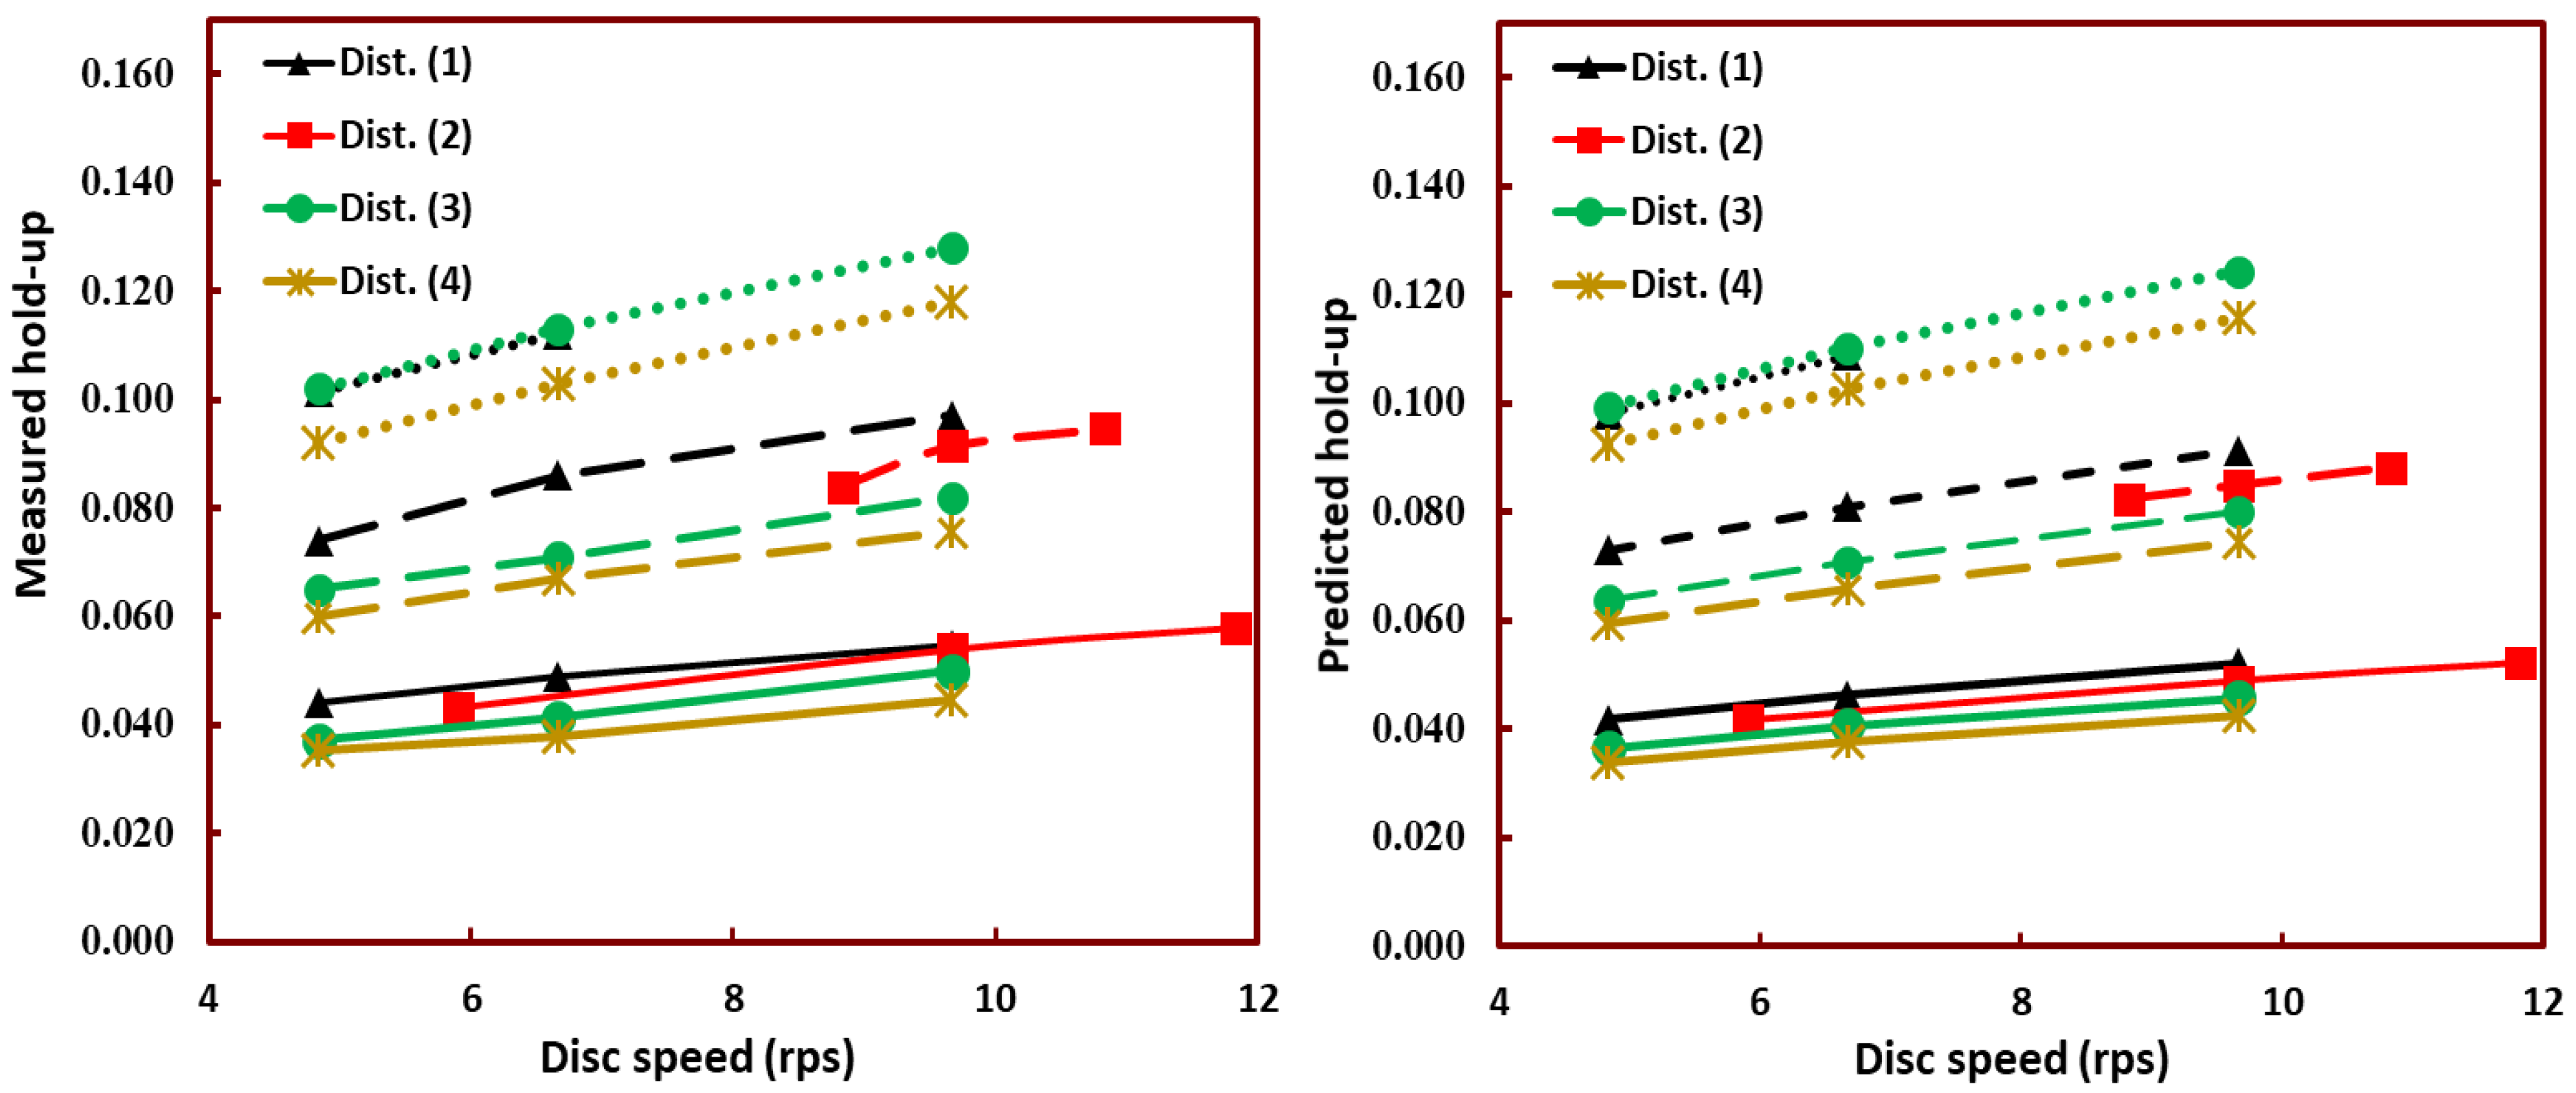
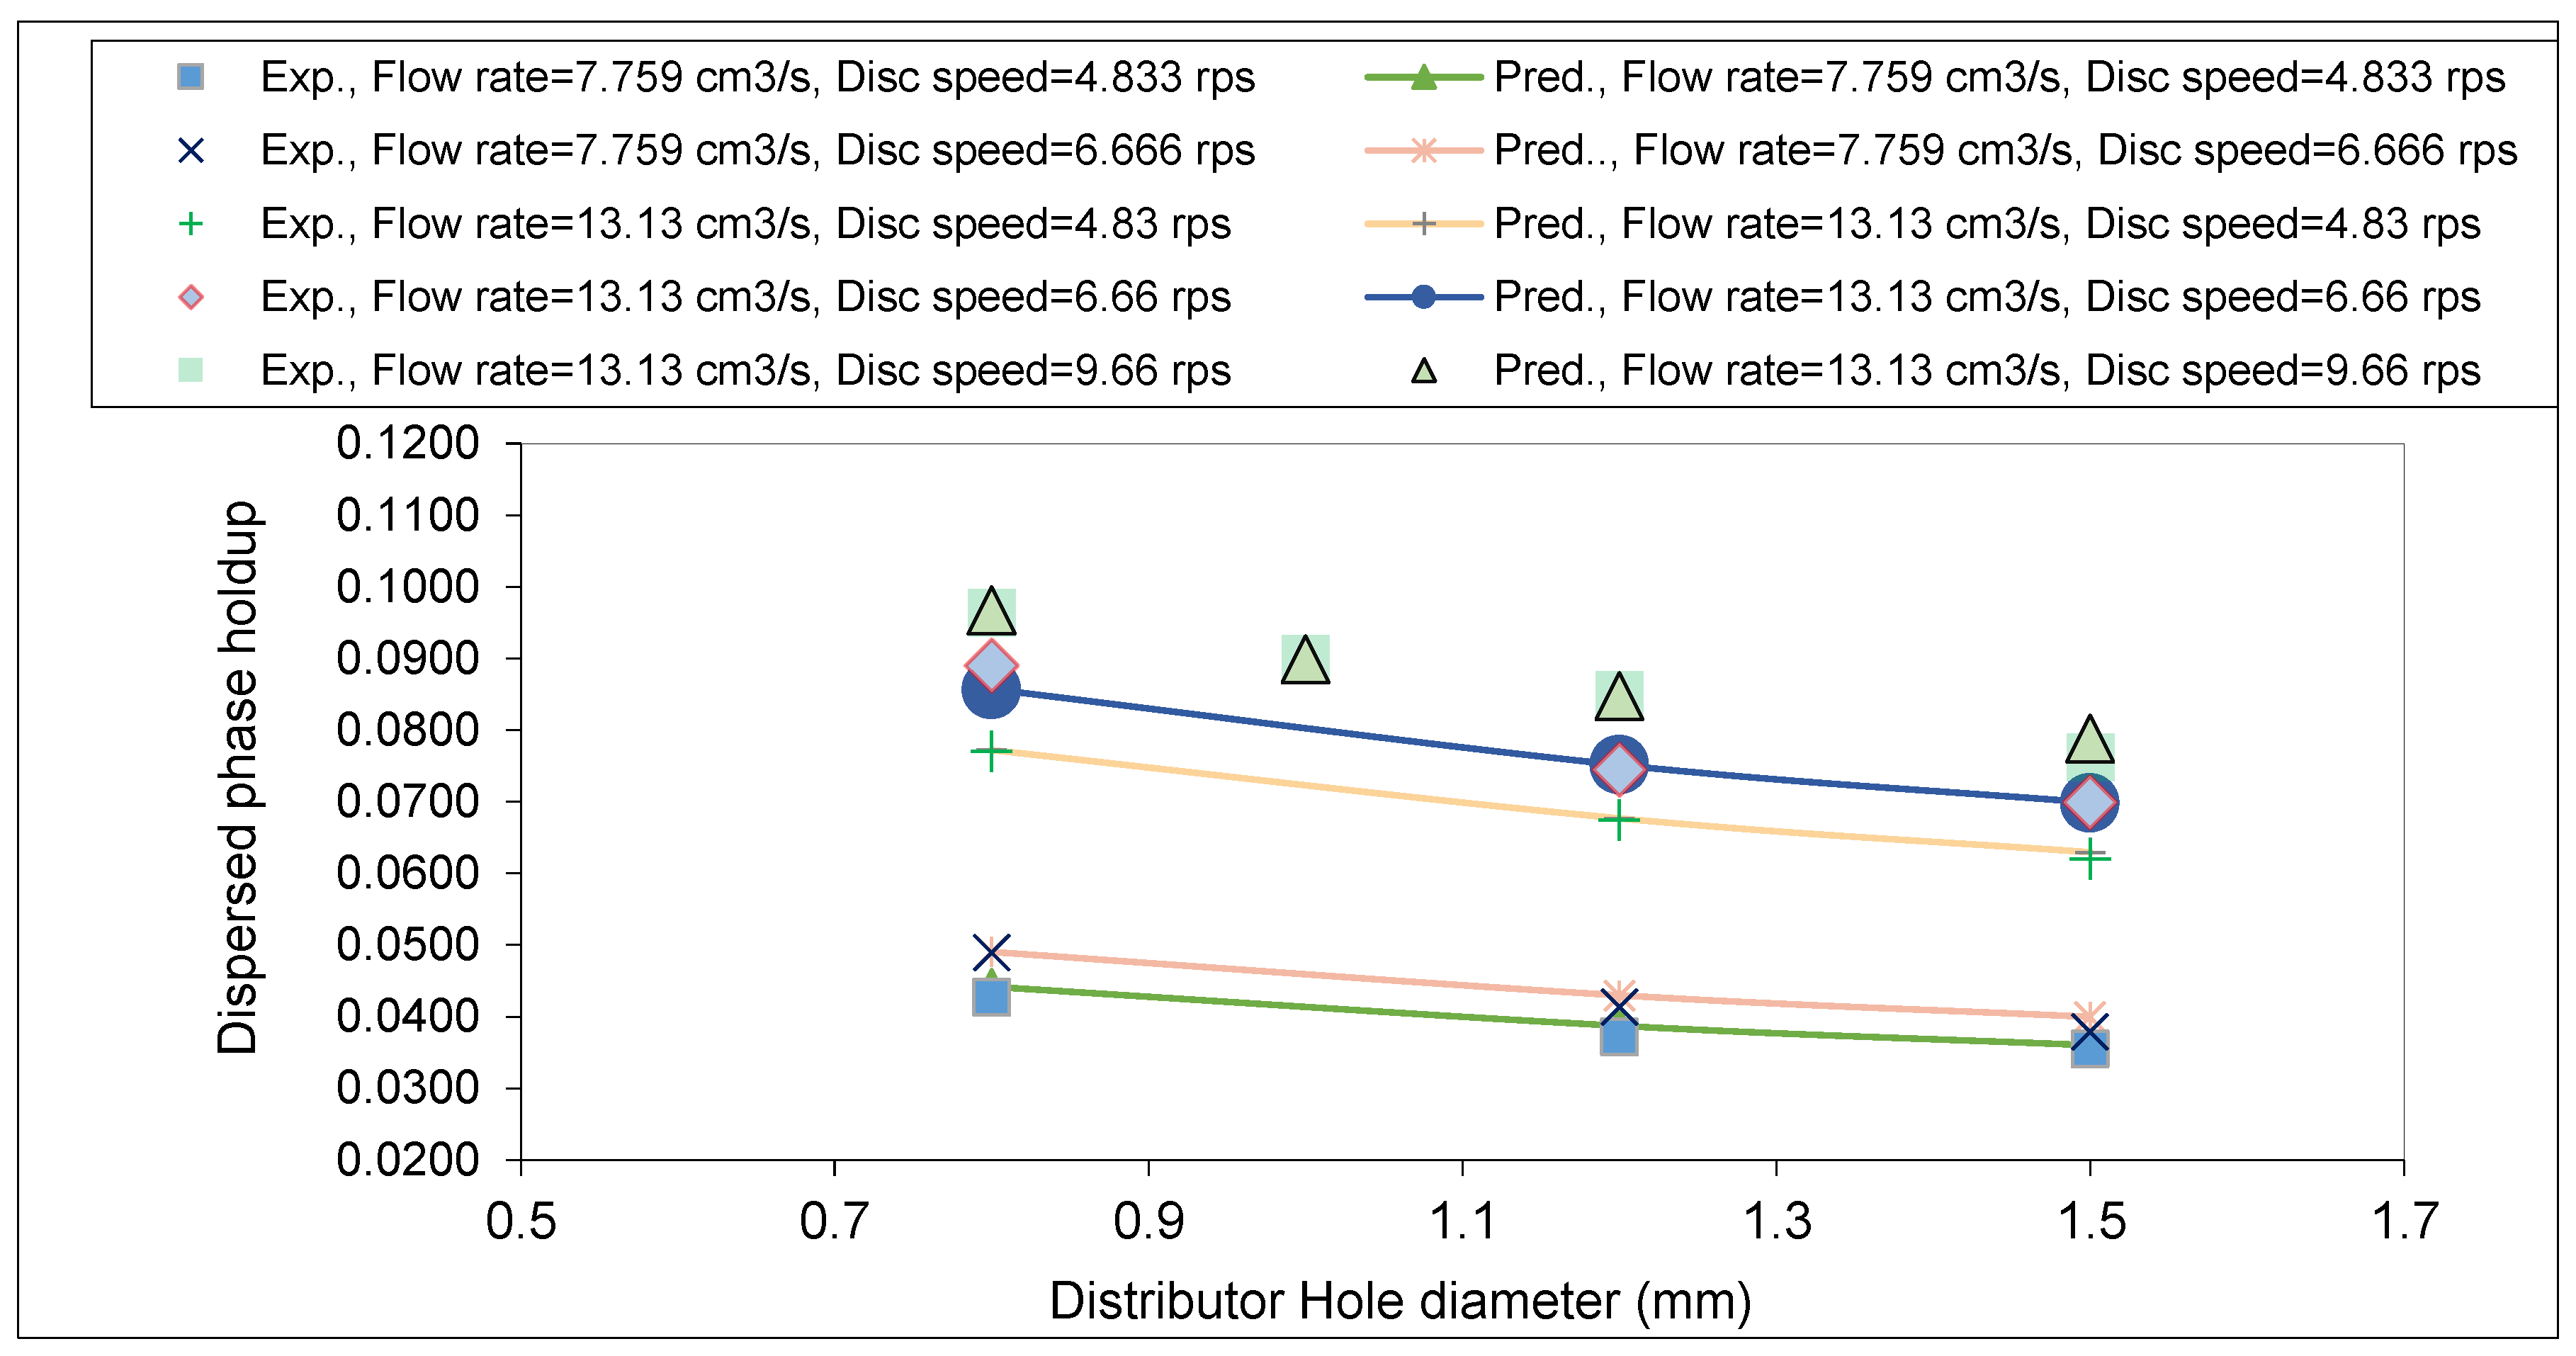
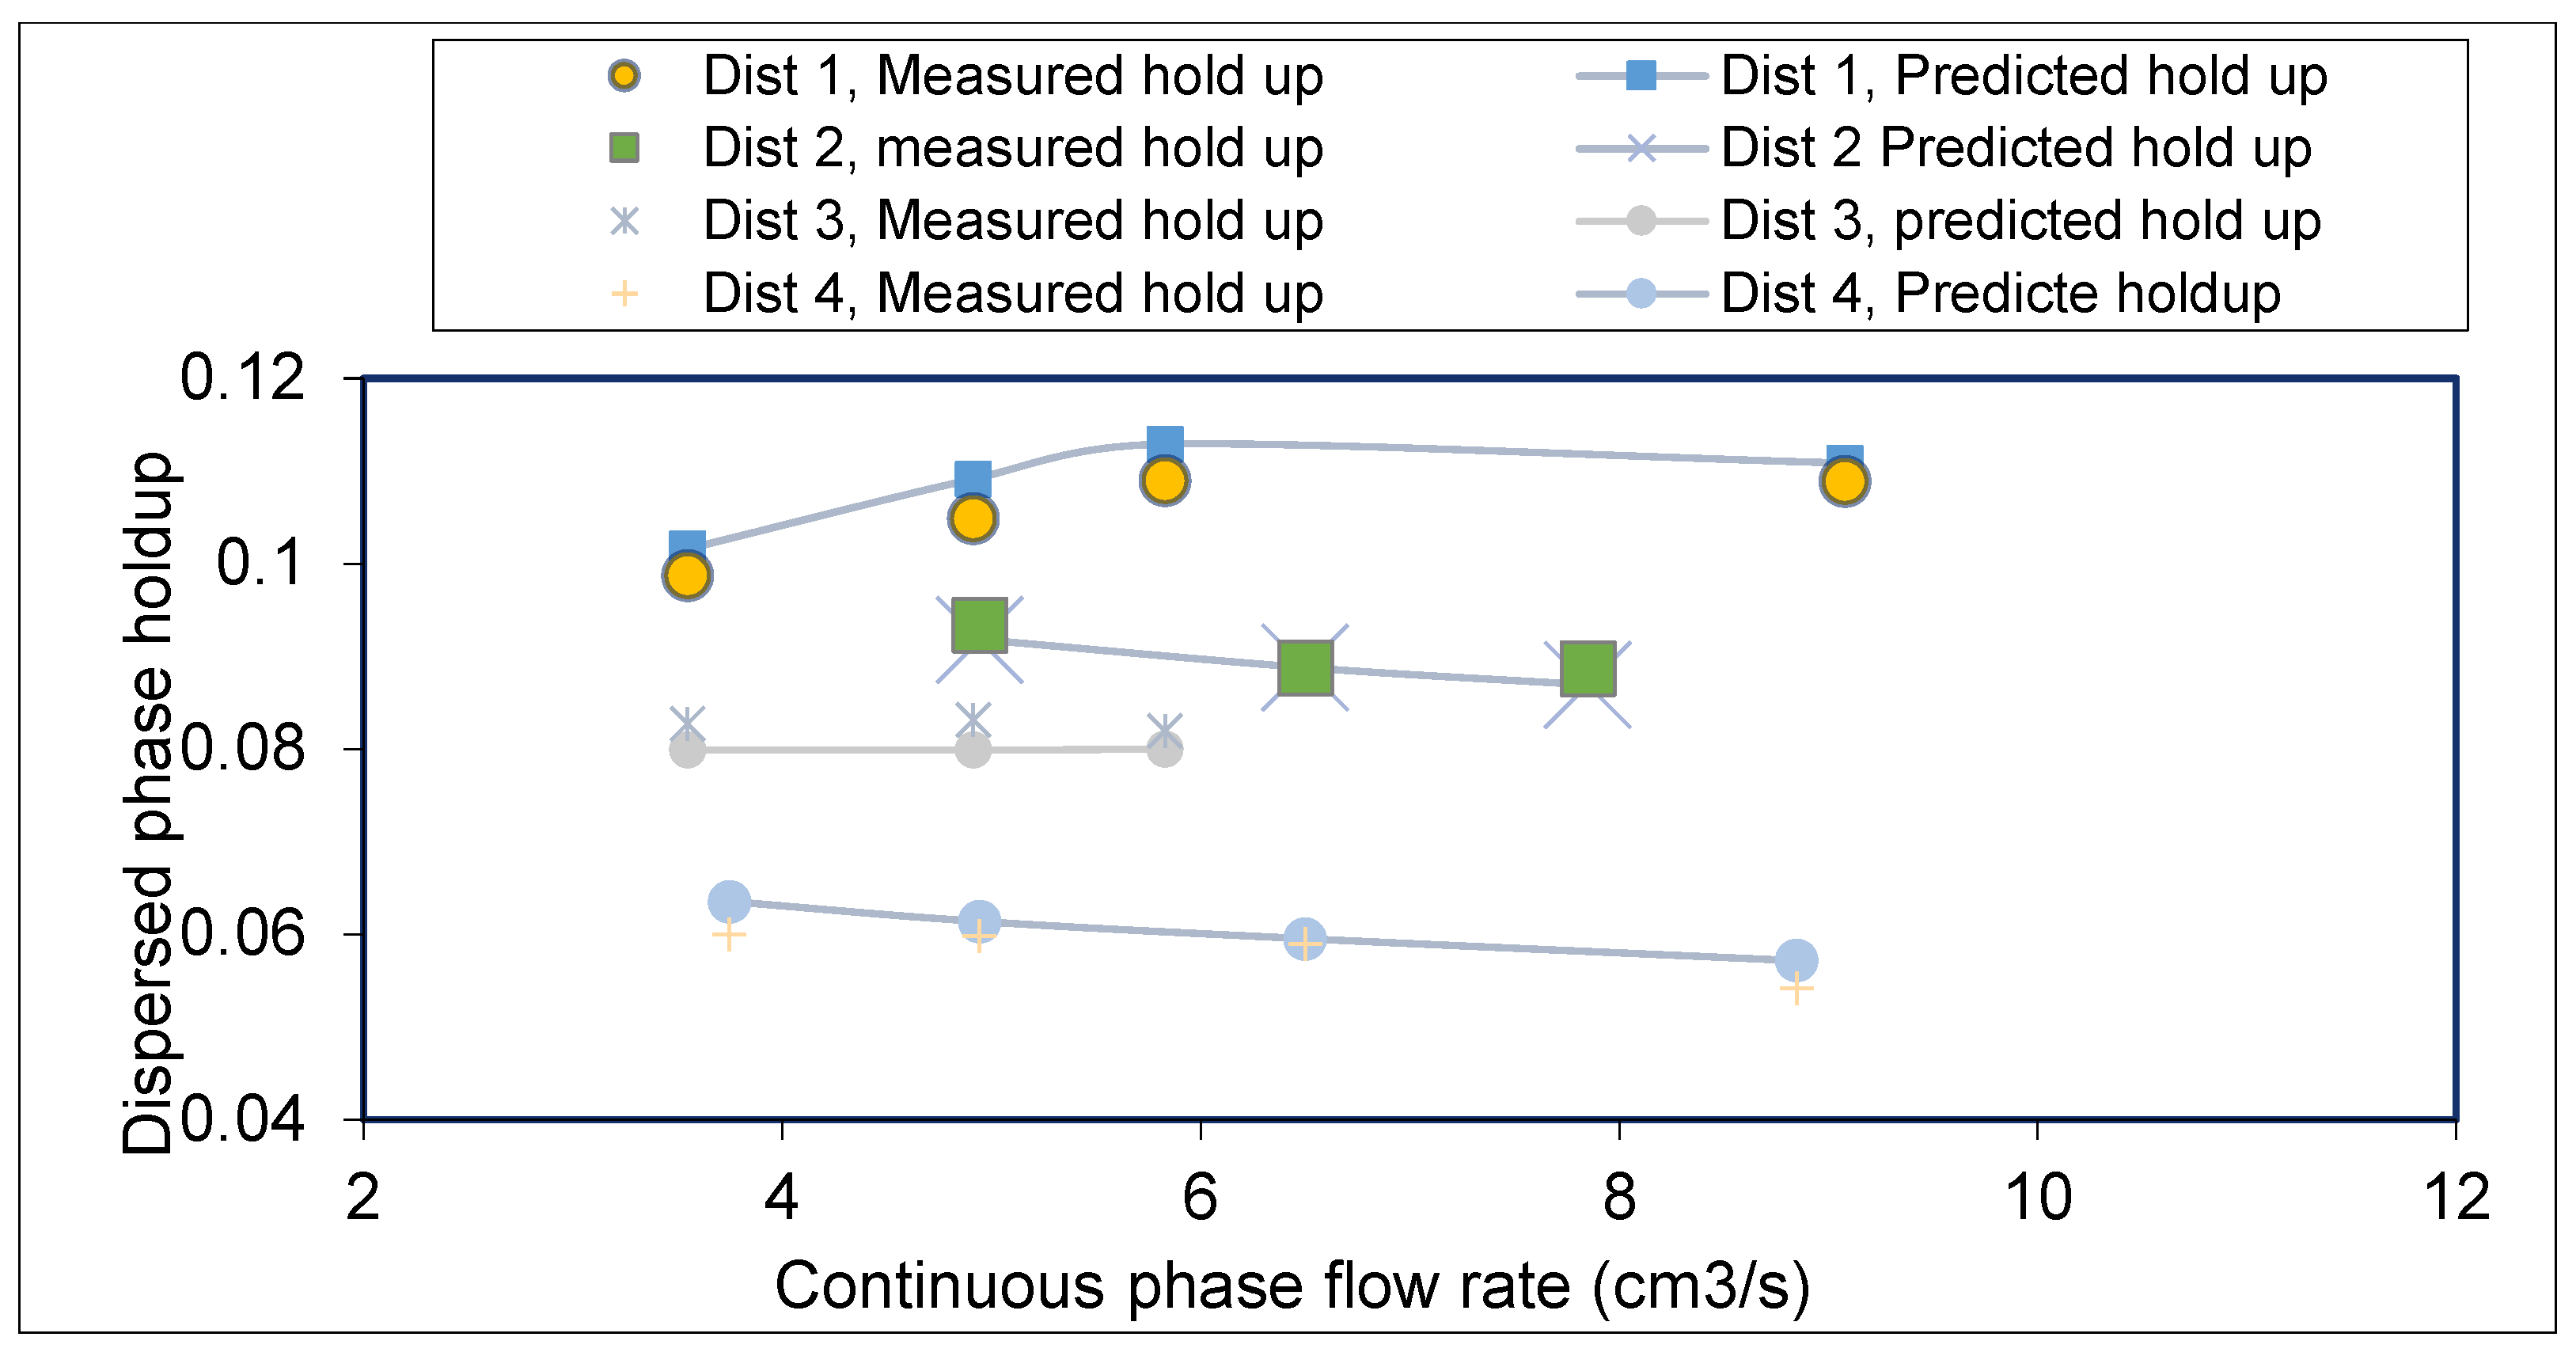
3.2.1. Effect of Dispersed Phase Distributor

The results demonstrate that the holdup was drastically affected by the diameter of the DP hole distributor, phase flow rates, disc speed, and interfacial tension. The holdup was also affected in a significant but weaker manner by the continuous phase flow rates.
The influence of the inlet hole distributor on the DP holdup fractions was tested. In runs represented in Figure 2, the DP holdup produced in the RDC column was significantly affected by the distributor devices employed. A higher dispersed holdup was achieved with smaller diameters of the distributor hole. This is because a larger drop size was produced by hole distributors with larger values [1,15]. Large drops have a higher velocity and shorter residence time, which results in lower holdup. As seen in Figure 2, the proposed Equation (4) responded well to the change in the distributor diameter and generated holdup values close to those measured. The values reproduced by the proposed equation showed a reasonable match between the measured and predicted holdup values.

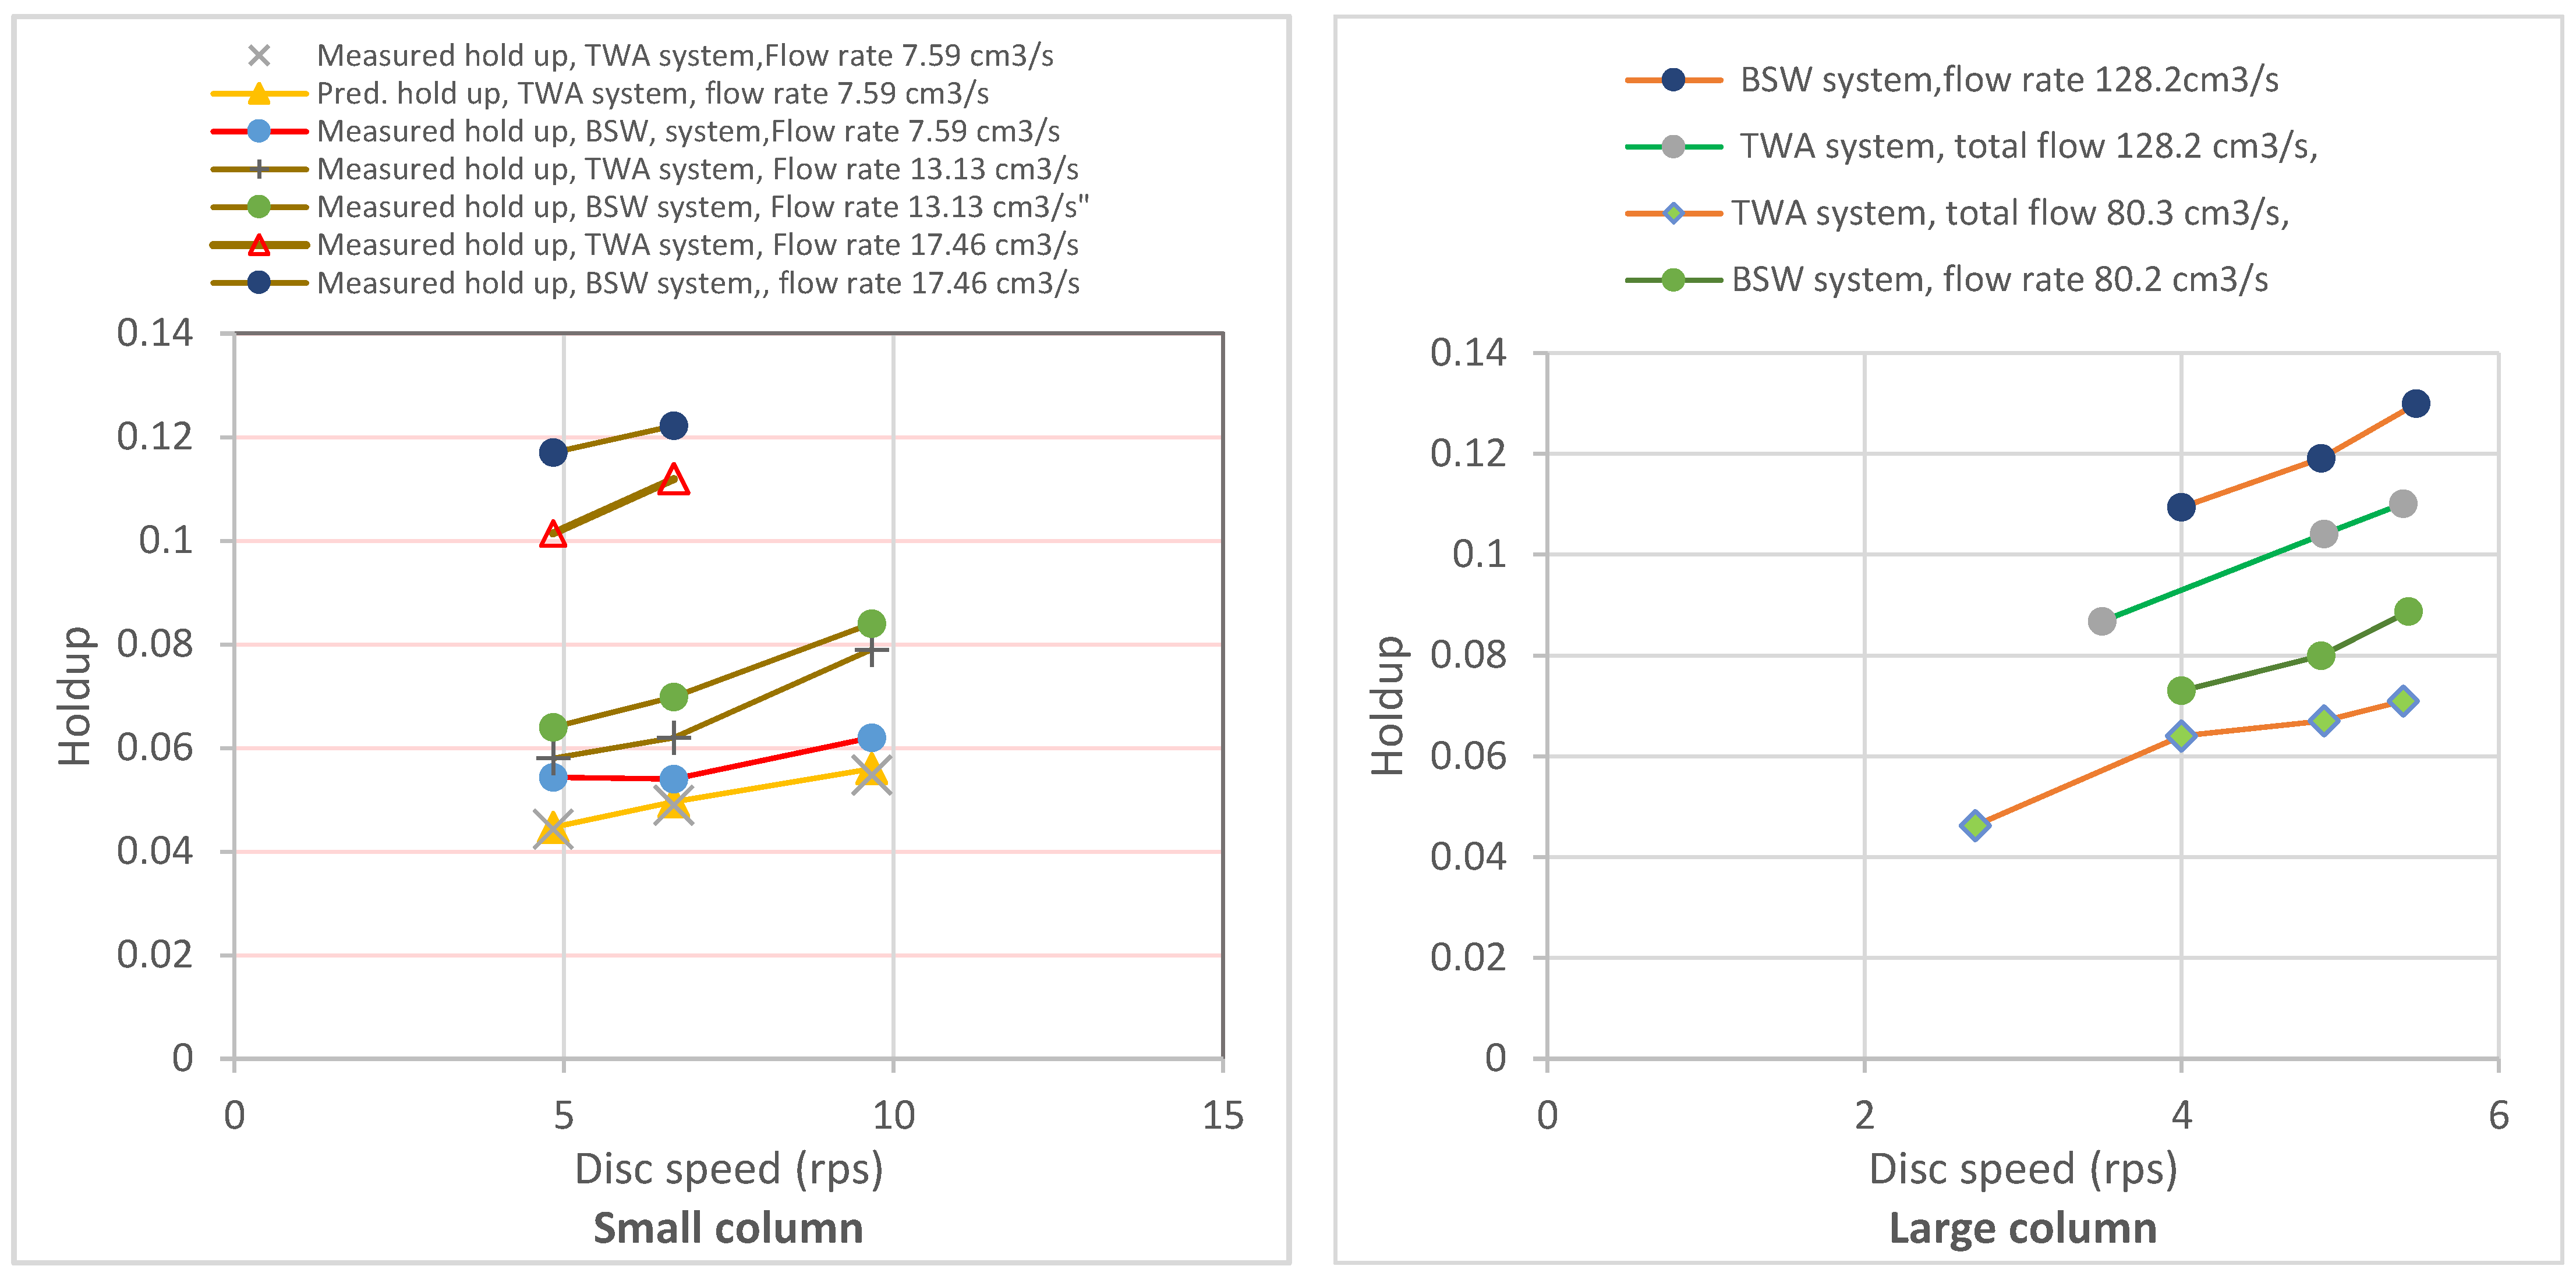
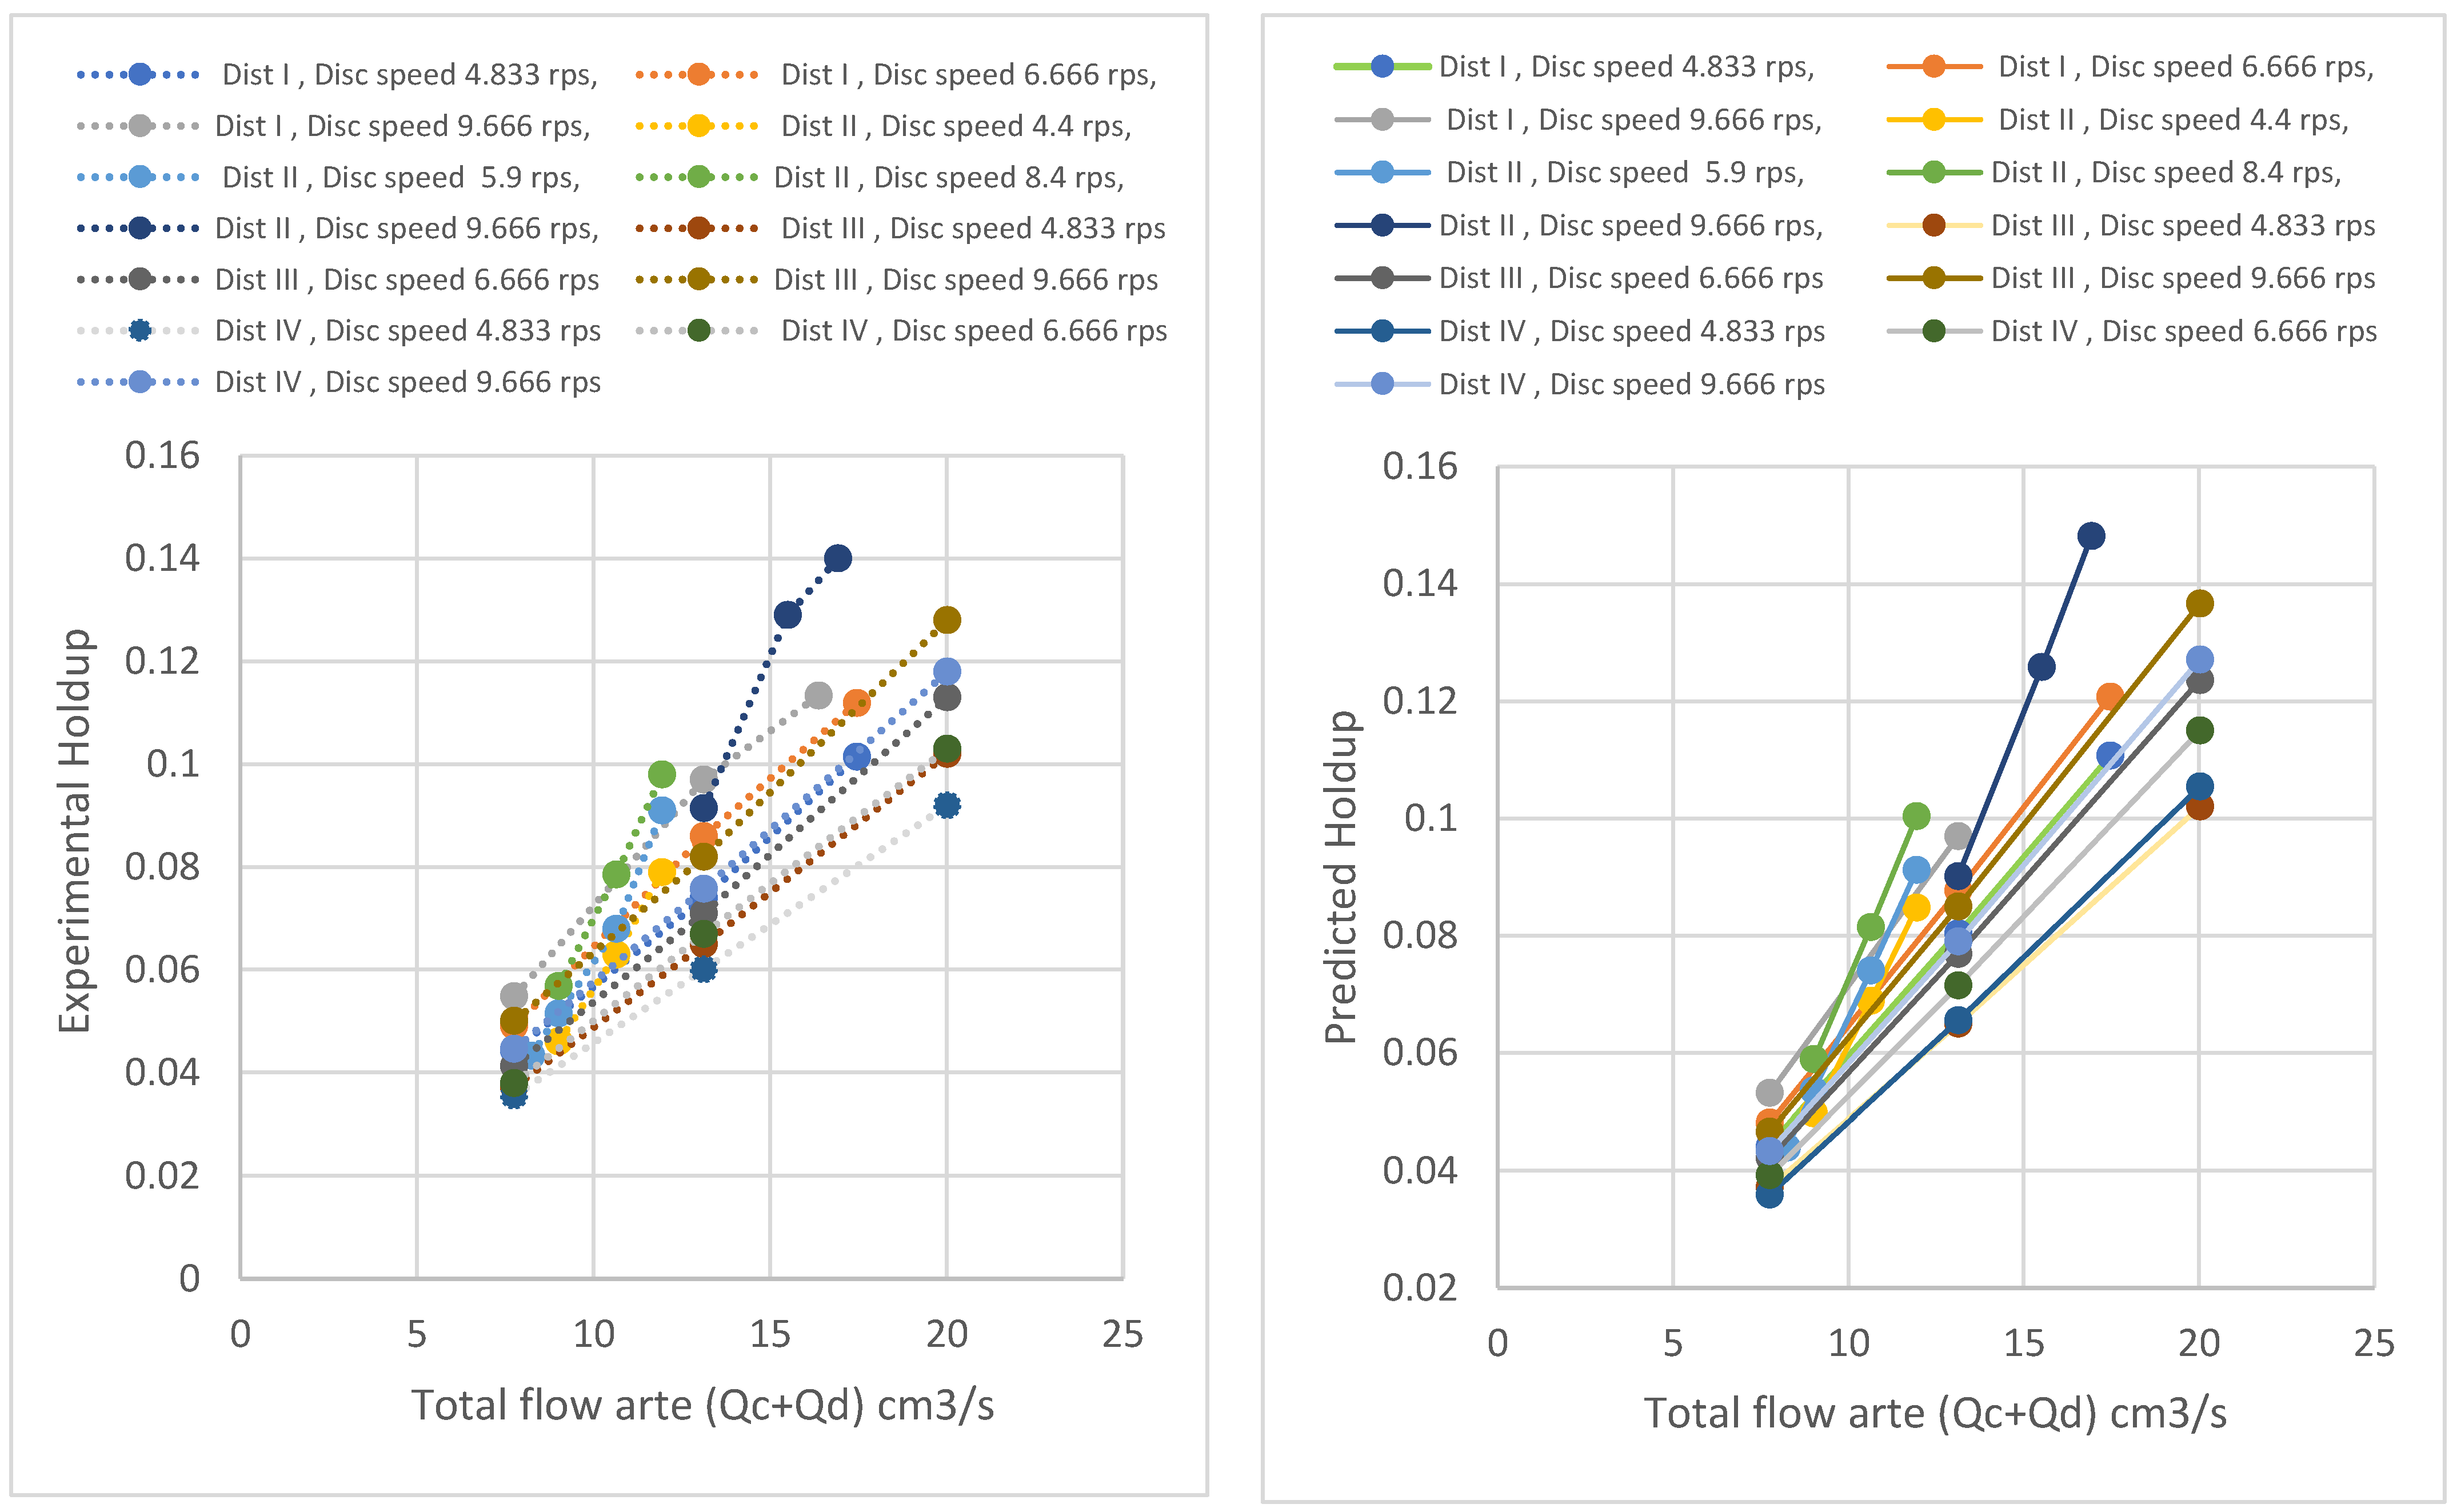
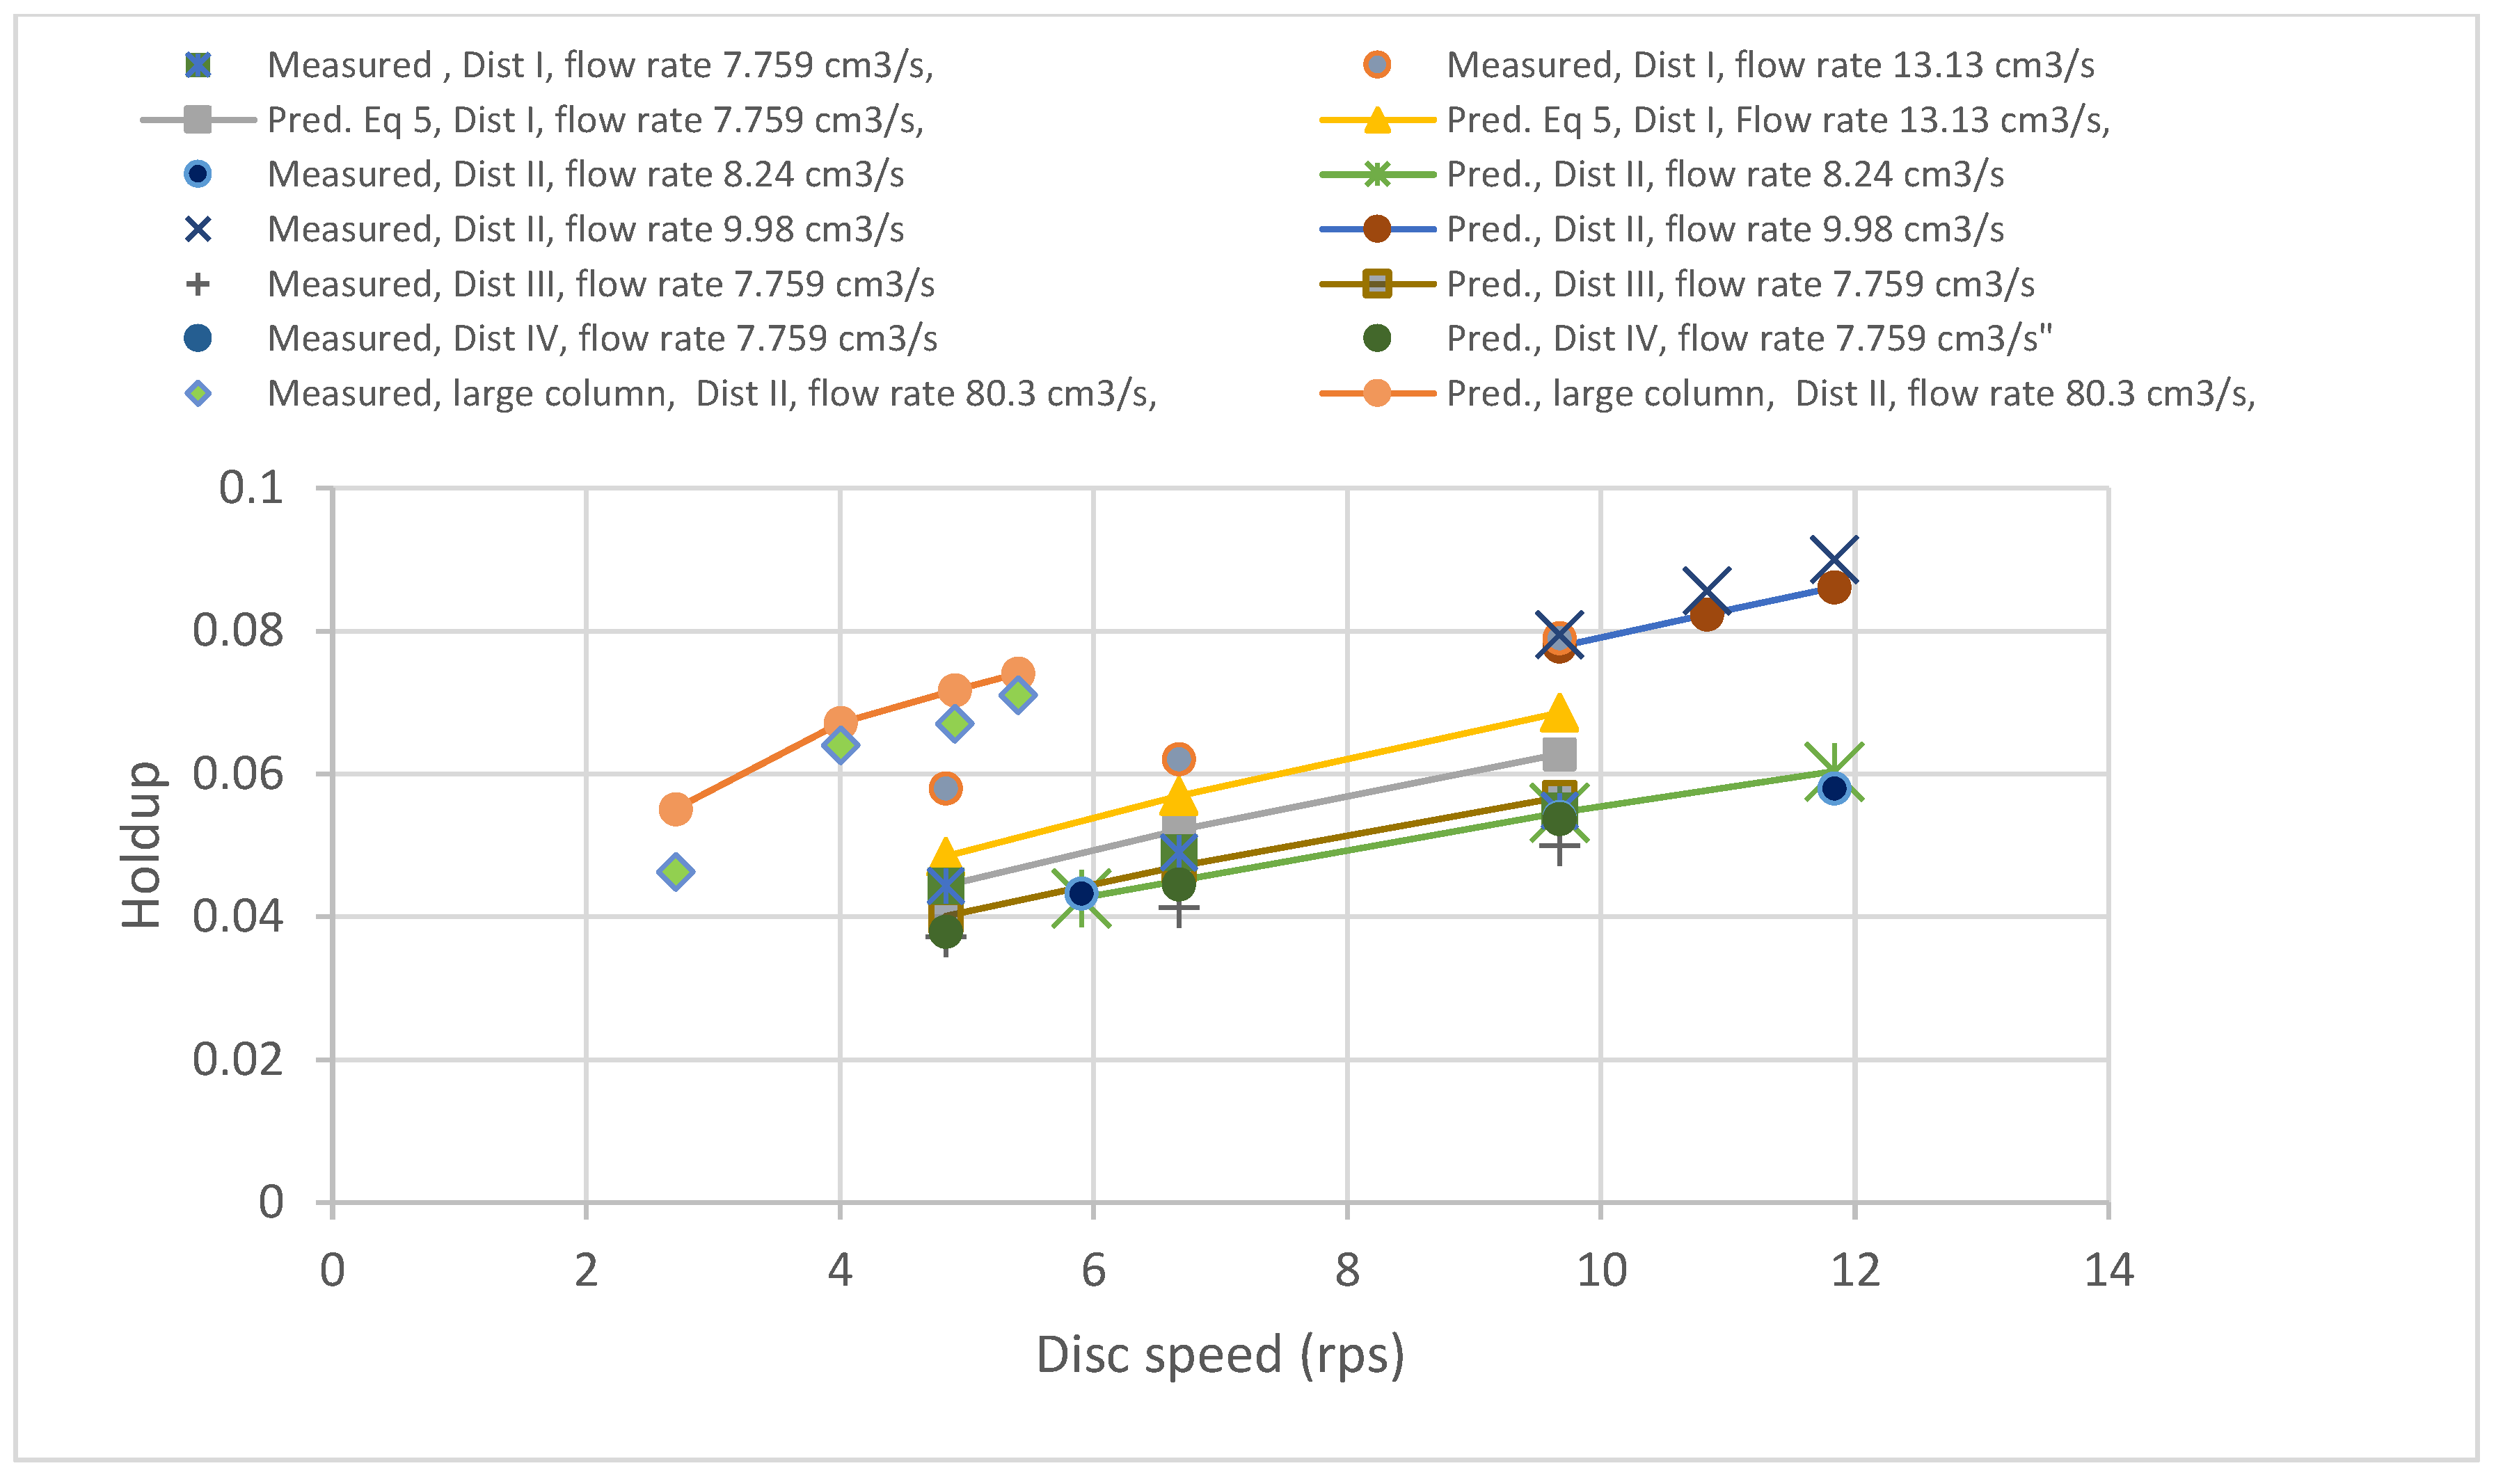
3.2.2. Effect of Flow Rate and Disc Speed

Figure 3 presents the measured and predicted holdup drawn as a function of the total flow. This figure illustrates that the experimental holdup increased as the flow rate increased. This increase in the holdup could be attributed to the increase in the dispersed phase fed to the column and the reduction in drop sizes balanced by the drag force exhibited by the continuous phase. The reproduced values of the experimental data generated by the new correlation were drawn as a function of the total flow rate. The overall results showed a high match between the measured and predicted values.
The impact of the continuous phase on the holdup was tested, and the results for the two distributors are illustrated in Figure 4. The measured and predicted results displayed in the figure indicate that the holdup was weakly affected by the increasing continuous phase flow rate. The proposed correlation reproduced the same trend and was in good agreement with the measured one.
Meanwhile, the effect of the disc speed on the holdup was examined, and the results are illustrated in Figure 4. The measurements were performed using a small column for four distributors using three levels of flow rate (low: 7.759 cm3/s; medium: 13.13 cm3/s; and high: 20.03 cm3/s). The experimentally measured holdup increased with increasing disc speed. The increase in the holdup can be attributed to the reduction in the drop diameter and to an increase in the turbulence level arising from the resistance to flow that originated from the disc action.
These results were reproduced efficiently by the new correlation, as depicted in Figure 5. The comparison between the experimental and theoretical holdup values clearly reflects the accuracy of the correlation to reproduce identical holdup values as a function of disc speed. There was a high degree of consistency and similar trends when comparing the theoretical values with the experimental holdup measured under variable operating conditions.
The DP holdup was affected more by the flow rate changes than by the disc speed in spite of the minor change in the mean size of the drop with the former and the sharp change with the latter. This occurrence could be attributed to two primary parameters: (1) the drag forces caused by the counter-flow, and (2) the axial and radial mixing caused by the rotation of the disc. These two parameters led to an increase in the residence time spent by the drop fractions in the column, leading also to increased holdup.

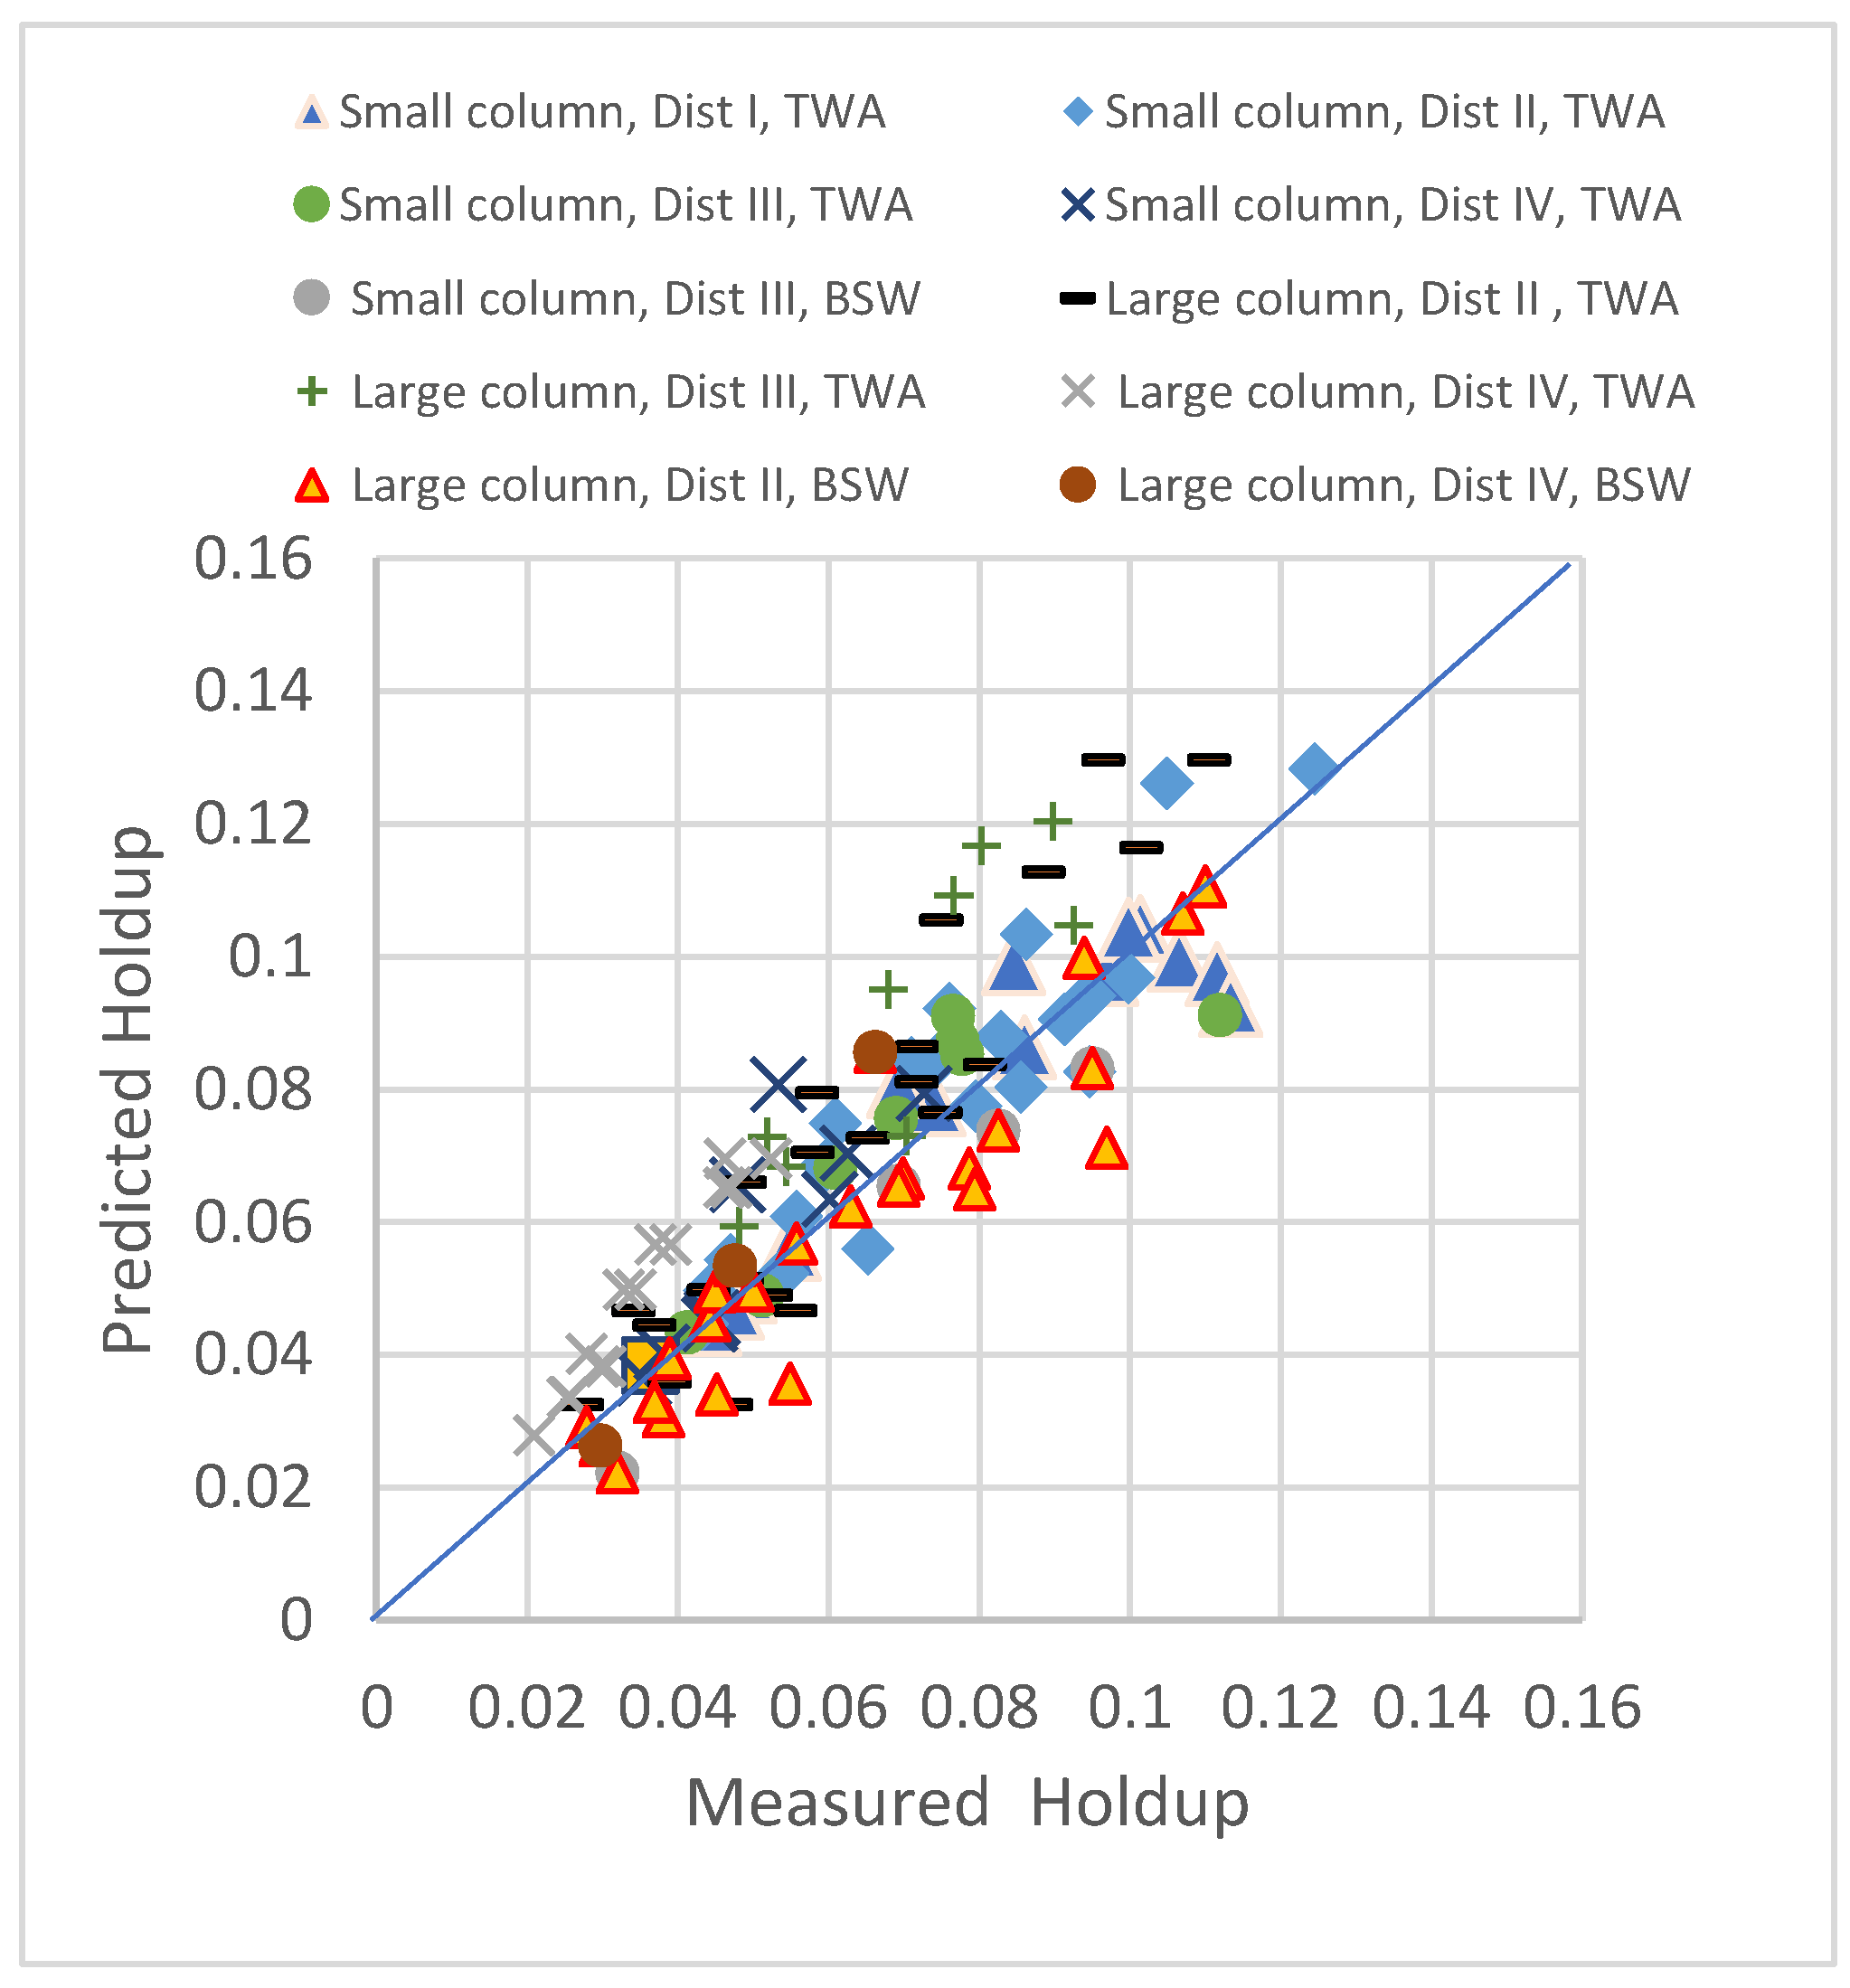
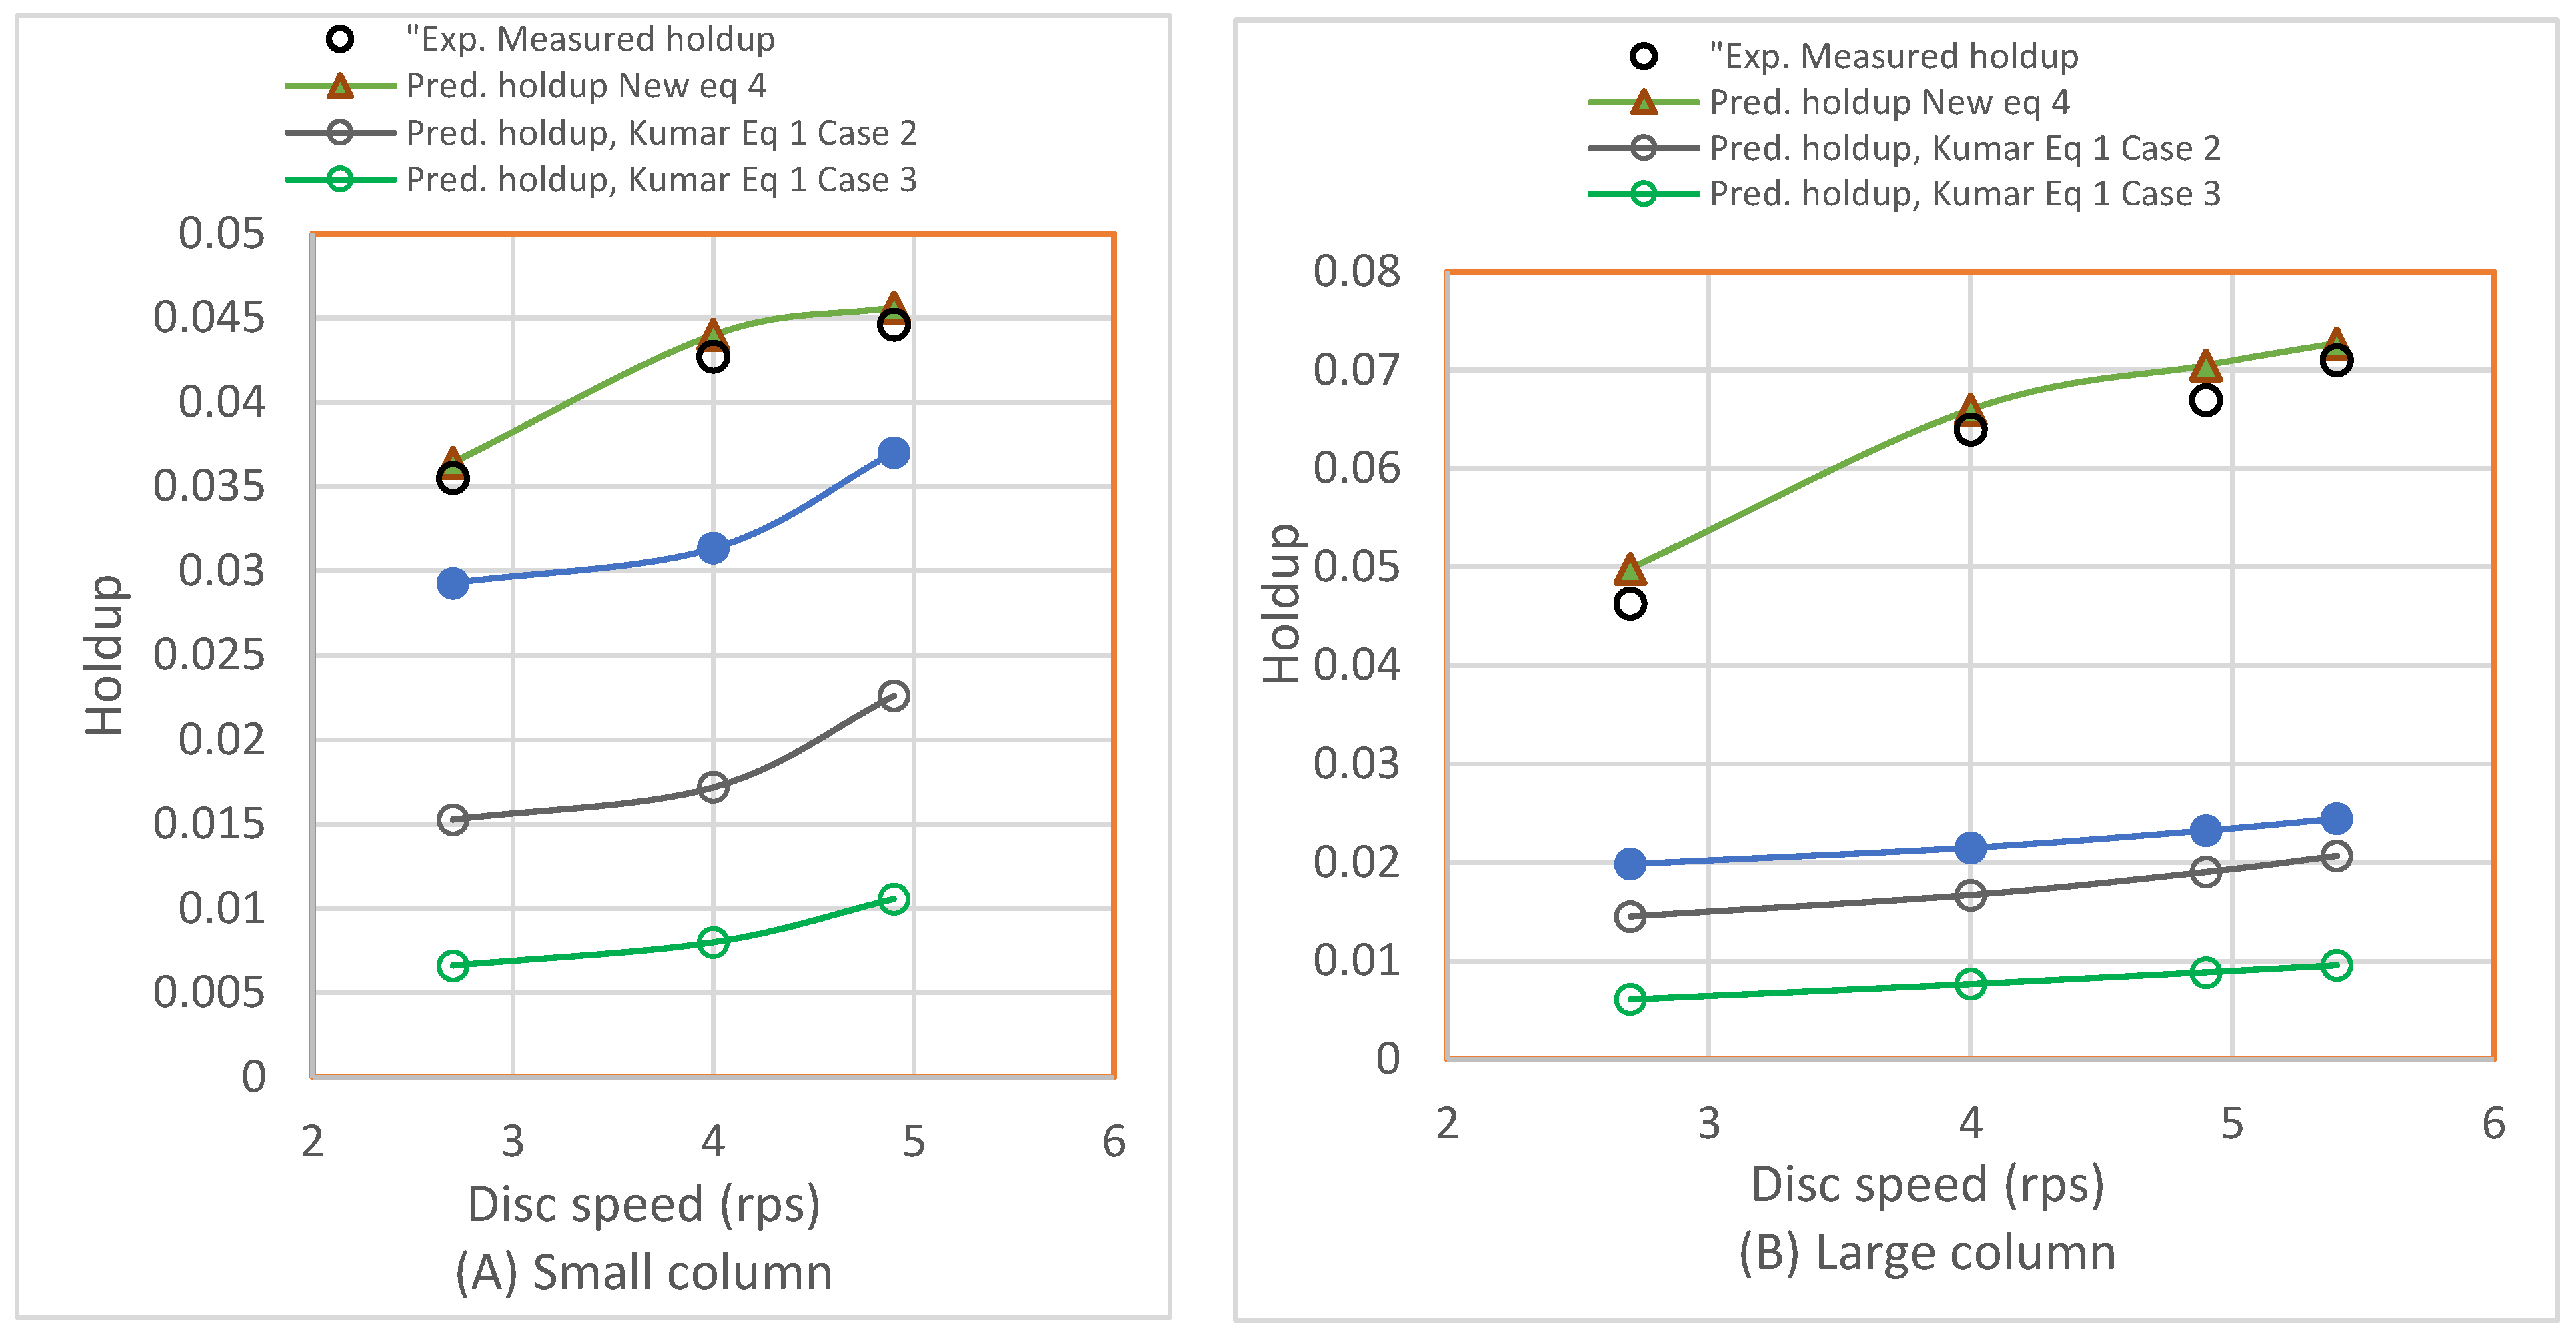
3.2.3. Effect of Column Diameter

To check the applicability and validity of the suggested correlations, experimental values obtained from the small (7.62 cm diameter) and large column (21.9 cm diameter) were compared with predicted holdup values obtained from the new correlation. The results are illustrated in Figure 6, where the data from both columns is in good agreement for all distributors as observed around the 45° line. However, a relatively marked deviation of +7.5% was observed for the data obtained from the small distributor (0.1 cm hole diameter) at a high flow rate.
With the large column, quite a good agreement was noted at low flow rates only, and the predicted values deviated from one another as the flow rate increased. The extent of the variation in the holdup was not expected to be identical for the same variation in the d32 values because the latter does not exactly represent the reality of drop size distributions inside the extractor.
As clarified above, the last term in the proposed model equation involved the scale up factor which is represented as the ratio of compartment height to the difference in column and rotating disc diameter. The applicability and validity of the two new model correlations to the scale-up parameter were tested using different size columns using different systems from different workers; the holdup data predicted from all columns were in good agreement with the experimental results with relatively marked deviation of +7.5% observed.

3.2.4. Effect of Chemical System

To check the capability of the physical characteristics term and the validity of the new correlation, two physical systems were used: BSW (butanol–succinic acid–water) and high interfacial tension TAW (toluene–acetone–water). Figure 7 shows the comparison between the values predicted by the new correlation with the experimental data from the two systems. The figure shows a remarkable overlap of the predicted values with those experimentally measured in the two columns, four various distributors, and under several operating conditions.
A sample of some runs was selected to compare the effect of the system properties on the column’s dispersed phase holdup. The results are presented in Figure 8. As seen in Figure 8, higher dispersed phase holdup values were observed with the BSW system, which exhibited a lower interfacial tension than was obtained from the TWA system. This can be explained by the larger drops generated from the higher interfacial tension system (i.e., TWA) than what was produced by the lower interfacial tension system (i.e., BSW).
This variation in holdup is mainly attributed to the variation in the interfacial tension and distributor hole diameter. This is contrary to what was reported by Kumar and Hartland [11] who stated that the interfacial tension of the chemical system and the distributor hole size have an insignificant effect on the holdup.

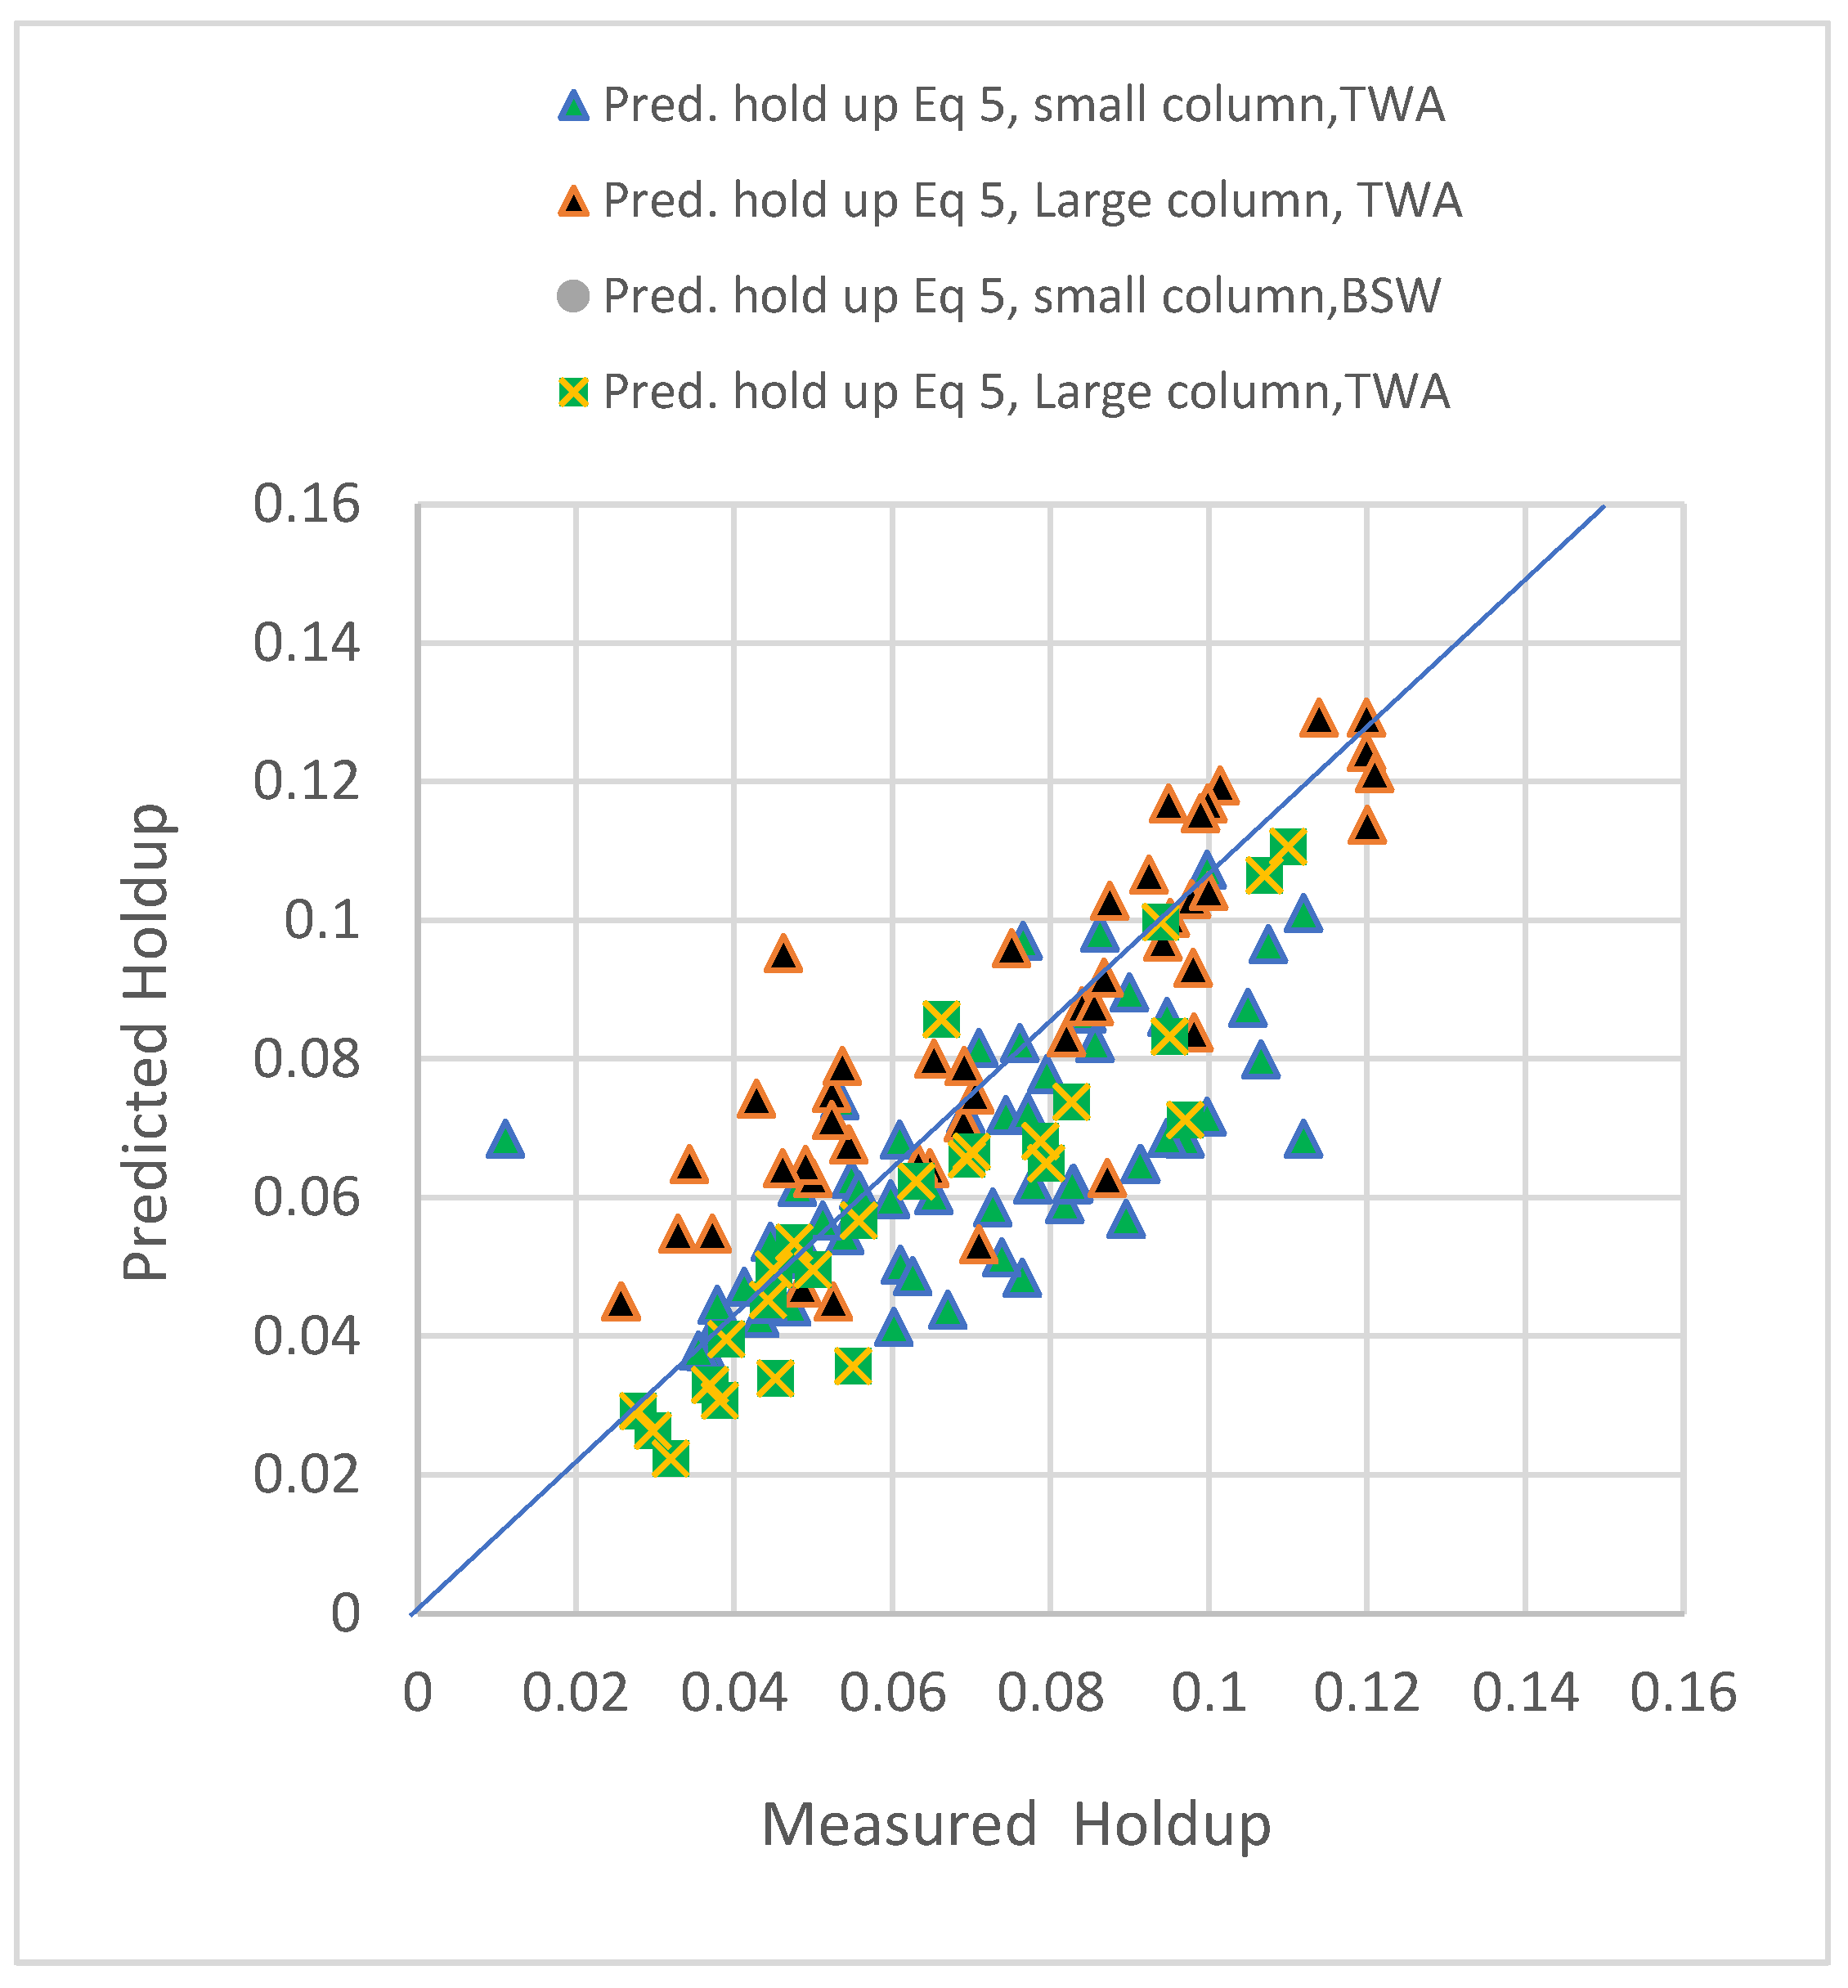
3.2.5. Validating the Holdup Correlation with the Reported Data

The new correlation was tested to reproduce the reported holdup data, using the data of Korchinsky and Bastani [20] and Korchinsky and Al-Husseini [21] selected for that purpose. Both works employed the same experimental technique and columns in collecting their experimental data. The first work used the low interfacial tension system (BSW) as well as the high interfacial tension system (TAW). Figure 9 illustrates that the results were highly consistent. Additionally, trends for all data from the two correlations reproduced the holdup data from the two columns and two chemical systems with less than 7% difference, except for a few odd points; this might have occurred because the second correlation does not include the internal column dimensions.

3.2.6. Effect of the Geometry Term

The effect of the geometry term on the holdup was tested using Equation (5). The same data from the large and small columns were used to test the Equation (5). However, as seen in Figure 10, some systematic deviation in the holdup was observed. The deviation was apparent with some experimental runs conducted at high flow rates. This reflects the need to include the geometry term in any design correlation.
For validating the new Equation (5), samples for some runs were drawn in a separate subplot, as seen in Figure 11. The trends measured and that predicted by Equation (5) were in good agreement.

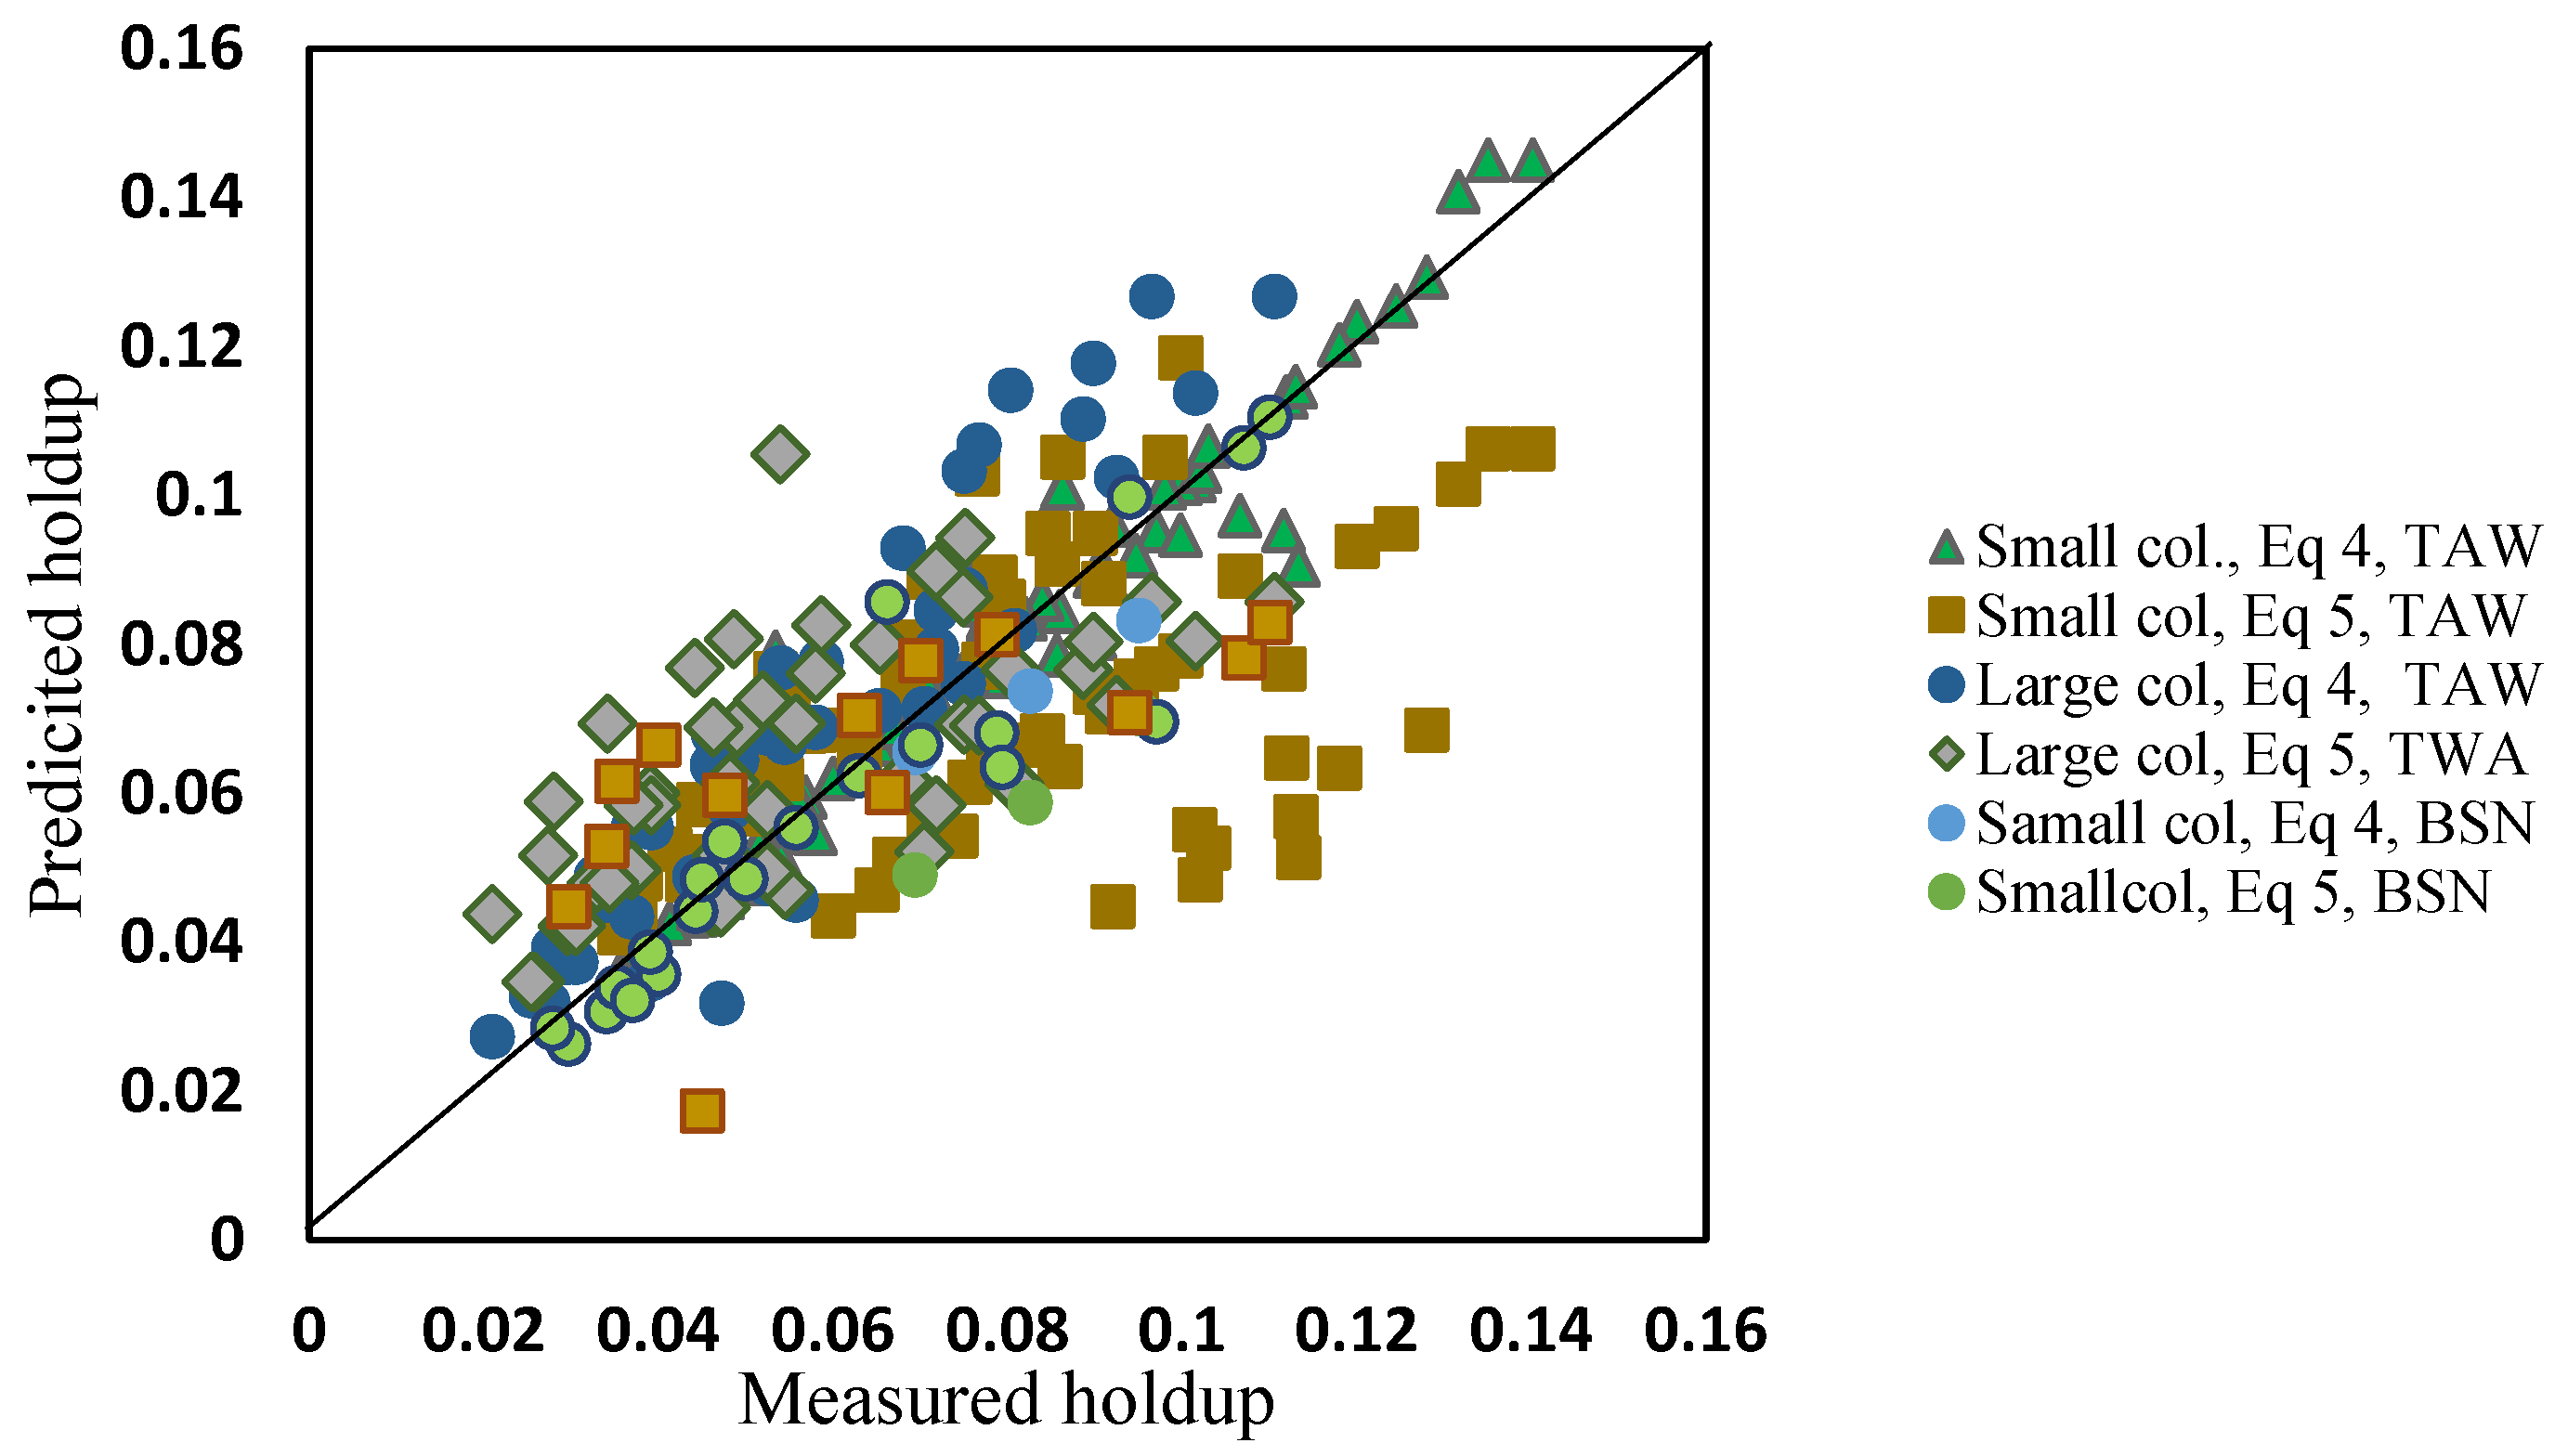
3.3. Comparing the Predictions of the New Correlation with Those Reported in the Literature

The proposed new correlations were then validated by comparing their results with those previously proposed by other researchers. The measured data and the data predicted using Equations (1)–(5) were compared, as shown in Figure 12, where data predicted by the Murakami and Hemmati equations (Equations (2) and (3)) were ignored as the values produced were over predicted, with more than 100% error in comparison to the measured values. The comparison produced a good agreement, and close trends were observed between the measured holdup and that calculated by the new correlation. Only Kumar’s equation (Equation (1) for case 4 shown in Table 1) gave a relatively reasonable agreement with the measured data. However, a large deviation was observed for the other three cases (i.e., no solute transfer; c to d transfer; and d to c transfer).
Using the new correlations, the MAPE between the measured and predicted holdup values was 5.2%. This compares to a MAPE of 25% for the Kumar general case correlation (Equation (1) with case 4 shown in Table 1). The MAPE for Kumar’s correlations of Equation (1) with c to d transfer (case 2) and Equation (1) with d to c transfer (case 3); were 54% and 92.4%, respectively. The maximum MAPE of 154% was attained by the case of no solute transfer for Kumar’s correlation (Equation (1) with no solute transfer (case 1) as shown in Table 1). Meanwhile, the Murakami and Hemmati correlations resulted in a MAPE of 120% and 198%, respectively.
For all data analyzed and used in this work, the new correlations (Equations (4) and (5)) reproduced the experimental results with a maximum standard deviation of ±1.7 and ±1.6, respectively.
In summary, most of the previous dispersed phase holdup correlations that had been applied to determine the RDC failed to represent the actual holdup in an RDC column. This is due to the fact that they were primarily based on the physical properties, characteristics, or the superficial velocity and did not include the inlet distributor geometry effect.

4. Conclusions

The DP holdup in a pilot plant rotating disc contactor (RDC) extraction column has been experimentally investigated, using 150 data, from two column sizes and two systems. The results indicated that the holdup was drastically affected by the dispersed phase inlet size distributor and geometry, flow rate, disc speed, and physical properties of the system. The analysis also showed that the effect of the disc speed was less pronounced than those of the distributor hole diameter and interfacial tension. Higher holdup was obtained with the low interfacial surface tension system (BSW) and with increased dispersed phase holdup, but this significantly weakened the effect of the continuous phase flow rate. Two newly accurate correlations were proposed to predict DP holdup, incorporating for the first time the distributor hole diameter in addition to the flow rate, disc speed, superficial velocities, column geometry, and system physical properties. The predictive correlations were successfully checked to reproduce the experimental data for different column sizes and for different systems. Both new correlations reproduced the experimental results with a maximum standard deviation of 1.7 and 1.6, respectively. Additionally, the average standard error for the first and second correlation was 5.2% and 9.4%, respectively. The first correlation can be used for design purposes, while the second can be used to collect data about existing columns. The comparison of the new correlation with currently reported correlations showed that the new correlations were more accurate in predicting the holdup.

Author Contributions

Conceptualization, A.M.I.A.-R.; methodology, Q.F.A., W.A.N. and A.A.A.; software, A.M.I.A.-R.; validation, Q.F.A., H.S.M. and I.K.S.; formal analysis, A.M.I.A.-R.; investigation, A.M.I.A.-R.; resources, A.M.I.A.-R.; data curation, A.M.I.A.-R.; writing—original draft preparation, A.M.I.A.-R.; writing—review and editing, A.M.I.A.-R.; Q.F.A. and F.S.M.; visualization, F.S.M.; supervision, Q.F.A.; project administration, A.M.I.A.-R. All authors have read and agreed to the published version of the manuscript.

Funding

This research received no external funding.

Institutional Review Board Statement

Not applicable.

Informed Consent Statement

Not applicable.

Data Availability Statement

Not applicable.

Conflicts of Interest

The authors declare no conflict of interest.

Nomenclature

Symbols Used
Ch[cm]Stage height, or compartment height
d32[mm]Average mean drop diameter
Dc[cm]Column diameter
D, DR[cm]Rotating disc diameter
Ds[cm]stator opening diameter
hd[cm]Dispersed phase distributor hole diameter
N[s−1]Disc speed (revolution per second)
Qd[cm3 s−1]Dispersed phase flow rate
Qc[cm3 s−1]Continuous phase flow rate
Vd[cm/s]dispersed phase superficial velocity
Vc[cm/s]continuous phase superficial velocity
Greek Letters
ρ c [g cm−3]Continuous phase density
ρ d [g cm−3]Dispersed phase density
Δ ρ [g cm−3]Density difference ( ρ c ρ d )
μ c [g s cm−1]Continuous phase viscosity
μ d [g s cm−1]Dispersed phase viscosity
σ [g s−2]Interfacial surface tension
g[cm s−2]Gravitational acceleration

Appendix A

Table A1. Toluene was dispersed into water to prevent the adhesion of large or small drops dispersed in the aqueous phase. A sample of the data is provided in Appendix A.
Run NoDisc Speed
(rps)
Distributor Hole Diameter (cm)Continuous Phase Flow Rate
(cm3/s)
Dispersed Phase Flow Rate
(cm3/s)
Measured Holdup
14.8330.083.4594.30.0443
26.6660.083.4594.30.049
39.6660.083.4594.30.0548
44.8330.085.837.30.0704
56.6660.085.837.30.0896
69.6660.085.837.30.1116
74.8330.087.7879.680.1049
86.6660.087.7879.680.1184
95.90.083.874.30.0473
105.90.083.876.80.0693
115.90.083.878.10.0846
129.6660.083.557.30.09983
139.6660.084.9157.30.1066
149.6660.085.837.30.1116
159.6660.089.087.30.11336
165.90.13.874.370.0433
179.6660.13.874.370.054
1811.8330.13.874.370.0653
194.50.13.855.170.0443
205.90.13.855.170.047
218.40.13.855.170.0558
224.50.13.856.80.0598
235.90.13.856.80.0609
248.40.13.856.80.071
254.50.13.858.10.0744
265.90.13.858.10.0761
278.40.13.858.10.0863
289.6660.13.876.110.0795
2910.8330.13.876.110.0856
3011.8330.13.876.110.0947
318.8330.15.837.30.0829
329.6660.15.837.30.0914
3310.8330.15.837.30.0947
3411.8330.15.837.30.0998
359.6660.15.839.680.105
3610.1660.15.839.680.1245
378.8330.15.8311.10.1076
389.6660.15.8311.10.1201
398.40.13.855.170.0558
408.40.13.856.80.071
418.40.13.858.10.0863
429.6660.15.837.30.09137
439.6660.15.839.680.1049
449.6660.15.8311.10.1201
459.6660.123.557.30.0765
469.6660.124.9157.30.0772
479.6660.125.837.30.0778
484.8330.123.4594.30.0372
496.6660.123.4594.30.0413
509.6660.123.4594.30.0512
514.8330.125.837.30.0609
526.6660.125.837.30.069
539.6660.125.837.30.0778
5411.8330.125.837.30.112
554.8330.128.9311.10.0913
566.6660.128.9311.10.1066
579.6660.128.9311.10.1218
585.90.153.874.30.0364
595.90.153.876.80.048
605.90.153.878.10.0534
614.8330.153.4594.30.0355
626.6660.153.4594.30.0379
639.6660.153.4594.30.0446
644.8330.155.837.30.0602
656.6660.155.837.30.0626
669.6660.155.837.30.0727
674.8330.158.9311.10.0879
686.6660.158.9311.10.0896
699.6660.158.9311.10.0964

References

  1. Ayham, M.; Al-Rahawi, I.; Salam, K. Influence of inlet distributor and column diameter on hydrodynamic characteristics in RDC liquid extraction column. J. Res. Eng. Technol. 2016, 5, 359–371. [Google Scholar]
  2. Al-Aswad, K.K.; Mumford, C.J.; Jeffreys, G.V. The Application of Drop Size distribution and Discrete Drop Mass Transfer Distribution and Models to Assess the Performance of a Rotating Disc Contactor. AIChE J. 1985, 31, 1488–1497. [Google Scholar] [CrossRef]
  3. Kirou, V.I.; Tavlarides, L.L.; Bonnet, J.C.; Tsouris, C. Flooding, hold-up, and drop size measurment in multistage column extractor. AIChE J. 2004, 34, 283–292. [Google Scholar] [CrossRef]
  4. Slater, M.J. Liquid–Liquid extraction column design. Can. J. Chem. Eng. 1985, 63, 1004–1005. [Google Scholar] [CrossRef]
  5. Kalaichelvi, P.; Murugesan, T. Dispersed phase hold-up in rotary disc contactor. Bioprocess Biosyst. Eng. 1988, 18, 105–111. [Google Scholar] [CrossRef]
  6. Korchinsky, W.J.; Ismail, A.M. Mass Transfer Parameters in Rotating Disc Contactors: Influence of Column Diameter. J. Chem. Technol. Biotechnol. 1988, 43, 147–158. [Google Scholar] [CrossRef]
  7. Johnson, A.I.; Lavergne, E.A.L. Hold-up in liquid-liquid extraction columns. Can. J. Chem. Eng. 2010, 1, 37–41. [Google Scholar]
  8. Cruz-Pinto, J.J.C.; Korchinsky, W.J.; Al-Husseini, R. I.S.E.C.: Mass Transfer to Non-uniform Dispersions in Countercurrent Flow Liquid-Liquid Extraction Columns. In Proceedings of the ISEC 83, American Institute of Chemical Engineering, Denver, CO, USA, 4 May 1983. [Google Scholar]
  9. Kumar, A.; Hartland, S. Prediction of dispersed phase hold-up, in rotating disc extractors. Chem. Eng. Comm. 1987, 56, 87–106. [Google Scholar] [CrossRef]
  10. Kumar, A.; Hartland, S. Independent Prediction of slip velocity and dispersed phase hold-up, in liquid-liquid extraction columns. Can. J. Chem. Eng. 1989, 67, 17–25. [Google Scholar] [CrossRef]
  11. Kumar, A.; Hartland, S. A Unified Correlation for the Prediction of Dispersed-Phase Hold-Up in Liquid-Liquid Extraction Columns. Ind. Chem. Eng. Res. 1995, 34, 3925–3940. [Google Scholar] [CrossRef]
  12. Korchinisky, W.J. Liquid-Liquid Extraction column modeling: Is the forward mixing influence is necessary? Chem. Eng. Res. Des. 1992, 70, 333–345. [Google Scholar]
  13. Murakami, A.; Misonou, A.; Inoue, K. Dispersed Phase Hold-up in a Rotating Disc Extraction Column. Int. Chem. Eng. 1978, 18, 16–22. [Google Scholar]
  14. Hemmati, A.R.; Shirvani, M.; Torab-Mostaedi, M.; Ghaem, A. Hold-up and Flooding characteristics in a perforated rotating disc contactor (PRDC). RSC Adv. 2015, 5, 63025–63033. [Google Scholar] [CrossRef]
  15. Al-Rahawi, I.A.M. New predictive correlations for the drop size in RDC liquid–liquid extraction column. Chem. Eng. Technol. 2007, 30, 1–10. [Google Scholar]
  16. Sá, R.M.; Góis, L.M.N.; Cavalcanti, C.F. Dispersed phase hold-up in a liquid-liquid extraction column. Lat. Am. Appl. Res. 2010, 40, 373–376. [Google Scholar]
  17. Shahrokh, H. Meisam Torab-Mostaedi2 and Seyed Hamed Mousavi, Prediction of Dispersed Phase Hold-up in Scheibel Extraction Columns by a New Correlation. J. Chem. Pet. Eng. 2017, 51, 105–111. [Google Scholar]
  18. Leila, S.M.; Hassan, M.M.; Rezvan, T.; Jaber, S. Prediction of the mean drop diameter, dispersed phase hold-up and slip velocity in a horizontal pulsed sieve plate column for uranium stripping from Loaded Alamine 336 by ammonium carbonate. Prog. Nucl. Energy 2019, 117, 103082. [Google Scholar]
  19. Khanramaki, F.; Safdari, J.; Shirani, A.S.; Torkaman, R. Experimental study on hold-up, characteristic and slip velocities in a horizontal pulsed sieve-plate column and uranium reactive extraction condition in aqueous phase. Prog. Nucl. Energy 2018, 109, 159–170. [Google Scholar] [CrossRef]
  20. Walter, J.K.; Daryoush, B. Application of ‘Forward Mixing’ Model to the Low Interfacial Tension System n-Butanol-Succinic Acid-Water in Rotating Disc-Contactor Liquid Extraction Columns. J. Chem. Technol. Biotechnol. 1993, 58, 113–122. [Google Scholar]
  21. Korchinsky, W.J.; Al-Husseini, R. Liquid-liquid extraction column (rotating disc contactor)-model parameters from drop size distribution and solute concentration measurements. J. Chem. Technol. Biotechnol. 1986, 36, 395–409. [Google Scholar] [CrossRef]
  22. Rinco-Rubio, L.M.; Kumar, A.; Hartland, S. Continuous phase axial dispersion in Wirz extraction column. Chem. Eng. Res. Des. 1995, 73, 33–39. [Google Scholar]
Figure 1. Schematic diagram of the rotating disc contactor (RDC) layout.
Chemengineering 05 00079 g001
Figure 2. Measured and predicted holdup influence of distributor hole diameter. Measured holdup (symbols) and predicted holdup (lines).
Chemengineering 05 00079 g002
Figure 3. Dispersed phase holdup versus total flow rate, for the values experimentally measured and the theoretically predicted, for all distributors.
Chemengineering 05 00079 g003
Figure 4. Dispersed phase holdup, effect of continuous phase flowrate at a disc speed of 9.666 rps. Measured holdup (symbols) and predicted holdup (lines).
Chemengineering 05 00079 g004
Figure 5. Dispersed phase holdup versus disc speed for the experimentally and theoretically predicted values. Low total flowrate (solid lines), medium total flowrate (long dash lines), high total flowrate (dotted lines).
Chemengineering 05 00079 g005
Figure 6. Comparison of the experimentally measured and predicted dispersed phase holdup values (using Equation ((4)), from the small and large column, for all four distributors, using the TAW (toluene–acetone–water) and BSW (butanol–succinic acid–water) system.
Chemengineering 05 00079 g006
Figure 7. Dispersed phase holdup experimentally measured and predicted in small (7.62 cm) and large (21.9 cm) RDC, effect of TAW and BSA systems’ physical properties, (distributors I–IV).
Chemengineering 05 00079 g007
Figure 8. Dispersed phase holdup experimentally measured in small (7.62 cm) and large (21.9 cm) RDC, using the BSW system (distributors I–IV).
Chemengineering 05 00079 g008
Figure 9. Comparison of the predicted holdup from the two correlations (4 and 5) with the measured values of (Korchinsky and Bastani 1993) [20]; and (Korchinsky and Al-Husseini 1986) [21].
Chemengineering 05 00079 g009
Figure 10. Comparison of the measured and predicted dispersed phase holdup values (from Equation (5)) obtained from the small and large columns, for all four distributors and two systems.
Chemengineering 05 00079 g010
Figure 11. The measured and predicted dispersed phase holdup values (from Equation (5)) obtained from the small and large columns, for different distributors and operating conditions.
Chemengineering 05 00079 g011
Figure 12. Measured and predicted holdup data for the new and the reported correlations (dots represent the measured holdup). (A) For the small column (flowrate = 7.759 cm3/s, distributor = 0.15 cm) and (B) the large column (flowrate = 80.3 cm3/s, distributor = 0.12 cm).
Chemengineering 05 00079 g012
Table 1. Values of dispersed phase (DP) holdup of Kumar and Hartland correlation under various mass transfer methods.
Mass Transfer Directionk1k2n1n2n3n4
(case 1) No solute transfer570.53747.781.28−0.45−0.580.85
(case 2) c→d transfer6.414.081.28−0.16−0.680.29
(case 3) d→c transfer19.6860.000.68−0.17−0.780.64
(case 4) General for above three cases65.7374.21.24−0.34−0.490.53
Table 2. Comparison between the operating conditions of the present study and various studies found in the literature.
Continuous Phase Flow (cm3/s)Dispersed Phase Flow
(cm3/s)
Disc Speed
(r.p.s)
Ref.
3.45–9.454.15–10.593.5–11.86[1]
19.5–52.323.456–95.72.9–6.8[8]
11.6–2315.8–126.73–32[9]
32–4525.9–43.273.67–13.33[13]
38.29–95.8272.07–92.545–7[14]
2.57–57.23.38–80.01.3–9.7[20]
20.2–48.226.7–90.04.0–6.3[21]
2.76–9.084.3–11.14.8–11.83This work
Table 3. Details of dispersed phase distributors.
Distributor No.ABCD
Average hole diameter Dh (mm)0.801.001.221.50
Holes number191285
Hole Area (mm2)0.5030.7861.171.77
Total holes area (mm2)9.559.439.368.84
Publisher’s Note: MDPI stays neutral with regard to jurisdictional claims in published maps and institutional affiliations.

