Article

Group Contribution Revisited: The Enthalpy of Formation of Organic Compounds with “Chemical Accuracy”

Pro-Deo Consultant, 52525 Heinsberg, North-Rhine Westphalia, Germany
ChemEngineering 2021, 5(2), 24; https://doi.org/10.3390/chemengineering5020024
Submission received: 19 February 2021 / Revised: 15 April 2021 / Accepted: 28 April 2021 / Published: 11 May 2021

Abstract

:
Group contribution (GC) methods to predict thermochemical properties are of eminent importance to process design. Compared to previous works, we present an improved group contribution parametrization for the heat of formation of organic molecules exhibiting chemical accuracy, i.e., a maximum 1 kcal/mol (4.2 kJ/mol) difference between the experiment and model, while, at the same time, minimizing the number of parameters. The latter is extremely important as too many parameters lead to overfitting and, therewith, to more or less serious incorrect predictions for molecules that were not within the data set used for parametrization. Moreover, it was found to be important to explicitly account for common chemical knowledge, e.g., geminal effects or ring strain. The group-related parameters were determined step-wise: first, alkanes only, and then only one additional group in the next class of molecules. This ensures unique and optimal parameter values for each chemical group. All data will be made available, enabling other researchers to extend the set to other classes of molecules.

1. Introduction

To understand chemical reactivity and/or chemical equilibria, knowledge of thermodynamic properties such as gas-phase standard enthalpy of formation ∆fHogas is a necessity. Moreover, it is highly relevant to technological process design. Experimental measurement of ∆fHogas is one of the ways of collecting reliable and accurate data. However, the limitations and challenges, including the determination of ∆fHogas of unstable species, the required purity of samples, time and the cost of experiments faced by experimentalists, are well known. Furthermore, the very large gap between the large number of compounds registered in Chemical Abstracts (more than 100 million) and the available experimental values of ∆fHogas of compounds is continuously increasing, and with more than 1 billion possible organic molecules containing 13 non-hydrogen atoms, the most convenient and practical approach has been to employ property prediction models for the estimation of ∆fHogas.
To evaluate the enthalpy of formation of molecules, which we will mostly refer to as ΔHf throughout this paper, from their molecular structure, two important classes of property models have been widely employed: ab initio quantum mechanics-based property models and GC-based property models [1] and references therein. More recently, artificial intelligence-based models such as neural networks have been explored [2] and references therein. The “holy grail” in the field of computational thermochemistry is to arrive at chemical accuracy, which is generally stated as 1 kcal mol−1 or about 4 kJ mol−1. In a 2010 review paper in which both ab initio methods and GC methods were reviewed, Van Speybroeck et al. [1] noted that “for the majority of chemical species we are still quite a bit away from what is often referred to as chemical accuracy, i.e., 1 kcal mol−1” (for further background, see also the references in [1]). Recently (2019), Curtiss and co-workers [3] claimed that for a set of 459 from the GDB-9 database, “the G4MP2 enthalpies of formation have an accuracy (mean absolute deviations) of 0.79 kcal mol−1”, i.e., 3.3 kJ/mol. However, in 2013, Hukkerikar et al. [4] reported that for a data set containing 861 experimentally measured values comprising a wider variety of organic compounds (hydrocarbons, oxygenated compounds, nitrogenated compounds, multifunctional compounds, etc.), a “developed GC model for the gas-phase ΔHf provides significant improvement in accuracy with an average absolute error of 1.75 kJ/mol and standard deviation of 2.61 kJ/mol”, thus significantly better than the Curtiss result.
Regarding predictive methods for the heat of formation of organic molecules, the work described in the literature referred to above, including the references therein, is the status quo regarding achieving chemical accuracy, i.e., 1 kcal/mol. However, although both ab initio and GC methods [3,4] seem to be near the goal of chemical accuracy, each of the current implementations has at least one serious drawback with consequences for the predictive reliability for molecules other than those taken into account in [3,4]. The reliability of predictions with a pre-set required accuracy is the key performance indicator for an appropriate method in the context of the application purpose indicated in the first part of this Introduction. For the ab initio work [3], all Gn methods are composite methods comprising a number of computed energy values and a specific choice of the basis set for these components in order to arrive at the best result for a pre-selected set of usually small test molecules, making these methods, in essence, semi-empirical rather than pure ab initio with no guarantee of reliable prediction for molecules larger than very small molecules. Moreover, the error in the computed energies as evaluated by ab initio quantum methods depends on the accuracy of the total energy per atom, and with the total energy of a molecule proportional to the number of atoms (roughly speaking) (see Figure 4 in [1]), the error in the computed heat of formation steadily increases with the size of the molecule and therefore is (far) beyond chemical accuracy.
As it is far from trivial to consider an improved approach based on ab initio quantum mechanics calculations, we decided to focus on the group contribution method. The reason why we want to reevaluate the group contribution implementation is that previous works either did not achieve chemical accuracy (all older works) for a large range of organic molecules with different functional groups or claimed chemical accuracy [4] but the number of parameters was large and overfitting, leading to, in part, incorrect predictions with a totally unknown magnitude of deviations for molecules not part of the parametrization procedure. Thus, the novelty of this work, assuming we will be successful, will be a GC approach with chemical accuracy and avoidance of too many parameters (e.g., in [4]) to ensure good predictability. Actually, in the present work, we will only adopt the absolute minimum number of parameters required to establish chemical accuracy. If this cannot be achieved, the conclusion must be that the GC approach is not the correct way forward, as either chemical accuracy or reliable predictability is not within reach.

2. Key Aspects to Consider When Parametrizing a GC Model Aiming at Accurate ΔHf Predictions: Methodology and Methods Applied

2.1. The Group Contribution Method

In recent decades, the GC methodology has been developed by various groups of authors and deals with a variety of molecular properties. GC methods include those devised by Joback and Reid [5], Benson and co-workers [6,7], Domalski and Hearing [8], Constantino and Gani [9], Marrero and Gani [10], Rarey et al. [11,12], Hukkerikar et al. [4] and Kadda et al. [13]. One of these properties is gas-phase ΔHf organic molecules. In GC methods, the property of a pure compound is determined as the sum of individual contributions associated with the groups present in the molecule, see Figure 1, i.e., the GC method is an additive method. These contributions are parameters whose values are determined by comparing to a selected set of experimental data. The GC method is attractive when we consider a property such as the heat of formation of organic molecules, as chemists have known for a long time about the additivity of certain properties when analyzing the composition of the molecular structure. This applies definitively to homologous series which are series of compounds with the same general formula, where each member differs from the successive member by one –CH2- group. Members of the same homologous series show a trend in their physical properties. As more recent implementations of the GC method perform better than current ab initio methods [1,3,4], this paper is dedicated to a more detailed analysis of the performance of the GC method for the evaluation of the heat of formation of organic molecules.
In this paper, we will particularly compare the approach we will present to the Marrero–Gani model [10] with the parametrization reported by Hukkerikar et al. [4], as the latter approach has, thus far, shown the best results for ΔHf. The Marrero and Gani GC method employs the formula [10]
Δ f H gas o - H fo = i N i C i + j M j D j + k E k O k
with the variable Hfo an additional adjustable parameter of the property model. Ci is the contribution of the first-order group of type-i that occurs Ni times. First-order groups are the common molecular subgroups, viz., Figure 1, in which molecules are subdivided in a GC approach. To account for interactions between groups, e.g., more complex interactions in heterocyclic species, second-order and third-order groups have been previously introduced [10]. Dj is the contribution of the second-order group of type-j that occurs Mj times. Ek is the contribution of the third-order group of type-k that has Ok occurrences in the molecular structure of the pure compound. A detailed description can be found in [10].
It is important to note that the first-order groups, i.e., the groups in which the molecule is initially subdivided, can be defined in various ways. In the Marrero–Gani method [10], benzene has individual aromatic carbon atoms named aC as a group, and in 2-hexanon, one of the first-order groups is CH3C=O. Similarly, for a terminal cyanide (R-CH2-CN), one of the first-order groups reads CH2CN. Older GC methods, however, have followed a definition of first-order groups which is more in line with how chemists define the different entities that constitute a molecule. This applies, e.g., to van Krevelen and Chermin [14] and Joback and Reid [4]. These methods divide a molecule into, e.g., CH3, C=O, CN or a phenyl ring. Now, 2-hexanon comprises the groups CH3, CH2 and C=O.
As mentioned before, in the present work, we will explore whether we can develop the GC method with these more chemically intuitive first-order groups up to the level of an accurate predictive tool, i.e., chemical accuracy, 1 kal/mol, whilst avoiding overfitting due to too many adjustable parameters. We will build on the experience obtained from the work in [4] which was co-authored by the present author.

2.2. The Reliability of the Experimental Data Employed to Establish the GC Parameters

An accurate and reliable experimental data set is key to the reliable estimation of GC model parameters. When the experimental value available from the literature deviates from the true value, this can have a serious impact on the correct prediction for other species, particularly when a high accuracy such as “1 kcal/mol” is required. Hukkerikar et al. used experimental values of ∆fHogas taken from the extended CAPEC database [15]. Unfortunately, like for many other such databases, the list with concrete data (numerical values) is not publicly available. In the present work, we therefore prefer to adopt other data, i.e., data taken from the NIST database which are freely available (https://webbook.nist.gov/ (accessed on 7 April 2021)) and original papers that are quoted in the database. Experimental data show, however, a variation in experimental values which may go beyond the 1 kcal/mol accuracy we want to achieve. The NIST database, for instance, reveals for 1-decanol what is collected in Table 1 and there are many similar examples to be found. For many literature reported values, one observes such, one could say typical, variations, errors if you like, sometimes claimed to be small, and sometimes indicated as larger. Moreover, frequently, different methods were used to analyze and evaluate experimental heats of formation. Thus, we should take it for a fact that some experimental data have an error range of the magnitude or larger than the accuracy we set out as the requirement, namely, 1 kcal/mol. For these reasons, we preferably adopted data from the papers from Frederick D. Rossini and co-workers (we will quote the relevant papers later on), which are all from a single source analyzed by the same group of persons using the same equipment and, as we will see later, which have the more consistent CH2 group increments. Experimental data employed refer to 298.15K and the gas phase.
As history and experience in the chemical discipline has taught us about the additivity of certain properties, that knowledge can be used to find experimental values that must simply be incorrect. Let us present a clear-cut example from the series of n-alkyl alcohols (primary alcohols). When we look at the experimental data (Table S1 in the Supplementary Material), we see that the increment per CH2 group varies roughly between 17 and 24 kJ/mol, whereas the increment should equal the group contribution for the CH2 entity. In addition, the variation in the CAPEC database [15] is rather different from the variation within the values obtained from the NIST database as can be corroborated from Table S1. In both data sets, the variations have a magnitude similar to the predictive accuracy, 4 kJ/mol, we want to achieve. Similar observations and conclusions can be made for the n-alkanes, the n-alkenes and various other series. In summary, as chemical knowledge teaches us that it goes without saying that the deviations in these just mentioned cases must be attributed to experimental errors, consequently, in some cases, predictions should be considered more reliable than the experimental values, and the true series averaged deviation between model and experimental values is smaller than that calculated on the basis of the available experimental values.
Another feature that may occur is an experimental value for a single specific molecule which, for one reason or another, completely falls off track even though all similar molecules are well described by the devised model. When the procedure to fit a model is automated, such discrepancies are unlikely to be detected, e.g., higher-order contributions might be proposed, whereas it is much more likely that there is a problem with the reliability of the experimental value. We will see such a case later on in this paper, i.e., malononitrile and succinonitrile.

2.3. The Number of GC Parameters and the Choice for the Type of Groups

As not all heats of formation can be described as simple additions of contributions of basic groups such as CH3-, -CH2- and -C=C-, Gani et al. [10], for example, introduced second- and higher-order contributions to account for the otherwise too large deviations between model and experimental values, which have led to the best results reported up till now [4]. However, in practice, we see that, as an example, in the case of Tb (boiling point) estimation, 167 first-order, 106 second-order and 51 third-order (in total 324) contributions were involved (see Rarey et al. [16], for these data). With an absolute average deviation of 5.89 K for a set of 1794 components, approximately 5.5 data points were used per adjustable parameter. It goes without saying that with such a typical number of parameters compared to the number of data points, one cannot be really surprised about a good fit. For the ΔHf [4,13,17], we also observe very many higher-order parameters. The objective of fitting parameters in a specific model should obviously be to avoid any kind of what is known as overfitting because this seriously deteriorates the quality of the predictive behavior of the method. Therefore, we aim to establish a model with the minimum number of parameters ultimately required whilst, at the same time, achieving chemical accuracy.
As previously mentioned, in the present work, we will adopt the “group” definition in the sense of van Krevelen and Chermin [14]. This approach is different from the one in other works [4,10,13]. Still, the fact that not all properties can be accounted for quantitatively, sufficiently and accurately using the additivity of these group contributions must be accounted for. Therefore, we will use the concepts of the nearest neighbor group, in essence, group–group interactions, and if needed, the next nearest neighbor group. The terminologies nearest neighbor and next nearest neighbor are very common in the fields of chemistry and physics, e.g., NMR [18] and XPS (ESCA) [19], and in the field of magnetism in the physics domain. Thus, this is what chemists and physicists have successfully applied for decades to account for interactions between neighboring entities, in the present case, chemical groups. Rarey et al. also adopted this approach whilst modeling the boiling point Tb using group contributions [16]. We will demonstrate that this will enable us to obtain a method which uses the minimum number of parameters.

2.4. Methodology Applied to Obtain Group Contribution Parameter Values

Rather than optimizing many parameters for a larger set of different compounds at the same time, we take the approach to determine each individual chemical group contribution step-wise. This guarantees a unique and proper determination of the individual parameters whilst avoiding cross-contamination, i.e., contributions hidden in another parameter. As it is chemical knowledge that, for the alkanes and alkyl chains, the contribution due to the CH2 and CH3 groups is truly additive, we should start by fixing the group contribution values for these two groups by considering alkanes only. Next, adding another group to the alkane, e.g., a double (C=C) or triple bond (C≡C), an amine or a carboxylic group, we can also determine the group contribution of each of those groups. When there is no non-additive interaction with the alkyl chain, each of these substituents will have a single unique GC parameter. Reasons for non-additive contributions include electron donating or withdrawing groups, e.g., conjugation, steric hindrance or, as we will see later, a geminal substituent effect.
After careful consideration, we decided to determine the numerical values of the group contributions by hand. This is, of course, not common anymore today, as such an operation is commonly conducted by invoking computer-based optimization routines. However, while we want an average absolute difference between experimental and model values below 1 kcal/mol, i.e., chemical accuracy, at the same time, we want no, or only incidental, individual values above 1 kcal/mol. In incidental cases, a single value not reaching chemical accuracy might occur and needs to be accepted to keep the overall performance for a certain class of molecular entities acceptable with respect to chemical accuracy. Moreover, it might be needed to take into account a larger error arising from specific experimental data. Such decisions are made more adequately by the eye than by automated mathematical routines. The rationale is that we aim for an approach aiming at a reliable predictive method to obtain heats of formation with chemical accuracy and not a priori the best overall mathematical fit as pure mathematics does not know about physics and chemistry. As we gradually build up the approach class by class and thus group parameter by group parameter, this is an appropriate approach and, most importantly, we will see this leads to the desired results.
In specific cases, which we will encounter, we will use ab initio and density functional-type quantum chemical calculations to verify energy differences between similar species in order to verify whether deviations we see are genuine. While it is far from straightforward to evaluate the heat of formation by ab initio or DFT calculations [1], relative energy differences between structurally very similar structures can be evaluated with greater confidence. These calculations were performed using the Spartan 10 program suite [20], involving full geometry optimization within the Hartree–Fock (HF) method and with density functional theory (DFT) invoking the B3LYP functional, both involving the 6–311 + G** basis set.
Heats of formation and group contributions from the Marrero–Gani method [10], as optimized in the first paper claiming chemical accuracy [4], were obtained using the ICAS23 software version [17], which we will refer to as MG ICAS23.
The performance of the parameter estimation will be verified by calculating the differences between model and experimental values, and, in addition, by calculating the averaged absolute differences (ADD) per class of molecules expressed by AAD = (1/N) ∑j = 1,N (model–experiment).

2.5. Limitations of the Group Contribution Method

One might consider attempting to construct a group contribution method to cover any type of molecule. The GC methodology assumes additivity, and even when higher-order contributions such as the second- or third-order parameters in the Marrero–Gani method are introduced, it still remains a linear additive method. It is to be realized that in, e.g., substituted conjugated molecules, one can have any magnitude of shift in the electron density, particularly the π-electron density, and additivity based on a limited number of groups is by no means to be expected throughout. One should therefore accept that at a certain stage, the GC approach will cease to be applicable. Therefore, it is the opinion of the author that one should clearly state which systems can be treated reliably with the method, with a pre-defined quality of results, and that other systems may not be qualified to be treated appropriately.

3. Results

As explained before, in order to arrive at a consistent data set, we first need to parametrize the more simple classes of molecules such as the n-alkanes and the n-alcohols, even though these have been treated elsewhere before. Following the approach outlined in the above, one new group is parametrized in each successive step.

3.1. n-Alkanes and Monomethyl Alkanes

For the n-alkanes, we collected data from the NIST database, from the CAPEC database as used in [15] and from Rossini and co-workers [21]. All individual data can be found in the Supplementary Materials as Table S2. The CH3 GC parameter was simply taken as 50% of the heat of formation of ethane from the Rossini paper, i.e., −42.36 kJ/mol. There is a little variation in the experimental values for ethane with the CAPEC and NIST values but well below 1 kJ/mol, so for any practical use, this makes no difference. When we adopted the CH2 increment from the Rossini data set, −20.63 kJ/mol, we obtained an excellent result for the entire alkane data set with the model equation
ΔHf (n-alkanes) = 2 * GCCH3 + NCH2 * GCCH2
Equation (2), as with all other equations that will follow for other classes of molecules, is essentially of the general form of Equation (1), but now only the first-order term ∑I NiCi has been retained. Ci is the contribution of the group i, e.g., CH3, to the heat of formation, and Ni is the number of times this group is present in the molecule. The average absolute difference between the model Equation (2) and experiment (Rossini values and CAPEC values when not available from Rossini) was found to be 0.53 kJ/mol. We emphasize that this value could have been lower as the experimental data set probably suffers from some errors, albeit small ones. The deviations become clearly larger as soon as there are no available data from the Rossini group, which is from heneicosane onwards. The variation in the values for the CH2 increments is very small for the Rossini data, but non-negligible for the other data set. For the higher alkanes starting with heneicosane, for which we have only CAPEC data, the increments vary between 19.3 and 21.44 kJ/mol. When we calculate the average absolute difference between the experiment and model for the Rossini data (ethane up till eicosane), we only find a value of 0.19 kJ/mol. In conclusion, we may state that the model works excellently, as is also known from other works.
For the mono-methylalkanes, we needed to introduce one new group, namely, the CH group, for which we found the value −4 kJ/mol the best overall solution. Group contribution values for CH3 and CH2 were previously determined in Section 3.1. With the model equation
ΔHf (monomethyl-alkanes) = 3 * GCCH3 + NCH2 * GCCH2 + GCCH
we obtained an average absolute difference between the model and experiment of 1.91 kJ/mol, and all individual values, except for (2-methylnonane), are within chemical accuracy (1 kcal/mol or 4.2 kJ/mol). Here, we again used Rossini’s data wherever available [21] and otherwise NIST, and if both were not available, we used CAPEC data. All individual data can be found in Table S3 in the Supplementary Material. The value for the group CH was chosen as −4 kJ/mol because that value showed the best agreement between model and experimental values with the exception of 2-methylnonane which deviated by 5.34 kJ/mol from the experiment. A more negative value for the CH group would have led to a better overall (averaged) agreement with the experiment; however, in that case, other values would have been beyond chemical accuracy, more specifically, 4-methylheptane. Our choice was based on the observation that the CH2 increment associated with 2-methylnonane (−22.35 kJ/mol) is an indicator for an error in the experimental value (−260.2 kJ/mol). Finally, later on, we experienced that our choice for the CH group parameter also positively influenced the results for other classes, e.g., “2-Alkenes + substituent at double bond” and “1-Alkenes + substituent NOT at double bond”, avoiding results that would otherwise be beyond chemical accuracy.

3.2. Oxygen-Containing Series: n-Alcohols, n-Aldehydes, 2-Alkanones, Mono- and Dicarboxylic Acids, Ethers

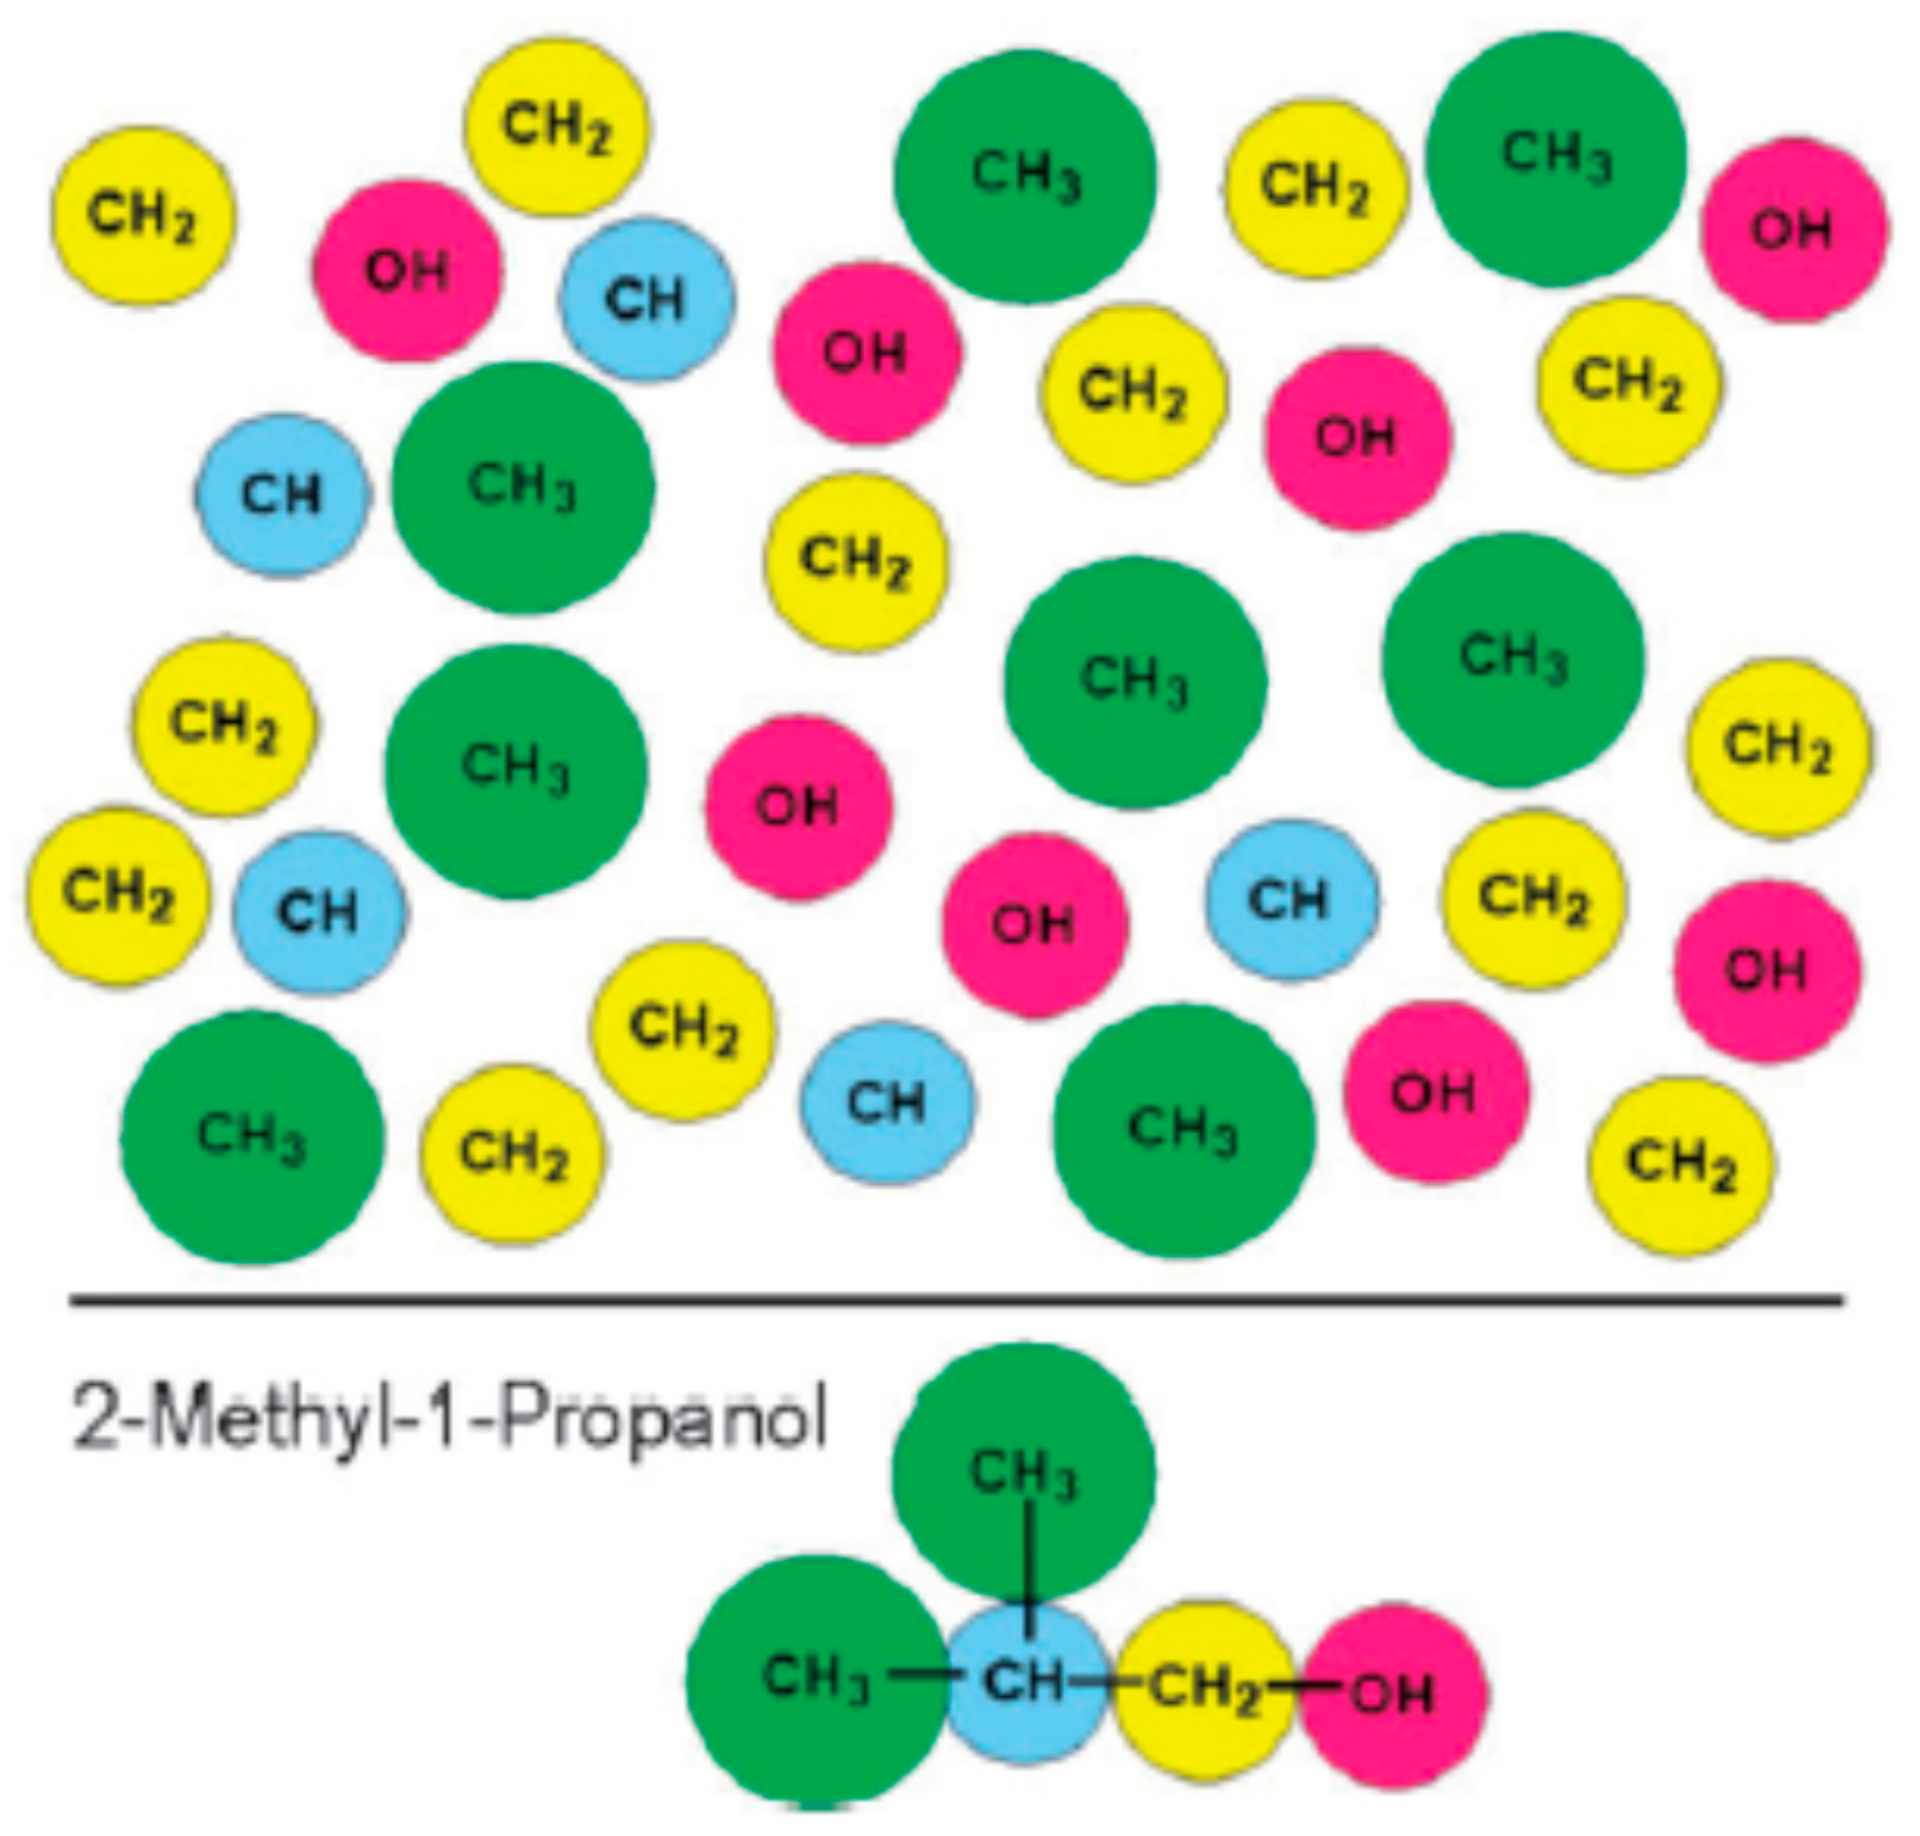
For the new OH group to be introduced, we found a group contribution value of −171 kJ/mol to be the appropriate value for a good model, leading to the best results for the model based on the formula
ΔHf (primary or n-alcohols) = GCCH3 + NCH2 * GCCH2 + GCOH
to evaluate the heats of formation for the n-alcohols and
ΔHf (secondary alcohols) = 2*GCCH3 + NCH2 * GCCH2 + GCOH
for the secondary alcohols. The averaged absolute difference between the model and experiment was evaluated as 1.54 kJ/mol. All individual data can be found in Table S4 in the Supplementary Material. The overall good performance including that for the higher members of the groups 1-tetradecanol and 1-eicosanol suggest that the model values are more accurate than the experimental values.
When adopting a new group contribution value of −124 kJ/mol for the aldehyde group (terminal C=O), the average absolute difference (model–exp) using CAPEC database experimental data was found to be only 0.31 kJ/mol, our model being
ΔHf (n-aldehydes) = GCCH3 + NCH2 * GCCH2 + GCC=O aldehyde
Experimental and model data are collected in Table S5 in the Supplementary Material.
When we adopt the simplest formula possible for the alkanones,
ΔHf (n-alkanones) = GCCH3 + NCH2 * GCCH2 + GCC=O keto
we find a very good account of the heat of formation based on the pure additive contribution using a group contribution parameter of −133 kJ/mol for the keto group, and an averaged absolute difference (model–exp) of 1.10 kJ/mol, whereas all individual deviations are below 2 kJ/mol. Data are collected in Table S6 in the Supplementary Material.
With the formula
ΔHf (carboxylic acids) = GCCH3 + NCH2 * GCCH2 + GCCOOH
the group contribution parameter for the carboxylic group was determined as −391 kJ/mol, leading to an averaged absolute difference (model–exp) of 1.12 kJ/mol. All individual data are collected in Table S7 in the Supplementary Material. Regarding individual values, the values for pentanoic acid and hexanoic acid show deviations of 4.25 and 3.88 kJ/mol, respectively. Whilst still basically within chemical accuracy, we observe that (i) the increments in the NIST data set are irregular (see Table S7 in the Supplementary Material) and (ii) when we take the corresponding values from the CAPEC database, the values for (model–exp) go down to 1.25 and 0.78 kJ/mol, respectively. In this case, we thus may conclude there is an issue with some experimental data, whereas otherwise, the model shows very satisfactory performance.
For dicarboxylic acids, we found that we can describe the heats of formation well by
ΔHf (dicarboxylic acids) = NCH2 * GCCH2 + 2 * GCCOOH
with an average absolute difference (exp–model) of 0.89 kJ/mol. All data are shown in Table S7 in the Supplementary Material. These results suggest there is definitely no need for higher-order contributions as suggested in the work of [4]. For MG ICAS23 [4,17], we found that for propanedioic acid, a secondary group had been introduced (HOOC-CHn-COOH (n in 1..2)); for butanoic acid, yet another second-order group had been introduced (HOOC-CHn-CHm-COOH (n, m in 1..2)); and for pentadioic and hexadioic acids, a third-order group was introduced (HOOC-(CHn)m-COOH (m > 2, n in 0..2)), adding up to four additional parameters to be fitted, whereas our current approach has none.
For the methylalkylethers, the group value for the (H3)COC(-) group was determined as −175 kJ/mol. The averaged absolute difference (model–exp) of 2.42 kJ/mol with the model
ΔHf (methylalkylethers) = GCCH3 + NCH2 * GCCH2 + GC(H3)COC(-)
and data are to be found in Table S8 in the Supplementary Material. We observed that for dimethylether, the difference (model–experiment) is 9.1 kJ/mol, whereas also Hukkerikar et al. [4], using a different GC approach, found a difference 10.2 kJ/mol. This suggests we should treat dimethylether as a separate, individual species in the GC approach with the experimental value of −184.1 kJ/mol associated with it, assuming this is a correct value.
Initially, we made an attempt to cover all ethers and di-alkylethers with one formula. However, it became clear that many individual values would not comply with chemical accuracy. Consequently, we introduced two distinct values for the methyl-alkylethers (H3)COC(-), and for the other di-alkylethers R’-COC-R. The GC contribution for the latter was determined as −168 kJ/mol. For these latter class of di-alkylethers, we report an averaged absolute difference with a value of 3.48 kJ/mol and thus within chemical accuracy, whereas the MG ICAS23 approach gives 3.38 kJ/mol. Still, our model value for di-n-pentylether differs by 13.5 k/J/mol from the experimental value. Interestingly, the MG ICAS23 approach [4] also reveals a difference of 13.5 kJ/mol. Moreover, also remarkable is the increment, from experimental data, for di-n-pentylether. Compared to di-n-butylether, the difference is 56 kJ/mol, which is a lot more than the additive value 2 * 20.68 = 41.7 kJ/mol. A value of 41.7 kJ/mol would account for the difference 13.7 kJ/mol for di-n-pentylether. For these longer alkyl chains, there is no chemical argument why such non-additive behavior would be realistic. One should therefore question this exceptional value for a single species, di-n-pentylether. On the basis of the current data and arguments, we conclude, for the time, that the models properly predict the heat of formation for all ethers. Both MG ICAS23 and the here proposed model perform appropriately.

3.3. Alkenes

Experimental data for the 1-alkenes were preferably taken from Rossini et al. [22,23], and otherwise from NIST or CAPEC. With a choice of +62.5 kJ/mol for the C=C group and our formula describing the heats of formation for the 1-alkenes,
ΔHf (1-alkenes) = GCCH3 + NCH2 * GCCH2 + GCC=C
we arrived at an average absolute difference (model–exp) of 0.17 kJ/mol only. All individual data can be found in Table S9 in the Supplementary Material. These findings once more confirm the correctness of our adopted values for the CH3 and CH2 groups. For ethylene itself, we need a dedicated single value, assuming the NIST value of +52.4 kJ/mol is correct. This is apparent from the increment of −31.49 kJ/mol between ethylene and 1-propene. We may also look at this from a different perspective, namely, by taking the heat of formation of +52.4 kJ/mol of ethylene as the basic value for C=C (rather than 62.5 kJ/mol for C=C-), and seeing all mono-substituted species as having a group nearest neighbor interaction of 10.1 kJ/mol. At the moment, it seems as appropriate to consider ethylene as a separate species with an individual value.
When we now look at the alkenes which have a non-terminal double bond, e.g., 2-pentene or 3-hexene, adopting the equation based on our choice for defining the groups ΔHf (non-terminal alkenes) = 2* GCCH3 + NCH2 * GCCH2 + GCC=C to evaluate the heats of formation as for the 1-alkenes, we find that the heats of formation deviate clearly, typically by about 10 kJ/mol, from the experimental values. It is to be noted that this is not observed for the alkynes (see later) which obey the same model for the 1-alkynes as well as for the other alkynes listed. This is likely to be the reason why in the Marrero–Gani model [10] the alkynes’ required groups include CH3, CH2 and C≡C, whereas for the alkenes, including the 1-alkenes, a second-order parameter was included to arrive at sufficiently accurate model values. To find out more about whether this is indeed truly non-additivity for the 2-alkenes, we performed density functional theory (DFT) calculations using the B3LYP functional and the 6 – 311 + G** basis set to evaluate the energies of alkenes and alkynes. The results are shown in Table 2. When we look at the structural differences between 1-ene and 2-ene, the difference regarding groups is one CH3 more and one CH2 less. The same can be said for the ynes. As we see from Table 2, the increment is about 25 kJ/mol for the ynes and 12 kJ/mol for the enes. Therefore, there is, maybe a little surprisingly from a naive chemical point of view, a difference between ynes and enes. It is the enes that pose the non-additive issue, as when we take the difference between our GC value for CH3 and CH2, we end up with a value over 20 kJ/mol which we obtained from the DFT calculations for the ynes, so these behave in a normal additive way. Thus, we need to correct the model values for the 2-enes and 3-enes or, in other words, we need to introduce a nearest neighbor interaction. For trans-R-C=C-R’, this correction was determined as 11.5 kJ/mol, and thus we introduced a new group, trans-R-C=C-R’, with a GC parameter value of +73.5 kJ/mol. For cis-R-C=C-R’, the correction was slightly larger, and the new group trans-R-C=C-R’ has an associated GC parameter of +78 kJ/mol. Thus, for the enes other than the 1-enes, we have a group contribution of +73.5 kJ/mol for the trans R-C=C-R’ group and +78 kJ/mol for the cis R-C=C-R’ group, compared to +62.5 kJ/mol for the 1-enes. One could also formulate it such that we can obtain a nearest neighbor effect contribution of 11 kJ/mol for trans-R-C=C-R’, and, similarly, 15.5 kJ/mol for cis-R-C=C-R’. With these new parameters and model formulae
ΔHf (non-terminal trans-alkenes) = GCCH3 + NCH2 * GCCH2 + GC trans-R-C=C-R’
ΔHf (non-terminal cis-alkenes) = GCCH3 + NCH2 * GCCH2 + GC cis-R-C=C-R
we obtain good agreement (within chemical accuracy) between model and experimental values for the trans-alkenes with an absolute average difference between the model and experiment of only 0.55 kJ/mol. All individual data are collected in Table S10 in the Supplementary Material.
We will now treat various alkylsubstituted alkenes separately, and as we will see in some cases, nearest neighbor effects are present; in others, they are not. For the 1-enes with an alkyl substituent not directly attached to a double-bond carbon atom, we can describe the heats of formation similar to the non-substituted 1-alkenes, and the formula reads
ΔHf (1-alkenes) = 2*GCCH3 + GCCH + NCH2 * GCCH2 + GCC=C
The averaged absolute difference (model–exp) is 2.54 kJ/mol and all individual model values are within chemical accuracy from the experimental values. As described before, the group CH has a value of −4 kJ/mol attributed to it. Data are collected in Table S11 in the Supplementary Material. In works using second- and third-order groups, e.g., the MG ICAS23 software suite [17], three additional second-order group parameters were involved ((CH3)2CH, CH2-CHm=CHn (m,n in 0..2), CHp-CHm=CHn (m,n in 0..2; p in 0..1)), whereas the presently proposed model did not involve any new parameters.
The next data set comprises 2-alkenes with a substituent at the double bond, and all data are collected in Table S12 in the Supplementary Material. Unfortunately, we have few experimental data available. Applying the formula expected on the basis of the groups that constitute this class of species results in an averaged absolute difference between model and experimental values of 1.0 kJ/mol and all individual values being within chemical accuracy. Compared to the best method thus far, implemented in the MG ICAS23 software suite, the MG approach needed two additional second-order group parameters (CH3-CHm=CHn (m,n in 0..2), CH2-CHm=CHn (m, n in 0..2)), whereas no additional parameters were needed for the model we present here, viz., Equation (11). It is interesting to note that this is different from the pure 2-alkenes (see above) where a, albeit single, nearest neighbor parameter needed to be added, but at present, we cannot exclude the idea that a fortuitous cancellation of two effects is involved.
ΔHf (2-alkenes with a substituent at the double bond) = NCH3 * GCCH3 + NCH * GCCH+ NCH2 * GCCH2 + GCC=C
For the 1-enes with an alkyl substituent at the double-bond carbon atom, i.e., 2-(m)ethyl−1-alkenes, the formula comprises a new group contribution term, GCC=C(C)-R, which includes a neighbor (to the double bond) effect of magnitude 8 kJ/mol in order to achieve the required chemical accuracy. The group contribution for the C=C bond with substituent (C=C(C)-R) therefore is +70 kJ/mol compared to +62 kJ/mol for the unsubstituted 1-enes. All individual values are collected in Table S13 in the Supplementary Material, for which we obtained an average absolute difference (model–exp) of 1.21 kJ/mol, whereas all individual differences are below 2 kJ/mol. The MG ICAS23 [4,17] result (we once more compare to the best available results reported until now) for the average absolute difference (exp–model) reads 1.50 kJ/mol. However, to achieve this, the method has four additional second-order group parameters ((CH3)2CH, CH2-CHm=CHn (m,n in 0..2), CH3-CHm=CHn (m,n in 0..2), CHp-CHm=CHn (m,n in 0..2; p in 0..1)) compared to a single nearest neighbor parameter in the presently proposed model.
ΔHf (1-alkenes with alkyl substituent at the double bond carbon atom) = 2*GCCH3 + NCH2 * GCCH2 + GCC=C(C)-R

3.4. Alkynes

As we have more experimental values from the NIST database, we use the Rossini data [24] when available and otherwise NIST experimental data to determine the GC parameter for the C≡C group. This does not impose any kind of issue, as the experimental values from the two data sets that can be compared differ by less than 2 kJ/mol. The main reason to select the larger NIST set is to check whether there are no deviations from a larger data set to ensure that we have a proper parameter value for the C≡C group. The value of this parameter was found to be 229 kJ/mol. The averaged absolute difference (model–exp) was 1.53 kJ/mol whilst using
ΔHf (1-alkynes) = GCCH3 + NCH2 * GCCH2 + GCC≡C
to evaluate the model values. Data are to be found in Table S14 of the Supplementary Material. The value of 229 kJ/mol was selected such that also individual values are within chemical accuracy (1 kcal/mol).
For the 2-, 3-, 4- and 5-ynes, we also found good agreement between experimental values (Rossini values, and if they are not available, NIST data) and the model
ΔHf (non-terminal-alkynes) = 2*GCCH3 + NCH2 * GCCH2 + GCC≡C
and calculated an averaged absolute difference (model–exp) of 1.78 kJ/mol. Only 2-pentyne has an error (5.25 kJ/mol) somewhat larger than chemical accuracy (4 kJ/mol). The NIST database provides two values for 2-butyne: 145 and 148 kJ/mol. The latter value 145 kJ/mol originates from [24], whereas the value of 148 kJ/mol originates from [25]. In their later paper [24], Rossini et al. stated not to have found the reason for these (small) differences.
For 2-pentyne, there is only one value, and the reference is to the Rossini et al. works, and therefore it is identical to the value in the previous column in Table S14 of the Supplementary Material. At this moment, we cannot conclude whether an experimental deviation is involved or that minor interactions are involved. Regarding the latter, a small additional term of the size 1.5 kJ/mol added to the C≡C group contribution (+229 kJ/mol) would make all non-terminal alkynes have a deviation within chemical accuracy. However, as this would be added on the basis of the need for, in essence, a single deviation, which still might be an experimental error of minor size, we do not propose this at this stage. All individual data are collected in Table S14 in the Supplementary Material.

3.5. Nitrogen-Containing Species: n-Alkylamines and Nitriles

The availability of experimental led to the selection of these data from different literature sources: experimental data are based on the Rossini value for ethylamine (Ref. [26] page 623), NIST values when available, and otherwise CAPEC data base values. By selecting a value of +13 kJ/mol for the amine group and our formula describing the heats of formation for the alkylamines,
ΔHf (n-alkylamines) = GCCH3 + NCH2 * GCCH2 + GCNH2
we arrived at an averaged absolute difference (model–exp) of 1.20 kJ/mol. The methylamine species is to be considered separately. This is not only because of the difference between the model and experiment (5.86 kJ/mol) but also because the increment between methylamine and ethylamine is clearly larger than the typical CH2 value of 20.63 kJ/mol, but around 26 kJ/mol. Thus, methylamine should best be considered a separate species. All individual values are collected in Table S15 of the Supplementary Material.
The nitriles form an interesting class, more specifically, the dinitriles. For the mono-nitriles, the group value for the nitrile group was found to be +116 kJ/mol based on the model
ΔHf (mononitriles) = GCCH3 + NCH2 * GCCH2 + GCCN
We evaluated an averaged absolute difference (model–exp) of 0.80 kJ/mol. Data can be found in Table 3.
When we now look at the α,ω-dinitriles, for 1,5-pentanedinitrile and 1,6-hexanedinitrile, we also find excellent agreement between the model, viz.,
ΔHf (α,ω-dinitriles) = NCH2 * GCCH2 + 2 * GCCN
and the experimental values shown in Table 3. For malononitrile (N≡CCC≡N) and butane-dinitrile (N≡CCCC≡N), also known as succinonitrile, the difference between model and experimental values is around 55 and 20 kJ/mol, respectively. As the other species reveal good agreement between model and experimental values, and because dinitrile species with a long CH2 sequence in between should be considered to be similar in behavior to the mono-nitriles but now with two nitrile groups at both ends, we assume these deviations are due to the interaction between the CN groups, which is further supported by the observation that for malononitrile, the deviation is much larger than for butane-dinitrile. We performed ab initio Hartree–Fock and DFT B3LYP calculations to evaluate the energy differences between the successive dinitriles, as presented in Table 4. These confirm that malononitrile and butane-dinitrile are distinct cases, and higher species follow the formula Equation (15b). This is supported by Beckhaus et al. [27], who reported, in a paper on geminal substituent effects, a synergetic destabilization by two geminal cyano substituents of 11.5 kcal/mol or 48 kJ/mol. In their paper, they also evaluated the heat of formation and found 266.5 kJ/mol for malononitrile, in good agreement with the NIST value in Table 5. For alkylsubstituted malononitriles, this effect decreases with increasing substitution but is still present, viz., Table 5. Thus, the alkylsubstituted malonitriles need to be treated separately which we will not further discuss here, but [27] provides the first useful data to push this forward.
Now, we need to mention an important difference from the previous MG ICAS23 [17] approach which reveals that for 1,6-hexanedinitrile, the groups involved are CH2 (twice), CH2CN (twice) and a third-order group NC-(CHn)m-CN, m > 2. Similarly, the heat of formation of 1,5-pentanedinitrile is accounted for by CH2 (one), CH2CN (twice) and a third-order group NC-(CHn)m-CN (m > 2), whereas 1,4-butanedinitrile is described by two CH2CN groups and a second-order group named NC-CHn-CHm-CN (n, m in 1..2), and, finally, malononitrile is described by one CH2CN group and one CN group. Thus, malononitrile is considered a regular molecule for which the heat of formation is purely additive with first-order contributions, namely, for CH2CN and CN only. Based on the energy differences between successive species in the series, and our ab initio and DFT calculations and the work by Beckhaus et al. [27], we have to conclude that the MG ICAS23 results are not based on the correct chemistry.
In summary, because of the presence of (large) geminal effects in malononitrile and succinonitrile, we need to treat these as individual entities in the GC method to circumvent more parameters for these two species only. All other mono- and dinitriles can be described based on the group contribution for CH2, CH3 and CN only.

3.6. Benzene/Phenyls

For the mono-substituted benzenes, from experimental data from Rossini et al. [28,29], we initially attempted ΔHf (mono-substituted benzene) = GCPhenyl + Nsubstituent * GCSubstituent. When we included benzene and thus only have the contribution GCPhenyl, we had deviations between the model and experiment. We observed the same for the di-, tri- and tetra-substituted benzenes that will be discussed later. However, when we add a single parameter, AromMonoalkyl, for the mono-alkylsubstituted benzenes with the numerical value 6 kJ/mol, we arrive at
ΔHf (mono-substituted benzene) = GCPhenyl + ∑ Nsubstituent * GCSubstituent + AromMonoalkyl
and we find good agreement between our new model and experimental values. All individual values are collected in Table S16 in the Supplementary Material. The averaged absolute difference (model–exp) found reads 0.88 kJ/mol, and all individual values are within chemical accuracy; actually, many have a deviation less than −1 kJ/mol. In our approach, we only have the single additional parameter valued at 6 kJ/mol. This additional parameter is not added in the unsubstituted benzene, so it could be said that benzene itself is an exception.
It was to be expected that for the substituted benzenes, a simple additive behavior of the energies of the individual groups will not lead to adequate results. The substitution of a conjugated system will lead to interaction energies between the groups, even though perhaps small. The MG ICAS23 [4,10,17] approach introduced second-order parameters for substituted benzenes, for each substitution pattern, e.g., AROMRINGs1s2s for 1,2 substitution, AROMRINGs1s3s5 for 1,5-substitution, AROMRINGs1s2s3s4s for 1,2,3,4-tetrasubstitution. By doing that, the quality of the fitting of the experimental data was improved substantially. However, it means that for di-substituted benzenes, we have AROMRINGs1s2s, AROMRINGs1s3s and AROMRINGs1s4s, which implies three parameters; for the tri-substituted benzenes, we have AROMRINGs1s2s3s, AROMRINGs1s2s,4s, AROMRINGs1s2s5s, AROMRINGs1s3s4s and AROMRINGs1s3s5s, which implies five additional parameters. For tetra-substituted benzene, we even have potentially three additional parameters: AROMRINGs1s2s3s4s, AROMRINGs1s2s3s5s, AROMRINGs1s2s4s5s.
As we aim at results within chemical accuracy with a minimum number of parameters, i.e., avoiding overfitting, we describe the di-substituted alkylbenzenes by
ΔHf (di-substituted benzene) = GCPhenyl + ∑ Nsubstituent * GCSubstituent + AromDialkyl
where the single additional substitution parameter AromDialkyl leads to a good description of the heats of formation of the di-substituted alkylbenzenes when this parameter takes the value 18.5 kJ/mol, viz., Table S16b. The averaged absolute difference between the model and experiment is 1.52 kJ/mol and all individual values are within chemical accuracy.
For the tri-substituted alkylbenzenes, we adopted
ΔHf (tri-substituted benzene) = GCPhenyl + ∑ Nsubstituent * GCSubstituent + AromTrialkyl
with AromTrialkyl = +30 kJ/mol, and the averaged absolute difference (model–exp) found reads 2.33 kJ/mol and all individual values are within chemical accuracy for both models, viz., Table S16c.
Finally, for the tetra-substituted alkylbenzenes, we adopted
ΔHf (tetra-substituted benzene) = GCPhenyl + ∑ Nsubstituent * GCSubstituent + AromTetraalkyl
with AromTetraalkyl = +40 kJ/mol, and the averaged absolute difference (model–exp) was calculated as 1.15 kJ/mol. For the present model, all individual values are clearly within chemical accuracy, viz., Table S16d.
In summary, we obtained excellent results whilst involving a single, individual substitution parameter for each of the mono-, di-, tri- and tetra-alkylsubstituted benzenes (we already had all other parameters from the previous part of this paper). This seems the best methodology reported thus far, as (see above) the previous best approach involved substantially more parameters with the risk of overfitting.

3.7. Naphthalenes

Experimental data were taken from Rossini et al. [29], if not available from the CAPEC database. With our choice of chemical groups, we treat naphthalene itself as a group and therefore the heat of formation for the unsubstituted molecule is set to the experimental value, i.e., the group contribution for the naphthalene group is +151.8 kJ/mol. We found the same as for the benzenes, i.e., a substituent effect which requires an additional parameter for substituted naphthalenes. In fact, we found the same parameters AromMonoalkyl and AromDialkyl as found for the substituted benzenes can be applied to the substituted naphthalanes. Thus, for the mono-substituted naphthalenes, we have
ΔHf (mono-alkyl substituted naphthalene) =
GCNaphthalene + ∑ Nsubstituent * GCsubstituent + AromMonoalkyl
and for the di-substituted naphthalenes, we have
ΔHf (di-alkyl substituted naphthalene) = GCNaphthlalene + ∑ Nsubstituent * GCsubstituent + AromDialkyl
The averaged absolute difference (model–exp) was found to be 1.52 kJ/mol and all six individual values were also within chemical accuracy, 4.2 kJ/mol. For the MG ICAS23 approach, the AAD was also only 2.60 kJ/mol; however, both naphthalene and 1-ethylnaphthalene were both beyond the desired 4.2 kJ/mol limit. For naphthalene, one third-order group is involved; for 1-ethylnaphthalene, two third-order groups are involved. The presently proposed model only has naphthalene as a group itself, and other parameters were known from the previous classes of molecules dealt with in this paper. For the mono- and di-alkylsubstituted naphthalenes, the same additional corrections were applied as for the corresponding substituted benzenes (see above). Individual data can be found in Table S17 in the Supplementary Material.

3.8. A Most Interesting Case: Cycloalkanes

An interesting case are the cycloalkanes in which ring strain plays a significant role. We have already seen one case in which taking into account chemical knowledge is crucial, i.e., malononitrile and succinonitrile, to obtain a reliable predictive model also beyond the molecules used for the parametrization. When we apply the up till now best approach, MG ICAS23 [4,10,17], we find that a range of third-order parameters were involved for the cylcoalkanes. In addition, for methylcyclopentane and methylcyclohexane, additional third-order 5- and 6-member ring parameters are introduced, whereas these are surprisingly absent in the unsubstituted equivalents cyclopentane and cyclohexane. This is surprising as one would expect that cyclohexane and methylcyclohexane, not suffering from ring strain, would behave quite normally as a collection of CH2 groups, and as we will see below, they do indeed. Furthermore, despite all additional third-order parameters, the performance when applied to the cycloalkanes varies a lot: from chemical accuracy up till some 80 kJ/mol in error for cyclopropane and cyclobutane and more than 20 kJ/mol for cyclodecane. For the very constrained case of bicyclobutane, the deviation from the experiment (MG ICAS23 value −169 kJ/mol) is even around 380 kJ/mol (for references, see the caption of Table 4).
As cyclohexane is a species known to exhibit practically no ring strain (only 0.4 kJ/mol according to Anslyn and Dougherty [30]), one would expect the heat of formation can be described as the sum of CH2 group contributions. This is confirmed by the results for cyclohexane and all n-alkylsubstituted cyclohexanes in Table 6: the only groups involved were CH2 (only group for cyclohexane), and CH3 and CH for the n-alkylsubstituted cyclohexanes, for which parameter values were determined at the beginning of the present study, viz., Section 3.1. All other cycloalkanes show very significant differences between such a model, i.e., ΔHf (cycloalkane) = NCH2 * GCCH2, and the experimental values. The issue here is the ring strain in these cyclic molecules. Ring strain is a result of energy differences introduced by CCC bending and CCCC torsional changes and not simply a property which is additive in a few additional parameters. With increasing ring size and increasing substitution, these contributions vary, and it is not surprising that many additional parameters are needed, while for several species, the difference between the model and experiment is still huge (see numbers quoted above). As the ring strain is not a simple additive parameter or a few simple additive parameters covering the series, the solution to this problem is as follows: we need to take into account common chemical knowledge, namely, recognition of and concrete experimental values for the ring strain [29], add the values
ΔHf (cycloalkane) = NCH2 * GCCH2 + ring strain
and, similarly for the methylsubstituted cycloalkanes,
ΔHf (methylcycloalkane) = NCH2 * GCCH2 + GCCH + GCCH3 + ring strain
and we then obtain the value in the column “Model ΔHf” in Table 6, and the difference from experimental values is shown in the column “Model–Exp”. The averaged absolute difference over all cycloalkanes in Table 6 is 2.32 kJ/mol. This is a good result, with only a single value beyond chemical accuracy, viz., methylcyclohexane. We notice that the deviation for the n-alkylsubstituted cyclopentanes is typically 3.6 kJ/mol throughout, which may originate from a different ring strain energy for the substituted cyclopentane compared to the pure cyclopentane. The same applies to the n-alkylsubstituted cyclohexanes for which the difference is, on average, approximately 2.4 kJ/mol. If this could be confirmed, the averaged absolute deviation would decrease from 2.32 down to 0.46 kJ/mol.
Whilst taking into account ring strain, the most striking example in this series is bicyclobutane: 0.74 kJ/mol from the experiment where other methods totally fail.
In summary, these results clearly reveal that for the (alkylsubstituted-)cycloalkanes, one should take into account ring strain, a well-known phenomenon in the field of physical organic chemistry. However, as these ring strain energies themselves are evaluated from the differences between the experimental values and the expected, additive values, the straightforward way is to adopt the experimental values for the unsubstituted cycloalkanes; in other words, adopt each unsubstituted cycloalkane as an individual new group.

4. Conclusions

We have constructed a group contribution approach adopting the definition of a group which chemists are mostly used to: CH3, OH, phenyl, etc. Our approach involves a minimum number of GC parameters: one for each group, whilst using a minimum number of additional parameters to account for nearest neighbor effects, e.g., for alkylsubstituted benzenes. Compared to other methods, e.g., [4] and earlier references therein, this avoids overfitting and subsequent consequences for the predictive power for molecules other than those used for the current parametrization, as was also explicitly shown for, e.g., the cycloalkanes. The present GC parametrization reveals chemical accuracy, i.e., a maximum 1 kcal/mol (4.2 kJ/mol) deviation from the experiment with few exceptions. Exceptions with respect to chemical accuracy include 2-methylnonane (5.34 kJ/mol) for which case we provided arguments that the experimental value is likely an error. Overall, these results seem the best thus far reported, i.e., either the results are quantitatively better or fewer parameters have been used.
We have seen that the quality of the current results is, in part, due to the use of consistent and proper experimental data, preferably from few laboratories such as the Rossini group data. It was shown explicitly that for the larger set from Rossini et al., one observes more consistent values for the CH2 increments for various classes of molecules.
The use of common, generally known and accepted chemical knowledge was found to be crucial to properly account for certain species, including geminal effects for malononitrile and succinonitrile, and ring strain for cycloalkanes. This underpins that solely using mathematical optimization routines and adding higher-order group parameters is not appropriate as it does not account for the proper chemistry/physics throughout, with consequences for the predictive power for species not within the data set employed for parametrization.
Finally, additional results for other classes of molecules are in preparation, whereas the Excel file comprising all numerical values involved in this study will be made available upon request, so other researchers can expand this work with additional experimental data and new group parametrizations.

Supplementary Materials

The following are available online at https://www.mdpi.com/article/10.3390/chemengineering5020024/s1, Table S1: Experimental (CAPEC data base and NIST data base) and increments (difference between experimental value for the species and that of the species with 1 CH2 group less, so the previous entry in the table); Table S2: Experimental and model values for alkanes. All values in kJ/mol.; Table S3: Experimental and model values for mono-methylalkanes. All values in kJ/mol.; Table S4: Experimental and model values for the n-alcohols. All values in kJ/mol.; Table S5: Experimental and model values for the aldehydes. All values in kJ/mol.; Table S6: Experimental and model values for the ketones. All values in kJ/mol.; Table S7: Experimental and model values for mono- and dicarboxylic acids. All values in kJ/mol.; Table S8: Experimental and model values for methyl (upper part) and other di-alkyl ethers (lower part). All values in kJ/mol; Table S9: Experimental and model values for alkenes. All values in kJ/mol; Table S10: Experimental and model values for the 2-enes and 3-enes. All values in kJ/mol; Table S11: Experimental and model values for the 1-alkenes with an alkyl substituent not directly attached to the double bond carbon atom; Table S12: Experimental and model values for the 2-alkenes with an alkyl substituent directly attached to the double bond; Table S13: Experimental and model values for the 1-alkenes with an alkyl substituent directly attached to the double bond carbon atom; Table S14: Experimental and model values for alkynes. All values in kJ/mol.; Table S15: Experimental and model values for the primary amines. All values in kJ/mol.; Table S16: Experimental and model values for substituted benzenes; Table S17: Experimental and model values for substituted naphthalenes. All values in kJ/mol.

Funding

This research received no external funding.

Data Availability Statement

Data is contained within the article or Supplementary Material.

Acknowledgments

The author gratefully acknowledges Georgios Kontogeorgis and Gürkan Sin and Guoliang Wang (all Danisch Technical University DTU) for allowing the use and providing a copy of the ICAS23 software suite, particularly the ProPred module which was used in this study. The author also gratefully acknowledges Jűrgen Rarey for truly very useful suggestions.

Conflicts of Interest

The author declares that the research was conducted in the absence of any commercial or financial relationships that could be construed as a potential conflict of interest. This research received no (financial) funding.

References

  1. Van Speybroeck, V.; Gani, R.; Meier, R.J. The calculation of thermodynamic properties of molecules. Chem. Soc. Rev. 2010, 39, 1764–1779. [Google Scholar] [PubMed]
  2. Meier, R.J. A Way towards Reliable Predictive Methods for the Prediction of Physicochemical Properties of Chemicals Using the Group Contribution and other Methods. Appl. Sci. 2019, 9, 1700. [Google Scholar] [CrossRef] [Green Version]
  3. Narayanan, B.; Redfern, P.C.; Assary, R.S.; Curtiss, L.A. Accurate quantum chemical energies for 133 000 organic molecules. Chem. Sci. 2019, 10, 7449–7455. [Google Scholar] [PubMed]
  4. Hukkerikar, A.S.; Meier, R.J.; Sin, G.; Gani, R. A method to estimate the enthalpy of formation of organic compounds with chemical accuracy. Fluid Phase Equilibria 2013, 348, 23–32. [Google Scholar]
  5. Joback, K.G.; Reid, R.C. Estimation of Pure-Component Properties from Group-Contributions. Chem. Eng. Commun. 1987, 57, 233–243. [Google Scholar]
  6. Benson, S.W.; Cruickshank, F.R.; Golden, D.M.; Haugen, G.R.; O’Neal, H.E.; Rodgers, A.S.; Shaw, R.; Walsh, R. Additivity rules for the estimation of thermochemical properties. Chem. Rev. 1969, 69, 279–324. [Google Scholar]
  7. Cohen, N.; Benson, S. Estimation of the heats of formation of organic compounds by additivity methods. Chem. Rev. 1993, 93, 2419–2438. [Google Scholar]
  8. Domalski, E.S.; Hearing, E.D. Estimation of the Thermodynamic Properties of C-H-N-O-S-Halogen Compounds at 298.15 K. J. Phys. Chem. Ref. Data 1993, 22, 805–1159. [Google Scholar]
  9. Constantinou, L.; Gani, R. New group contribution method for estimating properties of pure compounds. AIChE J. 1994, 40, 1697–1710. [Google Scholar]
  10. Marrero, J.; Gani, R. Group-contribution based estimation of pure component properties. Fluid Phase Equilibria 2001, 183, 183–208. [Google Scholar]
  11. Moller, B.; Rarey, J.; Ramjugernath, D. Estimation of the vapour pressure of non-electrolyte organic compounds via group contributions and group interactions. J. Mol. Liq. 2008, 143, 52–63. [Google Scholar]
  12. Govender, O.; Rarey, J.; Ramjugernath, D. Estimation of Pure Component Properties, Part 5: Estimation of the Thermal Conductivity of Nonelectrolyte Organic Liquids via Group Contributions. J. Chem. Eng. Data 2020, 65, 1300–1312. [Google Scholar]
  13. Kadda, A.; Mustapha, B.A.; Yahiaoui, A.; Khaled, T.; Hadji, D. Enthalpy of Formation Modeling Using Third Order Group Contribution Technics and Calculation by DFT Method. Int. J. Thermodyn. (IJoT) 2020, 23, 34–41. [Google Scholar] [CrossRef]
  14. Van Krevelen, D.W.; Chermin, H.A.G. Estimation of the free enthalpy (Gibbs free energy) of formation of organic compounds from group contributions. Chem. Eng. Sci. 1951, 1, 66–80. [Google Scholar]
  15. Nielsen, T.; Abildskov, J.; Harper, P.; Papaeconomou, I.; Gani, R. The CAPEC Data Base. J. Chem. Eng. Data 2001, 46, 1041–1044. [Google Scholar]
  16. Nannoolal, Y.; Rarey, J.; Ramjugernath, D.; Cordes, W. Estimation of pure component properties Part 1. Estimation of the normal boiling point of non-electrolyte organic compounds via group contributions and group interactions. Fluid Phase Equilibria 2004, 226, 45–63. [Google Scholar]
  17. ICAS. Available online: https://www.kt.dtu.dk/english/research/kt-consortium/software (accessed on 7 April 2021).
  18. Budzelaar, P.H.M. Available online: http://www.akoci.uni-hannover.de/ak-duddeck/pdf/pdf-spektro-skripten/NMR%20Simulation.pdf (accessed on 7 April 2021).
  19. Pijpers, A.P.; Meier, R.J. Core Level Photoelectron Spectroscopy for Polymer and Catalyst Characterisation. Chem. Soc. Rev. 1999, 28, 233–238. [Google Scholar]
  20. Wavefunction Inc. Spartan’10; Wavefunction Inc.: Irvine, CA, USA, 2010. [Google Scholar]
  21. Prosen, E.J.; Rossini, F.D. Heats of combustion and formation of the paraffin hydrocarbons at 25 °C. J. Res. Natl. Bur. Stand. 1945, 34, 263–269. [Google Scholar]
  22. Prosen, E.J.; Rossini, F.D. Heats of formation, hydrogenation, and combustion of the monoolefin hydrocarbons through the hexenes, and of the higher-1-alkenes in the gaseous state at 25 °C. J. Res. Natl. Bur. Stand. 1946, 36, 269–275. [Google Scholar]
  23. Taylor, W.J.; Wagman, D.D.; Williams, M.G.; Pitzer, K.S.; Rossini, F.D. Heat, equilibrium constants, and free energies of the alkylbenzenes. J. Res. Natl. Bur. Stand. 1946, 37, 95–122. [Google Scholar]
  24. Prosen, E.J.; Maron, F.W.; Rossini, F.D. Heats of combustion, formation, and insomerization of ten C4 hydrocarbons. J. Res. Natl. Bur. Stand. 1951, 46, 106–112. [Google Scholar]
  25. Wagman, D.D.; Kilpatrick, J.E.; Pitzer, K.S.; Rossini, F.D. Heats, equilibrium constants, and free energies of formation of the acetylene hydrocarbons through the pentynes, to 1,500° K. J. Res. Natl. Bur. Stand. 1945, 35, 467–496. [Google Scholar]
  26. Rossini, F.D.; Wagman, D.D.; Evans, W.H.; Levine, S.; Joffe, I. Selected Values of Chemical Thermodynamic Properties, Circular of the National Bureau of Standards 500. 1 February 1952. Available online: https://nvlpubs.nist.gov/nistpubs/Legacy/circ/nbscircular500.pdf (accessed on 7 April 2021).
  27. Beckhaus, H.-D.; Dogan, B.; Pakusch, J.; Verevkin, S.; Rüchardt, C. Abhangigkeit des inversen anomeren Effektes geminaler Nitril-Gruppen von der Struktur. Chem. Ber. 1990, 123, 2153–2159. [Google Scholar]
  28. Prosen, E.J.; Johnson, W.H.; Rossini, F.D. Heats of combustion and formation at 25 °C of the alkylbenzenes through C10H14, and of the higher normal monoalkylbenzenes. J. Res. Natl. Bur. Stand. 1946, 36, 455–461. [Google Scholar]
  29. Speros, D.M.; Rossini, F.D. Heats of combustion and formation of naphthalene, the two methylnaphthalenes, cis and trans decahydronaphthalene, and related compounds. J. Phys. Chem. 1960, 64, 1723–1727. [Google Scholar]
  30. Kilpatrick, J.E.; Werner, H.G.; Beckett, C.W.; Pitzer, K.S.; Rossini, F.D. Heats, Equilibrium Constants, and Free Energies of Formation of the Alkylcyclopentanes and Alkylcyclohexanes. J. Res. Natl. Bur. Stand. 1947, 39, 523–543. [Google Scholar]
  31. Knowlton, J.W.; Rossini, F.D. Heats of Combustion and Formation of Cyclopropane. J. Res. Natl. Bur. Stand. 1949, 43, 113–115. [Google Scholar]
  32. Anslyn, E.V.; Dougherty, D.A. Modern Physical Organic Chemistry; University Science Books: Sausalito, CA, USA, 2006; ISBN 1-891389-31-9. [Google Scholar]
  33. Wiberg, K.B.; Lampman, G.M.; Ciula, R.P.; Connor, D.S.; Schertler, P.; Lavanish, J. Bicyclo [1.1.0] butane. Tetrahedron 1965, 21, 2749–2769. [Google Scholar]
Figure 1. Schematic representation of the group contribution (GC) concept where the molecule is broken into building blocks. The upper part shows chemical groups, the identities in the group contribution method, which can be used to describe a molecule such as 2-methyl-1-propanol shown in the lower part. Different GC approaches might follow a different definition of the individual groups (see also text for further detail). A property.
Chemengineering 05 00024 g001
Table 1. Experimental heat of formation for 1-decanol taken from the NIST database. The first column shows the variation in experimental values for the ΔHf for 1-decanol according to different literature sources. For further details, please consult the original papers cited on the NIST webbook pages (https://webbook.nist.gov/ (accessed on 7 April 2021)).
ΔfH°gas (kJ/mol)Reference
−387.2Mosselman and Dekker, 1975
−396.6 ± 1.4Mosselman and Dekker, 1975
−388.8Chao and Rossini, 1965
−398.2 ± 1.2Chao and Rossini, 1965
−395.2 ± 2.4Green, 1960
−404.6 ± 3.1Verkade and Coops, 1927
Table 2. Density functional theory (DFT) calculated energies (B3LYP total energy in hartree units) and energy differences (in kJ/mol) between higher enes and ynes (i.e., 2-, 3-, 4-, 5-enes and -ynes) with the corresponding 1-ene or 1-yne. Therefore, for example, the −25.7 kJ/mol in column 3 is the energy difference between 2-butyne and 1-butyne, the minus sign indicating 2-butyne as the more stable species. For further discussion, see text.
AlkynesB3LYP Total Energy (Hartree)Energy Difference with 1-yne (kJ/mol)AlkenesB3LYP Total Energy (Hartree)Energy Difference with 1-ene (kJ/mol)
1-butyne−156.016968 1-butene−157.269727
2-butyne−156.026734−25.722-butene−157.27461−12.86
1-pentyne−195.341675 1-pentene−196.594118
2-pentyne−195.350891−24.272-pentene−196.598701−12.07
1-hexyne−234.665807 1-hexene−235.91856
2-hexyne−234.6756−25.792-hexene−235.922923−11.49
3-hexyne−234.674842−23.793-hexene−235.922785−11.13
1-heptyne−273.990201 1-heptene−275.242954
3-heptyne−273.999707−25.032-heptene−275.247311−11.47
1-octyne−313.314412 3-heptene−275.247443−11.82
2-octyne−313.324211−25.801-octene−314.567081
3-octyne−313.323866−24.902-octene−314.571746−12.28
4-octyne−313.324338−26.141-nonene−353.891462
1-nonyne−352.638734 2-nonene−353.89613−12.29
2-nonyne−352.648379−25.401-decene−393.215702
3-nonyne−352.648401−25.462-decene−393.220413−12.41
4-nonyne−352.647278−22.504-decene−393.220417−12.42
1-decyne−391.963101
2-decyne−391.972723−25.34
3-decyne−391.972564−24.92
4-decyne−391.972965−25.98
5-decyne−391.972943−25.92
Table 3. Experimental and model values for mono- and dinitriles. All values in kJ/mol.
NitrilesNISTModel ΔHfModel–ExpABS (Model–Exp)
propanenitrile51.553.011.511.51
butanenitrile31.232.381.181.18
pentanenitrile11.111.750.650.65
heptanenitrile −29.511.451.45
octanenitrile−50.6−50.140.460.46
decanenitrile−91.6−91.40.200.2
tetradecanenitrile−174.8−173.920.880.88
averaged absolute difference 0.80
malononitrile266.3211.37−54.9354.93
butanedinitrile209.7190.74−18.9618.96
pentanedinitrile 170.110.110.11
hexanedinitrile149149.480.480.48
averaged absolute difference 0.30
Table 4. Hartree–Fock and DFT calculated energies in the unit hartree, the common energy unit for quantum calculations. These values are given as a reference for those that want to verify these results by similar calculations, but for the context of this paper, the important numbers are those in bold representing the deviation from additivity. We applied both methods to ensure we obtain a semi-quantitatively reliable answer. The numbers in bold in the columns entitled “deviation from additivity” reveal that, in particular, the heat of formation of malononitrile deviates strongly from additivity: the quantum calculations suggest a deviation in the range 34–39 kJ/mol, which we can qualitatively compare to the deviation of 54 kJ/mol from the data in part a of this table. Additionally, for succinonitrile (butanedinitrile), we find a clear deviation. For further discussion, see the main text. All numbers except those in bold are reported in order for theoretical chemists to be able to reproduce the results reported here.
Hartree Fock Total Energies (Hartree)Increments Total Energy (Hartree)Total Energy Assuming Additivity (Hartee)Deviation from Additivity (Hartree)Deviation from Additivity (kJ/mol)DFT B3LYP Total Energies (Hartree)Increments Total Energy (Hartree)Total Energy Assuming Additivity (Hartree)Deviation from Additivity (Hartree)Deviation from Additivity (kJ/mol)
malono−223.69937 −223.7142330.01486339.0−225.042919 −225.0559010.01298234.1
succino−262.75558−39.056210−262.7591340.0035549.3−264.378353−39.335434−264.3810010.0026487.0
pentane−301.802334−39.046754−301.8040350.0017014.5−303.70477−39.326417−303.7061010.0013313.5
hexane−340.848886−39.046552−340.8489360.000050.1−343.031351−39.326581−343.031201−0.00015−0.4
heptane−379.893837−39.044951−379.89383700.0−382.356335−39.324984−382.356301−0.000034−0.1
octane−418.938738−39.044901 −421.681401−39.325066
Table 5. Results for substituted malononitriles, where predictions from the currently proposed model are compared to experimental results obtained from [27]. The results, in particular, the difference between the model and experiment, reflect the statement made in [27] that the deviation is dependent on the degree of substitution.
R (R’) C (CN)2Beckhaus et al. [27]NISTModel ΔHfModel–ExpABS (Model–Exp)
1a Ref [19] R=H, R’=H266.5266.3211.37−55.1355.13
1b Ref [19] R=H, R’=C(CH3)3131.6 83.29−48.3148.31
1c Ref [19] R=H, R’=n-C5H11131.1 107.12−23.9823.98
1d Ref [19] R=CH3, R’=CH3188.4 126.65−61.7561.75
1e Ref [19] R=CH3, R’=C(CH3)2CH(CH3)277.8 36.93−40.8740.87
1f Ref [19] R=CH3, R’=C(CH3)2(C2H5)71.8 83.2911.4911.49
averaged absolute difference 40.26
Table 6. All values in kJ/mol. Experimental data from Rossini et al. [30,31], or if they are not available, from NIST (only cyclooctane); otherwise, data are from the CAPEC database. Ring strain energies from [32,33] (bicyclobutane). The model ΔHf values incorporate the contribution due to ring strain according to Equation (18).
CycloalkanesRossiniNISTModel ΔHfModel–ExpABS (Model–Exp)Ring Strain
cyclopropane53.3 53.21−0.090.09115.1
cyclobutane 27.580.940.94110.1
cyclopentane−77.3−77−77.190.110.1125.96
cyclohexane−123.2−123.5−123.38−0.180.180.4
cycloheptane −118.450.950.9525.96
cyclooctane −126.1−124.441.661.6640.6
cyclononane −132.910.590.5952.76
cyclodecane −154.41151.9
methylcyclopentane−106.8 −102.923.883.8825.96
ethylcyclopentane−127.16 −123.553.613.6125.96
n-propylcyclopentane−148.18 −144.184425.96
n-amylcyclopentane−189 −185.443.563.5625.96
n-heptylcyclopentane−230.3 −226.73.63.625.96
decylcyclopentane−292.2 −288.593.613.6125.96
n-tetradecyJcyclopentane−374.7 −371.113.593.5925.96
n-hexadecylcyclopentane−415.89 −412.373.523.5225.96
methylcyclohexane−154.88 −149.115.775.770.4
ethylcyclohexane−171.88 −169.742.142.140.4
propylcyclohexane−193.4 −190.373.033.030.4
butylcyclohexane−213.3 −2112.32.30.4
n-amylcycIohexane−234 −231.632.372.370.4
1-octylcyclohexane−295.8 −293.522.282.280.4
n–decylcyclohexane−337.1 −334.782.322.320.4
n–tridecylcyclohexane−398.9 −396.672.232.230.4
tetradecylcyclohexane−419.58 −417.32.282.280.4
bicyclobutane 217217.740.740.74267
averaged absolute difference 2.32
Publisher’s Note: MDPI stays neutral with regard to jurisdictional claims in published maps and institutional affiliations.

