Article

A Simple and Accurate Approach for Determining the VFA Concentration in Anaerobic Digestion Liquors, Relying on Two Titration Points and an External Inorganic Carbon Analysis

Faculty of Civil and Environmental Engineering, Technion—Israel Institute of Technology, Haifa 32000, Israel
*
Author to whom correspondence should be addressed.
ChemEngineering 2021, 5(2), 15; https://doi.org/10.3390/chemengineering5020015
Submission received: 1 March 2021 / Revised: 31 March 2021 / Accepted: 1 April 2021 / Published: 6 April 2021

Abstract

:
A new analytic approach is presented for determining the total volatile fatty acids (VFAT) concentration in anaerobic digesters. The approach relies on external determination of the inorganic carbon concentration (CT) in the analyzed solution, along with two strong-acid titration points. The CT concentration can be determined by either a direct analysis (e.g., by using a TOC device) or by estimating it from the recorded partial pressure of CO2(g) in the biogas (often a routine analysis in anaerobic digesters). The titration is carried out to pH 5.25 and then to pH 4.25. The two titration results are plugged into an alkalinity-mass-based equation and then the two terms are subtracted from each other to yield an equation in which VFAT is the sole unknown (since CT is known and the effect of the total orthophosphate and ammonia concentrations is shown to be small at this pH range). The development of the algorithm and its verification on four anaerobic reactor liquors is presented, on both the raw water and on acetic acid-spiked samples. The results show the method to be both accurate (up to 2.5% of the expected value for VFAT/Alkalinity >0.2) and repetitive when the total orthophosphate and ammonia concentrations are known, and fairly accurate (±5% for VFAT >5 mM) when these are completely neglected. PHREEQC-assisted computation of CT from the knowledge of the partial pressure of CO2(g) in the biogas (and pH, EC and temperature in the liquor) resulted in a very good estimation of the CT value (±3%), indicating that this technique is adequate for the purpose of determining VFAT for alarming operators in case of process deterioration and imminent failure.

1. Introduction

The control of anaerobic reactors via titrimetric analysis, applied to determine the sum of the volatile fatty acids concentrations (VFAT, namely the sum of the acetate, propionate and butyrate systems in solution), has been addressed in many publications [1,2,3,4,5,6,7,8,9,10,11,12,13,14]. More than a few algorithms have been developed in the past to interpret titration results aimed at VFAT concentration determination [5], ranging from methods relying on two [4,7,14,15] through eight [11] titration points, and almost anything in between [8,9]. Some of the methods entail (external) analytical knowledge of the concentrations of other, dominant, weak-acid systems present in the water, such as orthophosphate (PT) and ammonia (NT) [8,11,13], while others [1,2,6,7,10,15] ignore the presence of these species, a practice that often yields only approximate results. The major difficulty in accurately determining the VFAT concentration through titration lies in the fact that the buffer capacity curves of the carbonate system (pKC1 = 6.375) and the VFA system (pKa = 4.75) overlap close to the pH range where the buffering capacity of the VFA system is dominant. This is particularly true under the water composition that develops in intensive anaerobic digesters, which is often characterized by a very high total inorganic carbon concentration (CT), such as, e.g., in thermophilic and mesophilic anaerobic digesters. The fact that the buffering capacity of the carbonate system is often much higher than that of the VFA system at that pH range (4.5 < pH < 6) leads to camouflaging of the titration signal that arises from the VFA species, which can only be overcome by relatively unwieldy titration methods, which often require the execution of multiple titration points. More specifically, most of the methods that have been suggested thus far, e.g., [8,11,16,17] have considered the problem to consist of two unknowns (VFAT and CT), which need to be determined simultaneously, while assuming that PT and NT had been determined by an external analysis (and thus their effects on the titration interpretation can be calculated and included in the algorithm). Such an approach, although certainly possible and capable of resulting in accurate VFAT results, invariably leads to cumbersome and lengthy titration procedures. Other approaches exist that attempt to separate CT from VFAT by acidification and boiling [1] or by neglecting the effect of CT in a particular pH range [2,4,15]. Each of these methods has its advantages and disadvantages, elaboration on which can be (partly) found in [12,17].
The current work assumed a different approach, according to which the total inorganic carbon concentration (CT) is analyzed on the same sample, however separately from the titration method that is performed to determine the VFAT concentration. Once CT is determined (e.g., via a TOC analyzer), a very simple and easy to execute 2-point titration procedure can be performed to yield accurate VFAT concentration results, and, as shown in this paper, this can be done without the need to analyze the PT and NT concentrations, as is often required in other titration methods.

Development of the Titration-Data Interpretation Algorithm

Similarly to previous approaches [4,8,11] the fundamental algorithm equation involves equating an equivalent-based term of the overall alkalinity species in solution (relative to the reference species defined below) in terms of the volume of the standard strong acid titrant added (left hand side of Equation (1)) with an equivalent-based term of alkalinity expressed in terms of the concentrations of all proton accepting species likely to be present in the water, i.e., proton accepting species of the carbonate, orthophosphate, ammonia and VFA systems following the addition of a certain equivalent mass, x, of strong acid (right hand side of Equation (1)). The utilized alkalinity equation was formulated against the following reference species: H2CO3*, H3PO4, NH4+ and CH3COOH (representing all the acidic species of the various VFA weak acid systems).
( V e V x ) C a = ( 2 [ C O 3 2 ] x + [ H C O 3 ] x + 3 [ P O 4 3 ] x + 2 [ H P O 4 2 ] x + [ H 2 P O 4 ] x + [ N H 3 ] + [ A ] + [ O H ] [ H + ] ) ( V s + V x )
where: Ve = volume of titrant (strong acid) required to the equivalence point (L); Vx = volume of titrant added to yield pHx (L); Vs = the volume of the sample (L); Ca = concentration of the titrant (eq/L) and the subscript x represents the concentration of the individual species following the dosage of Vx liter of strong acid to the solution.
Equation (1) can be written explicitly as a function of the total concentration of the various weak acid systems (CT, PT, NT, VFAT), pHx and the apparent equilibrium constants:
( V e V x ) C a = ( C T ( 2 K C 1 K C 2 + K C 1 10 p H x ) 10 2 p H x + K C 1 10 p H x + K C 1 K C 2 + P T ( 3 K P 1 K P 2 K P 3 + 2 K P 1 K P 2 10 p H x + K P 1 10 2 p H x ) 10 3 p H x + K P 1 10 2 p H x + K P 1 K P 2 10 p H x + K P 1 K P 2 K P 3 + N T K N K N 10 p H x + V F A T K A c K A c 10 p H x + K W 10 p H x 10 p H x ) ( V s + V x )
where: K′C, K′P, K′N and K′Ac are the thermodynamic equilibrium constants of the carbonate, orthophosphate, ammonia and acetate systems, respectively, adjusted for ionic strength and temperature.
Note that in order to consider the original CT, VFAT, PT and NT values in the water, they are multiplied in the algorithm by the dilution factor emanating from the titrated volume. For brevity and comprehensibility reasons, this dilution factor is not shown in Equation (2) through (6), but it is of course included in the computerized algorithm (see code in Appendix B).
If CT is known and two titration points (i.e., two Vx/pHx pairs) are chosen such that the alkalinity components of the phosphate and ammonia systems hardly change when the two formed equations are subtracted from each other, only one unknown, VFAT, remains, since Ve is also eliminated. Following [8,11] the two chosen titration points should be located roughly half a pH unit on either side of the pKAc of acetic acid (i.e., the titration is carried out to pH 5.25 and then to pH 4.25). These areas in the pH scale support stable and accurate pH measurements and the relatively large amount of strong acid that needs to be added between them (when the VFA and carbonate concentrations are substantial) allows for high accuracy, particularly when the VFAT concentration increases, which is exactly the eventuality for which the method is developed. When the VFAT concentration is very low (i.e., lower than 120 mg/L as CH3COOH), the accuracy (in % of the true VFAT concentration) may be lower, but this is perceived inconsequential for anaerobic processes control.
Equations (3)–(5) depict the formation of two equations from Equation (2) following titration to the two pH points (Vx1, pH 5.25 and Vx2, pH 4.25), and the isolation of VFAT (Equation (4)) following the subtraction of Equation (3) from Equation (4). For demonstration purposes the values of respective thermodynamic equilibrium constants [16] are shown in these equations, however in the practical algorithm developed in this paper these values are adjusted to reflect the solution’s ionic strength and temperature effects [18]. It is noted that in the practical execution of the method there is no need to titrate precisely to pH 5.25 and pH 4.25 but only to their vicinity.
( V e V x 1 ) C a = ( C T ( 2 K C 1 K C 2 + K C 1 10 5.25 ) 10 10.5 + K C 1 10 5.25 + K C 1 K C 2 + N T K N K N 10 5.25 + K W 10 5.25 10 5.25 + P T ( 3 K P 1 K P 2 K P 3 + 2 K P 1 K P 2 10 5.25 + K P 1 10 10.5 ) 10 15.75 + K P 1 10 10.5 + K P 1 K P 2 10 5.25 + K P 1 K P 2 K P 3 + V F A T K A c K A c 10 5.25 ) ( V s + V x 1 )
( V e V x 2 ) C a = ( C T ( 2 K C 1 K C 2 + K C 1 10 4.25 ) 10 8.5 + K C 1 10 4.25 + K C 1 K C 2 + N T K N K N 10 4.25 + K W 10 4.25 10 4.25 + P T ( 3 K P 1 K P 2 K P 3 + 2 K P 1 K P 2 10 4.25 + K P 1 10 8.5 ) 10 12.75 + K P 1 10 8.5 + K P 1 K P 2 10 4.25 + K P 1 K P 2 K P 3 + V F A T K A c K A c 10 4.25 ) ( V s + V x 2 )
Subtracting Equation (3) from Equation (4) and isolating VFAT yields:
V F A T = ( V x 2 V x 1 ) C a + ( V s + V x 2 ) [ V s V s + V x 2 C T ( 2 K C 1 K C 2 + K C 1 10 4.25 ) 10 8.5 + K C 1 10 4.25 + K C 1 K C 2 + V s V s + V x 2 N T K N K N 10 4.25 + K W 10 4.25 10 4.25 + V s V s + V x 2 P T ( 3 K P 1 K P 2 K P 3 + 2 K P 1 K P 2 10 4.25 + K P 1 10 8.5 ) 10 12.75 + K P 1 10 8.5 + K P 1 K P 2 10 4.25 + K P 1 K P 2 K P 3 ] ( V s + V x 1 ) [ V s V s + V x 1 C T ( 2 K C 1 K C 2 + K C 1 10 5.25 ) 10 10.5 + K C 1 10 5.25 + K C 1 K C 2 + V s V s + V x 1 N T K N K N 10 5.25 + K W 10 5.25 10 5.25 + V s V s + V x 1 P T ( 3 K P 1 K P 2 K P 3 + 2 K P 1 K P 2 10 5.25 + K P 1 10 10.5 ) 10 15.75 + K P 1 10 10.5 + K P 1 K P 2 10 5.25 + K P 1 K P 2 K P 3 ] V s [ 10 4.75 10 4.75 + 10 5.25 10 4.75 10 4.75 + 10 4.25 ]
To substantiate that the PT and NT alkalinity-related component concentrations can indeed be neglected in Equation (5) without a significant loss of accuracy, let us consider a fairly typical anaerobic digester water composition, characterized by three typical orthophosphate (PT) concentrations (100, 150 and 200 mgP/L) and one total ammonia (NT) concentration of 32.1 mM (450 mgN/L) [19]. Figure 1 shows the buffering capacity curves of the various weak acid systems in solution at the relevant pH range, assuming three VFAT values and CT = 51.1 mM. For the derivation of the buffer capacity terms see Lahav and Birnhack (2019) [18]. Since the integration of a buffering capacity curve between two pH values gives, by definition, the overall alkalinity concentration between these values, one can perform a separate integration of each weak acid system and determine from it the theoretical error in the VFAT concentration that would arise from ignoring the NT and PT values in the calculation represented by Equation (5).
Table 1 shows the overall theoretical error incurred from neglecting NT and PT. While the effect of NT on VFAT is outright negligible (as also demonstrated by the very small the area under the NT buffer intensity curve), the effect of PT cannot be considered as such, but it is still small and, as shown in Table 1, it becomes smaller as the total VFA concentration (VFAT) reaches high (and alarming, from the anaerobic digester operation standpoint) concentrations. For example, the error in determining a VFAT concentration of 8 mM (480 mg/L as CH3COOH) was merely 3.3% when NT and PT were 450 mgP/L and 200 mgN/L, respectively. Therefore, for the sake of execution simplicity and for anaerobic reactor control purposes both NT and PT can be ignored without loss of essential information. This said, if PT and NT concentrations are known, even roughly, they could be plugged into the algorithm to attain better accuracy. This is mostly important when PT reaches very high concentrations, such as 700 mgP/L, which has been reported in some locations [20].

2. Materials and Methods

2.1. Titration Procedure

All titrations were performed in a sealed 220-mL glass container, equipped with a cap with perforated holes for placing pH and electrical conductivity (EC) probes, along with a port used for acid dosage. The titration was performed using a digital burette (Dosimat 775, Metrohm) filled with 0.05/0.1/0.25 N hydrochloric acid, under slow magnetic stirring. To obtain good results with the method it is essential to use a high-quality, sensitive pH electrode, which shows a stabilized reading in less than 30 s.

2.1.1. Titration of Synthetic Solutions

To compare the results of the new developed algorithm with the previously published 5- and 8-point methods [8,11], six synthetic solutions with varying VFAT concentration (mg/L as CaCO3) and carbonate alkalinity concentration (mg/L as CaCO3) ratios were titrated using the 8-point titration procedure [11], which consists in it both the 5-point and the 2-point titration points (note that the VFA unit of concentration is shown here as mg/L as CaCO3, for calculating the VFA to carbonate alkalinity ratio using similar units). The VFAT concentration was 1 mM in all the synthetic solutions, simulating a dilution factor of 3.3 with deionized water (DIW) for an initial VFAT concentration of 200 mg/L as HAc. To substantiate the premise that the method is accurate for all VFAs that have a pKa value close to 4.75, a synthetic solution of butyric acid with a VFAT to alkalinity ratio of 0.31 and a VFAT concentration of 1 mM was also prepared and tested using the same method.

2.1.2. Titration of Anaerobic Liquor Solutions

The dilution of the sample was done inside the sealed container, using a large as possible solution volume to reduce the head space to a minimum, to restrict the CO2 mass that could potentially escape from the aqueous phase during the titration. Titrations were performed with an acid concentration of 0.05 N. The initial temperature and EC values are recorded prior to the titration. For detailed guidelines for sample collection and step-by-step execution of the procedure the reader is referred to the first section in the results and to Appendix A.

2.2. Interpretation Program

2.2.1. Synthetic Solutions

The measured parameters (temperature; EC; CT; dilution factor; initial solution volume and the acid concentration) and the titration results for each synthetic solution were plugged in the program developed by Lahav and Morgan, 2002 [11] and the new excel program developed in the current work. The Excel program can be downloaded from the Supplementary Material.

2.2.2. Anaerobic Liquors

All the measured parameters (temperature; EC; CT; NT; PT; dilution factor; initial solution volume and the acid concentration) and the titration results (two acid volumes and pH values) were plugged into a custom written excel function (see details of the VFA code in Appendix B) to yield the VFAT concentration (in M).

2.3. Calculating CT from the Knowledge of the CO2(g) Partial Pressure

To determine the CT concentration from the biogas-CO2 partial pressure, the PHREEQC [21] software was used (database = phreeqc.dat). The solution characteristics were plugged into the initial solution sheet and the inorganic carbon (CT) was set to equilibrate with the measured partial pressure (Pp) of CO2(g) in the biogas. The initial solution CT was set at equilibrium with a given CO2 Pp and only the speciation results of the solution were used. The Excel program can be downloaded from the Supplementary Material.

2.4. Sample Preparation and Analyses

2.4.1. Sample Preparation

Synthetic solutions: sodium acetate, butyric acid and sodium bicarbonate were used to simulate the VFAT and carbonate alkalinity, respectively. The VFAT concentration was determined prior to addition of the carbonate alkalinity using TOC analyzer and Gran’s titration for total alkalinity. CT was determined using a TOC analyzer. All the chemicals were of analytical grade, salts were dried at 60 °C overnight and kept in a desiccator prior to use.
Anaerobic liquor: (1) for the VFAT analysis: samples of anaerobic digester liquor were centrifuged (6000 rpm for 20 min), filtered through a No. 1 Whatman filter paper and refrigerated (4 °C) until analysis and (2) CT, NT and PT determination: samples of the anaerobic digester liquor were immediately centrifuged at 6000 RPM for 20 min after sampling and the clear supernatant was diluted (1:250) and filtered via a 45 μm syringe filter.

2.4.2. Analyses

Analyses: Ammonia was determined using the salicylate method [22]. Phosphate was determined using the metol method [23]. Inorganic carbon concentration (CT) was determined by a Sievers M5310C (Suez Water Technologies, Boulder Co, USA) TOC Analyzer with a detection range of 0.04–50 mg/L. pH, temperature and electrical conductivity (EC) were measured using a Metrohm 914 pH meter equipped with a pH electrode with a Pt1000 sensor (Unitrode with Pt1000, Metrohm) and an EC electrode (conductivity measuring cell, Metrohm).
Statistical analyses: All the empirical results were analyzed statistically by JMP Pro®, SAS Institute Inc. α = 0.05 was used in all calculations.

3. Results and Discussion

3.1. Comparison of the Newly Developed Algorithm to Previous Titration Methods Using Synthetic Solutions

Table 2 presents the titration results and relative error (%) obtained with three titration methods, as compared to a known VFAT and CT concentrations, at six VFAT to alkalinity dimensionless ratios (mg/L as CaCO3 to mg/L as CaCO3).
Table 2 shows that all the three methods yield accurate results down to VFAT/alkalinity ratio of 0.12 (relative error of 4.5%) while when the ratio dropped to 0.1, the relative error rose to 10%. The reason for the drop in accuracy at the low ratios stems from the fact that even a small error in the analysis of the (high) CT concentration yield a high error in the (low) VFAT concentration. To overcome this inherent drawback, the user is advised to spike the solution with an accurate volume of sodium acetate solution, to increase the ratio to above 0.2. This will ensure the accuracy of the results (in all three methods). At the end of the procedure the known dosed concentration should be subtracted from the result. To make sure that the obtained results are accurate, the user should follow the following guidelines: (1) the VFAT concentration in the titrated solution should be at least one 1 mM (i.e., 60 mg/L as CH3COOH); (2) if the VFAT concentration is lower than 60 mg/L, it is suggested to spike the solution with a known concentration of acetic acid to attain at least 1 mM while also keeping in mind the VFAT/alkalinity ratio (note that you will need to add the volume of the dosed acetic acid to the total volume, correct the PT and NT concentrations, etc.) and (3) an initial titration can be performed to assess the volume of acid required to reach the two pH points. The titration after that can be faster thereby reducing the potential change in CT due to CO2 release from the solution to the beaker’s headspace; (4) the volume of the titrated acid is crucial to the accurate execution of the method. Choose an acid concentration that will allow for at least 2 mL of titrant between the two pH points. More guidelines and instructions appear in Appendix A.

3.2. Application of the New Method on Four (Raw and Spiked) Anaerobic Digester Liquors

Figure 2 shows the VFAT concentrations (average of triplicate measurements with lower and upper 95% confidence intervals) obtained by the proposed method upon its execution on four types of both thermophilic (Shafdan, Acre) and mesophilic (Haifa) anaerobic digestion waters treating sludge from a municipal WWTP and another set of measurements performed on a mesophilic anaerobic digester treating winery wastes (Zichron). In all cases the raw water was diluted to obtain a solution with an alkalinity concentration in the range 300–400 mg/L as CaCO3; CT (and also NT and PT) was determined by external analysis and two titration points were executed. The raw results of all the analyses are listed in Table A1, Table A2, Table A3 and Table A4 in Appendix C. As shown in Figure 2, the method was found to be very accurate (an average error lower than 1.5%, relative to the expected, spiked values) in determining the VFAT concentration of the spiked samples, and also in predicting (via extrapolation of the spiked samples’ results) the raw-water VFAT concentration (compare the free term in the linear regression equations with the raw VFAT results that appear in Table 3). The slope of all four linear regression equations is very close to 1 (with p value < 0.01), demonstrating the accuracy of the method. The raw VFAT concentration in two of the solutions (the mesophilic reactors, Haifa and Zichron) was lower, with concentrations of 12 and 28 mg/L as HAc, respectively, while in the thermophilic reactors (Shafdan and Acre) the recorded concentrations were 250 and 580 mg/L as HAc, respectively. The results that appeared in Figure 2 were obtained by plugging the measured CT, NT and PT concentrations into Equation (5), in addition to the results of the two titration points. Table 3 lists the VFAT results that were returned by Equation (5) when PT and NT were neglected (i.e., assuming that both concentrations are zero). As shown, the resulting difference was not larger than 5% when the VFAT concentration was higher than 5 mM. When the VFAT concentration was increased to concentrations commonly perceived to be of concern (>8 mM) to the stability of anaerobic digesters, the error induced by neglecting NT and PT dropped to 1–5%. Most importantly for VFAT concentration control purposes, the slope of the increase in the VFAT concentrations remained the same when PT and NT were neglected, which means that, although from a global perspective less accurate VFAT results were obtained, the method continues to serve its main purpose, which is to alert the operator on a possible decline in the methanogenic bacteria activity.

3.3. Determining VFAT Using CT Values Estimated from CO2(g) Partial Pressure Values Measured in the Biogas

TOC analyzers may not be available in the (often) rudimentary laboratories that operate within WWTPs. Since the knowledge of CT is obligatory for executing the presented method, the authors warmly suggest that such device would be available. However, in its absence, CT can be estimated via a simulation program (PHREEQC or a similar tool) from the knowledge of the CO2(g) partial pressure in the biogas, which is measured routinely in many anaerobic digesters, in addition to the electrical conductivity, pH and temperature prevailing in the anaerobic digester liquor. Such calculation relies on two assumptions: (1) the aqueous phase in the reactor is completely mixed and (2) the aqueous phase tends towards equilibrium with the biogas. The two assumptions, although reasonable, are clearly not entirely correct, but for the purpose of estimating CT for use in the suggested method, our hypothesis was that the emanating error would be relatively low, and more importantly, the trend in the increase in the VFAT concentration can be expected to be obtained accurately regardless of the inaccuracy in the nominal VFAT concentrations, which is sufficient for raising a red flag in the case of an alarming rise in the VFAT concentration. To assess whether such estimation is valid, seven anaerobic digesters in the Shafdan WWTP and one in the Acre WWTP were sampled for the percentage of CO2(g) and the overall pressure in the (dry) biogas, along with the required parameters (pH, EC and temperature) in the aqueous phase. PHREEQC was used to calculate the CT concentrations from these data, and these were compared with measured CT values obtained from the same samples via a TOC-based analysis. The results are presented in Table 4, which shows that the CT values obtained from the calculations were very close to the TOC-measured CT (an average difference of 0.4% and STDV of 2.8%). Such deviations in the CT concentration can be expected to yield only a small error in the computed VFAT concentration of several tens of mgHAc/L at the maximum, which translates into inconsequential error in VFAT when the measured concentration was high (e.g., 8 mM). It can be hence concluded that estimating the CT value via the CO2(g) partial pressure and its use within Equation (5) is a viable method for determining the trend of the VFAT concentration, despite the slightly lower accuracy.

4. Conclusions

A new, titration-based, simple to execute and accurate analytical method for VFAT analysis in anaerobic digester waters is presented and verified. The method differs from previous techniques by the fact that the total inorganic carbon concentration is analyzed on the same sample, but by an external method, preferably using a TOC analyzer. The titration method consists of only two points, carried out to pH values in the vicinity of pH 5.25 and pH 4.25. The buffer capacity area between these pH values is dominated by the VFAT and carbonate weak-acid systems, with only a minor effect of the ammonia and orthophosphate systems, hence these weak-acid systems can be neglected in the analysis without significant loss of accuracy, particularly when the VFAT concentration is high (VFAT > 8 mM). The method was shown to yield results that are comparable with the 5-point and 8-point methods in terms of accuracy and reproducibility. The method was further tested on four anaerobic liquors and was shown to yield accurate and consistent results, with both raw and spiked samples. The inclusion of the orthophosphate (and to a lesser extent the ammonia) concentration increases the obtained accuracy, however if these are not known, the loss of accuracy is inconsequential (not more than a few percent) when the VFAT concentration reaches values of concern. A PHREEQC-based procedure was developed for estimating the total inorganic carbon concentration based on the measured partial pressure of CO2 in the biogas, for possible use in the case that a direct CT analysis is not available. This technique was shown to yield accurate CT values with an average error of 0.4% ± 2.8%. The resulting VFAT computation may only slightly deviate from the correct value, indicating that this approximated technique is valid for determining the VFAT trend, and hence adequate as a monitoring tool for the performance of anaerobic digesters. This said, for obtaining the most accurate and reliable VFAT results the writers recommend using externally measured CT and PT values. NT can be neglected altogether because its effect on the VFAT value is almost negligible. The presented method is ideal for use by researchers working on anaerobic processes, but it is also appropriate as a routine tool for controlling full-scale anaerobic digesters. The Excel-based interpretation program and the PHRREQC-based procedure for estimating CT from Pp (CO2) can be downloaded from the Supplementary Material.

Supplementary Materials

The Excel program and installation instructions are available for download from https://www.mdpi.com/article/10.3390/chemengineering5020015/s1.

Author Contributions

P.N.: Methodology, Data curation, Writing—original draft, Visualization, Validation, Writing—review and editing, Software. Y.G.: Methodology, Data curation, Project administration, Validation, Writing—original draft, Visualization, Writing—review and editing, Software. Y.A.: Validation, Writing—review and editing, Formal analysis. O.L.: Conceptualization, Writing—original draft, Supervision, Writing—review and editing, Visualization. All authors have read and agreed to the published version of the manuscript.

Funding

This research received no external funding.

Acknowledgments

The authors wish to acknowledge the great help made available by the operating staff at Shafdan, headed by Eng. Efrat Kohen.

Conflicts of Interest

The authors declare no conflict of interest.

Appendix A. Detailed Instructions for Performing the Analytic Procedure

The suggested two-point titration technique for VFA analysis consists of three main steps: sampling, sample preparation and titration.
CO2 is highly supersaturated in anaerobic digesters. This means that when samples are collected the water has a strong tendency release CO2(g) to the atmosphere. This may cause an error in both the pH measurement (release of CO2 raises the pH) and in the TOC analysis applied for determining the inorganic carbon concentration (CT). It is therefore crucial to perform the initial pH measurement at the sampling point and to take measures to collect the sample for analysis with minimal CO2 loss. After collecting the liquor, the sampling container should be filled to the rim (no headspace) and sealed.

Appendix A.1. pH and Temperature Measurement at the Sampling Point

1. To determine accurately the pH value and the temperature of the digester liquor, pH and temperature measurement should be performed as follows:
2. Fill the measuring beaker continuously from the sampling point, while letting the outlet tube fill the beaker from the bottom.
3. Place the pH electrode and the temperature sensor at the bottom of the beaker, close to the outlet of the water.
Take the value after the electrode has completely stabilized.

Appendix A.2. Sampling and Sample Preparation

The high concentration of suspended solids in the solution influences the measurement of the initial EC and pH values. To avoid this error, the samples for the VFA titration should be centrifuged (6000 rpm for 20 min) prior to performing the method.
To minimize CO2(g) release, the sampling should be performed directly into the test tubes that are inserted into the centrifuge machine. Sampling should be performed as follows:
  • Fill the test tube slowly, by letting the liquor outlet tube fill the test-tube from its bottom.
  • Let the liquor to overflow for at least one volume of the test tube and then seal the tube tightly.
  • After the centrifuge step, the test tubes kept closed until the titration.
  • Only the supernatant part of the centrifuge step is used in the titration.
  • If CT analysis is carried out using a TOC analyzer, the centrifuge supernatant should be sampled for this purpose.

Appendix A.3. Titration

The following set of conditions must be met for attaining stable and accurate results:
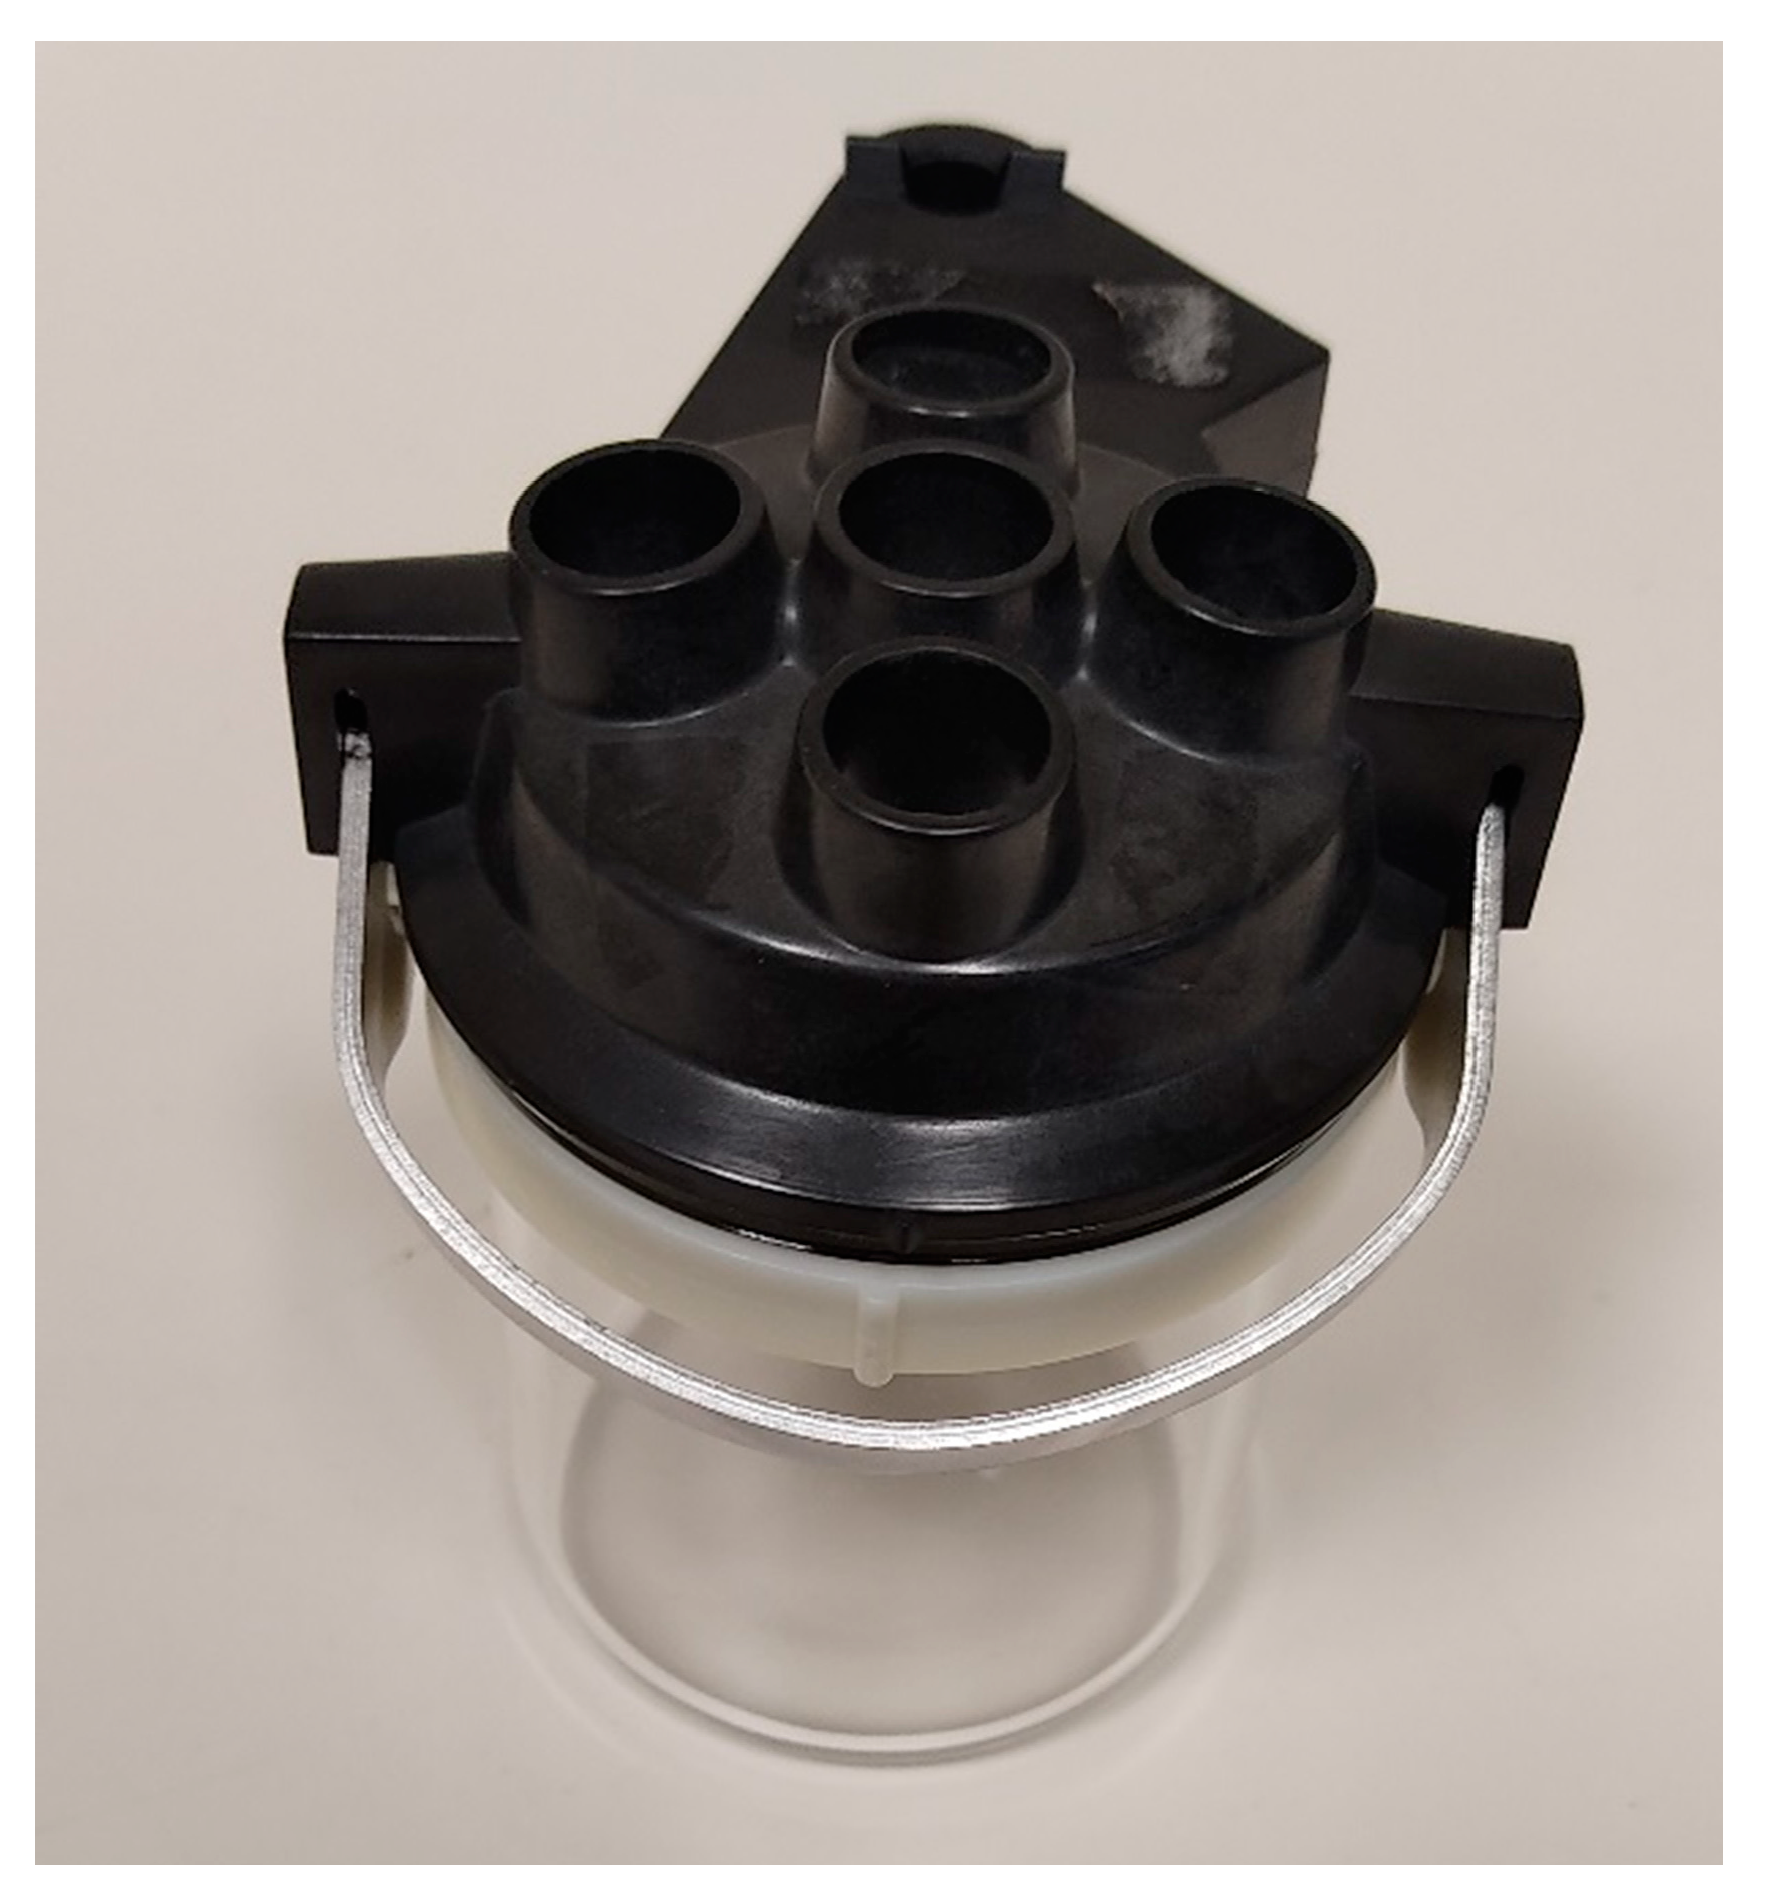
  • The titration must be performed in a sealed, gently magnetically stirred beaker (see Figure A1).
  • The inlet holes for the pH and EC electrodes and for the acid tube or burette should be sealed as tightly as possible.
  • Only analytical grade acid (HCl) ampules of a known concentration (diluted to a concentration of 0.05–0.2 eq/L) should be used.
  • The pH and EC electrodes must be calibrated and be in a good working condition.
  • From experience, to obtain accurate results, the alkalinity of the titrated solution (after dilution) should be around 300–400 mg/L as CaCO3. The sample should be diluted to meet this condition.
  • A minimal head space should be left in the sealed beaker for allowing the addition of acid with a small safety margin.
The titration procedure:
  • Place the required volume of deionized water for the required dilution in the beaker.
  • Close the beaker cover. Insert the EC and pH electrodes in their designated inlet holes.
  • Gently open the centrifuged test tube and take the required volume of the supernatant by using a pipette.
  • Insert the volume of sample below the water level (to minimize CO2 losses) through the inlet hole of the acid tube or burette in the cap of the sealed beaker.
  • Place the acid tube or burette in place.
  • Wait for the pH reading to stabilize.
  • After stabilization, register the EC and temperature values (the temperature can be measured via the EC or pH meters).
  • Start titrating the strong acid to pH = 5.25. Register the exact pH that was reached and the volume of strong acid that was titrated. These measurements are marked pHX1 and VX1, respectively.
  • Continue titrating the strong acid to pH = 4.25. Register the exact pH reached and the cumulative volume of strong acid up to that pH point. These measurements are marked pHX2 and VX2, respectively.
Figure A1. A sealed beaker with inlet holes for electrodes and for the acid titration tubing.
Chemengineering 05 00015 g0a1

Appendix B. The Code Used for Calculating VFAT from the Acquired Data

The following algorithm was written in VBA, to create an Excel function:
Function VFA (pHx1, pHx2, Vx1, Vx2, Temp, EC, CT, NT, PT, Dilution, Vs, Ca)
Dim gamma_m, gamma_d, gamma_t, kc1, kc2, kN, kp1, kp2, kp3, kA, Hx1, Hx2 As Double
Hx1 = 10 ^ (−1 * pHx1)
Hx2 = 10 ^ (−1 * pHx2)
‘literature data for equilibrium constants’
Hcarbon1 = 7700
Hcarbon2 = 14,900
Hammonia = 52,210
Hphosphate1 = −8000
Hphosphate2 = 4200
Hphosphate3 = 14,700
Hacetic = −200
Hwater = 55,830
Rgas = 8.314
pkc1 = 6.375
pkc2 = 10.335
pkN = 9.25
pkp1 = 2.12
pkp2 = 7.2
pkp3 = 12.7
pkA = 4.75
pkw = 14
‘Transforming the equilibrium constants to observed’
I = EC * (2.5 * 10 ^ −5) * 670
gamma_m = 10 ^ (−1.82 * (10 ^ 6) * ((78.3 * (Temp + 273.15)) ^ (−1.5)) * 1 * (((I ^ 0.5)/(1 + (I ^ 0.5))) − 0.2 * I))
gamma_d = 10 ^ (−1.82 * (10 ^ 6) * ((78.3 * (Temp + 273.15)) ^ (−1.5)) * 4 * (((I ^ 0.5)/(1 + (I ^ 0.5))) − 0.2 * I))
gamma_t = 10 ^ (−1.82 * (10 ^ 6) * ((78.3 * (Temp + 273.15)) ^ (−1.5)) * 9 * (((I ^ 0.5)/(1 + (I ^ 0.5))) − 0.2 * I))
kc1 = ((10 ^ (−1 * pkc1)) * Exp (−1 * Hcarbon1 * ((1/(273.15 + Temp)) − (1/298))/Rgas))/gamma_m
kc2 = ((10 ^ (−1 * pkc2)) * Exp (−1 * Hcarbon2 * ((1/(273.15 + Temp)) − (1/298))/Rgas)) * gamma_m/gamma_d
kN = ((10 ^ (−1 * pkN)) * Exp (−1 * Hammonia * ((1/(273.15 + Temp)) − (1/298))/Rgas)) * gamma_m
kp1 = ((10 ^ (−1 * pkp1)) * Exp (−1 * Hphosphate1 * ((1/(273.15 + Temp)) − (1/298))/Rgas))/gamma_m
kp2 = ((10 ^ (−1 * pkp2)) * Exp (−1 * Hphosphate2 * ((1/(273.15 + Temp)) − (1/298))/Rgas)) * gamma_m/gamma_d
kp3 = ((10 ^ (−1 * pkp3)) * Exp (−1 * Hphosphate3 * ((1/(273.15 + Temp)) − (1/298))/Rgas)) * gamma_d/gamma_t
kA = ((10 ^ (−1 * pkA)) * Exp(−1 * Hacetic * ((1/(273.15 + Temp)) − (1/298))/Rgas))/gamma_m
kw = ((10 ^ (−1 * pkw)) * Exp(−1 * Hwater * ((1/(273.15 + Temp)) − (1/298))/Rgas))/gamma_m
‘species for alklalnity x1′
HCO3_x1 = (Hx1 * kc1 * CT * (Vs/(Vs + Vx1)))/(Dilution * (Hx1 * Hx1 + Hx1 * kc1 + kc1 * kc2))
CO3_x1 = (kc1 * kc2 * CT * (Vs/(Vs + Vx1)))/(Dilution * (Hx1 * Hx1 + Hx1 * kc1 + kc1 * kc2))
NH3_x1 = kN * NT * (Vs/(Vs + Vx1))/(Dilution * (kN + Hx1))
H2PO4_x1 = (Hx1 * Hx1 * kp1 * PT * (Vs/(Vs + Vx1)))/(Dilution * (Hx1 * Hx1 * Hx1 + Hx1 * Hx1 * kp1 + Hx1 * kp1 * kp2 + kp1 * kp2 * kp3))
HPO4_x1 = (Hx1 * kp1 * kp2 * PT * (Vs/(Vs + Vx1)))/(Dilution * (Hx1 * Hx1 * Hx1 + Hx1 * Hx1 * kp1 + Hx1 * kp1 * kp2 + kp1 * kp2 * kp3))
PO4_x1 = (kp1 * kp2 * kp3 * PT * (Vs/(Vs + Vx1)))/(Dilution * (Hx1 * Hx1 * Hx1 + Hx1 * Hx1 * kp1 + Hx1 * kp1 * kp2 + kp1 * kp2 * kp3))
OH_x1 = kw/Hx1
Alk_x1 = 2 * CO3_x1 + HCO3_x1 + 3 * PO4_x1 + 2 * HPO4_x1 + H2PO4_x1 + NH3_x1 + OH_x1 − Hx1
‘species for alklalnity x2′
HCO3_x2 = (Hx2 * kc1 * CT * (Vs/(Vs + Vx2)))/(Dilution * (Hx2 * Hx2 + Hx2 * kc1 + kc1 * kc2))
CO3_x2 = (kc1 * kc2 * CT * (Vs/(Vs + Vx2)))/(Dilution * (Hx2 * Hx2 + Hx2 * kc1 + kc1 * kc2))
NH3_x2 = kN * NT * (Vs/(Vs + Vx2))/(Dilution * (kN + Hx2))
H2PO4_x2 = (Hx2 * Hx2 * kp1 * PT * (Vs/(Vs + Vx2)))/(Dilution * (Hx2 * Hx2 * Hx2 + Hx2 * Hx2 * kp1 + Hx2 * kp1 * kp2 + kp1 * kp2 * kp3))
HPO4_x2 = (Hx2 * kp1 * kp2 * PT * (Vs/(Vs + Vx2)))/(Dilution * (Hx2 * Hx2 * Hx2 + Hx2 * Hx2 * kp1 + Hx2 * kp1 * kp2 + kp1 * kp2 * kp3))
PO4_x2 = (kp1 * kp2 * kp3 * PT * (Vs/(Vs + Vx2)))/(Dilution * (Hx2 * Hx2 * Hx2 + Hx2 * Hx2 * kp1 + Hx2 * kp1 * kp2 + kp1 * kp2 * kp3))
OH_x2 = kw/Hx2
Alk_x2 = 2 * CO3_x2 + HCO3_x2 + 3 * PO4_x2 + 2 * HPO4_x2 + H2PO4_x2 + NH3_x2 + OH_x2 − Hx2
‘calculation of the VFA concentration–results in molar’
AT = (Dilution * ((Vx2 − Vx1) * Ca + (Vs + Vx2) * Alk_x2 − (Vs + Vx1) * Alk_x1))/(((Vs * kA)/(kA + Hx1)) − ((Vs * kA)/(kA + Hx2)))
‘output of the total VFA concentration in molar’
VFA = AT
End Function

Appendix C. Raw Data Showing the Analytical Results Obtained with the Four Anaerobic Digester Liquors + Computational Results

Table A1. Results of Shafdan VFAT + spiking.
VFATpHx1Vx1pHx2Vx2TempECDilution[HCl]Spike VolumeTICPTNT
mg/L as HAc mL mL°CmS/cm NmLppmmg/L as Pmg/L as N
251.65.2208.5504.2889.44022.10.35238.000.050.009851491038
260.25.2788.6064.2729.60822.60.35238.000.050.009851491038
255.05.2768.5324.2599.53422.00.35238.000.050.009851491038
352.75.2608.4104.2609.47021.90.35238.010.050.049851491038
362.85.2698.2484.2549.36024.50.35838.010.050.0410001491038
363.45.2478.4204.2709.46222.40.35238.080.050.409851491038
455.85.3078.1224.2319.38823.00.35238.020.050.089851491038
461.55.3028.1304.2409.38623.50.35238.020.050.089851491038
474.15.2698.3544.2909.51022.90.35238.160.050.809851491038
607.55.2427.9064.2409.20024.80.35838.020.050.1210001491038
583.95.2858.1204.2599.43022.50.35238.240.051.209851491038
603.55.2708.1604.2479.48023.70.35238.240.051.209851491038
692.65.2727.8784.2669.25022.50.35238.030.050.169851491038
690.95.2718.0004.2649.37222.40.35238.320.051.609851491038
731.35.2328.0064.2429.37423.70.35238.320.051.609851491038
814.95.2677.8004.2749.26022.50.35238.400.052.009851491038
811.65.2397.8984.2759.30222.80.35238.400.052.009851491038
809.05.2307.8004.2639.20022.80.35238.400.052.009851491038
Table A2. Results of Haifa VFAT + spiking.
VFATpHx1Vx1pHx2Vx2TempECDilution[HCl]Spike VolumeTICPTNT
mg/L as HAc mL mL°CmS/cm NmLppmmg/L as Pmg/L as N
25.595.29.94.210.923.40.519.00.10.02.4207.2697.9
26.765.210.04.210.923.50.519.00.10.02.4207.2697.9
33.225.310.04.210.922.80.519.00.10.02.4207.2697.9
85.35.29.84.210.822.10.519.00.10.42.4207.2697.9
80.05.39.84.310.822.10.519.00.10.42.4207.2697.9
84.65.29.84.210.922.00.519.00.10.42.4207.2697.9
140.85.29.64.310.721.40.519.10.10.82.4207.2697.9
137.05.29.64.210.721.30.519.10.10.82.4207.2697.9
127.25.29.64.310.723.60.519.10.10.82.4207.2697.9
192.55.29.44.310.623.50.519.10.11.22.4207.2697.9
190.25.39.44.310.623.40.519.10.11.22.4207.2697.9
189.95.39.44.310.624.40.519.10.11.22.4207.2697.9
236.05.29.04.310.221.20.519.20.11.62.4207.2697.9
245.15.39.04.210.421.10.519.20.11.62.4207.2697.9
238.65.39.14.210.421.70.519.20.11.62.4207.2697.9
298.75.38.94.210.421.30.519.20.12.02.4207.2697.9
301.45.28.94.210.321.50.519.20.12.02.4207.2697.9
299.75.38.94.210.420.90.519.20.12.02.4207.2697.9
Table A3. Results of Zichron VFAT + spiking.
VFATpHx1Vx1pHx2Vx2TempECDilution[HCl]Spike VolumeTICPTNT
mg/L as HAc mL mL°CmS/cm NmLppmmg/L as Pmg/L as N
12.25.1427.6044.1948.28623.00.274419.00.050.0511.05
17.45.1617.6924.1818.41222.30.274419.00.050.0511.05
12.75.2367.6124.2248.39824.20.274419.00.050.0511.05
113.35.2527.2784.2378.25424.20.274419.10.050.7511.05
114.45.2307.3064.2048.27222.90.274419.10.050.7511.05
121.95.2387.2904.2448.25825.10.274419.10.050.7511.05
223.15.2337.0784.2428.19821.80.274419.10.051.4511.05
225.95.1897.0824.2198.16021.90.274419.10.051.4511.05
234.35.2327.0484.2488.18021.90.274419.10.051.4511.05
344.45.2406.7204.2288.08823.70.274419.20.052.1511.05
339.25.2386.7364.2438.07023.00.274419.20.052.1511.05
329.15.2366.7304.2288.07024.90.274419.20.052.1511.05
451.75.2556.4184.2337.99823.80.274419.30.052.8511.05
435.35.2426.4744.2477.97823.20.274419.30.052.8511.05
421.85.2416.4444.1778.02625.60.274419.30.052.8511.05
536.35.2576.1204.2447.84224.60.274419.40.053.5511.05
538.65.2466.1724.2457.86823.60.274419.40.053.5511.05
527.55.2426.1404.2237.85025.50.274419.40.053.5511.05
Table A4. Results of Acre VFAT + spiking.
VFATpHx1Vx1pHx2Vx2TempECDilution[HCl]Spike VolumeTICPTNT
mg/L as HAc mL mL°CmS/cm NmLppmmg/L as Pmg/L as N
583.15.2559.5764.22710.97420.30.77738.000.050.001170.7561.92927.2
593.55.2529.5424.20710.97020.90.77738.000.050.001170.7561.92927.2
576.65.2689.6224.23011.05422.90.77738.000.050.001170.7561.92927.2
699.35.2279.4964.23610.93821.90.77738.070.050.351170.7561.92927.2
706.15.2569.4344.24310.93622.30.77738.070.050.351170.7561.92927.2
692.75.2229.5584.25910.95922.40.77738.070.050.351170.7561.92927.2
789.45.2509.3744.24410.92620.90.77738.140.050.701170.7561.92927.2
775.45.2269.3444.18810.92023.30.77738.140.050.701170.7561.92927.2
838.65.2609.3524.28710.92422.90.77738.140.050.701170.7561.92927.2
904.15.2389.2144.22110.87020.70.77738.210.051.051170.7561.92927.2
922.15.2299.2184.25010.83822.10.77738.210.051.051170.7561.92927.2
905.85.2309.2424.25710.84022.00.77738.210.051.051170.7561.92927.2
999.25.2349.1264.24810.82622.10.77738.280.051.401170.7561.92927.2
1028.25.2279.1184.24610.83422.80.77738.280.051.401170.7561.92927.2
1010.35.1809.1264.18010.81822.60.77738.280.051.401170.7561.92927.2
1119.05.2128.9604.25910.69822.70.77738.350.051.751170.7561.92927.2
1116.45.2538.9304.26610.75022.50.77738.350.051.751170.7561.92927.2
1124.45.2248.9444.24410.73021.40.77738.350.051.751170.7561.92927.2

References

  1. Dilallo, R.; Albertson, O.E. Volatile Acids by Direct Titration. J. Water Pollut. Control Fed. 1961, 33, 356–365. Available online: http://www.jstor.org/stable/25034391 (accessed on 28 February 2021).
  2. McGhee, T.J. A method for approximation of the volatile acid concentrations in anaerobic digesters. Water Sew. Work. 1968, 115, 162–166. [Google Scholar]
  3. Chatterjee, B.; Radhakrishnan, L.; Mazumder, D. New approach for determination of volatile fatty acid in anaerobic digester sample. Environ. Eng. Sci. 2018, 35, 333–351. [Google Scholar] [CrossRef]
  4. Mu, Z.-X.; He, C.-S.; Jiang, J.-K.; Zhang, J.; Yang, H.-Y.; Mu, J. A modified two-point titration method for the determination of volatile fatty acids in anaerobic systems. Chemosphere 2018, 204, 251–256. [Google Scholar] [CrossRef]
  5. Sun, H.; Wu, S.; Dong, R. Monitoring Volatile Fatty Acids and Carbonate Alkalinity in Anaerobic Digestion: Titration Methodologies. Chem. Eng. Technol. 2016, 39, 599–610. [Google Scholar] [CrossRef]
  6. Zan, F.; Zeng, Q.; Chi, K.; Hao, T.; Ekama, G.A. A novel approach for rapidly measuring volatile fatty acids in anaerobic process. Water Res. 2020, 182, 115960. [Google Scholar] [CrossRef] [PubMed]
  7. Jenkins, S.; Morgan, J.; Sawyer, C. Measuring Anaerobic Sludge Digestion and Growth by a Simple Alkalimetric Titration. J. Water Pollut. Control Fed. 1983, 55, 448–453. Available online: http://www.jstor.org/stable/25041903 (accessed on 28 February 2021).
  8. Moosbrugger, R.E.; Wentzel, M.C.; Ekama, G.A.; Marais, G.V.R. A 5 pH Point Titration Method for Determining the Carbonate and SCFA Weak Acid/Bases in Anaerobic Systems. Water Sci. Technol. 1993, 28, 237–245. [Google Scholar] [CrossRef]
  9. Buchauer, K. A comparison of two simple titration procedures to determine volatile fatty acids in influents to waste-water and sludge treatment processes. Water SA 1998, 24, 49–56. [Google Scholar]
  10. Münch, E.v.; Greenfield, P.F. Estimating VFA concentrations in prefermenters by measuring pH. Water Res. 1998, 32, 2431–2441. [Google Scholar] [CrossRef]
  11. Lahav, O.; Morgan, B.E.; Loewenthal, R.E. Rapid Simple and Accurate Method for Measurement of VFA and Carbonate Alkalinity in Anaerobic Reactors. Environ. Sci. Technol. 2002, 36, 2736–2741. [Google Scholar] [CrossRef] [PubMed]
  12. Fernández, R.; Dinsdale, R.M.; Guwy, A.J.; Premier, G.C. Critical analysis of methods for the measurement of volatile fatty acids. Crit. Rev. Environ. Sci. Technol. 2016, 46, 209–234. [Google Scholar] [CrossRef]
  13. Charnier, C.; Latrille, E.; Lardon, L.; Miroux, J.; Steyer, J.P. Combining pH and electrical conductivity measurements to improve titrimetric methods to determine ammonia nitrogen, volatile fatty acids and inorganic carbon concentrations. Water Res. 2016, 95, 268–279. [Google Scholar] [CrossRef] [PubMed]
  14. Sun, H.; Guo, J.; Wu, S.; Liu, F.; Dong, R. Development and validation of a simplified titration method for monitoring volatile fatty acids in anaerobic digestion. Waste Manag. 2017, 67, 43–50. [Google Scholar] [CrossRef] [PubMed]
  15. Ripley, L.E.; Boyle, W.C.; Converse, J.C. Improved Alkalimetric Monitoring for Anaerobic Digestion of High-Strength Wastes. J. Water Pollut. Control Fed. 1986, 58, 406–411. Available online: http://www.jstor.org/stable/25042933 (accessed on 28 February 2021).
  16. Benjamin, M.M. Water Chemistry, 2nd ed.; McGraw-Hill: New York, NY, USA, 2002. [Google Scholar]
  17. Lahav, O.; Morgan, B.E. Titration methodologies for monitoring of anaerobic digestion in developing countries—A review. J. Chem. Technol. Biotechnol. 2004, 79, 1331–1341. [Google Scholar] [CrossRef] [Green Version]
  18. Lahav, O.; Birnhack, L. Aquatic Chemistry, 1st ed.; De Gruyter: Berlin, Germany, 2019. [Google Scholar] [CrossRef]
  19. Moragaspitiya, C.; Rajapakse, J.; Millar, G.J.; Ali, I. Optimization of mesophilic anaerobic digestion of a conventional activated sludge plant for sustainability. Alex. Eng. J. 2019, 58, 977–987. [Google Scholar] [CrossRef]
  20. Mehta, C.M.; Latif, M.A.; Bastrone, D.J. Improved phosphorus solubility during acidic anaerobic digestion. In Proceedings of the AWA Biosolids Conference, Melbourne, Australia, 25–27 June 2014; p. 60. [Google Scholar]
  21. Charlton, S.R.; Parkhurst, D.L. Modules based on the geochemical model PHREEQC for use in scripting and programming languages. Comput. Geosci. 2011, 37, 1653–1663. [Google Scholar] [CrossRef]
  22. Willis, R.B.; Montgomery, M.E.; Allen, P.R. Improved Method for Manual, Colorimetric Determination of Total Kjeldahl Nitrogen Using Salicylate. J. Agric. Food Chem. 1996, 44, 1804–1807. [Google Scholar] [CrossRef]
  23. McGregor, A.J. A colorimetric modification of McLean’s method for the determination of phosphorus in soils. J. Sci. Food Agric. 1950, 1, 105–107. [Google Scholar] [CrossRef]
Figure 1. Buffer intensity curves for the various weak acid systems typically present in anaerobic digestion solutions at the pH range relevant for the titration procedure suggested in this work. Three total volatile fatty acids (VFAT) and PT values and one CT (51.1 mM) and NT (32.1 mM) values were considered (EC = 6 mS/cm, Temp = 25 °C).
Chemengineering 05 00015 g001
Figure 2. VFAT results obtained from applying the method to four (spiked) anaerobic digestion liquors ((a): ●—Shafdan WWTP; —Haifa WWTP; and (b): ▲—Acre WWTP; —Zichron winery digester).
Chemengineering 05 00015 g002
Table 1. The error induced in VFAT calculation (Equation (5)) by neglecting the alkalinity components related to the ammonia and orthophosphate weak-acid systems.
NT = 450 mg/L
PT = 100 mg/L
NT = 450 mg/L
PT =150 mg/L
NT = 450 mg/L
PT = 200 mg/L
VFAT (mM)VFAT (mM) Calculated by Neglecting NT and PTErrorVFAT (mM) Calculated by Neglecting NT and PTErrorVFAT (mM) Calculated by Neglecting NT and PTError
22.136.8%2.210.2%2.2713.5%
55.132.7%5.24.0%5.275.4%
88.131.7%8.22.5%8. 273.3%
1010.131.3%10.22.0%10. 272.7%
Table 2. Titration results of six synthetic solutions and the simulated butyric acid solution, showing the calculated VFA concentration and relative error (%), as interpreted by the three titration algorithms.
VFAT/AlkalinityDilutionVFAT *5-Point Method8-Point Method2-Point Method
mg/L as HAcmg/L as HAc
Relative Error
mg/L as HAc
Relative Error
mg/L as HAc
Relative Error
0.493.459.3 ± 0.1259.6 ± 0.761.2 ± 1.0259.1 ± 0.32
0.5%3.1%−0.4%
0.333.459.3 ± 0.1259.4 ± 0.860.1 ± 0.8659.9 ± 0.77
0.2%1.3%1.0%
0.263.655.3 ± 1.2154.8 ± 0.5755.7 ± 0.956.5 ± 1.78
−0.8%0.9%2.3%
0.203.459.3 ± 0.1259.6 ± 1.2360.5 ± 1.0959.6 ± 0.96
0.5%1.9%0.4%
0.123.852.5 ± 0.0454.6 ± 0.3155 ± 0.1654.9 ± 0.51
4.1%4.8%4.5%
0.103.459.3 ± 0.1253.9 ± 4.0753.9 ± 4.253.1 ± 3.18
−9.1%−9.1%−10.5%
Butyric acid
0.31
3.459.3 ± 1.858.7 ± 0.17
−0.9%
60.8 ± 0.7
2.7%
58.8 ± 0.63
−0.8%
* The VFAT concentration was verified using TOC analysis (no other organic species were present in this solution) and by applying the Gran titration (3 titration points to below pH2.7), which is accurate in the absence of the carbonate system.
Table 3. Estimation of the error obtained in VFAT’s calculation when NT and PT are ignored (=0).
Sample #Calculated with Measured NT, PT
(mg/L as HAc)
Calculated with NT and PT = 0
(mg/L as HAc)
Relative Error (%)
Shafdan raw255.6 ± 3.55266.5 ± 3.844.3%
Shafdan spiked 1359.6 ± 4.93370.7 ± 53.1%
Shafdan spiked 2463.8 ± 7.64475.3 ± 7.42.5%
Shafdan spiked 3598.3 ± 10.34609.5 ± 10.261.9%
Shafdan spiked 4705 ± 18.65716 ± 18.511.6%
Shafdan spiked 5811.8 ± 2.43822.7 ± 2.591.3%
Haifa raw28.5 ± 3.3543.6 ± 3.3853%
Haifa spiked 183.3 ± 2.3498.1 ± 2.1718%
Haifa spiked 2135 ± 5.74149.7 ± 5.5311%
Haifa spiked 3190.9 ± 1.16206 ± 1.068%
Haifa spiked 4239.9 ± 3.83254.7 ± 4.216%
Haifa spiked 5300 ± 1.12314.8 ± 0.815%
Acre raw584.4 ± 6.95590.5 ± 6.81%
Acre spiked 1699.4 ± 5.48705.4 ± 5.571%
Acre spiked 2801.1 ± 27.09807.3 ± 27.231%
Acre spiked 3910.7 ± 8.15916.6 ± 8.191%
Acre spiked 41012.6 ± 11.961018.5 ± 121%
Acre spiked 51119.9 ± 3.341126 ± 3.21%
Table 4. Comparison of results of TOC-measured vs. estimated CT values obtained from the knowledge of the CO2 percentage in the biogas.
ReactorCO2 in Dry BiogaspHECTempTOC-Measured CTCO2 Pp-Calculated CTError
%-mS/cm°CmMmM%
Shafdan 138.07.288.0152.479.384.7+6.8%
Shafdan 238.17.277.9953.282.181.6−0.7%
Shafdan 338.07.277.7352.483.082.9−0.1%
Shafdan 538.27.267.8953.177.679.6+2.5%
Shafdan 638.27.277.8953.780.180.10.0%
Shafdan 717.67.709.3253.796.797.3+0.6%
Shafdan 821.17.649.4054.2101.698.9−2.7%
Acre East29.37.469.0952.197.5101.7+4.4%
Publisher’s Note: MDPI stays neutral with regard to jurisdictional claims in published maps and institutional affiliations.

