Article

Insights from Mathematical Modelling into Process Control of Oxygen Transfer in Batch Stirred Tank Bioreactors for Reducing Energy Requirement

Process & Chemical Engineering, School of Engineering, University College Cork, T12 K8AF Cork, Ireland
*
Author to whom correspondence should be addressed.
ChemEngineering 2020, 4(2), 34; https://doi.org/10.3390/chemengineering4020034
Submission received: 14 April 2020 / Revised: 17 May 2020 / Accepted: 25 May 2020 / Published: 26 May 2020
(This article belongs to the Special Issue Bio-Processing and Biochemical Engineering)

Abstract

:
Significant energy savings can be made in aerobic stirred tank batch bioreactors by the manipulation of agitator power (Pag) and air flowrate per unit working volume (vvm). Control is often implemented to maintain the oxygen concentration in the bioreaction liquid (COL) at a constant value. This work used model simulations to show that controlling the Pag and vvm continuously over time, such that it is operated at or near the impeller flooding constraint results in the minimum energy requirement for oxygen transfer (strategy Cmin); however, this might prove impractical to control and operate in practice. As an alternative, the work shows that dividing the bioreaction time into a small number of constant Pag time segments (5–10), where a PID controller is used to control vvm to maintain COL constant in each segment, can achieve much of the energy saving that is associated with Cmin. During each time segment, vvm is increased and a sudden decrease in COL is used to detect the onset of flooding, after which there is a step increase in Pag. This sequence of Pag step increases continues until the bioreaction is completed. This practical control approach was shown to save most of the energy that is associated with Cmin.

1. Introduction

In aerobic bioreactors, oxygen is critical for microbial activity and it can easily become rate limiting, thus continuous supply is required [1]. In aerobic batch stirred tank bioreactors, the oxygen uptake rate (OUR) of the micro-organisms will vary over the batch bioreaction time and an aeration system is required to supply a sufficient oxygen transfer rate (OTR) to satisfy the OUR of the micro-organisms. This typically consists of an air compressor to provide air that enters as bubbles and a mechanical agitator that greatly improves the oxygen transfer rate (OTR). Many studies have shown how agitation and air flowrate influence OTR and, in turn, influence cell growth and the production of metabolites [2,3,4,5,6,7,8,9].
For stirred tank aerobic bioreactors, the aeration system is energy intensive with energy being required for the air compressor and mechanical agitator. This represents a significant cost in aerobic bioreactors [10] and contributes to the environmental impact that is associated with the consequential carbon footprint of the bioreactors. When considering this, it is becoming increasingly important to reduce cost [11] and carbon footprint by using energy more efficiently. Proper equipment selection, such as the selection of impeller type and impeller dimensions [12,13,14], can reduce aeration system energy and associated costs and carbon footprint. Hydrodynamics will strongly influence the rate of oxygen mass transfer [15,16,17,18] in a given stirred bioreactor. The agitator mechanical power input (Pag) and air volumetric flowrate (FG) are under direct operational control and can be manipulated to produce a volumetric mass transfer coefficient (kLa) that can provide sufficient OTR to meet the OUR. Reducing aeration system energy requirement can be achieved by optimal operation of Pag and FG [12,19,20,21].
Process control can improve the performance of bioreactors [22,23,24,25,26]. The control of Pag and FG is used to control the oxygen transfer rate in aerobic bioreactors. A commonly used practical control strategy is to measure the oxygen concentration in the bioreaction liquid and use this information to vary FG and/or Pag throughout the bioreaction, so as to maintain the oxygen concentration close to a constant value. Many combinations of the two can potentially deliver the same OTR that satisfies the OUR required in order to maintain a constant oxygen concentration [20]. When the total agitator and compressor energies are summed over the duration of the bioreaction, the total energy requirement that is associated with each combination will vary. Consequently, this presents an opportunity to reduce energy by manipulating and controlling Pag and/or FG throughout the bioreaction to provide an OTR that satisfies the OUR requirement while using less total energy [19,20,27]. Furthermore, it represents an opportunity to minimise total energy by determining the combinations of Pag and FG over the bioreaction time that minimises the total energy requirement.
Some studies have shown that operating at or close to the onset of flooding throughout the bioreaction can minimise the total energy requirement. Kreyenschulte et al. [28] developed a computation tool for assessing aeration system energy demand at the large-scale. For bioreactor volumes of 20 m3 and larger using conventional agitators, they showed that the minimum energy consumption was achieved by operating close to the onset of flooding. Fitzpatrick et al. [29] performed a mathematical modelling study, which showed that energy was minimised by operating at or close to the onset of flooding. Of course, this approach to energy reduction might be limited by other constraints, such as foaming and use of antifoams, the production of carbon dioxide, and damage to cells [18,30]. The shear sensitivity of mammalian cells will influence the selection of air spargers and impellers, and will limit air flowrates and the specific power input of agitators [18].
This work focusses on bioreactor process control to achieve energy reduction/minimisation for oxygen transfer in a batch stirred tank aerobic bioreactor. A bioreaction model is used to simulate a bioreaction and the only output variable that is used by the process controller is the oxygen concentration in the bioreaction liquid. The objective is to investigate the application of PID process control to manipulating FG and/or Pag, so that the energy for oxygen transfer is reduced or minimised, while also maintaining the oxygen concentration at a constant value.

2. Mathematical Modelling and Aeration System Control Strategies

2.1. Mathematical Modelling

The bioreactor simulated in this study had a working volume of 20 m3. A six bladed Rushton turbine impeller was used with a standard design configuration. The mathematical models, along with relevant parameter values, used for bioreaction kinetics, OUR, OTR, agitator, and compressor power requirements, phase equilibrium, and flooding constraints have already been presented in this journal by Fitzpatrick et al. [29], based on previous work that was conducted by the group.

2.2. Aeration System Control Strategies

A commonly used practical control strategy is to maintain the oxygen concentration in the bioreaction liquid (COL) at a constant value, by controlling FG (or vvm) and/or Pag throughout the bioreaction. This strategy is applied in this work (in this work, the parameter vvm is used instead of FG, because it is commonly used. vvm is defined as ( v v m = F G / V L ) , where VL is the bioreactor working volume. vvm is expressed in the units of minutes−1).
A numerical method approach was applied, whereby the bioreaction kinetics and oxygen transfer modelling were used to simulate the bioreaction. In particular, it was applied to calculate COL at each time step during the bioreaction, as illustrated in Figure 1, and to evaluate the agitator and compressor electrical power/energy requirements. A PID control algorithm was applied to vary the value of vvm (and Pag) throughout the fermentation to maintain COL around a constant specified value (this is referred to as strategy C). The time step used in the numerical method approach was 10−4 h or 0.36 s. The computations were implemented in Matlab (MathWorks, Natick, MA, USA).
There are a number of sub-strategies within strategy C which were investigated. Initially, Pag was kept constant and vvm was varied throughout the fermentation (this is referred to as strategy C1). Subsequently, from an oxygen transfer energy perspective, it is shown that dividing the bioreaction time up into two or more time segments with different constant Pag values, where vvm is varied in each time segment, might result in major energy savings (this is referred to as strategy C1-N, where N is the number of time segments).
Further, it is shown that there is a Pag-vvm combination profile over time that minimises the total electrical energy that is required for strategy C. This is referred to as strategy Cmin. It is shown that the optimal Pag-vvm combinations often occur at the onset of the flooding constraint. Consequently, from a control perspective, it is important to able to detect the onset of flooding from the COL data only. This is integrated into the C1-N control strategy, in particular, and it is referred to as strategy C1F-N.

3. Results and Discussion

3.1. Bioreaction Progression

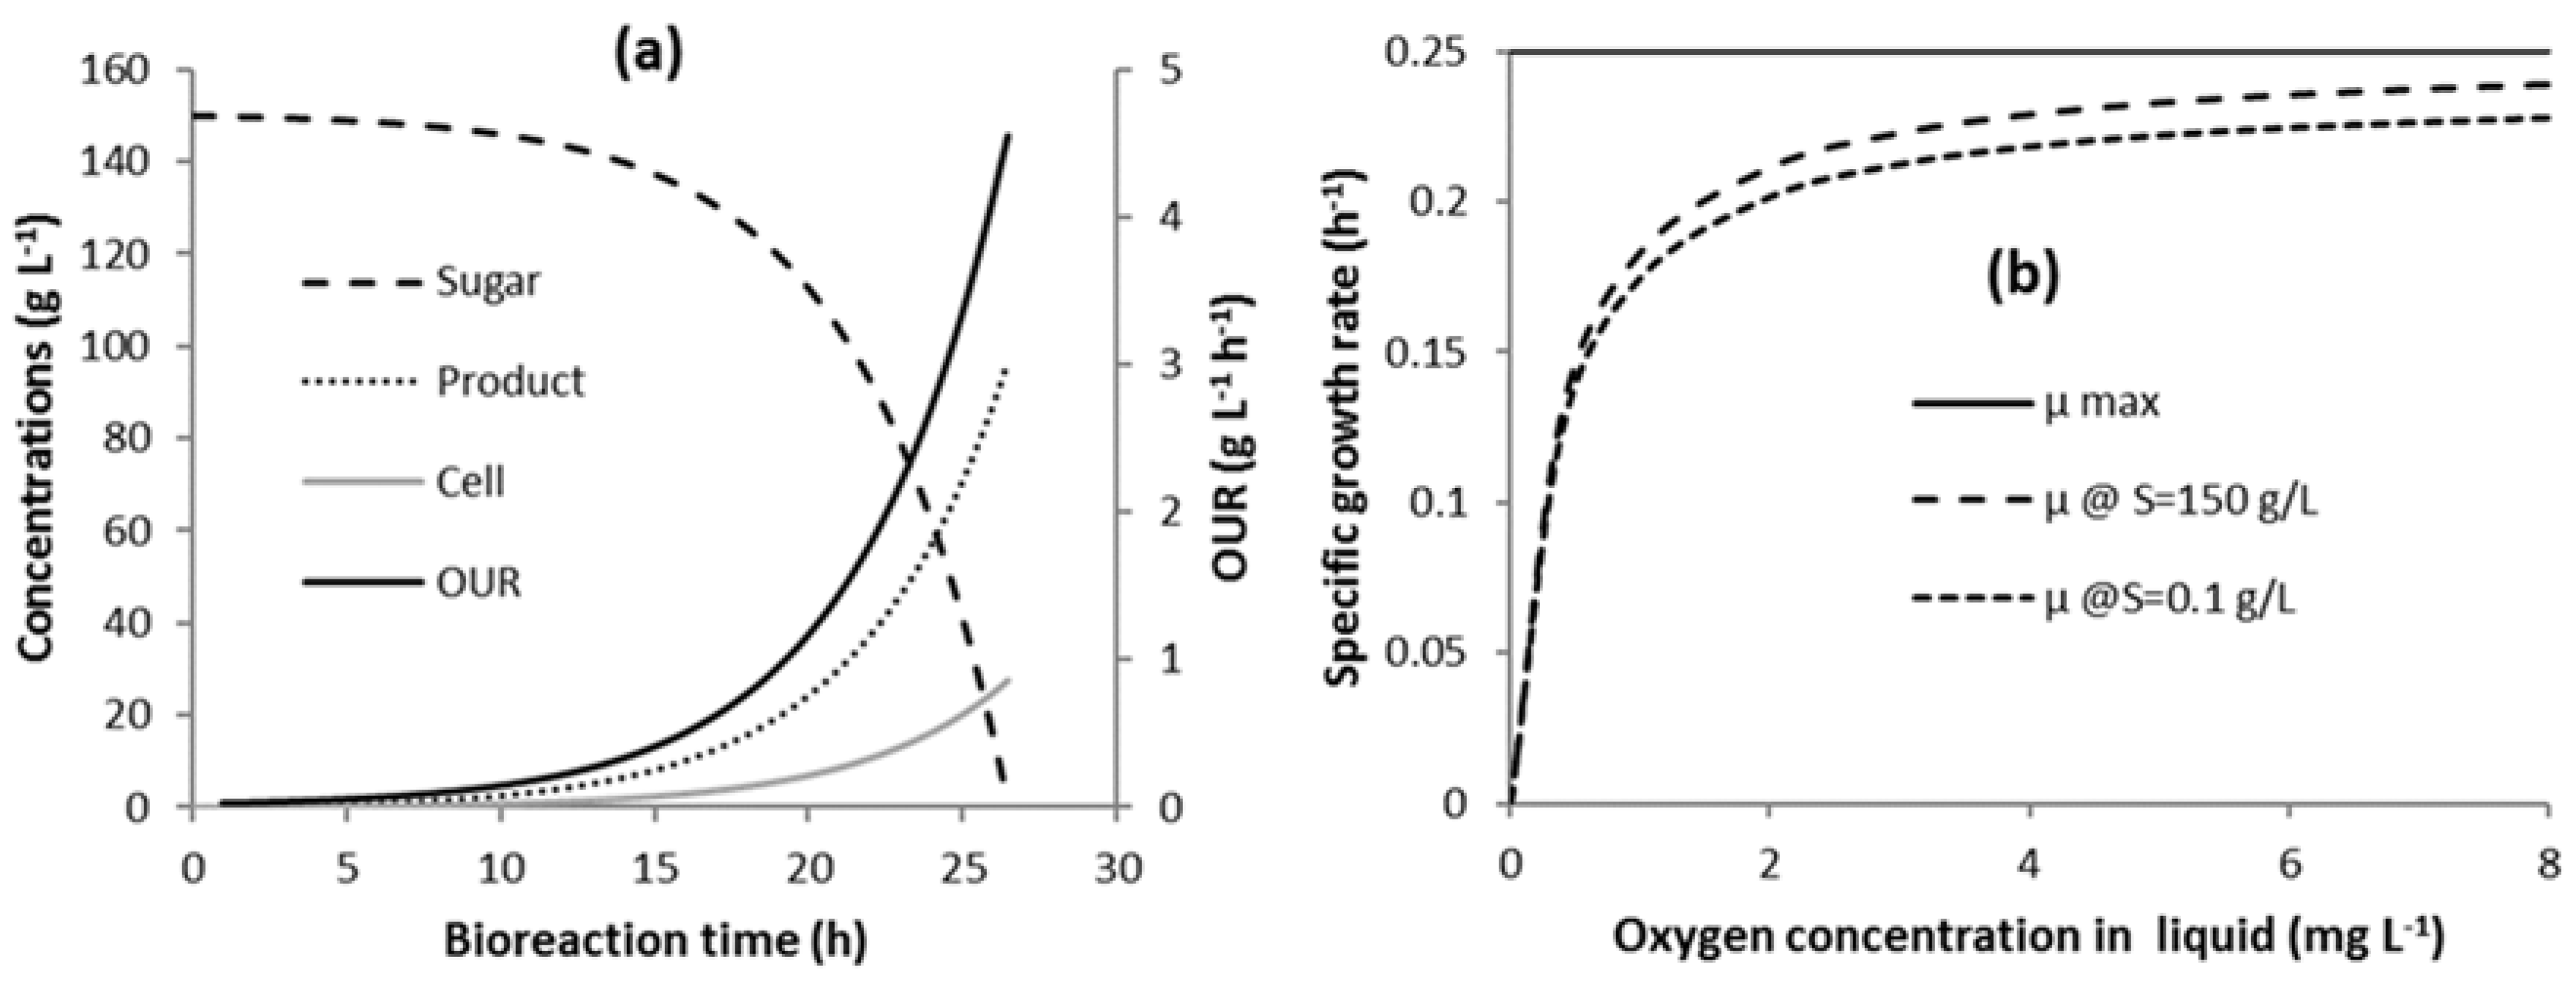
Figure 2a presents the evolution of sugar, product and cell concentrations, and OUR over the duration of the bioreaction. The bioreaction time is about 26.5 h when the oxygen concentration in the bioreaction liquid is maintained at 2 mg L−1. The bioreaction progresses slowly over the first 10 h, after which there are significant changes in the concentrations, and the OUR reaches a maximum of 4.7 g L−1 h−1 towards the end of the bioreaction. Figure 2b shows the influence of oxygen concentration in the bioreaction liquid on the specific growth rate. There is a progressive decrease in specific growth rate as the oxygen concentration is reduced below about 2 mg L−1.

3.2. Control of vvm in Strategy C1

For control strategy C1, Pag is assigned a constant value, such that flooding does not occur throughout the bioreaction. The lowest value of Pag for the bioreaction without flooding is approximately 38.5 kW. A PID control algorithm was developed to continuously vary vvm over time, so as to maintain COL close to 2 mg L1. The PID controller continuously evaluates an error value e(t) as the difference between a desired set point (COL = 2 mg L1) and the value of COL evaluated from the model. It then calculates a value of the control variable vvm(t) to minimise the error e(t). The new value of vvm(t) is based on the sum of proportional, integral, and derivative (PID) terms in Equation (1):
v v m ( t ) = K p e ( t ) + K i 0 t e ( t ) d t + K d d e ( t ) d t
The constants Kp, Ki and Kd, were determined using the Ziegler-Nichols tuning method [31]. This is composed of the following steps:
(1)
Set a low Kp value (1 or 10 for example) and set Ki = Kd = 0.
(2)
While Ki = Kd = 0, increase Kp value until COL sustained oscillations appear. The Kp value where oscillations appear is called Kp_lim.
(3)
Measure oscillation period T0.
(4)
Tune PID parameters using Equations (2) to (4).
K p = 0.6   K p _ l i m
τ i = 0.5   T 0
τ d = 0.125   T 0
where τ i = K p / K i and τ d = K d / K p .
Kp_lim and T0 were evaluated as 16 and 0.002 h, respectively, and the PID parameters were evaluated from Equations (2) to (4) as Kp = 9.6; τ i = 0.001 h; τ d = 0.00025 h, from which Ki and Kd were evaluated.
The control algorithm worked very well for the simulated bioreaction, After the initial part of the bioreaction, where the COL is allowed decrease from 8 to 2 mg L1, the variation of COL throughout the bioreaction was very small in the range of 2 ± 0.03 mg L1.
The duration of the time step in the simulation is 104 h or 0.36 s, thus the compressor air flowrate is being changed in the simulation at the end of each time step. This is a short period of time, thus the impact of compressor change time (ΔtC) or time interval between changing the compressor air flowrate was investigated. The simulations were performed with values of ΔtC greater than 0.36 s. It was found that the PID controller worked well up to about ΔtC = 5 s, but oscillations started to appear in the first half of the bioreaction at higher values of ΔtC.

3.3. Energy Reduction and Minimisation

3.3.1. Energy Minimisation Using Strategy Cmin

OUR varies throughout the bioreaction time during batch operation, as illustrated in Figure 2a. At a specific time during the bioreaction, many different combinations of vvm and Pag can be determined in order to provide an OTR that satisfies the OUR at that time in order to maintain a constant COL value, subject to the constraints. Each of these combinations will have different power requirements. Consequently, for a specific value of OUR, there exists an optimum combination of Pag and vvm that minimises the oxygen transfer total power requirement, subject to constraints [29].
The simulations were performed (at a constant COL of 2 mg L1) during the bioreaction time to determine the combinations of vvm and Pag that minimise the total power requirement at each time increment during the bioreaction. Consequently, the minimum total energy requirement for the bioreactor is achieved by continuously controlling the bioreactor at these optimal combinations of Pag and vvm throughout the entire bioreaction, and this is referred to as strategy Cmin. This was simulated and Table 1 presents the electrical energy requirements for Cmin, along with the C1 energies for comparison. For the Cmin simulation, the minimum total power requirements throughout the bioreaction occurred at the onset of flooding.
The power requirements will depend on the values of OUR, the kLa correlation, and the constraints. Fitzpatrick et al. [29] performed simulations for a typical range of OUR values, bioreactor working volumes, and for five kLa correlation equations. These simulations applied the same bioreaction kinetics as in this work. These simulations showed that the minimum total power requirement tended to be constrained by flooding for many of the scenarios, and it was close to the flooding value for those where the minimum was obtained before the occurrence of flooding. Overall, the simulations suggest that the scenario C minimum total energy can be achieved by the controlling vvm–Pag combinations at the onset of flooding throughout the bioreaction.

3.3.2. Energy Reduction Using Strategy C1-N

Scenario Cmin might not be practical, because it involves trying to continuously control vvm and Pag, so that they are at the onset of flooding throughout the bioreaction. In strategy C1, Pag is kept constant and vvm was varied throughout the fermentation. Pag has a lower limiting value, whereby if Pag is chosen below this limiting value, then the vvm required at maximum OUR exceeds the flooding vvm and COL cannot be maintained constant. Operating at this limiting value of Pag throughout the bioreaction time results in relatively high total energy requirement due to the high agitator energy requirement.
Fitzpatrick et al. [29] suggests that this energy requirement can be greatly reduced by applying strategy C1-N, where the bioreaction time is divided up into N time segments (two or more time segments), where lower constant Pag values are applied in each time segment without flooding the impeller. For the model bioreaction, the OUR progressively increases with time with the maximum being near the end, as illustrated in Figure 2a. This bioreaction could be divided up into N time segments with Pag progressively increasing from segment to segment, up until the limiting Pag value in strategy C1 in the last time segment.
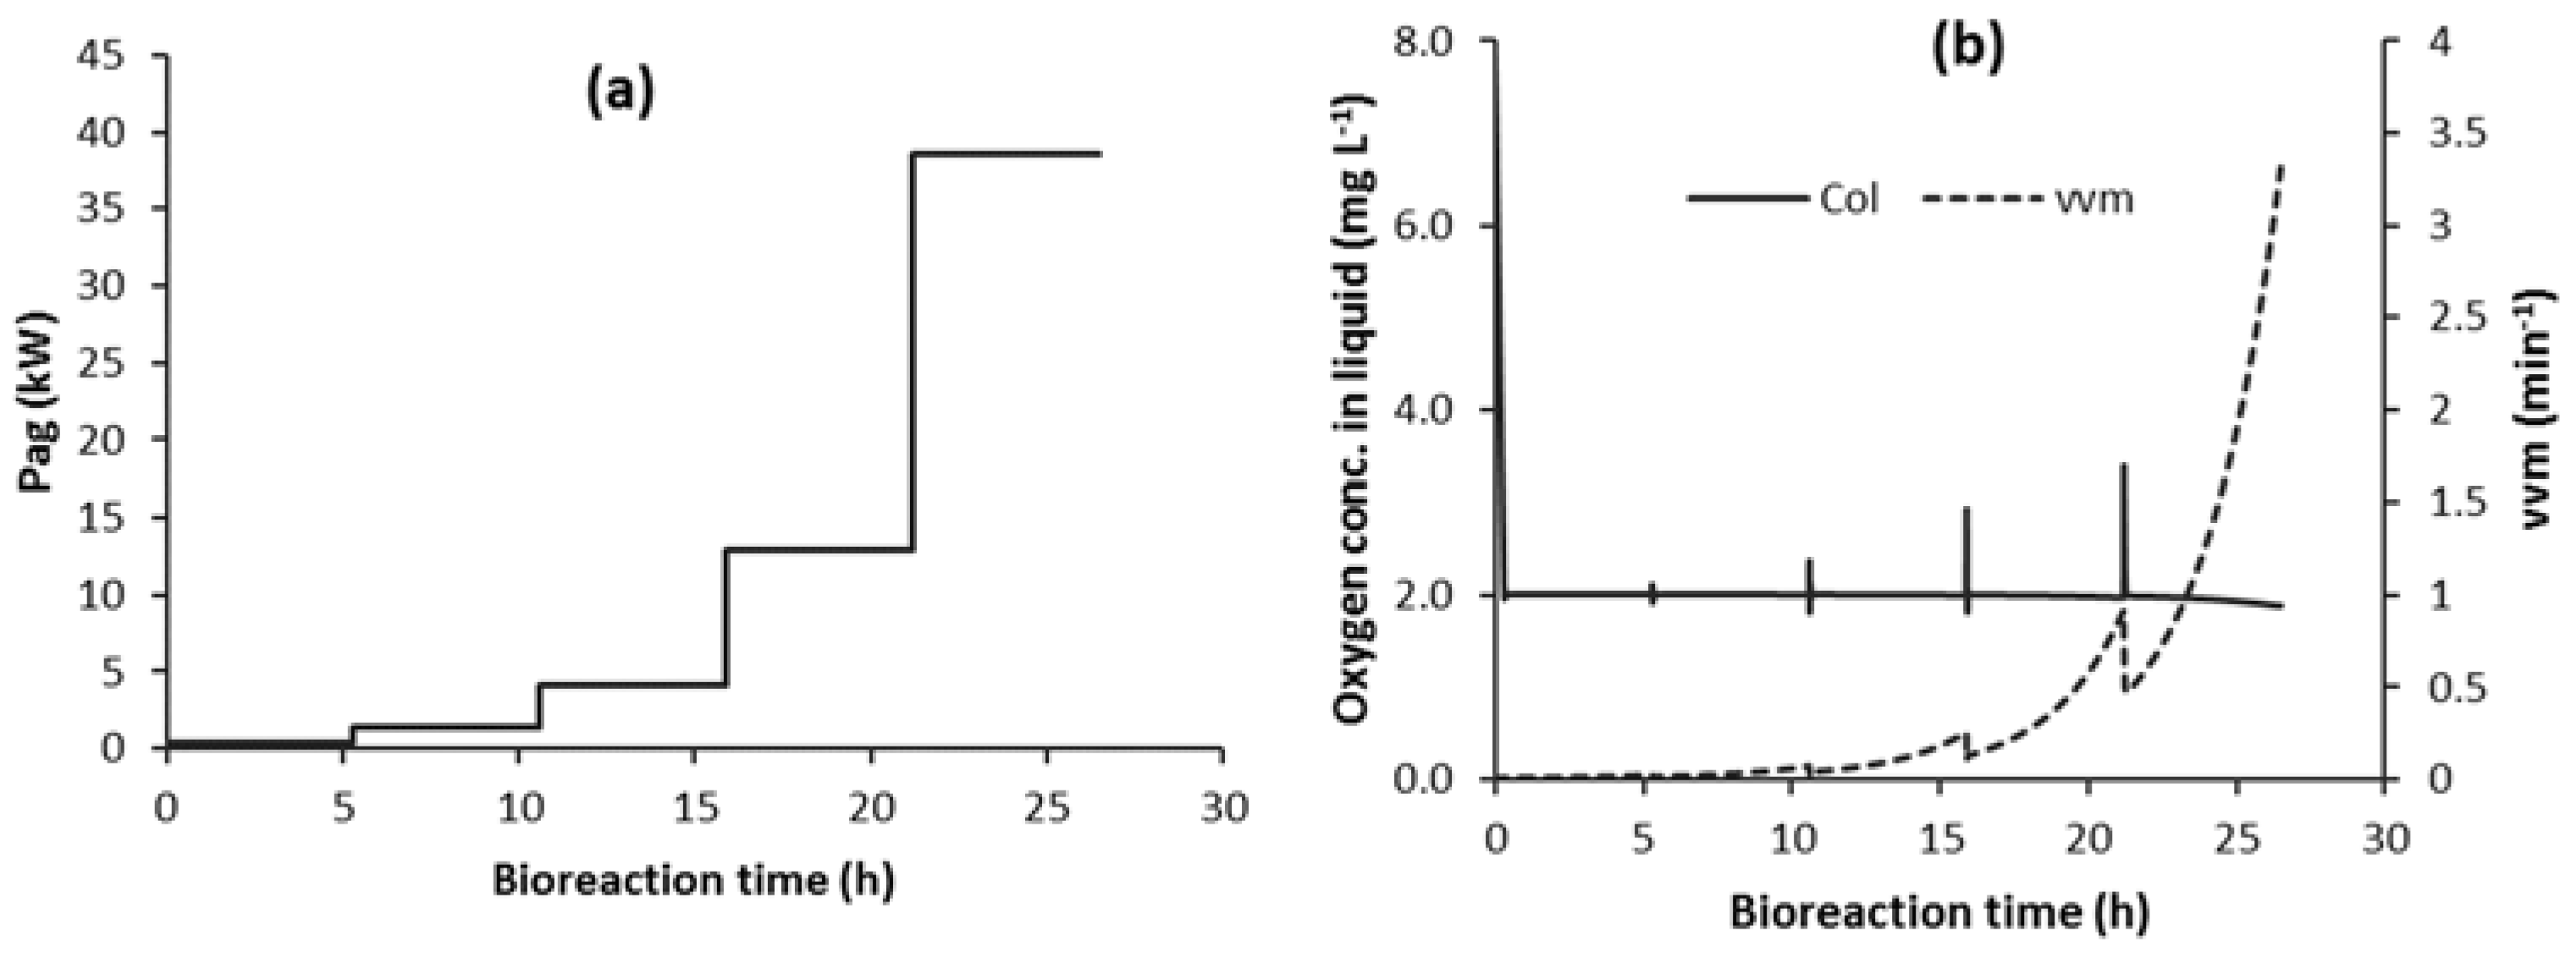
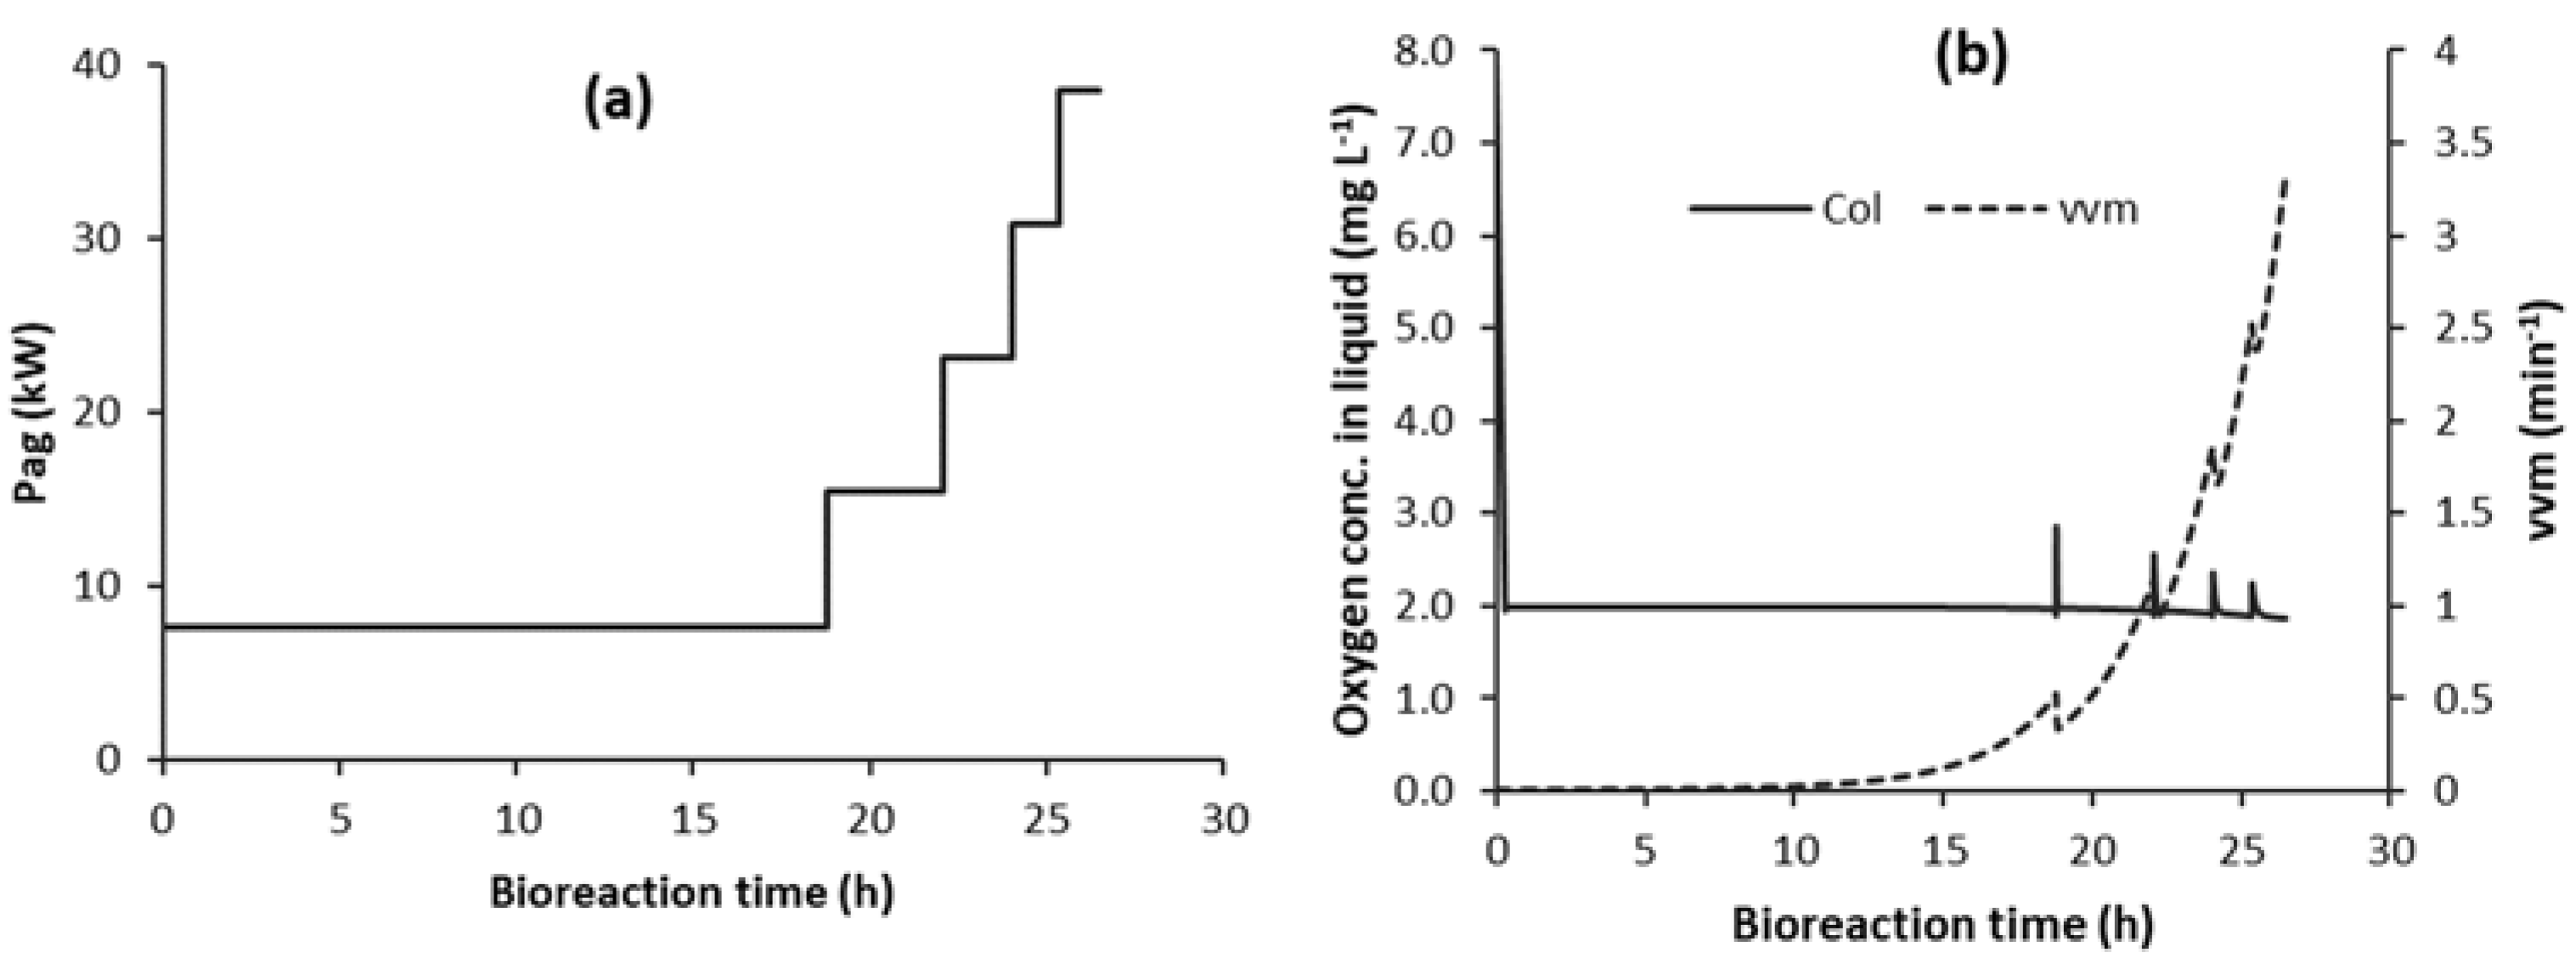
Figure 3 illustrates the variation in Pag, vvm and COL for a five-segment control strategy (C1-5) where the time duration of each segment is equal. Figure 3a shows the values of Pag in each time segment. Within each time segment, the value of Pag represents the lowest value without the occurrence of impeller flooding. The non-linear increase in Pag from segment to segment is due to OUR increasing non-linearly, as illustrated in Figure 2a. Figure 3b shows how vvm is varied by the control algorithm. Within each time segment, vvm increases, as expected, and then decreases when there is a transition from one segment to the next with the step increase in Pag. This step increase in Pag causes significant variation in COL, as illustrated in Figure 3b; however, this is only for a short duration after the transition. Otherwise, the control algorithm works very well in controlling COL. In fact, the variation at the transition can be greatly reduced by introducing a more gradual increase in Pag at the end of each time segment, rather than a step increase.
Simulations were performed to compare the energy requirements of strategies C1-N with C1 and Cmin, and Table 1 presents the results. Increasing the number of time segments results in a major reduction in the total energy requirement for oxygen transfer. Dividing the bioreaction time into two time-segments results in a 42% energy reduction. Dividing the bioreaction time into 10 time-segments results in a 66% energy reduction. Consequently, there is a diminishing additional energy saving that is associated with each additional time segment. Increasing the number of time segments will progressively approach that of Cmin.

3.4. Implementation of Strategy C1-N with Detection of Impeller Flooding using Oxygen Sensor Data (C1F-N)

Section 3.3 suggests that energy can be minimised by operating at or close to the onset of impeller flooding throughout the duration of the bioreaction; however, this might not be operable from a practical control perspective. Strategy C1-N, using a small number of time segments, is practically operable, and Section 3.3 suggests that this could obtain most of the energy savings that are associated with Cmin. For example, the data provided in Table 1 show that operating with 10 equal time segments (C1–10) provides 96.6% of the savings made by Cmin relative to strategy C1.
The problem with strategy C1-N, as outlined in Section 3.3, is that it inherently assumes that the relationship between the flooding vvm and Pag is known. Such correlations do exist [32], however these are only approximations. Consequently, it would advantageous if the controller could detect the onset of flooding while using the measured COL data. With this, the controller could implement a step increase in Pag once it detected flooding and automatically moved to the next time segment.

3.4.1. Detection of Impeller Flooding Using Oxygen Sensor Data and Implementation of Strategy C1F-N

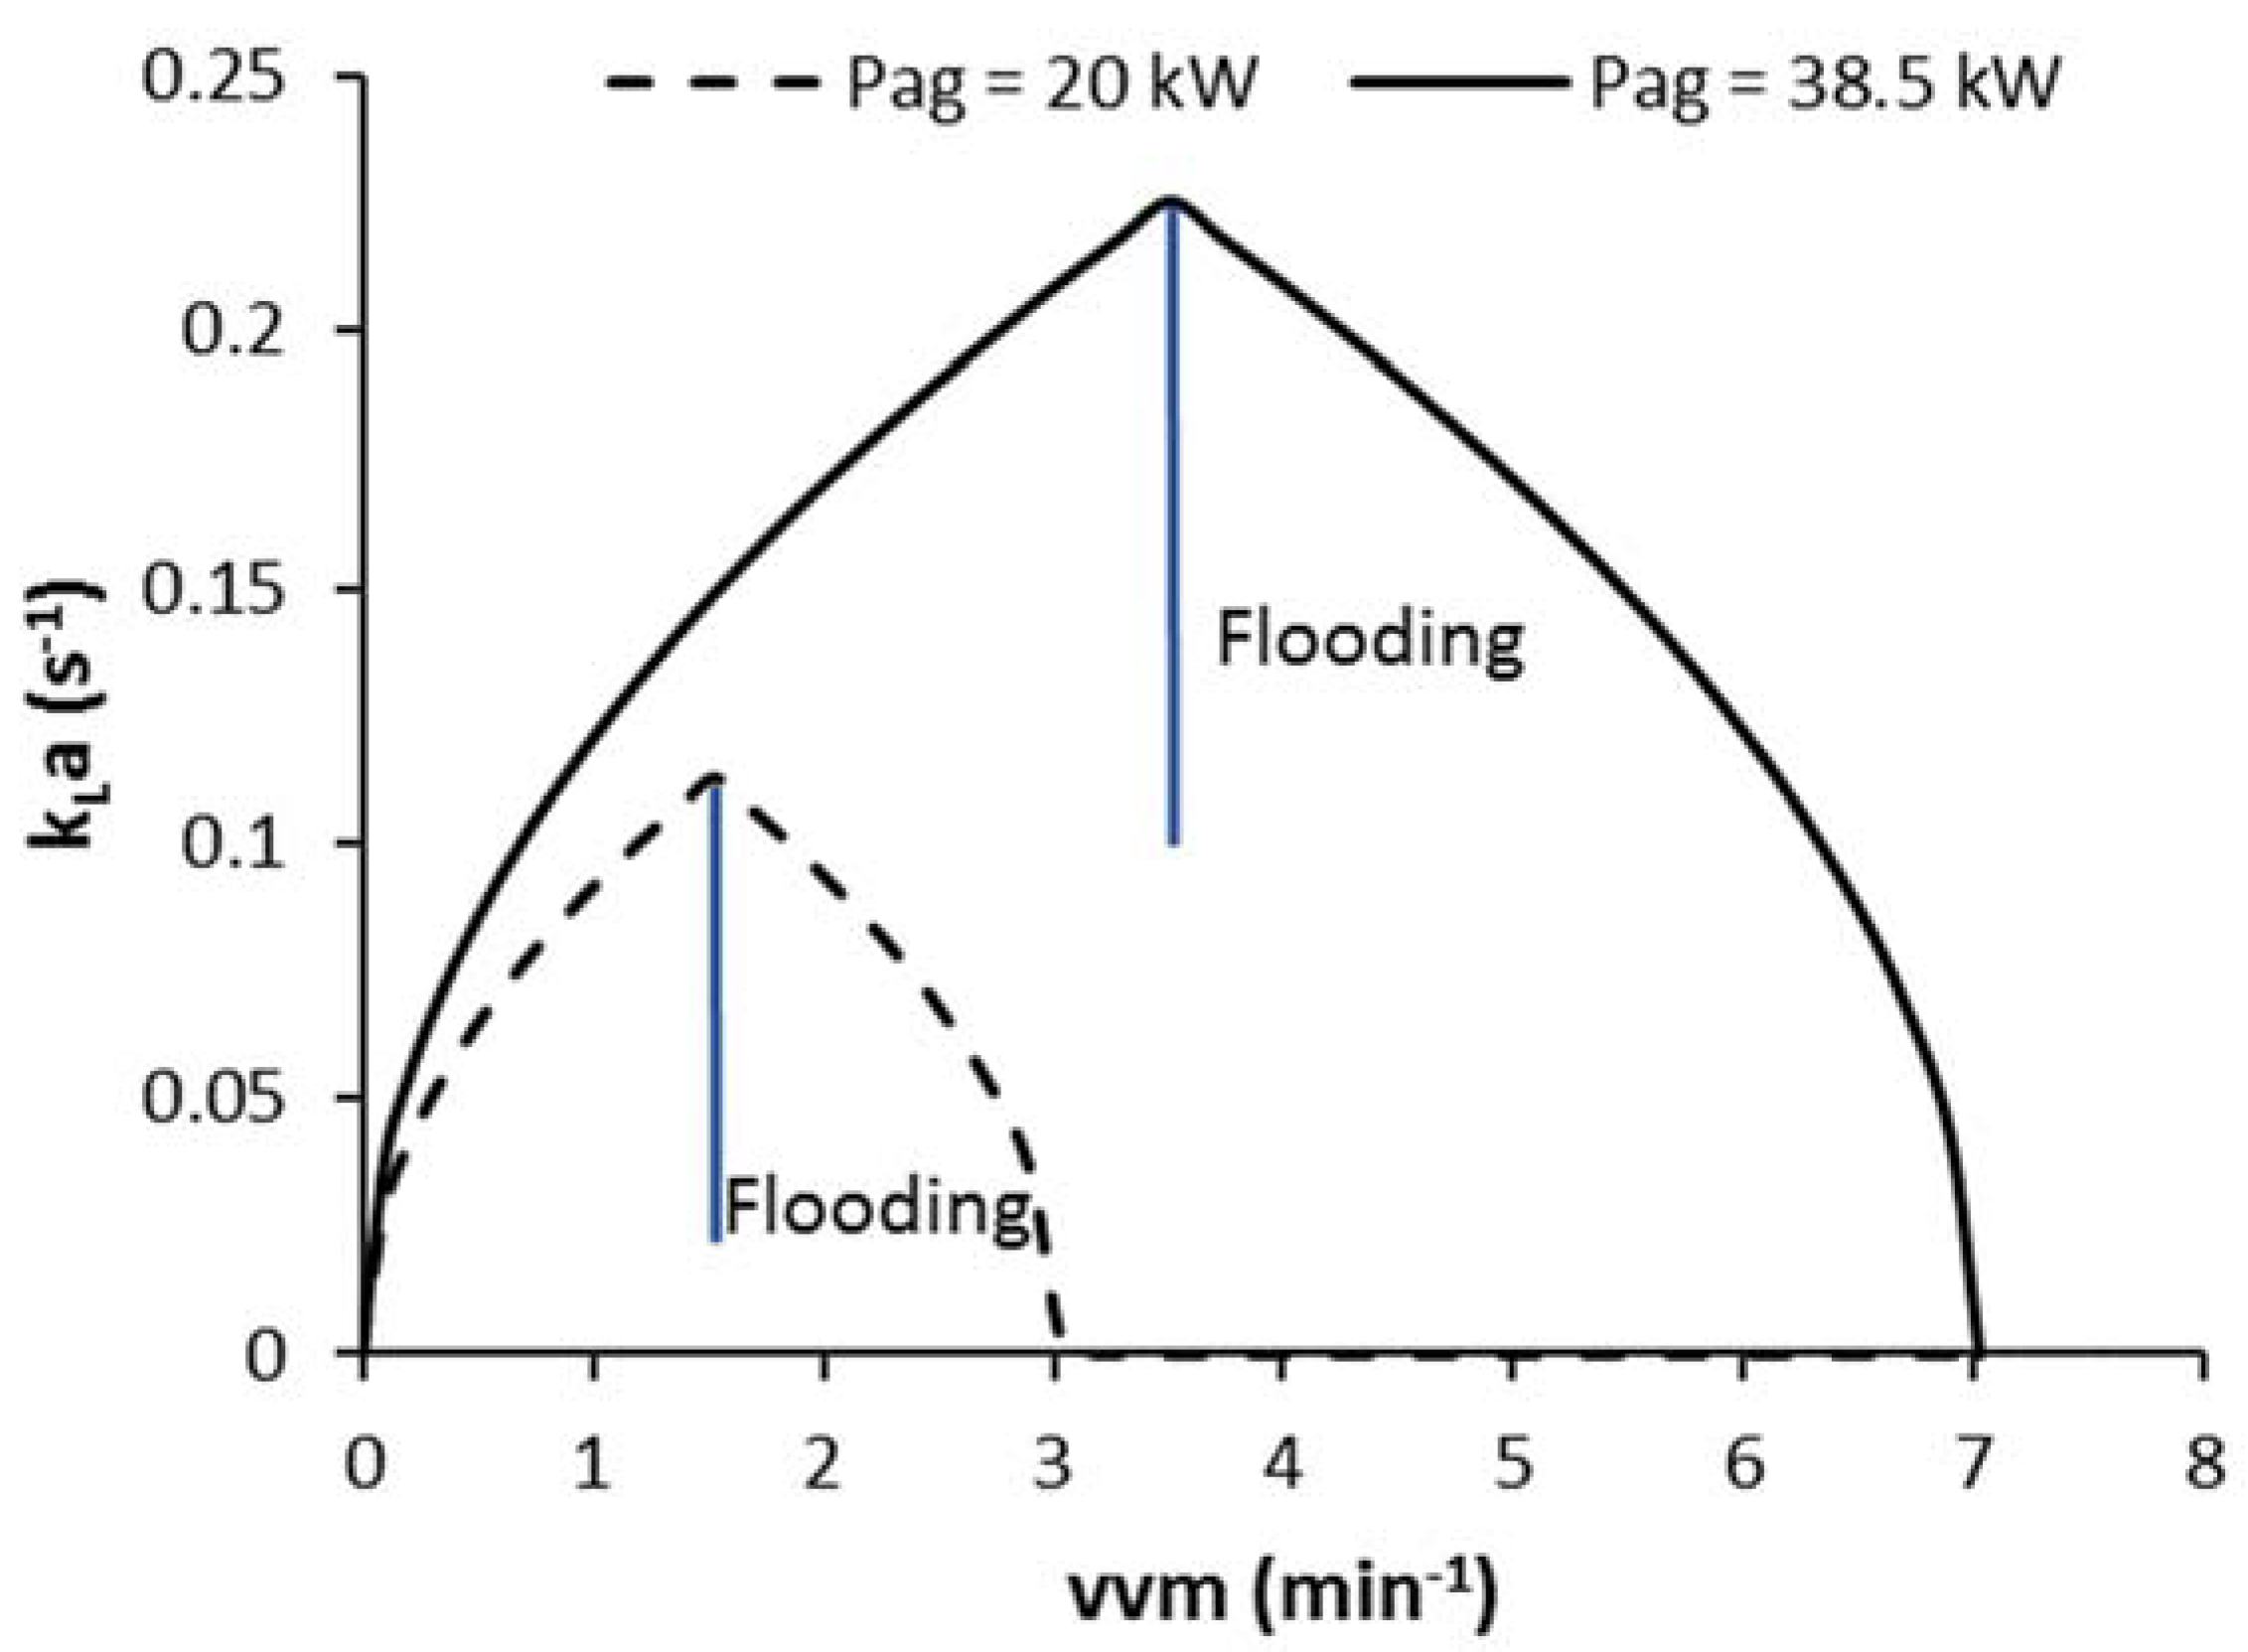
Considering the above, work was undertaken to develop an algorithm that could detect the onset of flooding. Before doing this, a kLa model for the flooding region had to be developed, so that kLa in the simulated bioreaction would decrease in the flooded region. As a first attempt, a simplified model for estimating kLa in the flooded region was constructed. This essentially consisted of applying the kLa correlation Equation (5), such that it is symmetrical around the flooding air superficial velocity ( v s F ), as presented in Equation (6), where air superficial velocity ( v s ) is defined as air volumetric flowrate per unit cross-sectional area of bioreactor [29]. Figure 4 illustrates how vvm and Pag influence kLa in the non-flooded and flooded regions for two values of Pag.
Region 1:
v s v s F   k L a = K ( P a g V L ) n 1 ( v s ) n 2
Region 2:
    v s F < v s 2   v s F   k L a = K ( P a g V L ) n 1 ( v s F ( v s v s F ) n 2
Region 3:
      v s > 2   v s F   k L a = 0
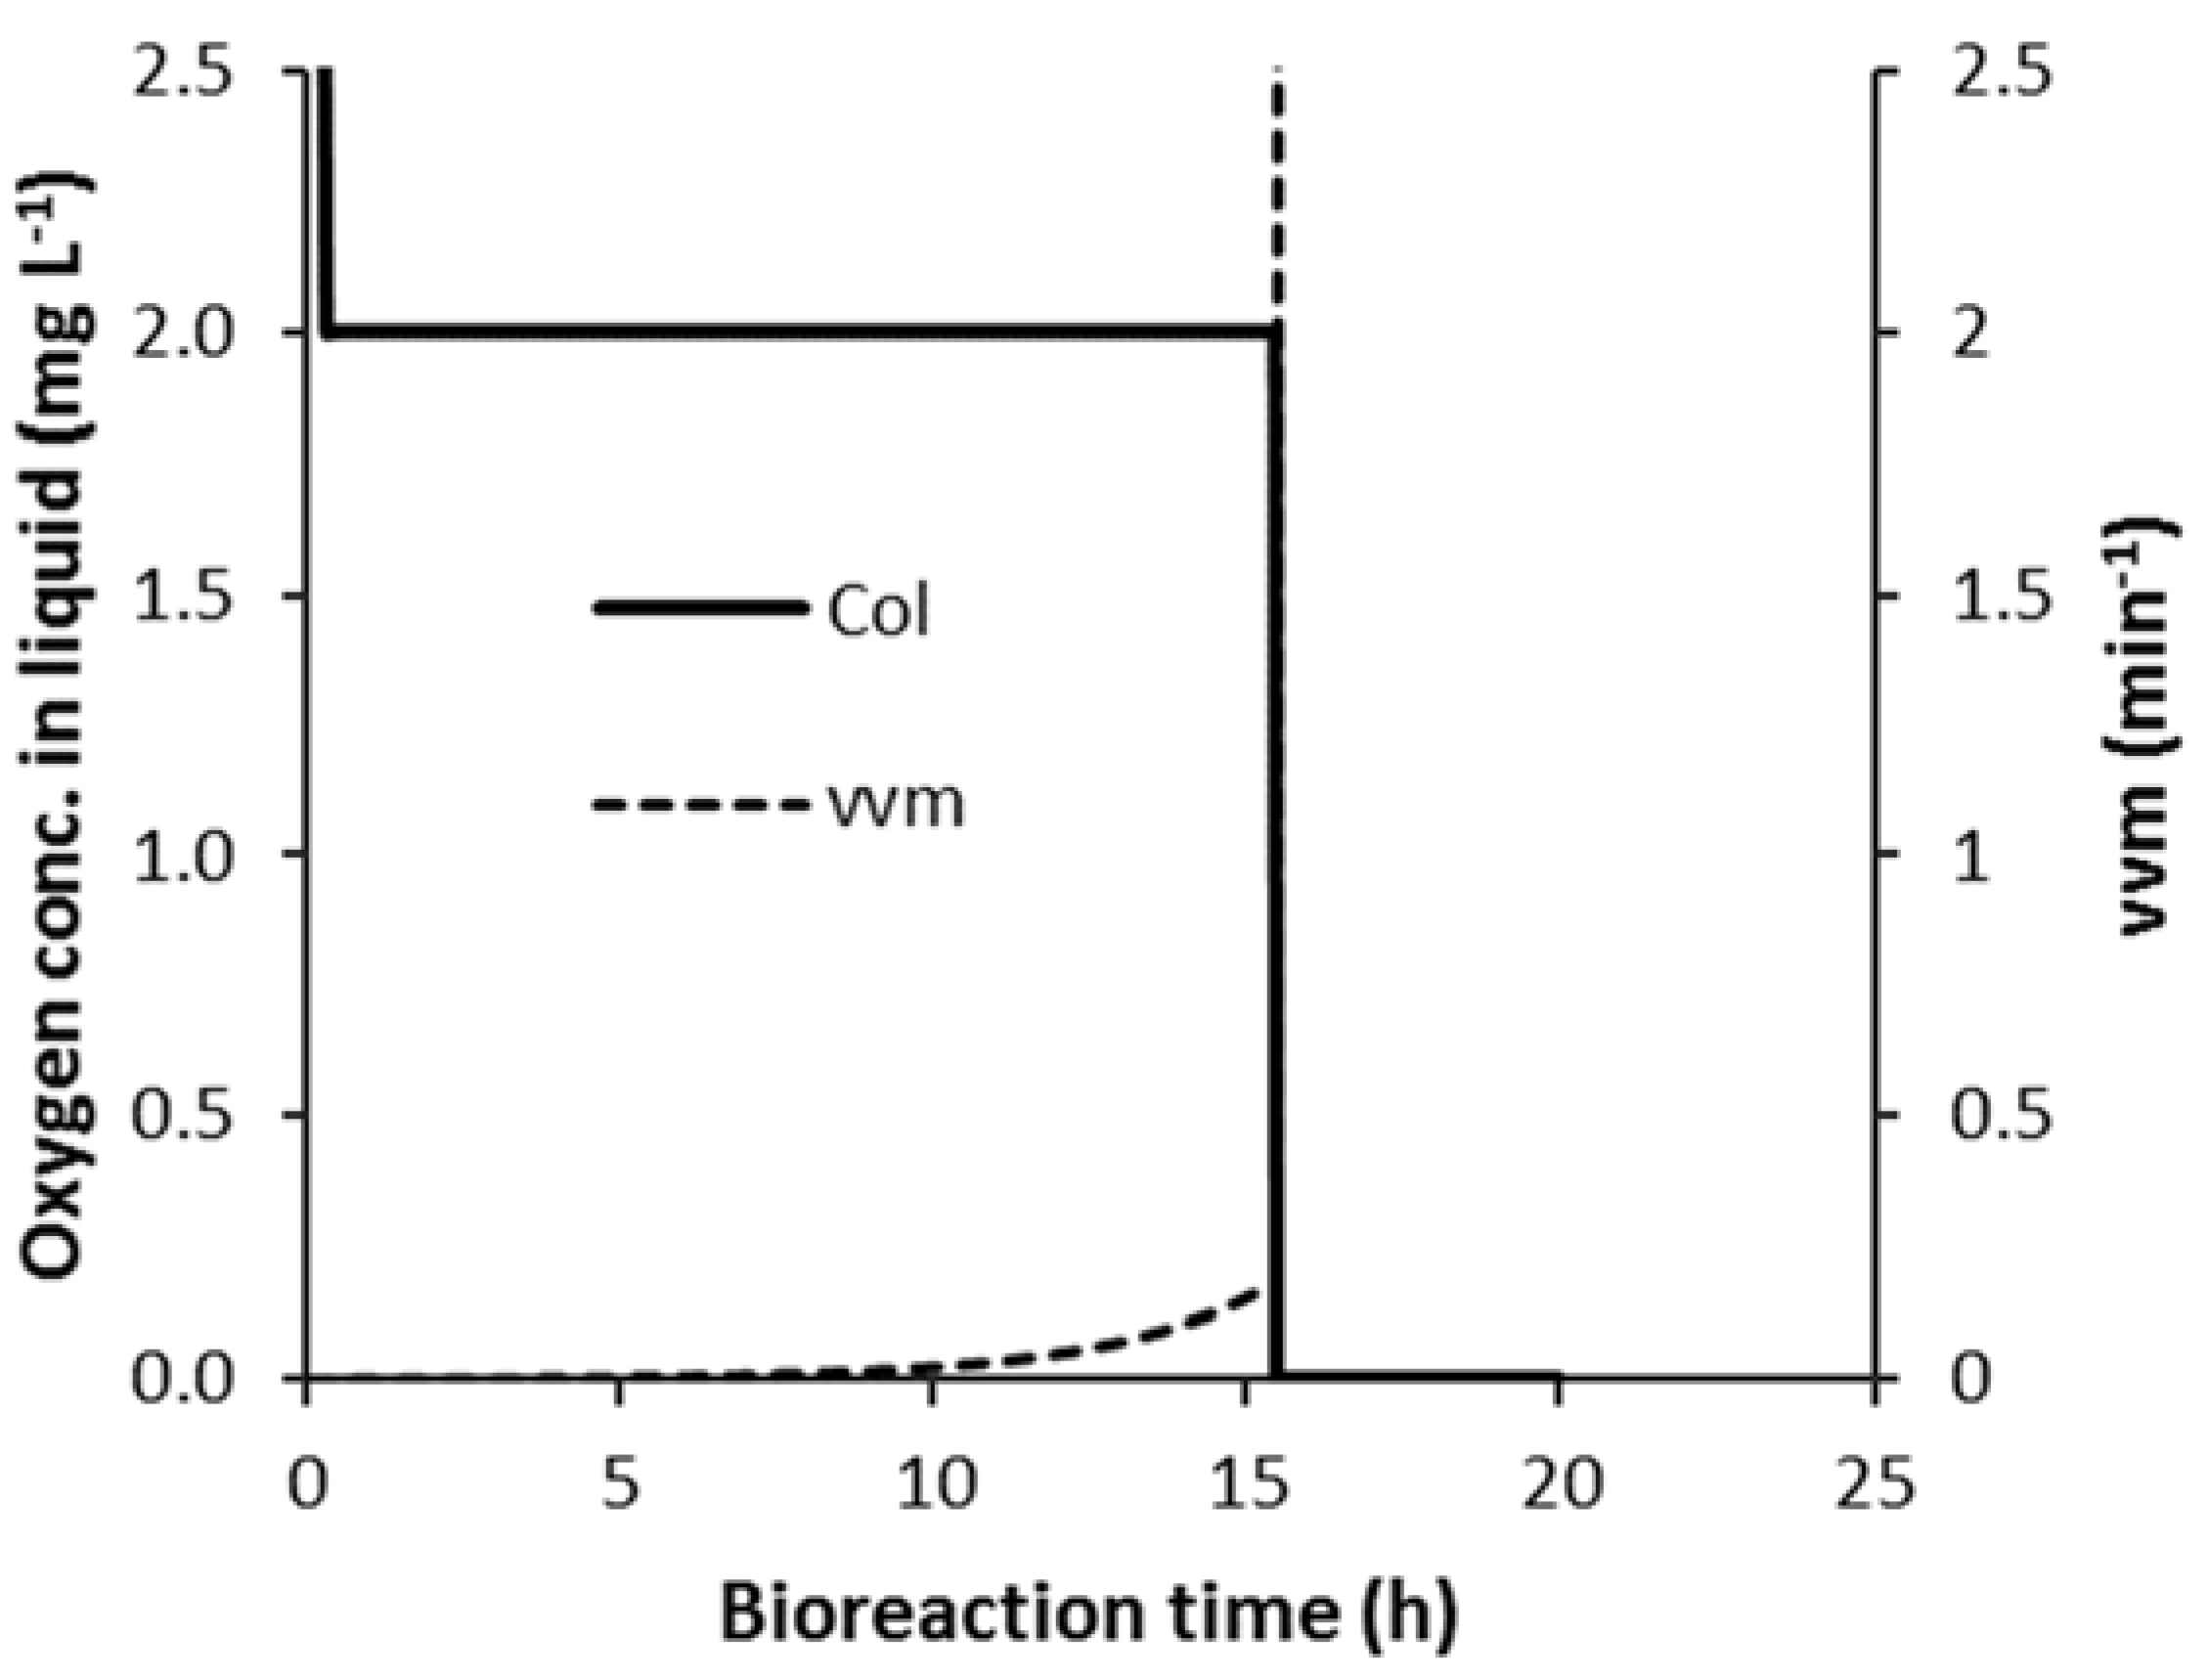
The work on developing a flooding detection algorithm first looked at how the model behaved when the simulated flooding occurred. This is presented in Figure 5 for a strategy C1 case where flooding occurs during the bioreaction. Pag was assigned a constant value of 3.8 kW, which is well below the value of Pag where the onset of flooding occurs at the maximum OUR for the non-flooded case (~38.5 kW). The flooding occurred at about 15.51 h into the bioreaction, as can be seen in Figure 5 by the rapid decrease in COL, which took approximately 45 s to decrease from the set-point of 2 mg L1 down to 0. This is because as COL decreases due to the increase in OUR, the controller responds by increasing vvm to increase the OTR. However, this is counterproductive once vvm is in the flooded region and it causes kLa (and OTR) to decrease rather than increase, which, in turn, causes COL to decrease rapidly. This rapid continuous decrease in COL was used to detect the onset of flooding. Flooding was detected when COL decreased below a certain value (referred to as COL_FLD), which was below the 2 mg L1 control set-point. Simulations were first performed at a value of COL_FLD that was equal to 1.9 mg L1 and this worked well. However, significant fluctuations in COL occur after the subsequent increase in Pag, thus flooding detection had to be suspended for a short time period after the Pag transition.
The flooding detection was then integrated into the C1-N control strategy and it is referred to as strategy C1F-N. To implement the C1F-N strategy, it is first necessary to estimate a high enough value of Pag (Pagmax), such that flooding does not occur at maximum OUR. This is, in essence, sizing the mechanical power requirement of the agitator. One approach to doing this is to experimentally measure the maximum OUR at a small scale for the bioreaction. Subsequently, the modelling equations that were presented by Fitzpatrick et al. [29], including a relevant kLa correlation, were be applied to gain an estimate of Pag at the onset of flooding for the maximum OUR value, as was carried out for Figure 3. This can also be used to provide an estimate on the maximum vvm requirement (vvmmax), which essentially sizes the air compressor and prevents any excessive airflow response by the PID controller.
Once Pagmax is estimated, the C1F-N control strategy is implemented, as follows:
A step increase in Pag from time segment to time segment (ΔPag) is defined in Equation (7).
Δ P a g = P a g m a x N  
Subsequently, the Pag in each time segment (Pagi) (where i is an integer starting at 1) is given in Equation (8).
P a g i = i × Δ P a g
This is a little different to the previous implementation of C1-N where the time segments were of equal duration, but the step increases in Pag varied in magnitude, as illustrated in Figure 3. Currently, the durations are different, but the step increases in Pag are the same. This is illustrated in Figure 6 for five time segments (C1F-5). This is more practical, because it is not known exactly what the flooding Pag is at the end of each time segment for the case of using equal time segment durations.
Further simulations were performed for two and 10 segments and Table 2 presents the energy requirements, and these can be compared with C1-N presented in Table 1, where there was no flooding detection. The energy requirements and energy savings are similar, but they are a little greater for the cases while using flood detection. This is most likely because the segment time durations and Pag values in each time segment are different.
In the results shown above, the simulations were performed at COL_FLD = 1.9 mg L1, which is only 0.1 mg L1 below the control set-point of 2 mg L1. The PID controller performed well in controlling COL in the simulated bioreactions; however, random fluctuations in real oxygen sensor measurements could cause the measured COL to be below 1.9 mg L1 and cause unwanted step increases in Pag and greatly reduce the energy saving potential. Consequently, the influence of random fluctuations in the oxygen sensor measurements are investigated in the next section.

3.4.2. Dealing with Random Fluctuations in the Oxygen Sensor Measurements and Unwanted Pag Step Increases

Random fluctuations in real oxygen sensor measurements could cause unwanted step increases in Pag, which would greatly reduce the energy saving potential. This is highly undesirable. A number of factors could cause the random fluctuations, including the medium being two-phase consisting of air bubbles in aqueous liquid and variations in oxygen concentrations due to non-ideal mixing. This section examines the impact of these fluctuations and how they can be overcome. The impact of random fluctuations is included in the modelling through Equation (9).
C O L _ s e n s o r = C O L   ( 1 + x   Y )
where COL_sensor is the simulated oxygen sensor measurement, Y is the maximum fluctuation amplitude (mg L−1), and x is a random number generated between −1 and +1. The error value e(t) is now calculated as the difference between a desired set point (COL = 2 mg L1) and the value of COL_sensor, and this is used in the PID controller equation (1) in order to evaluate vvm.
This was initially applied for Y = 0.2 and COL_FLD = 1.9 mg L1. Figure 7a shows the random fluctuation in sensor oxygen concentration in the liquid (COL_sensor), and Figure 7b shows its effect on Pag. When compared to Figure 6a, this shows the Pag step increases occurring much earlier than desired and, consequently, the energy saving potential is lost. This simply occurs because the random fluctuations (with Y = 0.2) causes COL_sensor to randomly decrease below COL_FLD activating unwanted step increases in Pag. This causes a fluctuation in vvm, which causes the real value of the oxygen concentration in the liquid (COL) to also vary, as illustrated in Figure 7c.
One approach for trying to prevent the random fluctuations causing unwanted Pag step increases is to reduce the value of COL_FLD. From Equation (9) and considering that COL is fluctuating around its set-point (COL_sp), then unwanted Pag step increases will occur if the condition in Equation (10) is met.
C O L _ s p ( 1 Y ) < C O L _ F L D
When considering this, simulations were run for combinations of Y (= 0.1, 0.3, 0.5) and COL_FLD (= 1.9, 1.7, 1.5, 1.2, 0.8) to evaluate whether unwanted Pag step increases occurred or not, and Table 3 presents the results. The results show that an unwanted Pag step increase did occur when the condition in Equation (10) was met. Furthermore, Table 3 shows some unwanted Pag step increases occurring for some COL_FLD lower than in the condition, and this is due to the random fluctuation in the COL value below the set-point value (Figure 7c).
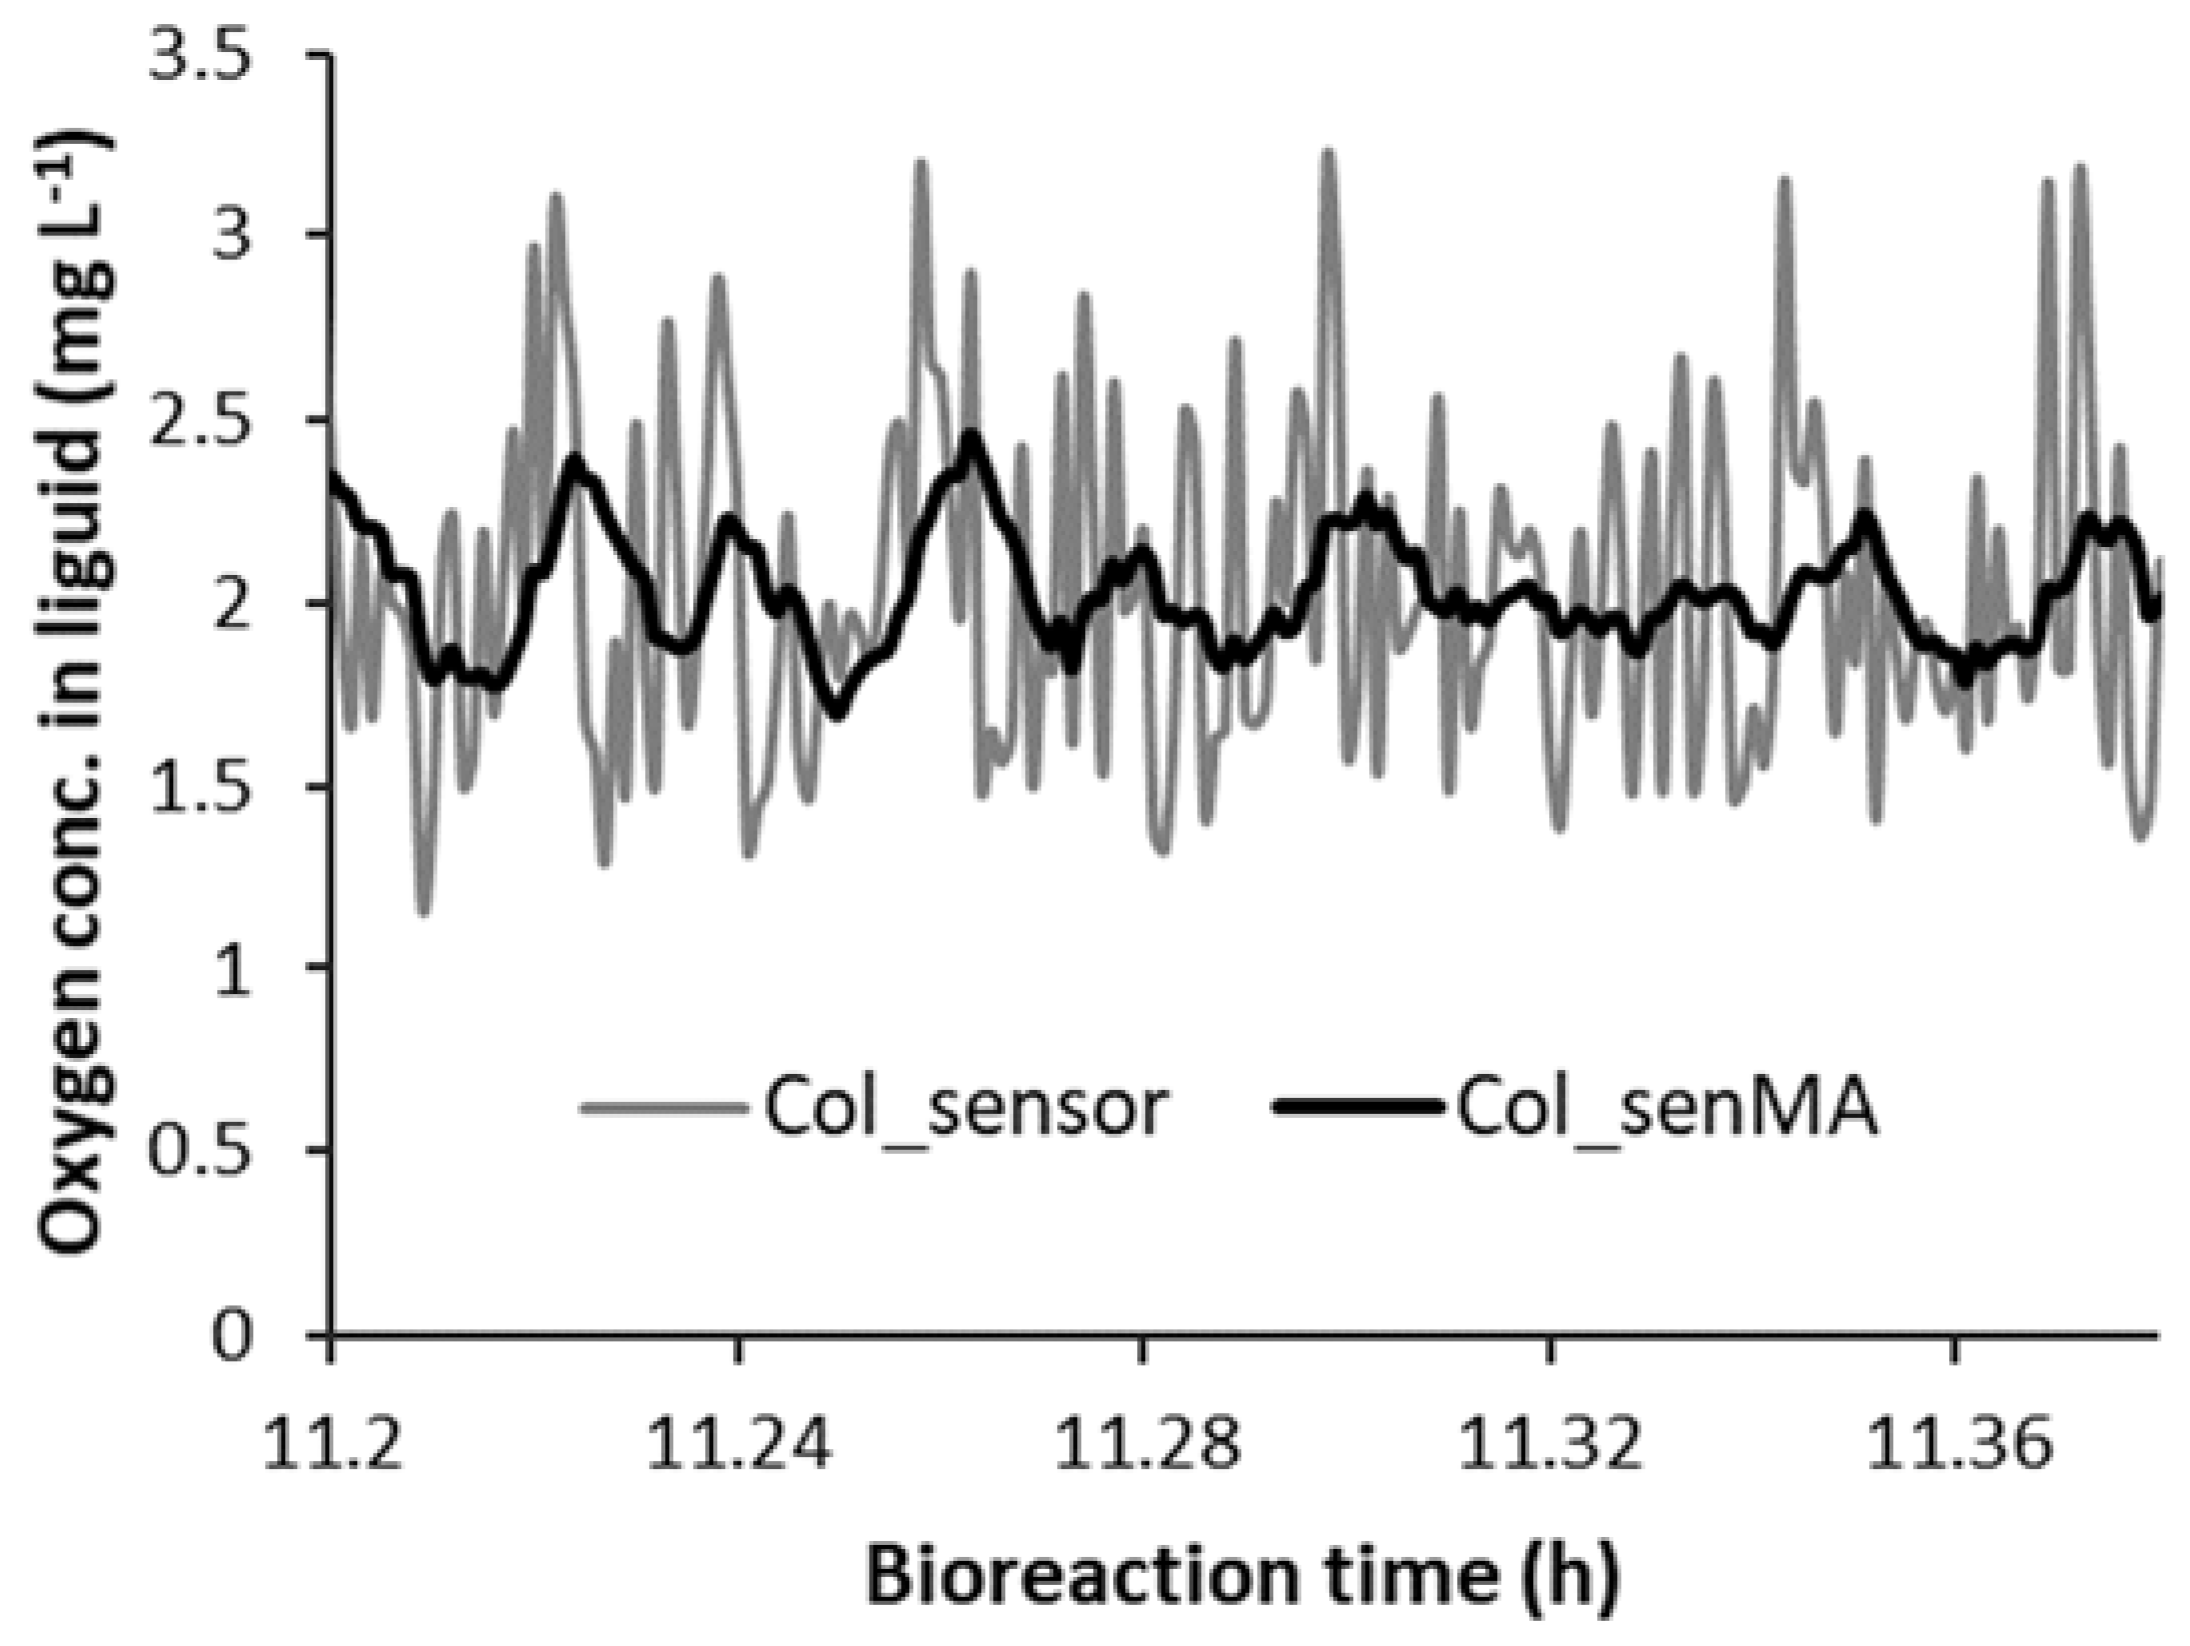
Reducing the effect of the fluctuations by applying a moving average to fluctuation in COL_sensor (i.e., COL_senMA) is another approach for trying to prevent the random fluctuations causing unwanted Pag step increases. This was implemented in the model by evaluating the average of COL_sensor over the last ten time steps. Figure 8 illustrates the effect of using moving average to reduce the fluctuations. This had a beneficial impact on reducing unwanted step increases in Pag, as the first “Yes” in Table 3 became a “No” for each of the values of Y. Care has to be taken not to have too long a time duration over which a moving average is calculated as it introduces a time delay.

3.4.3. Impact of Operating at Lower Values of COL_FLD

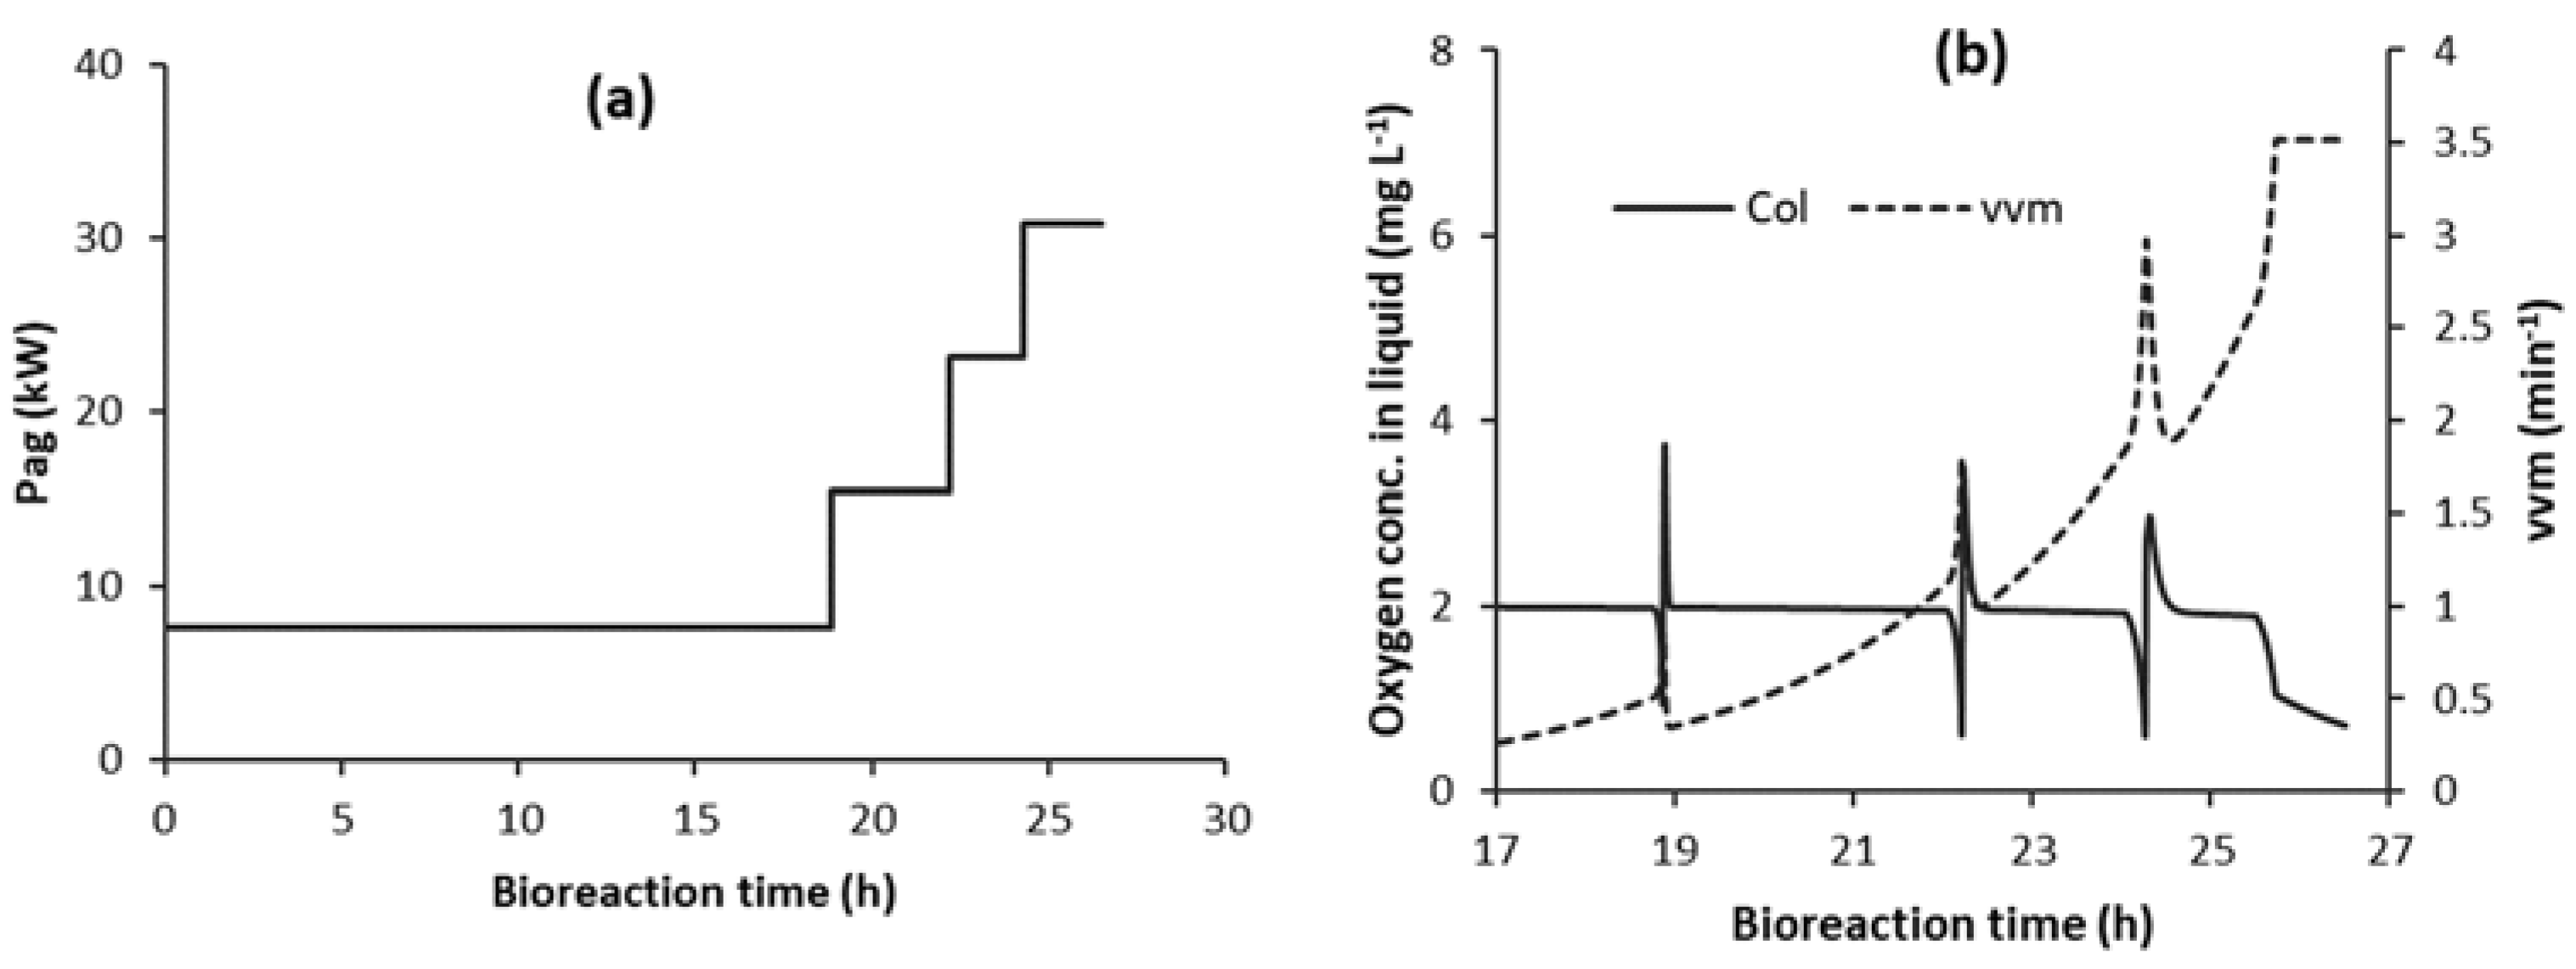
To avoid the effect of random fluctuations in the oxygen sensor measurements (COL_sensor) causing unwanted Pag step increases, it may be necessary to operate at lower values of COL_FLD, as outlined in the previous section. Some of the C1F-5 simulations that were run at lower values of COL_FLD (typically below 0.8 mg L1) showed an unusual behaviour. This occurred in simulations both with and without random fluctuations, thus the root cause of this behaviour was not the presence of the random fluctuations. Figure 9 illustrates the behaviour, where there was a lower number of Pag step increases (one less in Figure 9a) and an unusual COL profile towards the end of the bioreaction (Figure 9b). This behaviour did not have a major influence on bioreaction time or total energy requirement, even at a very low COL_FLD of 0.1 mg L1, where the bioreaction time increased by 0.2 h and the total energy increased by 3.7%.
The rationale for the behaviour is somewhat complex. Before a Pag step increase, COL decreases towards COL_FLD due to the onset of flooding and the PID controller correspondingly causes an increase in vvm, as illustrated in Figure 9b. This moves the system further into the flooding zone, which reduces kLa and causes COL to rapidly decrease. This usually results in a Pag step increase when COL decreases to COL_FLD. However, in the latter part of the bioreaction (Figure 9b), the rate of decrease of COL suddenly changed to a slower rate and COL decreased more slowly towards COL_FLD. This sudden transition corresponded to, or was triggered by, vvm attaining its maximum value (vvmmax). This is a specified value in the model that equals the value of vvm at the onset of flooding at the final value of Pag. Once vvm becomes constant, kLa also attains a constant value, and a complex interplay between variables occurs, which causes COL to decrease at a much slower rate. This slower decrease in COL results in COL not being reduced to COL_FLD before the end of the bioreaction (as illustrated in Figure 9b) and, thus, the final Pag step was not triggered (Figure 9a).
An initial suggestion to overcome this might be to increase the value of vvmmax, because limiting this value caused the slowing of the decreases in COL that resulted in the final Pag step increase not being triggered. This was simulated; however, the modelling showed that this worked for some simulations, but not so for other simulations, especially those at low values of COL_FLD. The reason for this approach not working is because increasing vvm beyond the original specified vvmmax does trigger the Pag step increase as desired; however, the higher vvm is in the flooding zone at the higher final Pag value. How far it is into the flooding zone has a major influence on kLa and OTR. If too far into the flooding zone, insufficient OTR is developed and COL will continue to decrease towards zero, slowing the bioreaction and significantly increasing the bioreaction time.
The net effect of the above is that reducing COL_FLD to low values, e.g., <0.8 mg L1 in the simulations, can result in complex dynamics occurring, as highlighted above. However, it might not be necessary to operate at such low values of COL_FLD and, consequently, the issue will not manifest itself. Furthermore, the behaviour that is illustrated in Figure 9 resulted in a minor reduction in bioreactor performance, with only small increases in energy requirement and bioreaction time.

4. Conclusions

A PID controller was used to control vvm, so as to maintain COL at a constant value of 2 mg L1 throughout a simulated bioreaction whose OUR progressively increased over time. When Pag is kept constant throughout the bioreaction, this leads to excessive oxygen transfer energy requirement, because a high value of Pag is required at maximum OUR to prevent flooding. Operating at or near the impeller flooding constraint throughout the bioreaction results in the minimum energy requirement for oxygen transfer (strategy Cmin); however, this might prove impractical to control and operate in practice. It was shown that most of the energy saving that is associated with Cmin could be achieved by dividing the bioreaction time into a small number of time segments (e.g., 5) with lower constant Pag values. The onset of flooding occurs at the end of each time segment and this initiates a Pag step increase for the next time segment. To implement this, the onset of flooding needs to be detected in order to signal the increase in Pag. This was achieved while using the simulated COL vs. time data, where there was a rapid decrease in COL when flooding occurred, and this was used to detect the onset of flooding and initiate the step increase in Pag for the next time segment. Random fluctuations in the oxygen sensor readings can cause unwanted Pag step increases, which could reduce the energy saving potential; however, the incorporation of lower values of COL_FLD and moving averages can overcome this problem. The insights developed in this paper are coming from mathematical modelling simulations and some practical insights (such as sensor measurement fluctuations); consequently, practical experimental and pilot scale work is required to test and further develop the presented ideas. Furthermore, there might be other practical constraints that may influence the determination of vvm and Pag and impact on the energy reduction potential, such as foaming and the shear sensitivity of cells. Finally, the control of oxygen transfer coupled with reducing the energy requirement is complex, as there are many variables that can interact with each other, which sometimes might result in unusual non-intuitive behaviours. The implementation of modelling simulations and interrogating the resulting data can help to explain these behaviours.

Author Contributions

J.J.F. supervised all of the work presented in the paper and wrote the paper. F.G., E.M. contributed to the development of the mathematical models, execution of the models to generate the results and to the analysis and interpretation of the results. All authors have read and agreed to the published version of the manuscript.

Funding

This research received no external funding.

Conflicts of Interest

The authors declare no conflict of interest.

List of Symbols

COLoxygen concentration in the bioreaction liquid (mg L−1)
COL_FLDoxygen concentration at which Pag step increase occurs (mg L−1)
COL_sensorsimulated oxygen sensor measurement (mg L−1)
OL_senMAmoving average of COL_sensor values (mg L−1)
COL_spoxygen concentration controller set-point (mg L−1)
Eagagitator electrical energy (GJ)
Eccompressor electrical energy (GJ)
Etotsum of agitator and compressor electrical energy (GJ)
e(t)difference between O2 concentration set-point and simulated value (mg L−1)
FGinlet air volumetric flowrate (m3 h−1)
kLavolumetric oxygen mass transfer coefficient (h−1)
KdKiKpPID controller constants
Nnumber of time increments
OURoxygen uptake rate (g L−1 h−1)
OTRoxygen transfer rate (g L−1 h−1)
Pproduct concentration (g L−1)
Pagagitator mechanical power input (kW)
Ssugar concentration (g L−1)
ttime (hours)
T0oscillation period PID controller (h)
VLbioreactor working volume (m−3)
vvmvolume of air per minute per unit bioreactor working volume (min−1)
v s air superficial velocity (m h−1)
v s F air superficial velocity at onset of flooding (m h−1)
Xcell concentration (g L−1)
Ymaximum random fluctuation amplitude in oxygen concentration (mg L−1)
µspecific growth rate (h−1)
µmaxmaximum specific growth rate (h−1)
τiτdPID controller parameters (h)

References

  1. García-Ochoa, F.; Gomez, E. Bioreactor scale-up and oxygen transfer rate in microbial processes: An overview. Biotechnol. Adv. 2009, 27, 153–176. [Google Scholar] [CrossRef] [PubMed]
  2. Juarez, P.; Orejas, J. Oxygen transfer in a stirred reactor in laboratory scale. Lat. Am. Appl. Res. 2001, 31, 433–439. [Google Scholar]
  3. Demirtas, M.U.; Kolhatkar, A.; Kilbane, J.J. Effect of aeration and agitation on growth rate of Thermus thermophilus in batch mode. J. Biosci. Bioeng. 2003, 95, 113–117. [Google Scholar] [CrossRef]
  4. Bandaiphet, C.; Prasertsan, P. Effect of aeration and agitation rates and scale-up on oxygen transfer coefficient, kLa in exopolysaccharide production from Enterobacter cloacae WD7. Carbohydr. Polym. 2006, 66, 216–228. [Google Scholar] [CrossRef]
  5. Huang, W.-C.; Chen, S.-J.; Chen, T.-L. The role of dissolved oxygen and function of agitation in hyaluronic acid fermentation. Biochem. Eng. J. 2006, 32, 239–243. [Google Scholar] [CrossRef]
  6. Emily, L.; Nandong, J.; Samyudia, Y. Experimental Investigation on the Impact of Aeration Rate and Stirrer Speed on Micro-Aerobic Batch Fermentation. J. Appl. Sci. 2009, 9, 3126–3130. [Google Scholar] [CrossRef] [Green Version]
  7. Radchenkova, N.; Vassilev, S.; Martinov, M.; Kuncheva, M.; Panchev, I.; Vlaev, S.; Kambourova, M. Optimization of the aeration and agitation speed of Aeribacillus palidus 418 exopolysaccharide production and the emulsifying properties of the product. Process. Biochem. 2014, 49, 576–582. [Google Scholar] [CrossRef]
  8. Tervasmäki, P.; Latva-Kokko, M.; Taskila, S.; Tanskanen, J. Effect of oxygen transfer on yeast growth—Growth kinetic and reactor model to estimate scale-up effects in bioreactors. Food Bioprod. Process. 2018, 111, 129–140. [Google Scholar] [CrossRef]
  9. Felder, M.; Simmons, A.; Shambaugh, R.; Sikavitsas, V. Effects of Flow Rate on Mesenchymal Stem Cell Oxygen Consumption Rates in 3D Bone-Tissue-Engineered Constructs Cultured in Perfusion Bioreactor Systems. Fluids 2020, 5, 30. [Google Scholar] [CrossRef] [Green Version]
  10. Alves, S.S.; Vasconcelos, J.M.T. Optimisation of agitation and aeration in fermenters. Bioprocess Eng. 1996, 14, 119–123. [Google Scholar] [CrossRef]
  11. Humbird, D.; Davis, R.; McMillan, J.D. Aeration costs in stirred-tank and bubble column bioreactors. Biochem. Eng. J. 2017, 127, 161–166. [Google Scholar] [CrossRef]
  12. Benz, G.T. Impeller selection for agitated aerobic fermenters. Chem. Eng. Prog. 2004, 100, 18S–20S. [Google Scholar]
  13. Buffo, M.; Corrêa, L.; Esperança, M.; Cruz, A.J.G.; Farinas, C.; Badino, A.C. Influence of dual-impeller type and configuration on oxygen transfer, power consumption, and shear rate in a stirred tank bioreactor. Biochem. Eng. J. 2016, 114, 130–139. [Google Scholar] [CrossRef]
  14. Schaepe, S.; Kuprijanov, A.; Sieblist, C.; Jenzsch, M.; Simutis, R.; Lübbert, A. kLa of stirred tank bioreactors revisited. J. Biotechnol. 2013, 168, 576–583. [Google Scholar] [CrossRef]
  15. Gakingo, G.; Clarke, K.; Louw, T. A numerical investigation of the hydrodynamics and mass transfer in a three-phase gas-liquid-liquid stirred tank reactor. Biochem. Eng. J. 2020, 157, 107522. [Google Scholar] [CrossRef]
  16. Rahimi, M.J.; Sitaraman, H.; Humbird, D.; Stickel, J.J. Computational fluid dynamics study of full-scale aerobic bioreactors: Evaluation of gas–liquid mass transfer, oxygen uptake, and dynamic oxygen distribution. Chem. Eng. Res. Des. 2018, 139, 283–295. [Google Scholar] [CrossRef]
  17. De Jesus, S.S.; Neto, J.M.; Filho, R. Hydrodynamics and mass transfer in bubble column, conventional airlift, stirred airlift and stirred tank bioreactors, using viscous fluid: A comparative study. Biochem. Eng. J. 2017, 118, 70–81. [Google Scholar] [CrossRef]
  18. Nienow, A.W. Mass transfer and mixing across the scales in animal cell culture. In Animal Cell Culture; Al-Rubeai, M., Ed.; Volume 9, Cell Engineering; Springer: Cham, Switzerland, 2015. [Google Scholar]
  19. Benz, G.T. Optimize power consumption in aerobic fermenters. Chem. Eng. Prog. 2003, 99, 32–35. [Google Scholar]
  20. Benz, G.T. Cut agitator power costs. Chem. Eng. Prog. 2012, 108, 40–43. [Google Scholar]
  21. Zamouche, R.; Bencheikh-Lehocine, M.; Meniai, A.-H. Oxygen transfer and energy savings in a pilot-scale batch reactor for domestic wastewater treatment. Desalination 2007, 206, 414–423. [Google Scholar] [CrossRef]
  22. Hu, D.; Luo, K.; Ma, H.; Min, H.; Zhao, Y.; Cui, Y.; Wang, S.; Ning, N.; Zhang, L.; Liu, W. A sustainability anti-infective pharmaceutical wastewater treatment technology: Multi-stage vertical variable diameter membrane bioreactor with DO online controlling. Bioresour. Technol. 2020, 311, 123507. [Google Scholar] [CrossRef] [PubMed]
  23. Chitra, M.; Natarajan, P.; Abraham, A. Dissolved Oxygen Control of Batch Bioreactor using Model Reference Adaptive Control scheme. IFAC-PapersOnLine 2018, 51, 13–18. [Google Scholar] [CrossRef]
  24. Du, X.; Wang, J.; Jegatheesan, V.; Shi, G. Dissolved Oxygen Control in Activated Sludge Process Using a Neural Network-Based Adaptive PID Algorithm. Appl. Sci. 2018, 8, 261. [Google Scholar] [CrossRef] [Green Version]
  25. Simutis, R.; Lübbert, A. Bioreactor control improves bioprocess performance. Biotechnol. J. 2015, 10, 1115–1130. [Google Scholar] [CrossRef]
  26. Jonelis, K.; Brazauskas, K.; Levisauskas, D. A system for dissolved oxygen control in industrial aeration tank. Inf. Technol. Control 2012, 41, 46–52. [Google Scholar] [CrossRef] [Green Version]
  27. Oliveira, R.; Simutis, R.; De Azevedo, S.F. Design of a stable adaptive controller for driving aerobic fermentation processes near maximum oxygen transfer capacity. J. Process. Control 2004, 14, 617–626. [Google Scholar] [CrossRef]
  28. Kreyenschulte, D.; Emde, F.; Regestein, L.; Büchs, J. Computational minimization of the specific energy demand of large-scale aerobic fermentation processes based on small-scale data. Chem. Eng. Sci. 2016, 153, 270–283. [Google Scholar] [CrossRef]
  29. Fitzpatrick, J.; Gloanec, F.; Michel, E.; Blondy, J.; Lauzeral, A. Application of Mathematical Modelling to Reducing and Minimising Energy Requirement for Oxygen Transfer in Batch Stirred Tank Bioreactors. ChemEngineering 2019, 3, 14. [Google Scholar] [CrossRef] [Green Version]
  30. Buffo, M.M.; Esperança, M.N.; Béttega, R.; Farinas, C.S.; Badino, A.C. Oxygen Transfer and Fragmentation of Aspergillus niger Pellets in Stirred Tank and Concentric-Duct Airlift Bioreactors. Ind. Biotechnol. 2020, 16, 67–74. [Google Scholar] [CrossRef]
  31. Seborg, D.E.; Edgar, T.F.; Mellichamp, D.A.; Doyle, F.J., III. Process Control and Dynamics; John Wiley & Sons: Hoboken, NJ, USA, 2011. [Google Scholar]
  32. Bakker, A.; Smith, J.M.; Meyers, K.J. How to disperse gases in liquids. Chem. Eng. 1994, 12, 98–104. [Google Scholar]
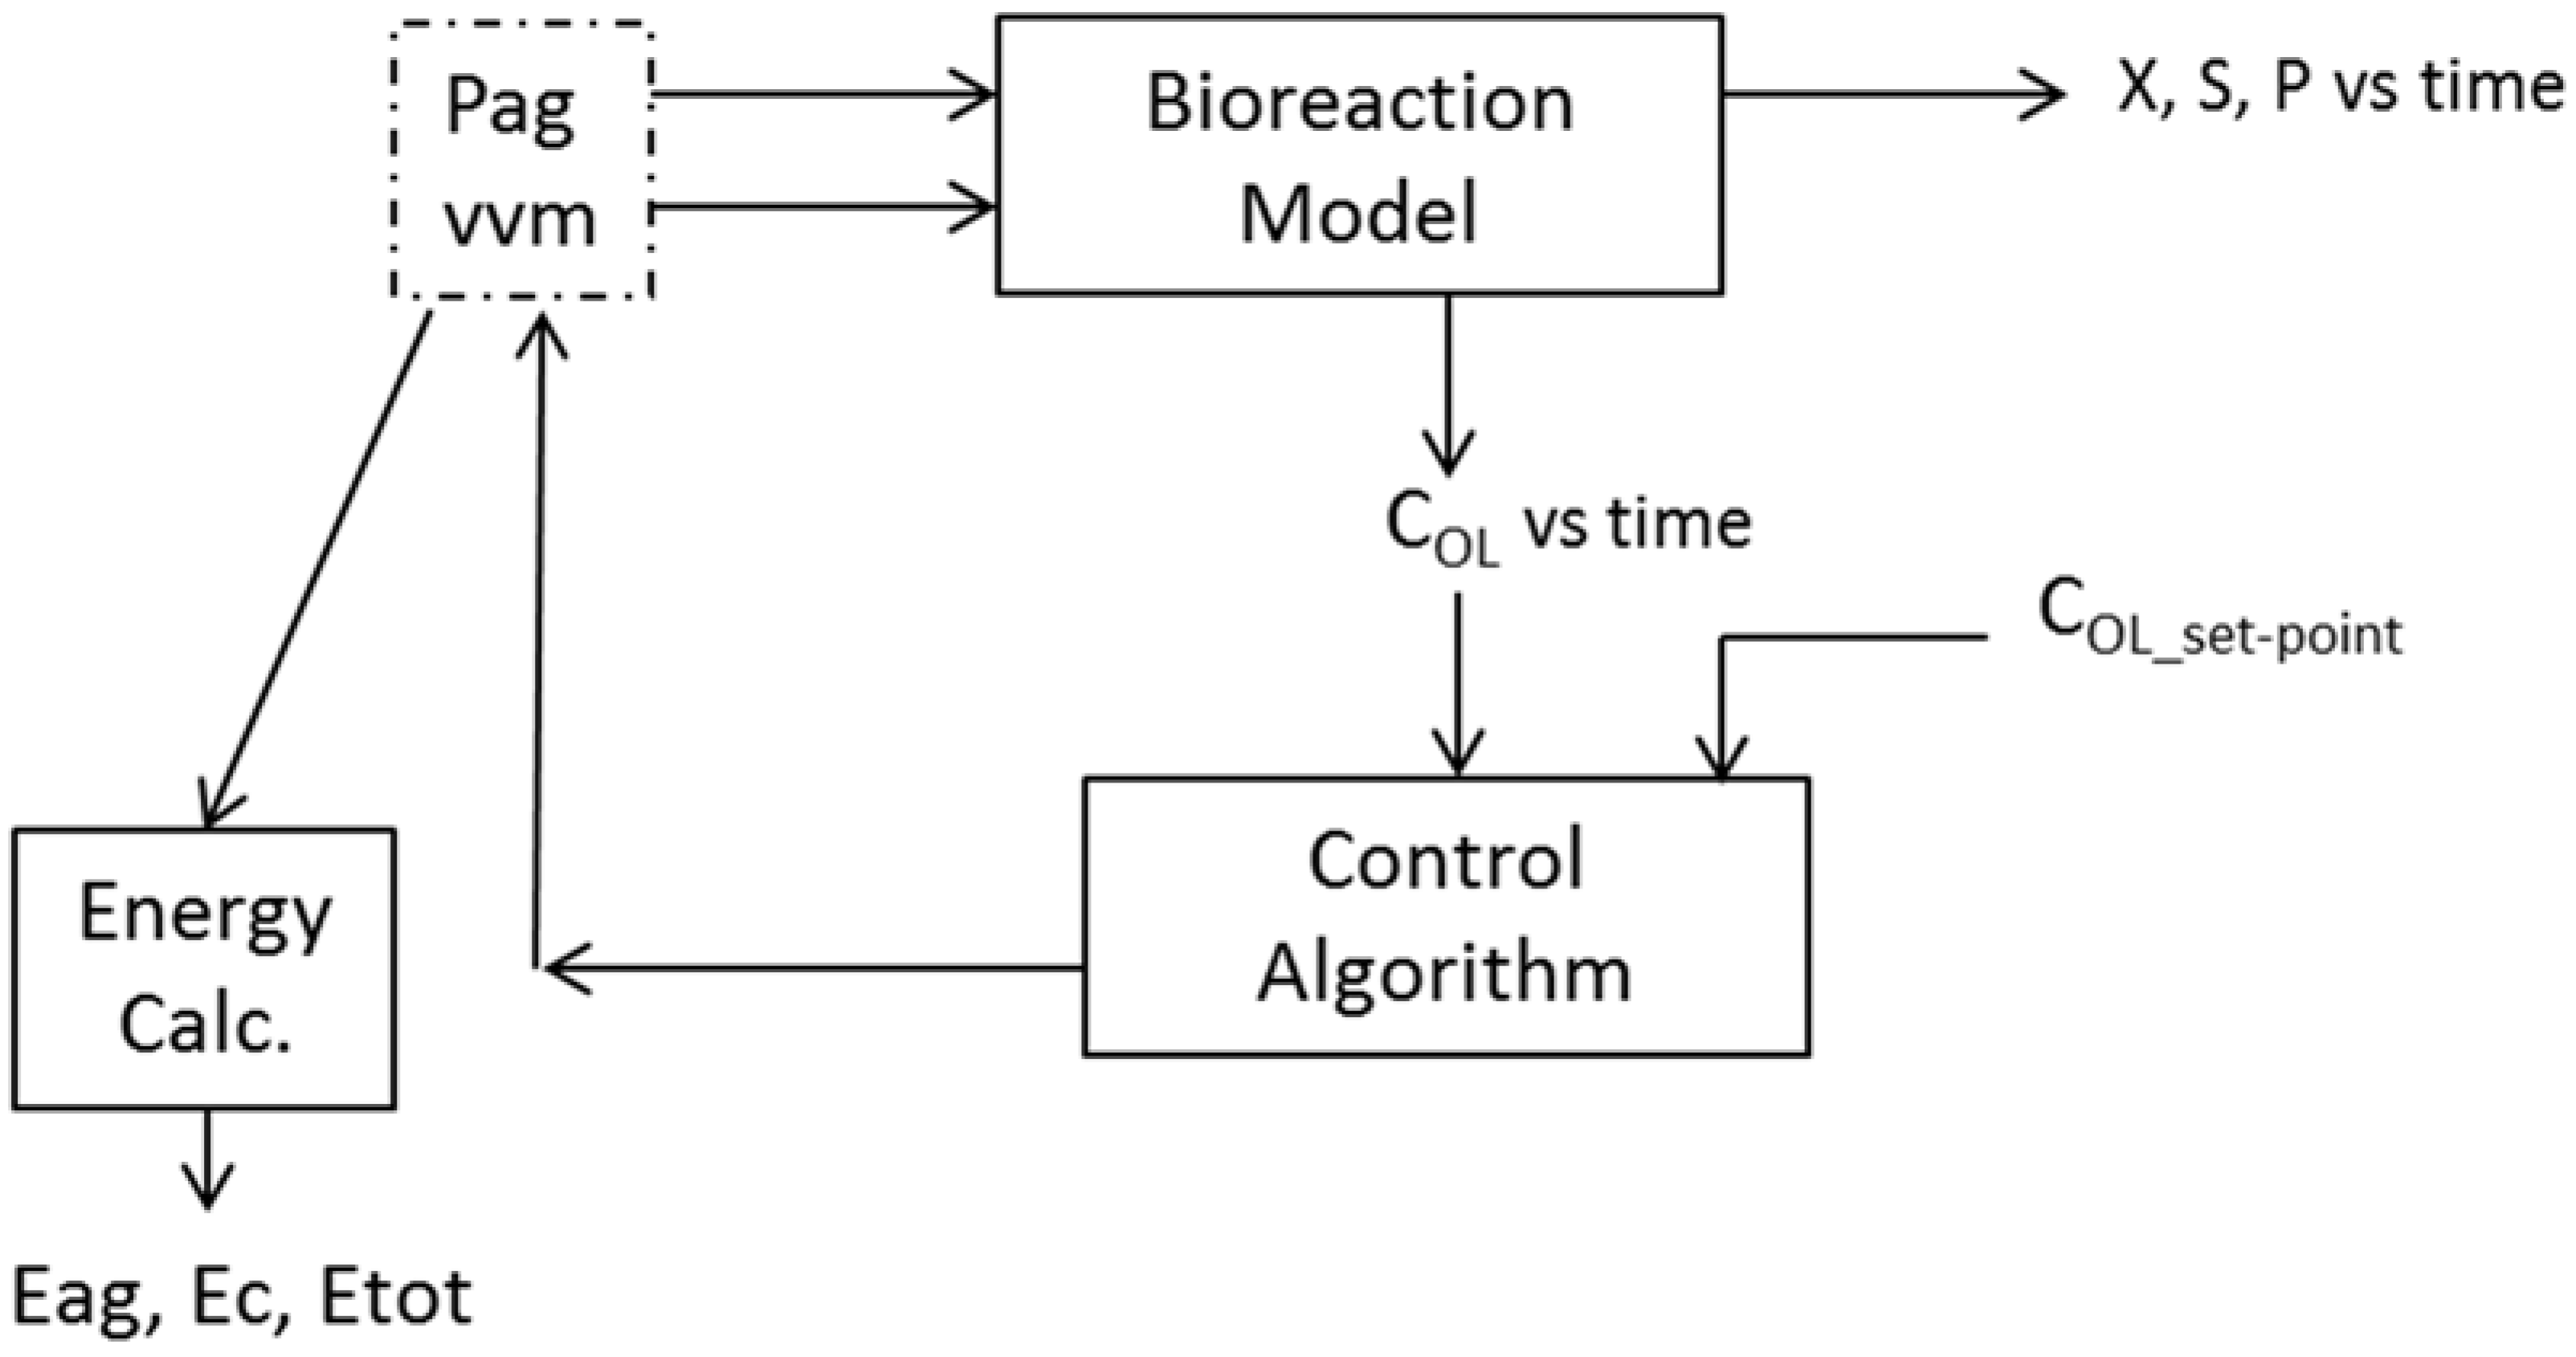
Figure 1. General schematic of control strategy.
Chemengineering 04 00034 g001
Figure 2. Bioreaction kinetics: (a) Cell, sugar, and product concentrations and oxygen uptake rate (OUR) (Strategy C1: COL = 2 mg L1, Pag = 38.5 kW); and, (b) effect of oxygen concentration and sugar concentration (S) on specific growth rate.
Chemengineering 04 00034 g002
Figure 3. Scenario C1-5: Effect of proportional, integral, and derivative (PID) control on (a) Pag step increases and (b) COL and vvm (five equal time segments—non-flooding).
Chemengineering 04 00034 g003
Figure 4. Effect of vvm and Pag on kLa in the non-flooded and flooded regions using a symmetrical kLa model.
Chemengineering 04 00034 g004
Figure 5. Effect of flooding on control strategy C1. (Pag = 3.8 kW and flooding occurs at 15.51 h).
Chemengineering 04 00034 g005
Figure 6. Control strategy C1F-5 (with automatic detection of flooding; COL_FLD = 1.9 mg L1): (a) Pag step increases; and, (b) COL and vvm.
Chemengineering 04 00034 g006
Figure 7. (a) Random fluctuation (Y = 0.2) of sensor oxygen concentration in liquid (COL_sensor), and its effect on the evolution of (b) Pag, and (c) COL for control strategy C1F-5 (with automatic detection of flooding; COL_FLD = 1.9 mg L1).
Chemengineering 04 00034 g007
Figure 8. Comparison of the sensor oxygen concentration in liquid (COL_sensor) and its moving average (COL_senMA).
Chemengineering 04 00034 g008
Figure 9. Effect of COL_FLD = 0.5 mg L1 on control strategy C1F-5 (with automatic detection of flooding; Y = 0): (a) Pag step increases; and, (b) COL and vvm (Note: time starts at 17 h).
Chemengineering 04 00034 g009
Table 1. Comparison of energy requirements (MJ) for the different strategies (set-point COL = 2 mg L1). The % energy savings are relative to strategy C1.
Control StrategyAgitator
Eag
Compressor
Ec
Total
Etot
Energy Savings (%)
C141044594563-
Cmin746706145268.2
C1-22174463263742.2
C1-51221529175061.6
C1-10965590155565.9
Table 2. Comparison of energy requirements (MJ) for the strategies with onset of flooding detection (C1F-N) (set-point COL = 2 mg L1). The % energy savings are relative to strategy C1.
Control StrategyAgitator
Eag
Compressor
Ec
Total
Etot
Energy Savings (%)
C141044594563-
Cmin746706145268.2
Strategy C1F-N
C1F-22303520282338.1
C1F-51305596190158.3
C1F-101001635163764.1
Table 3. Effect of Y and COL_FLD on whether or not unwanted Pag step increases occurred (Yes/No) (set-point COL = 2 mg L1).
COL_FLD
(mg L1)
Y = 0.1Y = 0.3Y = 0.5
0.8NoNoYes
1.2NoYesYes
1.5NoYesYes
1.7YesYesYes
1.9YesYesYes
Colour signifies that constraint in Equation (10) was met.