Abstract
The physical properties, like density and viscosity, of alkanolamine + H2O (water) + CO2 (carbon dioxide) mixtures receive a significant amount of attention as they are essential in equipment sizing, mathematical modelling and simulations of amine-based post-combustion CO2 capture processes. Non-linear models based on artificial neural networks (ANNs) were trained to correlate measured densities and viscosities of monoethanol amine (MEA) + H2O, MEA + H2O + CO2, and 2-amino-2-methyl-1-propanol (AMP) + MEA + H2O + CO2 mixtures and results were compared with conventional correlations found in literature. For CO2-loaded aqueous amine mixtures, results from the ANN models are in good agreement with measured properties with less than 1% average absolute relative deviation (AARD). The ANN-based methodology shows much better agreement (R2 > 0.99) between calculated and measured values than conventional correlations.
1. Introduction
Carbon dioxide (CO2) removal from flue gas using chemical absorption has been studied intensively to find a suitable alkanolamine to make the process feasible. It has been proven that chemical absorption with aqueous alkanolamines is an efficient method for CO2 capture where the gas streams have low CO2 concentrations. Alkanolamines exhibit different physicochemical properties depending on the structural characteristics due to the hydroxyl and the amino groups. The amino group in the alkanolamine allows reacting amine with acid gases [1,2]. The presence of a hydroxyl group enhances the water solubility and reduces the volatility. Monoethanol amine (MEA) is a primary amine known as the most basic and reactive amine for acid gas removal [1]. Although MEA provides high reactivity, it has thermodynamic limitations that limit the overall performance of the CO2 capture [3]. As a result, the interest has shifted towards other amine solvents like sterically hindered amines, which overcome several issues with using MEA. 2-amino-2-methyl-1-propanol (AMP) is a sterically hindered primary amine, which provides high absorption capacity with superior stripping qualities [4,5]. The aqueous blend of AMP with MEA can provide high absorption capacity and reaction rate under low energy demand in favor of process feasibility.
Physical properties such as density and viscosity of CO2 loaded aqueous amine mixtures are used in process equipment design, modelling and simulation of the amine-based post-combustion CO2 capture processes. Several empirical correlations were developed by Weiland et al. [6], Han et al. [7] and Jayarathna et al. [2], which are acceptable and can be used in process design and simulations. For the density of aqueous MEA mixtures, the approach of suggesting a Redlich-Kister type polynomial for the excess molar volume is commonly used [8]. Similarly, the viscosity deviation from the ideal mixtures was correlated to fit viscosity data of the aqueous mixtures. Constructing a theoretical model that suits the CO2-loaded aqueous amine mixtures is a difficult task due to inadequate understanding of the physics and chemistry of the mixtures. The Redlich-Kister model for excess properties of binary mixtures is given as:
where and are the excess property, mole fraction of the components and regression parameters, respectively.
This model has been applied in several studies to correlate excess volume of the aqueous amine or amine mixtures to correlate density of the solutions [7,9,10,11]. It requires a higher degree polynomial with a large number of parameters to achieve a good fit for the measured data. Hartono et al. [11] suggested a lower degree polynomial with less number of parameters for the aqueous MEA mixtures. The Redlich-Kister approach can be extended to ternary mixtures by considering binary parameters as explained in Equation (1) [12,13]. Literature can be found for the application of Redlich-Kister equation to correlate excess viscosity of binary amine mixtures [14], while Hartono et al. [11] used a lower degree polynomial to achieve an acceptable accuracy of predictions.
It is important to correlate the physical properties of CO2 loaded aqueous amine mixtures as the absorber and desorber operate with solvents with dissolved CO2. The accuracy of design of such a process highly depends on solution properties. Only a few attempts have been made to develop correlations for CO2 loaded amine solutions and they are based on statistical regression on measured data. Weiland et al. [6] and Hartono et al. [11] proposed correlations for density and viscosity of CO2-loaded aqueous MEA mixtures. Zhang et al. [15] discussed the density and viscosity of CO2-loaded aqueous 2-dimethylaminoethanol (DMAE) and 2-diethylaminoethanol (DEAE) solutions.
1.1. Weiland’s Density and Viscosity Correlations
1.1.1. Density Correlation
Weiland’s density correlation [6] is defined by Equations (2)–(5).
where and are the density of the CO2 loaded aqueous MEA mixture, molar volume, temperature, mole fraction and molecular weight of the species, respectively. Molar volume with no subscript refers the molar volume of the mixture and subscript and refer to MEA, H2O and CO2, respectively. and are regression parameters used to fit the density data.
1.1.2. Viscosity Correlation
Weiland’s viscosity correlation [6] is defined by Equation (6)
where and are the viscosity of CO2-loaded aqueous MEA mixture, viscosity of H2O, temperature, CO2 loading and weight percentage of MEA in the aqueous mixture, respectively.
1.2. Hartono’s Density and Viscosity Correlations
1.2.1. Density Correlation
Hartono’s density correlations [11] are defined by Equations (7)–(11).
For non-loaded solutions,
where and are the excess molar volume, temperature, mole fractions, molecular weight, density of the aqueous mixture and density of the pure components, respectively.
For CO2-loaded solutions,
where and are the density of the CO2-loaded aqueous MEA mixture, density of the aqueous MEA mixture, CO2 added to the solution on a mass basis, mole fractions and molecular weight, CO2 loading and volume expansion caused by the CO2 addition, respectively. Here, and refer to MEA, H2O and CO2, respectively.
1.2.2. Viscosity Correlation
Hartono’s viscosity correlation [11] are defined by Equations (12)–(15).
For non-loaded solutions,
where and are the viscosity of the aqueous MEA mixture, viscosity deviation from ideal mixture viscosity, viscosity of pure components and mole fractions, respectively.
For CO2-loaded solutions,
where and are viscosity of the CO2 loaded aqueous MEA mixture, viscosity of the aqueous MEA mixture, viscosity deviation, CO2 loading and mole fractions respectively. Here, and refer to MEA, H2O and CO2, respectively.
The approach of constructing an artificial neural network (ANN) to correlate physical properties has been done for various liquid mixtures including different amine blends that can be used in post-combustion CO2 capture. A properly trained ANN is able to correlate data with high accuracy. Garg et al. [16] reported a study of density prediction using ANNs for aqueous MEA mixtures under different compositions and temperatures. Pouryousefi et al. [17] discussed ANNs for various physical properties including density, viscosity, refractive index, heat capacity, thermal conductivity and thermal diffusivity of CO2 loaded MEA + DEAB (4-(diethylamino)-2-butanol) + H2O and MEA+ MDEA (methyldiethanol amine) + H2O mixtures. Haratipour et al. [18] adopted an approach of training ANNs for density and viscosity of various blends of alkanolamine with H2O. Pierantozzi et al. [19] investigated the applicability of ANNs for predicting the thermal conductivity of liquid alcohols for a wide range of temperatures. The approach has been taken into more complex mixtures such as biodiesel that contains various components. Several properties, including density, viscosity, cetane number, iodine value and induction period, were correlated using ANNs by Rocabruno-Valdés et al. [20] and Barradas Filho et al. [21].
In this study, several feedforward backpropagation artificial neural networks are trained to predict the density and viscosities of MEA + H2O + CO2 and AMP + MEA + H2O + CO2 mixtures. The predictions are compared with existing correlations found in the literature.
2. Materials and Methods
2.1. Material Description and Sample Preparation
Table 1 lists the material used in this study. Deionized water (resistivity 18.2 MΩ cm) was degassed using a rotary evaporator for the preparation of aqueous amine solutions. The weight of the materials was measured via an electronic balance from Mettler Toledo, model: XS-403S (Greifensee, Switzerland) with a resolution of 1 mg. The CO2 loading of aqueous amine solutions was performed by bubbling CO2 through an aqueous amine mixture until the pH becomes steady. Later, a series of CO2-loaded solutions were prepared by mixing CO2-loaded aqueous amine solution and aqueous amine solution with different mass ratios. The CO2 concentration in the solutions was determined by a titration method as explained by Jayarathna et al. [2] and Han et al. [7].

Table 1.
Description of materials used for the experiments.
2.2. Density Measurements
The density of the mixtures was measured using a density meter DMA 4500 from Anton Paar (Graz, Austria). The density meter consists of a vibrating U-tube in which the resonance frequency of the U-tube with the sample is measured and used for the density calculations. The accuracy of the measurements highly depends on the calibration of the instrument. Accordingly, the DMA 4500 was calibrated with air and degassed water and the validity of the calibration was examined via density check frequently. During the experiments, the sample (approximately 5 mL) should be carefully injected into the U-tube to avoid any bubble formation that causes errors in the final reading. The density measurements in DMA 4500 were performed at atmospheric pressure and the maximum temperature was limited to 363.15 K. A separate sample was used for each measurement at each temperature and composition. Final density measurements were considered as the average of three replicates.
2.3. Viscosity Measurements
The dynamic viscosity of the mixtures was measured using an Anton Paar (Graz, Austria) Physica MCR 101 rheometer with a double-gap measuring system. The calibration of the measuring system was performed by using viscosity reference standard S3S from Paragon Scientific Ltd (Prenton, United Kingdom). The viscosity of the viscosity standard fluid was measured and compared with the values at different temperatures as provided by the supplier. The deviations between measured and reference data were considered and measured viscosities of amine + H2O + CO2 mixtures were corrected accordingly. For the viscosity of measured temperatures where reference data are not available, viscosity deviations were determined through linear interpolation. In order to maintain the solution temperature precisely, a temperature controlling system with temperature uncertainty 0.03 K was equipped with the instrument. The measurements below the temperature of 303.15 K were obtained using an external Anton Paar Viscotherm VT 2 cooling system with a standard temperature uncertainty of 0.02 K. A liquid sample of 7 mL was transferred into the pressure cell. The pressure cell XL was pressurized with N2 gas at 4 bar to avoid degassing of CO2 from the sample. The viscosity data were considered as the average of three replicates.
2.4. Experiments
For MEA + H2O mixtures (30–100 mass% of MEA), the viscosities were measured under the temperature range of 293.15–353.15 K. The density and viscosity of MEA + H2O + CO2 mixtures were measured under different MEA concentrations (30–50 by mass% of aqueous solution), five different CO2 loadings (<0.6 mol CO2/ mol MEA) and the temperatures (293.15–353.15 K). Similarly, the density and viscosity of AMP + MEA + H2O + CO2 mixtures were over a range of different compositions of AMP, MEA and H2O, five different CO2 loadings (<0.6 mol CO2/ mol amine) and the temperature range of 293.15–353.15 K. The concentrations of aqueous MEA + H2O and AMP + MEA + H2O mixtures with corresponding CO2 loadings are given in Table 2.
Table 2.
Characteristics of the amine mixtures.
2.5. Activation Function of the ANN
Several activation functions are available to use in a hidden layer as a sigmoid, inverse tangent, hyperbolic tangent and saturated linear function. For the ANN developed in this study, the activation or transfer function in the hidden layer is a hyperbolic tangent and a linear relation is used for the output layer. In the Equations (16)–(18), the equations involved within a single hidden layer ANN are shown.
where , , , and are the inputs to the network, inputs to the hidden neurons, weight between network input and the hidden neurons and bias term to hidden neurons, respectively. The subscript and are for number of hidden neurons and number of inputs, respectively.
The hyperbolic tangent and linear relation are given in Equations (17) and (18).
where and are the input weights and bias in the output layer, respectively.
2.6. ANN Training
In the developed ANN models, the mole fractions of components and the temperature are considered as the inputs for the network. One hidden layer with multiple neurons is adopted for the training with the learning algorithm of Bayesian regularization (BR). The optimum number of neurons for the hidden layer was found by analyzing the cost function of mean squared error (MSE) for BR [22] as given in Equation (19) over thirty neurons. All the networks are with a single output for density and viscosity in each amine mixture. The input data sets were divided into 70%, 15% and 15% randomly for the training, validation and testing. Data were scaled in the range of (−1, 1) before they were used for the training of ANN. Figure 1 illustrates a schematic of neurons in an ANN consisting of one hidden layer with a single output. The measured data by the authors to perform this study can be found in the sources [23,24]. Table 3 lists the number of data used in amine mixtures for the study. The Supplementary Materials provide calculated weights and bias for the ANNs and figures of
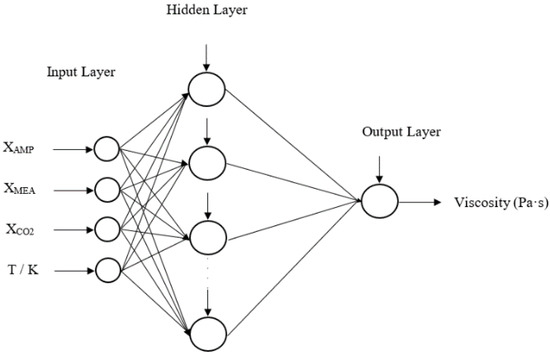
Figure 1.
A schematic of feed forward artificial neural network with one hidden layer.
Table 3.
Number of data used in amine mixtures.
- (a)
- RMSE (root mean squared error) for test data versus number of hidden neurons.
- (b)
- MSE for (training + validation + test) data versus number of hidden neurons.
- (c)
- Learning curves of ANNs.
3. Results and Discussions
This section discusses the performance of ANN in density and viscosity predictions of considered CO2-loaded alkanolamine + H2O mixtures. The ANN-based models were evaluated using average absolute relative deviation (AARD) as given in Equation (20).
where N, and refer to the number of data points, the measured property and calculated property, respectively.
3.1. Density from ANN Based Models and Empirical Correlations
The measured densities of MEA + H2O + CO2 and AMP + MEA + H2O + CO2 mixtures were used to train, validate and test two feed forward back propagation ANNs. The density of the mixtures increases with the increase in dissolved CO2 and decreases with the increase in temperature. The prediction accuracy was analyzed through calculated AARD between measured data and predictions. Here the measured data were the same data that have been used to train, validate and test the ANNs. Han et al. [7] improved Weiland’s correlation to fit data at different temperatures. Accordingly, the improved Weiland’s density correlation was adopted to compare with predictions from ANN to study the possible deviations between different approaches. For the density of MEA + H2O + CO2 mixtures, mole fractions of MEA, CO2 and temperature were considered as the inputs. In the CO2-loaded mixtures, CO2 reacts with amines to produce carbamate and bicarbonate. The mole fractions of CO2 in the mixtures were calculated considering it as unreacted with the amine. This method was adopted by several authors [6,11] to develop correlations and the same technique was followed. In AMP + MEA + H2O + CO2 mixtures, inputs were considered as mole fractions of AMP, MEA, CO2 and temperature. Table 4 lists the information related to the trained ANNs for densities.
Table 4.
Performance of trained artificial neural networks (ANNs) for density.
Figure 2a,b illustrate the comparison of ANN predictions with correlations from Han et al. [7] and Hartono et al. [11] for MEA + H2O + CO2 mixtures. The correlation presented by Han et al. [7] is a modified Weiland’s correlation that was fitted for densities of MEA + H2O + CO2 mixtures over a range of temperatures. Han’s correlation was capable of predicting densities at 0.4% AARD while Hartono’s correlation predicts at a 0.3% AARD. Comparison of these correlations with ANN shows that a properly trained network is capable of predicting density at a high accuracy compared to measured data. A modified Weiland’s correlation for amine mixtures with more than one amine is adopted for molar volume of AMP + MEA + H2O + CO2 mixtures [24] to fit density and was compared with ANN predictions. The modified Weiland’s correlation was able to fit density with 0.4% AARD and ANN predictions showed better accuracies compared to the modified Weiland’s correlation. Figure 3a,b show the comparison of correlated densities from ANN and the modified Weiland’s correlation.
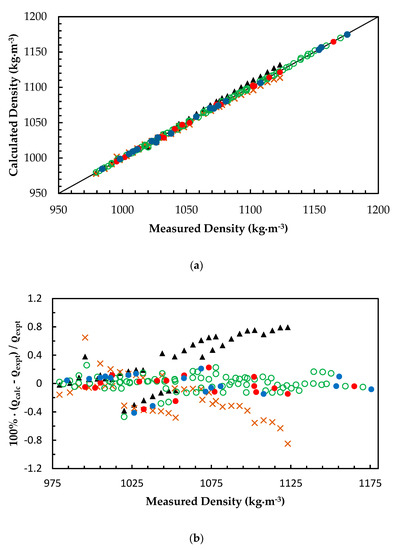
Figure 2.
(a) Comparison of correlated density with measured density for monoethanol amine (MEA) + H2O + CO2 mixtures. ANN: Training data, ‘○’; Validation data, ‘●’; Test data, ‘●’. Hartono et al. [11], ‘▲’. Han et al. [7], ‘x’. (b) Percentage deviation of correlated density from measured density for MEA + H2O + CO2 mixtures. ANN: Training data, ‘○’; Validation data, ‘●’; Test data, ‘●’. Hartono et al. [11], ‘▲’. Han et al. [7], ‘x’.
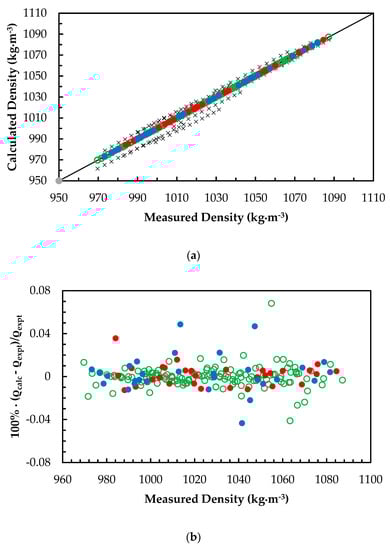
Figure 3.
(a) Comparison of correlated density with measured density for 2-amino-2-methyl-1-propanol (AMP) + MEA + H2O + CO2 mixtures. ANN: Training data, ‘○’; Validation data, ‘●’; Test data, ‘●’. Modified Weiland’s correlation, ‘x’. (b) Percentage deviation of correlated density from measured density for AMP + MEA + H2O + CO2 mixtures. ANN: Training data, ‘○’; Validation data, ‘●’; Test data, ‘●’.
3.2. Viscosity from ANN Based Models and Empirical Correlations
Three feed forward back propagation ANNs were developed for measured viscosities of MEA + H2O, MEA + H2O + CO2 and AMP + MEA + H2O + CO2 mixtures. Table 5 summarized the performance (AARD %) of ANN predictions and the number of neurons in each network.
Table 5.
Performance of trained ANNs for viscosity.
The ANN models were developed based on the mixtures with different amine concentrations and CO2 loadings as given in Table 2. The measured viscosity of MEA + H2O mixtures were compared with Hartono’s correlation and Arachchige’s correlation [25] in which the calculated AARD for correlations are 3.14% and 3.5%, respectively. This shows that predictions from ANN for MEA + H2O mixtures have good accuracy compared to the correlations as shown in Figure 4a,b. For the MEA + H2O + CO2 mixtures, Hartono’s correlation was compared with the ANN model and Figure 5a,b illustrate the performance of the ANN compared to the correlation. The results reveal that Hartono’s correlation was able to predict viscosity at 2.7% AARD for the viscosity of CO2-loaded 30 mass% MEA mixture and it is higher than the AARD was obtained from trained ANN.
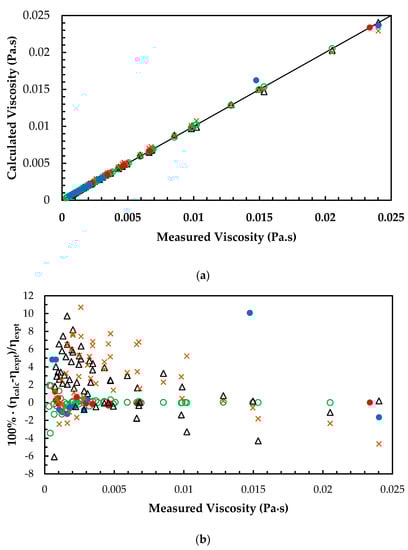
Figure 4.
(a) Comparison of correlated viscosity with measured viscosity for MEA + H2O mixtures. ANN: Training data, ‘○’; Validation data, ‘●’; Test data, ‘●’. Arachchige et al. [25], ‘x’. Hartono et al. [11], ‘∆’. (b) Percentage deviation of correlated viscosity from measured viscosity for MEA + H2O mixtures. ANN: Training data, ‘○’; Validation data, ‘●’; Test data, ‘●’. Arachchige et al. [25], ‘x’. Hartono et al. [11], ‘∆’.
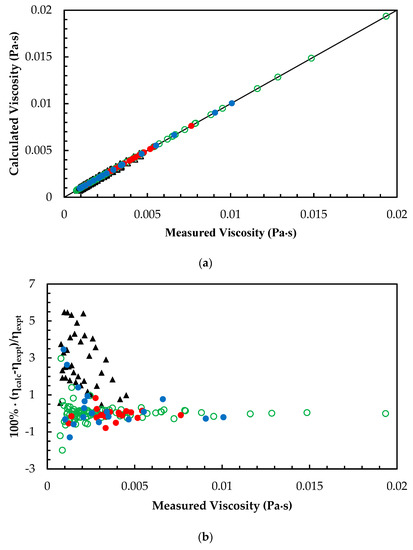
Figure 5.
(a) Comparison of correlated viscosity with measured viscosity for MEA + H2O + CO2 mixtures. ANN: Training data, ‘○’; Validation data, ‘●’; Test data, ‘●’. Hartono et al. [11], ‘▲’. (b) Percentage deviation of correlated viscosity from measured viscosity for MEA + H2O + CO2 mixtures. ANN: Training data, ‘○’; Validation data, ‘●’; Test data, ‘●’. Hartono et al. [11], ‘▲’.
For the viscosities of AMP + MEA + H2O + CO2 mixtures, an ANN was trained and validated for the mixtures with different amine concentrations and CO2 loadings as given in Table 2. The predicted viscosities are in good agreement with measured data with accuracy as mentioned in Table 5. A modified Weiland’s viscosity correlation [24] was adopted to compare the performance of ANN as illustrated in Figure 6a,b. The modified Weiland’s viscosity correlation was able to fit the measured viscosities with 2.7% AARD. The accuracy of ANN predictions was high in accuracy and the overall performance is reported in Table 5.
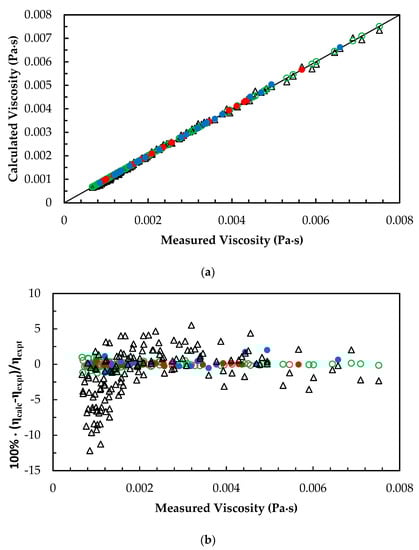
Figure 6.
(a) Comparison of correlated density with measured density for AMP + MEA + H2O + CO2 mixtures. ANN: Training data, ‘○’; Validation data, ‘●’; Test data, ‘●’. Modified Weiland’s correlation, ‘∆’. (b) Percentage deviation of correlated density from measured density for AMP + MEA + H2O + CO2 mixtures. ANN: Training data, ‘○’; Validation data, ‘●’; Test data, ‘●’. Modified Weiland’s correlation, ‘∆’.
The study reveals that properly trained feedforward backpropagation ANN models are capable of predicting physical properties of alkanolamine + H2O + CO2 mixtures with good accuracy and models are appropriate for engineering applications of designing process equipment and performing mathematical modelling and simulations of absorption and desorption systems. There were challenges in density measurements of CO2-loaded aqueous amine solutions due to the formation of gas bubbles inside the U-tube because of the degassing of CO2 in DMA 4500 at high temperatures. Consequently, the maximum temperature of the density measurements was limited to 323.15 K for some CO2-loaded aqueous amine mixtures to reduce the experimental errors. The uncertainties in density and viscosity measurements are reported in references [23,24].
4. Conclusions
In this work, the use of non-linear models based on feedforward backpropagation ANNs were investigated to predict physical properties of MEA + H2O, MEA + H2O + CO2 and AMP + MEA + H2O + CO2 mixtures. ANNs with a single hidden layer and a single output were considered with amine and CO2 mole fractions and temperature as inputs. Multiple neurons were adopted in the hidden layer to minimize the mean squared error to acquire a good fit with reasonable accuracy. The predictions were compared with conventional physical property correlations proposed by Hartono et al. [11], Han et al. [7] and modified Weiland’s correlation for density and Arachchige et al. [25], Hartono et al. [11] and modified Weiland’s correlation for viscosity.
For the density of MEA + H2O + CO2 and AMP + MEA + H2O + CO2 mixtures, developed ANN models were able to correlate measured data with an accuracy of 0.12% and 0.01% AARD for test data, respectively. Moreover, for the viscosity of MEA + H2O, MEA + H2O + CO2 and AMP + MEA + H2O + CO2 mixtures, the accuracies of estimations through developed ANN models were 2.4%, 0.75% and 0.51% AARD for test data, respectively. Consequently, the estimated properties were found to be in good agreement with the measured data. The accuracies of conventional correlations were lower than the accuracies of ANN models, indicating that this approach can enhance the reliability of engineering calculations in the equipment sizing, mathematical modelling and simulations of amine-based post-combustion CO2 capture process.
Supplementary Materials
The following are available online at https://www.mdpi.com/2305-7084/4/2/29/s1, Figure S1: Mean squared error of neurons in the hidden layer for density of MEA + H2O + CO2 mixtures, Figure S2: Learning curve of ANN with 6 neurons for density of MEA + H2O + CO2 mixtures, Figure S3: Mean squared error of neurons in the hidden layer for density of AMP + MEA + H2O + CO2 mixtures, Figure S4: Learning curve of ANN with 9 neurons for density of AMP + MEA + H2O + CO2 mixtures, Figure S5: Mean squared error of neurons in the hidden layer for viscosity of MEA + H2O mixtures, Figure S6: Learning curve of ANN with 14 neurons for viscosity of MEA + H2O mixtures, Figure S7: Mean squared error of neurons in the hidden layer for viscosity of MEA + H2O + CO2 mixtures, Figure S8: Learning curve of ANN with 12 neurons for viscosity of MEA + H2O + CO2 mixtures, Figure S9: Mean squared error of neurons in the hidden layer for viscosity of AMP + MEA + H2O + CO2 mixtures, Figure S10: Learning curve of ANN with 14 neurons for viscosity of AMP + MEA + H2O + CO2 mixtures, Figure S11: Root mean squared error of neurons in the hidden layer for density of MEA + H2O + CO2 mixtures, Table S1: Weight matrix (hidden layer) for density model of MEA + H2O + CO2 mixtures, Table S2: Weight matrix (output layer) for density model of MEA + H2O + CO2 mixtures, Table S3: Weight matrix (hidden layer) for density model of AMP + MEA + H2O + CO2 mixtures, Table S4: Weight matrix (output layer) for density model of AMP + MEA + H2O + CO2 mixtures, Table S5: Weight matrix (hidden layer) for viscosity model of MEA + H2O mixtures, Table S6: Weight matrix (output layer) for viscosity model of MEA + H2O mixtures, Table S7: Weight matrix (hidden layer) for viscosity model of MEA + H2O + CO2 mixtures, Table S8: Weight matrix (output layer) for viscosity model of MEA + H2O + CO2 mixtures, Table S9: Weight matrix (hidden layer) for viscosity model of AMP + MEA + H2O + CO2 mixtures, Table S10: Weight matrix (output layer) for viscosity model of AMP + MEA + H2O + CO2 mixtures.
Author Contributions
Supervision, L.E.Ø., K.C. and D.A.E.; Writing—original draft, S.S.K. All authors have read and agreed to the published version of the manuscript.
Funding
This work was funded by the Ministry of Education and Research of the Norwegian Government.
Conflicts of Interest
The authors declare no conflict of interest.
References
- Kidnay, A.J.; Parrish, W.R. Fundamentals of Natural Gas Processing; Taylor & Francis Group: Boca Raton, FL, USA, 2006. [Google Scholar]
- Jayarathna, S.; Weerasooriya, A.; Dayarathna, S.; Eimer, D.A.; Melaaen, M.C. Densities and surface tensions of CO2 loaded aqueous monoethanolamine solution with r=(0.2 to 0.7) at T=(303.15 to 333.15)K. J. Chem. Eng. Data 2013, 58, 986–992. [Google Scholar] [CrossRef]
- Sartori, G.; Savage, D.W. Sterically hindered amines for CO2 removal from gases. Am. Chem. Soc. 1983, 22, 239–249. [Google Scholar]
- Henni, A.; Hromek, J.J.; Tontiwachwuthikul, P.; Chakma, A. Volumetric properties and viscosities for aqueous AMP solutions from 25 °C to 70 °C. J. Chem. Eng. Data 2003, 48, 551–556. [Google Scholar] [CrossRef]
- Li, M.H.; Lai, M.D. Solubility and diffusivity of N2O and CO2 in (Monoethanolamine + N-Methyldiethanolamine + water) and in (Monoethanolamine + 2-Amino-2-methyl-1-propanol+water). J. Chem. Eng. Data 1995, 40, 486–492. [Google Scholar] [CrossRef]
- Weiland, R.H.; Dingman, J.C.; Cronin, D.B.; Browning, G.J. Density and viscosity of some partially carbonated aqueous alkanolamine solutions and their blends. J. Chem. Eng. Data 1998, 43, 378–382. [Google Scholar] [CrossRef]
- Han, J.; Jin, J.; Eimer, D.A.; Melaaen, M.C. Density of water (1) + Monoethanolamine (2) + CO2 (3) from (298.15 to 413.15) K and surface tension of water (1) + Monoethanolamine (2) from (303.15 to 333.15) K. J. Chem. Eng. Data 2012, 57, 1095–1103. [Google Scholar] [CrossRef]
- Redlich, O.; Kister, A.T. Algebraic representation of thermodynamic properties and the classification of solutions. Ind. Eng. Chem. 1948, 40, 345–348. [Google Scholar] [CrossRef]
- Lee, M.J.; Lin, T.K. Density and viscosity for Monoethanolamine+Water, +Ethanol, and+2-Propanol. J. Chem. Eng. Data 1995, 40, 336–339. [Google Scholar] [CrossRef]
- Amundsen, T.G.; Øi, L.E.; Eimer, D.A. Density and viscosity of monoethanolamine + water + carbon dioxide from (25 to 80) °C. J. Chem. Eng. Data 2009, 54, 3096–3100. [Google Scholar] [CrossRef]
- Hartono, A.; Mba, E.O.; Svendsen, H.F. Physical properties of partially CO2 loaded aqueous monoethanolamine (MEA). J. Chem. Eng. Data 2014, 59, 1808–1816. [Google Scholar] [CrossRef]
- Hsu, C.H.; Li, M.H. Densities of aqueous blended amines. J. Chem. Eng. Data 1997, 42, 502–507. [Google Scholar] [CrossRef]
- Mandal, B.P.; Kundu, M.; Bandyopadhyay, S.S. Density and viscosity of aqueous solution of (N-Methyldiethanolamine + Monoethanolamine), (N-Methyldiethanolamine + Diethanolamine), (2-Amino-2-methyl-1-propanol + Monoethanolamine), and (2-Amino-2-methyl-1-propanol + Diethanolamine). J. Chem. Eng. Data 2003, 48, 703–707. [Google Scholar] [CrossRef]
- Islam, M.N.; Islam, M.M.; Yeasmin, M.N. Viscosity of aqueous solution of 2-methoxyethanol, 2-ethoxyethanol, and ethanolamine. J. Chem. Thermodyn. 2004, 36, 889–893. [Google Scholar] [CrossRef]
- Zhang, J.; Fennell, P.S.; Trusler, J.P.M. Density and viscosity of partially carbonated aqueous tertiary alkanolamine solutions at temperatures between (298.15 and 353.15) K. J. Chem. Eng. Data 2015, 60, 2392–2399. [Google Scholar] [CrossRef]
- Garg, S.; Shariff, A.M.; Shaikh, M.S.; Lal, B.; Aftab, A.; Faiqa, N. A neural network approach to predict the density of aqueous MEA solution. Aust. J. Basic Appl. Sci. 2015, 9, 415–422. [Google Scholar]
- Pouryousefi, F.; Idem, R.; Supap, T.; Tontiwachwuthikul, P. Artificial neural networks for accurate prediction of physical properties of aqueous quaternary systems of carbon dioxide (CO2)-loaded 4-(Diethylamino)-2-butanol and Methyldiethanolamine blended with Monoethanolamine. Ind. Eng. Chem. Res. 2016, 55, 11614–11621. [Google Scholar] [CrossRef]
- Haratipour, P.; Baghban, A.; Mohammadi, A.H.; Nazhad, S.H.H.; Bahadori, A. On the estimation of viscosities and densities of CO2-loaded MDEA, MDEA+AMP, MDEA+DIPA, MDEA+MEA, and MDEA+DEA aqueous solutions. J. Mol. Liq. 2017, 242, 146–159. [Google Scholar] [CrossRef]
- Pierantozzi, M.; Di Nicola, G.; Latini, G.; Coccia, G. Artificial neural network modelling of liquid thermal conductivity for alcohols. Phys. Chem. Liq. 2018, 56, 363–380. [Google Scholar] [CrossRef]
- Rocabruno-Valdés, C.I.; Ramírez-Verduzco, L.F.; Hernández, J.A. Artificial neural network models to predict density, dynamic viscosity, and cetane number of biodiesel. Fuel 2015, 147, 9–17. [Google Scholar] [CrossRef]
- Barradas Filho, A.O.; Barros, A.K.D.; Labidi, S.; Viegas, I.M.A.; Marques, D.B.; Romariz, A.R.S.; de Sousa, R.M.; Marques, A.L.B.; Marques, E.P. Application of artificial neural networks to predict viscosity, iodine value and induction period of biodiesel focused on the study of oxidative stability. Fuel 2015, 145, 127–135. [Google Scholar] [CrossRef]
- Chhantyal, K. Sensor Data Fusion Based Modelling of Drilling Fluid Return Flow through Open Channels; University of South-Eastern Norway: Porsgrunn, Norway, 2018. [Google Scholar]
- Karunarathne, S.S.; Eimer, D.A.; Øi, L.E. Density, viscosity and free energy of activation for viscous flow of monoethanol amine (1) + H2O (2) + CO2 (3) mixtures. Fluids 2020, 5, 13. [Google Scholar] [CrossRef]
- Karunarathne, S.S.; Eimer, D.A.; Øi, L.E. Density, viscosity and free energy of activation for viscous flow of CO2 loaded AMP, MEA and H2O mixtures. J. Mol. Liq. 2019. under review. [Google Scholar]
- Arachchige, U.S.P.R.; Aryal, N.; Eimer, D.A.; Melaaen, M.C. Viscosities of pure and aqueous solutions of Monoethanolamine (MEA), Diethanolamine (DEA), and N-Methyldiethanolamine (MDEA). In Proceedings of the Annual Transactions of the Nordic Rheology Society, Copenhagen, Denmark, 12–14 June 2013. [Google Scholar]
© 2020 by the authors. Licensee MDPI, Basel, Switzerland. This article is an open access article distributed under the terms and conditions of the Creative Commons Attribution (CC BY) license (http://creativecommons.org/licenses/by/4.0/).