Article

Drying-Induced Strain-Stress and Deformation of Thin Ceramic Plate

1
Department of Mechanical Engineering, Gifu University, Gifu 501-1193, Japan
2
Gifu Renewable Energy System Research Center, Gifu University, Gifu 501-1193, Japan
*
Author to whom correspondence should be addressed.
ChemEngineering 2020, 4(1), 9; https://doi.org/10.3390/chemengineering4010009
Submission received: 20 September 2019 / Revised: 29 November 2019 / Accepted: 11 December 2019 / Published: 1 February 2020

Abstract

:
Ceramic thin plates are applied to several industrial purposes including electronic materials and sensors. Drying-induced shrinkage and strain-stress formation of a ceramic thin plate were studied experimentally and theoretically. A kaolin thin plate molded into 10 mm × 30 mm × 1 mm was dried in a hot air stream, and the drying characteristics and deformation were examined. Modeling was also performed to predict the behavior. Heat and moisture transfer conservation equations and constitution equations based on viscoelastic strain-stress were simultaneously solved by a finite element method. A test piece of the thin plate was warped when only one side of the plate was dried, while it was almost flat when both sides were dried. The behaviors of drying and deformation were predicted with a reasonable agreement by the modeling. Parametric analyses by the modeling revealed that the drying conditions with faster drying rate in the beginning period resulted in formation of greater maximum principal stress, and drying on only one side of the plate induced stronger tensile stress in falling rate period than that with both sides drying. The larger thickness of the plate influenced the formation of significantly greater tensile stress but affected maximum compressive stress only a little.

1. Introduction

In drying processes of ceramics, molded wet clay is subjected to internal strain-stress formation induced by shrinkage. The phenomena may result in unacceptable deformation from originally molded configuration and/or causing failure of the dry products. To obtain sufficiently high quality of dry products, drying processes should be accurately controlled so as to inhibit stronger internal stress formation, and design of molds predicting deformation precisely is also necessary. A large number of researches have been reported on drying-induced shrinkage and strain-stress formation of ceramics in the past [1,2,3,4,5,6,7,8,9]. Those works are seen in the handbook as well [10]. Crack formation in ceramic drying has been also studied [11]. The majority of works have been subjected to slabs, cylinders, and other simple configurations; but recently, a comprehensive modeling has been also developed for 3D material [12]. Furthermore, needs of ceramic thin film are increasing for industrial application in fields of fine ceramics like electronic circuit boards, thin film coating, electronic devices, etc. Drying of thin films of ceramic powder suspension and colloid as ceramic precursor was studied to understand the mechanical behavior, including strain-stress and crack formation [13,14,15,16]. Their works were carried out experimentally to evaluate the critical conditions of crack-free drying. However, there has been few reports on modeling for predicting drying-induced shrinkage behavior of thin films except a limited paper [17].
This study presents behaviors of drying-induced strain-stress and deformation of ceramic thin plates by the methodologies of experimentation and modeling. The thin plates simulate ceramic green sheets molded continuously through an extruder. Hot-air drying of thin plates was performed to examine the drying rate and the deformation. The conservation equations of heat and moisture transfer and the constitution equations of viscoelastic strain-stress were modified from Itaya et al. [4] and simultaneously solved by the finite element method. The effects of hot air temperature and the thickness of the plate on the drying performance, strain-stress formation, and deformation were discussed by comparing the experimental data with the results analyzed by the modeling.

2. Experiments

2.1. Sample Preparation

Kaolin “Eckalite 1” provided by the KCM Corporation was employed representatively as an original ceramic sample for preparation of ceramic green thin plates. The main chemical components were 45.6% SiO2 and 38.9% Al2O3. The particle size under 8 μm dominated 86% in mass fraction. The kaolin was mixed well with a certain amount of water and was pressed in a mold made of brass, as seen in Figure 1. The size of the molded thin plate was 10 mm in width, 30 mm in length, and two different thicknesses of 1 mm and 0.5 mm. The initial moisture content of the sample molded was set in the range of approximately 0.3 to 0.4 kg-water/kg-dry solid.
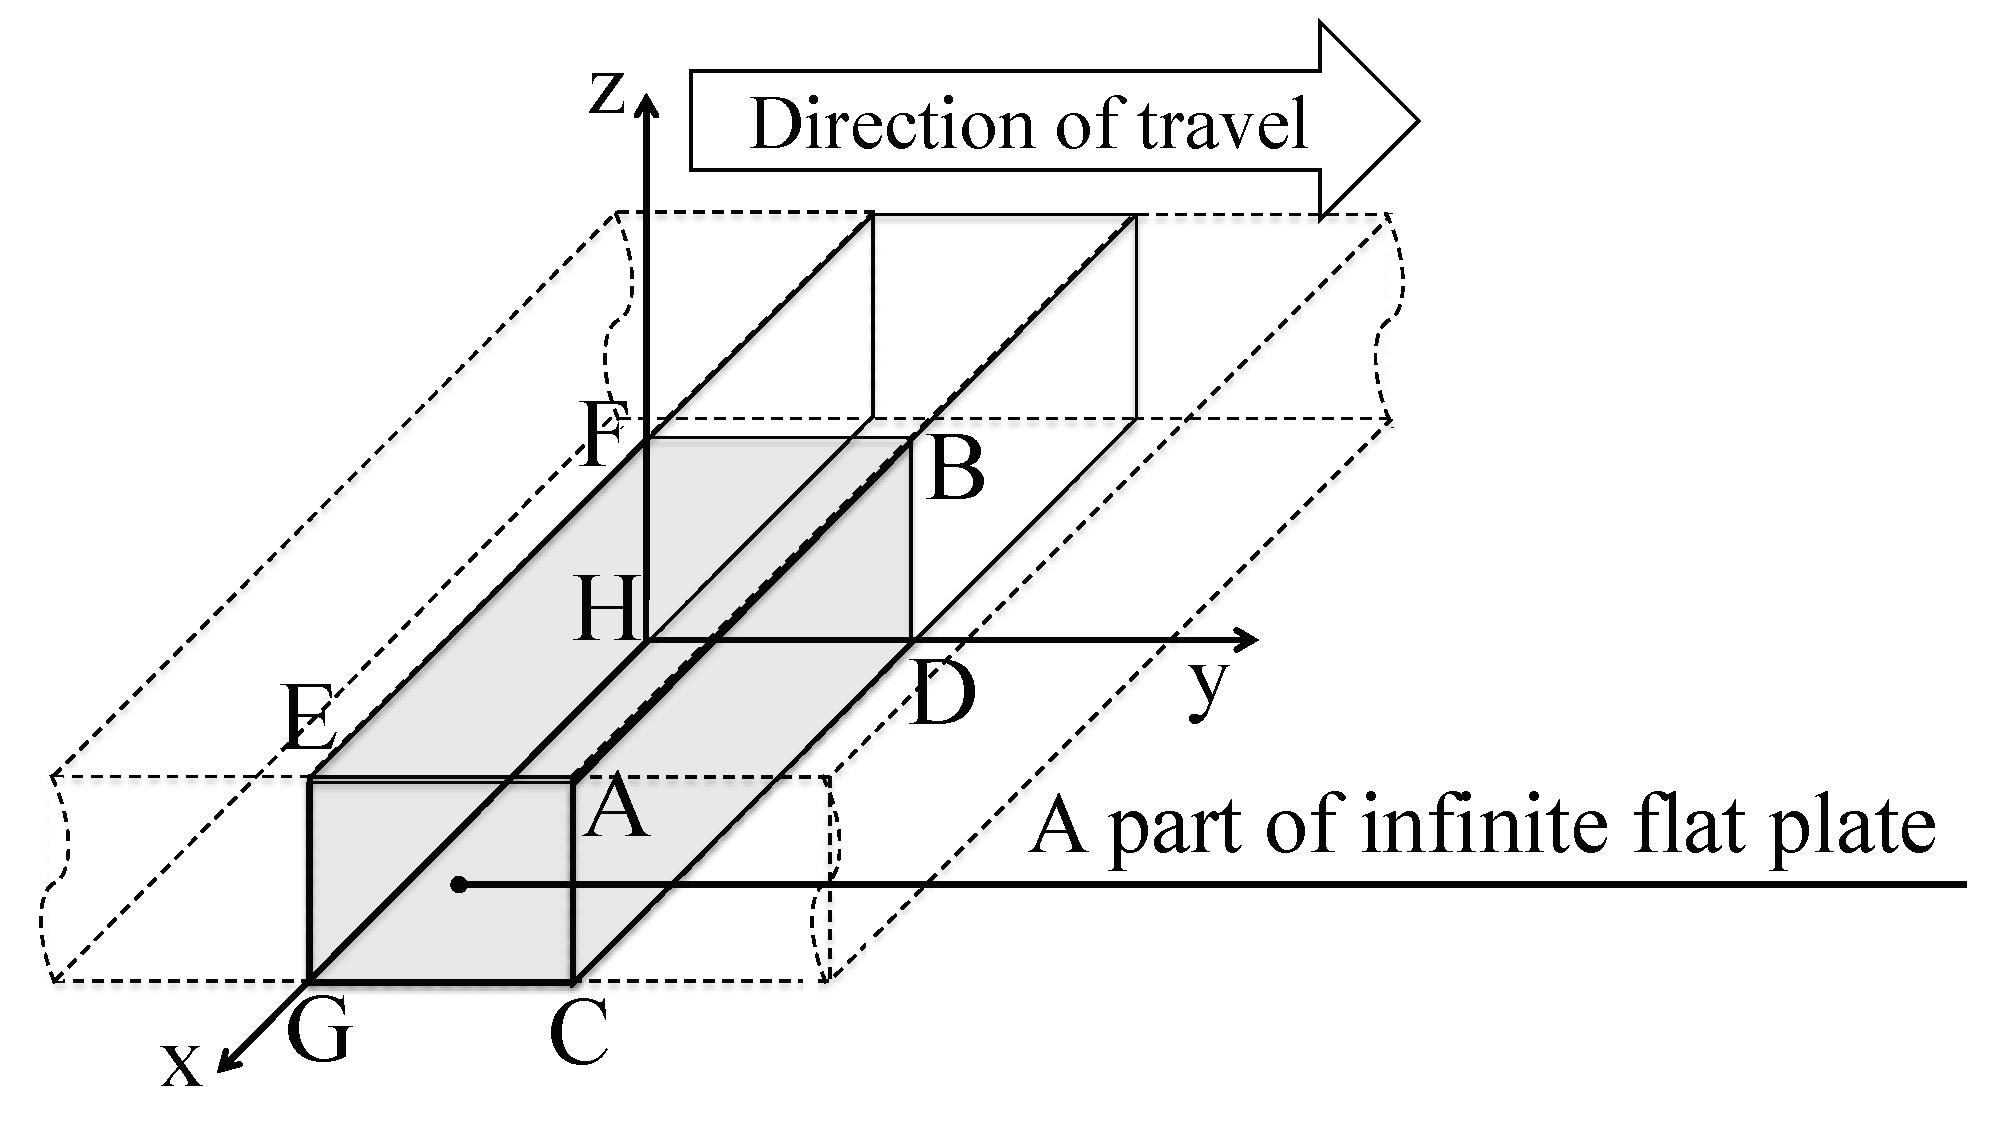
This sample simulates a narrow part of a wet ceramic sheet moving in a tunnel dryer as illustrated in Figure 2. Then, the drying processes may be a continuous steady state operation, but a specified narrow part of the sheet can be supposed to be equivalent to the fact that drying proceeds transiently if the thermal conduction and moisture diffusion are ignored in the direction along movement of the sheet and the edge effect of the sample is negligibly small due to thin thickness in the order of 1 mm.

2.2. Drying Experiments

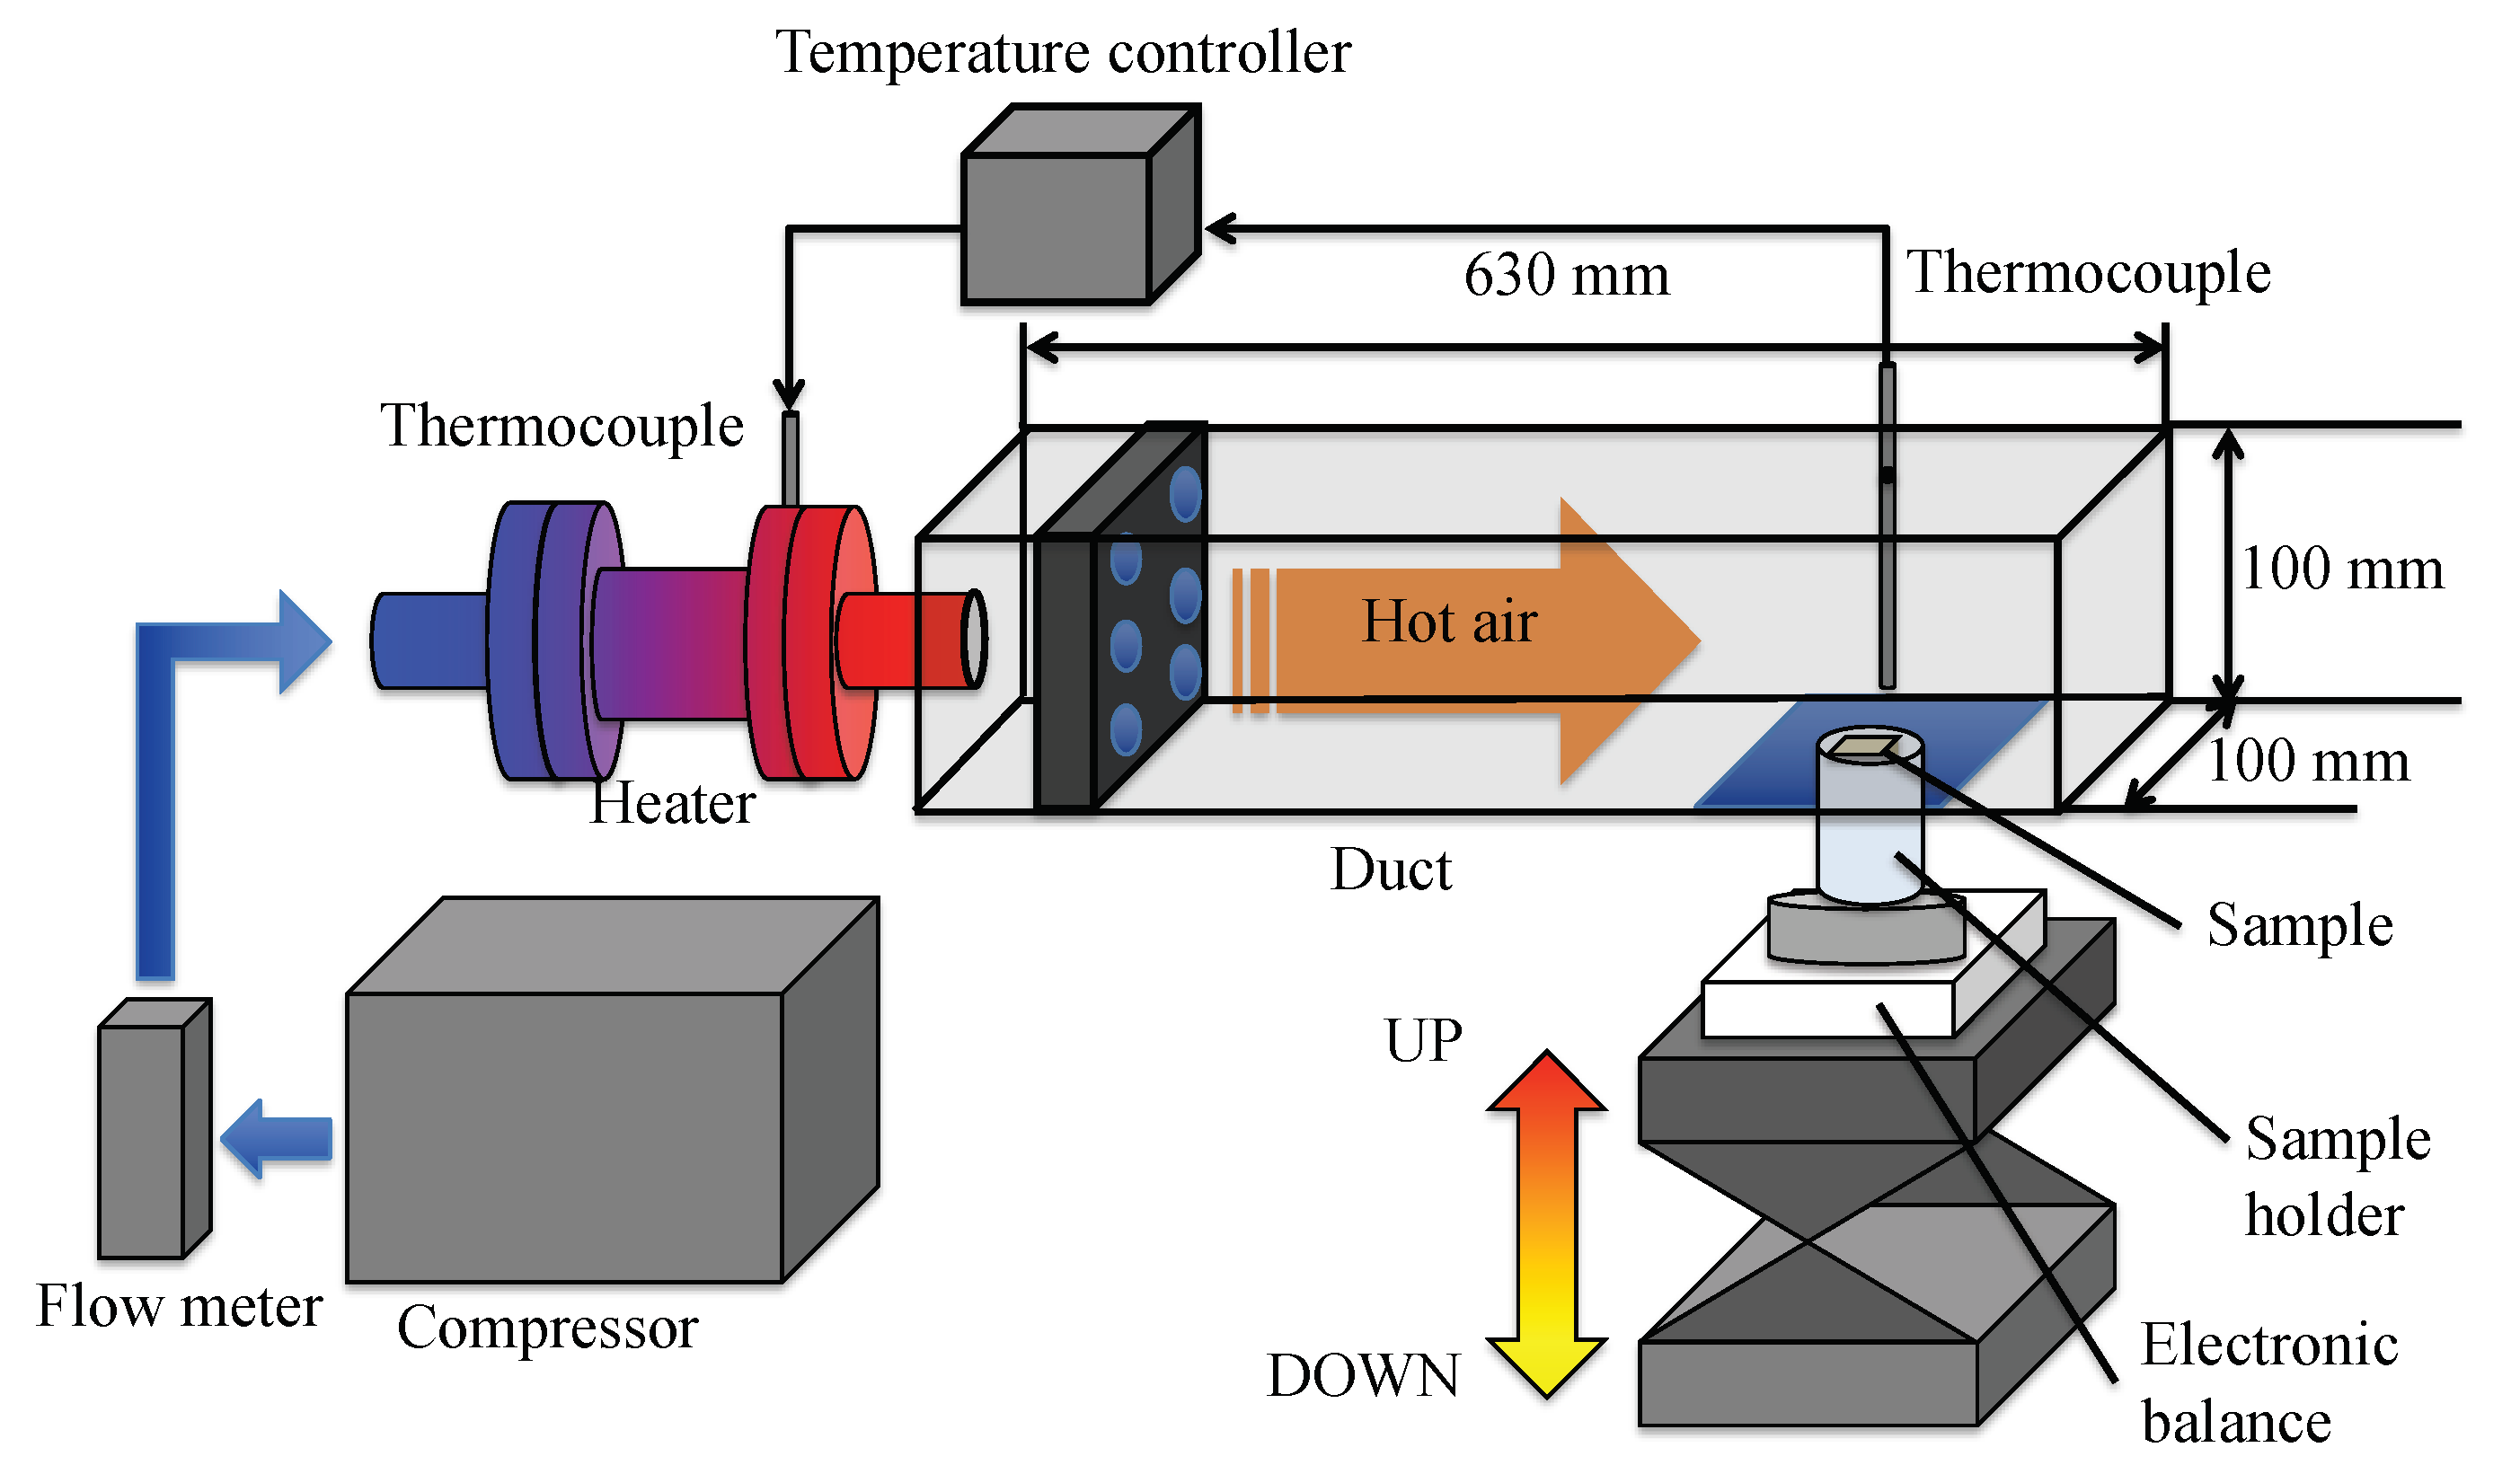
The experimental setup of hot-air drying is shown in Figure 3. It consisted of a compressor, an air heater, a dryer duct, and a sample holder. Hot air was supplied into the inlet of the duct, passing through an electric heater from a reservoir of air compressed using a compressor, which can maintain a rather stable flow without fluctuation compared to a blower. The dryer was a 630 mm long rectangular duct made of 15-mm thick Styrofoam, and the cross section was 100 × 100 mm square in the inside. Wire mesh with 2-mm aperture was placed at the air entrance side to suppress turbulence of inlet air and distribute the stream uniformly. The test section of the sample was located at the position 160 mm upward from the exit of the duct. Hot air temperature was measured by a K-type of thermocouple (3 mmϕ) placed in the stream over the test section and controlled to maintain a set preliminary temperature. Air humidity was determined from dry- and wet-bulb temperatures in the room during the drying experiment, since air in the room was compressed and supplied to the duct without condensation of water vapor in air. A sample was put on a holder and jacked up in the test section so as to adjust the upper surface of the sample to the bottom wall of the duct as soon as the drying started after the temperature of the hot air stream in the inside of the duct was confirmed to achieve a steady state. The drying rate was determined from the transient behavior of the sample weight, measured by an electronic balance on which the holder with a sample was placed. The sample temperature was measured by 0.1-mm thick K-type thermocouple attached on the sample surface.
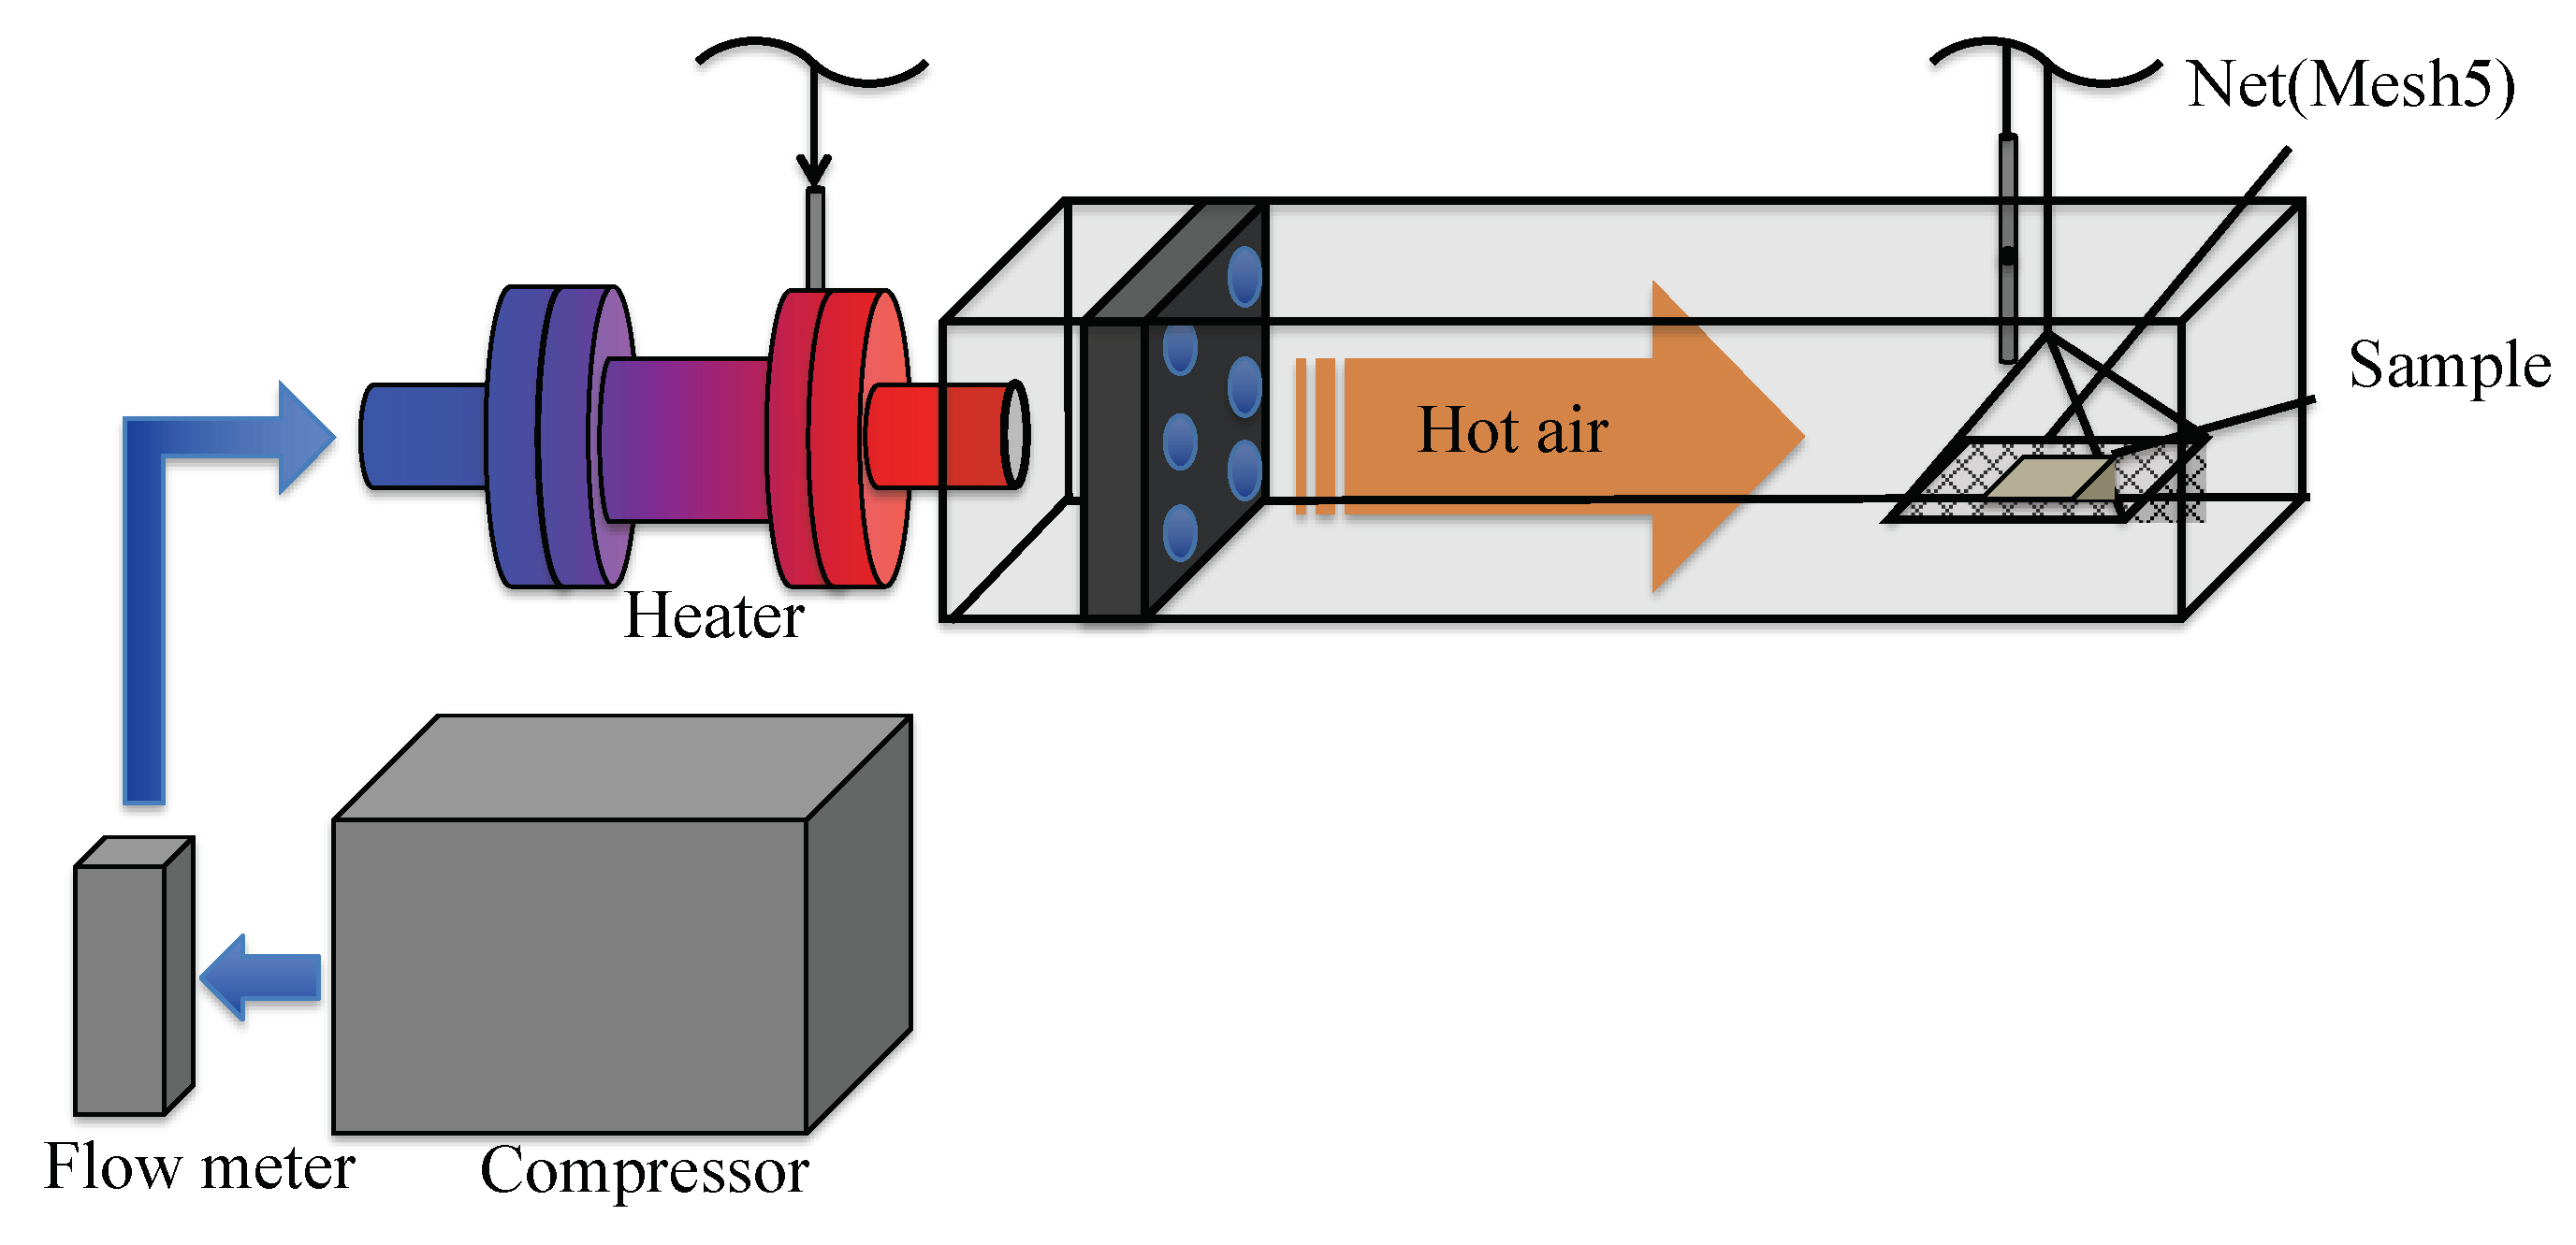
The procedure specified in the above is to examine the performance when the only one side of a thin plate sample was subjected to drying. In the present study, drying of both sides of a sample was also performed to compare the drying and deformation behaviors to one side drying. A different sample holder was employed in the both sides drying experiment, as seen in Figure 4. A thin plate sample was put on a wire mesh holder with 5-mm aperture, which was hung up in the center of a hot air stream at the same location as the test section in the duct in Figure 3. The sample holder was connected to the electronic balance to measure the transient behavior of the sample weight. The experimental setup of this examination was the same as that in Figure 3 except the portion of the sample holder and the position of the electronic balance.
The experimental conditions carried out are given in Table 1. In this study, two hot air temperatures, 100 and 120 °C, were employed to preliminarily validate the modeling. Too high an air temperature will result in crack formation, but the detailed evaluation on cracking is the next step of the studies. Hence, the experiment was done at the two air temperatures here as a simple setup of dryer made of Styrofoam was available and cracks were not generated in the sample.

3. Modeling

The analyses were performed on heat/moisture transfer and strain-stress during drying of the sample. The modeling was similar to that developed by Itaya et al. [4], but partly modified so as to solve a transient problem of drying of a thin plate. Only the outline is specified here, as more description was reported in the reference [2,3,4].
The transient three-dimensional governing equations of heat/moisture transfer and strain-stress in a thin plate of clay were solved simultaneously and numerically by the finite element method. To simplify the model, the following brief assumptions were introduced: 1) the analysis is done through a whole drying period by applying a model specified later, here though, the analysis was carried out only in the periods of preheating and constant drying rate in the past work; 2) the Dufour effect is neglected; 3) the initial profiles of temperature and moisture content are uniform; 4) water evaporates only on the surface of the sample; 5) heat and moisture transfers on the inside of a sample are expressed by overall heat conduction and water diffusion; 6) heat conductivity and moisture diffusivity are isotropic and constant; and 7) the sample is a viscoelastic material to consider creep phenomenon.

3.1. Heat and Moisture Transfer

The governing equations of the heat and mass transfer are deduced in dimensionless forms as
T * θ = div q * ,
W * θ = div J * ,
where q * and J * are heat and mass transfer flux vectors inside the sample body given by, respectively,
q * = grad T * ,
J * = grad W * .
The initial and boundary conditions on the surfaces exposing to a hot air stream are represented as
θ = 0   ; T * = 0 ,   W * = 1 ,
θ > 0   ; Bi 1 T * + Bi r 1 T * η BiN h H e H a = q * · n ,
η BiLeN m H e H a = J * · n .
The dimensionless parameters are defined as
θ = t α / l 0   ,   T * = T T 0 / T a T 0 ,   W * = W / W 0 ,   Le = α / D w   ,   Bi = hl 0 / λ , Bi r = σ r ϕ l 0 T a 2 + T s 2 T a + T s / λ ,   N h = L a / c pa T a T s ,   N m = c ρ V / c pa ρ d 0 V 0 W 0 ,
where t and l0 are time and representative length, respectively. Ta and Ts are temperatures of hot air and the sample surface, respectively. W is moisture content. λ, α, and Dw are apparent thermal conductivity, thermal diffusivity defined by λ/cρ, and overall diffusion coefficient in the sample body. h, σr, and ϕ are convective heat transfer coefficient, Stefan-Boltzmann constant (5.67 × 10⁻⁸ W/(m2·K4)), and blackness. Ha and He are hot air humidity and saturated humidity to the surface temperature but are not strictly dimensionless parameters as their unit is given by kg-H2O/kg-dry air. Hence, the parameters Nh and Nm [kg-dry air/kg-H2O] relating to heat and mass transfers are not dimensionless as well. cpa and c are specific heat of air and wet clay, La is latent heat of water, ρ is density of wet clay, ρd0 is density of dry clay in initial volume of the sample, and V is volume of the sample. Subscript 0 represents properties in the initial state. η is a correction factor corresponding to the rate in falling rate period, which is defined as
W * > W c *   ; η = 1 ,
W * < W c *   ; η = W * / W c * .
The correlation of Equation (10) is modeled so that the falling drying rate is proportional to the ratio of the moisture content on the sample surface W * to the critical moisture content W c * in the dimensionless form. Equations (6) and (7) are replaced for the surface ABDC and EFHG and the symmetrical surface FBDH seen in Figure 2 as
θ > 0   ; q * · n = 0 ,
J * · n = 0
because the heat and moisture transfer in the direction of y-axis is assumed to be ignored and the sample is symmetrical to the yz-plane.

3.2. Strain-Stress Analysis

A linear viscoelasticity, which is suggested as a reliable behavior taking account for creep phenomenon of strain-stress for several materials, was assumed. The governing equations in a viscoelastic medium are represented as follows [2]:
Constitutive equation:
σ ij = 0 t G ijkl t τ τ ε kl τ ε kl s d τ ,
where σ ij and ε kl are stress and strain tensors, respectively. Gijkl is tensor correlating between stress and strain. The subscripts i, j, k, and l represent x-, y-, z-coordinates. Using convolution form, the equation can be rewritten as
σ ij = G ijkl ε kl τ ε kl s ,
G ijkl = 1 3 G 2 t G 1 t δ ij δ kl + 1 2 G 1 t δ ik δ jl + δ il δ jk ,
G 1 t = 2 G t ,
G 2 t = 3 K t .
G and K are shear and bulk moduli, respectively. δ ij is the Kronecker delta function. ε kl s in Equation (14) is the free strain—that is, the strain taking place due to shrinkage under no internal stress load—and assumed to be expressed by a function of only the local moisture content.
Equilibrium equation:
σ ij ,   j + F i = 0 .
Strain-displacement equation:
ε ij = 1 2 U i , j + U j , i ,
where σ ij ,   j is differential of σ ij to j, Fi is body force, and Ui,j is differential of displacement Ui to j.
To solve the above governing equations, the Galerkin finite element method was applied. In the analysis, since it is easy to apply to irregular shapes, isoparametric elements consisting of twenty nodes were introduced. The source code for the numerical analysis had been programmed by the authors themselves without using any commercial codes.

3.3. Physical Properties and Parameters for Simulation

The most physical properties and parameters necessary for the simulation of the model were same as the past works by Itaya et al. [2,3,4]. Linear viscoelastic parameters are given by
E t = 7.0 × 10 4 exp t 1.7 × 10 4 ,
K t = 1 3 E t 1 2 ν ,
G t = 1 2 E t 1 + ν ,
where ν is a parameter equivalent to Poisson ratio and it was to be 0.3. The density ρ0 of the wet sample at the initial state was 1.6 × 10³ kg/m3 from measurement. The volume shrinkage was determined from the volumes before and after drying of the wet sample molded in some thicknesses and fitted empirically in a proportional relation to the moisture content as
S V W = 0.14 W + 0.958   for   W < 0.3   kg / kg - d . s .
Then, the free strain is given by
ε s = 1 S V 1 / 3 .
The convective heat transfer h was estimated from the constant drying rate of the sample and given as 23.99 W/(m2·K) for one side drying and 46.53 W/(m2·K) for both sides drying. The mass transfer coefficient k can be deduced employing Lewis correlation as
h k = c pa ,
where cpa is the specific heat of humid air and was 1.013 kJ/(kg·K) as an average value for the air humidity during the drying experiments carried out. The parameters BiLeNm on the left-hand side of Equation (7) could be obtained in a form without using the mass transfer coefficient k by substituting the correlation of Equation (25) in the dimensional equation. The critical moisture content was set as W c * = 0.357 based on the drying experimental data. The other parameters were to be λ = 1.03 W/(m·K), c = (4.184W + 1.09)/(1 + W) kJ/kg·K, ρd0 = 1.56 × 10³ kg/m3, ρ = (1 + W)ρd0V0/V, ϕ = 0.8, Le = 5.0, l0 = 0.01 m.
The analytic space of a thin plate was discretized in 135 elements with 1068 nodes to solve the equations numerically by the finite element method.
The job was run after compiling the code by Absoft Pro Fortran version 19.0.0 on an Apple MacBook Air (MacOS 10.12.6; processor, 1.7 GHz Intel Core i7; memory, 8 GB) to solve the transient behaviors of the profiles of temperature, moisture content, and strain-stress.

4. Results and Discussion

4.1. Transient Moisture Content and Temperature

Hot-air drying experiments of a thin plate sample were carried out. Figure 5 shows the experimental results on the transient behaviors of temperature and average moisture content of the sample obtained in the conditions of Runs 1, 3, 4, and 5 in Table 1. The sample temperature was measured by a K-type of thermocouple (0.1 mmϕ in diameter) attached at the center location on the sample surface. The figure compares the experimental data with the results analyzed by the modeling as well. The moisture content profile solved numerically in each time step was integrated through a whole body of the plate to obtain the average moisture content plotted in the figure. The three drying periods were observed, i.e., the drying periods of preheating, constant rate, and falling rate for any drying conditions in the experiments and the modeling. The transient temperature and moisture content obtained in most runs were predicted reasonably by the present modeling. However, the modeling estimated a little larger moisture content behavior and/or slower drying rate during a constant rate period in the one side drying case, as seen in Figure 5b. This deviation of the moisture content may have been caused because the convective heat transfer coefficient was indeed greater than that used in the modeling or heating, and evaporation did not only take place on the top surface of the plate but also became a little significant partly on the bottom surface of the plate in the one side drying experiment by hot air at 120 °C due to deformation warping the thin plate sample plate upward, as specified later. The wet bulb temperature was also drawn by a chain line for a reference in the figure. Both results of the experiment and the modeling on the temperature during the constant drying rate period were a little higher than the wet bulb temperature, and the difference at 120 °C air temperature was more significant than that at 100 °C. The reason is due to the effect of radiation heat transfer from the inner wall of the duct in the dryer, and the trend could be analyzed well by the modeling. Further discussion on the drying behaviors will be done later based on a reasonable agreement between experiments and modeling.
As the initial conditions of the experiment were not always same in the all runs, the drying behaviors are compared in the dimensionless forms defined in Equation (8) between 100 °C and 120 °C in hot air temperature for the cases of one side drying and both sides drying in Figure 6. The surface temperatures in the constant rate period were almost the same in the cases of one side drying and both sides drying, as far as the hot air temperature was the same. This fact means that the bottom side in the case of the one side drying is assumed to be insulated thermally without water evaporation in the modeling and the sample was kept at almost the same temperature as the both sides drying case during the constant rate period, although the trend was observed so that heating and drying on the bottom surface might occur partly in the one side drying case. The duration of the constant rate period became shorter when the constant drying rate was greater, such as the condition under hotter air temperature and both sides drying.

4.2. Profiles of Moisture Content and Temperature

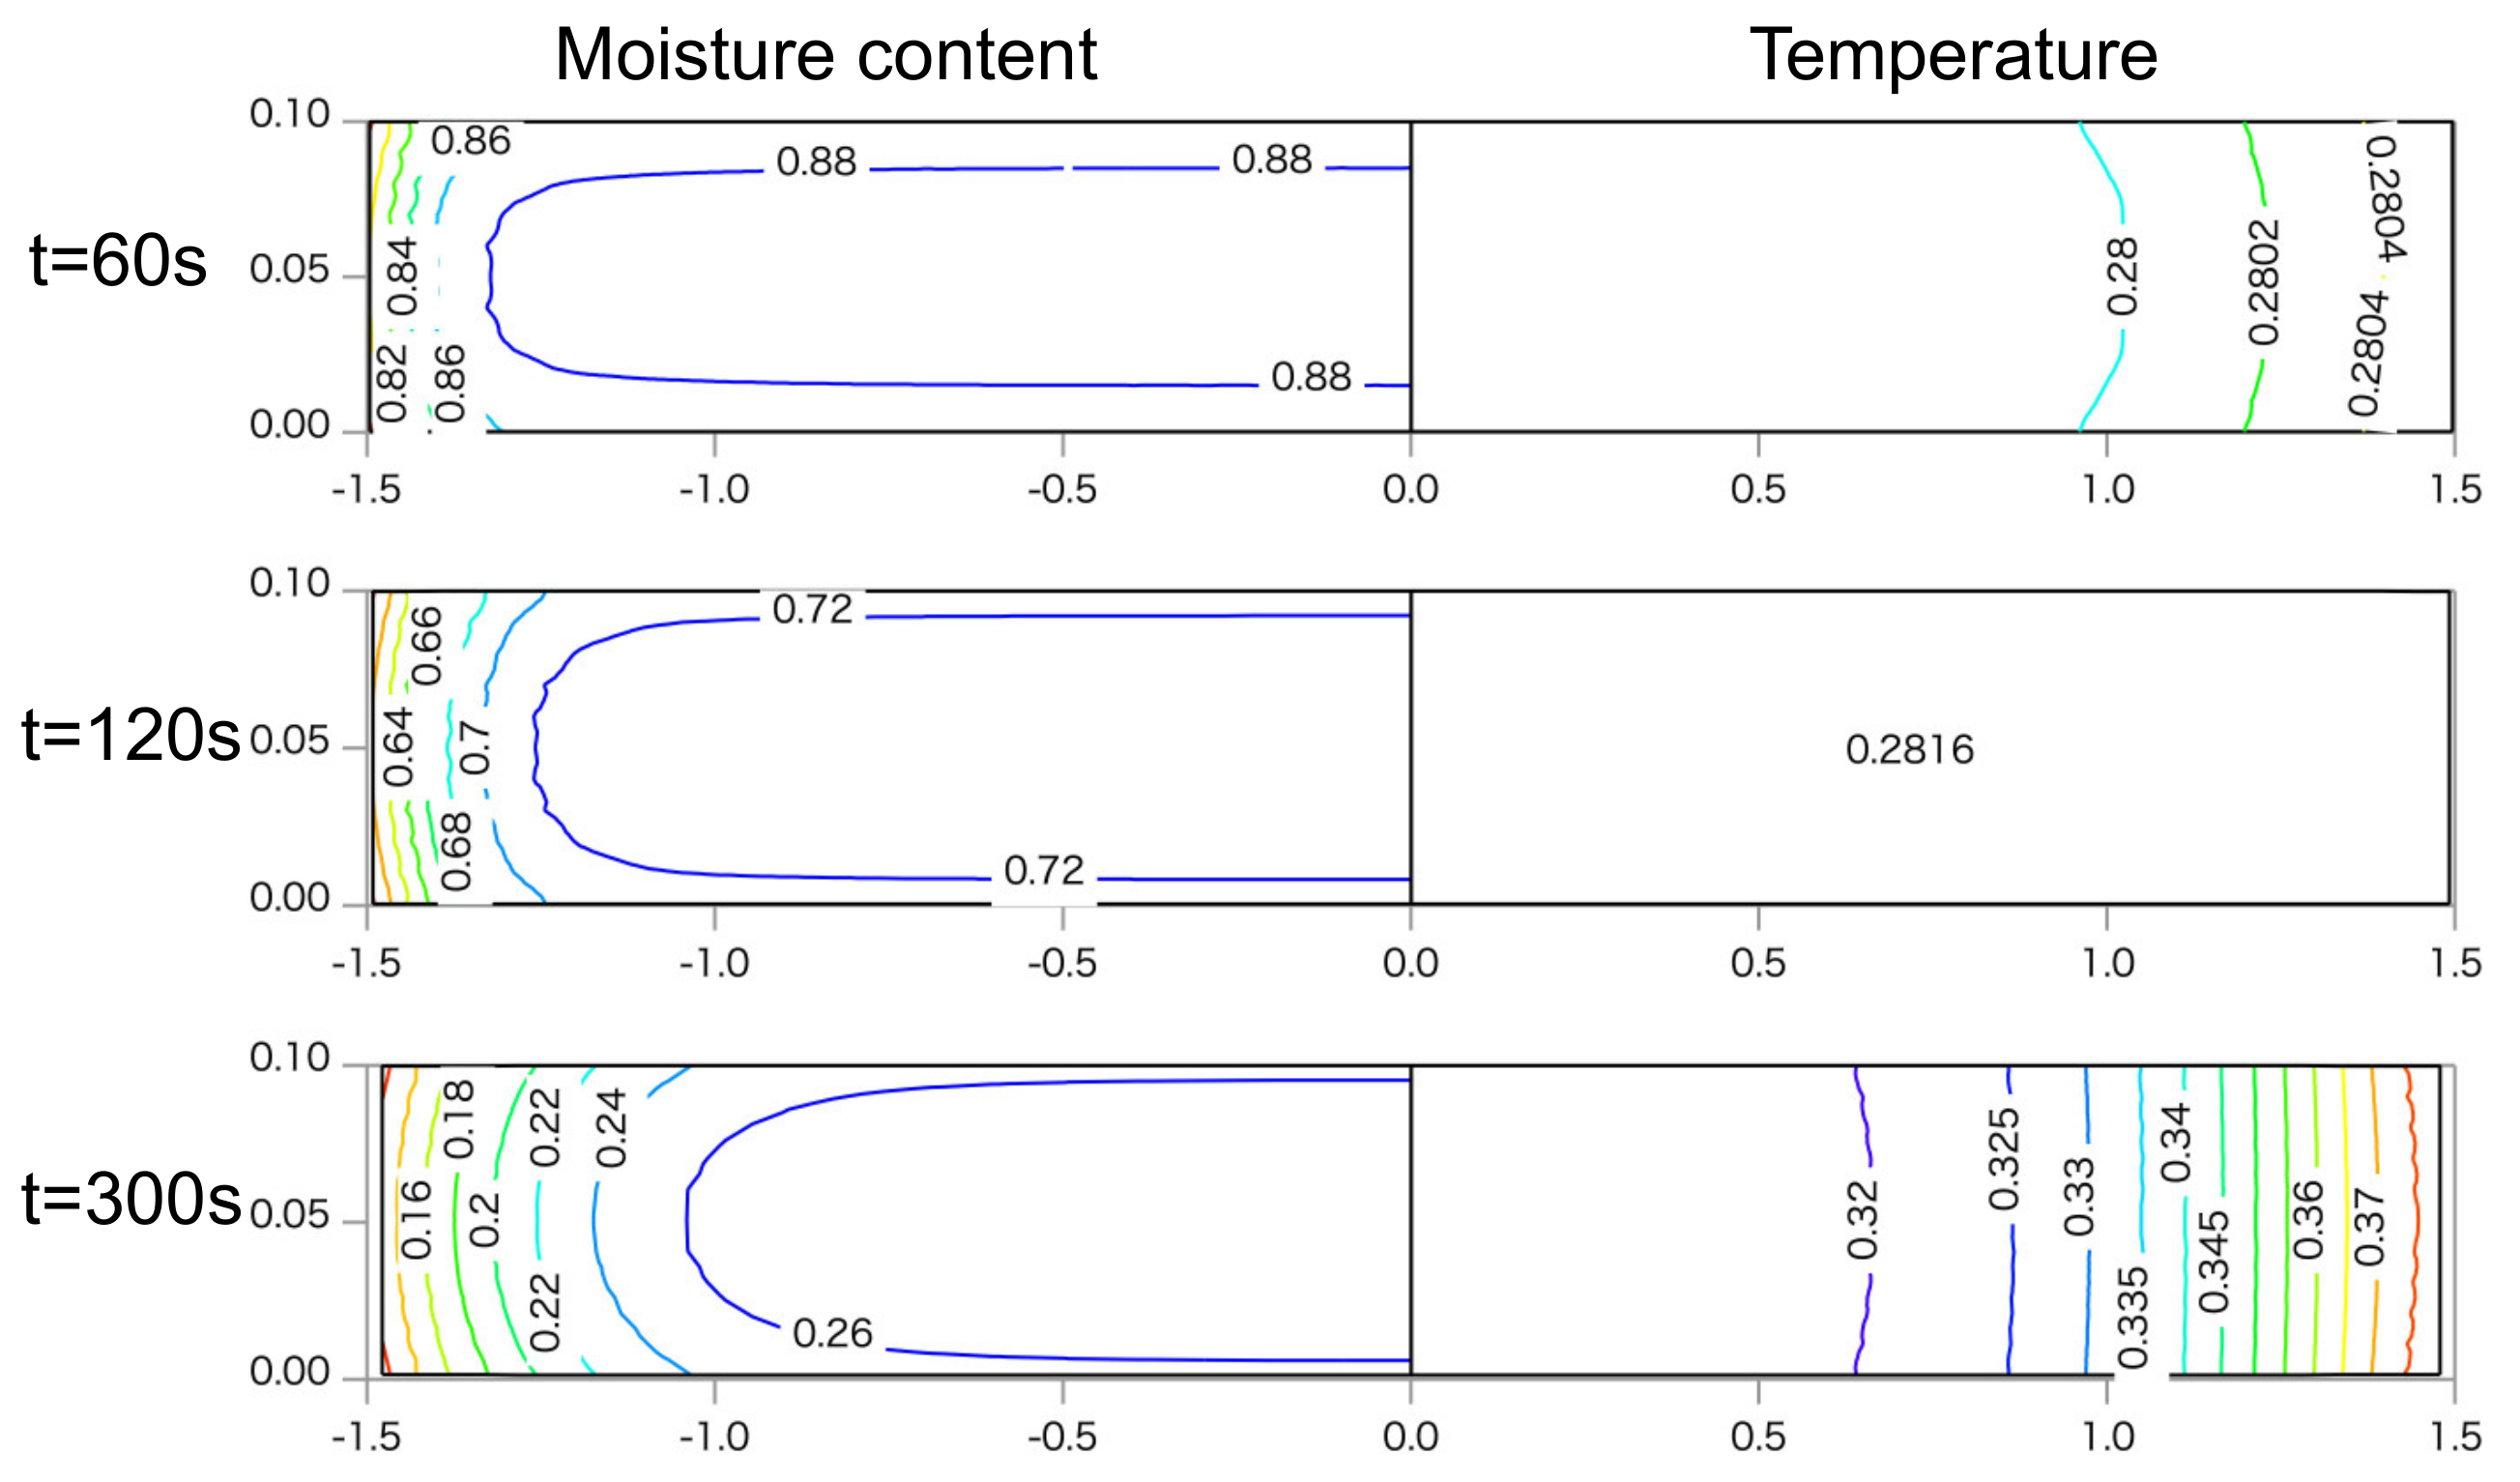
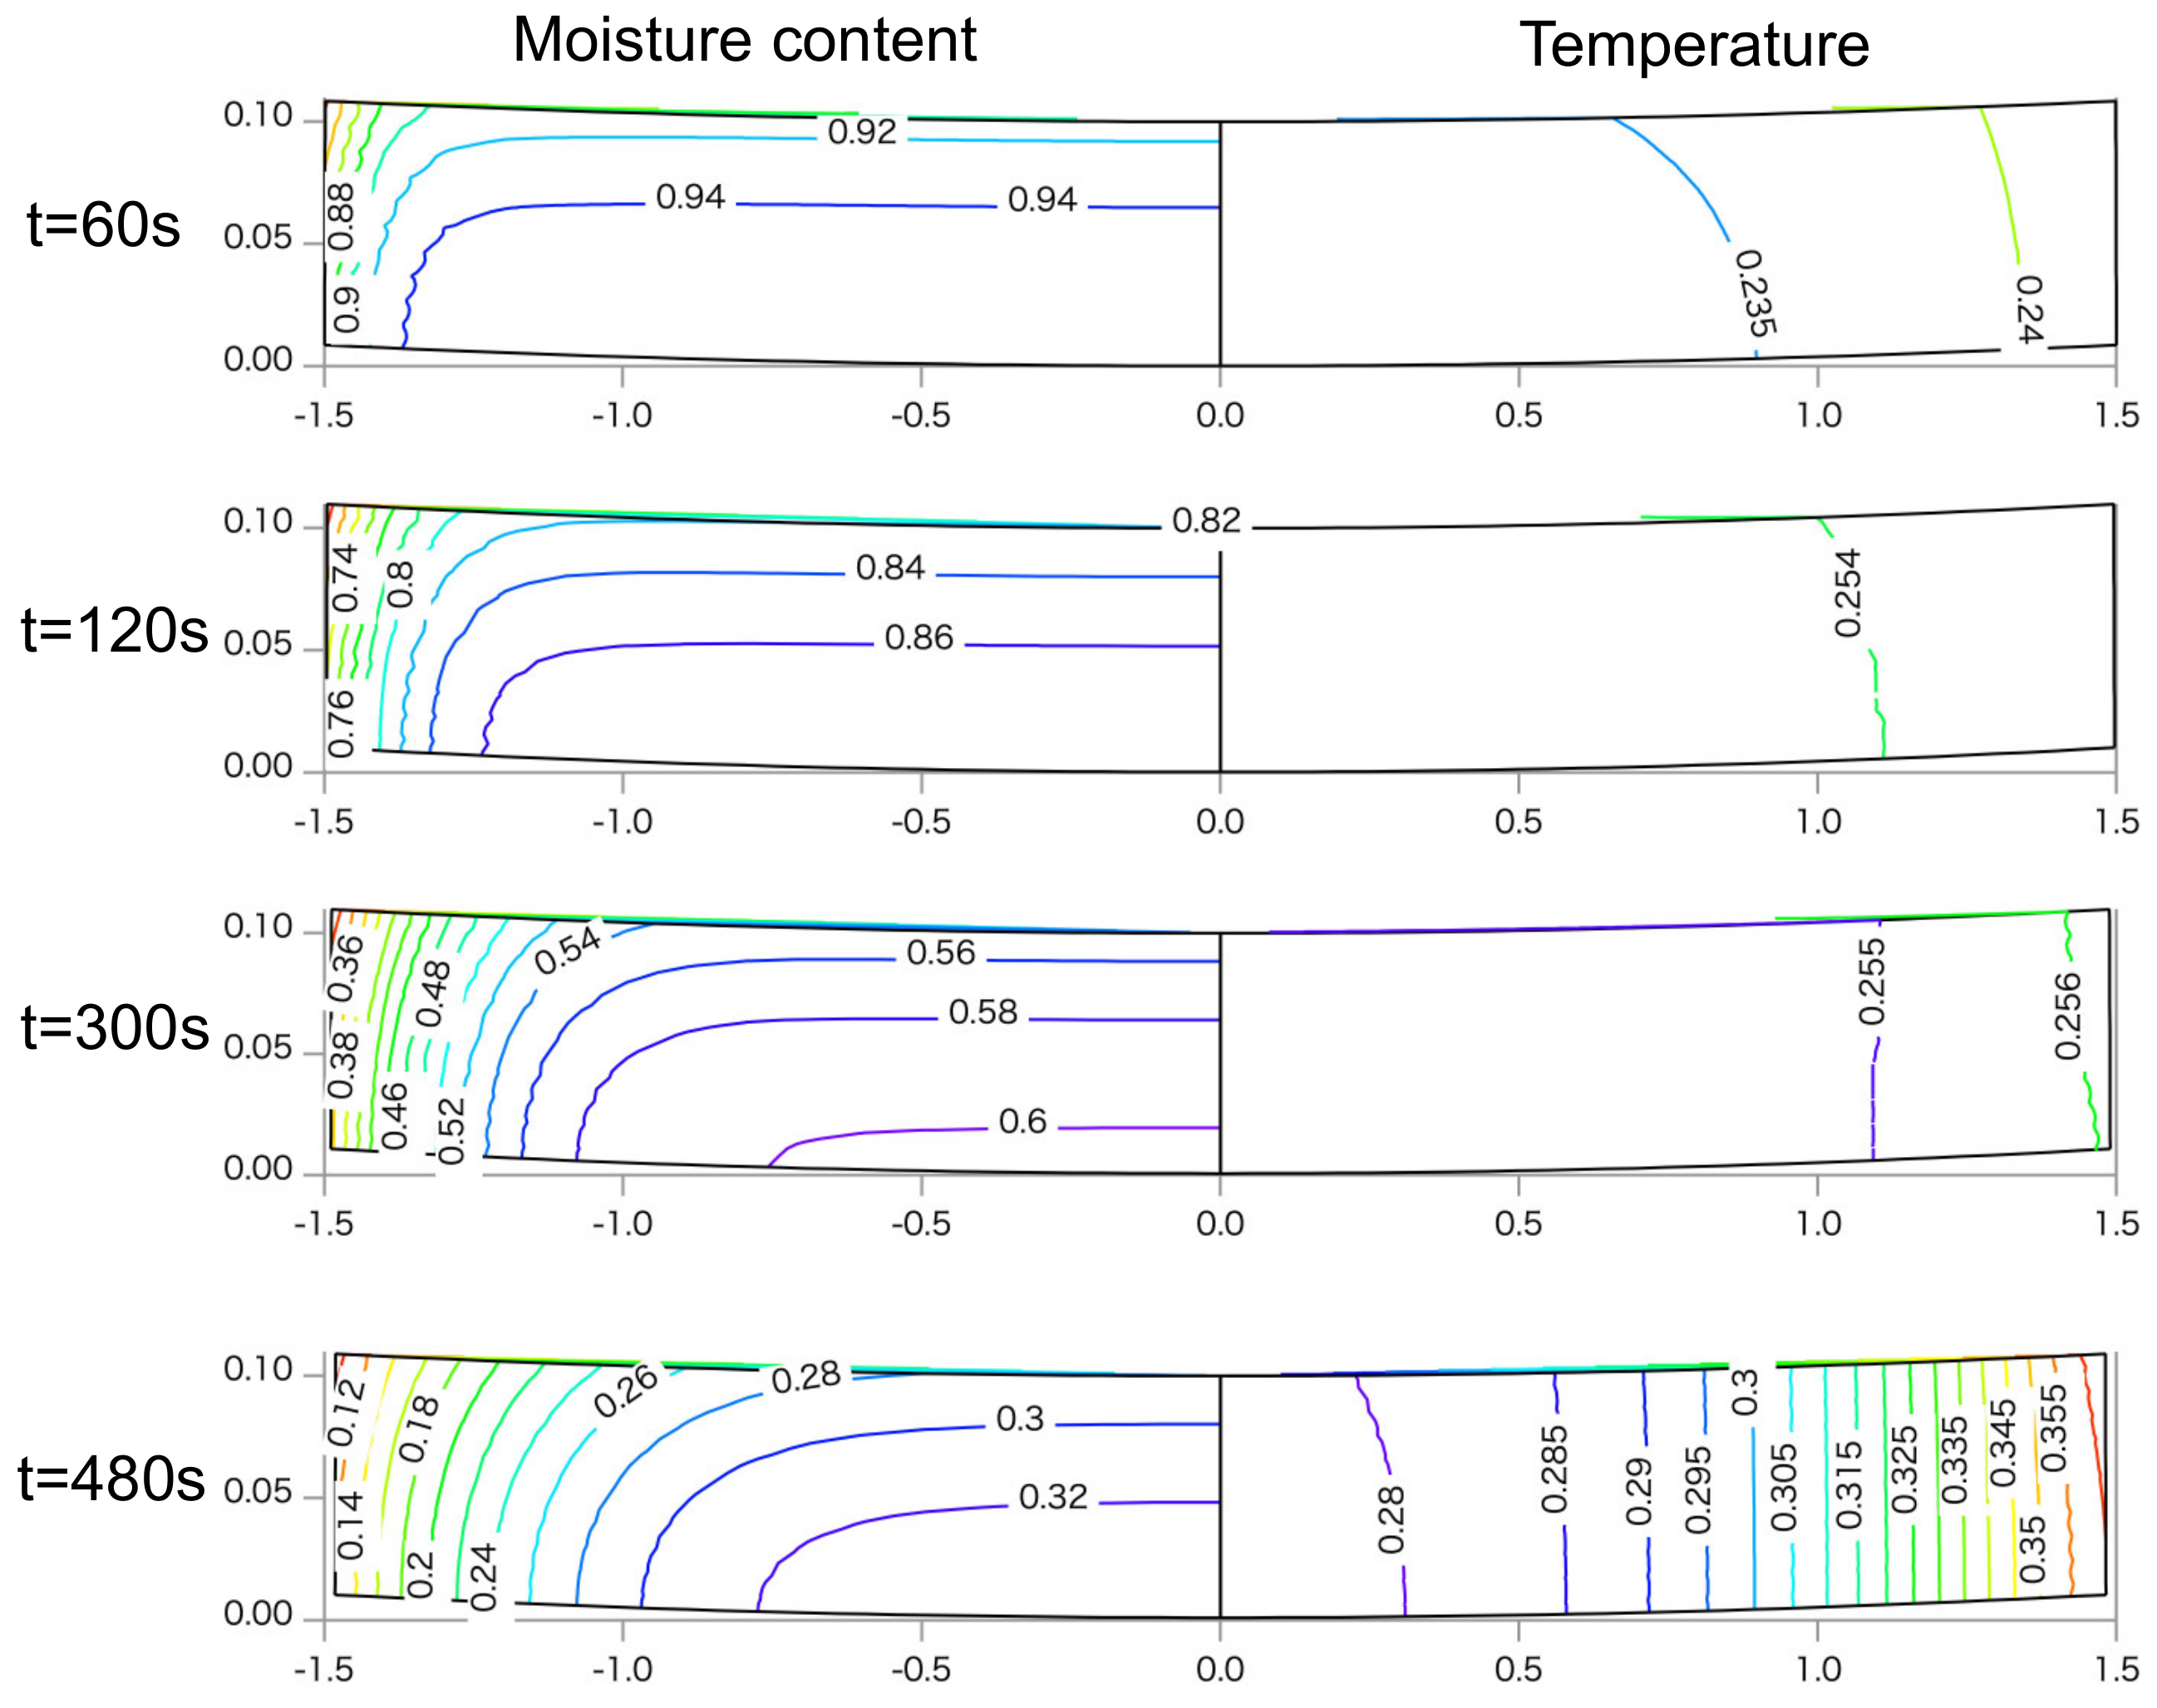
Figure 7 illustrates the contours of dimensionless moisture content and temperature as well as the configuration of the sample obtained from the analysis in the case of both sides drying under the hot air temperature of 100 °C. The profiles are drawn, representing the drying times of 60, 12, and 300 s that were corresponding to the drying periods of the preheating, the constant rate, and the falling rate, respectively. The profiles of moisture content and temperature show only on the half face of the sample, i.e., the ABDC face in Figure 2 due to the symmetry; and moisture content is drawn on the left-hand side of the center line while temperature is on the right-hand side. The axes are given in length with the unit of centimeters, but it should be noted that the thickness direction or the vertical axis was expanded into 4.5 times the scale of the horizontal axis. The contour lines of the moisture content show a large gradient in the edge region of the plate. These profiles with large gradient will induce stronger stress there due to generation of shrinkage. The temperature profiles were almost uniform except the falling rate period. The configuration on the cross section shrank a little in the thickness and length directions with almost keeping the original shape.
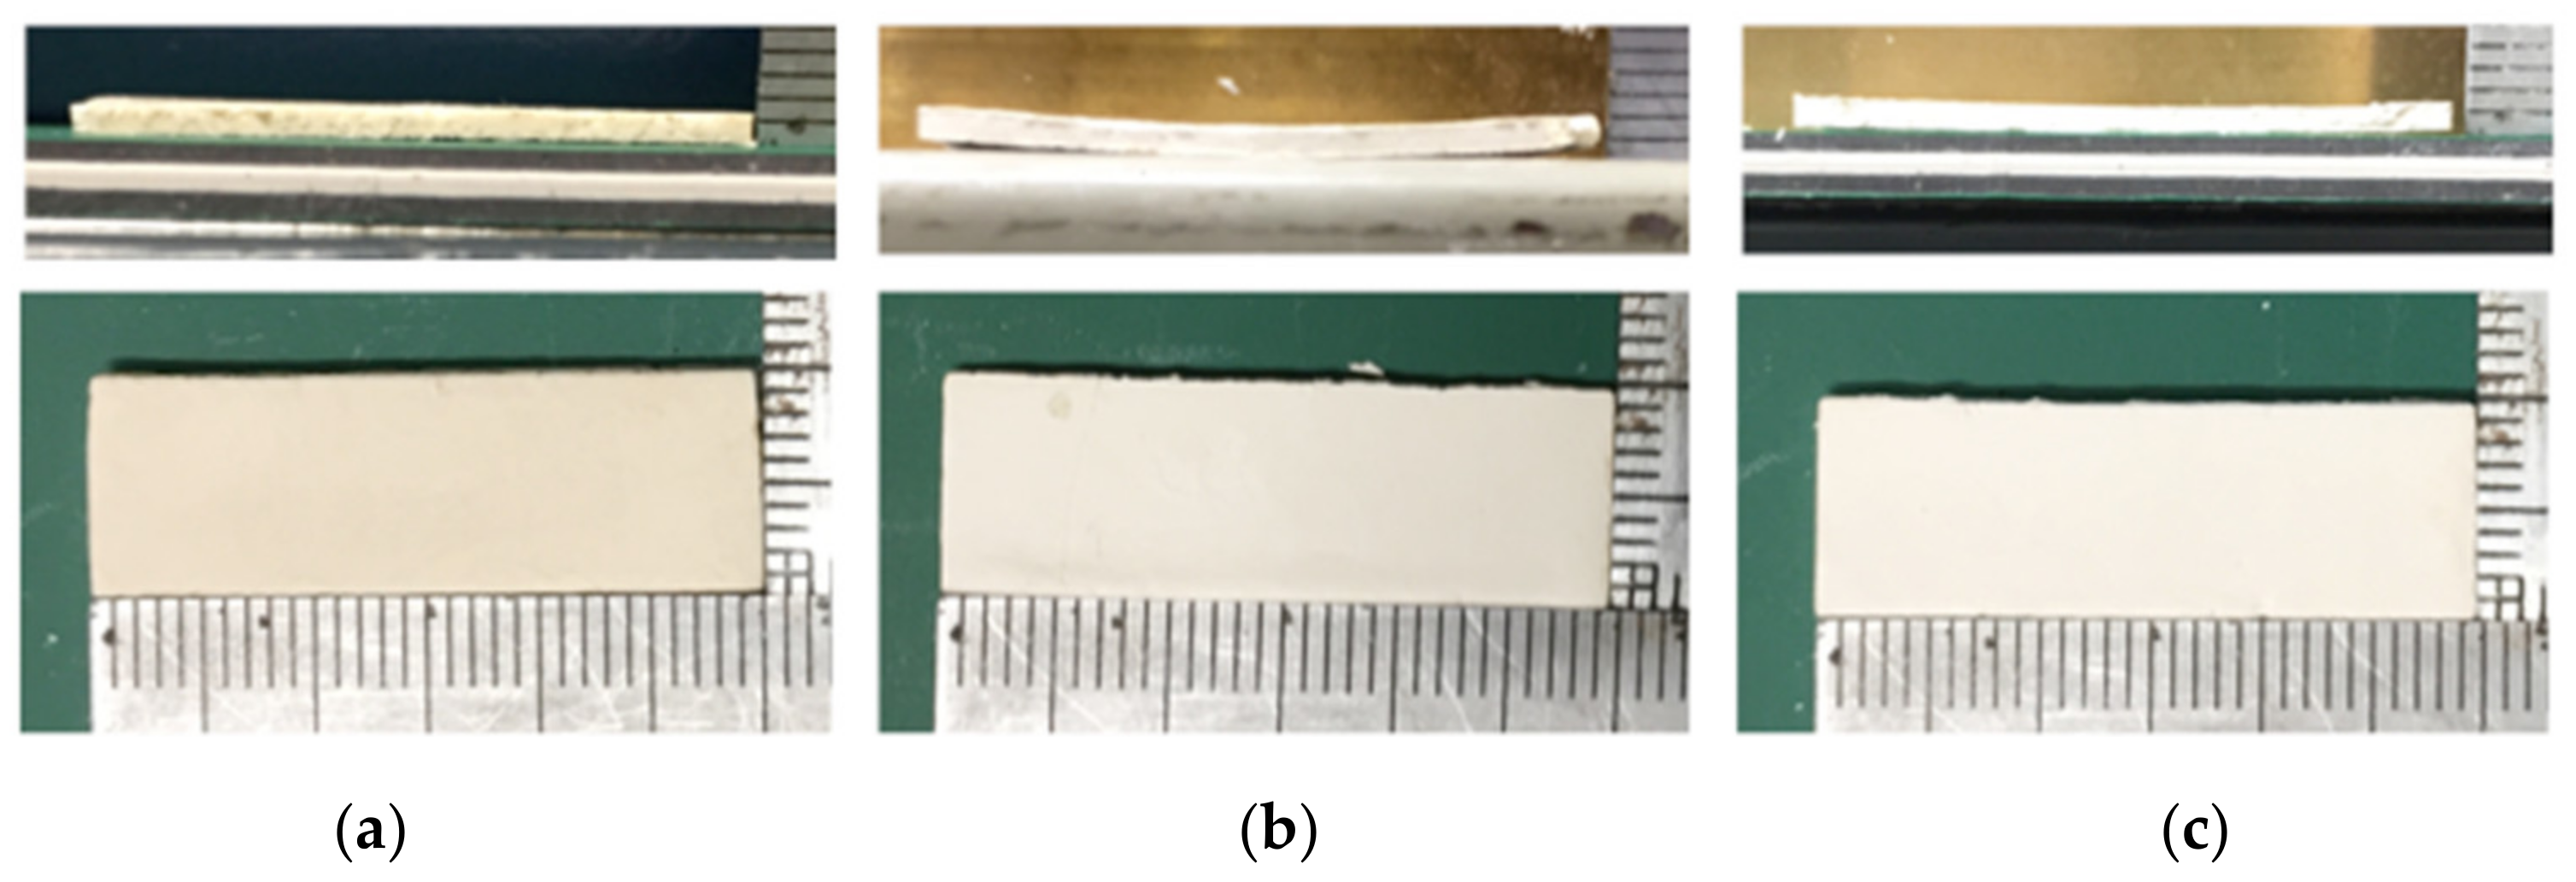
The profiles in the case of the one side drying under hot air temperature 100 °C are drawn in Figure 8. In this figure, the contour profile at 480 s, whose average moisture content was almost the same as that at 300 s during the both sides drying case, is shown in addition to 3 drying times seen in Figure 7 since one side drying proceeded slower than both sides drying. The moisture content profile shows a greater gradient than that in Figure 7 in the region close to the surface exposed to the hot air stream at any drying time. The configuration was deformed so as to warp the thin plate because only the upper side of the sample was subjected to drying and the upper surface shrank greater than the bottom surface. The photographs of the configuration of the sample observed in the experiment are shown in Figure 9. This trend of deformation agreed well between the modeling and the experiment.

4.3. Drying-Induced Stress Formation

Drying-induced stress was also simultaneously solved, as specified in the modeling. The profile of the stress vector in a sample plate was obtained from the analyses. Then, three principal stresses and their orientation vectors can be derived as an eigen value problem of each stress vector. In this study, drying-induced stress behavior was discussed in terms of principal stresses, as the strength will cause crack formation during drying. The transient behavior of the maximum principal stresses in several drying conditions is shown in Figure 10. The maximum principal stress was determined by choosing the greatest stress loaded in the plate in each time step. Positive and negative values mean tensile and compressive stresses, respectively. It should be noted that the location of the maximum stress could move to a different position with the elapsing drying time. The compressive stress was loaded more significantly than the tensile stress in the beginning of drying until 50 s in any case of drying because compressive stress was caused in the inner part of the plate, maintaining still higher moisture content due to immediate shrinkage induced by reduction of moisture content on the surface exposed to a hot air stream as soon as drying started. However, the compressive stress relaxed to almost zero in the falling rate period. The tensile stress became gradually stronger and achieved a peak stress just before completion of drying in the both sides drying case, while the one side drying case continued increasing the stress for at least over 600 s of the drying time. Additionally, the one side drying case resulted in stronger compressive and tensile stresses than the both sides drying case in the later drying period, although slower drying rate induced weaker tensile and compressive stresses in the earlier drying period. However, it is not easy to compare the transient behavior of stress formation more in detail since the drying rate is quite different among the drying conditions.
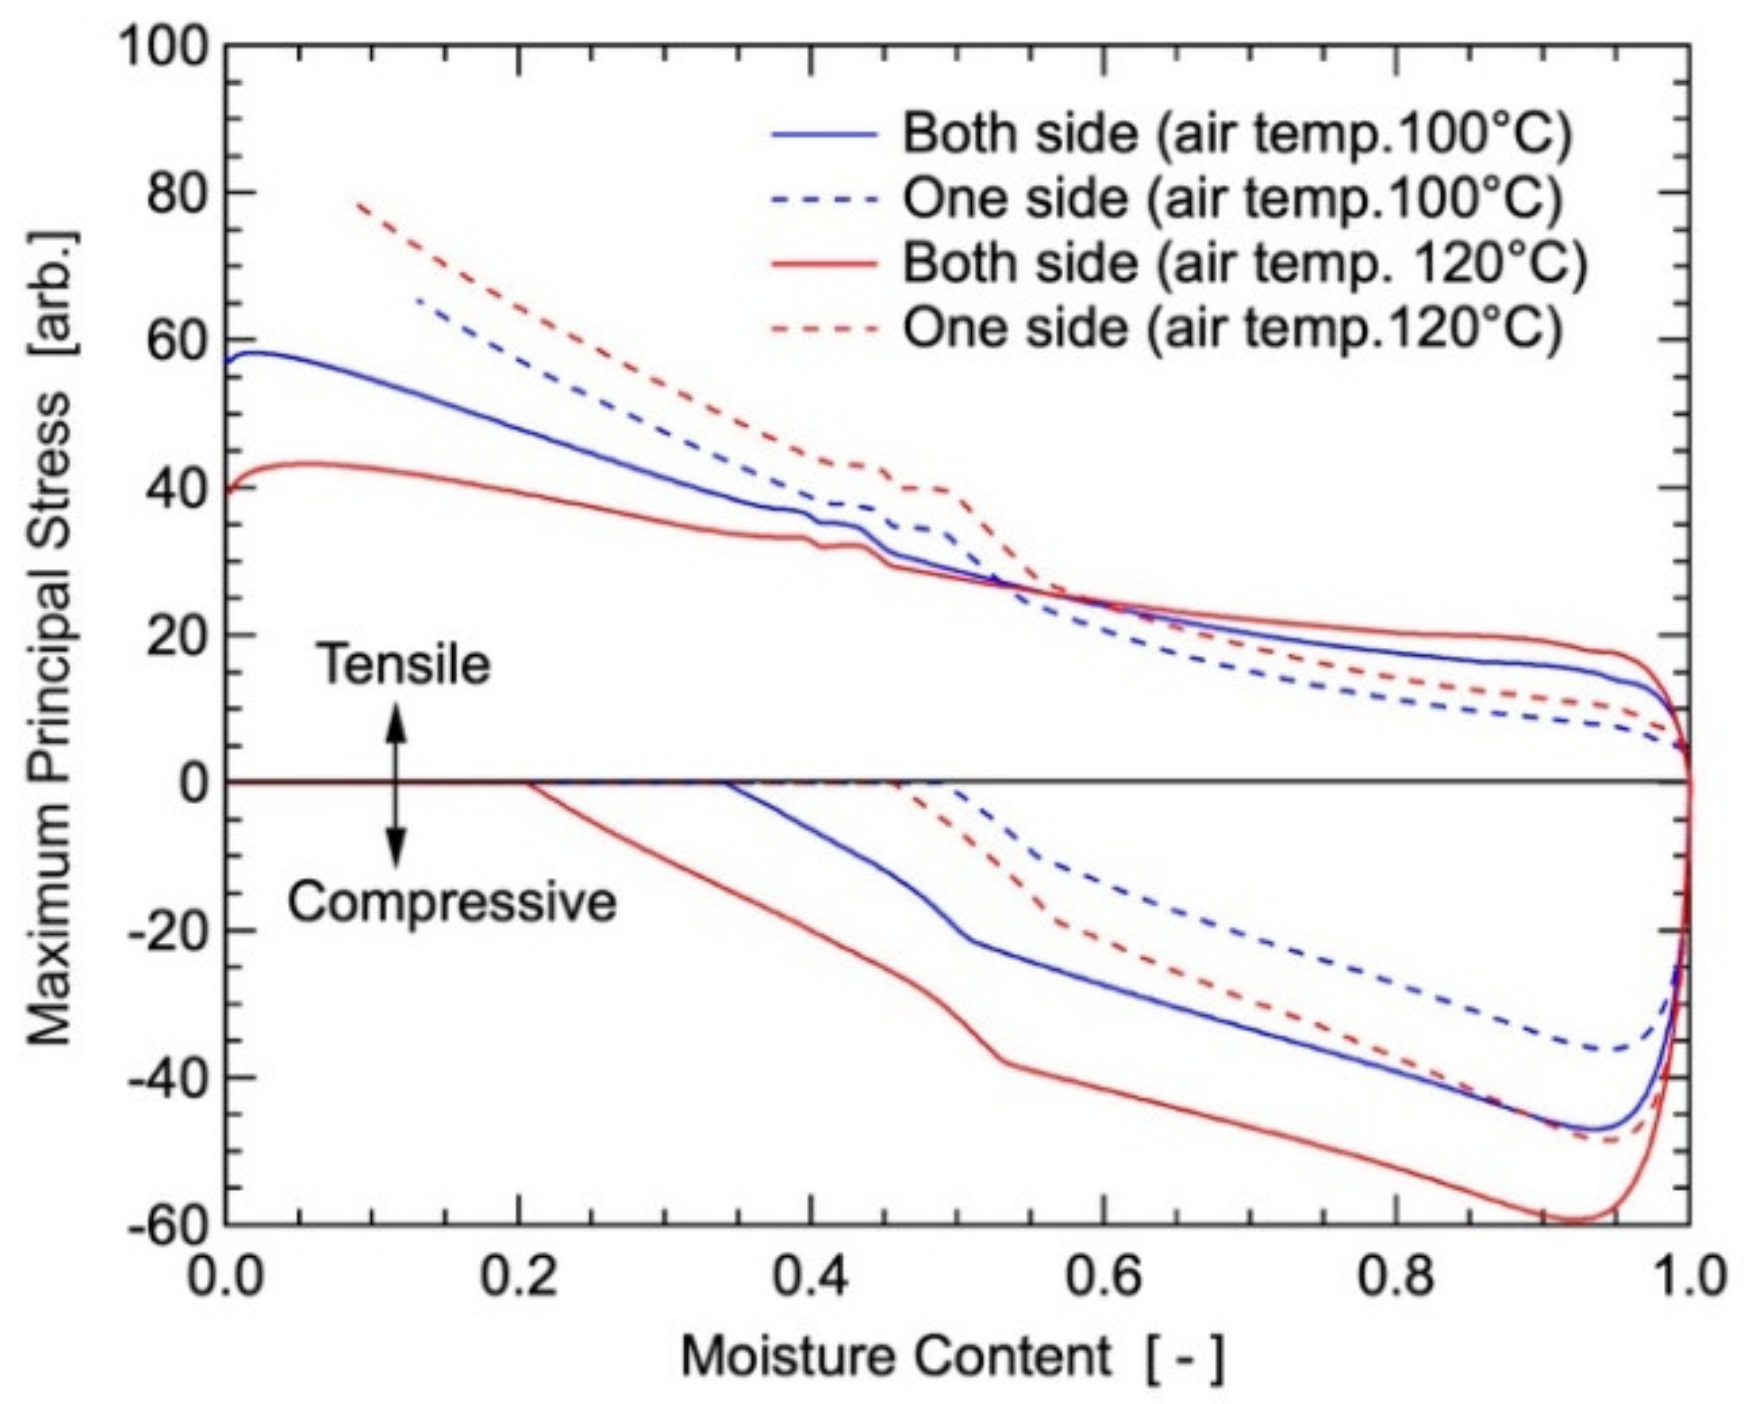
Figure 11 illustrates the principal stresses against the average moisture content of the plate in the drying conditions seen in Figure 10. The compressive stress was usually greater throughout drying with a rise in the drying rate when the stresses were compared with the same moisture content. However, the peak compressive stress in the one side drying case with 120 °C hot air was stronger than that in the both side drying case with 100 °C hot air in the preheating period, although the former drying rate was slower than the latter drying rate. The reason will be because the one side drying case was quite non-homogeneous drying and deformation was significant already at 60 s, as seen in Figure 8. The tensile stress in the preheating and constant rate periods showed a trend to increase with rise in the drying rate in any case of drying, but the one side drying made the tensile stress greater than the both sides drying when the drying proceeded to lower moisture content than the critical moisture content. This fact means that uniform drying of both sides is desirable to enhance the drying rate as well as suppress formation of stress and deformation, although only when the sample plate is as thin as in this work.

4.4. Effect of Plate Thickness on Drying-Induced Stress

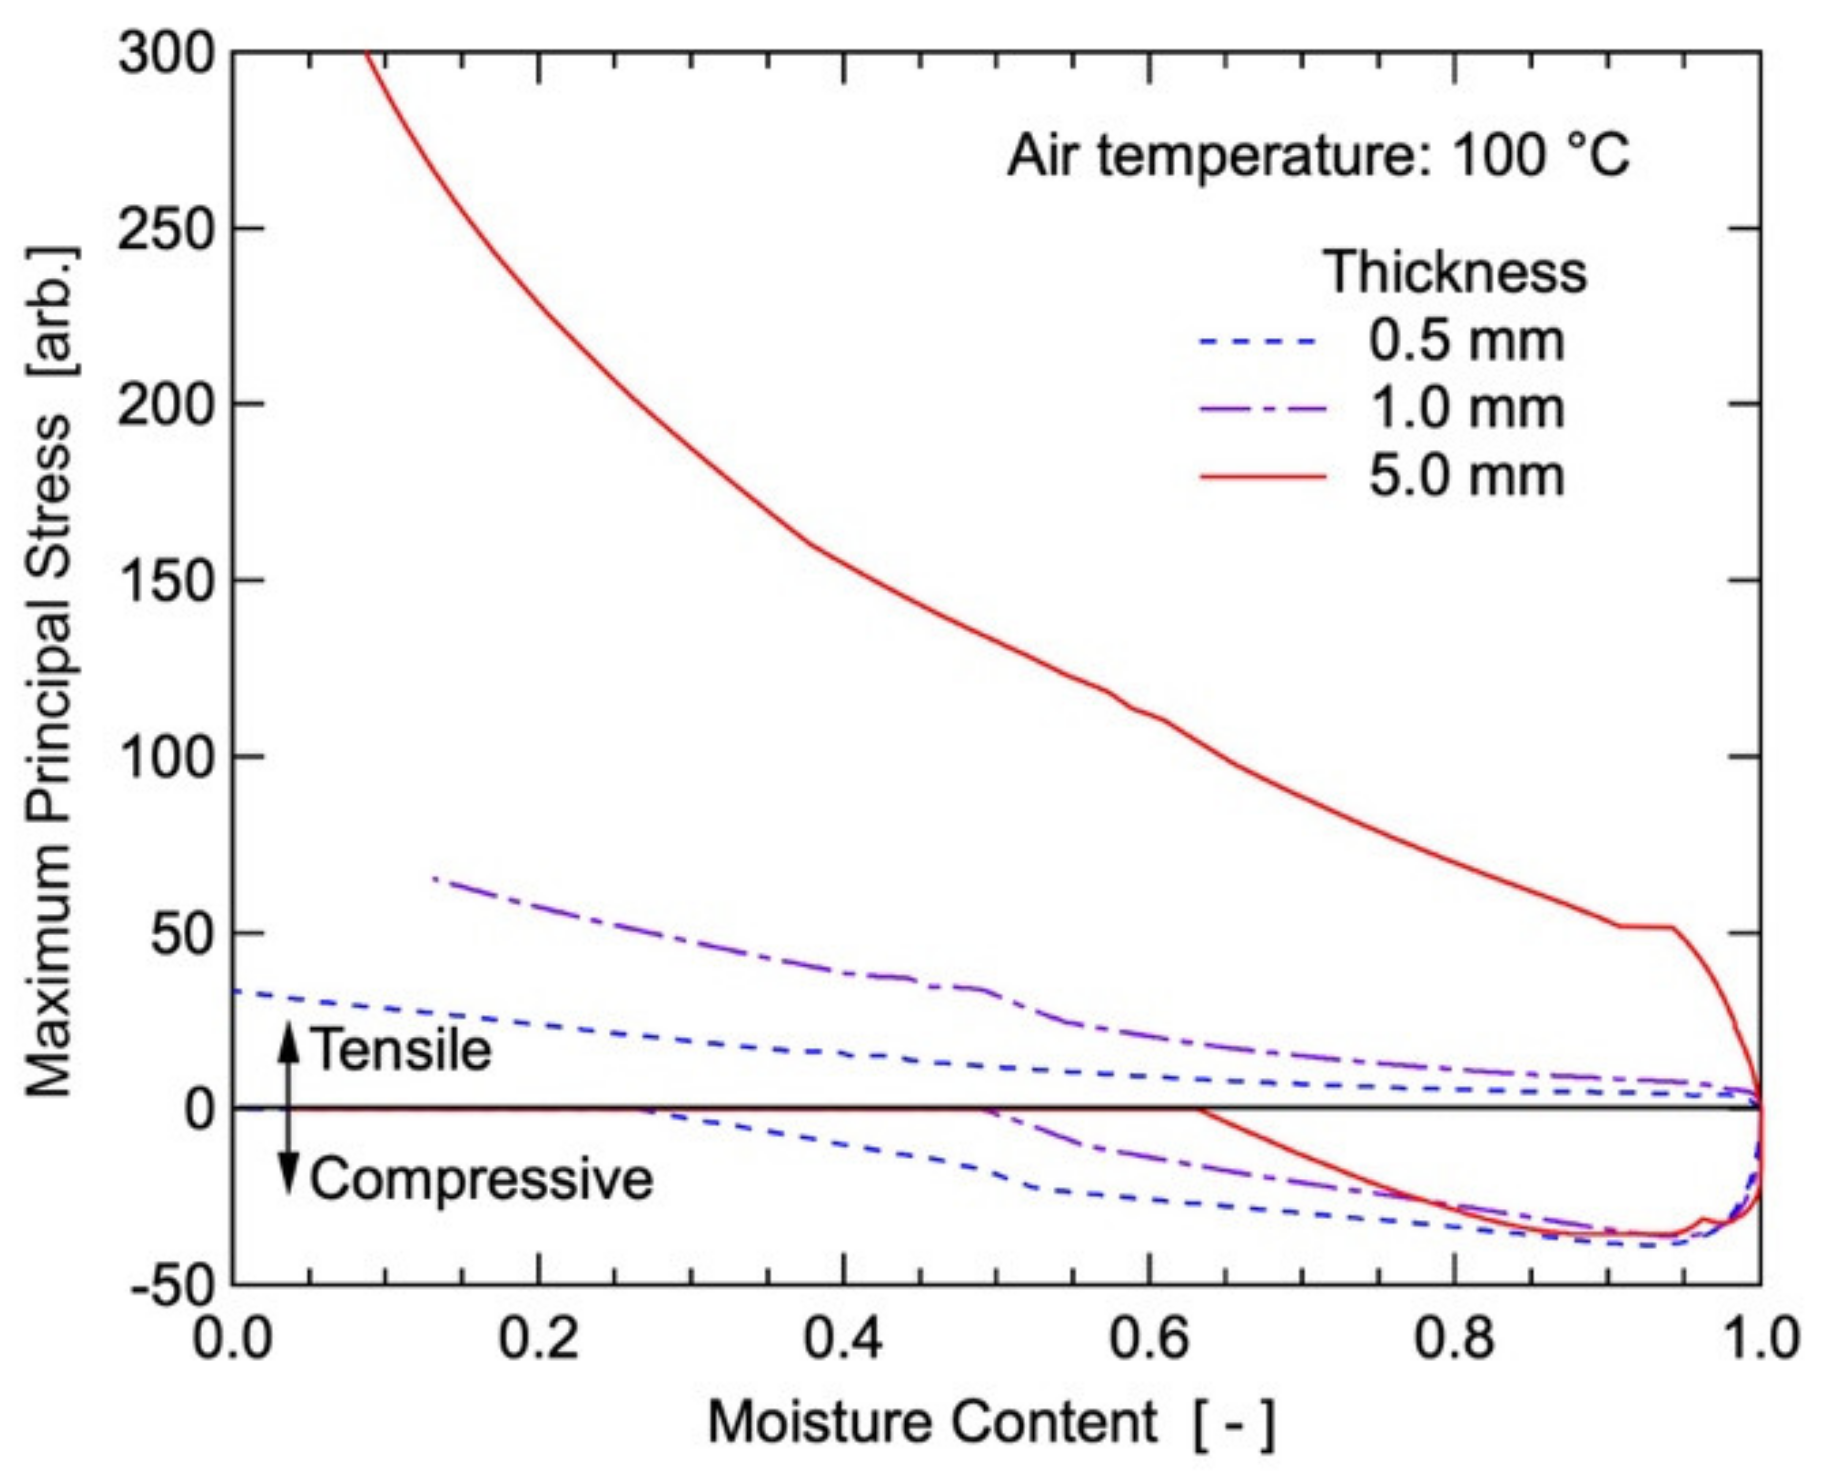
Further parametric analyses were performed to study the effect of the sample thickness on stress formation behavior. Figure 12 shows the comparison of the maximum principal stress behaviors formed in the sample among the three thicknesses, 0.5 mm, 1.0 mm, and 5.0 mm, under air temperature 100 °C. This comparison was done in the one side drying case, as tensile stress continued rising until almost drying completion above the peak magnitude in the both sides drying case. The peak strength of compressive stress was almost independent on the thickness, as far as thin plates less than 5 mm were concerned, but a thicker sample relaxed compressive stress in lower moisture content. The tensile stress rose significantly with an increase in thickness of the thin plate. It is proposed from these trends that the one side drying of thin plates should be controlled more carefully in later drying time during falling rate period rather than constant rate period.
It should be noted that the stresses were given arbitrarily to compare the relative magnitude in this paper, since uncertain properties were used tentatively as they were unknown, and the measurement of the wet sample was not easy.

5. Conclusions

Hot-air drying of ceramic thin plates was studied to investigate the transient behaviors of drying-induced strain-stress and deformation. The drying experiments showed that a test piece of kaolin molded into a thin plate of 10 mm x 30 mm x 1 mm was warped when only one side of the plate was dried, while the plate was almost flat when both sides were dried. The behaviors of the drying and the configuration due to deformation of the thin plate were predicted with a reasonable agreement by the modeling, simultaneously solving the conservation and constitution equations based on heat and moisture transfer and viscoelastic strain-stress by a finite element method. The modeling also showed that the maximum principal compressive stress formed in the plate in any case of the drying conditions achieved a peak strength in a short time and was relaxed to almost zero, while one side drying of the plate made the tensile stress continue increasing until almost drying completion, and beyond that in both sides drying. From the parametric analyses, in the case of one side drying, thicker plates resulted in a little influence on the compressive stress but significantly enlarging tensile stress. It can be concluded that the modeling developed in this work will contribute to the prediction of an optimum drying method to enhance the drying rate while maintaining a quality of dry products of a thin plate.

Author Contributions

Conceptualization, Y.I.; methodology, Y.I.; software, Y.I. and H.H.; validation, Y.I. and H.H.; formal analysis, Y.I. and H.H.; investigation, H.H.; resources, Y.I. and N.K.; data curation, Y.I., N.K., and T.N.; writing—original draft preparation, Y.I.; writing—review and editing, N.K. and T.N.; visualization, Y.I. and H.H.; supervision, Y.I.; project administration, Y.I.; funding acquisition, Y.I. All authors have read and agreed to the published version of the manuscript.

Funding

This research received no external funding.

Conflicts of Interest

The authors declare no conflict of interest.

Nomenclature

BiBiot number defined by Equation (8)
BirBiot number relating to radiative heat transfer defined by Equation (8)
cspecific heat of wet clay
cpaspecific heat of wet air
Dwmoisture diffusivity in sample
E(t)relaxation modulus equivalent to Young’s modulus
Fii element of body force vector
G(t)shear modulus
G1, G2moduli defined by Equations (16) and (17)
Gijkltensor correlating between stress and strain defined by Equation (15)
hheat transfer coefficient
Haabsolute humidity of hot air
Hesaturated absolute humidity at surface temperature of wet sample
J*moisture flux vector
K(t)bulk modulus
kmass transfer coefficient of moisture
Lalatent heat of water
LeLewis number defined by Equation (8)
l0representative length
Nhheat transfer parameter defined by Equation (8)
Nmmass transfer parameter defined by Equation (8)
noutward normal unit vector
q*heat flux vector
Svvolume shrinkage
Ttemperature
ttime
Uii element of displacement vector
Vvolume of sample
Wmoisture content of dry solid base
Wccritical moisture content
x, y, zcoordinate
αthermal diffusivity of sample
δijKronecker’s delta
εijij element of strain tensor
ε*ijij element of strain tensor relating to stress generation
εsijij element of strain tensor caused by free shrinkage
θdimensionless time
νPoisson’s ratio
ηcorrection factor of drying rate defined by Equation (10)
λthermal conductivity of sample
ρdensity of wet clay
ρddry density excluding water in wet clay
σijij element of stress tensor
σrStefan-Boltzmann constant
τdummy value for integration
ϕblackness
superscripts
*dimensionless parameters
0initial condition
ahot air
i, j, k, lx, y or z coordinate
ssurface of sample

References

  1. Gong, Z.X.; Mujumdar, A.S.; Itaya, Y.; Mori, S.; Hasatani, M. Drying of Clay and Nonclay Media: Heat and Mass Transfer and Quality Aspects. Dry. Technol. 1998, 16, 1119–1152. [Google Scholar] [CrossRef]
  2. Itaya, Y.; Taniguchi, S.; Hasatani, M. A Numerical Study of Transient Deformation and Stress Behavior of a Clay Slab during Drying. Dry. Technol. 1997, 15, 1–21. [Google Scholar] [CrossRef]
  3. Itaya, Y.; Mori, S.; Hasatani, M. Effect of Intermittent Heating on Drying-Induced Strain-Stress of Molded Clay. Dry. Technol. 1999, 17, 1261–1271. [Google Scholar] [CrossRef]
  4. Itaya, Y.; Okouchi, K.; Mori, S. Effect of heating modes on internal strain-stress formation during drying of molded ceramics. Dry. Technol. 2001, 19, 1491–1504. [Google Scholar] [CrossRef]
  5. Kowalski, S.J.; Rybicki, A. Qualitative aspect of convective and microwave drying of saturated porous materials. Dry. Technol. 2004, 22, 1173–1189. [Google Scholar] [CrossRef]
  6. Kowalski, S.J.; Rajewska, K.; Rybicki, A. Mechanical effects in saturated capillary-porous materials during convective and microwave drying. Dry. Technol. 2004, 22, 2291–2308. [Google Scholar] [CrossRef]
  7. Scherer, G.W. Theory of Drying. J. Am. Ceram. Soc. 1990, 73, 3–14. [Google Scholar] [CrossRef]
  8. Shishido, I.; Maruyama, T.; Funaki, M.; Ohtani, S. On the Drying Mechanism of Shrinkage Material. Kagaku Kogaku Ronbunshu 1987, 13, 78–85. [Google Scholar] [CrossRef] [Green Version]
  9. Shishido, I.; Muramatsu, T.; Ohtani, S. Local Moisture Content and Stress Distributions within Clay during Drying Shrinkage. Kagaku Kogaku Ronbunshu 1988, 14, 87–94. [Google Scholar] [CrossRef] [Green Version]
  10. Kowalski, S.J.; Rybicki, A. Thermo-hydro-mechanical Aspect of Drying. In Handbook of Industrial Drying, 4th ed.; CRC Press: Boca Raton, FL, USA, 2014; pp. 1239–1260. [Google Scholar]
  11. Zhang, J.; Gao, Y.; Wang, Z. Evaluation of Shrinkage Induced Cracking Performance of Low Shrinkage Engineered Cementitious Composite by Ring Tests. Compos. Part B Eng. 2013, 52, 21–29. [Google Scholar] [CrossRef]
  12. Heydari, M.; Khalili, K.; Ahmadi-Brooghani, S.Y. More Comprehensive 3D Modeling of Clay-Like Material Drying. AIChE J. 2018, 64, 1469–1478. [Google Scholar] [CrossRef]
  13. Holmes, D.M.; Vasant Kumar, R.; Clegg, W.J. Cracking during Lateral Drying of Alumina Suspension. J. Am. Ceram. Soc. 2006, 89, 1908–1913. [Google Scholar] [CrossRef]
  14. Holmes, D.M.; Tegeler, F.; Clegg, W.J. Stresses and Strains in Colloidal Films during Lateral Drying. J. Eur. Ceram. Soc. 2008, 28, 1381–1387. [Google Scholar] [CrossRef]
  15. Lampenscherf, S.; Pompe, W. Mechanical Behavior of Granular Ceramic Film during Drying. Z. Met. Mater. Res. Adv. Tech. 1998, 89, 96–105. [Google Scholar]
  16. Singh, K.B.; Tirumkudulu, M.S. Cracking in Drying Colloidal Films. Phys. Rev. Lett. 2007, 98, 218302. [Google Scholar] [CrossRef] [PubMed] [Green Version]
  17. Raisul Islam, M.; Ho, J.C.; Mujumdar, A.S. Simulation of liquid diffusion-controlled drying of shrinking thin slabs subjected to multiple heat sources. Dry. Technol. 2003, 21, 413–438. [Google Scholar] [CrossRef]
Figure 1. Metal mold for sample preparation.
Chemengineering 04 00009 g001
Figure 2. Ceramic thin sheet traveling in a dryer.
Chemengineering 04 00009 g002
Figure 3. Outline of hot-air drying experimental setup (one side drying of sample).
Chemengineering 04 00009 g003
Figure 4. Outline of hot-air drying experimental setup (both sides drying of sample).
Chemengineering 04 00009 g004
Figure 5. Transient behavior of temperature and moisture content during drying: (a) air temperature 100 °C; (b) air temperature 120 °C.
Chemengineering 04 00009 g005
Figure 6. Dimensionless temperature and moisture content.
Chemengineering 04 00009 g006
Figure 7. Profiles of moisture, temperature, and deformation behavior during both sides drying (hot air temperature 100 °C).
Chemengineering 04 00009 g007
Figure 8. Moisture profiles and deformation behavior during one side drying (hot air temperature 100 °C).
Chemengineering 04 00009 g008
Figure 9. Configuration of the samples before and after drying (hot air temperature 100 °C): (a) initial sample before drying; (b) after 1200 s in one side drying; and (c) after 600 s in both sides drying.
Chemengineering 04 00009 g009
Figure 10. Transient behavior of maximum principal stresses in sample with 1.0-mm thickness.
Chemengineering 04 00009 g010
Figure 11. Maximum principal stresses against moisture content in sample with 1.0-mm thickness.
Chemengineering 04 00009 g011
Figure 12. Maximum principal stresses against moisture content in sample with different thicknesses.
Chemengineering 04 00009 g012
Table 1. Experimental conditions.
TermsRun 1Run 2Run 3Run 4Run 5
Drying modeOne side dryingBoth sides drying
Hot air temperature [°C]100100120100120
Sample thickness [mm]1.00.51.01.01.0
Sample width [mm]10.010.010.010.010.0
Sample length [mm]30.030.030.030.030.0
Initial sample weight [g]0.6220.2950.6730.6400.667
Initial sample temperature [°C]10.013.27.46.67.2
Sample moisture content [kg-water/kg-dry solid]0.3590.3160.4170.4200.381
Air flow rate at atmospheric temperature [L/min]5050505050
Air humidity [kg-moisture/kg-dry air]1.8 × 10−35.9 × 10−31.8 × 10−31.8 × 10−31.8 × 10⁻³