Article

Obtaining Mn-Co Alloys in AISI 430 Steel from Lithium-Ion Battery Recycling: Application in SOFC Interconnectors

by
Sicele L. A. Gonçalves
1,*,
Eric M. Garcia
2,
Hosane A. Tarôco
2 and
Tulio Matencio
3,*
1
Department of Chemical Engineering, Federal University of Minas Gerais, 13565-905 Belo Horizonte, Brazil
2
Department of Exact and Biological Sciences, Federal University of São João Del Rei - Sete Lagoas Campus, 35701-970 Sete Lagoas, Brazil
3
Department of Chemistry, Federal University of Minas Gerais, 13565-905 Belo Horizonte, Brazil
*
Authors to whom correspondence should be addressed.
ChemEngineering 2020, 4(1), 10; https://doi.org/10.3390/chemengineering4010010
Submission received: 9 October 2019 / Revised: 7 January 2020 / Accepted: 31 January 2020 / Published: 5 February 2020
(This article belongs to the Special Issue 2019 HYPOTHESIS XIV)

Abstract

:
The recycling of exhausted lithium-ion batteries from mobile phones originate five solutions with different Co and Mn proportions that were used as electrolytic solutions to obtain Mn-Co spinel coatings on the surface of AISI430 stainless steel. The coatings are intended to contain chromium volatility in the working conditions of Solid Oxide Fuel Cells (SOFC) metallic interconnectors. Potentiostatic electrodeposition was the technique used to obtain Mn-Co coatings from low concentration electrolytes at pH = 3.0 and potential applied −1.3 V. Charge efficiency data were used for sample optimization. Three optimized samples were subjected to oxidation heat treatment at 800 °C for 300 h and then characterized by XRD, SEM and EDS. The results showed that the addition of manganese ions instead of cobalt ions in the electrolytic bath produces more stable and well-distributed deposits as the ratio of the two ions becomes equal in the electrolytic bath. Thin, homogeneous and stable spinel coatings (Mn, Co)3O4 2.8 μm and 3.9 μm thick were able to block chromium volatility when exposed to SOFC operating temperature.

1. Introduction

Solid Oxide Fuel Cells (SOFC’s) are promising devices for power generation [1,2,3,4,5]. Operating in medium-high temperature environments (750–1000 °C), SOFCs have relatively high energy conversion efficiency, low emission of pollutants and fuel flexibility compared to other types of fuel cells [1,2,3,4,5,6]. The electrical contact between two adjacent SOFC unit cells is promoted by the interconnectors, which also have the function of separating and distributing fuel and oxidant gases in the electrode [7,8,9]. The selection of interconnect materials depends on the good compatibility of their properties with the cell components and still be economically feasible [1,2,5,10]. However, high working temperature cells (750–1000 °C) implies higher costs with compatible materials, increasing manufacturing costs and shortened cell life [1,2,10]. Traditionally, ceramic materials such as lanthanum chromite (LaCrO3) were used in high-temperature SOFC interconnectors [10,11,12]. However, technological advances in the manufacture and design of SOFCs allowed the reduction of the working temperature for intermediate ranges between 700 and 850 °C, thus being able to use lower costs and good properties materials as interconnectors [11]. Ferritic stainless steels, such as AISI430, are a good alternative for interconnector construction. The class of austenitic stainless steels are not acceptable as interconnectors as they contain addition of nickel. This element, despite increasing the corrosion resistance of the material, also increases its cost (Table 1) and modifies its coefficient of thermal expansion, which makes it unviable.
Commercial ferritic alloys were specially developed for SOFC applications and showed good results [7,10,11,12,13,14,15]. Crofer 22APU with nominal composition 20–24Cr; 0.03C; 0.3–0.8Mn; 0.5Si; 0.5Al; 0.2Ti; 0.2La (% wt) was specially developed for applications in SOFC environments [10,11,12,13]. Their superficial layer is predominantly composed by spinel oxides Cr2O3 and a columnar outer layer (Mn, Cr)2O3. This outer layer presents excellent corrosion resistance in atmospheres relevant to SOFC applications up to 900 °C, reducing the evaporation of chromium very effectively [13,16]. However, the manufacturing process and the noble metals present in their composition increase the final cost and, therefore, do not meet the economic viability requirement of SOFC [8,10]. As a good alternative, ferritic stainless steel (17–20% Cr) has been extensively studied for interconnectors manufacturing processes due to their properties as low cost, good mechanical properties and good workability if compared to the previously used materials [7,8,9,11,12,17]. However, at high temperatures, chromium may form gaseous oxides that migrating to the cathode and gradually reducing the cell performance, a phenomenon known as chromium poisoning [4,5,6,7,8,9,10,11,12]. Also, the reduction of Cr concentration in the base alloy promotes a thickness reduction in the protective chromium oxide layer and thus allows an iron oxide layer appearance. The oxidation/spallation phenomena result in a decrease in electrical conductivity and an increase in contact resistance between stacks [9,10].
As an alternative to chromium poisoning, several technologies have been studied including modification of steel composition [14,15], surface treatments [18] and application of protective coatings [7,8,9,19,20,21]. Application of protective coatings is a simple, efficient and cheaper method that inhibits the phenomenon of chromium poisoning and maintains a good specific electrical resistance. Co-Mn based spinels have been developed as a protective layer that improves the performance of ferritic steels and can be obtained by different methods [22] such as slurry coating [23], plasma spray [24], electrodeposition [25,26,27,28,29], and others techniques [30,31].
Electrodeposition technique involves the deposition of a metal or alloy film over a conducting surface by electrolysis from a well-formulated electrolyte known as a bath, which can be an aqueous simple salt solution or a complex salt type [32]. Karpuz, Kockar and Alper (2015) [28] investigated the effect of deposition parameters, such as electrolyte concentration and pH, deposition potential and film thickness. They demonstrated that microstructure and grain size are very dependent on these parameters, especially pH. For the experiment, the authors used a solution (0.1 M) MnSO4 + (0.25 M) H3BO3 + (0.25 M) CoSO4 and cyclic voltammetry data indicated the electrodeposition potential of the Mn-Co alloy. The results showed that smaller and more homogeneous grains are formed at lower pH’s and that the variation of this parameter does not influence the concentration of Mn in the deposited layer.
The possibility of obtaining the deposition electrolytes, rich in Mn and Co, from lithium-ion batteries recycling, is an attractive option to obtain coated metallic interconnectors at an even lower cost. Lithium-ion batteries (LIB’s) are efficient devices with high power density widely used in cell phones in the world [33]. These batteries, which have a durability average of 2 years, can become an object of environmental concern since, after their cycling life, these devices, which present toxic metals in their composition, are usually disposed of in an inadequate in the environment. It also adds to the economic importance of recycling [34]. According to METALARY (https://www.metalary.com), cobalt, for example, came in at about $ 80,000/t in 2018 (Table 1).
LIB’s are composed of cathode, anode, electrolyte, separator and current collector. The anode is graphite carbon, and the cathode is a lithium oxide and another metal in the form LiMO2, where M most often represents Co, Mn, Fe or Ni [35,36,37]. Operating at low temperatures and without burning organic solvents, a hydrometallurgical route can be used to recycle the LIB’s metals [38]. This method includes, after discharging and dismantling of exhausted LIB’s, the removal of aluminum foil using sodium hydroxide followed by acid leaching and finally the metal fluids recycling by precipitation or solvent extraction [39,40]. Thus, after the disposal of mobile phone batteries, the hydrometallurgical process allows its cathode recycling and reuse of the metals present in its composition [38]. In our previous work [41], the same recycling process was used to obtain a new anode for hydrogen production that was developed based on 430 stainless steel. In this present work, the mobile phones cathodes were dissolved under a hydrometallurgical process and produced a solution rich in Co and another in Mn. These solutions were used for the electrodeposition of Mn-Co in AISI 430 ferritic stainless steel by electrolytes with different Co and Mn proportions to improve its morphological and efficiency characteristics as a SOFC metallic interconnector. Potentiostatic electrodeposition was used as a viable alternative to obtain, from low concentrations solutions, relatively thin and dense layers with high efficiency and low costs [30,31,32,33]. The samples were submitted to thermal cycling of 800 °C to obtain the (Mn, Co)3O4 spinel layers. The microstructure and composition were analyzed by X-ray diffraction (XRD) to observe the surface phases in the samples after heat treatment. SEM and EDS were used to verify the homogeneity, grain distribution and surface chemical composition.

2. Materials and Methods

2.1. Substrate Preparation

Ferritic stainless steel AISI430 was used as a substrate in the form of rolled sheets in dimensions of 20 × 20 × 1 mm. The nominal steel composition is presented in Table 2.
The steel substrates were sanded using a DPU-10 Strues polishing machine with 400 and 600 water sandpaper. After this step, the samples were washed with deionized water and isopropyl alcohol and then dried with the aid of a HL 500 Steinel thermal blower.

2.2. Recycled Electrolyte Solutions: Hydrometallurgical Route

An illustrative scheme of the process for obtaining recycled electrolyte solutions is shown in Figure 1. Two exhausted Li-ion batteries used in cell phones were manually disassembled and their components separated. The cathodes were brought to the oven at 100 °C for 24 h to volatilize any residual organic solvents present in the electrolyte [42]. For the preparation of the solution, the cathode was detached from the current collecting aluminum strip after immersion in 2 mol/L NaOH [40,43,44,45]. The dissolution reactions of the current collecting aluminum foil are represented in Equations (1) and (2) below [45].
A l 2 O 3 ( s ) + 2   N a O H ( l ) + 3 H 2 O ( l ) 2 N a [ A l ( O H ) 4 ] ( l )
2 A l ( s ) + 2 N a O H ( l ) + 6 H 2 O ( l )     2 N a [ A l ( O H ) 4 ] ( l ) + 3 H 2 ( g )
After filtration and washed in deionized water, the cathode material was dried under ambient conditions for 24 h. The final product was dissolved in 10 mL of 6 mol/L H2SO4, 8 mL of 36% v/v H2O2 and 200 mL of distilled water. The solution was kept under stirring and heating at 80 °C for 2 h [41,45,46,47,48,49]. After cooling to room temperature, the solutions were filtered and the pH adjusted to 3.0 [27,29,50,51,52] with the addition of sodium acetate.
The concentrations of the electrolyte solutions from the recycling process were analyzed by Atomic Absorption Spectrometry (Intralab model AA-1275ª) and the results, S1 and S2, are showed at Table 3. From these results, the concentrations were adjusted with the addition of deionized water to obtain five solutions with different ratios between cobalt and manganese ions (A1–A5) (Table 3). The recovery of these metals was performed by Potentiostatic Electrodeposition.

2.3. Electrochemical Measurements

Cyclic Voltammetry and Potentiostatic Electrodeposition were performed on an Autolab PGSTAT 30 Potentiostat. An electrochemical cell with three electrodes was used in which: the working electrode are samples of AISI430 rolled steel sheets (3.0 cm2 dipped in the electrolyte); the reference electrode was Ag/AgCl; the platinum auxiliary electrode and electrolytes were the solutions obtained by the Li-ion battery recycling process (Table 2). Cyclic voltammetry was performed at 40 mVs−1 in 40 mL of each of the five “A” solutions, shown in Table 2. The charge efficiency (ε) was obtained by Equation (3), where ia and ic are the anodic and cathodic current density, respectively.
ε ( % ) = t 1 t 2 i a d t t 1 t 2 i c d t × 100
Potentiostatic electrodeposition was performed at potential −1.3 V for the five solutions. The process was performed for the time necessary to reach 20.0 C/cm2 of charge density.
The charge efficiency was also determined by the relationship between the actual mass gain of each sample after electrodeposition (ma) and the theoretical mass calculated (mt) (Equation (4)) [53].
The theoretical mass to be deposited during the process can be calculated based on Faraday’s Law (Equation (5)), provided the charge values (Q) that goes through the process, the molar mass of the deposited coating (M), the number of moles of electrons exchanged in the reaction (z) and the Faraday constant (F = 96.485 C·mol−1) [46]. In this study, M was the average molar mass between Mn and Co (56,936 g/mol). The samples were dried at room temperature and then weighed.
ε ( % ) = m a m t × 100
m t = Q M / z F
After this step, both coated and uncoated samples were subjected to oxidation heat treatment at 800 °C for 300 h, in 50 or 100 h cycles to obtain the protective spinel (Mn, Co)3O4 phases. At each cycle, the samples were cooled to room temperature and the gain mass determined for each one.
After heat treatment, the samples were characterized by X-ray diffractometry (XRD). XRD analysis was performed using Shimadzu—7000 with CuKα radiation (40 kV and 30 mA). The 2θ measurement was carried out at room temperature, in the range 30°–65° with a scan speed of 4 degrees by minute. Crystallographic standard patterns PDF 23-1237 and 80-1640 provided by the Crystallographica Search Match software indicate the peaks for the protective spinel MnCo2O3 and Co3O4 respectively [7,8,26]. These standard patterns were used as a source of comparison for the peaks related to these spinels in the “A” samples obtained. The uncoated steel sample underwent the same oxidation process and the diffractogram obtained was used to indicate the peaks concerning substrate oxidation in the diffractograms of the coated samples.
SEM and EDS were the techniques used to study the morphology and composition of the samples. The observations have been performed using a JEOL JSM–6360LV equipped with an energy dispersive X-ray based on Bruker SDD detectors. For quantification, QuantaX70 software was used. Image J software was used to calculate average grain sizes, sample porosity and coating thickness.

3. Results

3.1. Electrolyte Solutions

Table 4 shows the metals present in lithium-ion batteries by Atomic Absorption Spectroscopy. Battery 1 yielded a solution rich in Mn ions, and Battery 2 yielded a solution rich in Co ions. Mixing these solutions yielded five new solutions with well-defined proportions between Co and Mn, as shown in Table 3.

3.2. The Efficiency of Electrochemical Processes

For “A” solutions, the cyclic voltammetry graphs are shown in Figure 1. It can be seen that for all solutions, the cathodic reduction current starts at around −0.8 V and grows as the potential becomes more negative, indicating the reduction of metal ions present in the solution [28,29,41,52]. According to Karpuz et al. 2015 [29], the electrodeposition potential of Co-Mn alloy can be chosen based on values that produce reduction currents for both metals separately. In this work, solutions A1 and A5 are concentrated only in Co and Mn ions, respectively. Thus, it can be seen from Figure 2, the potential of −1.3 V as propitious in both cases to generate a reduction of electric current in the samples.
When the current becomes anodic, a larger width of the dissolution peak may indicate deposits that are more resistant to the oxidation process caused by the application of more positive potentials than −0.4 V. The stability of these deposits may be influenced by the parallel reduction of H+ ions during the cathodic reduction process. Hydrogen is adsorbed during the formation of intermediate phases and modifies the crystalline structure of the formed coating, influencing porosity and grain size during the deposition process [29,54]. Thus, it can be observed that for solutions A at pH = 3.0 there is a more stable deposit formation for solution A2, while A1 and A3 form intermediate stability deposits and, A4 and A5 indicate the formation of an inefficient deposit.
From the voltammograms, the total process efficiency for each solution can be determined (Equation (3)). The results are shown in Figure 3.
The relationship between theoretical mass and actual mass (Equation (5)) after the electrodeposition process also provides charge efficiency data presented in Figure 4. The theoretical mass of 0.006 g was calculated by Equation (4).
The analysis of the efficiency data provided by Figure 2 and Figure 3 allows us to infer that among the five solutions analyzed, only A1, A2 and A3, solutions more concentrated in cobalt ions, presented satisfactory efficiencies. For solutions A4 and A5, efficiency is approximately zero when calculated from voltammetric curves (Figure 3) and between 3% and 12% using deposited mass gain data (Figure 4).
The charge efficiency obtained by cyclic voltammetry predicts a relationship between the microstructural and chemical stability characteristics of the formed films. The efficiency calculated by the theoretical and actual mass variation obtained in the process allows a relationship between the amount of total charge applied in the process and the actual charge used in the metal reduction process. Thus, it can be observed that the most chemically stable samples, A1, A2 and A3 were also those that obtained the highest mass gain during electrodeposition. For these samples, the microstructural characterizations and surface chemical composition are shown in the following sections.

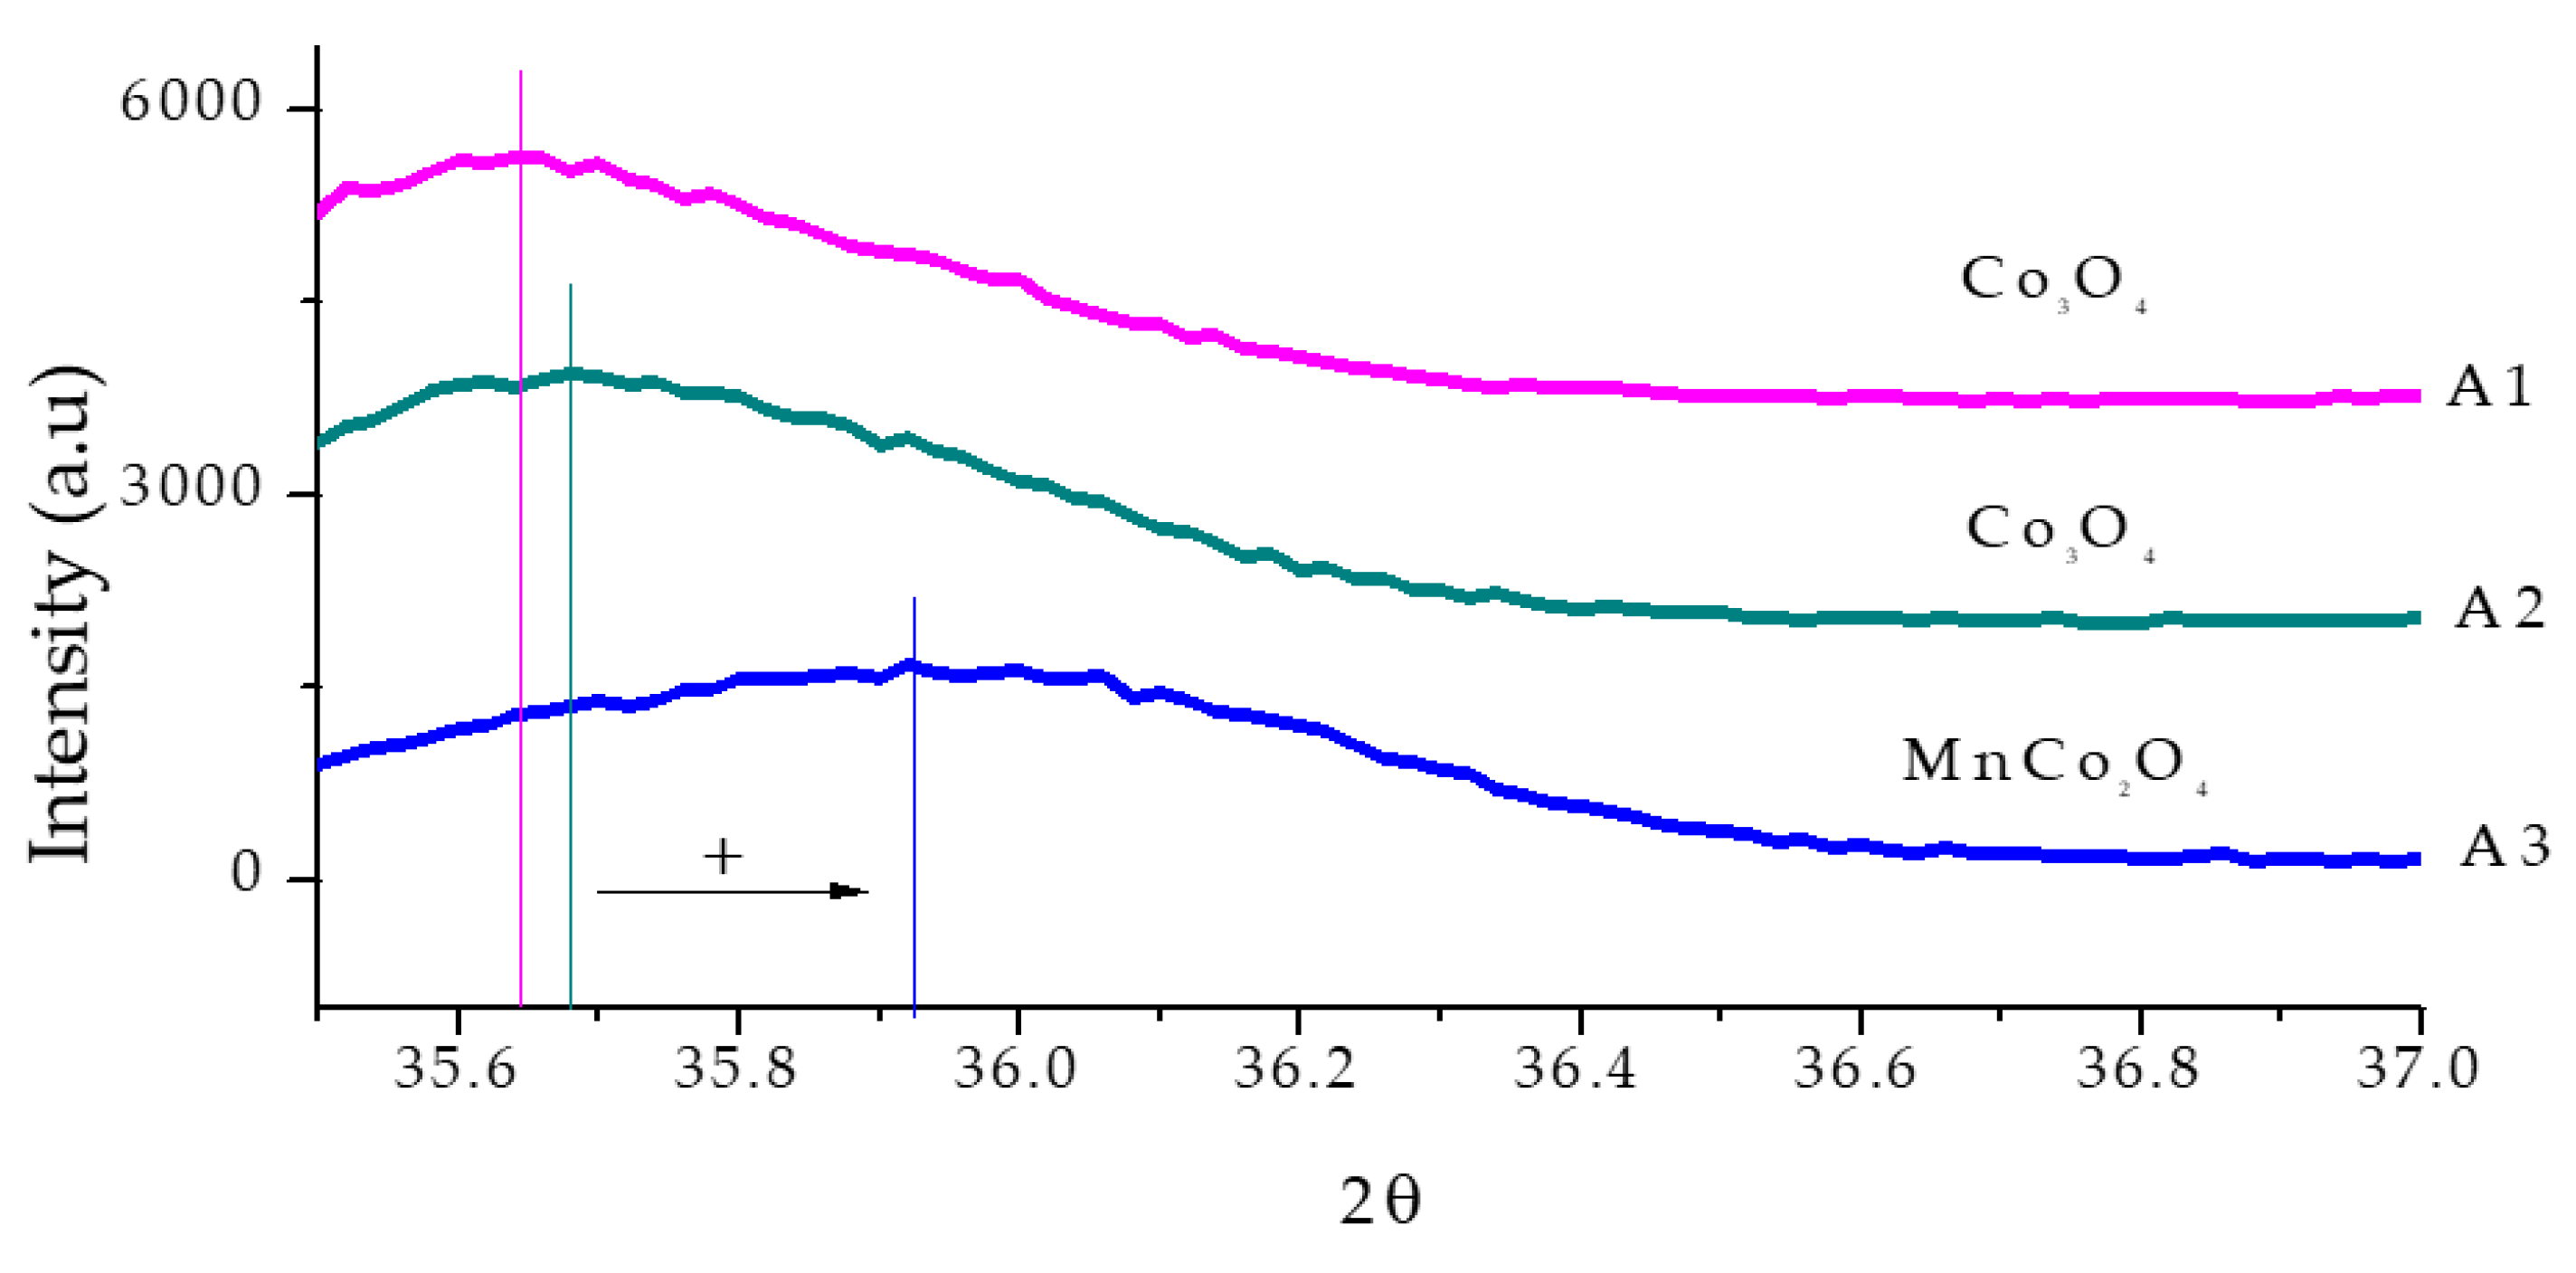
3.3. X-Ray Diffraction
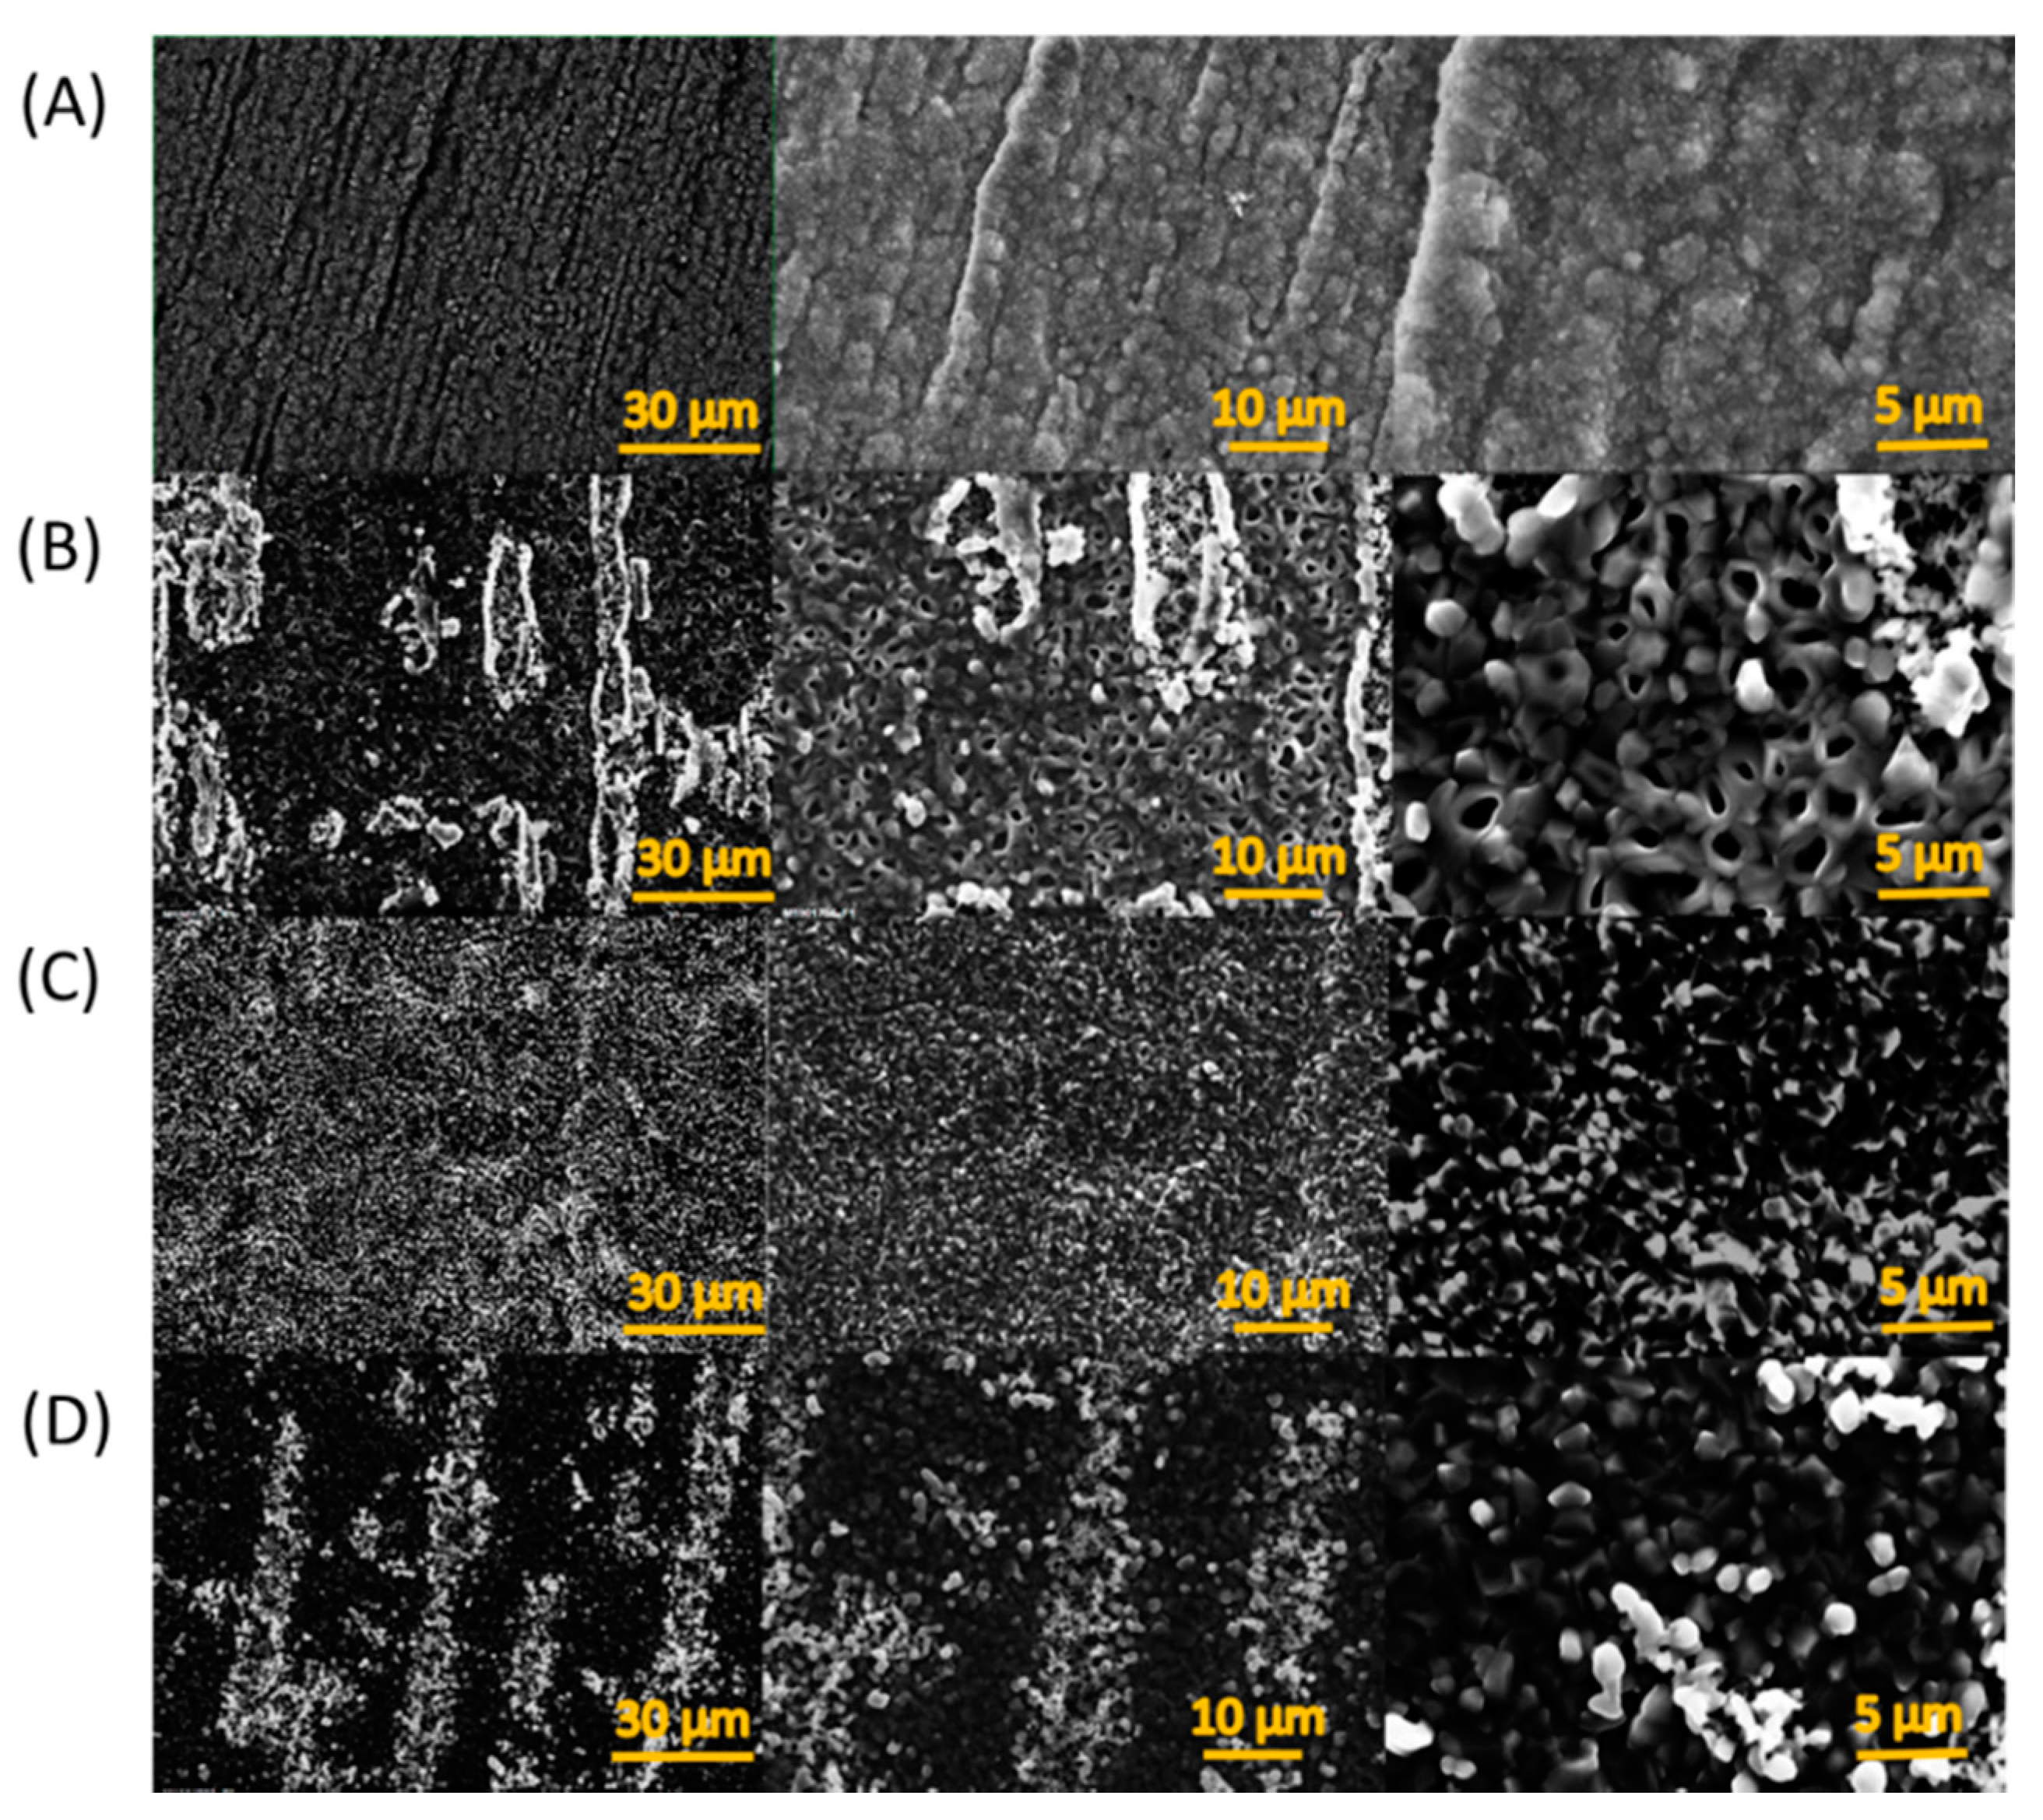
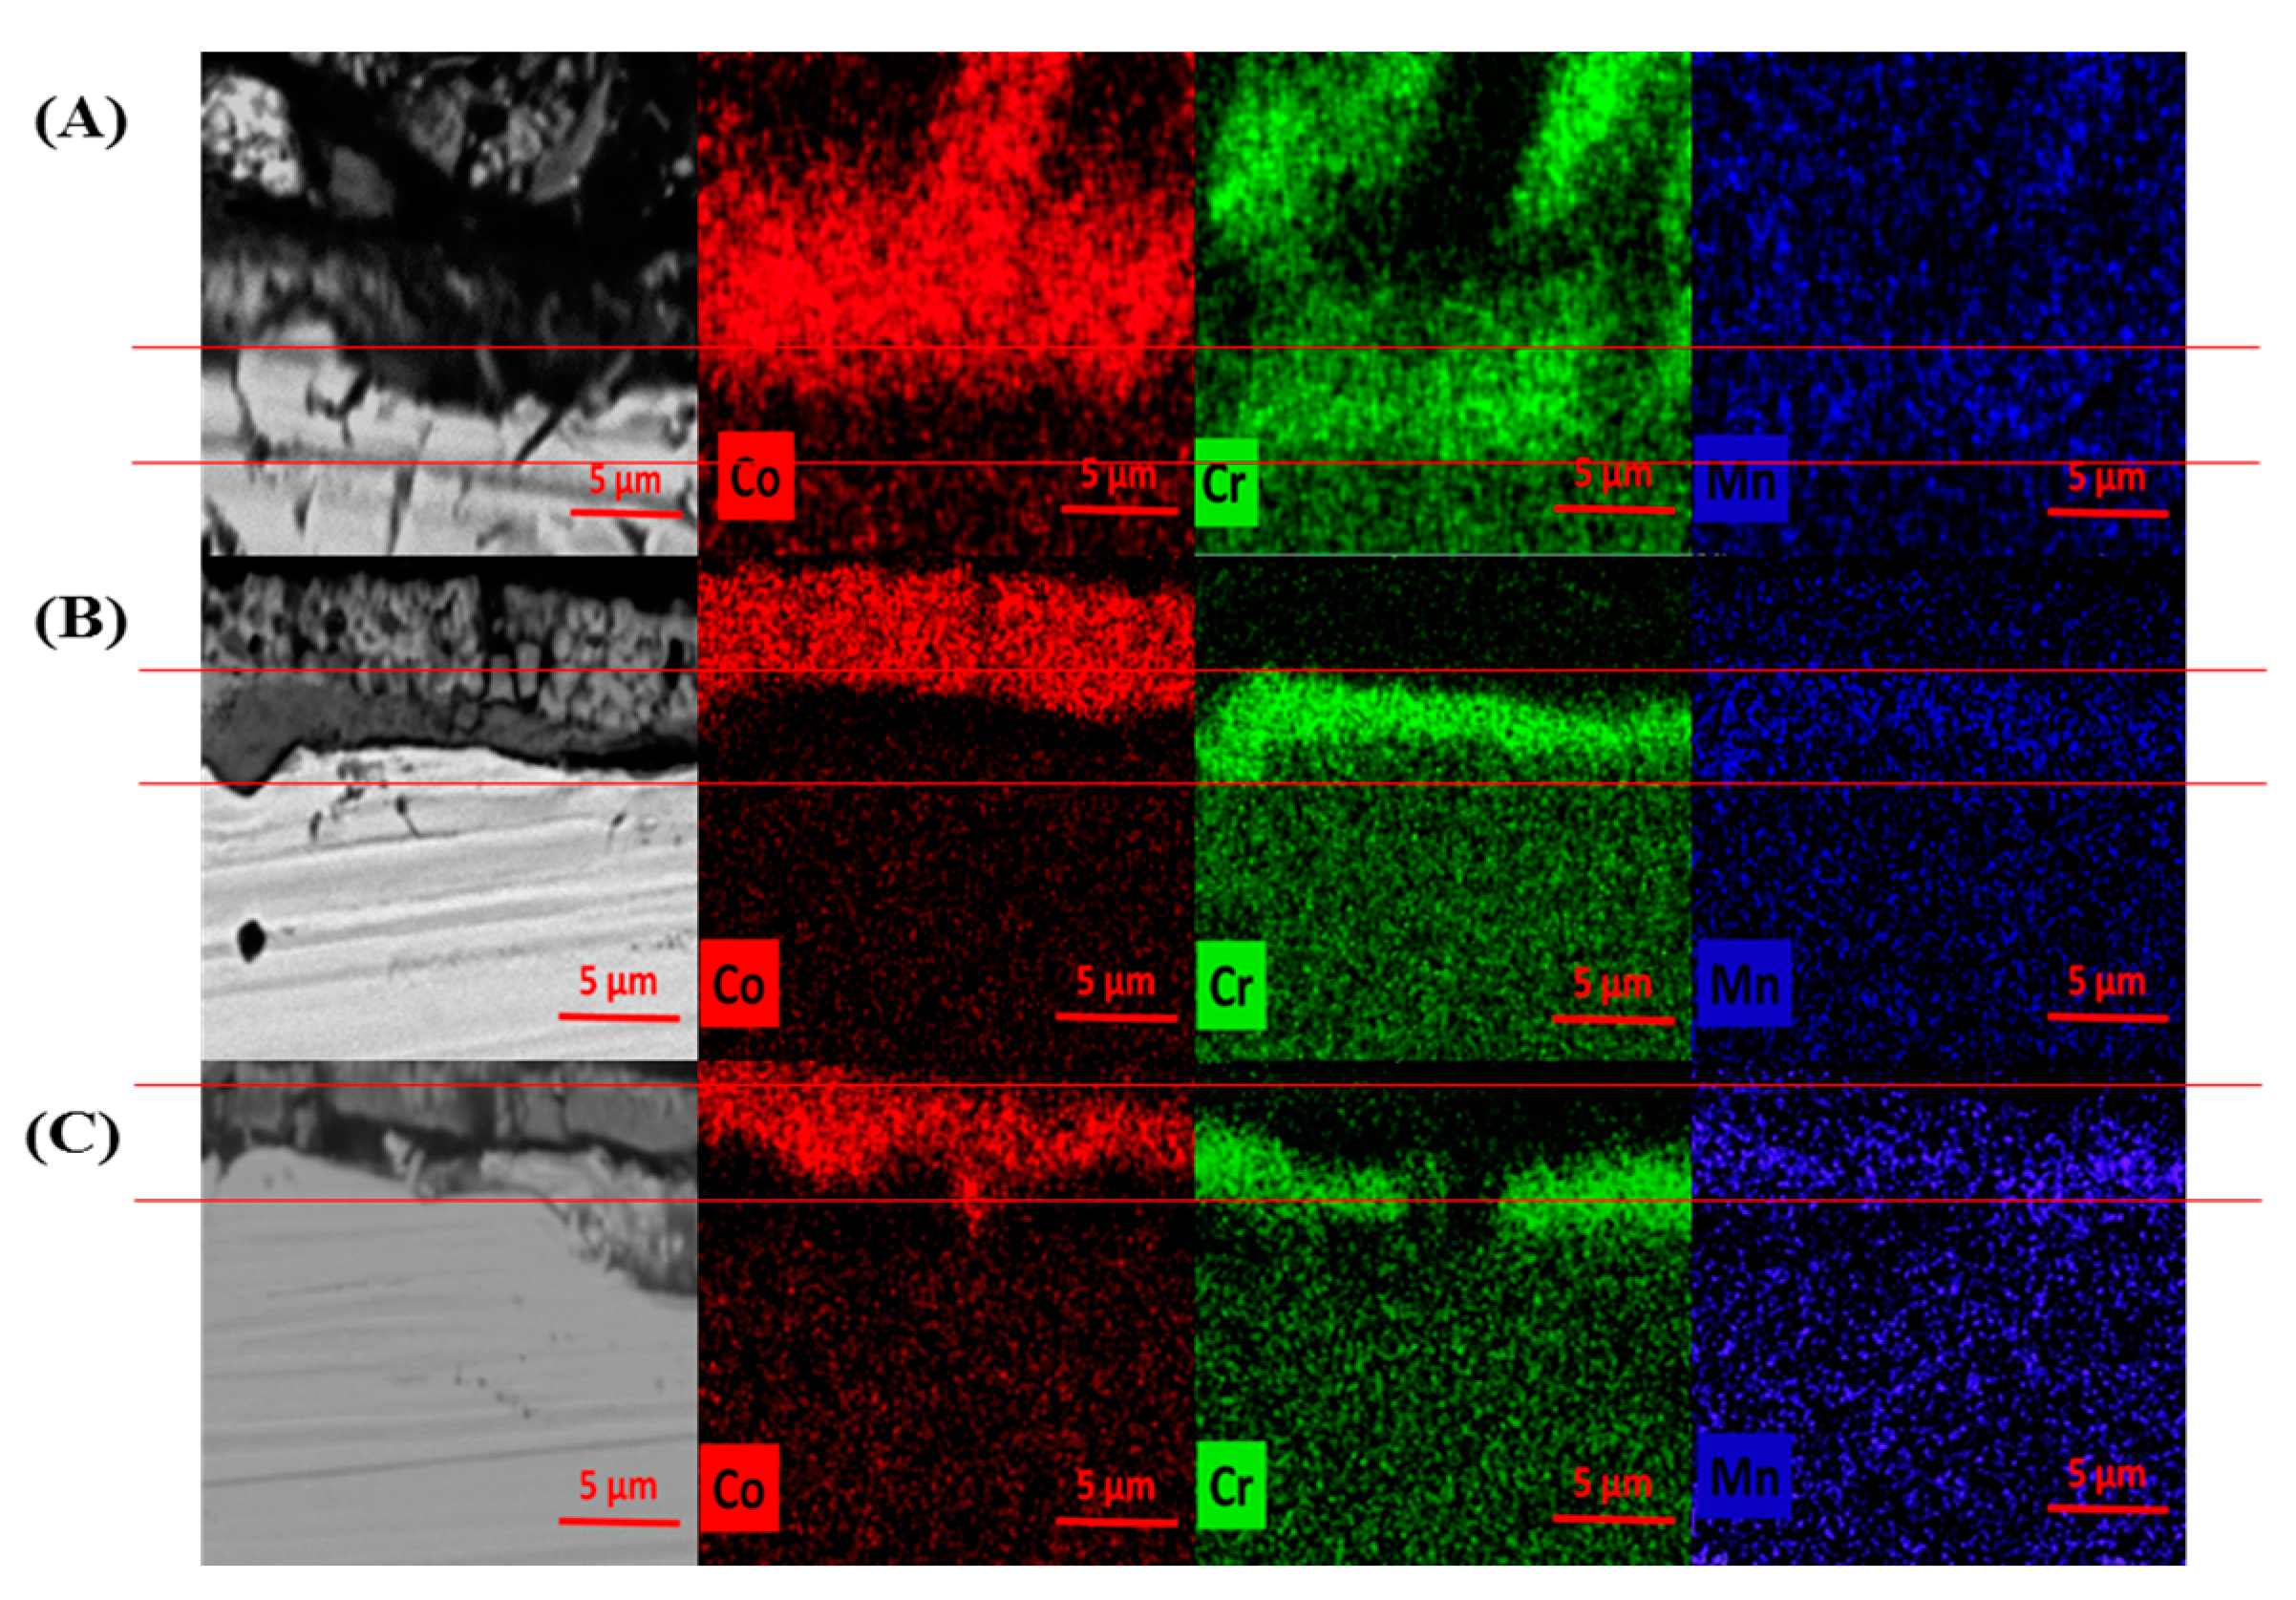
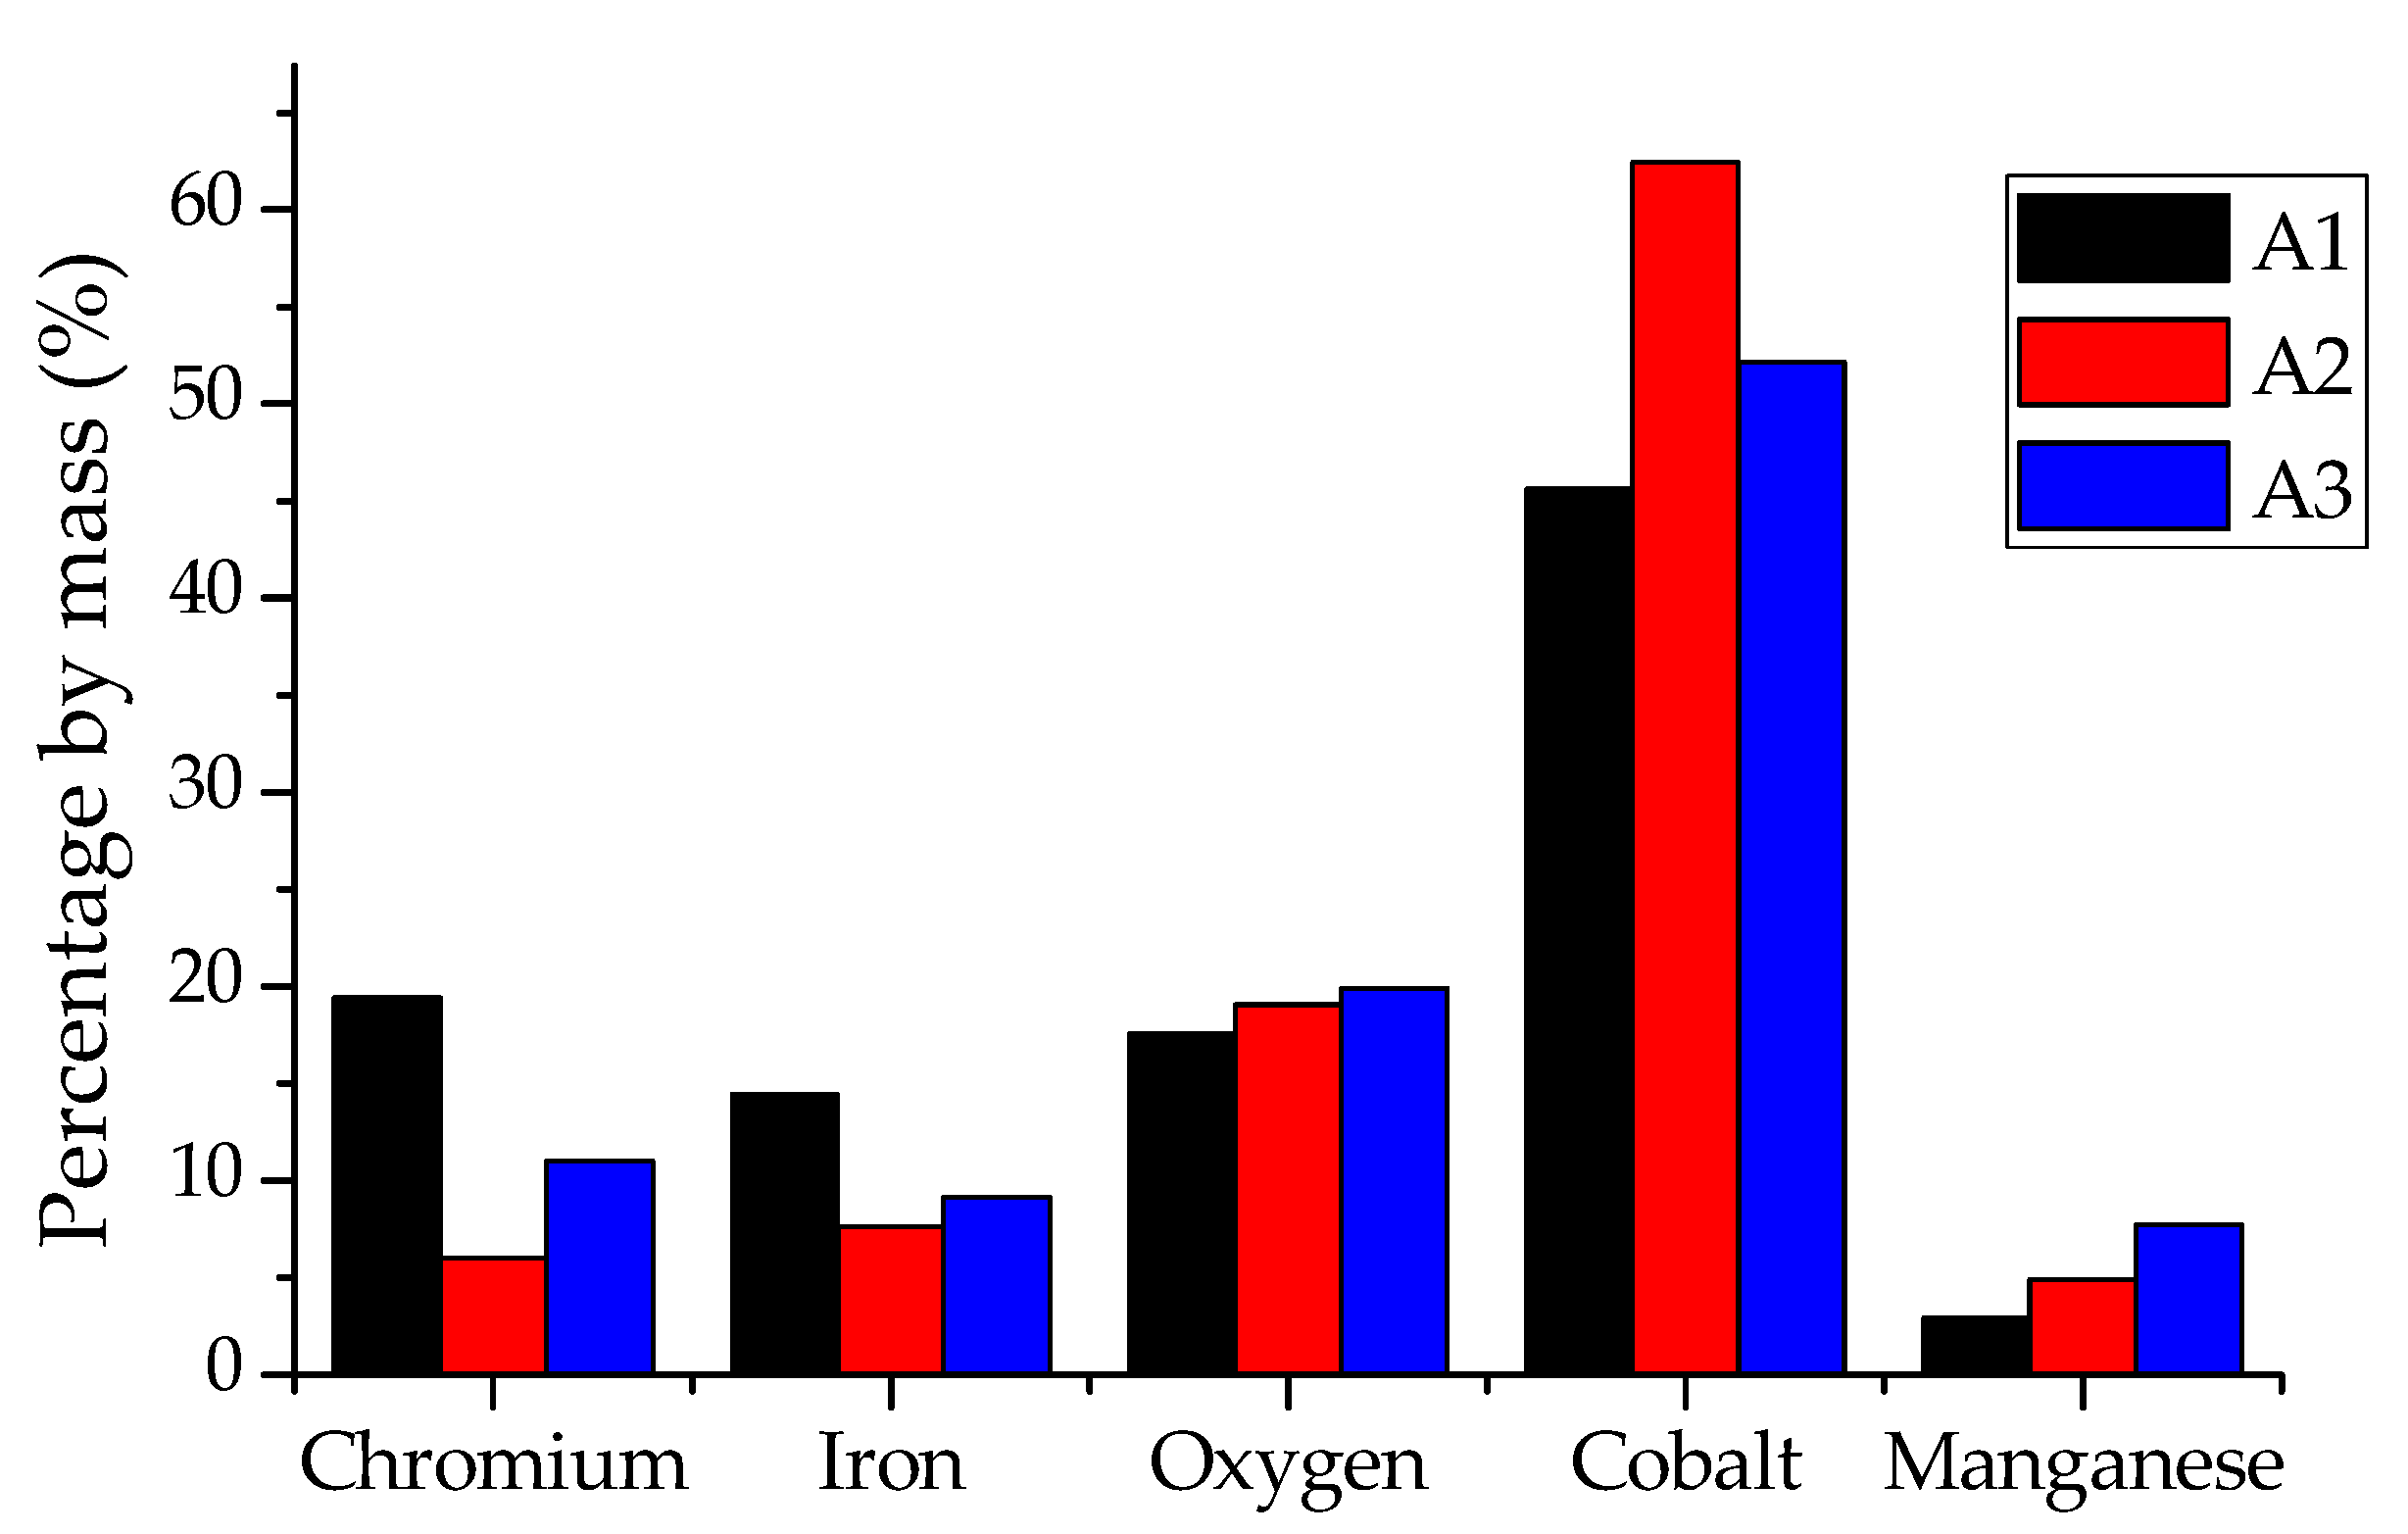
As indicated by the charge efficiency data (Figure 3 and Figure 4), the peaks for the Co3O4, MnCo2O4 and CoMn2O4 spinels were observed at a higher intensity for samples A1, A2 and A3. It can be observed that in Figure 5 these peaks are indicated without differentiation between the three phases. As explained in the literature, for these structures the diffractograms indicate only a slight variation in the 2θ position of the peaks for each phase. This small difference is explained by variations in the crystallite structure when Mn ions are inserted [25,26]. Low-intensity peaks concerning substrate oxidation can also be observed at low intensity at angles around 33.4°, 41.15°, 49.9° and 54.6° (2θ), which indicates a thin coating and/or not homogeneously distributed [27]. The thin film thickness obtained in this work is an expected feature since the ionic concentrations in the electrolyte solutions are low. The distribution characteristics of the film on the substrate surface are shown in the next section.
Figure 6 shows for the optimized samples the diffractograms in the highest intensity spinel peak range, between 35.5° and 37.0° (2θ). One can observe a different phase formed for the A3 solution. For solution A1, which does not have manganese ions in its composition, the oxide formed can be attributed to phase Co3O4, and similarly to sample A2, since there was no significant change in the phase angle formed for these two samples. At room temperature, spinel (Mn, Co)3O4 consists of a mixture between the tetragonal structure Mn2CoO4 and cubic structure MnCo2O4 phases. During heat treatment, the temperature increase around 400 °C makes the cubic structure stable [8,25,26,55,56]. Thus, under working conditions of SOFC’s, around 800 °C, the only structure present is the cubic. The transition between the two structures during heating has no harmful effects to the coating, as the thermal expansion coefficients of the two phases are very close [56].

3.4. SEM and EDS

Figure 7 shows SEM images of the uncoated stainless steel sample surface and samples A1, A2 and A3, heat-treated at 800 °C for 300 h. In Figure 8 and Figure 9 chemical map cross-sectional characterizations and semi-quantitative chemical composition data obtained by EDS, respectively. The composition and surface microstructure of the uncoated sample (Figure 7A) was taken as a basis for comparison for the same analyzes performed for samples A1, A2 and A3, shown in Figure 7B–D, respectively.
The coatings obtained in A1 and A3 were formed in layers, with heterogeneous distribution and relief to the upper layer. At higher magnification, a porous and coarse microstructure can be observed for A1, with elongated grains of average size 2.18 μm, while for A3 the grains are smaller, on average 1.85 μm. Sample A2 presented a homogeneous distribution with even finer grains, averaging 1.35 μm. The pores occupy 13% of the area analyzed in the microstructure of sample A1 and are probably due to the parallel reduction process of H+ ions during electrodeposition and the consequent adsorption of hydrogen gas on the crystal structure of the coating. The average pore size in this sample was 1.67 μm.
For the coated samples, the cross-sectional images are shown in Figure 8. For A1, despite the thicker (~7.4 μm), the coating was not as efficient as a barrier to chrome volatility. Regarding the horizontal line, it can be observed that the chromium was able to overcome the barrier formed by the coating, a fact that can be attributed to the high concentration of pores in its microstructure. The same behavior is not observed for the other two samples. The A3 coating has the smallest thickness, around 2.8 μm and, despite its thickness, was efficient against the volatility of the chrome, since the presence of this element is not observed in the coating. For A2, the intermediate thickness (~3.9 μm) reveals a stable, well distributed, and efficient coating against chromium poisoning. The presence of Mn, in light blue tone, can be noticed in the three samples at the same points where the highest concentration of Cr is also noted. Thus, it can be said that on the substrate surface, below the spinel coating, (Mn, Cr)2O3 formed, since Cr and Mn are elements present in the substrate composition (Table 1). For A3, besides the presence of Mn next to Cr, the presence of this element can also be observed in the regions where cobalt appears, proving that there was formation of spinel MnCo2O4. Some of the main requirements for a material to be used as an interconnector are known to be chemical stability, compatible TEC and good electrical conductivity in SOFC’s working conditions. AISI430 steel has compatible TEC and the coatings deposited on samples A2 and A3 were able to block the volatility of chrome on the steel surface. However, according to Ohm’s Law, electric current follows the paths of least resistance, which are those where the bridging oxide scale bridges are thinner. Therefore, thinner coatings that are still able to block chrome volatility can lead to a significant increase in electrical conductivity, whereas the electrical conductivity of Mn-Co coatings are orders of magnitude greater than Cr2O3 [17].
Semiquantitative EDS data for the surface of the samples are shown in Figure 9. Higher chromium and iron proportions in sample A1 are an expected result since as observed in Figure 7B and Figure 8A, the coating formed was porous and unstable. For samples A2 and A3, even to a lesser extent, the presence of chromium and iron may be noted due to the thin thickness of the coating formed. In this case, these elements can be detected by the depth that reaches the beam energy during the technique used. As expected from the XRD analysis and chemical maps, the surface amount of manganese becomes more abundant at the expense of cobalt for sample A3.

4. Conclusions

For the studied conditions, it was observed that higher proportions of cobalt ions in the electrolyte solution increase the efficiency of the electrodeposition process. However, the addition of Mn ions to the detriment of Co ions in the bath results in deposits that, although less thick, are also more stable and well distributed. Replacing Co ions with Mn ions in the solution is beneficial until to the extent that the proportions of the two metal ions are equal. For the studied conditions, the coating formed at the samples A2 and A3, after heat treatment, are the spinel oxides Co3O4 and MnCo2O4 respectively. Both coatings were able to block the chrome volatility on the AISI430 steel surface. However, the coating deposited in sample A3, besides blocking the loss of chromium, also presented the smallest thickness and is therefore the best condition obtained in this work.

Author Contributions

Conceptualization, S.L.A.G. and E.M.G.; methodology, S.L.A.G. and E.M.G.; validation, S.L.A.G. and E.M.G.; formal analysis, S.L.A.G.; investigation, S.L.A.G.; resources, T.M.; data curation, S.L.A.G.; writing—original draft preparation, S.L.A.G.; writing—review and editing, H.A.T. and T.M.; visualization, S.L.A.G.; supervision, T.M.; project administration, T.M.; funding acquisition, T.M. All authors have read and agreed to the published version of the manuscript.

Funding

This research was funded by “National Council for Scientific and Technological Development” (CNPq), “Coordination for the Improvement of Higher Education Personnel” (CAPES), and “Research Support Foundation of Minas Gerais” (FAPEMIG).

Acknowledgments

Acknowledgments to the “National Council for Scientific and Technological Development” (CNPq), “Coordination for the Improvement of Higher Education Personnel” (CAPES), “Research Support Foundation of Minas Gerais” (FAPEMIG) for their financial support. Also, to the UFMG Microscopy Center (CM-UFMG) for technical support and to APERAM (Timóteo-MG-Brazil) that kindly provided samples of AISI430 stainless steel.

Conflicts of Interest

The authors declare no conflict of interest.

References

  1. Mahmud, L.S.; Muchtar, A.; Somalu, M.R. Challenges in fabricating planar solid oxide fuel cells: A review. Renew. Sustain. Energy Rev. 2017, 72, 105–116. [Google Scholar] [CrossRef]
  2. Cooper, S.J.; Brandon, N.P. An Introduction to Solid Oxide Fuel Cell Materials, Technology and Applications. In Solid Oxide Fuel Cell Lifetime and Reliability: Critical Challenges in Fuel Cells; Brandon, N.P., Boldrin, P., Ruiz-Trejo, E., Eds.; Elsevier Ltd.: London, UK, 2017; pp. 1–18. ISBN 9780128097243. [Google Scholar]
  3. Kendall, K. History. In High-Temperature Solid Oxide Fuel Cells for the 21st Century; Kendall, K., Kendall, M., Eds.; Elsevier Ltd.: Birmingham, UK, 2016; pp. 25–50. ISBN 9780124104532. [Google Scholar]
  4. Janardhanan, V.M.; Deutschmann, O. Modeling of solid-oxide fuel cells. Z. Phys. Chem. 2007, 221, 443–479. [Google Scholar] [CrossRef]
  5. Ni, M. Modeling of solid oxide fuel cells. Sci. Bull. 2016, 61, 1311–1312. [Google Scholar] [CrossRef] [Green Version]
  6. Saadabadi, S.A.; Thallam Thattai, A.; Fan, L.; Lindeboom, R.E.F.; Spanjers, H.; Aravind, P.V. Solid Oxide Fuel Cells fuelled with biogas: Potential and constraints. Renew. Energy 2019, 134, 194–214. [Google Scholar] [CrossRef]
  7. Bednarz, M.; Molin, S.; Bobruk, M.; Stygar, M.; Długoń, E.; Sitarz, M.; Brylewski, T. High-temperature oxidation of the Crofer 22 H ferritic steel with Mn1.45Co1.45Fe0.1O4 and Mn1.5Co1.5O4 spinel coatings under thermal cycling conditions and its properties. Mater. Chem. Phys. 2019, 225, 227–238. [Google Scholar] [CrossRef]
  8. Jia, C.; Wang, Y.; Molin, S.; Zhang, Y.; Chen, M.; Han, M. High temperature oxidation behavior of SUS430 SOFC interconnects with Mn-Co spinel coating in air. J. Alloys Compd. 2019, 787, 1327–1335. [Google Scholar] [CrossRef]
  9. Li, J.; Xiong, C.; Li, J.; Yan, D.; Pu, J.; Chi, B.; Jian, L. Investigation of MnCu0.5Co1.5O4 spinel coated SUS430 interconnect alloy for preventing chromium vaporization in intermediate temperature solid oxide fuel cell. Int. J. Hydrogen Energy 2017, 42, 16752–16759. [Google Scholar] [CrossRef]
  10. Niewolak, L.; Tietz, F.; Quadakkers, W.J. Interconnects; Kendall, K., Kendall, M., Eds.; Elsevier: Jülich, Germany, 2016; ISBN 9780124104532. [Google Scholar]
  11. Yang, Z.; Weil, K.S.; Paxton, D.M.; Stevenson, J.W. Selection and Evaluation of Heat-Resistant Alloys for SOFC Interconnect Applications. J. Electrochem. Soc. 2003, 150, A1188–A1201. [Google Scholar] [CrossRef]
  12. Mahato, N.; Banerjee, A.; Gupta, A.; Omar, S.; Balani, K. Progress in material selection for solid oxide fuel cell technology: A review. Prog. Mater. Sci. 2015, 72, 141–337. [Google Scholar] [CrossRef]
  13. VDM ® Crofer 22 APU; Material Datasheet no. 4046; VDM Metals GmbH: Werdohl, Germany, 2010; p. 10.
  14. Jo, K.H.; Kim, J.H.; Kim, K.M.; Lee, I.; Kim, S. Development of a new cost effective Fe–Cr ferritic stainless steel for SOFC interconnect. Int. J. Hydrogen Energy 2015, 40, 9523–9529. [Google Scholar] [CrossRef]
  15. Hsu, C.; Yeh, A.; Shong, W.; Liu, C. Development of advanced metallic alloys for solid oxide fuel cell interconnector application. J. Alloys Compd. 2016, 656, 903–911. [Google Scholar] [CrossRef]
  16. Demeneva, N.V.; Kononenko, O.V.; Matveev, D.V.; Kharton, V.V.; Bredikhin, S.I. Composition-gradient protective coatings for solid oxide fuel cell interconnectors. Mater. Lett. 2019, 240, 201–204. [Google Scholar] [CrossRef]
  17. Bianco, M.; Linder, M.; Larring, Y.; Greco, F.; Van Herle, J. Lifetime issues for solid oxide fuel cell interconnects. In Solid Oxide Fuel Cell Lifetime and Reliability: Critical Challenges in Fuel Cells; Brandon, N.P., Boldrin, P., Ruiz-Trejo, E., Eds.; Elsevier Ltd.: London, UK, 2017; pp. 121–144. ISBN 9780128097243. [Google Scholar]
  18. Yeh, A.; Chen, Y.; Liu, C.; Shong, W. Development of an advanced bond coat for solid oxide fuel cell interconnector applications. J. Power Sources 2015, 296, 426–432. [Google Scholar] [CrossRef]
  19. Sun, Z.; Wang, R.; Nikiforov, A.Y.; Gopalan, S.; Pal, U.B.; Basu, S.N. CuMn1.8O4 protective coatings on metallic interconnects for prevention of Cr-poisoning in solid oxide fuel cells. J. Power Sources 2018, 378, 125–133. [Google Scholar] [CrossRef]
  20. Stefan, E.; Neagu, D.; Blennow Tullmar, P.; Persson, Å.H.; Sudireddy, B.R.; Miller, D.; Chen, M.; Irvine, J. Spinel-based coatings for metal supported solid oxide fuel cells. Mater. Res. Bull. 2017, 89, 232–244. [Google Scholar] [CrossRef] [Green Version]
  21. Bopp, C.; Santhanam, K. Corrosion Protection of Monel Alloy Coated with Graphene Quantum Dots Starts with a Surge. ChemEngineering 2019, 3, 80. [Google Scholar] [CrossRef] [Green Version]
  22. Mah, J.C.W.; Muchtar, A.; Somalu, M.R.; Ghazali, M.J. Metallic interconnects for solid oxide fuel cell: A review on protective coating and deposition techniques. Int. J. Hydrogen Energy 2017, 42, 9219–9229. [Google Scholar] [CrossRef]
  23. Hosseini, N.; Abbasi, M.H.; Karimzadeh, F.; Choi, G.M. Development of Cu1.3Mn1.7O4 spinel coating on ferritic stainless steel for solid oxide fuel cell interconnects. J. Power Sources 2014, 273, 1073–1083. [Google Scholar] [CrossRef]
  24. Grünwald, N.; Sohn, Y.J.; Yin, X.; Menzler, N.H.; Guillon, O.; Vaßen, R. Microstructure and phase evolution of atmospheric plasma sprayed Mn-Co-Fe oxide protection layers for solid oxide fuel cells. J. Eur. Ceram. Soc. 2019, 39, 449–460. [Google Scholar] [CrossRef]
  25. Molin, S.; Sabato, A.G.; Bindi, M.; Leone, P.; Cempura, G.; Salvo, M.; Cabanas Polo, S.; Boccaccini, A.R.; Smeacetto, F. Microstructural and electrical characterization of Mn-Co spinel protective coatings for solid oxide cell interconnects. J. Eur. Ceram. Soc. 2017, 37, 4781–4791. [Google Scholar] [CrossRef] [Green Version]
  26. Molin, S.; Jasinski, P.; Mikkelsen, L.; Zhang, W.; Chen, M.; Hendriksen, P.V. Low temperature processed MnCo2O4 and MnCo1.8Fe0.2O4 as effective protective coatings for solid oxide fuel cell interconnects at 750 °C. J. Power Sources 2016, 336, 408–418. [Google Scholar] [CrossRef] [Green Version]
  27. Wu, J.; Gemmen, R.S.; Manivannan, A.; Liu, X. Investigation of Mn/Co coated T441 alloy as SOFC interconnect by on-cell tests. Int. J. Hydrogen Energy 2011, 36, 4525–4529. [Google Scholar] [CrossRef]
  28. Karpuz, A.; Kockar, H.; Alper, M.; Karaagac, O.; Haciismailoglu, M. Electrodeposited Ni-Co films from electrolytes with different Co contents. Appl. Surf. Sci. 2012, 258, 4005–4010. [Google Scholar] [CrossRef]
  29. Karpuz, A.; Kockar, H.; Alper, M. Properties of electrodeposited Co–Mn films: Influence of deposition parameters. Appl. Surf. Sci. 2015, 358, 605–611. [Google Scholar] [CrossRef]
  30. Chen, G.; Xin, X.; Luo, T.; Liu, L.; Zhou, Y.; Yuan, C.; Lin, C.; Zhan, Z.; Wang, S. Mn1.4Co1.4Cu0.2O4 spinel protective coating on ferritic stainless steels for solid oxide fuel cell interconnect applications. J. Power Sources 2015, 278, 230–234. [Google Scholar] [CrossRef]
  31. Puranen, J.; Laakso, J.; Honkanen, M.; Heinonen, S.; Kylmälahti, M.; Lugowski, S.; Coyle, T.W.; Kesler, O.; Vuoristo, P. High temperature oxidation tests for the high velocity solution precursor flame sprayed manganese–cobalt oxide spinel protective coatings on SOFC interconnector steel. Int. J. Hydrogen Energy 2015, 40, 6216–6227. [Google Scholar] [CrossRef]
  32. Sobha Jayakrishnan, D. Electrodeposition: The versatile technique for nanomaterials. In Corrosion Protection and Control Using Nanomaterials; Saji, V.S., Cook, R., Eds.; Woodhead Publishing Limited: Cambrigde, UK, 2012; pp. 86–125. ISBN 9781845699499. [Google Scholar]
  33. Zeng, X.; Li, J.; Singh, N. Recycling of Spent Lithium-Ion Battery: A Critical Review. Crit. Rev. Environ. Sci. Technol. 2014, 44, 1129–1165. [Google Scholar] [CrossRef]
  34. Olukanni, D.; Aipoh, A.; Kalabo, I. Recycling and Reuse Technology: Waste to Wealth Initiative in a Private Tertiary Institution, Nigeria. Recycling 2018, 3, 44. [Google Scholar] [CrossRef] [Green Version]
  35. Gratz, E.; Sa, Q.; Apelian, D.; Wang, Y. A closed loop process for recycling spent lithium ion batteries. J. Power Sources 2014, 262, 255–262. [Google Scholar] [CrossRef]
  36. Yang, Y.; Huang, G.; Xu, S.; He, Y.; Liu, X. Thermal treatment process for the recovery of valuable metals from spent lithium-ion batteries. Hydrometallurgy 2016, 165, 390–396. [Google Scholar] [CrossRef]
  37. Yang, Y.; Xu, S.; He, Y. Lithium recycling and cathode material regeneration from acid leach liquor of spent lithium-ion battery via facile co-extraction and co-precipitation processes. Waste Manag. 2017, 64, 219–227. [Google Scholar] [CrossRef] [PubMed]
  38. Ajiboye, A.E.; Olasehinde, F.E.; Adebayo, O.A.; Ajayi, O.J.; Ghosh, M.K.; Basu, S. Extraction of Copper and Zinc from Waste Printed Circuit Boards. Recycling 2019, 4, 36. [Google Scholar] [CrossRef] [Green Version]
  39. Tran, A.T.; Tomlin, J.; Lam, P.H.; Stinger, B.L.; Miller, A.D.; Walczyk, D.J.; Cruz, O.; Vaden, T.D.; Yu, L. Conductivity, Viscosity, Spectroscopic Properties of Organic Sulfonic Acid solutions in Ionic Liquids. ChemEngineering 2019, 3, 81. [Google Scholar] [CrossRef] [Green Version]
  40. Ferreira, D.A.; Prados, L.M.Z.; Majuste, D.; Mansur, M.B. Hydrometallurgical separation of aluminium, cobalt, copper and lithium from spent Li-ion batteries. J. Power Sources 2009, 187, 238–246. [Google Scholar] [CrossRef]
  41. Garcia, E.; Taroco, H. Water Electrolysis Anode Based on 430 Stainless Steel Coated with Cobalt Recycled from Li-Ion Batteries. Recycling 2018, 3, 42. [Google Scholar] [CrossRef] [Green Version]
  42. Freitas, M.B.J.G.; Celante, V.G.; Pietre, M.K. Electrochemical recovery of cobalt and copper from spent Li-ion batteries as multilayer deposits. J. Power Sources 2010, 195, 3309–3315. [Google Scholar] [CrossRef]
  43. Chen, L.; Tang, X.; Zhang, Y.; Li, L.; Zeng, Z.; Zhang, Y. Process for the recovery of cobalt oxalate from spent lithium-ion batteries. Hydrometallurgy 2011, 108, 80–86. [Google Scholar] [CrossRef]
  44. Nan, J.; Han, D.; Zuo, X. Recovery of metal values from spent lithium-ion batteries with chemical deposition and solvent extraction. J. Power Sources 2005, 152, 278–284. [Google Scholar] [CrossRef]
  45. Zheng, X.; Zhu, Z.; Lin, X.; Zhang, Y.; He, Y.; Cao, H.; Sun, Z. A Mini-Review on Metal Recycling from Spent Lithium Ion Batteries. Engineering 2018, 4, 361–370. [Google Scholar] [CrossRef]
  46. Freitas, M.B.J.G.; Garcia, E.M. Electrochemical recycling of cobalt from cathodes of spent lithium-ion batteries. J. Power Sources 2007, 171, 953–959. [Google Scholar] [CrossRef]
  47. Garcia, E.M.; Santos, J.S.; Pereira, E.C.; Freitas, M.B.J.G. Electrodeposition of cobalt from spent Li-ion battery cathodes by the electrochemistry quartz crystal microbalance technique. J. Power Sources 2008, 185, 549–553. [Google Scholar] [CrossRef]
  48. Liu, P.; Xiao, L.; Chen, Y.; Tang, Y.; Wu, J.; Chen, H. Recovering valuable metals from LiNi x Co y Mn 1-x-y O 2 cathode materials of spent lithium ion batteries via a combination of reduction roasting and stepwise leaching. J. Alloys Compd. 2019, 783, 743–752. [Google Scholar] [CrossRef]
  49. Ordoñez, J.; Gago, E.J.; Girard, A. Processes and technologies for the recycling and recovery of spent lithium-ion batteries. Renew. Sustain. Energy Rev. 2016, 60, 195–205. [Google Scholar] [CrossRef]
  50. Apelt, S.; Zhang, Y.; Zhu, J.H.; Leyens, C. Electrodeposition of Co–Mn3O4 composite coatings. Surf. Coatings Technol. 2015, 280, 208–215. [Google Scholar] [CrossRef] [Green Version]
  51. Pinto, R.; Carmezim, M.J.; Montemor, M.F. Electrodeposition and isothermal aging of Co and Mn layers on stainless steel for interconnectors: Initial stages of spinel phase formation. J. Power Sources 2014, 255, 251–259. [Google Scholar] [CrossRef]
  52. Wu, J.; Jiang, Y.; Johnson, C.; Liu, X. DC electrodeposition of Mn–Co alloys on stainless steels for SOFC interconnect application. J. Power Sources 2008, 177, 376–385. [Google Scholar] [CrossRef]
  53. Yar-Mukhamedova, G.; Ved, M.; Sakhnenko, N.; Nenastina, T. Electrodeposition and properties of binary and ternary cobalt alloys with molybdenum and tungsten. Appl. Surf. Sci. 2018, 445, 298–307. [Google Scholar] [CrossRef]
  54. Lv, Y.; Geng, S.; Shi, Z. Effect of pH of the galvanic bath on electrodeposition of Cu-Mn3O4 composite coatings. Mater. Chem. Phys. 2017, 189, 176–182. [Google Scholar] [CrossRef]
  55. Talic, B.; Molin, S.; Wiik, K.; Hendriksen, P.V.; Lein, H.L. Comparison of iron and copper doped manganese cobalt spinel oxides as protective coatings for solid oxide fuel cell interconnects. J. Power Sources 2017, 372, 145–156. [Google Scholar] [CrossRef] [Green Version]
  56. Hu, Y.Z.; Yun, L.L.; Wei, T.; Li, C.X.; Qi, Z.; Yang, G.J.; Li, C.J.; Liu, M. Aerosol sprayed Mn 1.5 Co 1.5 O 4 protective coatings for metallic interconnect of solid oxide fuel cells. Int. J. Hydrogen Energy 2016, 41, 20305–20313. [Google Scholar] [CrossRef]
Figure 1. Illustrative scheme about the route for obtaining recycled electrolyte solutions.
Chemengineering 04 00010 g001
Figure 2. Cyclic voltammograms for “A” solutions (v = 40 mVs−1).
Chemengineering 04 00010 g002
Figure 3. Charge efficiency of solutions A. Data obtained from cyclic voltammograms.
Chemengineering 04 00010 g003
Figure 4. Charge efficiency of solutions A. Data obtained from post electrodeposition mass gain.
Chemengineering 04 00010 g004
Figure 5. X-ray diffractograms for coated A1, A2 and A3 samples and uncoated AISI 430 sample after thermal oxidation process at 800 °C for 300 h.
Chemengineering 04 00010 g005
Figure 6. X-ray diffractograms for coated A1, A2 and A3 samples and uncoated AISI 430 sample after thermal oxidation process at 800 °C for 300 h.
Chemengineering 04 00010 g006
Figure 7. SEM enlarged images for (A) uncoated AISIS steel (B) sample A1 (C) sample A2 (D) sample A3 after oxidation heat treatment at 800 °C for 300 h.
Chemengineering 04 00010 g007
Figure 8. SEM enlarged images and chemical cross-section composition maps for samples (A) A1; (B) A2; (C) A3, after oxidation heat treatment at 800 °C for 300 h.
Chemengineering 04 00010 g008
Figure 9. Semi-quantitative EDS data for the surface of samples A1, A2 and A3 after oxidation heat treatment at 800 °C for 300 h.
Chemengineering 04 00010 g009
Table 1. Average value of some metals at year-end 2018. Source: https://www.metalary.com/, accessed 20 April 2019.
ElementAverage Price (2018) U$/t
Cobalt80.490
Manganese2.060
Aluminum1.885
Nickel8.931
Iron57,86
Table 2. Chemical composition of AISI 430 steel used as substrate. Source: APERAM, 2016.
Fe
(%m)
C
(%m)
Mn
(%m)
Si
(%m)
Cr
(%m)
Ni
(%m)
Mo
(%m)
Nb
(%m)
Ti
(%m)
N
(ppm)
AISI430Bal.0.0470.230.3216.220.270.020.0120.003518
Table 3. Approximate composition of the precursor solutions and the "A" solutions to which they originated.
SolutionCo (mol/L)Mn (mol/L)
S10.170
S200.19
A10.04~0
A20.030.01
A30.020.02
A40.010.03
A5~00.04
Table 4. Chemical composition of electrolyte solutions from the recycled Li-ion battery cathode.
mol/LMnCoFeNi
Battery 10.1699**0.0001
Battery 20.00050.1868*0.0001
* Below detection limit of the equipment.

