Fracture Strength Evaluation of Agglomerates of Fatty Acid-Coated CaCO3 Nanoparticles by Nano-Indentation


Shiraishi Central Laboratories Co. Ltd., 4-78, Amagasaki 660-0085, Japan
*
Author to whom correspondence should be addressed.
ChemEngineering 2019, 3(3), 73; https://doi.org/10.3390/chemengineering3030073
Submission received: 15 June 2019
/
Revised: 6 August 2019
/
Accepted: 8 August 2019
/
Published: 9 August 2019
Abstract
:Nanoparticles often form agglomerates during their manufacturing process. When nanoparticles form agglomerates, their inherent properties cannot be fully exploited. In this study, we attempted to establish a conventional method to evaluate the fracture strength of agglomerates into smaller parts. We used a commercially available nano-indentation instrument with a flat indenter tip. We chose calcium carbonate nanoparticles with stearic acid coatings as model materials. It was found that the more fatty acid that is coated on the particle surface, the stronger the agglomerates become. The technique we propose in this study can be used to rapidly evaluate the fracture strength of nanoparticle agglomerates.
1. Introduction
Nanoparticles are receiving widespread attention due to their continuously increasing applications in various industries. In today’s world, nanoparticles are used not only as filler materials in nanocomposites but also as catalysts, in cosmetics, as carriers for drug delivery, and so on [1,2]. Nanoparticles are materials with at least one dimension less than 100 nm, and thus, they have a high specific surface area. Some special properties of composite materials can be enhanced by the addition of nanoparticles (for instance, titania nanoparticles can improve the brightness and opacity of white paper [3] and silica nanoparticles can improve the mechanical properties of coatings [4]), due to their large active surface area. This is called the “nano-effect” in the pigment/extender industry. On the other hand, nanoparticles tend to interact with one another to form micron-sized agglomerates, thus reducing their high surface energy [5]. In handling powder consisting of nanoparticles, agglomeration is an important phenomenon that can occur through several engineering processes including synthesis, filtering (solid-liquid separation), hot-air drying, delivering, and storing. When nanoparticles form agglomerates in binder materials, their inherent properties cannot be fully exploited. Therefore, dispersing nanoparticles in a matrix is a key requirement for producing nanocomposites with higher performances. In industry, each nanoparticle manufacturing process is designed so that agglomerates are more easily re-dispersed. However, there is no practical standard test method for measuring the fracture strength of individual agglomerates into smaller parts.
Nano-indentation is a reliable technique used to determine the micromechanical properties of single particles [6], thin-films [7], bulk materials [8], architected nanocomposites [9], and so on. With this technique, indentation load can be quantitatively measured as a function of penetration depth of the indentation tip into the specimen surface with nanometer depth resolution. The method has been applied to samples ranging from hard materials (e.g., metals [7,8], ceramics [10], and minerals [6]) to relatively soft materials such as polymers [11]. In this study, we attempted to apply the technique to evaluate the fracture strength of individual nanoparticle agglomerates. There are a few reports on application of nano-indentation for nanoparticle agglomerates. Raichman et al. succeeded in measuring inter-particle (silver nanoparticles, size: ~80 nm) forces in the nanometer regime using a contact mode scanning force microscope equipped with a cube-corner indenter tip [12]. Schilde et al. succeeded in measuring micromechanical properties of agglomerates (size: ~10–15 μm) of alumina nanoparticles (size: ~50–100 nm) with different primary particle morphologies (cuboid, disc, and needles) via nano-indentation using a Berkovich tip [13]. However, we believe the use of a flat indenter tip can offer more advantages than a pointed indenter tip (cube, Vickers, or Berkovich), with respect to a fracture strength test for nanoparticle agglomerates that have irregular shapes. In this study, we present preliminary data to establish a conventional fracture strength test method for nanoparticle agglomerates using a commercially available nano-indentation system equipped with a flat indenter tip. For fracture strength calculation, we used the Hiramatsu equation [14,15], which is used to evaluate the fracture force of irregularly shaped test pieces by uniaxial compression tests.
We chose synthesized calcium carbonate (CaCO3) nanoparticles with calcite phase as a model material. Synthesized calcite nanoparticles [16,17] are relatively uniformly-shaped rhombohedral particles (aspect ratio ~1) with narrow particle size distributions, so the effects of the primary particle morphology could be minimized in this study. It is reported that agglomerates of calcite nanoparticles have relatively spherical shapes [18]. CaCO3 nanoparticles are widely used as filler materials in several industries, including rubber, plastics, sealants, paints, printing inks, and paper [19]. For some hydrophobic binders such as plastics and sealants, the surfaces of CaCO3 particles are often treated with fatty acids in order to increase the affinity to the binders [20,21]. For the present study, we employed agglomerates of CaCO3 nanoparticles with/without fatty acid coatings as model materials. As the agglomerates are not ideal spheres, we crushed many agglomerates and calculated the average fracture strength.
2. Materials and Methods
2.1. Materials
Reagent grade calcite rhombohedral nanoparticles (primary particle size: ~80 nm) (Shiraishi Kogyo Kaisha Ltd., Osaka, Japan) and stearic acid (C17H35COOH) (FUJIFILM Wako Pure Chemicals, Co., Osaka, Japan) were used as starting materials. Three types of CaCO3 powder (CaCO3 nanoparticles without surface treatment, with a small amount, and with a large amount of stearic acid coatings) were prepared by the following steps: (1) preparation of their aqueous suspensions, (2) addition of stearic acid solution with mechanical agitation, (3) filtered, and (4) heat-dried in air. The powder samples will be called non-coated, lightly-coated, and heavily-coated samples hereafter.
2.2. Structural Characterization
For the three types of powder samples, Brunauer-Emmett-Teller (BET)-specific surface areas (SSAs) [22,23] were measured by the single-point method using nitrogen adsorption (Macsorb HM Model-1208, Mountech Co. Ltd., Tokyo, Japan). The average crystallite sizes were measured by the Scherrer equation [24] using the calcite diffraction peak (104) at 2θ = 29.5° in powder X-ray diffraction (XRD) patterns (Multi Flex, Rigaku Industrial Co. Ltd., Tokyo, Japan). Fatty acid contents in the surface treated samples were determined using thermogravimetric analysis (TGA) (Thermo plus EVO2, Rigaku Co., Ltd., Japan). For TGA, a predetermined quantity of the powders (~20.0 mg) was placed in a platinum pan and heated at a rate of 20 °C/min from room temperature to 600 °C under clean-air flow (500 mL/min). The amount of fatty acid was defined as the weight loss from 200 °C to 500 °C in this study. Fatty acid contents were expressed as gram per 100 g of CaCO3. Primary particles were observed by transmission electron microscopy (TEM) (JEM-2100HR, JEOL Co. Ltd., Tokyo, Japan, operated at 200 kV, equipped with a LaB6 electron gun). Specimens for TEM observations were prepared by suspending powder in ethanol, dispersing in ultrasonic bath for 10 min, and depositing a drop on carbon/collodion-coated copper grids.
Agglomerate size distributions were measured by static image analysis using a Morphologi G3 particle characterization system (Malvern Instruments Ltd., Malvern, UK). With this machine, number-based agglomerate size distributions from 0.5–10,000 μm can be automatically obtained from optical microscope images with tens of thousands of agglomerates. For the measurement process, the powder samples were dry dispersed onto glass plates using an automated sample dispersion unit connected to the machine. Agglomeration state observations were carried out using field emission-scanning electron microscopy (FE-SEM) (JSM-6330F, JEOL Co. Ltd., Japan, operated at 3.0 kV). Specimens for SEM observations were prepared by spreading powder onto Si wafer substrates and sputter-coating with platinum (FINE COATER JFC-1200, JEOL Co. Ltd., Japan) to avoid electrostatic charging during observations. Pore size distributions located within agglomerates were measured by mercury intrusion porosimetry (Pascal 140/240, Thermo Finnigan, Milan, Italy). BET-SSA, XRD, TGA, and mercury intrusion porosimetry were conducted three times for each sample, in order to obtain average results.
2.3. Nano-Indentation
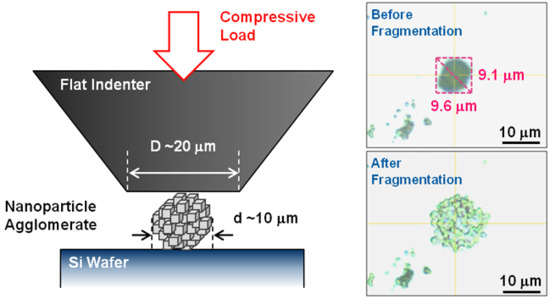
Fracture strength of agglomerates was measured by nano-indentation method using a commercially available nano-indentation system (ENT-2100, Elionix Co. Ltd., Tokyo, Japan). The instrument has a force range of 1 μN–100 mN and a displacement resolution of 0.06 nm. Figure 1a shows a schematic illustration of the fracture strength test by the nano-indentation system. The powder samples were dry dispersed onto Si wafer substrates (~15 mm × 15 mm), and the substrates were fixed onto a sample holder using a commercially available instant adhesive. We chose a polycrystalline diamond flat tip with a diameter of 20 μm. Agglomerates within the predetermined size range of 9–12 μm in diameter were chosen as indentation targets. The maximum load applied for each indentation was set to 2 mN. The measurement was conducted in ambient conditions at room temperature. The measurements were carried out until ten pieces of data were collected for each sample. The indenter tip was cleaned with acetone-soaked cotton swabs after each indentation test. Optical micrographs of agglomerates before and after the nano-indentation tests were taken from the direction parallel to the substrate using a CMOS camera (maximum magnification: ×2000) attached to the instrument. The diameter of each agglomerate was defined as the average of the length and width measured from the optical micrographs.
From the load-displacement curves obtained by nano-indentation tests, fracture strength were calculated using the Hiramatsu equation [14,15]:
where Csp is fracture strength, Fsp is load at fracture point, and d is diameter of agglomerate. The equation is widely used to calculate fracture strength for irregularly shaped test pieces. Figure 1b shows a schematic load-depth diagram for the nano-indentation test. In this study, agglomeration fracture point was defined as where the depth between a plot and the following plot (∆Dfollowing in Figure 1b) becomes more than twice as large as the depth between the plot and the previous plot (∆Dprevious in Figure 1b) for the first time during an indentation test.
3. Results and Discussion
3.1. Primary Particle Structure
Figure 2 shows a typical bright-field (BF) TEM image of primary particles in the non-coated sample. Calcite rhombohedral particles with an approximate size of 80 nm can be confirmed. Fatty acid contents derived from TGA (Figure S1), average crystallite sizes derived from XRD patterns (Figure S2), and the BET-SSA of the three types of CaCO3 powders are listed in Table 1. Fatty acid content of the heavily-coated sample was about twice that of the lightly-coated sample. Assuming that stearic acids form close-packed homogeneous layers on the calcite surface, lightly-coated and heavily-coated samples have 81% and 152% of their respective calcite nanoparticle surfaces coated with stearic acids. Although all three samples had similar average crystallite sizes, the BET-SSAs of the fatty acid-coated samples were significantly lower than the non-coated sample. This is likely to be because “apparent sizes” and surface roughness of the treated particles become larger due to the fatty acid coatings.
3.2. Agglomeration States
Figure 3 shows number-based agglomerate size distributions in the range of 0–12 μm measured by static image analysis. The agglomerate sizes at the 10%, 50%, and 90% levels of the cumulative size distributions (D10, D50, and D90) are given in Table 1. It can be seen that the non-coated sample has a broader size distribution compared with those of the fatty acid-coated samples. In addition, the larger the amount of fatty acid, the smaller the agglomerate size becomes and the sharper the size distribution becomes. This is thought to be because the surface activity of the nanoparticles was lowered by fatty acid-treatment. Note that the agglomeration size range selected for nano-indentation tests in this study (9–12 μm) is larger than the sizes D90 in all the agglomerate size distributions for the three samples. Figure 4 is an FE-SEM image of an agglomerate of lightly fatty acid-coated nanoparticles. It can be seen that the nanoparticles are densely packed without any large pores within the agglomerate, and the agglomerate has a relatively spherical shape. Figure 5a,b show the pore size distributions and cumulative pore volume in the pore diameter range of 5–500 nm measured by mercury intrusion porosimetry. The most frequent pore diameters within the range were measured to be approximately 48 nm, 28 nm, and 23 nm for the non-coated, lightly-coated, and heavily-coated powders, respectively. When combined with the FE-SEM observation results shown in Figure 4, these peaks are deduced to be due to the pores between agglomerates. Supposing that the cumulative mercury intruded volume from a pore diameter of 5 nm (the low limit of the measurement) to diameters where dV/dlog(Diameter) reached local minimums (62 nm, 37 nm, and 31 nm for non-coated, lightly-coated, and heavily-coated powders, respectively) as the pore volume within agglomerates, pore volume within agglomerates were 0.45 mm3/g, 0.28 mm3/g, and 0.25 mm3/g for non-coated, lightly-coated, and heavily-coated powders, respectively. Thus, it can be said that the higher the amount of fatty acid is, the smaller the pore size and pore volume within agglomerates becomes. It can be interpreted from these results that the fatty acid is treated even on the particles inside the agglomerates. The most frequent pore diameters and pore volumes within the agglomerates for the three types of samples are summarized in Table 1.
3.3. Nano-Indentation
Figure 6a,b is optical micrographs of agglomerates before and after the nano-indentation tests. These images were taken from the direction parallel to the indentation direction, and it can be seen that the agglomerate was fractured by the indentation test. The length and width of each agglomerate was measured from an optical micrograph taken before the fracture test. The diameter of the indentation tip used in this study was 20 μm (corresponding to the area indicated by the dotted blue circle in Figure 6b), and the positions of agglomerates other than the fractured one did not change. It can therefore be assumed that load-depth curves were measured only for the targeted agglomerates, and the effect of static electricity was not significant during the indentation.
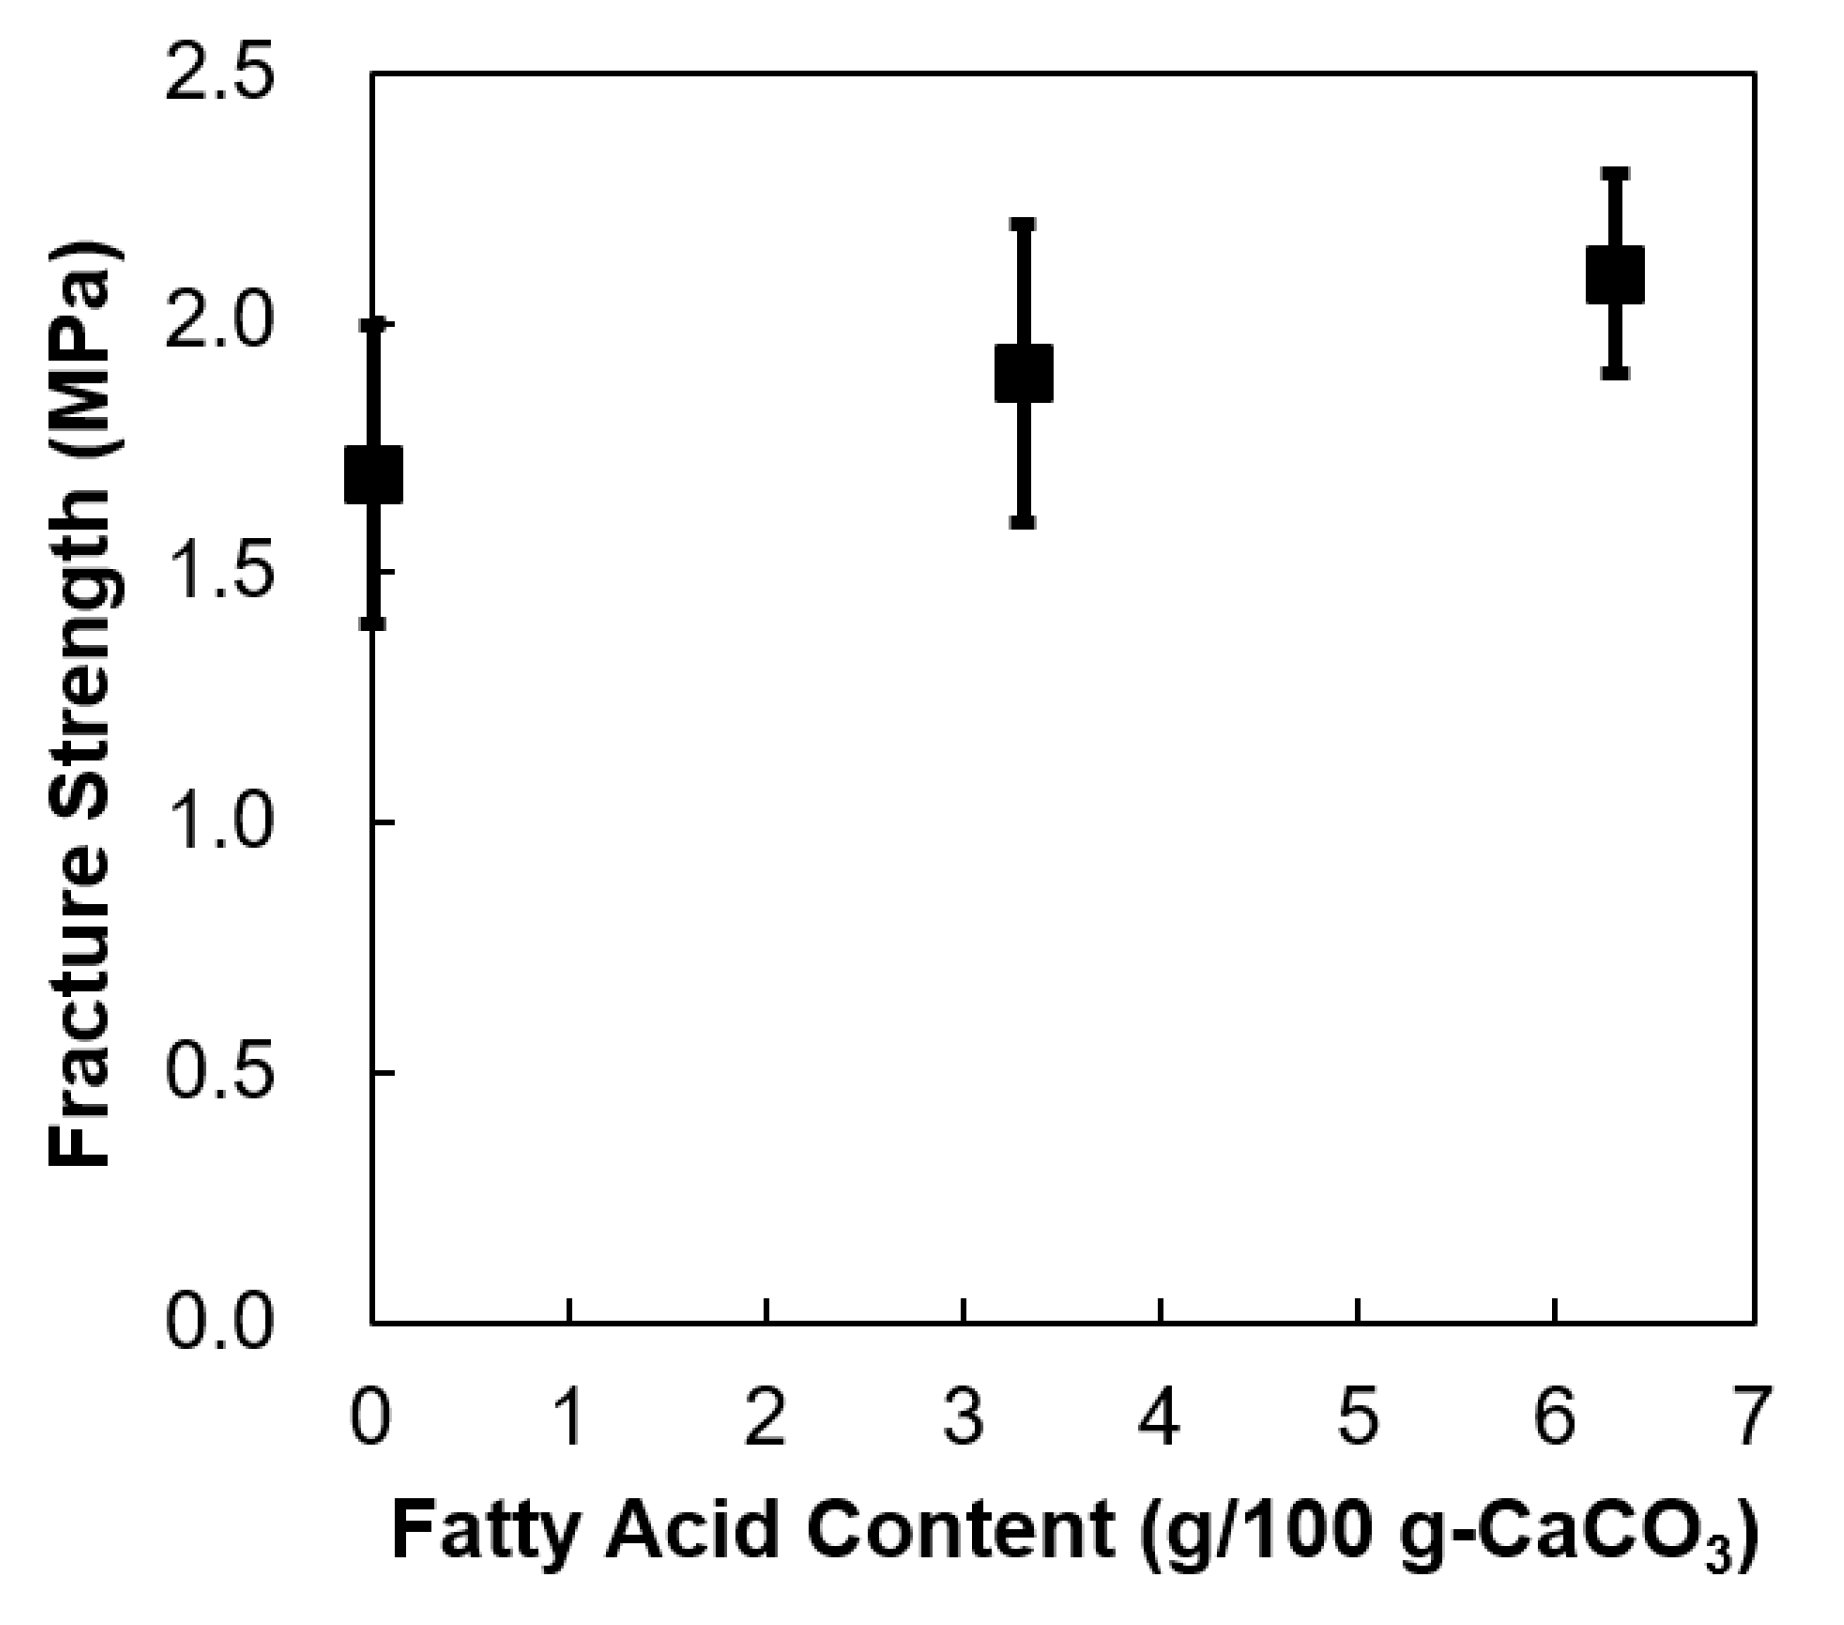
From the load-depth curves obtained during the indentation tests, the fracture strength was calculated using the Hiramatsu equation for ten agglomerates for each sample. Figure 7 shows the average fracture strength as a function of fatty acid content for the non-coated, lightly-coated, and heavily-coated samples. The fracture strength values are listed in Table 1. As the amount of surface treatment increases, fracture strength of agglomerates becomes slightly higher. This is interpreted to be because of the existence of fatty acid inside the agglomerates. Under the experimental conditions employed in this study (ambient conditions at room temperature), the smaller the pore volume within the agglomerates becomes due to interior fatty acid, the stronger the agglomerates become. It can be concluded that fracture strength of nanoparticle agglomerates can be quickly evaluated by using a commercially available nano-indentation instrument equipped with a flat indentation tip, and the Hiramatsu equation. Finally, in order to evaluate the fracture strength more quantitatively, the diameter of each agglomerate has to be determined using microscopes with higher resolution such as SEM and atomic force microscope. For the experiment, the usage of commercially available coordination-linked sample holders for SEM and the nano-indentation system may be beneficial.
4. Conclusions
We presented some preliminary results and demonstrated a rapid way to measure the fracture strength of agglomerates using a commercially available nano-indentation instrument. The experimental and analysis method employed in this study are simple and can be applied for agglomeration fracture strength testing not only for CaCO3 but also for other nanoparticles such as titania, alumina, silica, carbon black, and so on. In the present study, we used the technique to evaluate the effect of surface treatment on agglomeration fracture. However, we believe that the technique is beneficial for optimizing each process of manufacturing powder materials, including synthesis (including choosing appropriate particle size and shape), filtering, drying, and delivering by evaluating how easily nanoparticle agglomerates can be re-dispersed into smaller fragments. Because the observation direction is parallel to the indentation direction, agglomerates cannot be observed during fracture test using the nano-indentation instrument used in this study. A further approach for fraction behavior may be needed to observe agglomerates cross-sectionally during indentation tests.
Supplementary Materials
The following are available online at https://www.mdpi.com/2305-7084/3/3/73/s1, Figure S1: Thermogravimetric curves, Figure S2: Powder X-ray diffraction patterns.
Author Contributions
Y.K. conceived, designed and performed the experiments, analyzed the data, and wrote the paper. Y.K. and M.T. discussed the results and reviewed the paper.
Funding
This research received no external funding.
Acknowledgments
The authors acknowledge Elionix Co. Ltd. for the helpful discussions and thoughtful comments for measurement and analysis using the ENT-2100 instrument.
Conflicts of Interest
The authors declare no conflict of interest.
References
- Stark, W.J.; Stoessel, P.R.; Wohlleben, W.; Hafner, A. Industrial applications of nanoparticles. Chem. Soc. Rev. 2015, 44, 5793–5805. [Google Scholar] [CrossRef] [PubMed] [Green Version]
- Vance, M.E.; Kuiken, T.; Vejerano, E.P.; McGinnis, S.P.; Hochella, M.F., Jr.; Rejeski, D.; Hull, M.S. Nanotechnology in the real world: Redeveloping the nanomaterial consumer products inventory. Beilstein J. Nanotechnol. 2015, 6, 1769–1780. [Google Scholar] [CrossRef] [PubMed] [Green Version]
- Roberts, J.C. (Ed.) Paper Chemistry, 2nd ed.; Springer: Heidelberg, Germany, 1996. [Google Scholar]
- Zhoua, S.; Wu, L.; Suna, J.; Shen, W. The change of the properties of acrylic-based polyurethane via addition of nano-silica. Prog. Org. Coat. 2002, 45, 33–42. [Google Scholar] [CrossRef]
- Hosokawa, M.; Nogi, K.; Naito, M.; Yokoyama, T. (Eds.) Nanoparticle Technology Handbook, 1st ed.; Elsevier: Amsterdam, The Netherlands, 2007. [Google Scholar]
- Pejchal, V.; Žagar, G.; Charvet, R.; Dénéréaz, C.; Mortensen, A. Compression testing spherical particles for strength: Theory of the meridian crack test and implementation for microscopic fused quartz. J. Mech. Phys. Solid. 2017, 99, 70–92. [Google Scholar] [CrossRef] [Green Version]
- Saha, R.; Nix, W.D. Effects of the substrate on the determination of thin film mechanical properties by nanoindentation. Acta Mater. 2002, 50, 23–38. [Google Scholar] [CrossRef]
- Corcoran, S.G.; Colton, R.J.; Lilleodden, E.T.; Gerberich, W.W. Staircase yielding phenomenon of single-crystal Au. Phys. Rev. B 1997, 55, 16057–16060. [Google Scholar] [CrossRef]
- Gu, X.W. Mechanical Properties of Architected Nanomaterials Made from Organic–Inorganic Nanocrystals. JOM 2018, 70, 2205–2217. [Google Scholar] [CrossRef]
- Clarke, D.R.; Tandon, R. Factors affecting the fracture resistance of silicon nitride ceramics. Mater. Sci. Eng. A 1995, 195, 207–214. [Google Scholar] [CrossRef]
- Briscoe, B.J.; Fiori, L.; Pelillo, E. Nano-indentation of polymeric surfaces. J. Phys. D Appl. Phys. 1998, 31, 2395–2405. [Google Scholar] [CrossRef]
- Raichman, Y.; Kazakevich, M.; Rabkin, E.; Tsur, Y. Inter-Nanoparticle Bonds in Agglomerates Studied by Nanoindentation. Adv. Mater. 2006, 18, 2028–2030. [Google Scholar] [CrossRef]
- Schilde, C.; Westphal, B.; Kwade, A. Effect of the primary particle morphology on the micromechanical properties of nanostructured alumina agglomerates. J. Nanopart. Res. 2012, 14, 745. [Google Scholar] [CrossRef]
- Hiramatsu, Y.; Oka, Y.; Kiyama, H. Rapid Determination of the Tensile Strength of Rocks with Irregular Test Pieces. J. Min. Metall. Inst. Jpn. 1965, 81, 1024–1030. [Google Scholar] [Green Version]
- Hiramatsu, Y.; Oka, Y. Determination of the tensile strength of rock by a compression test of an irregular test piece. Int. J. Rock Mech. Min. Sci. 1966, 3, 89–90. [Google Scholar] [CrossRef]
- Shiraishi, T. Method of Manufacturing Monodispersed Carbonate of Alkali Earths. U.S. Patent No. 1,863,945, 21 June 1932. [Google Scholar]
- Takasaki, M.; Kezuka, Y.; Tajika, M.; Oaki, Y.; Imai, H. Evolution of calcite nanocrystals through oriented attachment and fragmentation: Multistep pathway involving bottom-up and break-down stages. ACS Omega 2017, 2, 8997–9001. [Google Scholar] [CrossRef]
- Kezuka, Y.; Kuma, Y.; Nakai, S.; Matsubara, K.; Tajika, M. Calcium carbonate chain-like nanoparticles: Synthesis, structural characterization, and dewaterability. Powder Technol. 2018, 335, 195–203. [Google Scholar] [CrossRef]
- Roskill Information Services Ltd. Ground and Precipitated Calcium Carbonate: Global Industry Markets and Outlook, 1st ed.; Roskill Information Services Ltd.: London, UK, 2012. [Google Scholar]
- Yoğurtcuoğlu, E.; Uçurum, M. Surface modification of calcite by wet-stirred ball milling and its properties. Powder Technol. 2011, 214, 47–53. [Google Scholar] [CrossRef]
- Mihajlović, S.R.; Vučinić, D.R.; Sekulić, Ž.T.; Milićević, S.Z.; Kolonja, B.M. Mechanism of stearic acid adsorption to calcite. Powder Technol. 2013, 245, 208–216. [Google Scholar] [CrossRef]
- Brunauer, S.; Emmett, P.H.; Teller, E. Adsorption of gases in multimolecular layers. J. Am. Chem. Soc. 1938, 60, 309–319. [Google Scholar] [CrossRef]
- Mikhail, R.S.; Brunauer, S. Surface area measurements by nitrogen and argon adsorption. J. Coll. Interf. Sci. 1975, 52, 572–577. [Google Scholar] [CrossRef]
- Scherrer, P. Estimation of the Size and Internal Structure of Colloidal Particles by Means of Röntgen. Nachr. Ges. Wiss. Göttingen 1918, 2, 96–100. [Google Scholar]
Figure 1.
(a) Schematic illustration of fracture strength test of nanoparticle agglomerates by nano-indentation with a flat indenter tip; (b) Schematic load-depth diagram for the nano-indentation test.
Figure 1.
(a) Schematic illustration of fracture strength test of nanoparticle agglomerates by nano-indentation with a flat indenter tip; (b) Schematic load-depth diagram for the nano-indentation test.
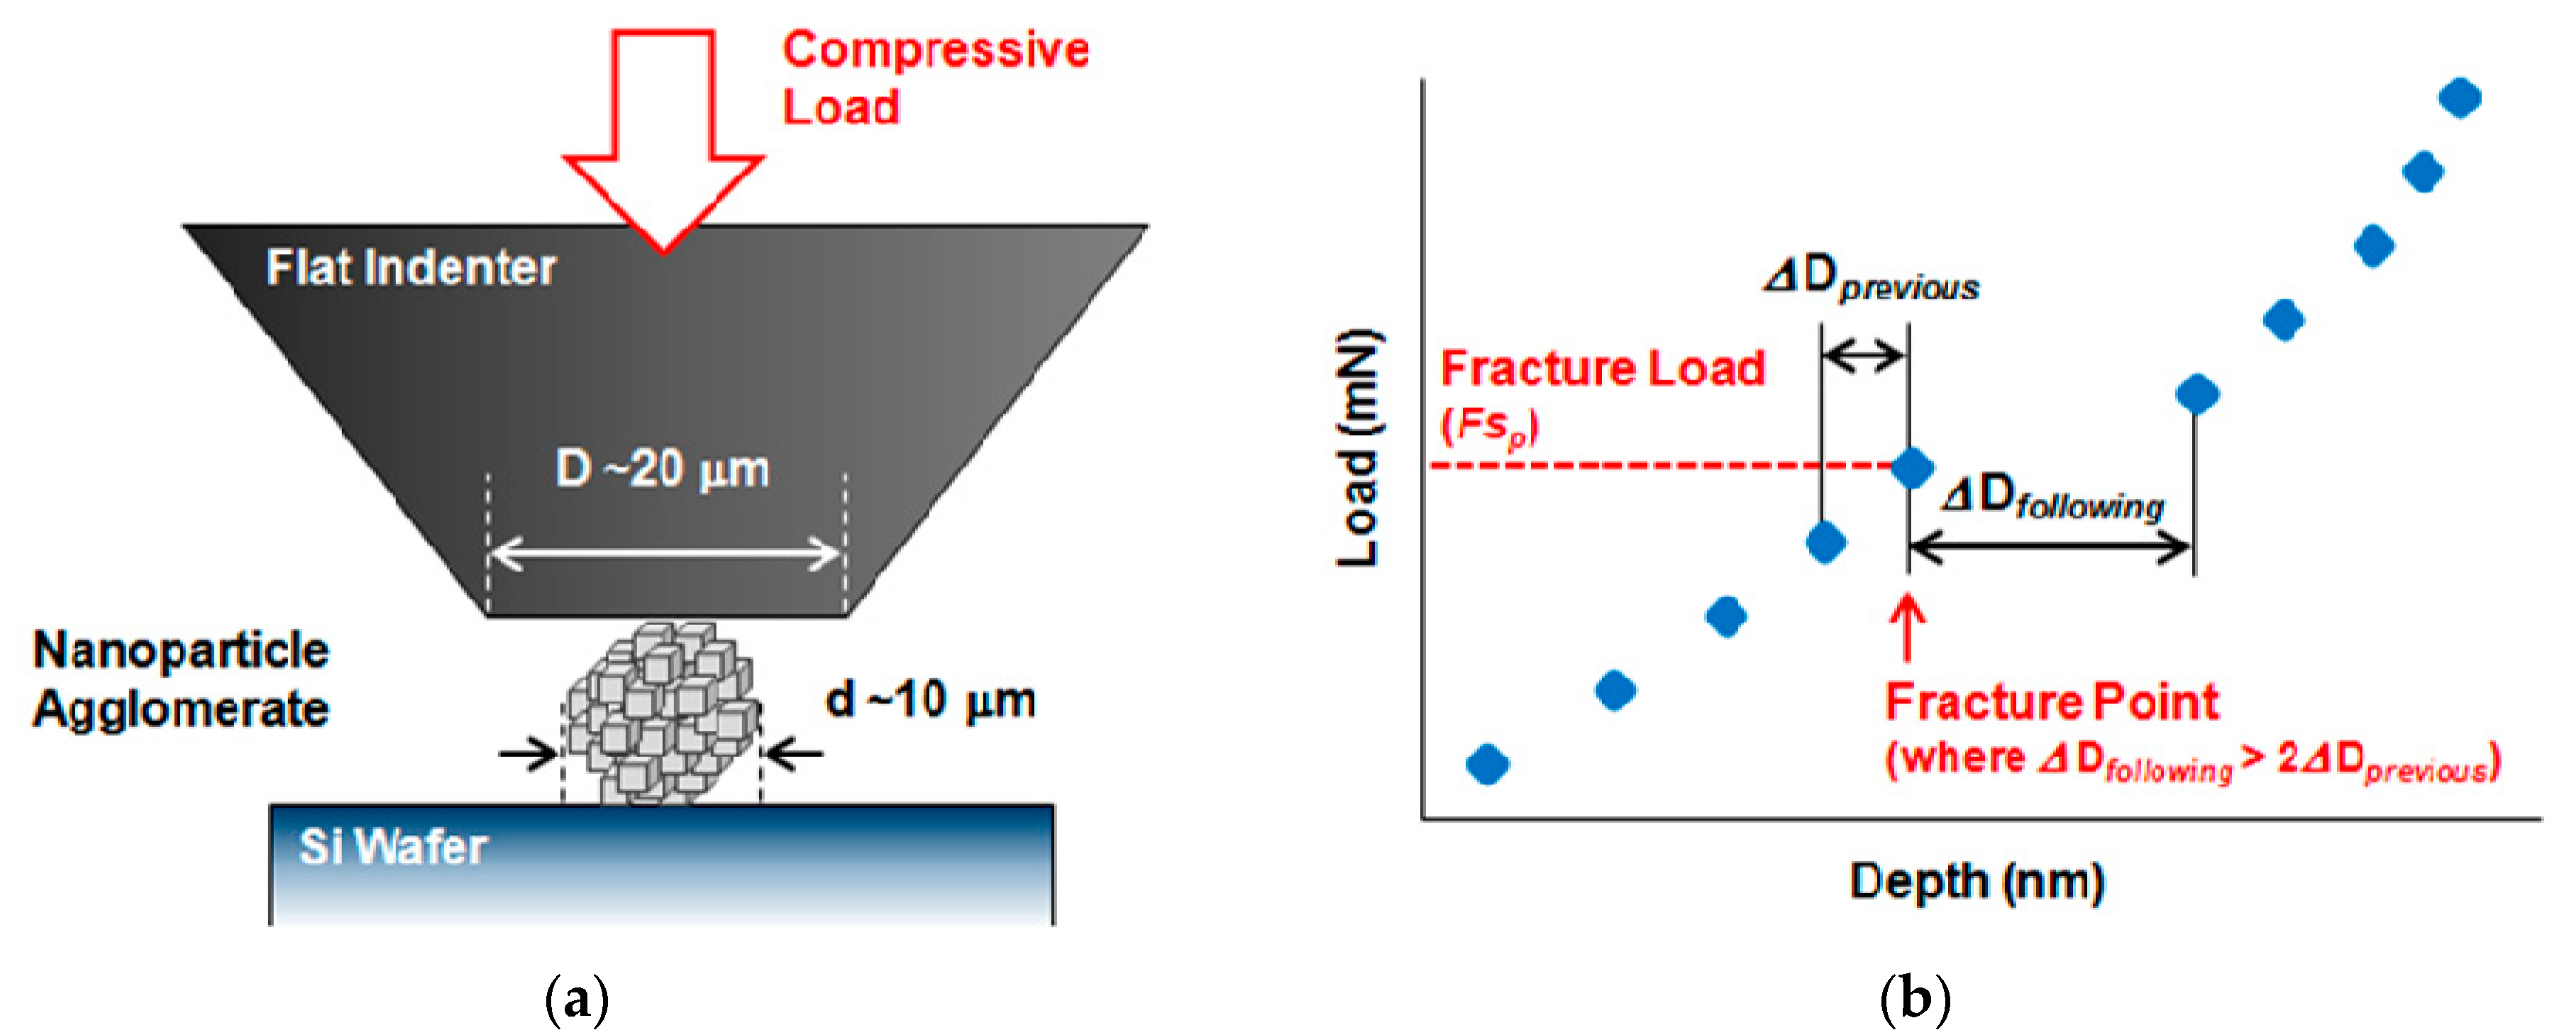
Figure 2.
A bright-field transmission electron microscopy image of the non-coated CaCO3 rhombohedral nanoparticles.
Figure 2.
A bright-field transmission electron microscopy image of the non-coated CaCO3 rhombohedral nanoparticles.
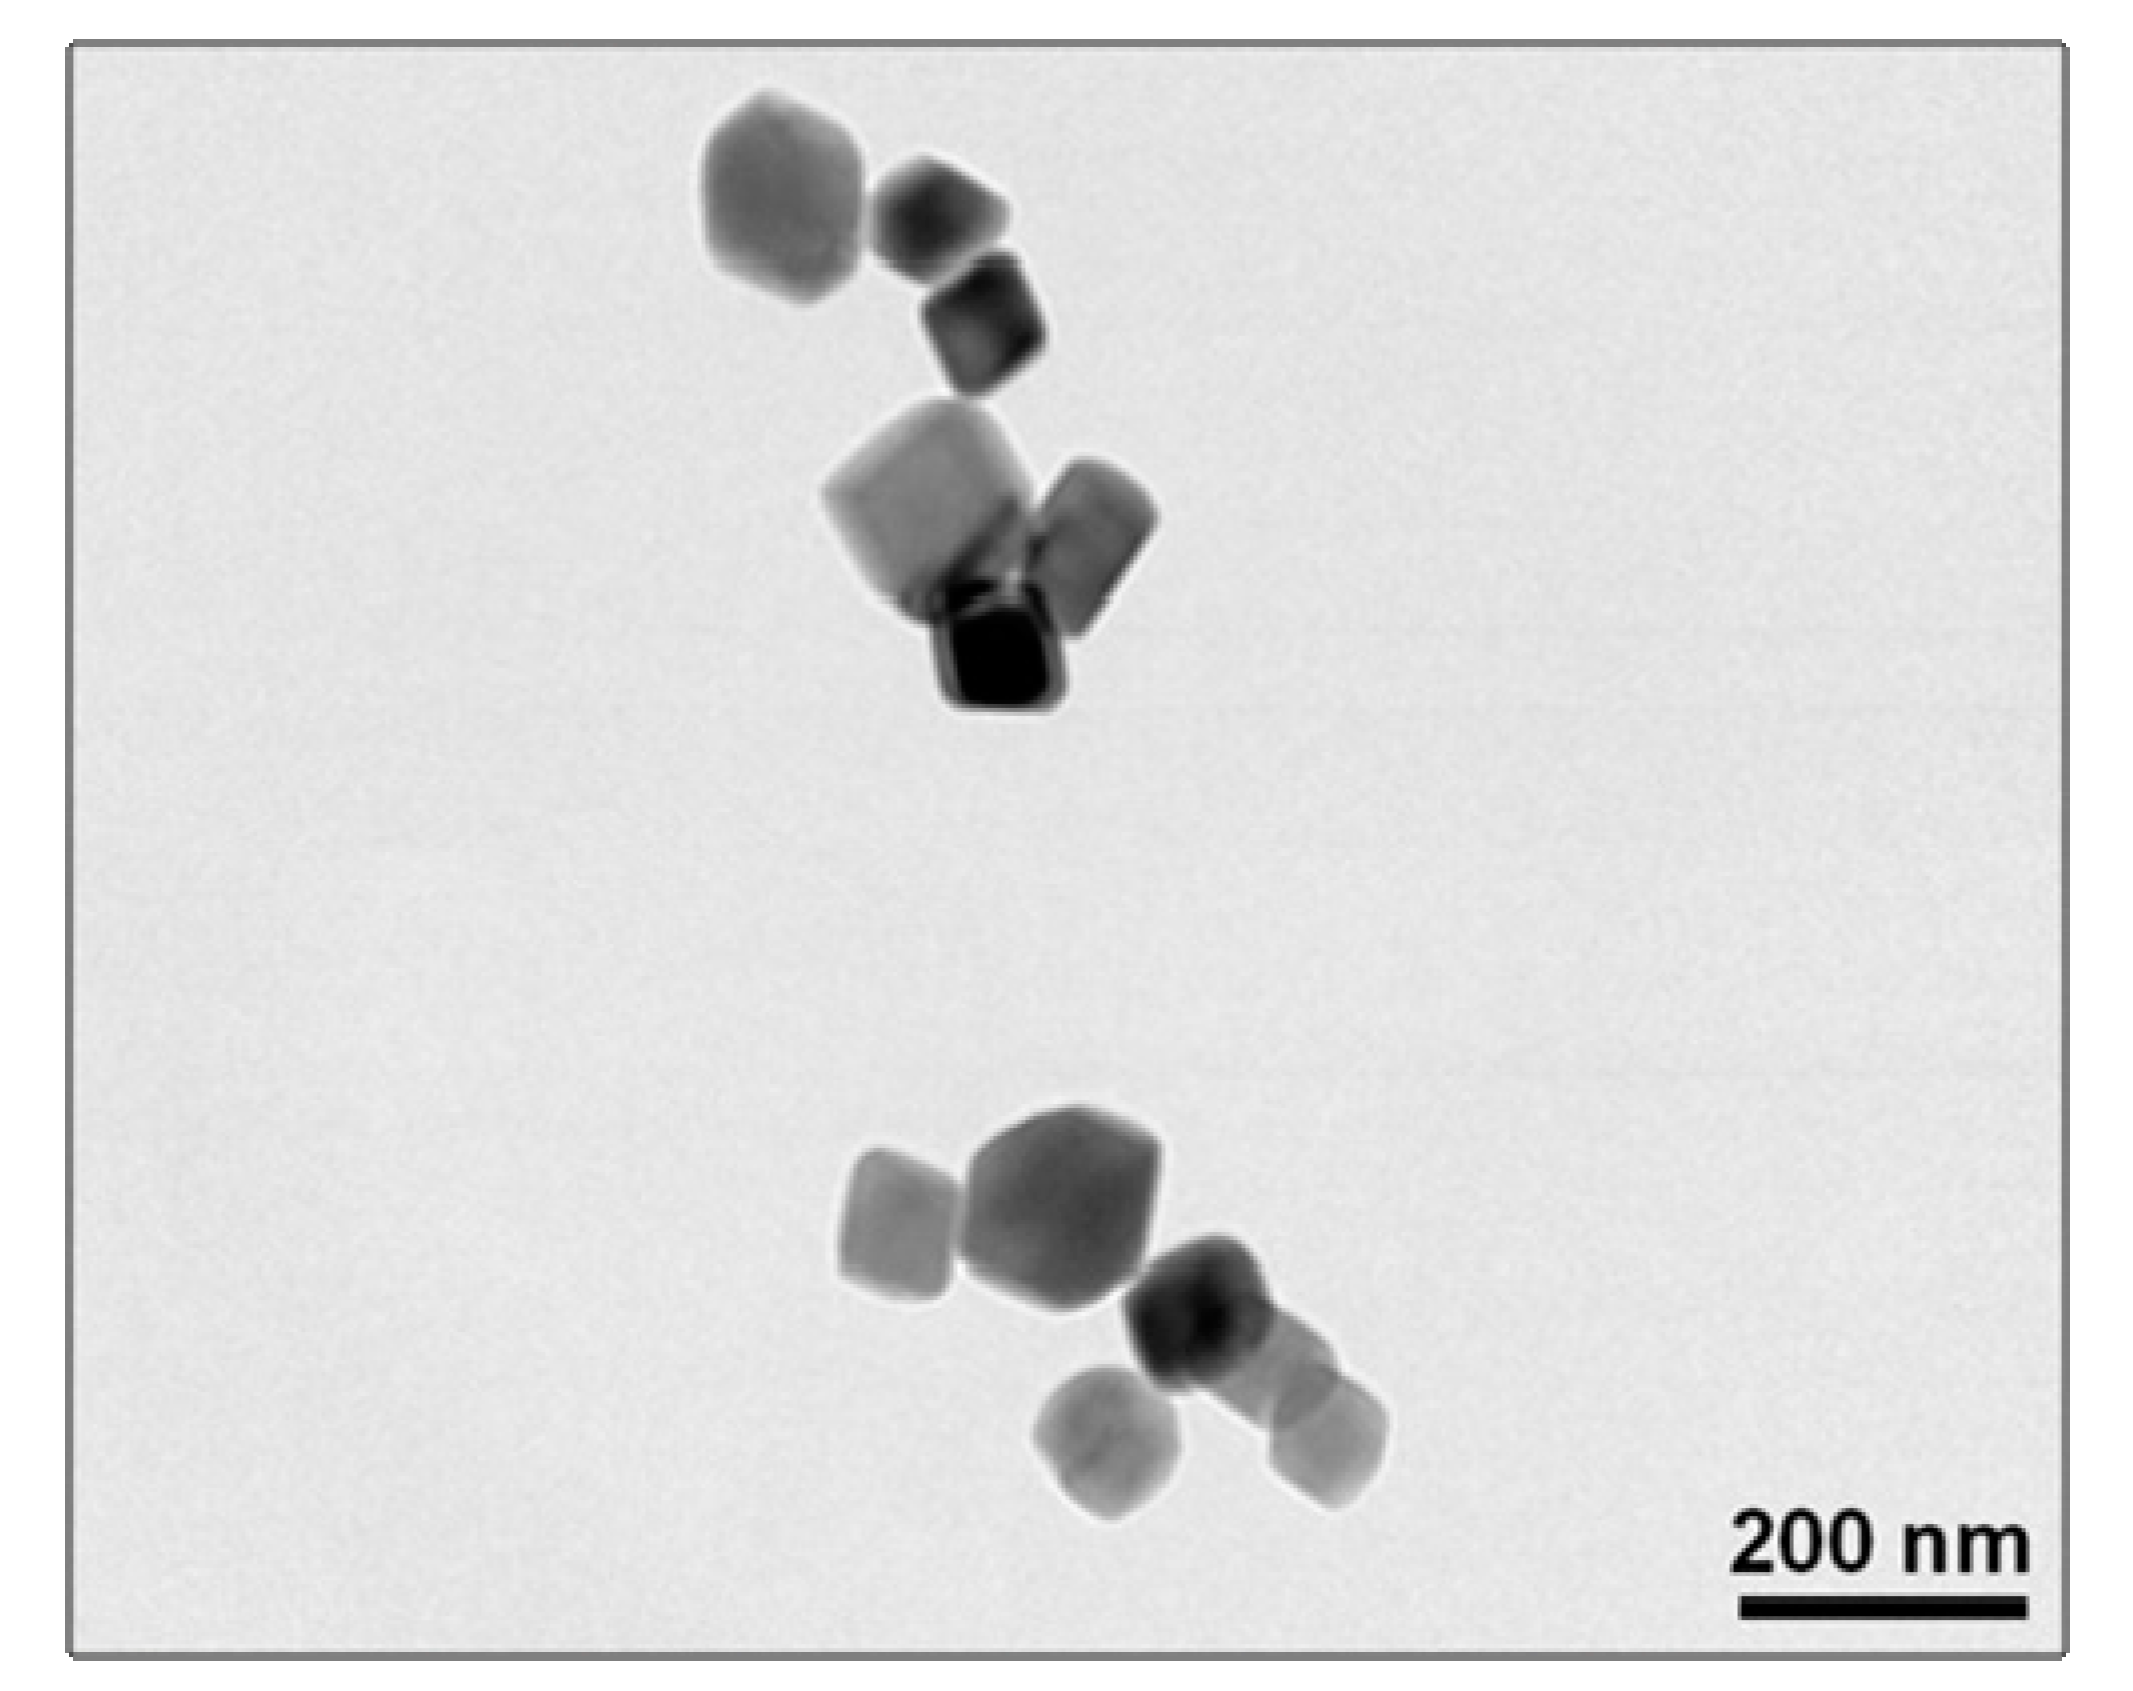
Figure 3.
Agglomerate size distributions for the non-coated, lightly fatty acid-coated, and heavily fatty acid-coated CaCO3 particles.
Figure 3.
Agglomerate size distributions for the non-coated, lightly fatty acid-coated, and heavily fatty acid-coated CaCO3 particles.
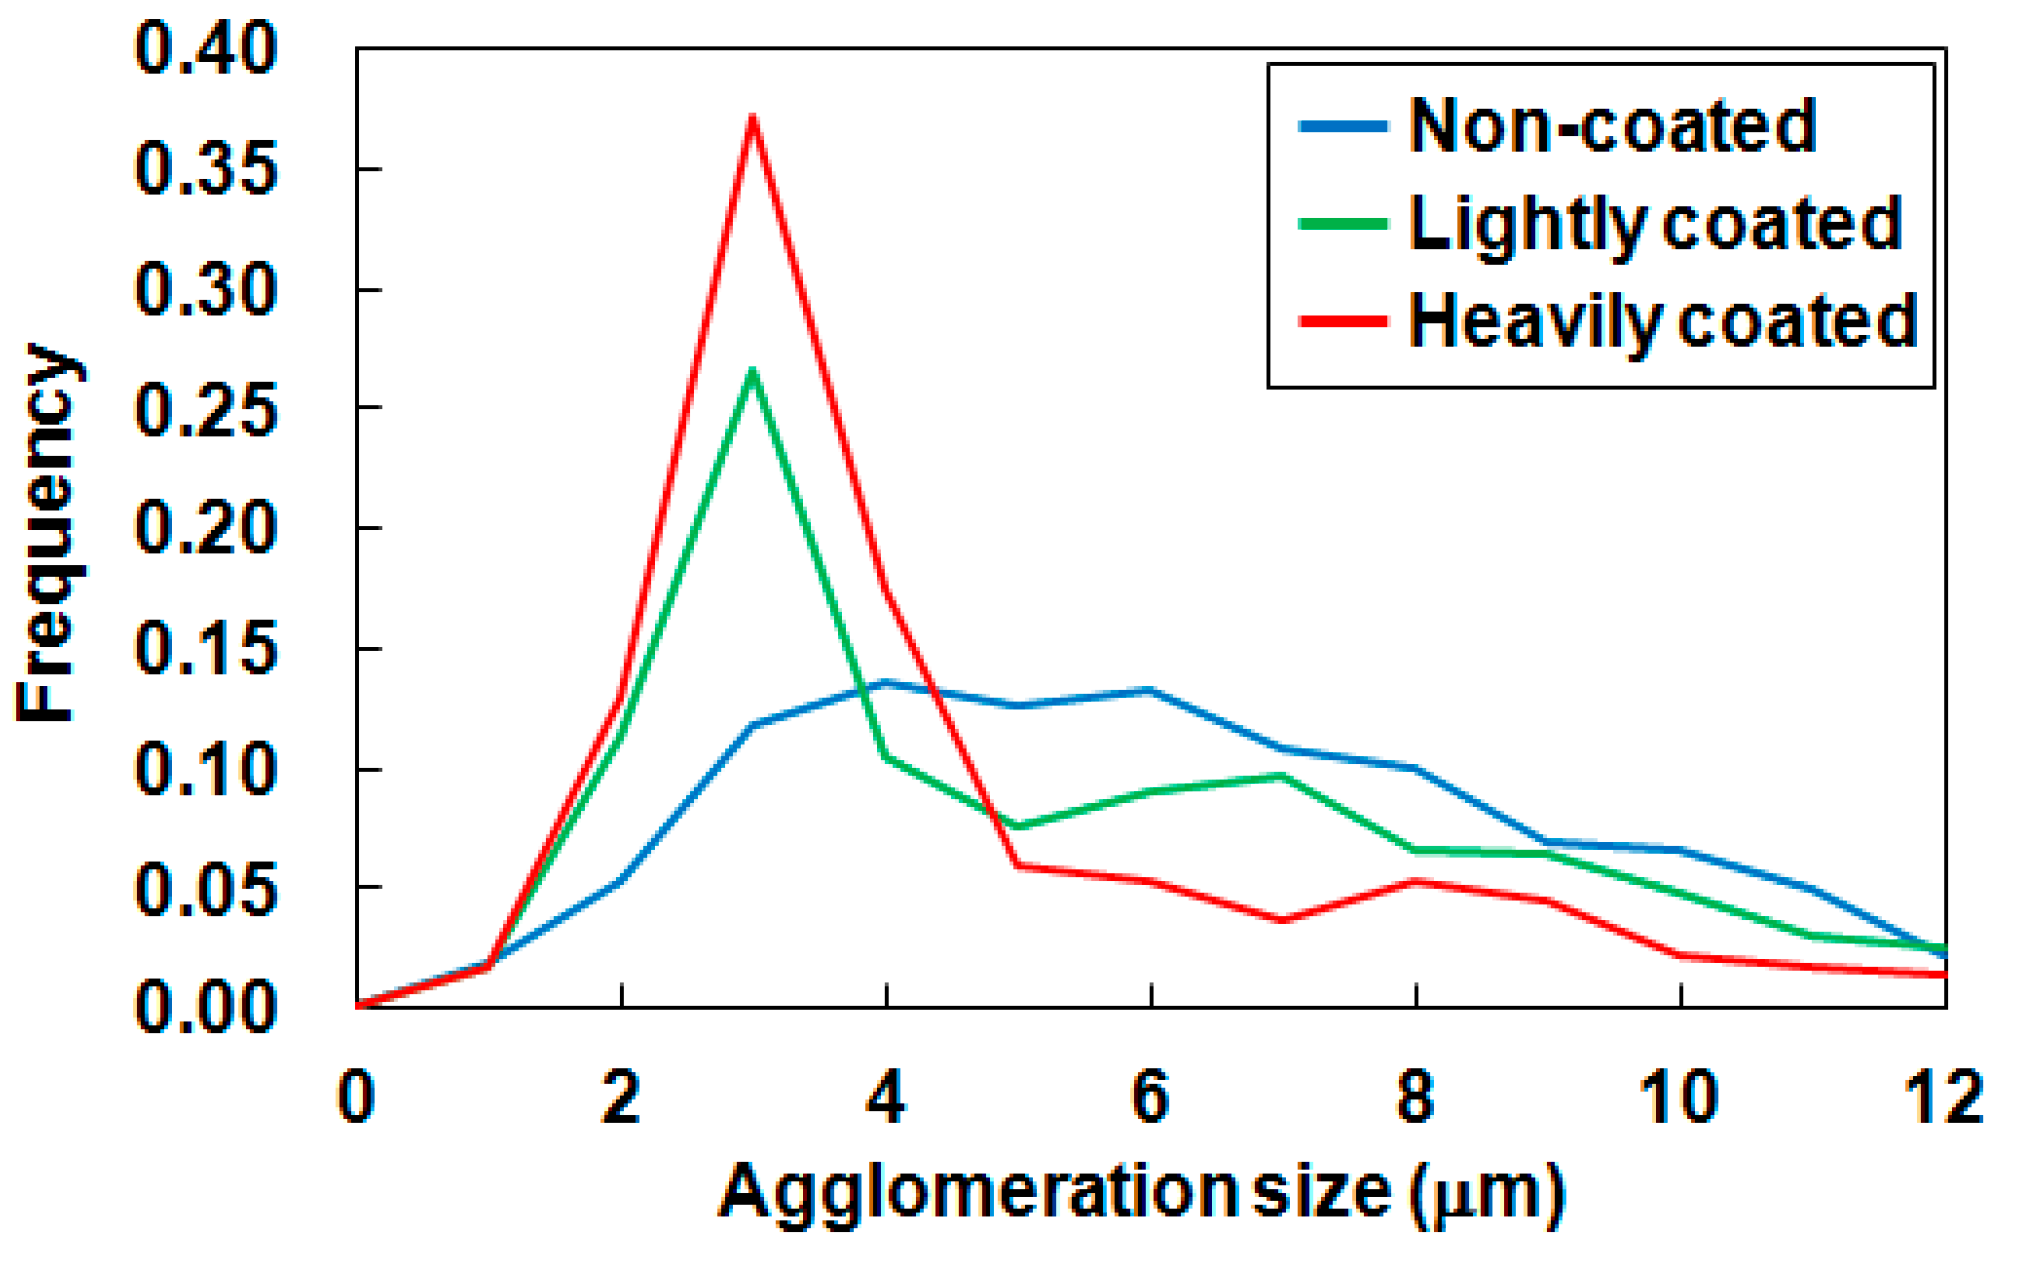
Figure 4.
A typical field-emission scanning electron microscopy image of an agglomerate of the lightly fatty acid-coated CaCO3 particles.
Figure 4.
A typical field-emission scanning electron microscopy image of an agglomerate of the lightly fatty acid-coated CaCO3 particles.
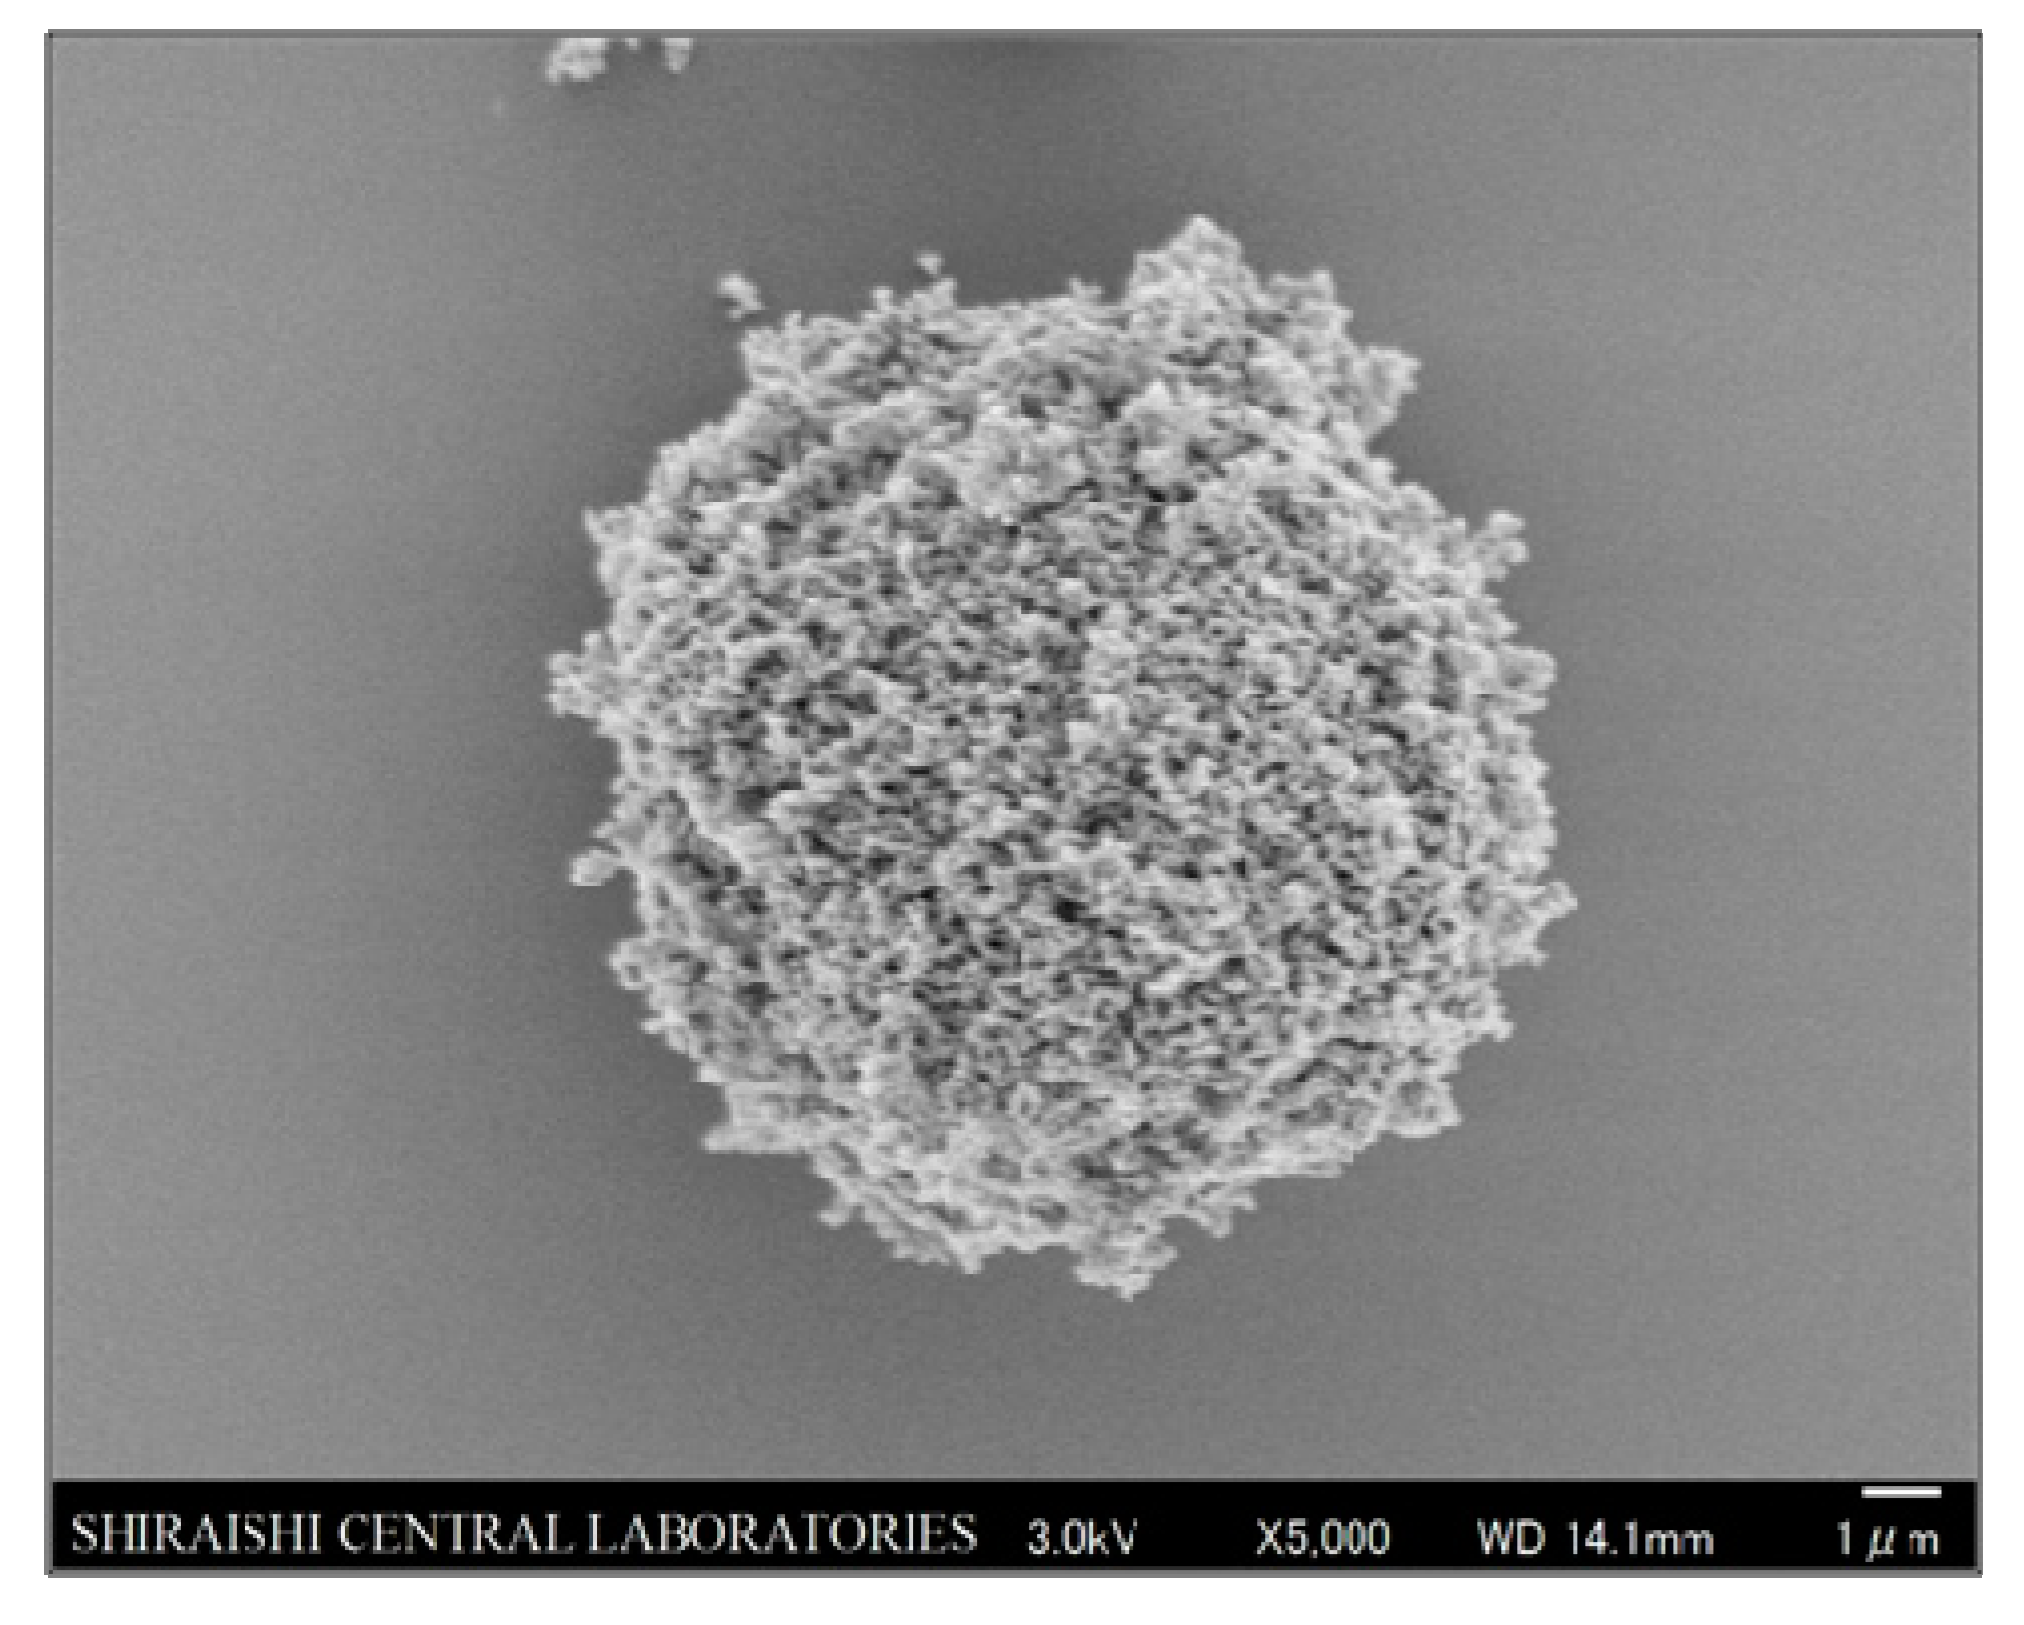
Figure 5.
Typical data from mercury intrusion porosimetry for the non-coated, lightly fatty acid-coated, and heavily fatty acid-coated CaCO3 powders; (a) Differential intrusion volume plot; (b) Cumulative pore volume plot.
Figure 5.
Typical data from mercury intrusion porosimetry for the non-coated, lightly fatty acid-coated, and heavily fatty acid-coated CaCO3 powders; (a) Differential intrusion volume plot; (b) Cumulative pore volume plot.
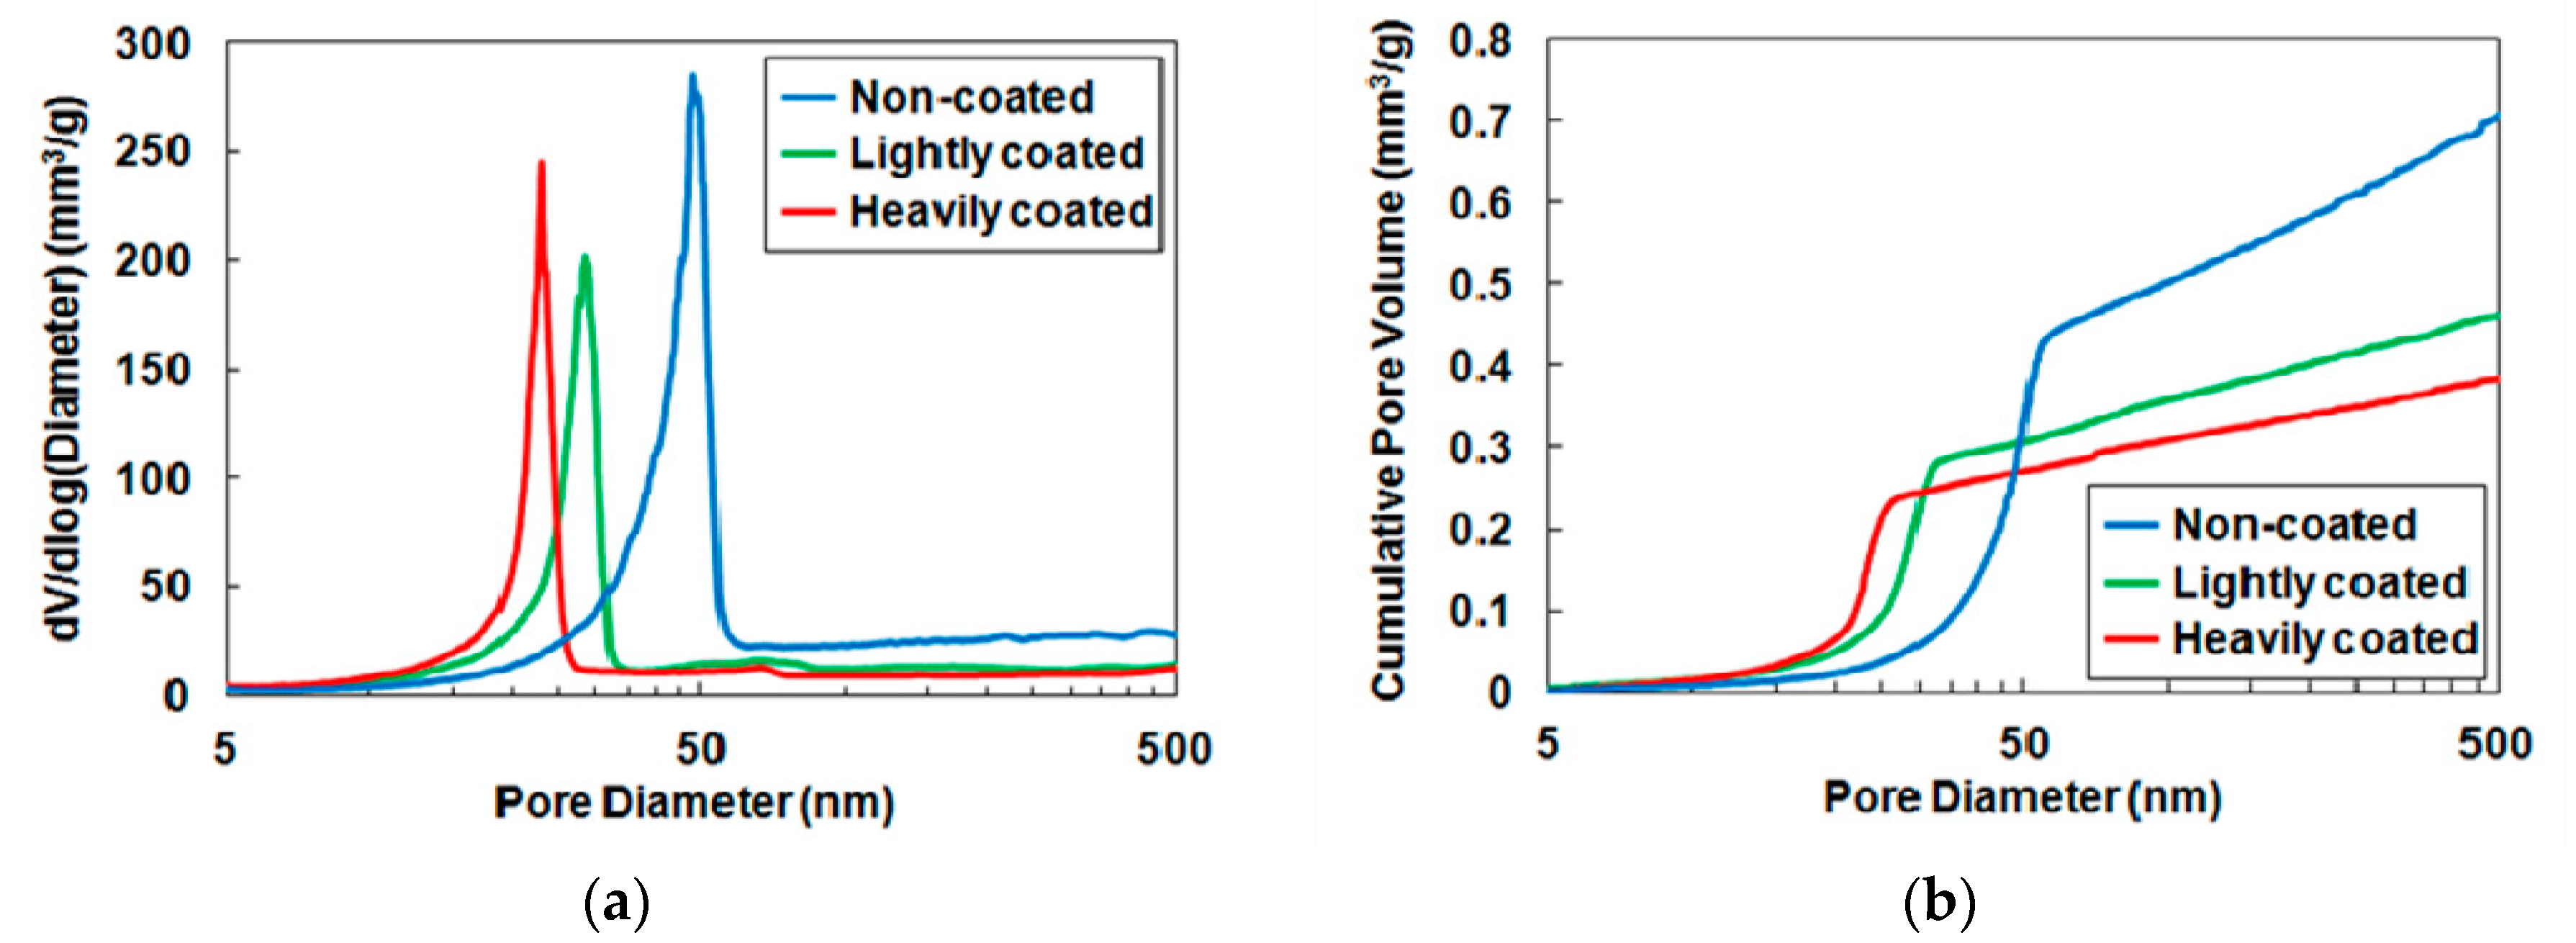
Figure 6.
Optical micrographs of an agglomerate of the lightly fatty acid-coated sample (a) before and (b) after the nano-indentation test.
Figure 6.
Optical micrographs of an agglomerate of the lightly fatty acid-coated sample (a) before and (b) after the nano-indentation test.
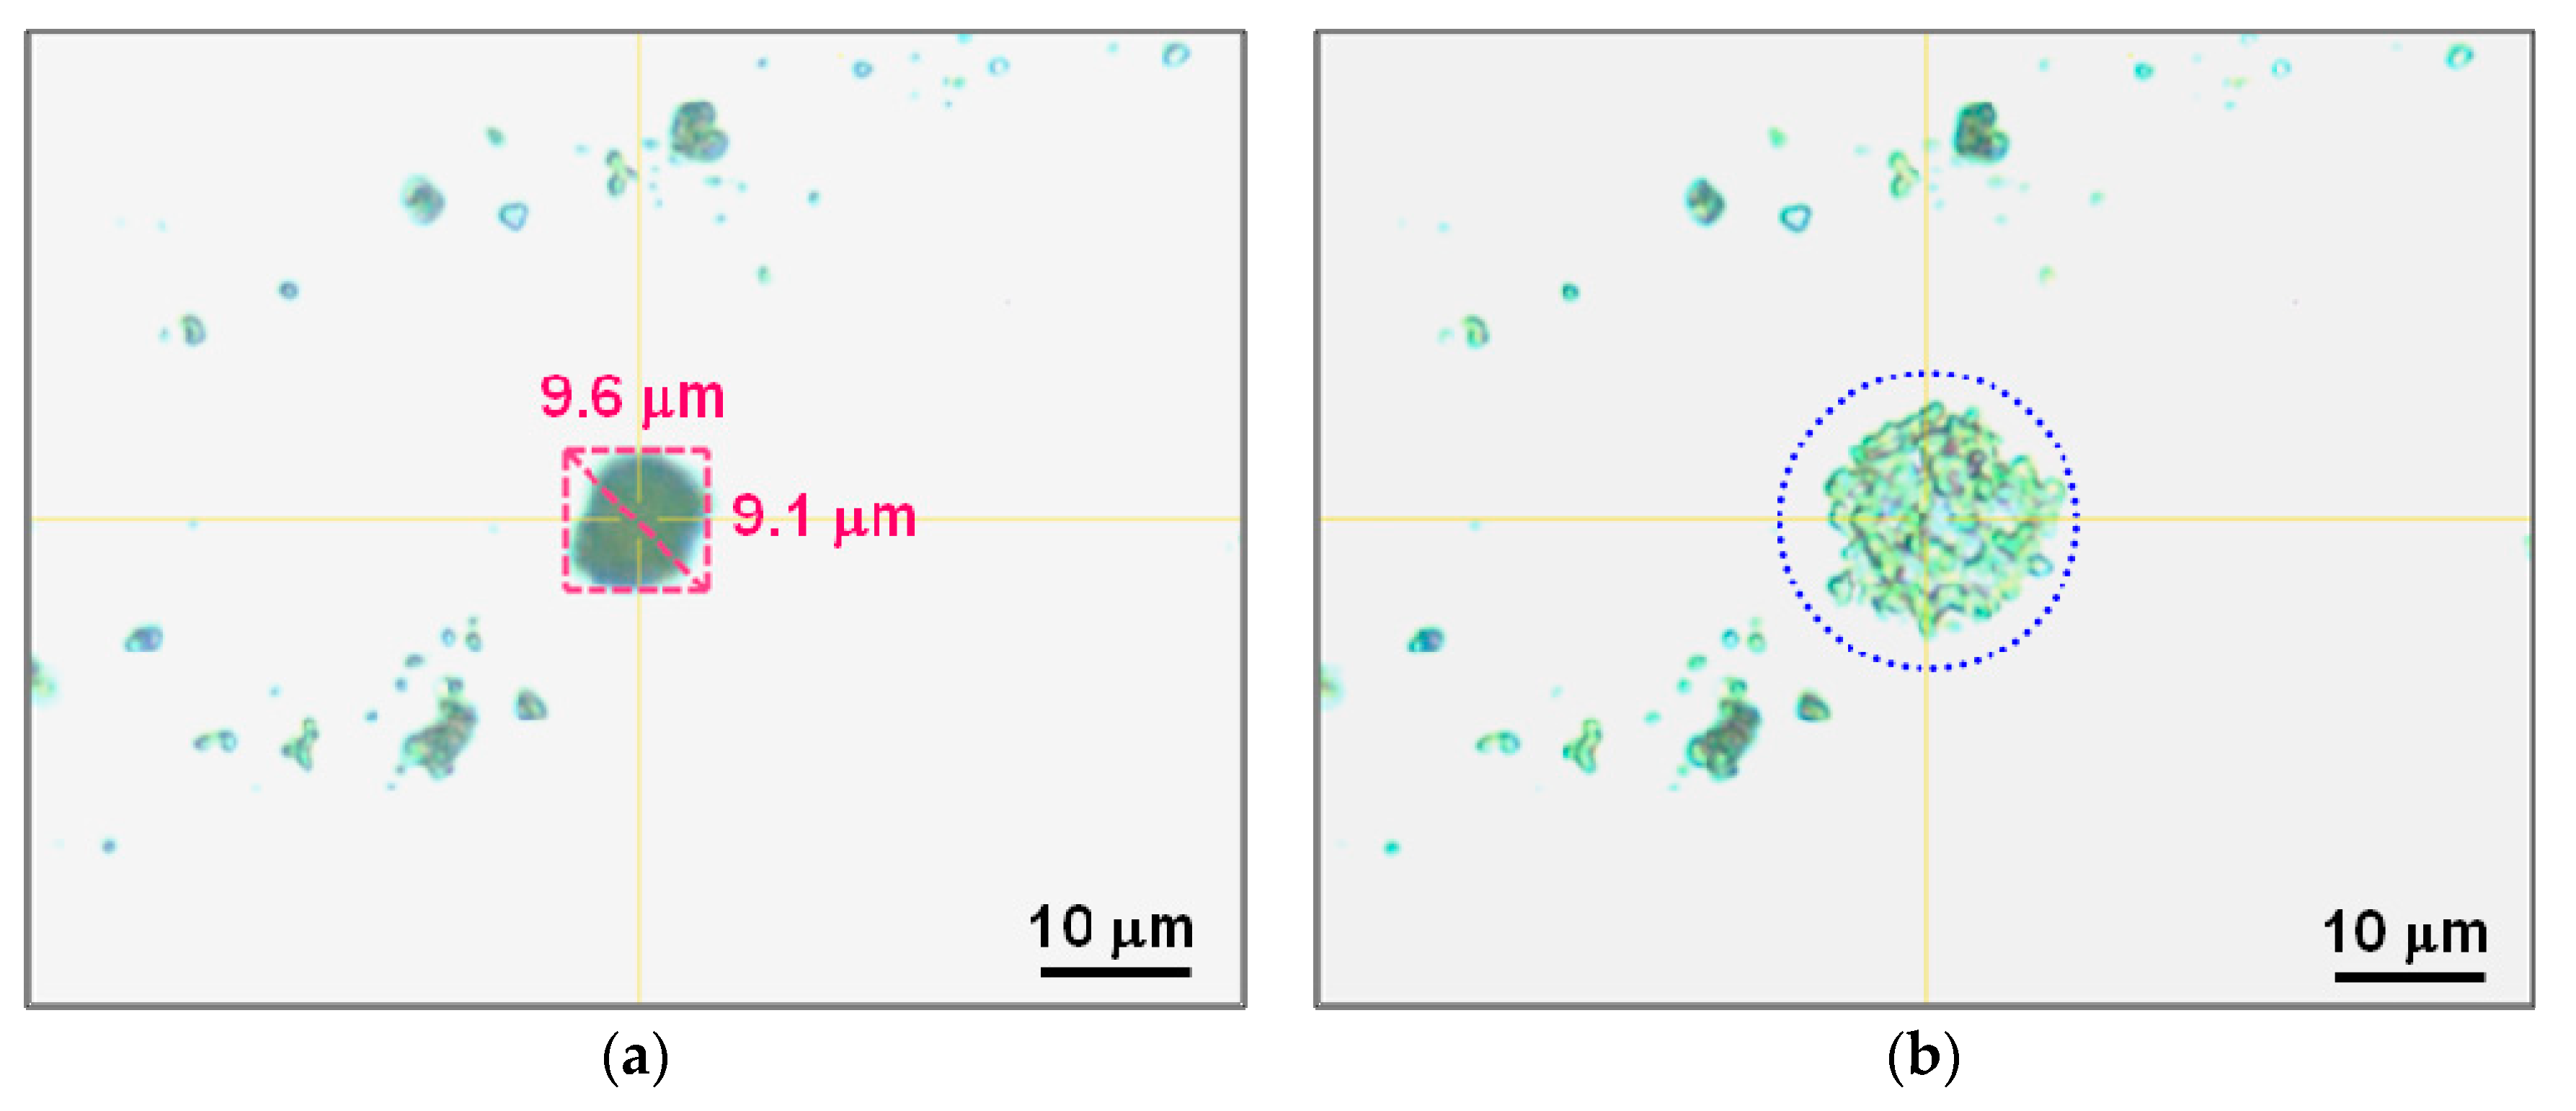
Figure 7.
Average fracture strength of agglomerates as a function of the amount of fatty acid coating. Error bars show the standard errors.
Figure 7.
Average fracture strength of agglomerates as a function of the amount of fatty acid coating. Error bars show the standard errors.

Table 1.
Powder characteristics of the non-coated, lightly-coated, and heavily-coated calcium carbonate powders.
Table 1.
Powder characteristics of the non-coated, lightly-coated, and heavily-coated calcium carbonate powders.
| Non-Coated | Lightly-Coated | Heavily-Coated | |
|---|---|---|---|
| Fatty acid content (g/100 g-CaCO3) | - | 3.3 | 6.3 |
| Crystallite size (nm) | 75 | 75 | 74 |
| BET-SSA (m2/g) | 18.7 | 16.5 | 16.7 |
| Agglomeration size (μm) | |||
| D10 | 2.3 | 1.8 | 1.8 |
| D50 | 5.3 | 4.0 | 3.0 |
| D90 | 9.6 | 9.2 | 8.2 |
| Most frequent pore diameter (nm) | 48 | 28 | 23 |
| Pore volume (mm3/g) | 0.45 | 0.28 | 0.25 |
| Fracture strength (Csp) (MPa) | 1.7 ± 0.3 | 1.9 ± 0.3 | 2.1 ± 0.2 |
© 2019 by the authors. Licensee MDPI, Basel, Switzerland. This article is an open access article distributed under the terms and conditions of the Creative Commons Attribution (CC BY) license (http://creativecommons.org/licenses/by/4.0/).
Share and Cite
MDPI and ACS Style
Kezuka, Y.; Tajika, M. Fracture Strength Evaluation of Agglomerates of Fatty Acid-Coated CaCO3 Nanoparticles by Nano-Indentation. ChemEngineering 2019, 3, 73. https://doi.org/10.3390/chemengineering3030073
AMA Style
Kezuka Y, Tajika M. Fracture Strength Evaluation of Agglomerates of Fatty Acid-Coated CaCO3 Nanoparticles by Nano-Indentation. ChemEngineering. 2019; 3(3):73. https://doi.org/10.3390/chemengineering3030073
Chicago/Turabian StyleKezuka, Yuki, and Masahiko Tajika. 2019. "Fracture Strength Evaluation of Agglomerates of Fatty Acid-Coated CaCO3 Nanoparticles by Nano-Indentation" ChemEngineering 3, no. 3: 73. https://doi.org/10.3390/chemengineering3030073