Insights from Mathematical Modelling into Energy Requirement and Process Design of Continuous and Batch Stirred Tank Aerobic Bioreactors

Abstract
:1. Introduction
2. Mathematical Modelling
2.1. Bioreaction Kinetics
2.2. Bioreactor Working Volume and Substrate Utilisation
2.2.1. Continuous Bioreactor
2.2.2. Batch Bioreactor
2.3. Oxygen Transfer and Detrmination of Agitator Power Requirement
2.4. Flooding and Phase Equilibrium Constraints
2.5. Aeration System Power Requirement
2.6. Refrigeration Power Requirement for Cooling
3. Results and Discussion
3.1. Bioreaction Kinetics
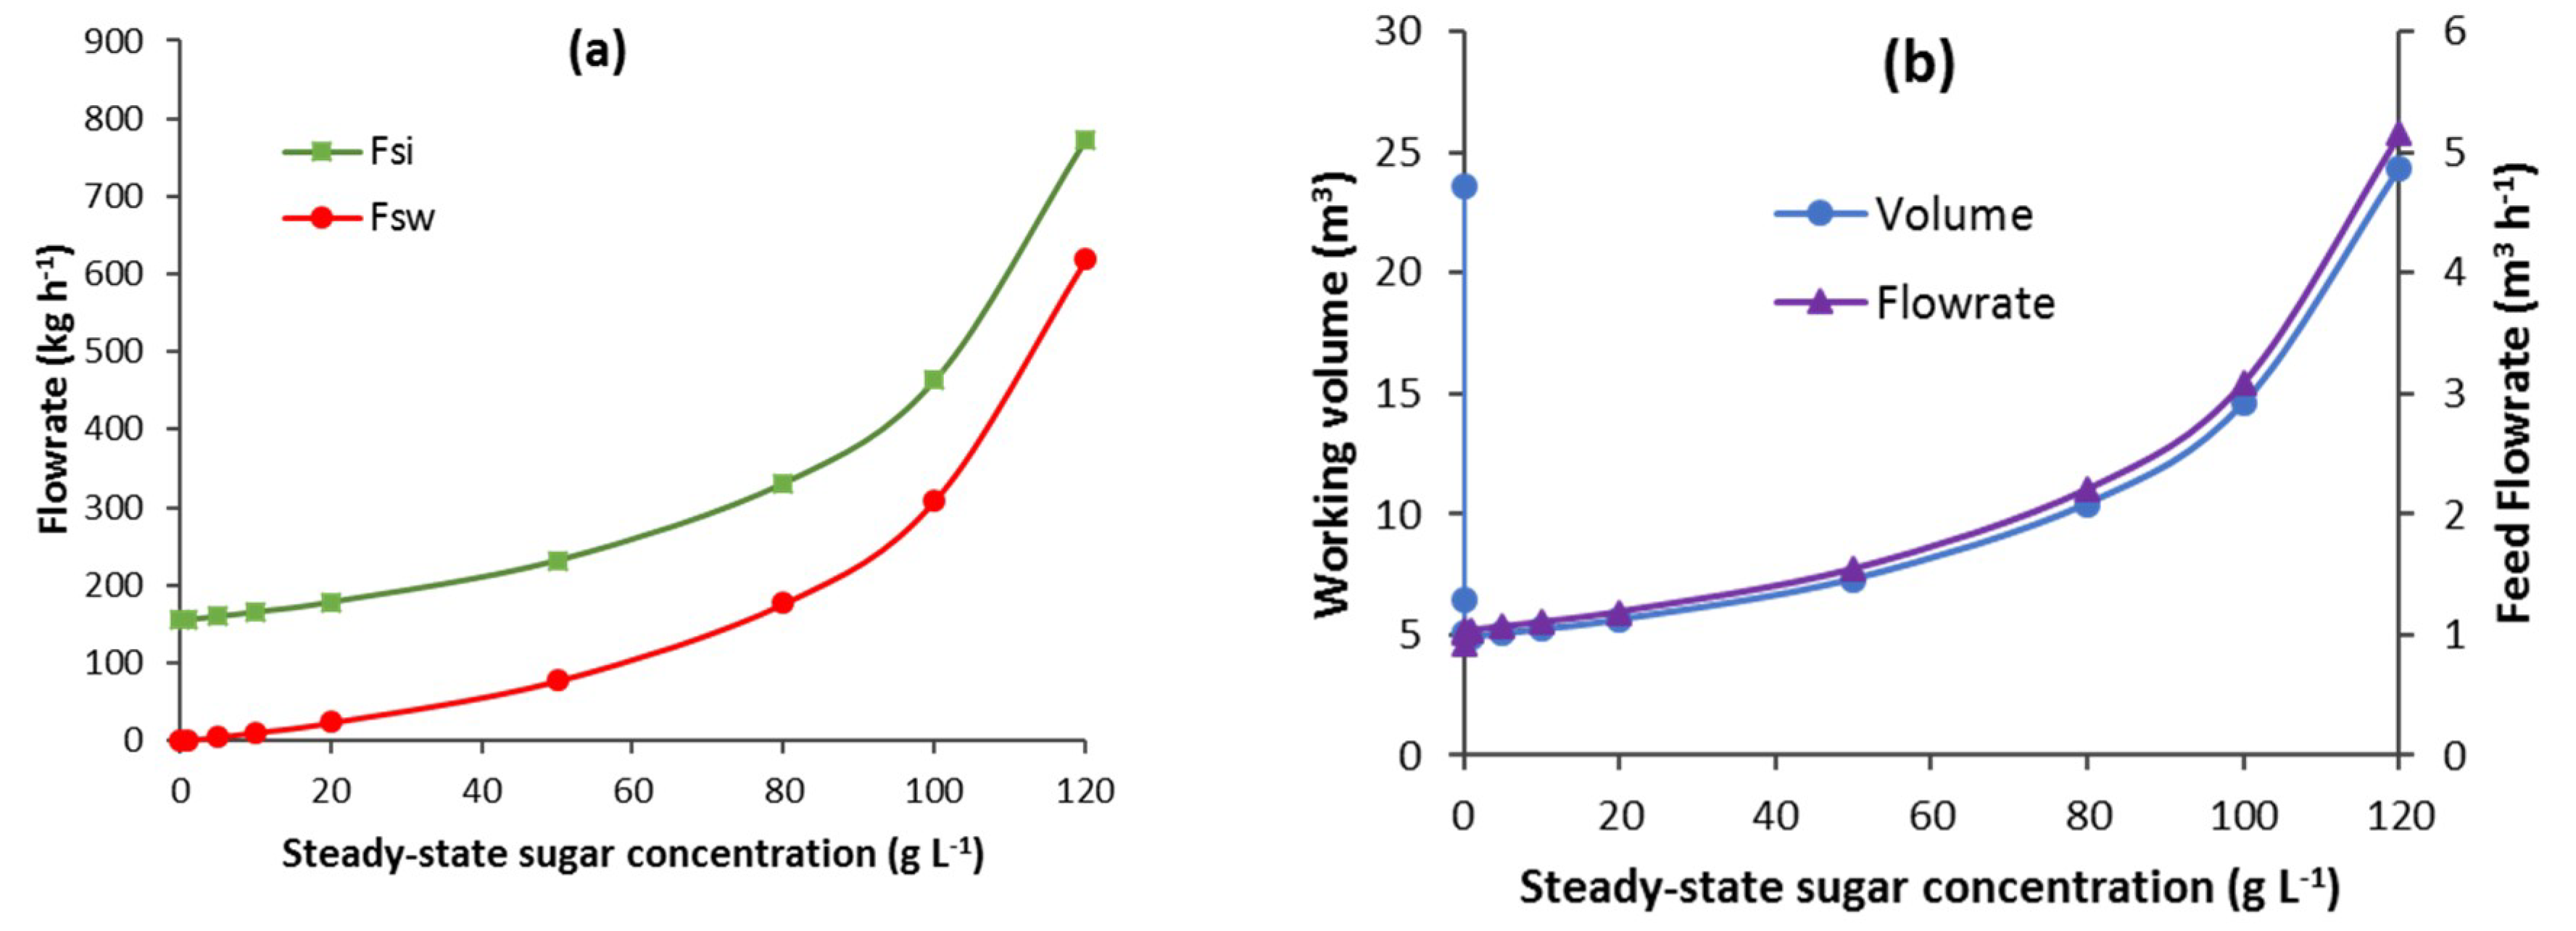
3.2. Bioreactor Volume and Feed/Wasted Sugar Substrate
3.2.1. CSTB
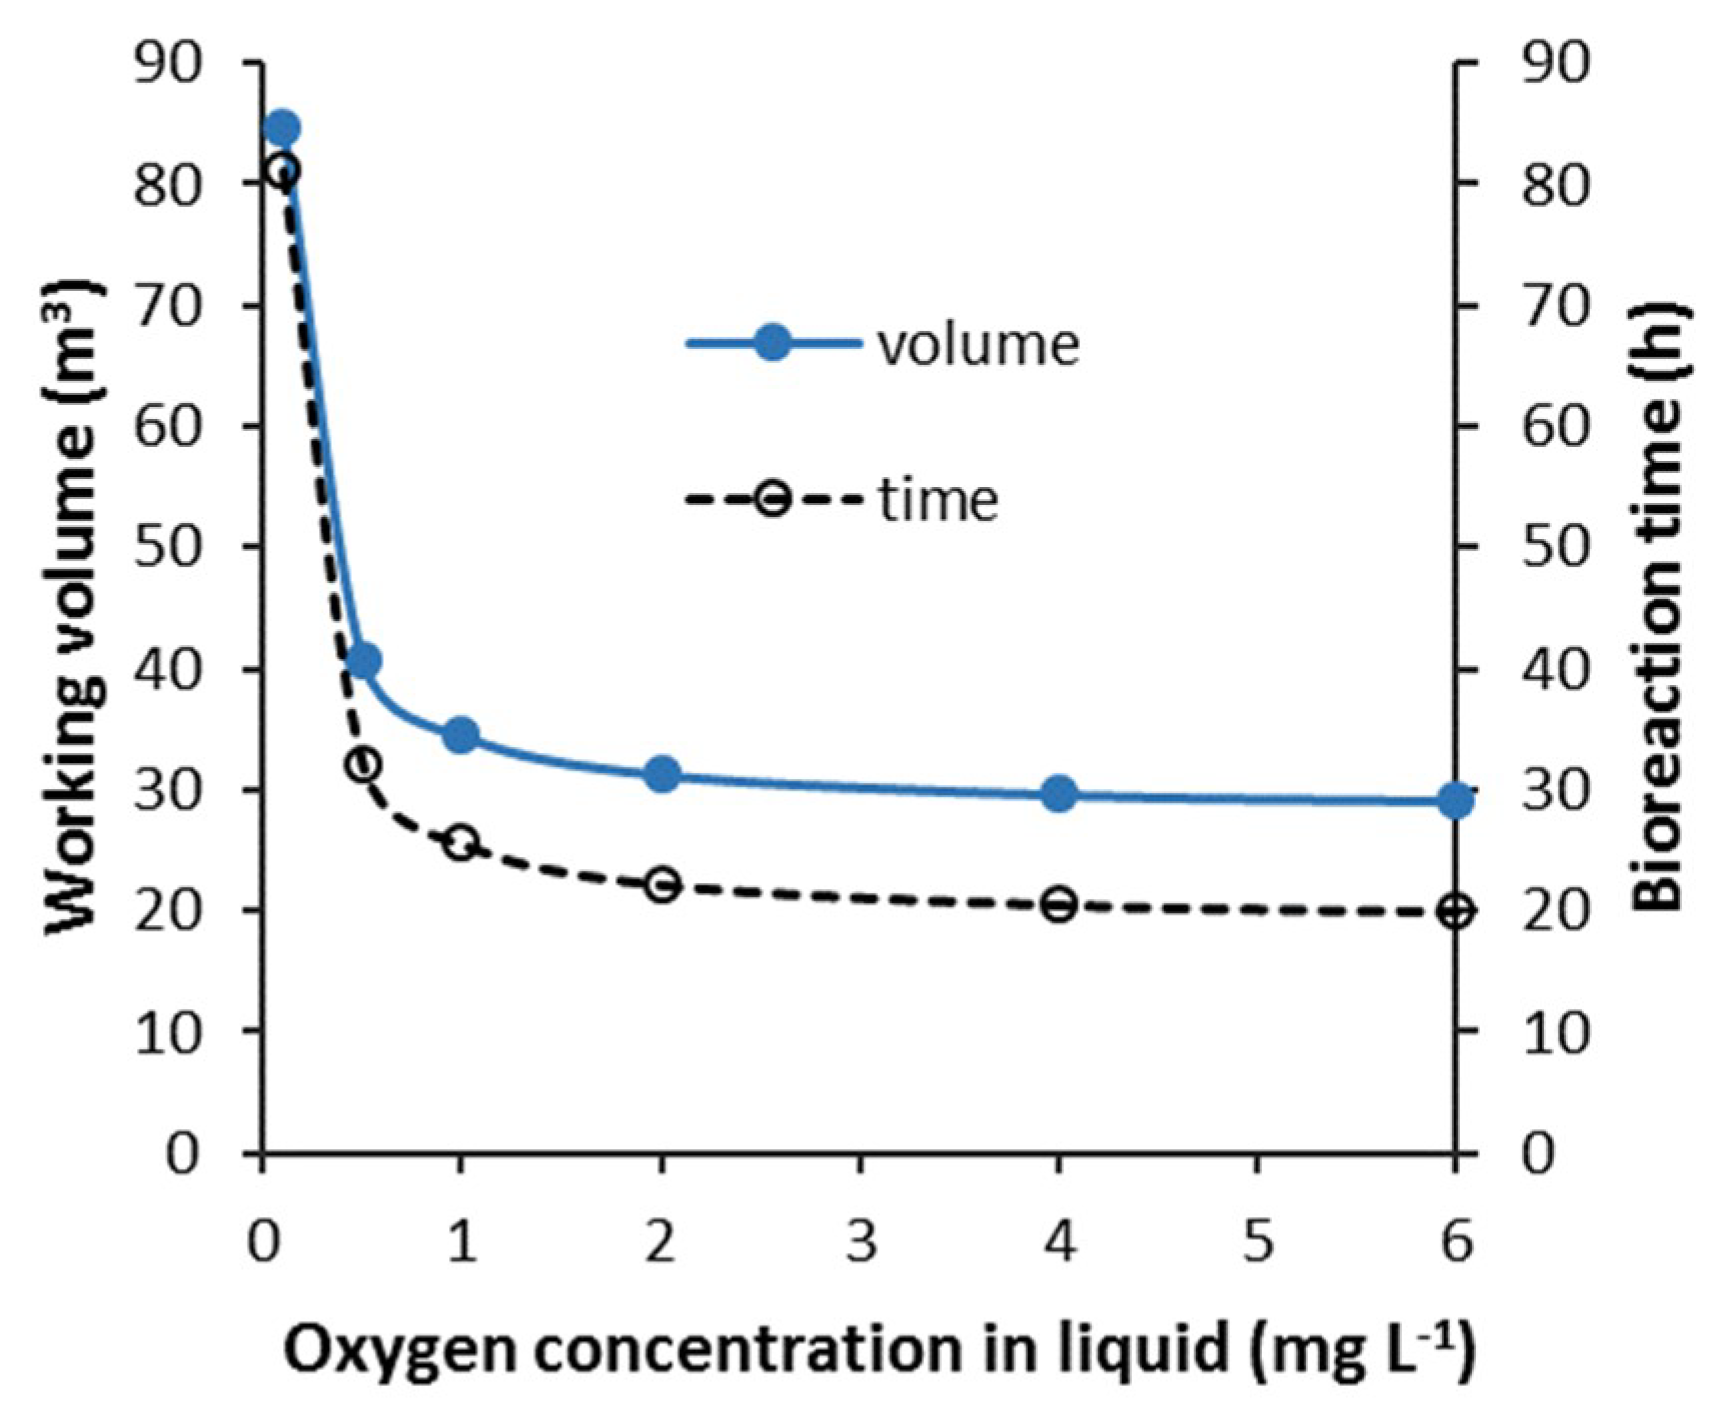
3.2.2. Batch
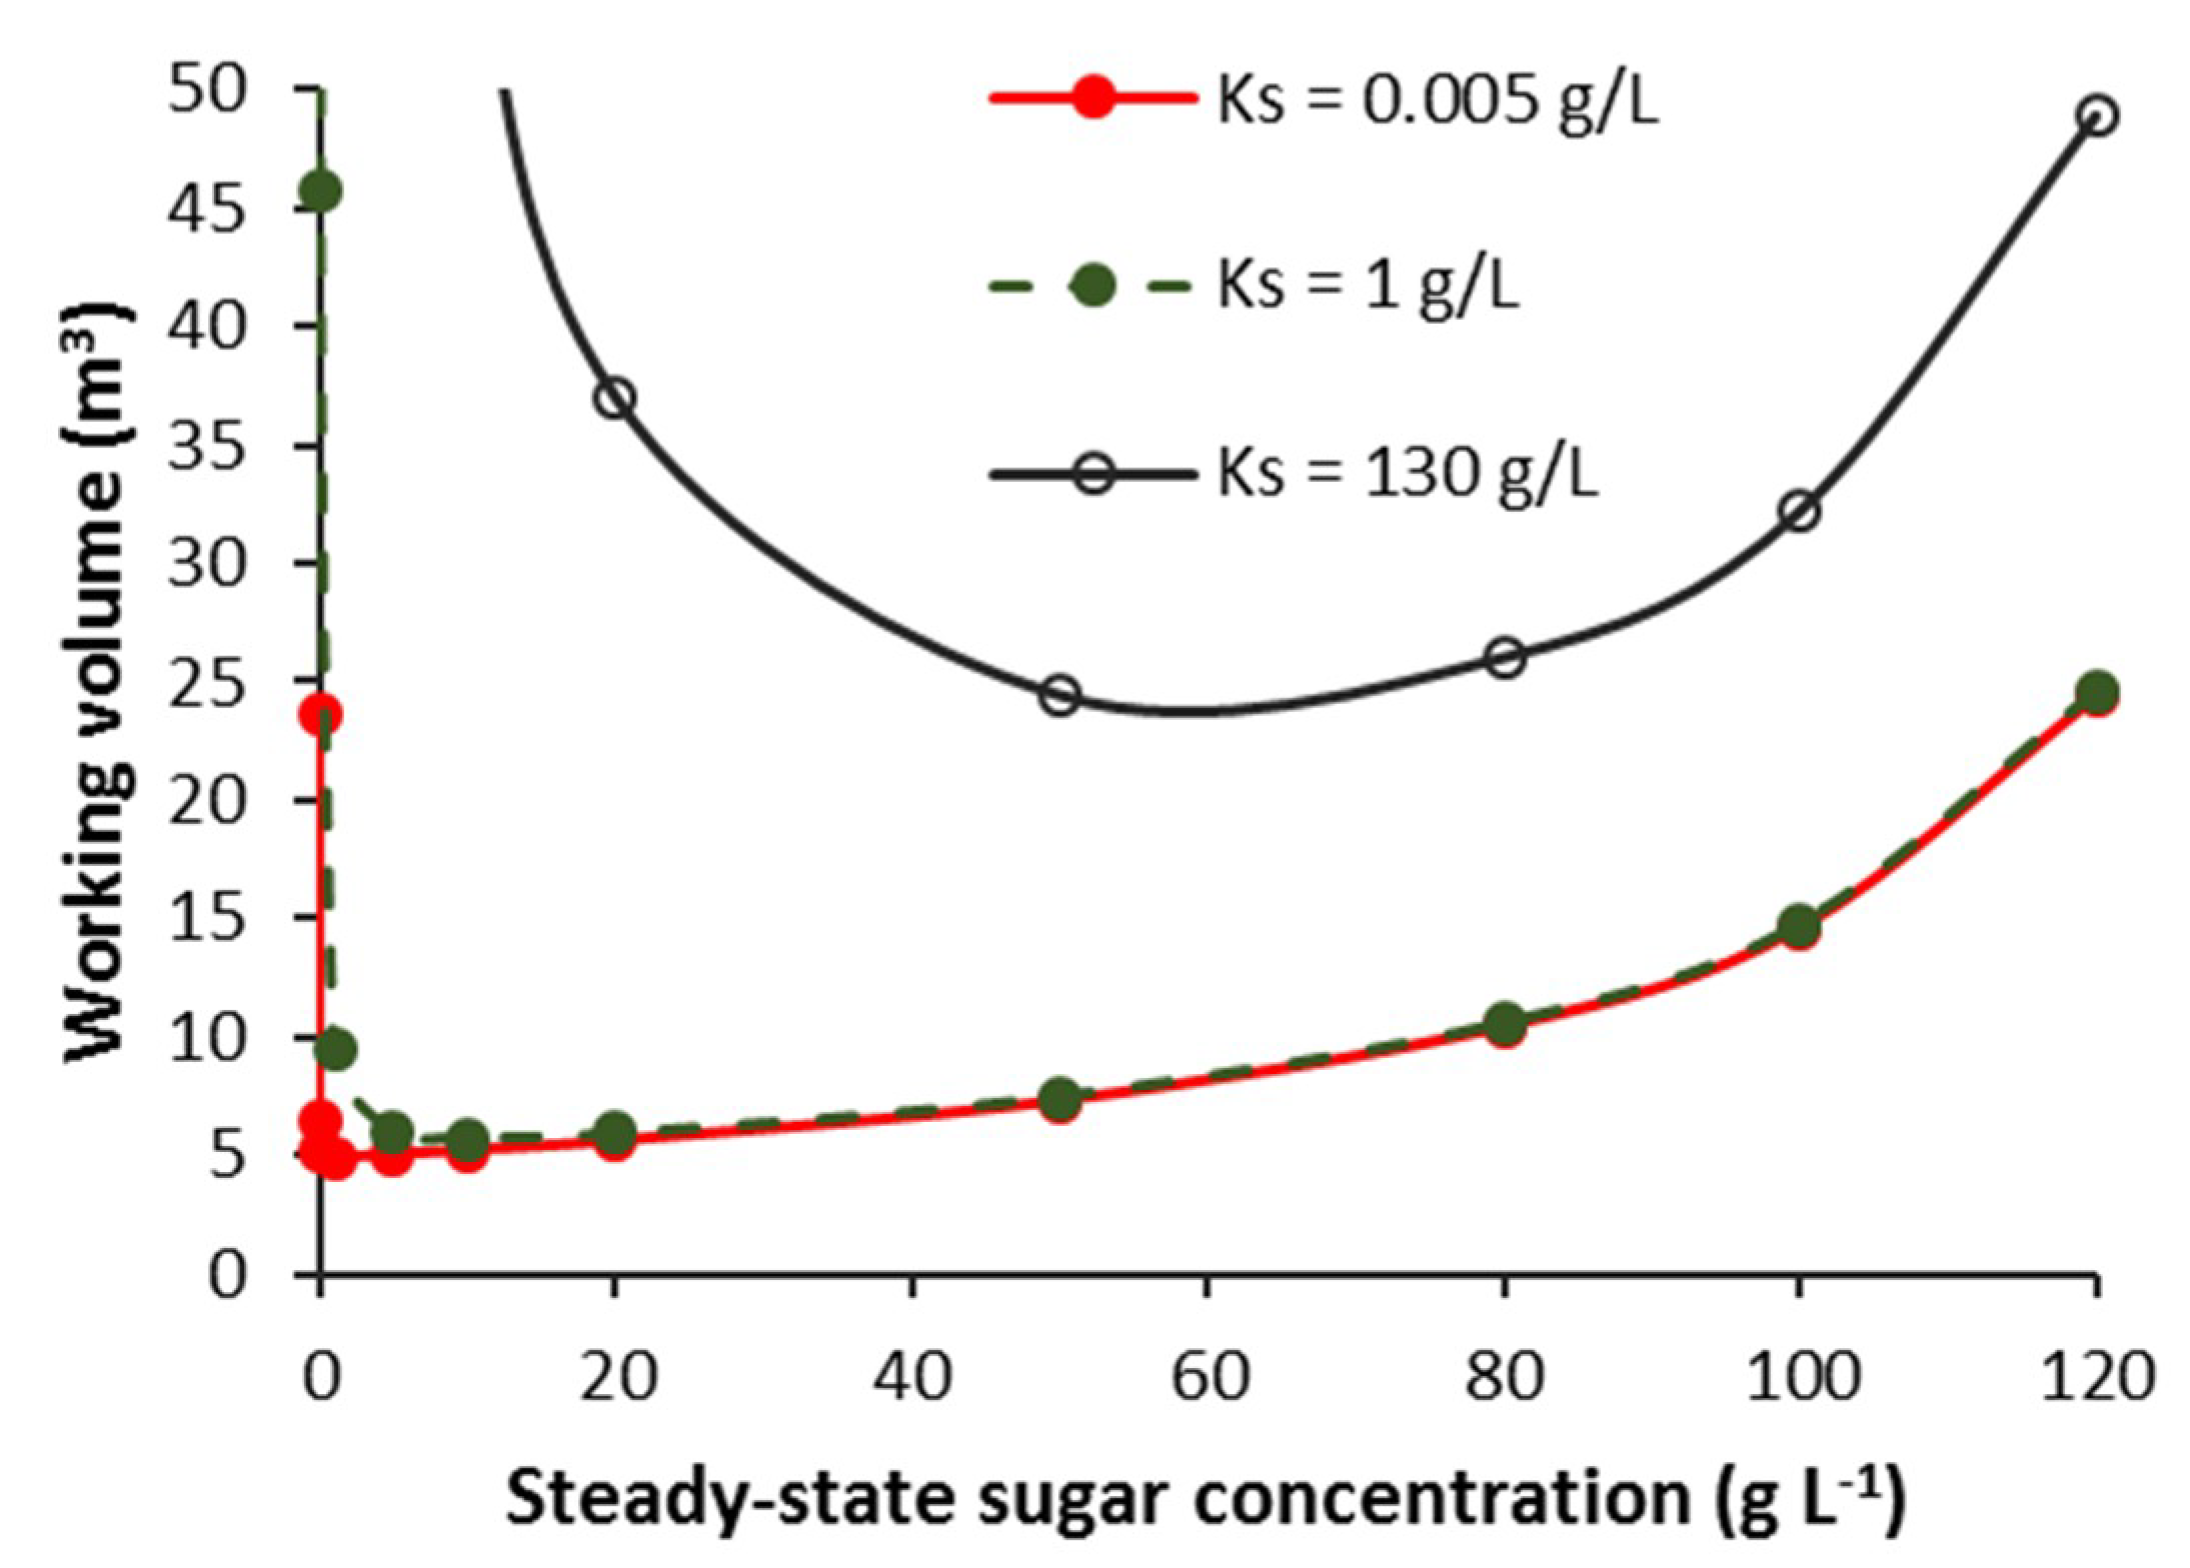
3.2.3. Effect of KS and Sugar Concentration
3.3. Electrical Power Requirement for Oxygen Transfer
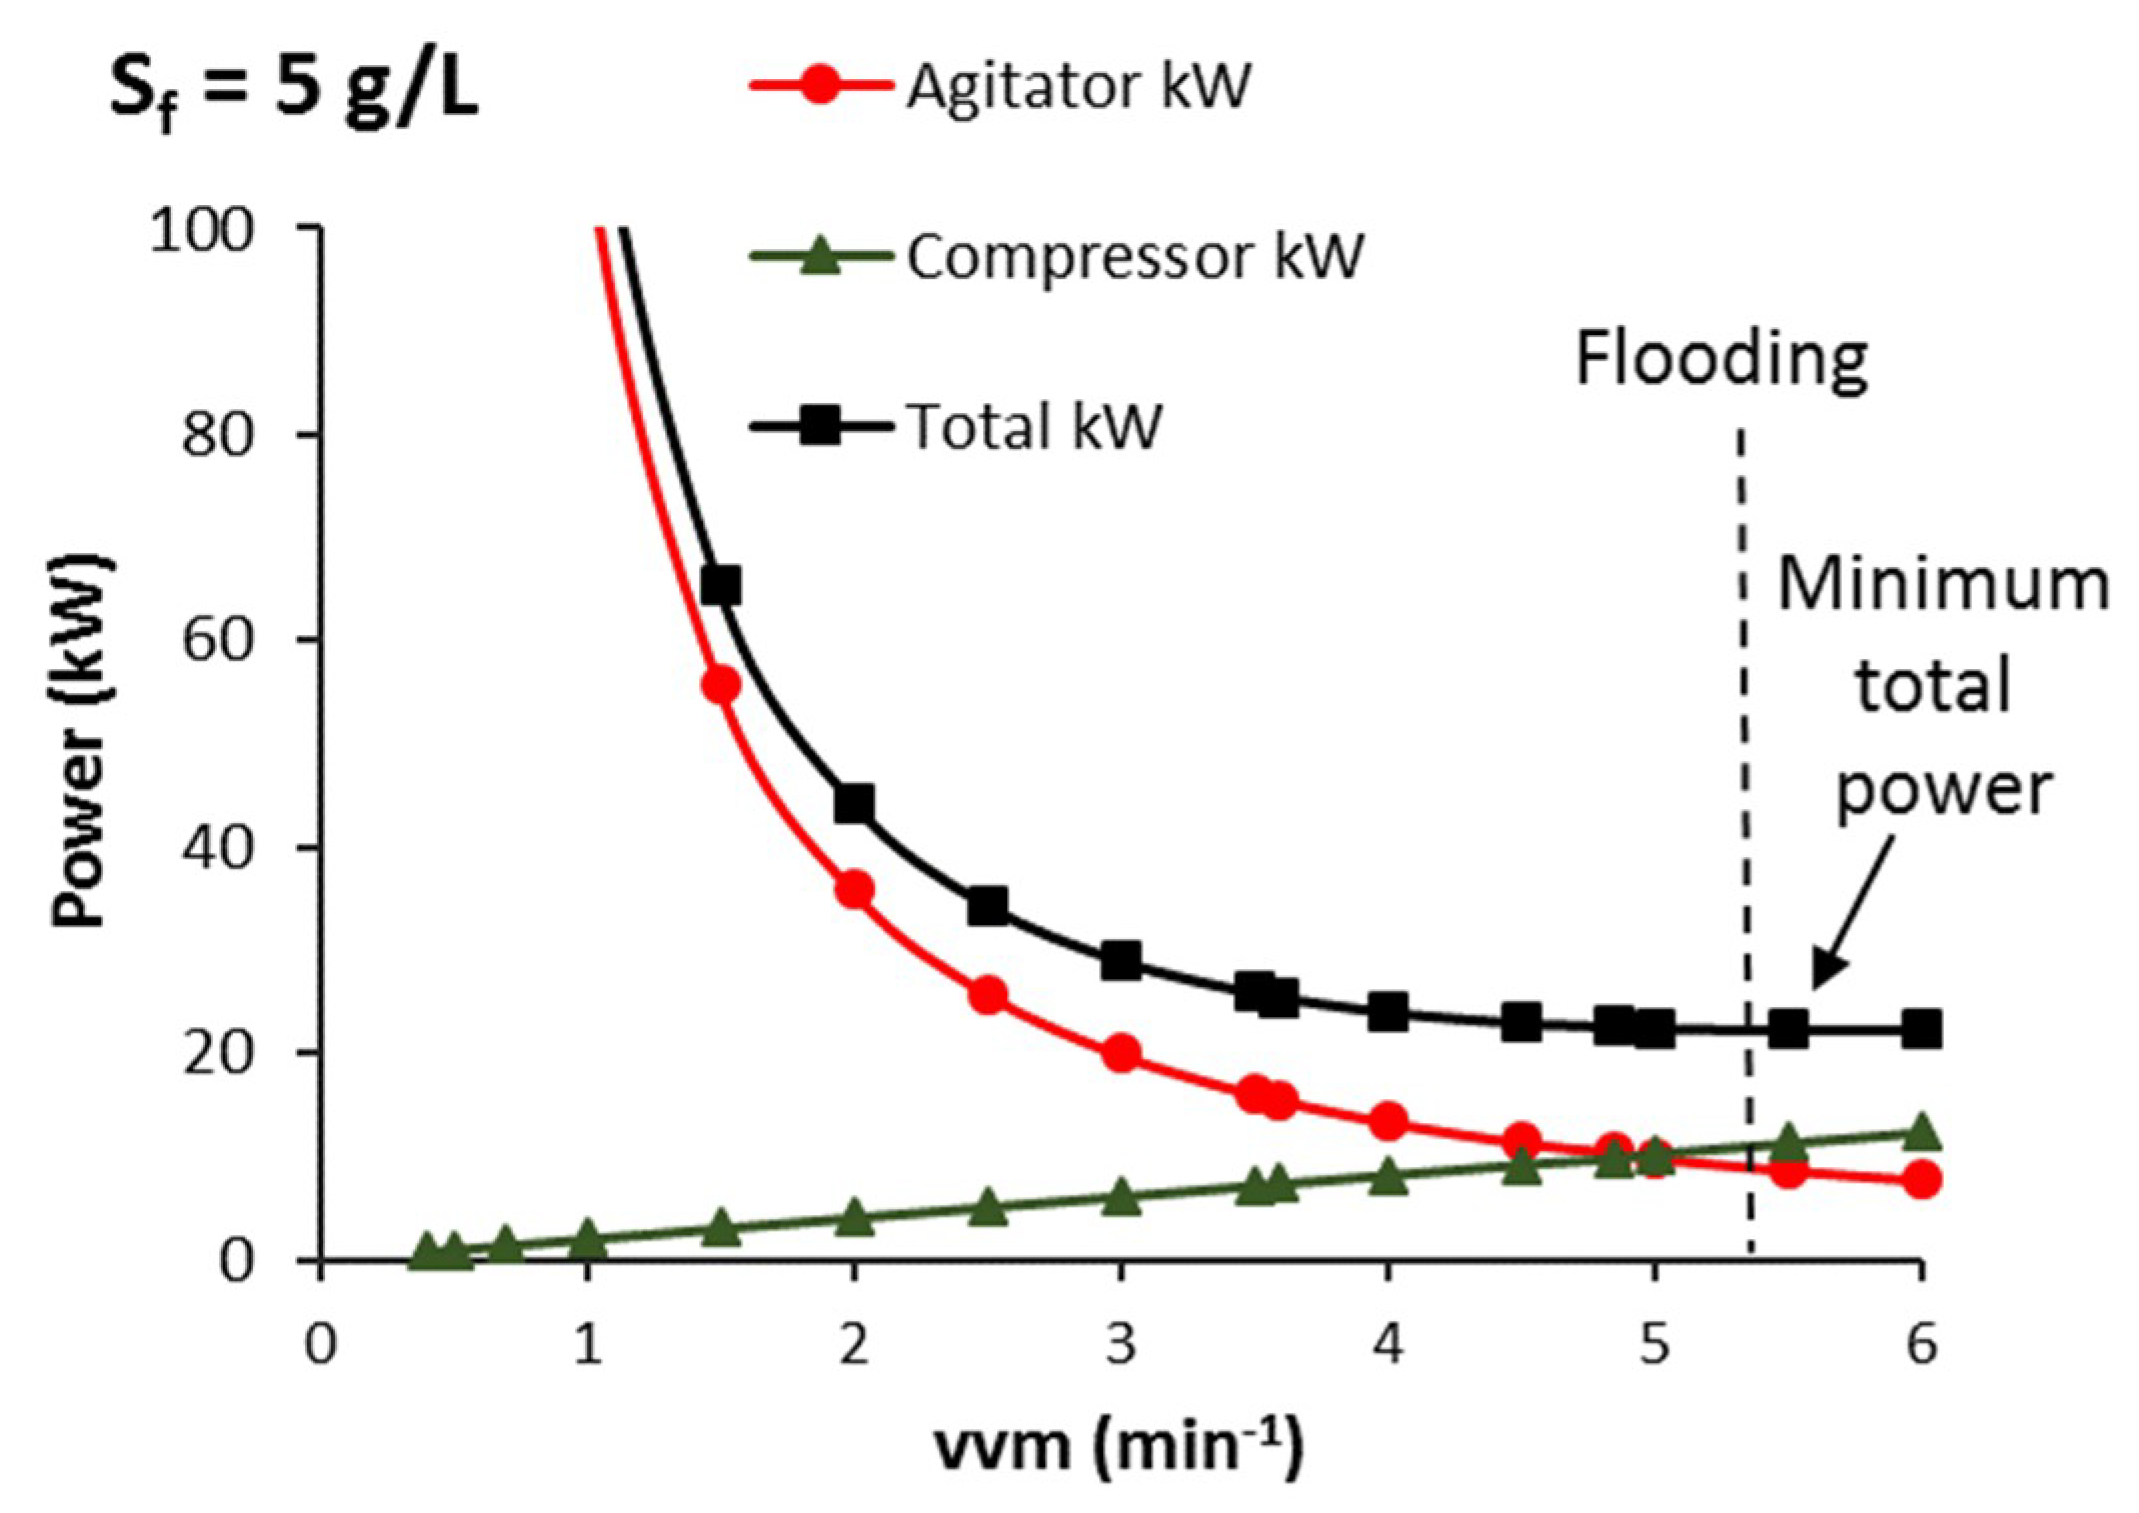
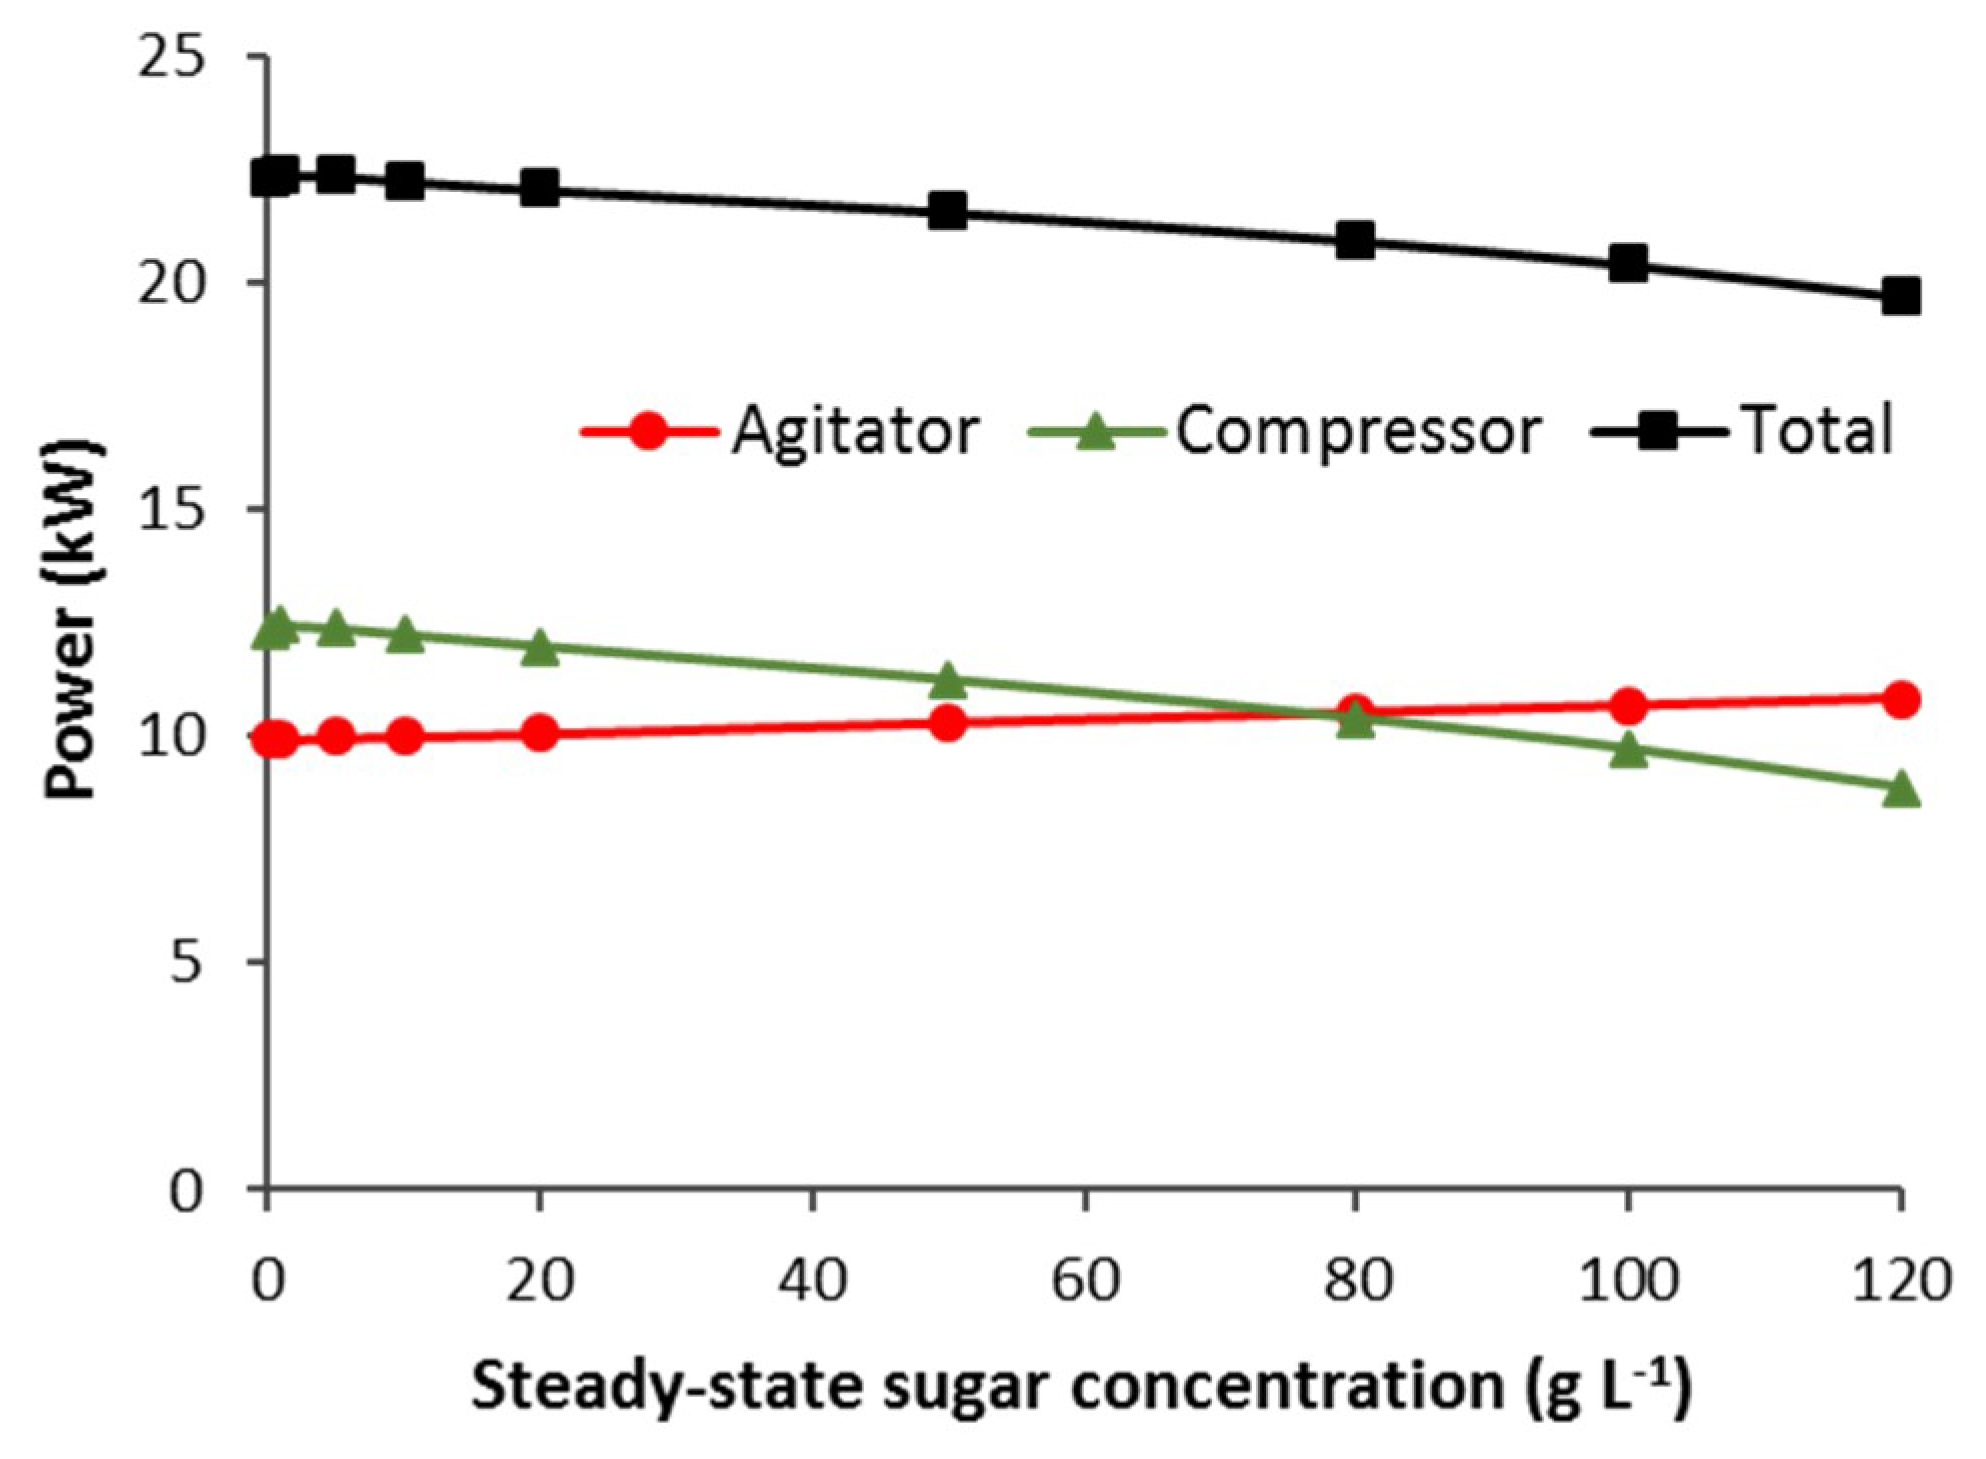
3.3.1. CSTB—Effect of vvm, Agitator Mechanical Power and Steady-State Sugar Substrate Concentration
3.3.2. CSTB—Agitator and Compressor Power Requirement that Minimises Total Electrical Power for Aeration
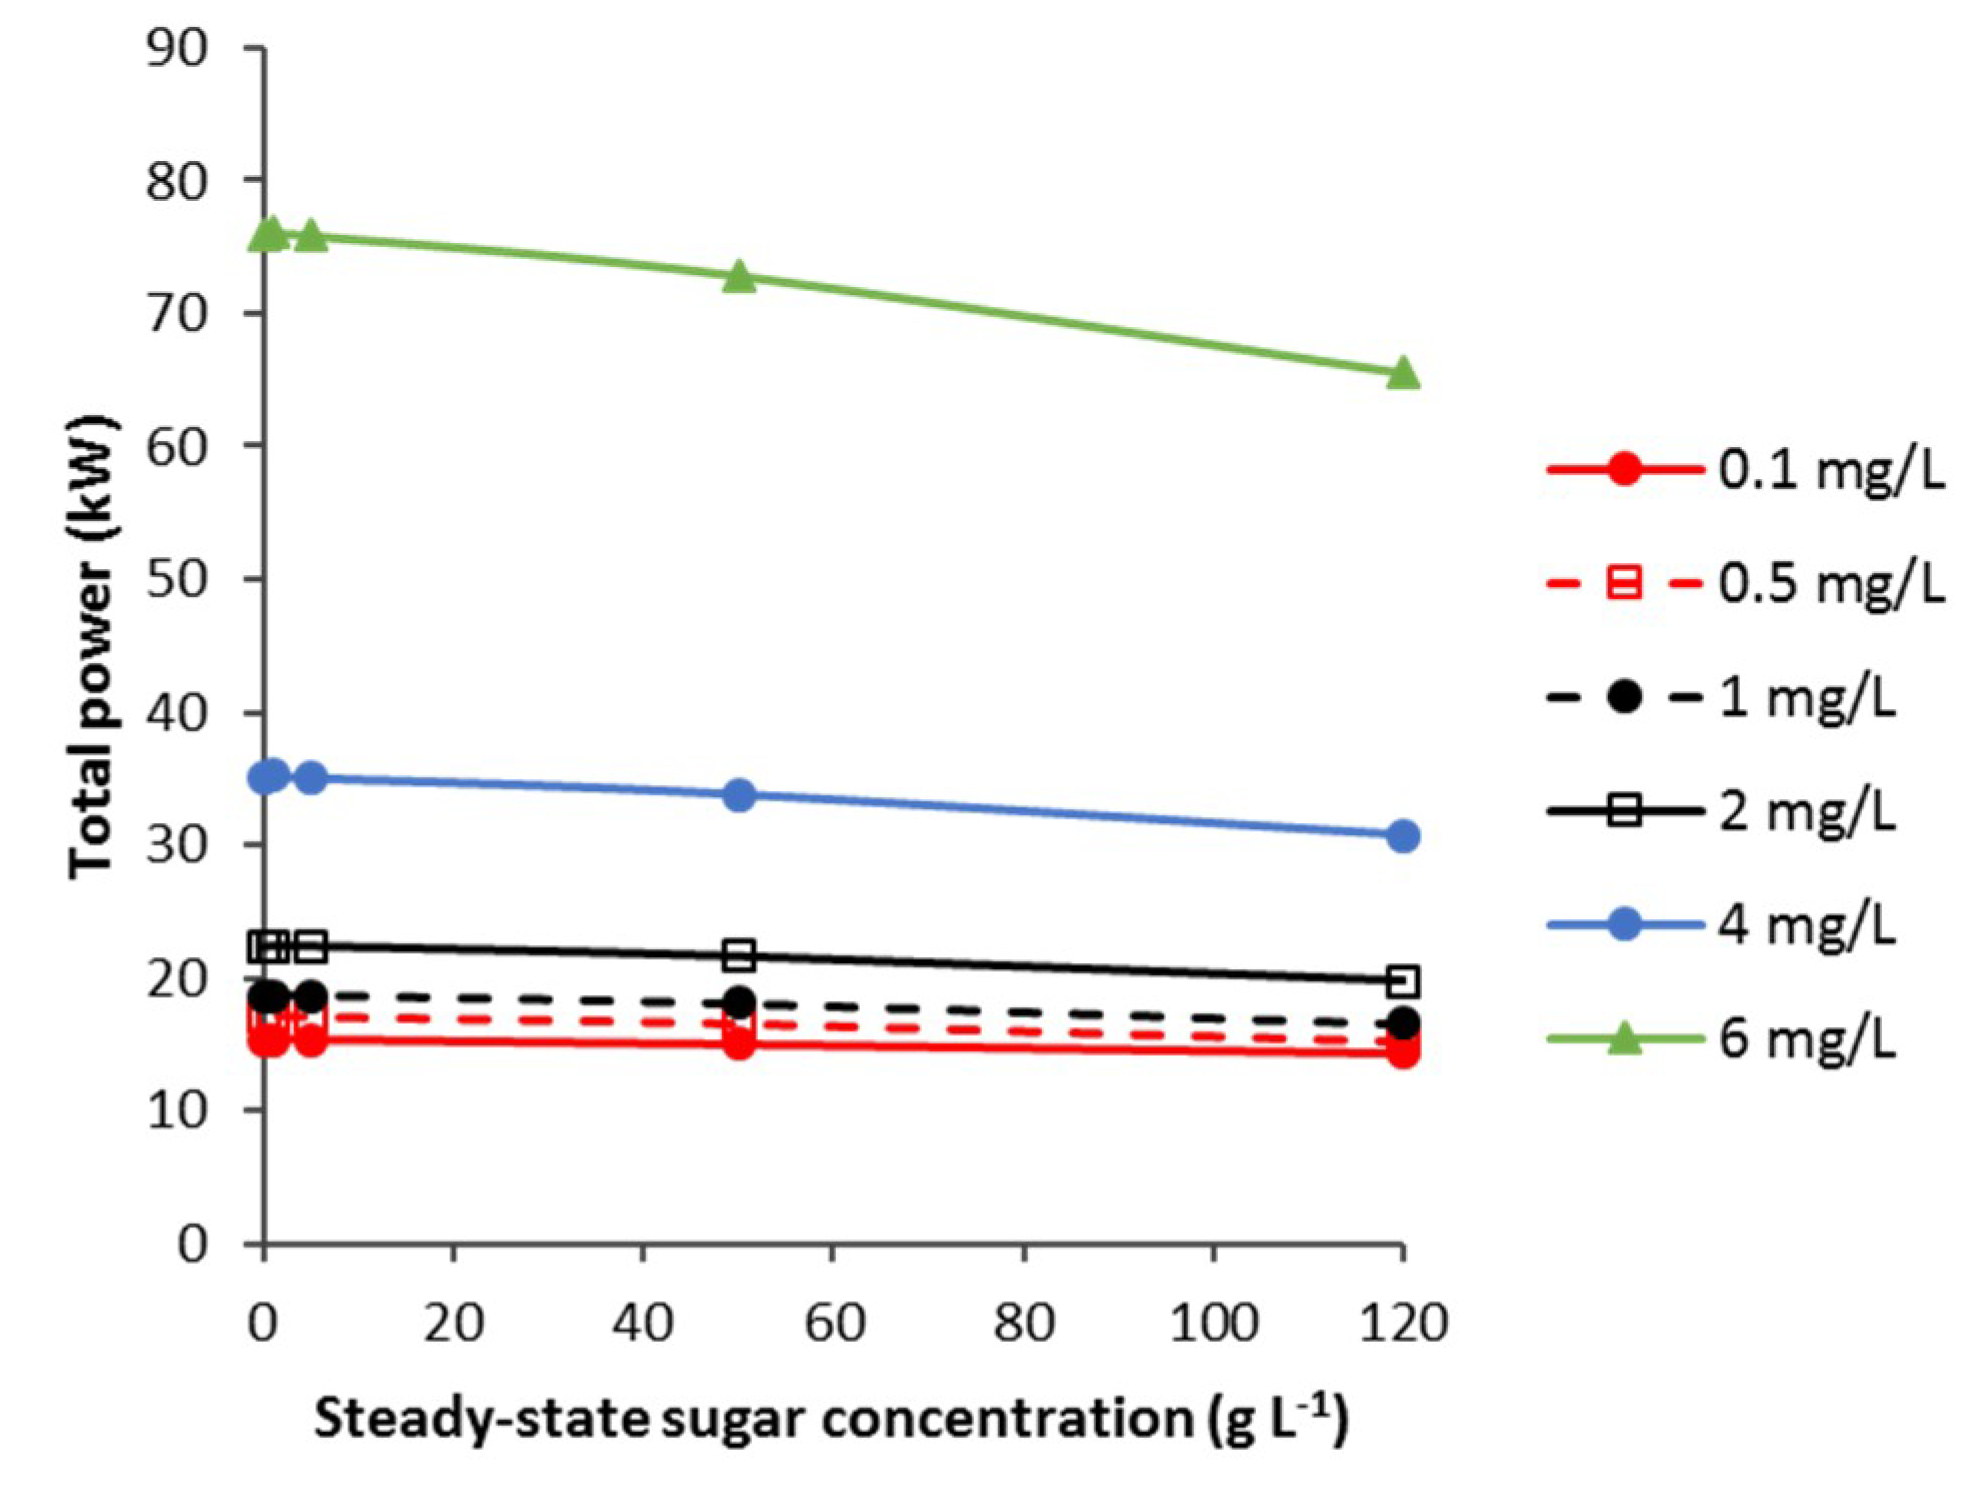
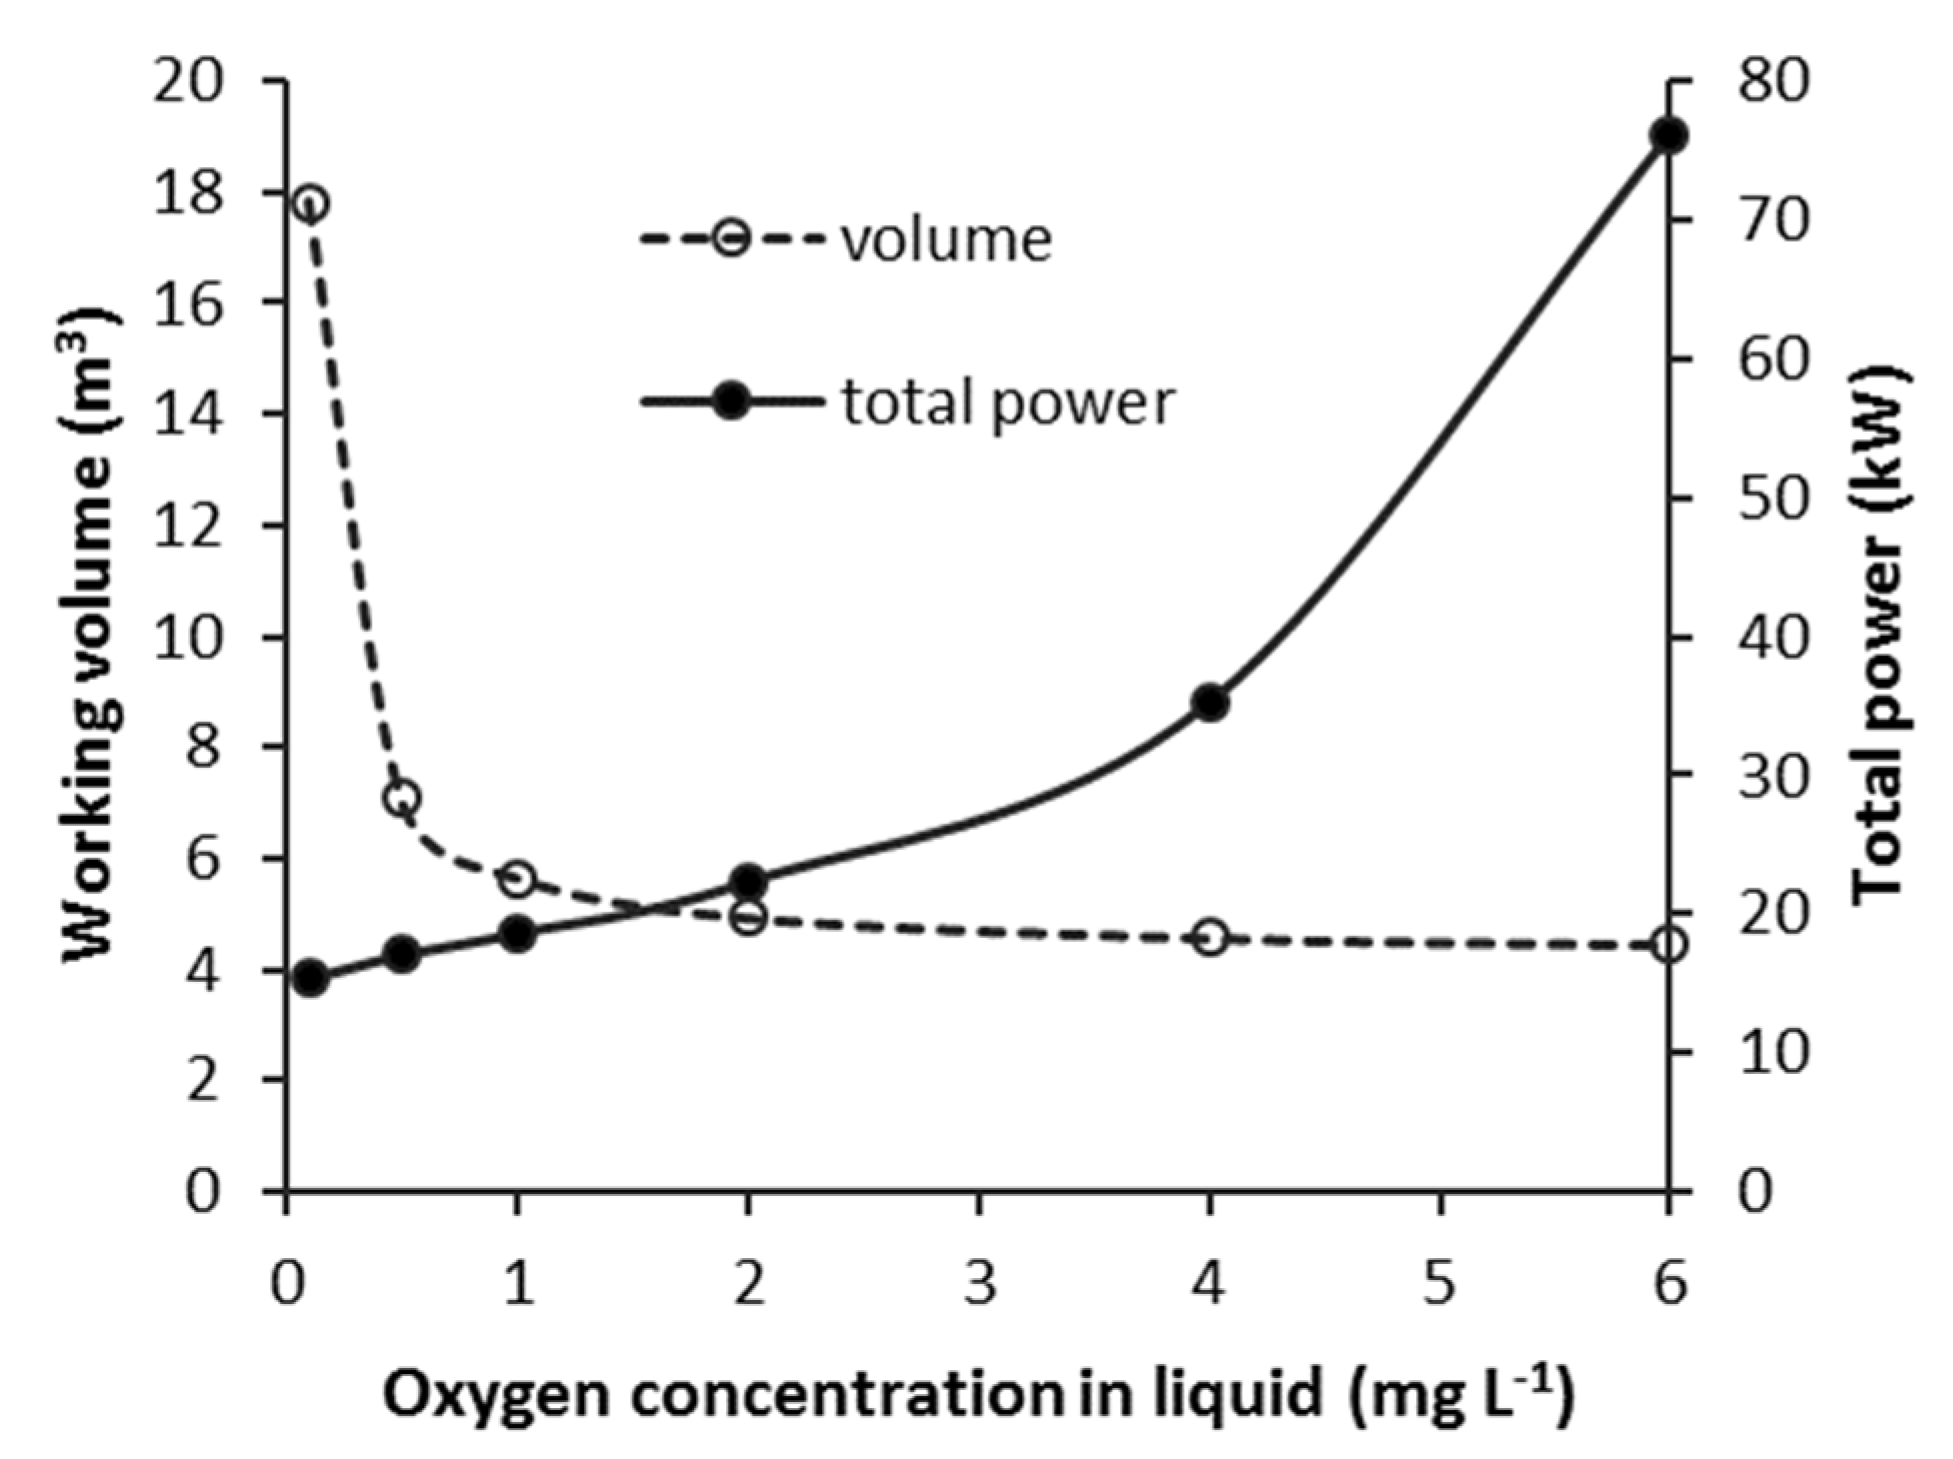
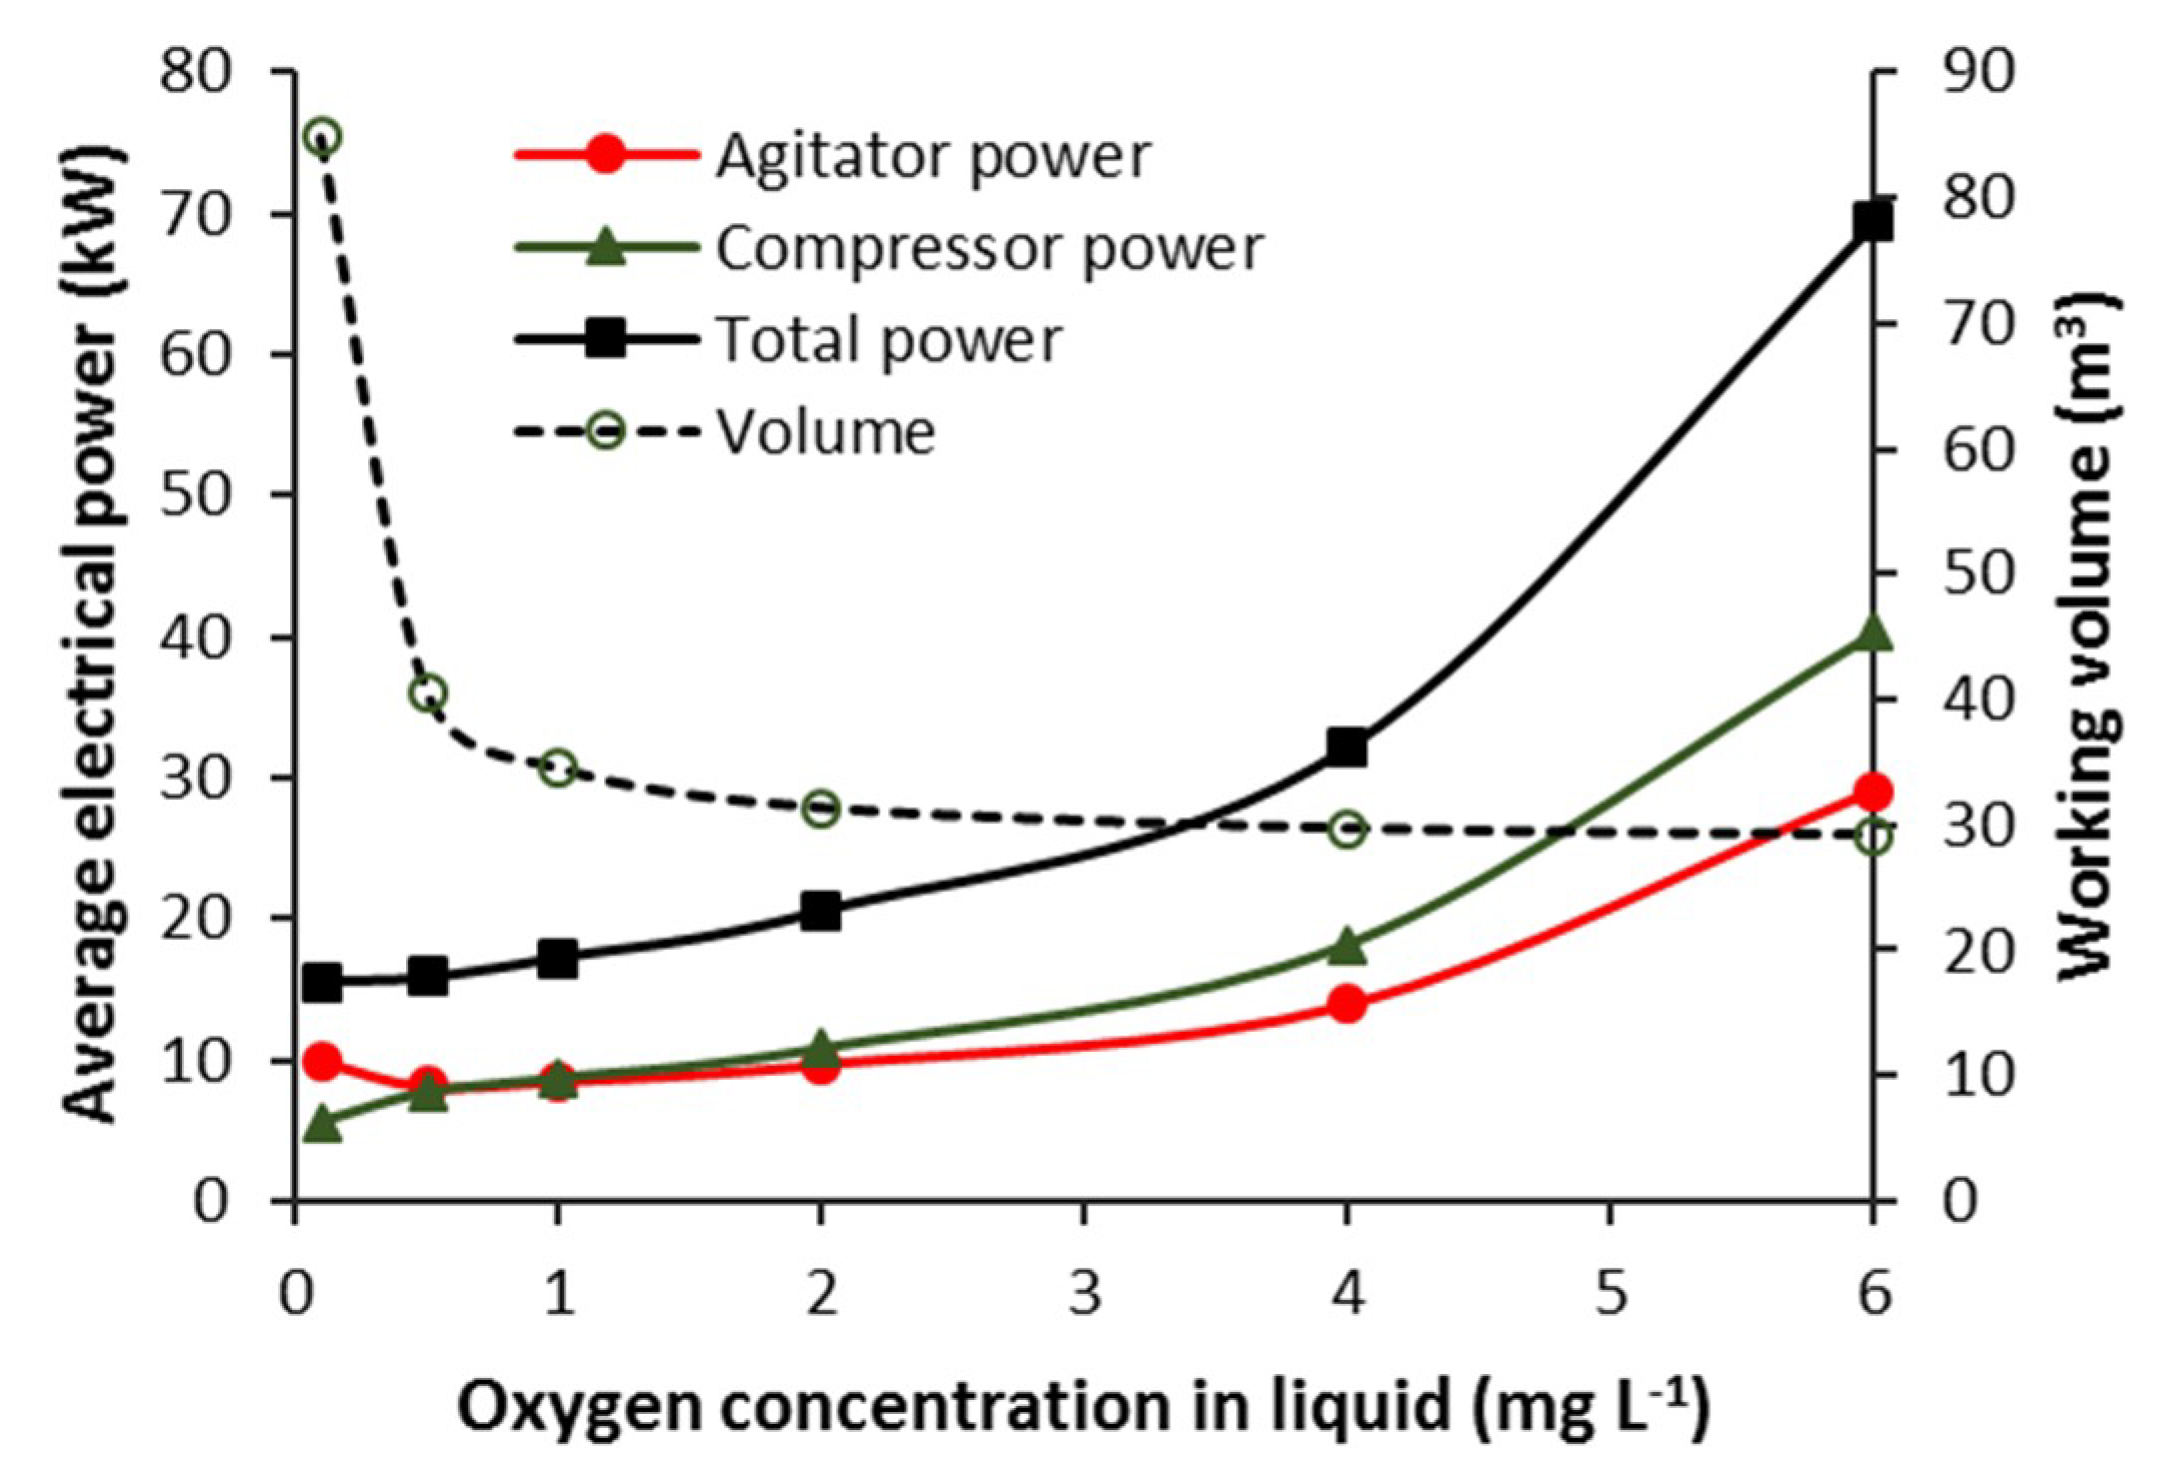
3.3.3. CSTB—Effect of Steady-State Oxygen Concentration (COL)
3.3.4. Batch—Agitator and Compressor Power Requirement
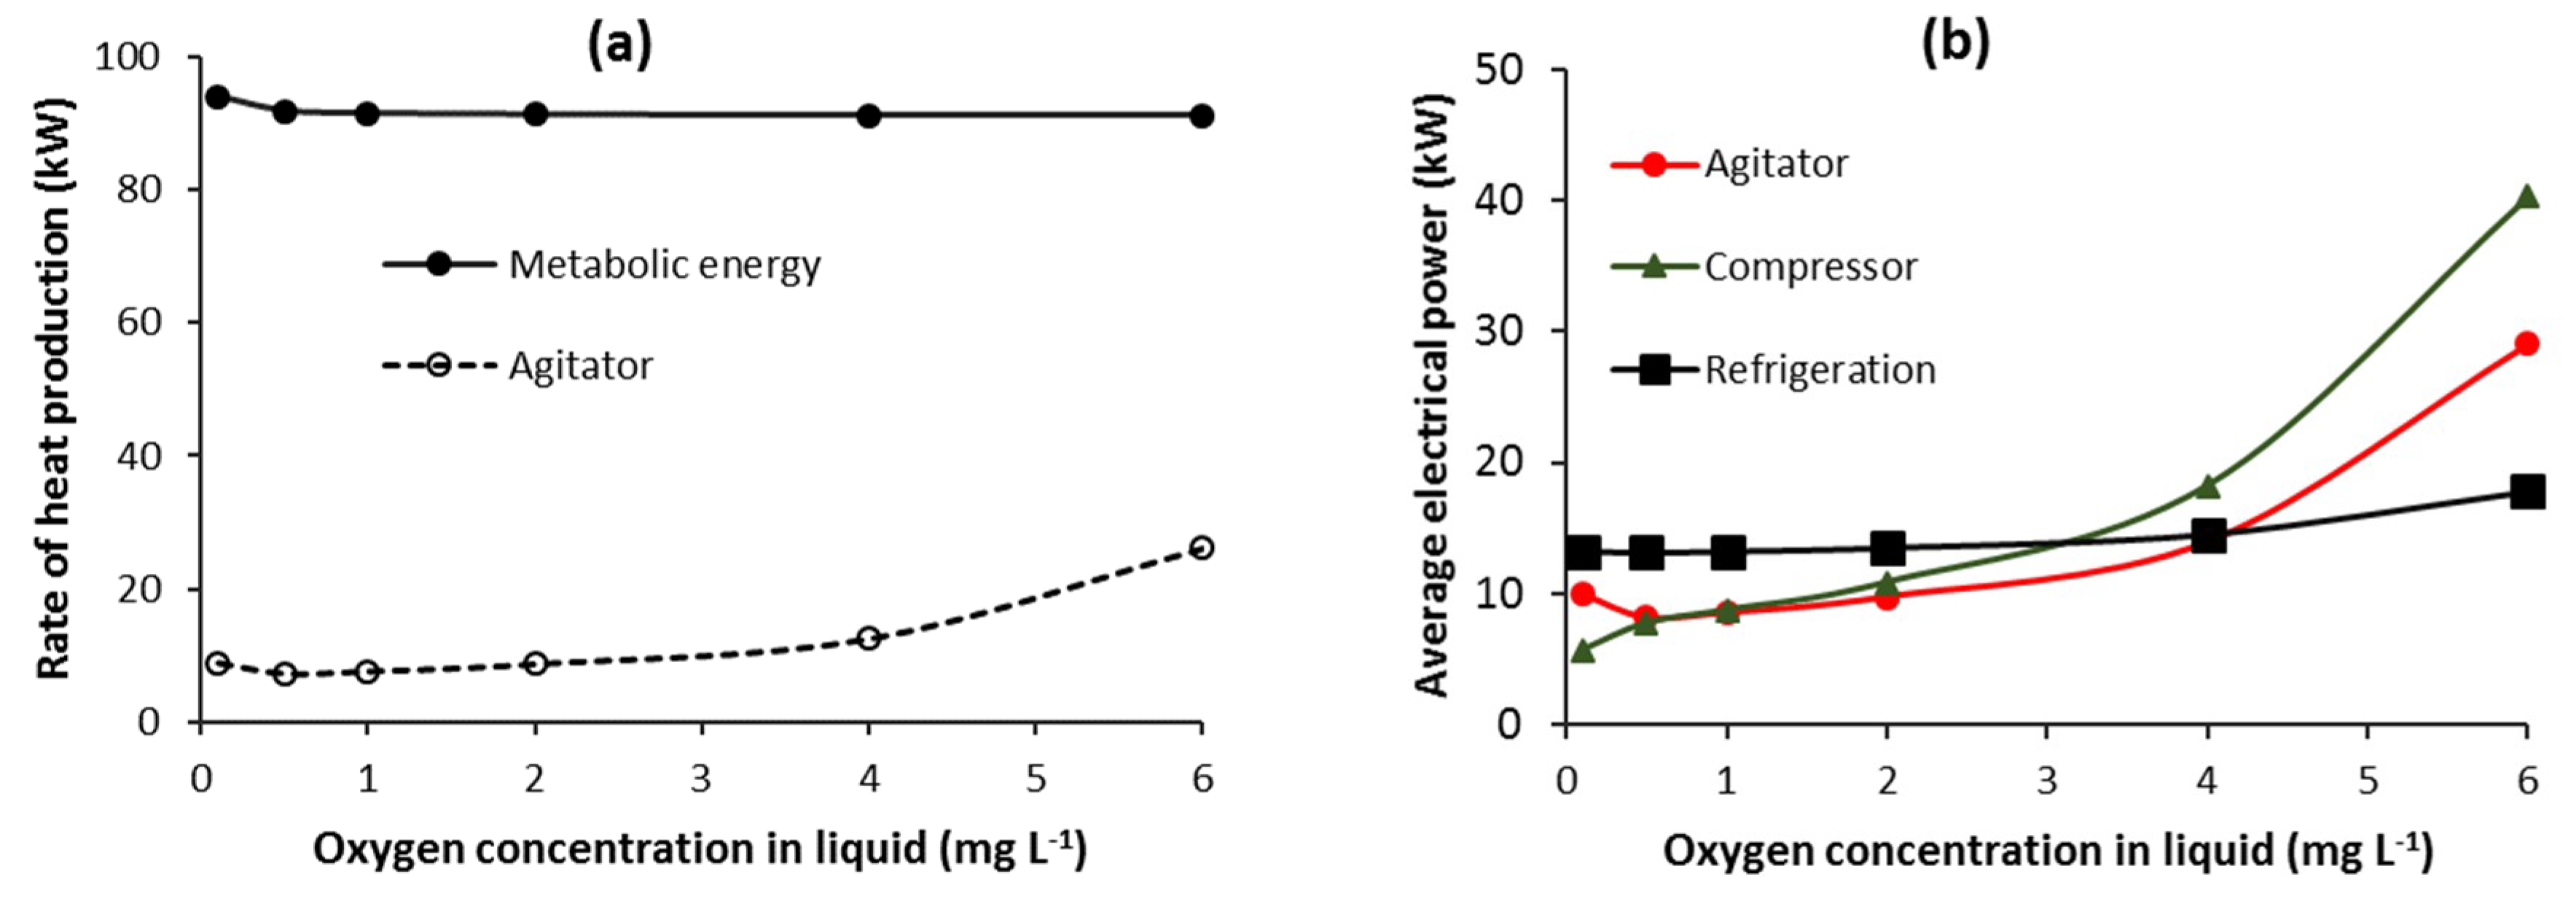
3.4. Refrigeration Electrical Power Requirement for Cooling
3.5. Process Design Optimisation/Trade-Offs and Comparison of Batch and CSTB
- Working volume of the bioreactor
- Amount of feed sugar required
- Amount of wasted or unutilised sugar leaving the bioreactor
- Electric energy requirement for oxygen transfer and cooling
- Greenhouse gas emissions associated with electric energy supply
- Cost
4. Conclusions
Funding
Conflicts of Interest
Abbreviations
| AT | cross-sectional area of bioreactor (m2) |
| COG | oxygen concentration in air bubble (mg L−1) |
| COGI | oxygen concentration in air entering bioreactor (mg L−1) |
| COGO | oxygen concentration in air leaving bioreactor (mg L−1) |
| COL | oxygen concentration in the bioreaction liquid (mg L−1) |
| CSTB | continuous stirred tank bioreactor |
| D | impeller diameter (m) |
| DR | dilution rate (h−1) |
| F | volumetric flowrate of feed entering bioreactor (m3 h−1) |
| FG | inlet air volumetric flowrate (m3 h−1) |
| FS0 | mass flowrate of sugar entering bioreactor (kg h−1) |
| FSW | mass flowrate of wasted sugar exiting bioreactor (kg h−1) |
| kLa | volumetric oxygen mass transfer coefficient (h−1) |
| KO | Monod kinetic constant for oxygen (g L−1) |
| KS | Monod kinetic constant for sugar (g L−1) |
| M | Henry’s Law constant |
| mS | specific maintenance coefficient (h−1) |
| N | agitator rotational speed (s−1) |
| NA | aeration number |
| NFr | Froude number |
| NP | agitator power number (ungassed) |
| NPG | agitator power number (gassed) |
| OUR | oxygen uptake rate (g L−1 h−1) |
| OTR | oxygen transfer rate (g L−1 h−1) |
| Pag | agitator mechanical power input in gassed bioreactor (kW) |
| Patm | atmospheric pressure (Pa) |
| Pb | product concentration in batch bioreactor when bioreaction is completed (g L−1) |
| PC | compressor mechanical power input (kW) |
| Pf | steady-state product concentration in CSTB (g L−1) |
| Pi | atmospheric pressure + static head in bioreactor (Pa) |
| P0 | concentration of any product in the feed (g L−1) |
| PR | product production rate (kg h−1) |
| Ptot | sum of compressor and agitator electrical power inputs (kW) |
| Sb | sugar concentration in batch bioreactor when bioreaction is completed (g L−1) |
| Sf | steady-state sugar concentration in CSTB (g L−1) |
| S0 | concentration of sugar in the feed (g L−1) |
| tb | bioreaction time in batch bioreactor (h) |
| td | down time between batches in batch operation (h) |
| T | bioreactor diameter (m) |
| VL | bioreactor working volume (m−3) |
| vs | air superficial velocity (m h−1) |
| vvm | volume of air per minute per unit bioreactor working volume (min−1) |
| Xf | steady-state cell concentration in CSTB (g L−1) |
| YXS | Yield coefficient for biomass (g dry cell weight per g sugar) |
| YPS | Yield coefficient for product (g product per g sugar) |
| α, β | bioreaction model kinetic constants |
| δ, Φ | OUR model constants |
| µ | specific growth rate (h−1) |
| µmax | maximum specific growth rate (h−1) |
| ηC | compressor isentropic efficiency |
| ηm | electric motor efficiency |
| ηr | refrigeration efficiency |
| γ | isentropic exponent of compression |
References
- Garcia-Ochoa, F.; Gomez, E. Bioreactor scale-up and oxygen transfer rate in microbial processes: An overview. Biotechnol. Adv. 2009, 27, 153–176. [Google Scholar] [CrossRef] [PubMed]
- Fitzpatrick, J.J.; Gloanec, F.; Michel, E.; Blondy, J.; Lauzeral, A. Application of mathematical modelling to reducing and minimising energy requirement for oxygen transfer in batch stirred tank bioreactors. Chemengineering 2019, 3, 14. [Google Scholar] [CrossRef]
- Benz, G.T. Optimize power consumption in aerobic fermenters. Chem. Eng. Pro. 2003, 99, 32–35. [Google Scholar]
- Benz, G.T. Cut agitator power costs. Chem. Eng. Pro. 2012, 108, 40–43. [Google Scholar]
- Oliveira, R.; Simutis, R.; Feyo de Azevedo, S. Design of a stable adaptive controller for driving aerobic fermentation processes near maximum oxygen transfer capacity. J. Process Control 2004, 14, 617–626. [Google Scholar] [CrossRef]
- Bandaiphet, C.; Prasertsan, P. Effect of aeration and agitation rates and scale-up on oxygen transfer coefficient, kLa in exopolysaccharide production from Enterobacter cloacae WD7. Carbohydr. Polym. 2006, 66, 216–228. [Google Scholar] [CrossRef]
- Hixson, A.W.; Caden, L.E. Oxygen transfer in submerged fermentation. Ind. Eng. Chem. 1950, 42, 1792–1801. [Google Scholar] [CrossRef]
- Badino, A.C.; De Almeida, P.I.F.; Cruz, A.J.G. Agitation and aeration an automated didactic experiment. Chem. Eng. Educ. 2004, 38, 100–107. [Google Scholar]
- Fayolle, Y.; Cockx, A.; Gillot, S.; Roustan, M.; Héduit, A. Oxygen transfer prediction in aeration tanks using CFD. Chem. Eng. Sci. 2007, 62, 7163–7171. [Google Scholar] [CrossRef]
- Gill, N.K.; Appleton, M.; Baganz, F.; Lye, G.J. Quantification of power consumption and oxygen transfer characteristics of a stirred miniature bioreactor for predictive fermentation scale-up. Biotechnol. Bioeng. 2008, 100, 1144–1155. [Google Scholar] [CrossRef]
- Benz, G.T. Piloting bioreactors for agitation scale-up. CEP 2008, 104, 32–34. [Google Scholar]
- Benz, G.T. Why conduct pilot studies for agitated gas-liquid mass transfer. Pharm. Eng. 2013, 33, 1–3. [Google Scholar]
- Kouda, T.; Yano, H.; Yoshinaga, F. Effect of agitator configuration on bacterial cellulose productivity in aerated and agitated culture. J. Ferment. Bioeng. 1997, 83, 371–376. [Google Scholar] [CrossRef]
- Amanullah, A.; Tuttiett, B.; Nienow, A.W. Agitator speed and dissolved oxygen effects in xanthan fermentations. Biotech. Bioeng. 1998, 57, 198–210. [Google Scholar] [CrossRef]
- Benz, G.T. Sizing impellers for agitated aerobic fermenters. Chem. Eng. Prog. 2004, 100, 18S–20S. [Google Scholar]
- Karimi, A.; Golbabaei, F.; Reza Mehrnia, M.; Neghab, M.; Kazem, M.; Nikpey, A.; Reza Pourmand, M. Oxygen mass transfer in a stirred tank bioreactor using different impeller configurations for environmental purposes. J. Environ. Health Sci. Eng. 2013, 10, 6. [Google Scholar] [CrossRef] [PubMed]
- Himmelsbach, W.; Keller, W.; Lovallo, M.; Grebe, T.; Houlton, D. Increase productivity through better gas-liquid mixing. Chem. Eng. 2007, 10, 50–58. [Google Scholar]
- Bakker, A.; Smith, J.M.; Meyers, K.J. How to disperse gases in liquids. Chem. Eng. 1994, 12, 98–104. [Google Scholar]
- Alves, S.S.; Vasconcelos, J.M.T. Optimisation of agitation and aeration in fermenters. Bioprocess Eng. 1996, 14, 119–123. [Google Scholar] [CrossRef]
- Kreyenschulte, D.; Emde, F.; Regestein, L.; Büch, J. Computational minimization of the specific energy demand of large-scale aerobic fermentation processes based on small-scale data. Chem. Eng. Sci. 2016, 153, 270–283. [Google Scholar] [CrossRef]
- Van’t Riet, K.; Tramper, J. Basic Bioreactor Design; Marcel Dekker Inc.: New York, NY, USA, 1991. [Google Scholar]
- Znad, H.; Blazej, M.; Bales, V.; Markos, J. A kinetic model for gluconic acid production by Aspergillus niger. Chem. Pap. 2004, 58, 23–28. [Google Scholar]
- Liu, J.Z.; Weng, L.; Zhang, Q.; Xu, H.; Ji, L. A mathematical model for gluconic acid fermentation by Aspergillus niger. Biochem. Eng. J. 2003, 14, 137–141. [Google Scholar] [CrossRef]
- Crueger, W.; Crueger, A. 1982. Biotechnology: A Textbook of Industrial Microbiology; Sinauer Associate: Massachusetts, MA, USA, 1982. [Google Scholar]
- Merchuk, J.C.; Asenjo, J.A. The Monod equation and mass transfer. Biotech. Bioeng. 1995, 45, 91–94. [Google Scholar] [CrossRef] [PubMed]
- Beyenal, H.; Chen, S.N.; Lewandowski, Z. The double substrate growth kinetics of Pseudomonas aeruginosa. Enzyme Microb. Technol. 2003, 32, 92–98. [Google Scholar] [CrossRef]
- Slininger, P.J.; Branstrator, L.E.; Bothast, R.J.; Okost, M.R.; Ladisch, M.R. Growth, Death, and Oxygen Uptake Kinetics of Pichia stipitis on Xylose. Biotech. Bioeng. 1991, 37, 973–980. [Google Scholar] [CrossRef] [PubMed]
- Garcia-Ochoa, F.; Gomez, E.; Santos, V.E.; Merchuk, J.C. Oxygen uptake rate in microbial processes: An overview. Biochem. Eng. J. 2010, 49, 289–307. [Google Scholar] [CrossRef]
- van’t Riet, K. Review of measuring methods and results in non-viscous gas-liquid mass transfer in stirred vessels. Ind. Eng. Chem. Process Des. Dev. 1979, 18, 357–364. [Google Scholar] [CrossRef]
- Fitzpatrick, J.J.; Gonçalves de Lima, K.; Keller, E. Application of mathematical modelling for investigating oxygen transfer energy requirement and process design of an aerobic continuous stirred tank fermenter. Food Bioprod. Process. 2017, 103, 39–48. [Google Scholar] [CrossRef]


| μmax (h−1) | KS (g·L−1) | KO (g·L−1) | α | β (h−1) | YXS | YPS | mS (h−1) |
|---|---|---|---|---|---|---|---|
| 0.25 | 0.005 | 0.000363 | 2.9220 | 0.1314 | 0.55 | 1 | 0.025 |
© 2019 by the author. Licensee MDPI, Basel, Switzerland. This article is an open access article distributed under the terms and conditions of the Creative Commons Attribution (CC BY) license (http://creativecommons.org/licenses/by/4.0/).
Share and Cite
Fitzpatrick, J.J. Insights from Mathematical Modelling into Energy Requirement and Process Design of Continuous and Batch Stirred Tank Aerobic Bioreactors. ChemEngineering 2019, 3, 65. https://doi.org/10.3390/chemengineering3030065
Fitzpatrick JJ. Insights from Mathematical Modelling into Energy Requirement and Process Design of Continuous and Batch Stirred Tank Aerobic Bioreactors. ChemEngineering. 2019; 3(3):65. https://doi.org/10.3390/chemengineering3030065
Chicago/Turabian StyleFitzpatrick, John J. 2019. "Insights from Mathematical Modelling into Energy Requirement and Process Design of Continuous and Batch Stirred Tank Aerobic Bioreactors" ChemEngineering 3, no. 3: 65. https://doi.org/10.3390/chemengineering3030065