Abstract
This study investigates the synthesis of [Ni0.80Co0.15](1−x)/0.95Alx(OH)2 (x = 0–0.2) materials by coprecipitation to understand the formation of layered double hydroxide (LDH) phases as influenced by Al content and synthesis route. Two routes were compared: the first method dissolved all the metal reagents into one solution before addition into the reaction vessel, while the second dissolved Al into a separate NaOH solution before simultaneous addition of the Ni/Co and Al solutions into the reaction vessel. The synthesized materials were characterized by Scanning Electron Microscopy, X-ray Diffraction, Inductively Coupled Plasma-Optical Emissions Spectroscopy and Thermogravimetric Analysis to understand the formation of LDH phases as influenced by Al content and synthesis method. It was found that as Al content increased, the amount of LDH phase present increased as well. No significant difference in LDH phase presence was observed for the two synthesis methods, but the morphologies of the particles were different. The method containing all the metals in one solution produced small particles, likely due to the continuous nucleation of Al(OH)3 disrupting particle growth. The method containing the separate Al in NaOH solution matched the morphology of the material with no Al, which is known to form desired large spherical particles under continuously stirring tank reactor synthesis conditions.
1. Introduction
Lithium ion battery positive electrode materials such as nickel-rich LiNi1−x−yMnxCoyO2 (NMC) and LiNi1−x−yCoxAlyO2 (NCA) have been gaining attention as more energy intensive applications, like electric vehicles, become increasingly widespread. Compared to the conventional LiCoO2 (LCO) material, NMC materials have lower cost, increased lifetime and increased safety [1,2,3,4,5,6,7]. NCA materials allow for very high energy density Li-ion cells with the potential for even lower cobalt content [3,4,5,6,7,8,9].
A common first step to synthesizing NMC, NCA and other lithium mixed metal oxides is coprecipitation to produce hydroxide precursor materials. This step produces materials that are atomically mixed in the form of M(OH)2 (M = divalent transition metals) before sintering with a lithium compound to make the electrode material. The syntheses of these precursor materials are well understood if the transition metals are divalent in the precursor hydroxide, such as in NMC precursors [10,11,12]. However, the introduction of Al for Al-doped materials such as NCA complicates the synthesis of hydroxide precursors and affects the products significantly. Since Al is trivalent in the hydroxide, an extra anion needs to be incorporated into the layered M(OH)2 structure in order to balance the charge, resulting in the formation of a new layered double hydroxide (LDH) phase [13,14,15,16,17]. Like Al-doped NMC [13] or LCO [14] precursors, it is expected that the amount of LDH phase present in the material increases as the Al content increases, but there have been few studies confirming this [17].
There are few reports of LDH materials in positive electrode material research for lithium ion batteries. Most of the focus of research on LDH materials for energy storage has been on supercapacitors [15,18,19,20,21,22,23] or as the negative electrode in lithium ion batteries [15,23,24]. In fact, the literature on NCA has generally avoided reporting about LDH in the precursor in detail. Experimental methods in the literature on NCA materials syntheses often omit precursor characterization [25,26,27,28,29,30,31] or use commercially supplied precursors [32,33,34,35]. Where precursor characterization was reported, there was generally very little discussion as to the presence, formation or removal of the LDH phase [16,17,36,37,38,39,40,41]. Our recent work was focused on the removal of the LDH phase and helped shed some light on this topic [17].
Another issue with the synthesis of NCA precursor materials is the morphology of the product. Ammonia is commonly used as a chelating agent to achieve a desired morphology during NMC precursor synthesis [10,11,12]. However, ammonia does not complex with Al and NCA precursor syntheses usually produce undergrown particles due to the continuous nucleation of Al(OH)3 disrupting particle growth [16,26,36,37,38,40]. NCA precursor syntheses have therefore attempted different routes, using either alternative chelating agents [16,37,39,42], coprecipitation as carbonates [25] or separating the Al to form an [Al(OH)x]3−x (x ≥ 4) solution [17,26,36,38,40].
In this work, [Ni0.80Co0.15](1−x)/0.95Alx(OH)2 (x = 0–0.2) hydroxide materials were prepared by the coprecipitation method. Two variations of the method were compared, one method having all the metal reagents combined together and the other method having a separate Al dissolved in NaOH solution. The synthesized materials were characterized by Inductively Coupled Plasma-Optical Emissions Spectroscopy (ICP-OES), Scanning Electron Microscopy (SEM), X-ray Diffraction (XRD) and Thermogravimetric Analysis-Mass Spectrometry (TGA-MS) to understand the formation of LDH phases as influenced by Al content and synthesis method and build on previous work [17].
2. Experimental
Reagents used in this work included Ni(SO4)·6H2O (Alfa Aesar, >98%), Co(SO4)·7H2O (Alfa Aesar, >98%), Al(NO3)3·9H2O (Sigma-Aldrich, >98%), NaOH (Fisher, 98.9%) and NH3(aq) (Sigma-Aldrich, 28–30%). Ni, Co, Al standards (1000 μg/mL, Ultra Scientific), HCl and HNO3 (Reagent grade, Sigma Aldrich) were used to prepare solutions for ICP-OES measurements.
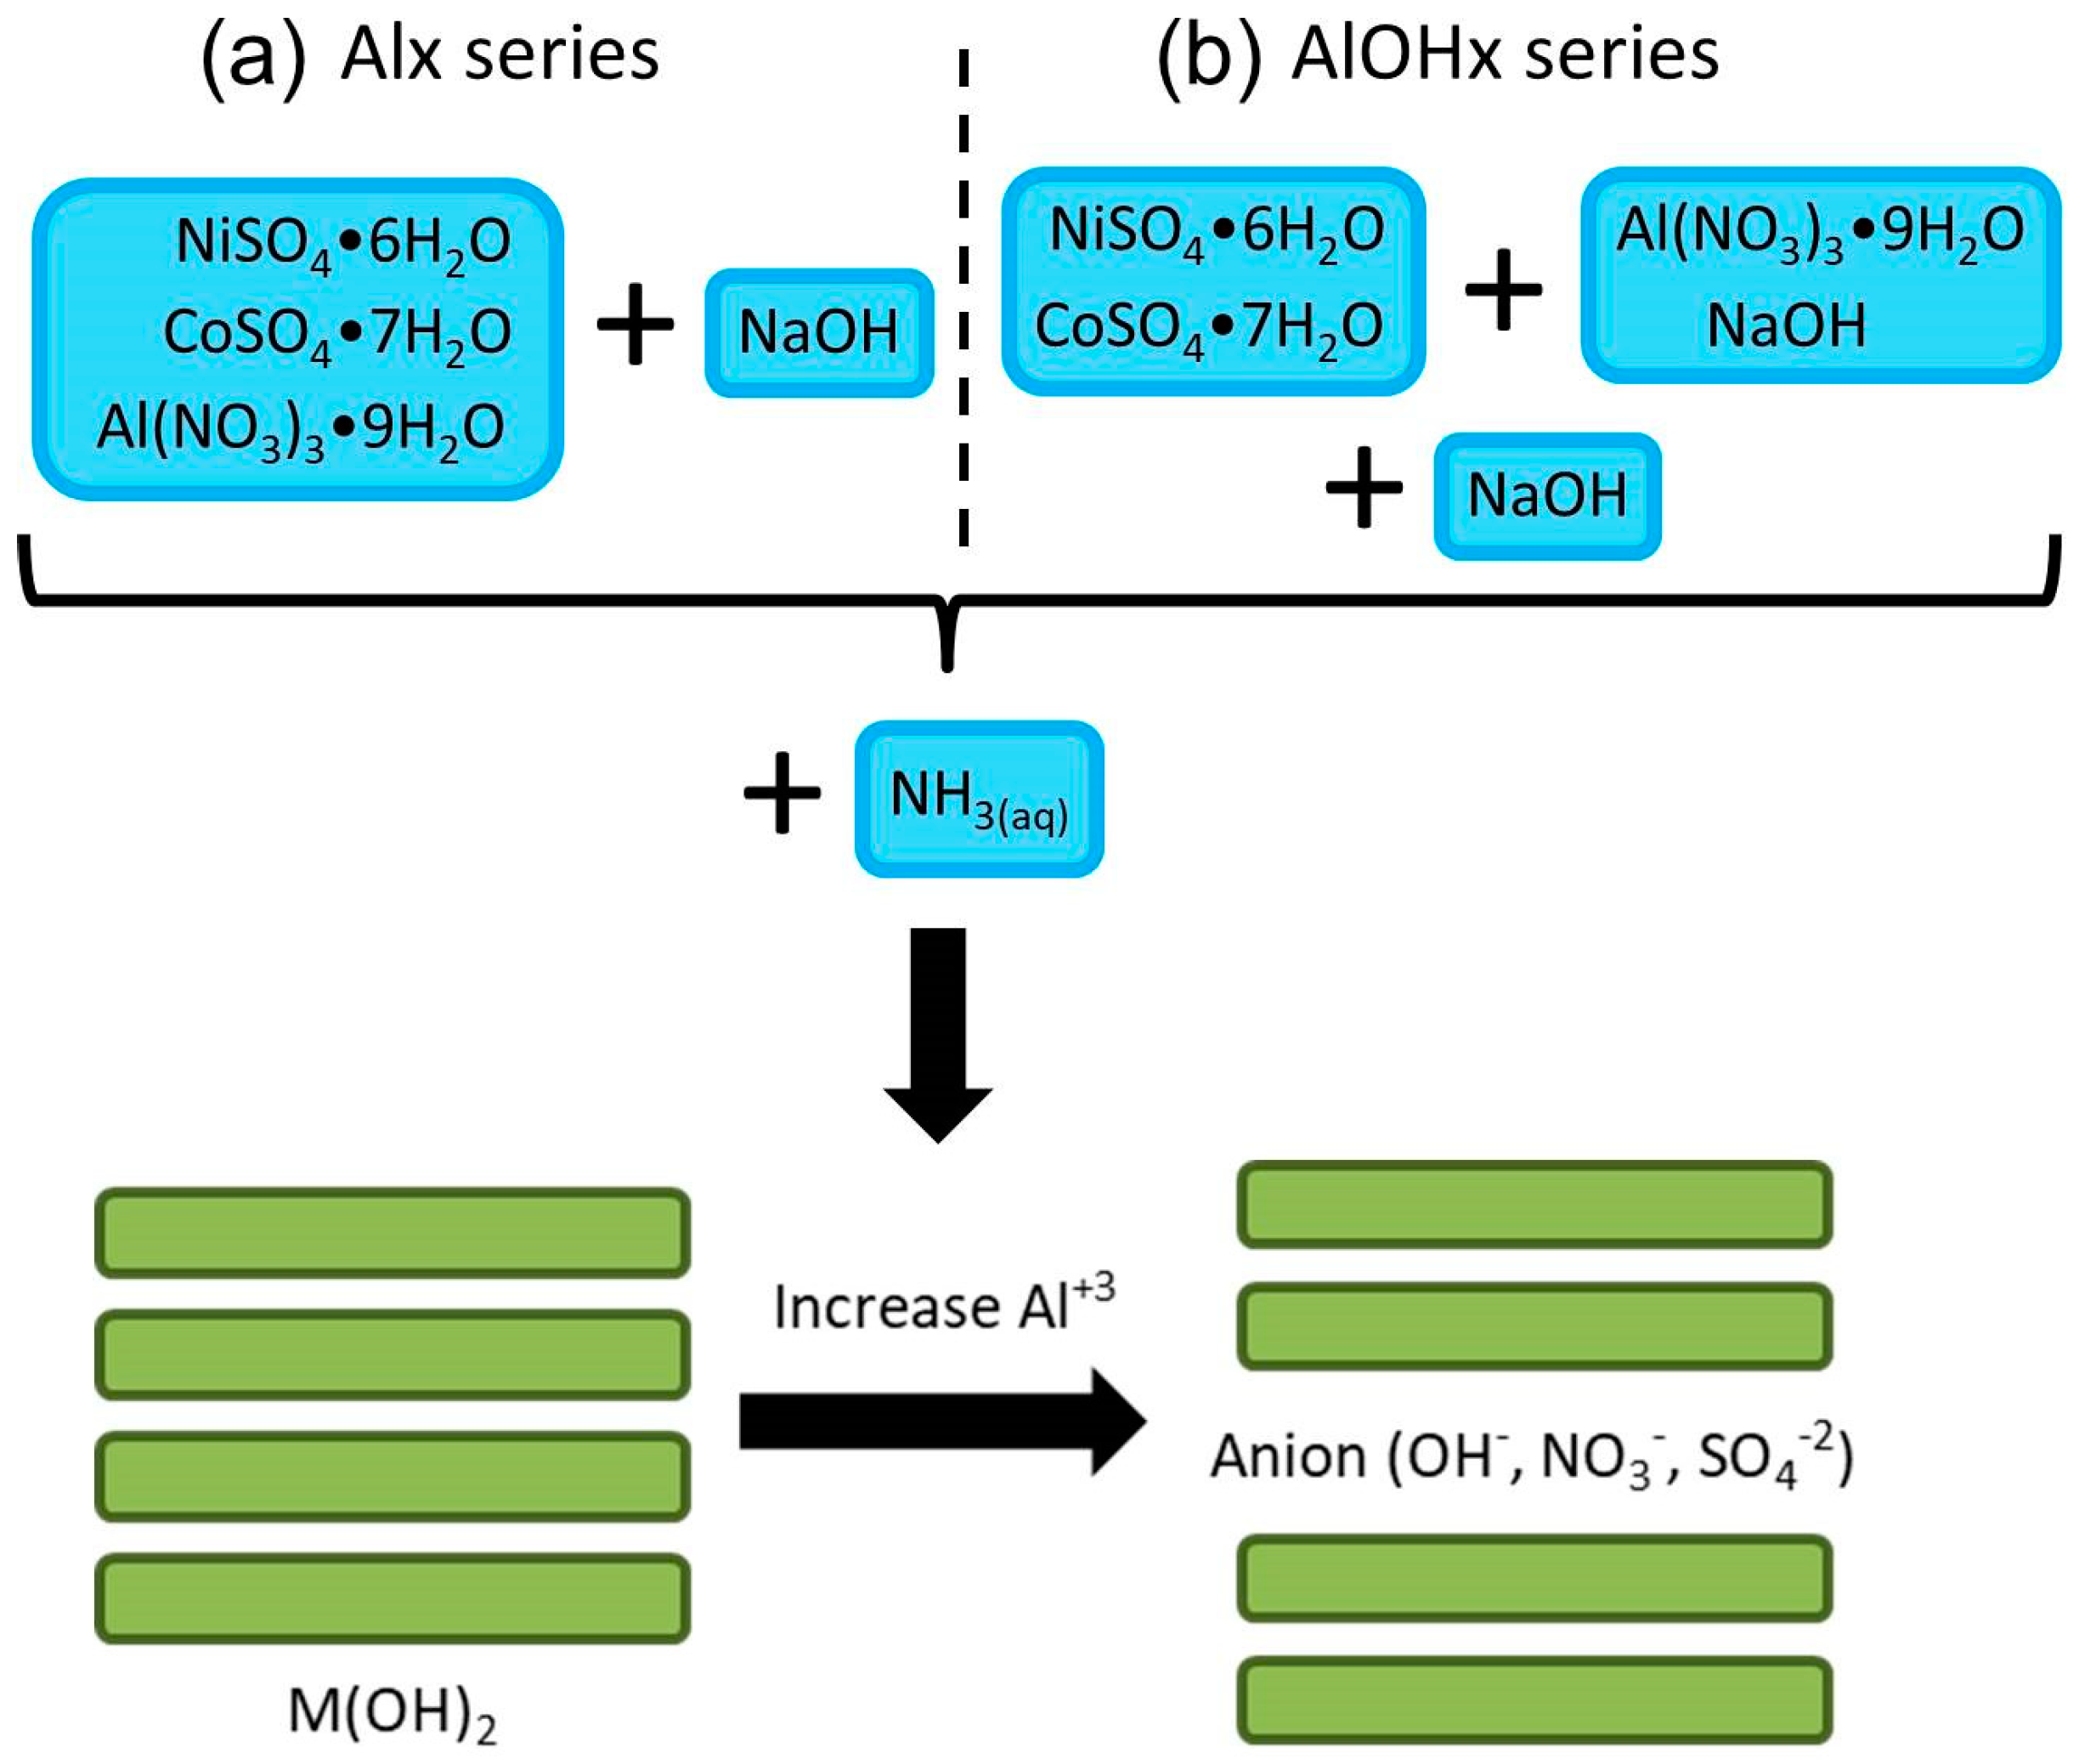
[Ni0.80Co0.15](1−x)/0.95Alx(OH)2 (x = 0–0.2, denoted as 0–20% Al) materials were synthesized by the coprecipitation method. Aqueous solutions of Ni(SO4), Co(SO4) and Al(NO3)3 were prepared with the Ni:Co:Al molar ratios specified in Table 1. In the first method (denoted as the Alx series, Figure 1a), the nickel, cobalt and aluminum reagents were dissolved into one solution (50 mL, 0.8M) along with a NaOH solution (50 mL, 2.2 M). For the second method (denoted as the AlOHx series, Figure 1b), the nickel and cobalt reagents were combined into one solution (50 mL, 0.76–0.64 M as the Al content increased) while the aluminum reagent was dissolved into a separate solution (50 mL, 0.04–0.16 M as the Al content increased) along with NaOH at an Al:OH molar ratio of 5 [17,26,36,38,40]. Similar to the first method, a NaOH solution (50 mL, 2.0–1.4 M as the Al content increased) was prepared but the concentration was adjusted to account for the NaOH in the Al solution (Table 1).

Table 1.
Target molar ratios for the two synthesis methods.

Figure 1.
A schematic representation of the synthesis of [Ni0.80Co0.15](1−x)/0.95Alx(OH)2 (x = 0–0.2) materials by (a) combining all metal reagents into one solution (Alx series) or (b) dissolving Al into a separate NaOH solution (AlOHx series) before addition into the reaction vessel.
Figure 1 shows the schematic representation of the two synthesis methods. It should be noted that at 0% Al, there is no need for a separate Al solution, so only one batch was synthesized (denoted as Al0). For both methods, the solutions were simultaneously added dropwise, using peristaltic pumps, to a stirred reaction vessel containing NH3 solution (100 mL, 1 M). The solutions were added over the course of 1 hour, with the reaction vessel kept at 50 °C and under a N2 atmosphere. The vessel was then cooled to room temperature and the precipitate filtered and rinsed four times with water before drying overnight at 80 °C in air.
ICP-OES measurements were carried out using a Perkin Elmer Optima 8000 ICP-OES Spectrometer to determine the elemental composition of samples (as metal ratios). Standard solutions of 0, 0.5 and 1 μg/mL for Al and 0, 1 and 2 μg/mL for Ni and Co were prepared by diluting the standards in 2% HNO3. 8–10 mg of sample was dissolved in 2 mL of aqua regia (1:3 HNO3:HCl) before dilution in 2% HNO3.
SEM imaging was carried out using a NanoScience Phenom G2 Pro Desktop SEM to image samples. Powder samples were prepared by mounting on adhesive carbon tape.
XRD patterns of powder samples were collected with a Siemens D5000 diffractometer equipped with a Cu target X-ray tube and a diffracted beam monochromator. Samples were measured in the scattering angle (2θ) range of 6°–76° or 10°–85° for 3 s at intervals of 0.05°.
TGA-MS measurements were carried out using a TA Instruments SDT Q600 coupled with a Discovery MS. Experiments went from room temperature up to 900 °C at a heating rate of 5 °C/min under an air flow rate of 100 mL/min.
3. Results and Discussions
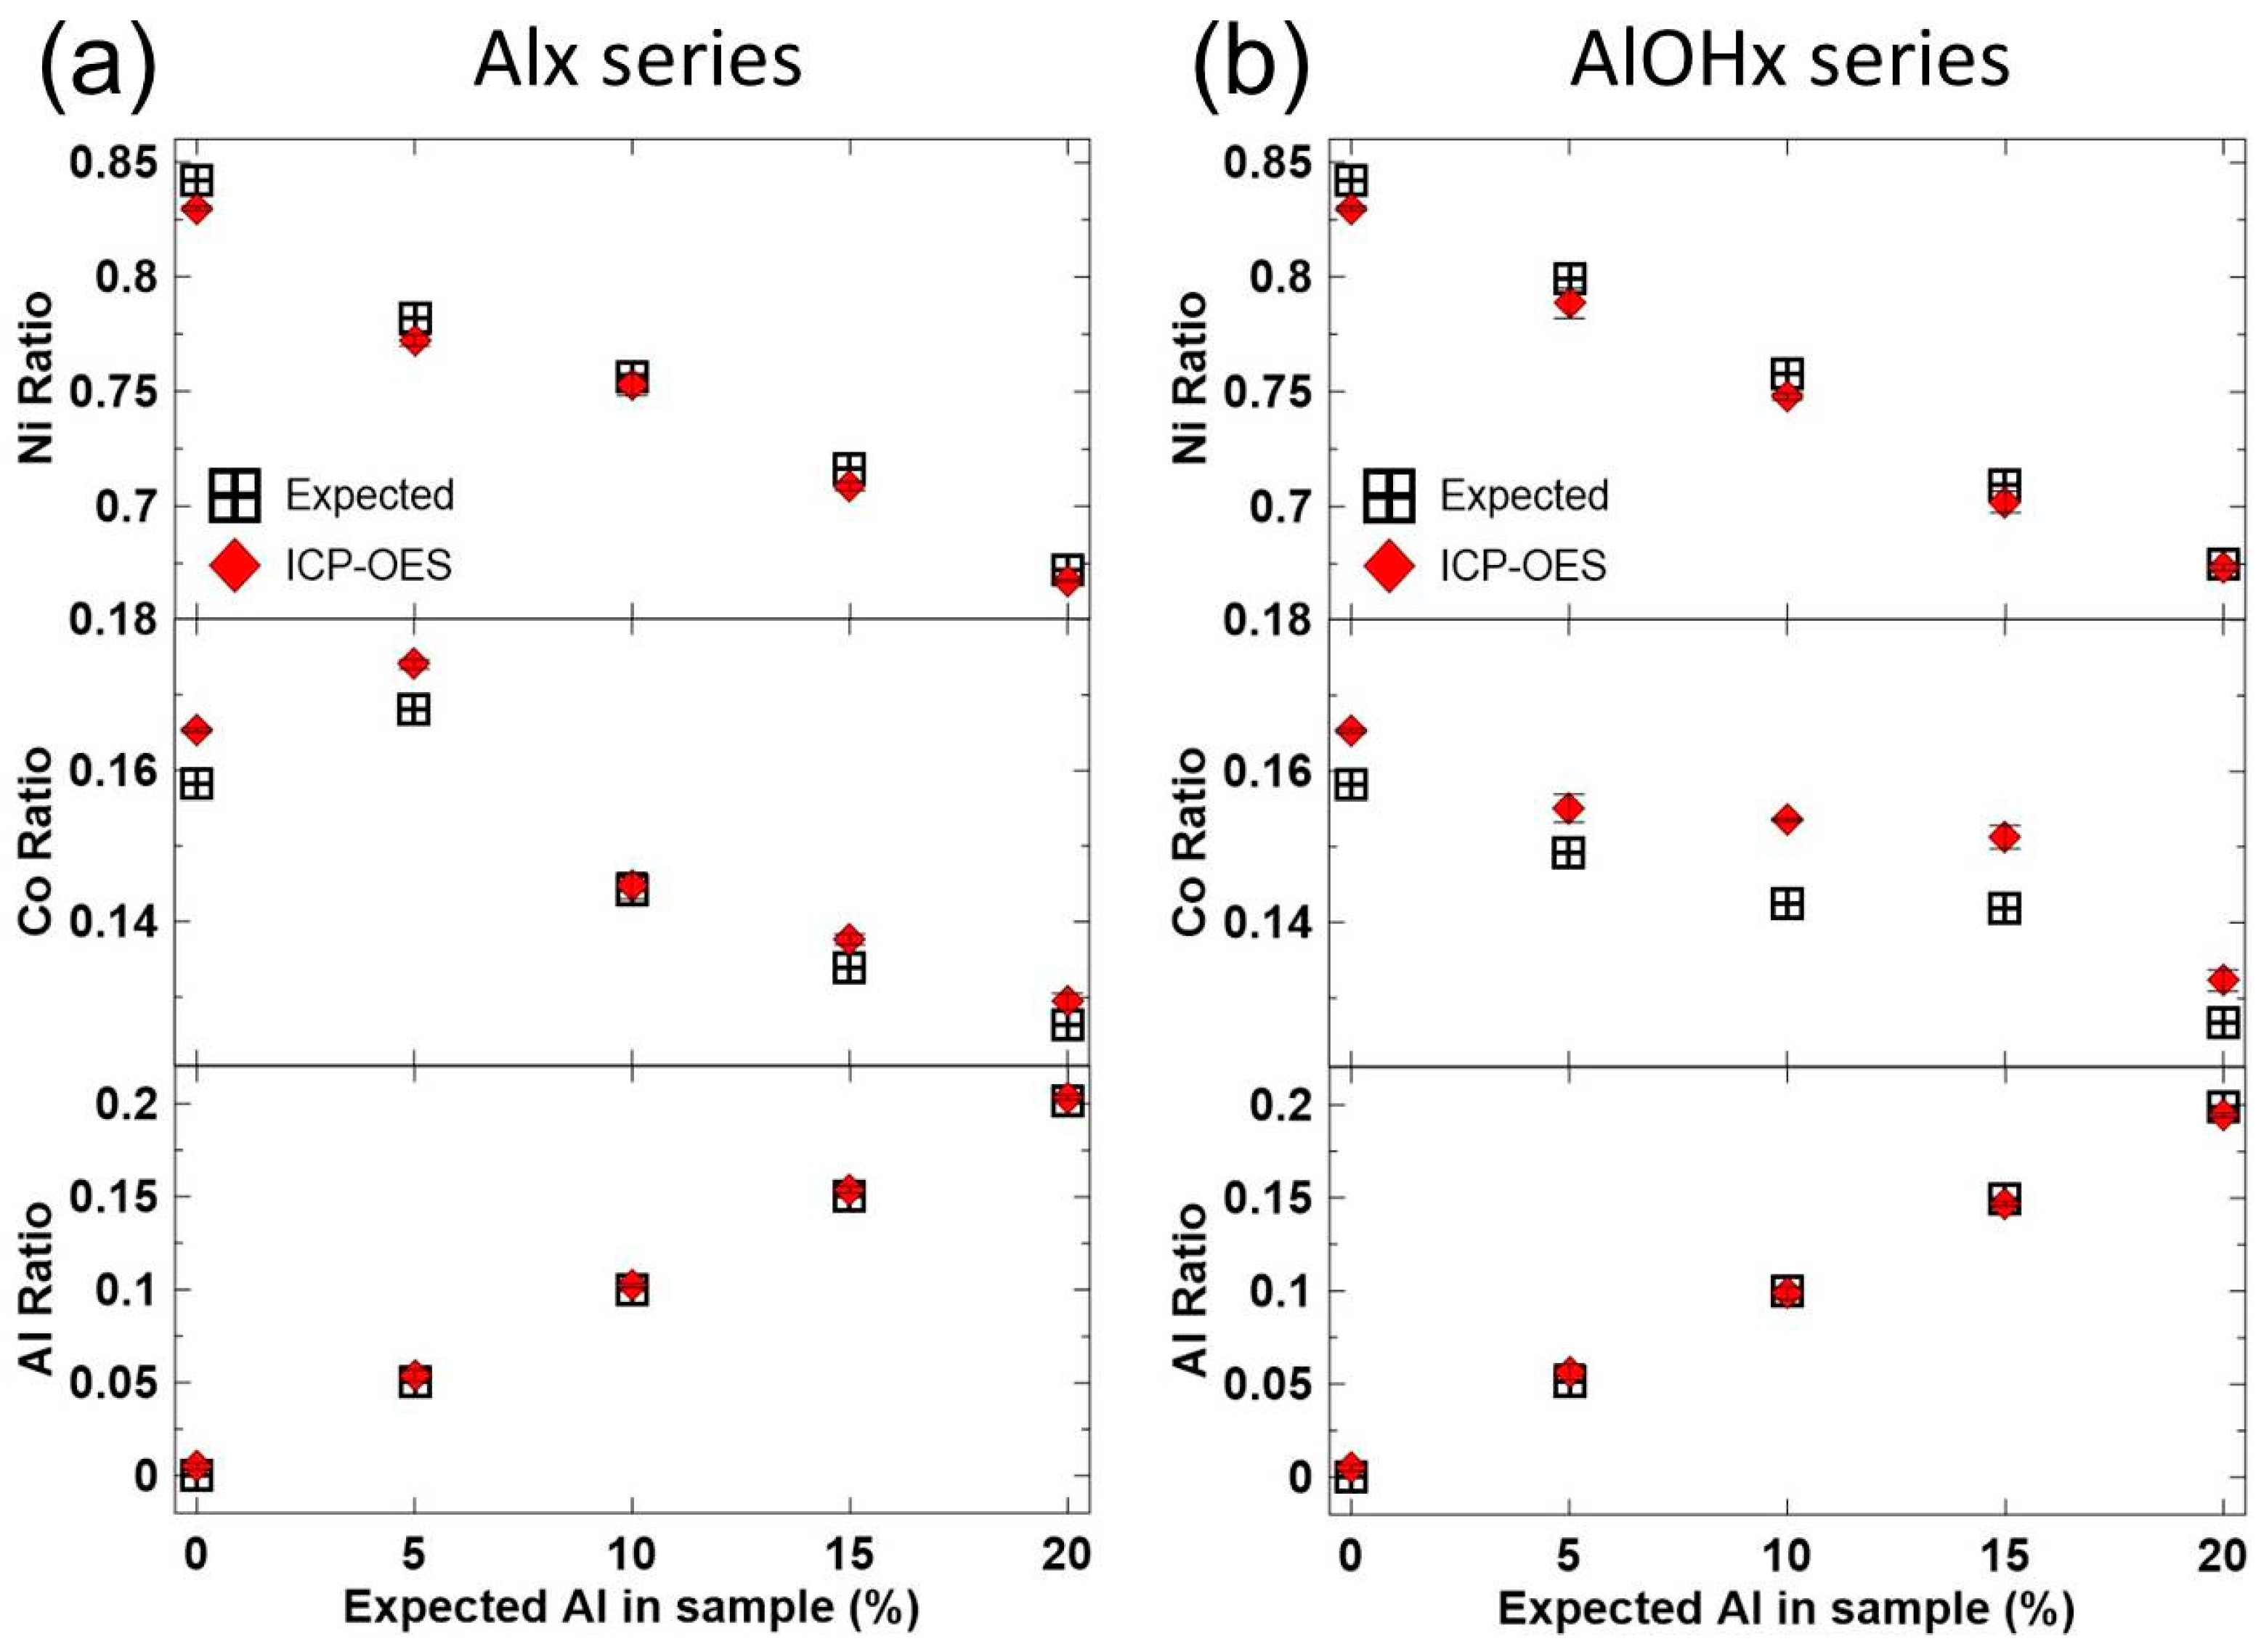
Figure 2 shows the ICP-OES results from the characterization of the synthesized hydroxides. Expected ratios were calculated based on reagent masses used. Metal atomic ratios were normalized to 1 to denote the stoichiometric ratios of the metals as determined by the ICP-OES. Figure 2a shows the expected and ICP-OES ratios for the Alx series, while Figure 2b shows the expected and ICP-OES ratios for the AlOHx series.
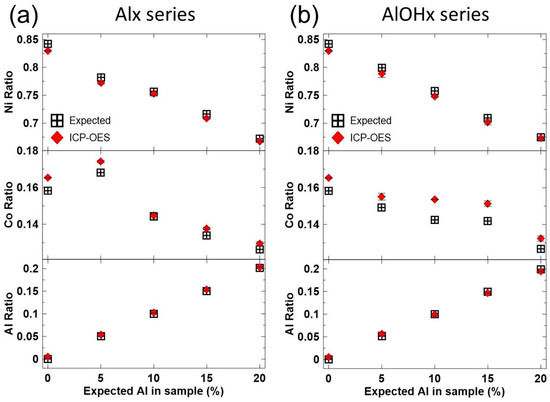
Figure 2.
Metal atomic ratios were determined by ICP-OES and normalized to 1 for (a) the Alx series and (b) the AlOHx series.
Figure 2 shows that the metal ratios as determined by the ICP-OES were close to the expected ratios. The slight discrepancy in the Ni and Co expected ratios and ICP-OES ratios is likely due to experimental error. The Al ratios closely matched expected ratios, and so the discrepancy between the expected and experimental ratios of Ni and Co is not expected to impact this study, which focuses on the effect of Al on LDH formation.
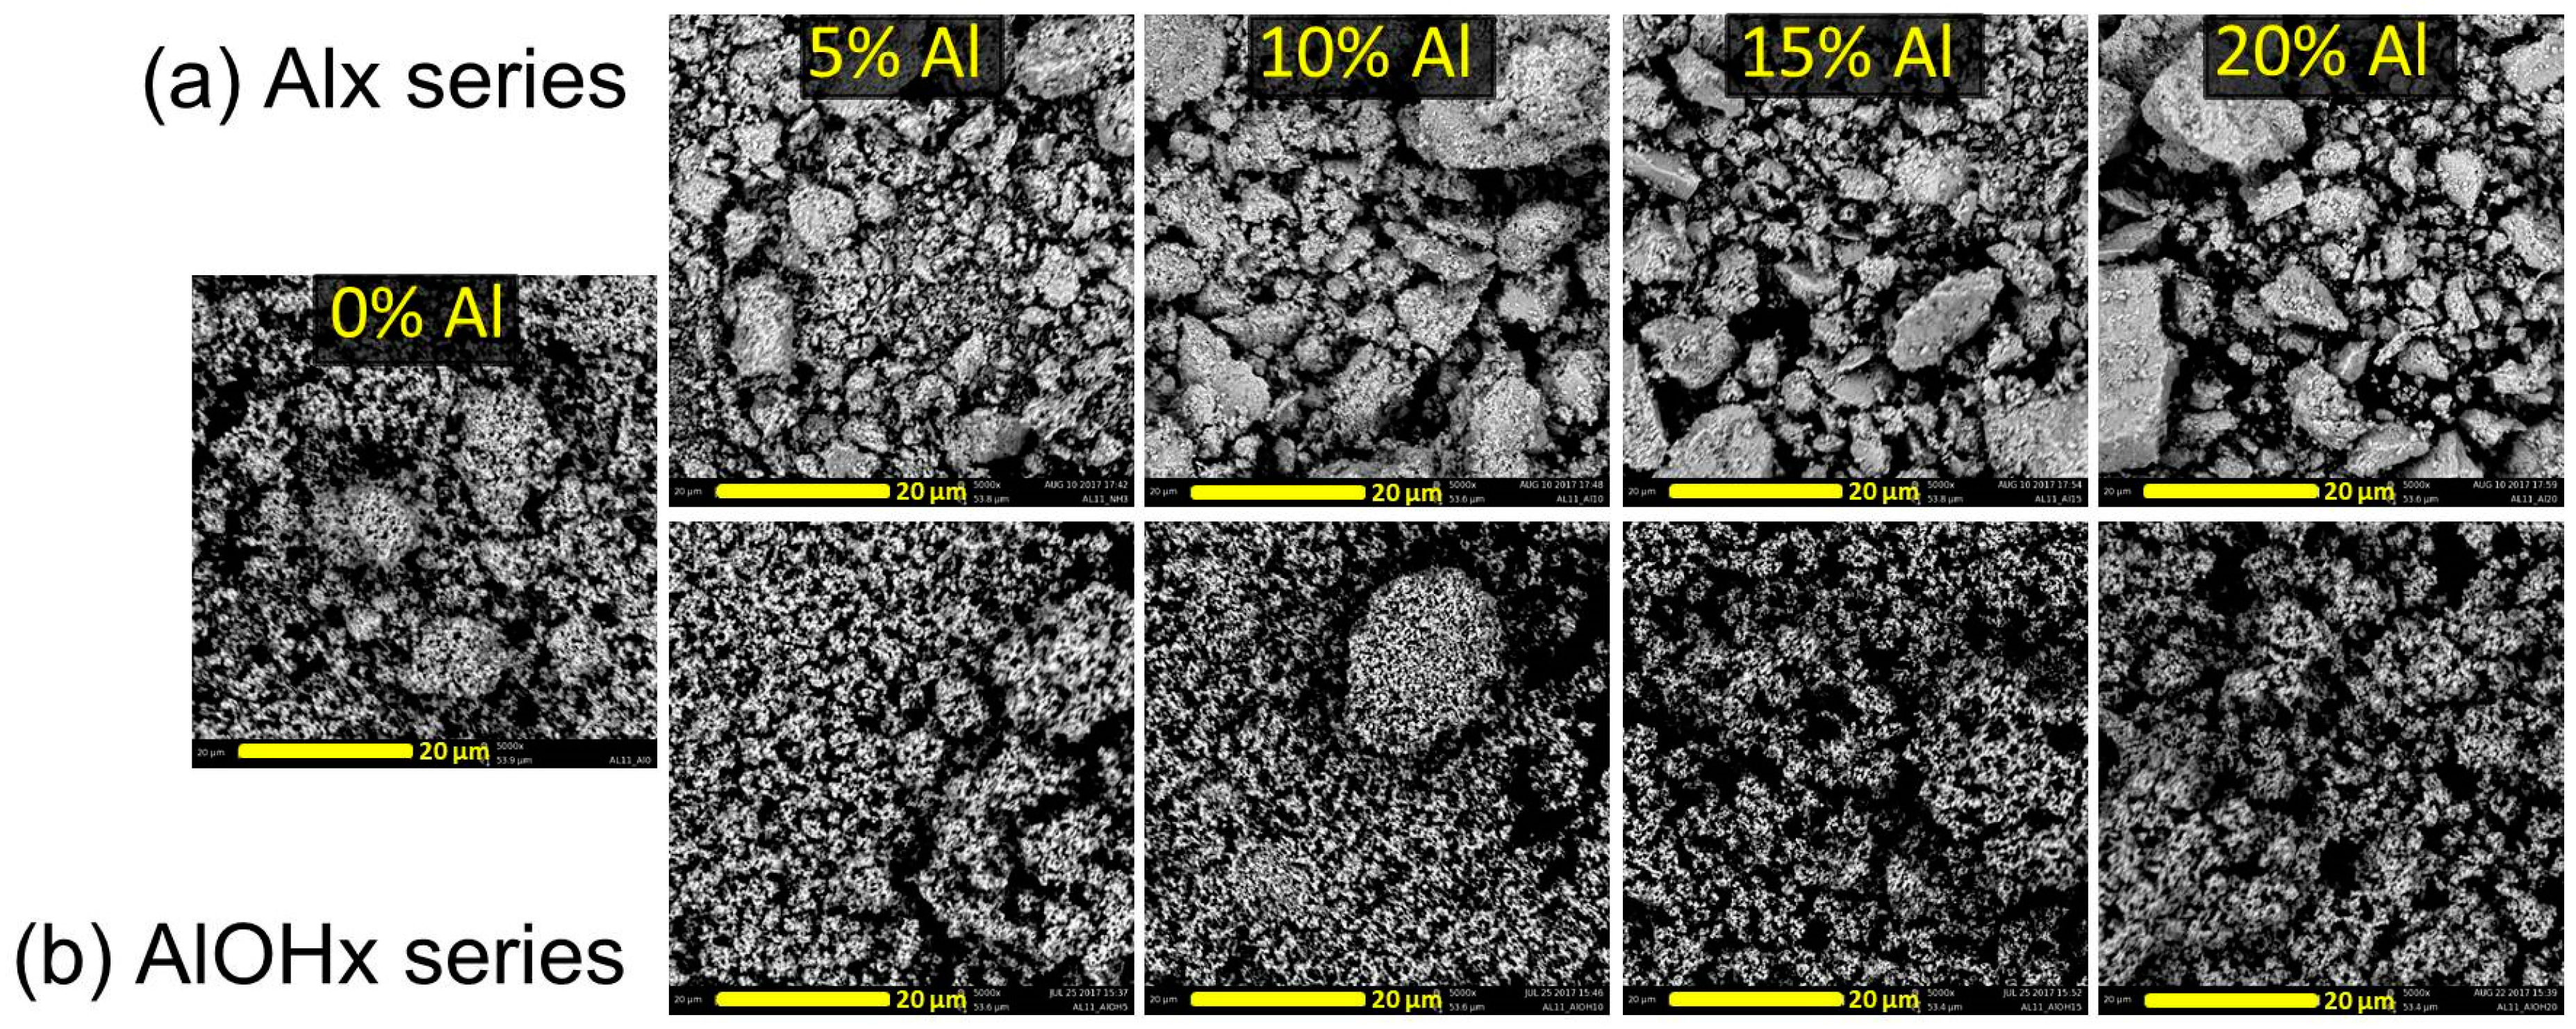
Figure 3 shows SEM images of the synthesized hydroxides. Figure 3a shows the SEM images of the Alx series and Figure 3b shows the SEM images of the AlOHx series. As mentioned, only one batch was synthesized at 0% Al since there is no need for a separate Al-in-NaOH solution. The Al0 sample is made up of small particles, some of which clustered into secondary particles with the primary particles still distinct. Conversely, Figure 3a shows that the Alx series of materials had a different morphology. Particles were irregularly shaped and non-uniform in size, with sizes ranging from smaller than the Al0 primary particles to larger than the Al0 secondary particles. The AlOHx series of materials showed a similar morphology to Al0, with primary particles still distinct from secondary particles.
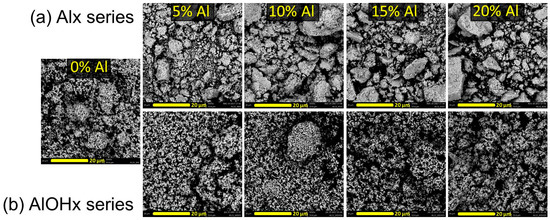
Figure 3.
SEM images of (a) the Alx series and (b) the AlOHx series.
It has been noted that the Alx synthesis procedure disrupts particle growth due to the continuous nucleation of Al(OH)3 into new, small particles [16,26,36,37,38,40]. It is suspected that these undergrown particles then agglomerated with neighboring particles during drying to minimize surface instability of such small particles, forming the larger particles seen in the SEM. The AlOHx series materials did not experience such a disruption due to the Al being in solution as Al(OH)4−, which precipitated onto the surface of existing particles and allowed for more particle growth [26,36,38,40]. Particle sizes for the Al0 and AlOHx series materials were still small due to the short synthesis time of 1 h. With a longer synthesis time and controlled reaction conditions through the use of a continuously stirring tank reactor, large spherical particles of desirable morphology have been synthesized using the AlOHx method [17,26,36,38,40,43].
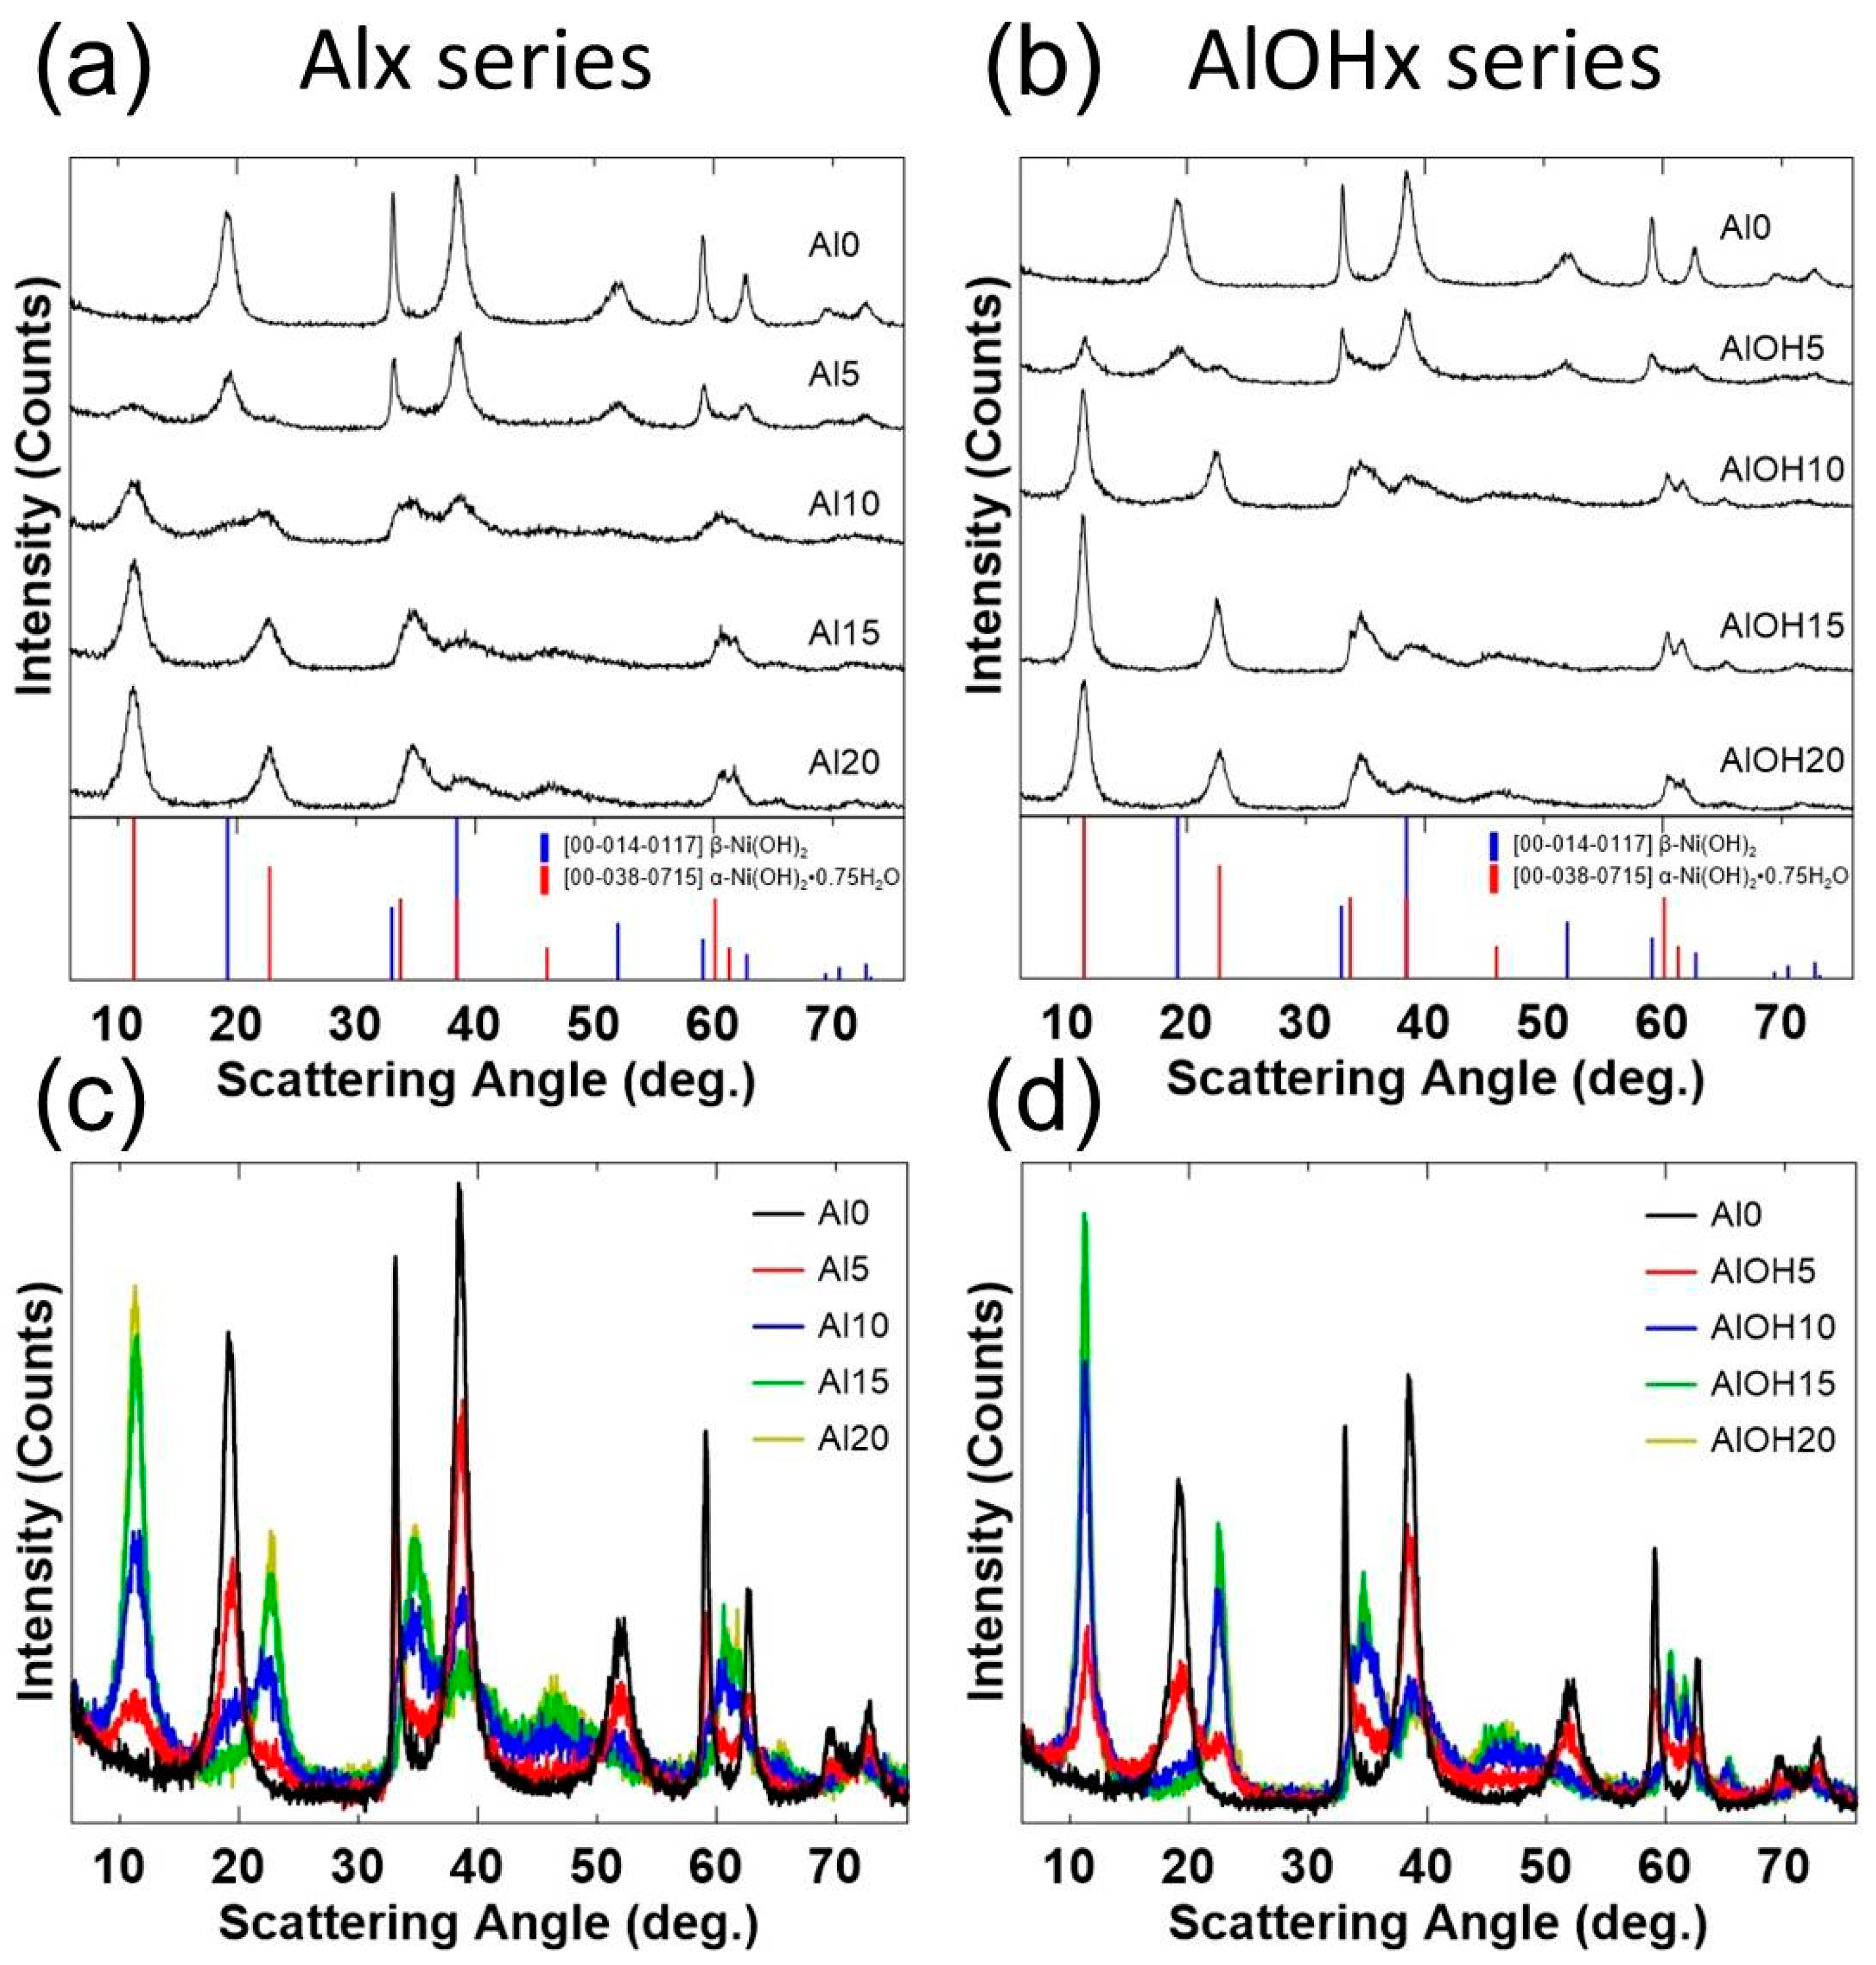
Figure 4 shows the XRD patterns of the Alx series (Figure 4a) and AlOHx series (Figure 4b) of materials, along with the reflections for 2 Ni(OH)2 phases (β-Ni(OH)2 (blue), JCPDS #00-014-0117; α-Ni(OH)2·0.75H2O (red), JCPDS #00-038-0715) on the top panels and the patterns being overlaid together on the bottom panels. Peaks in the XRD patterns were broad due to several factors, including small crystallite sizes and the likely presence of several different types of anions in the structure, which would form LDH phases with a range of interlayer spacing.
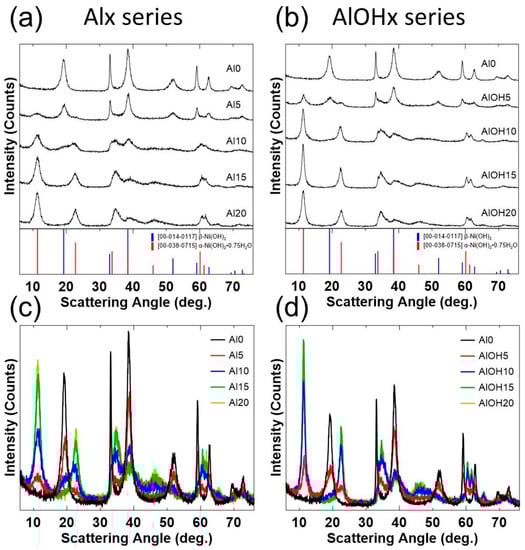
Figure 4.
XRD patterns (Cu Kα radiation) of (a) the Alx series and (b) the AlOHx series samples collected from 6°–76° along with the patterns of β-Ni(OH)2 and α-Ni(OH)2·0.75H2O phases. The overlaid XRD patterns of (c) the Alx series and (d) the AlOHx series are shown below.
The reflections are isostructural to the synthesized phases with and without LDH (a simple representation of the two phases can be seen in the bottom of Figure 1) [17,21]. The α-Ni(OH)2·0.75H2O incorporates water molecules in between the M(OH)2 layers, while the β-Ni(OH)2 phase does not have interlayer molecules. The top panels show clearly that as the Al content increases, the amount of the phase without LDH decreases while the amount of the phase with LDH increases. This is reasonable, as more trivalent Al3+ requires more charge balancing anions. The increase in the LDH phase seems to continue until 15% Al where the samples are 100% LDH [13,14]. The 20% Al materials also seem to be 100% LDH phase.
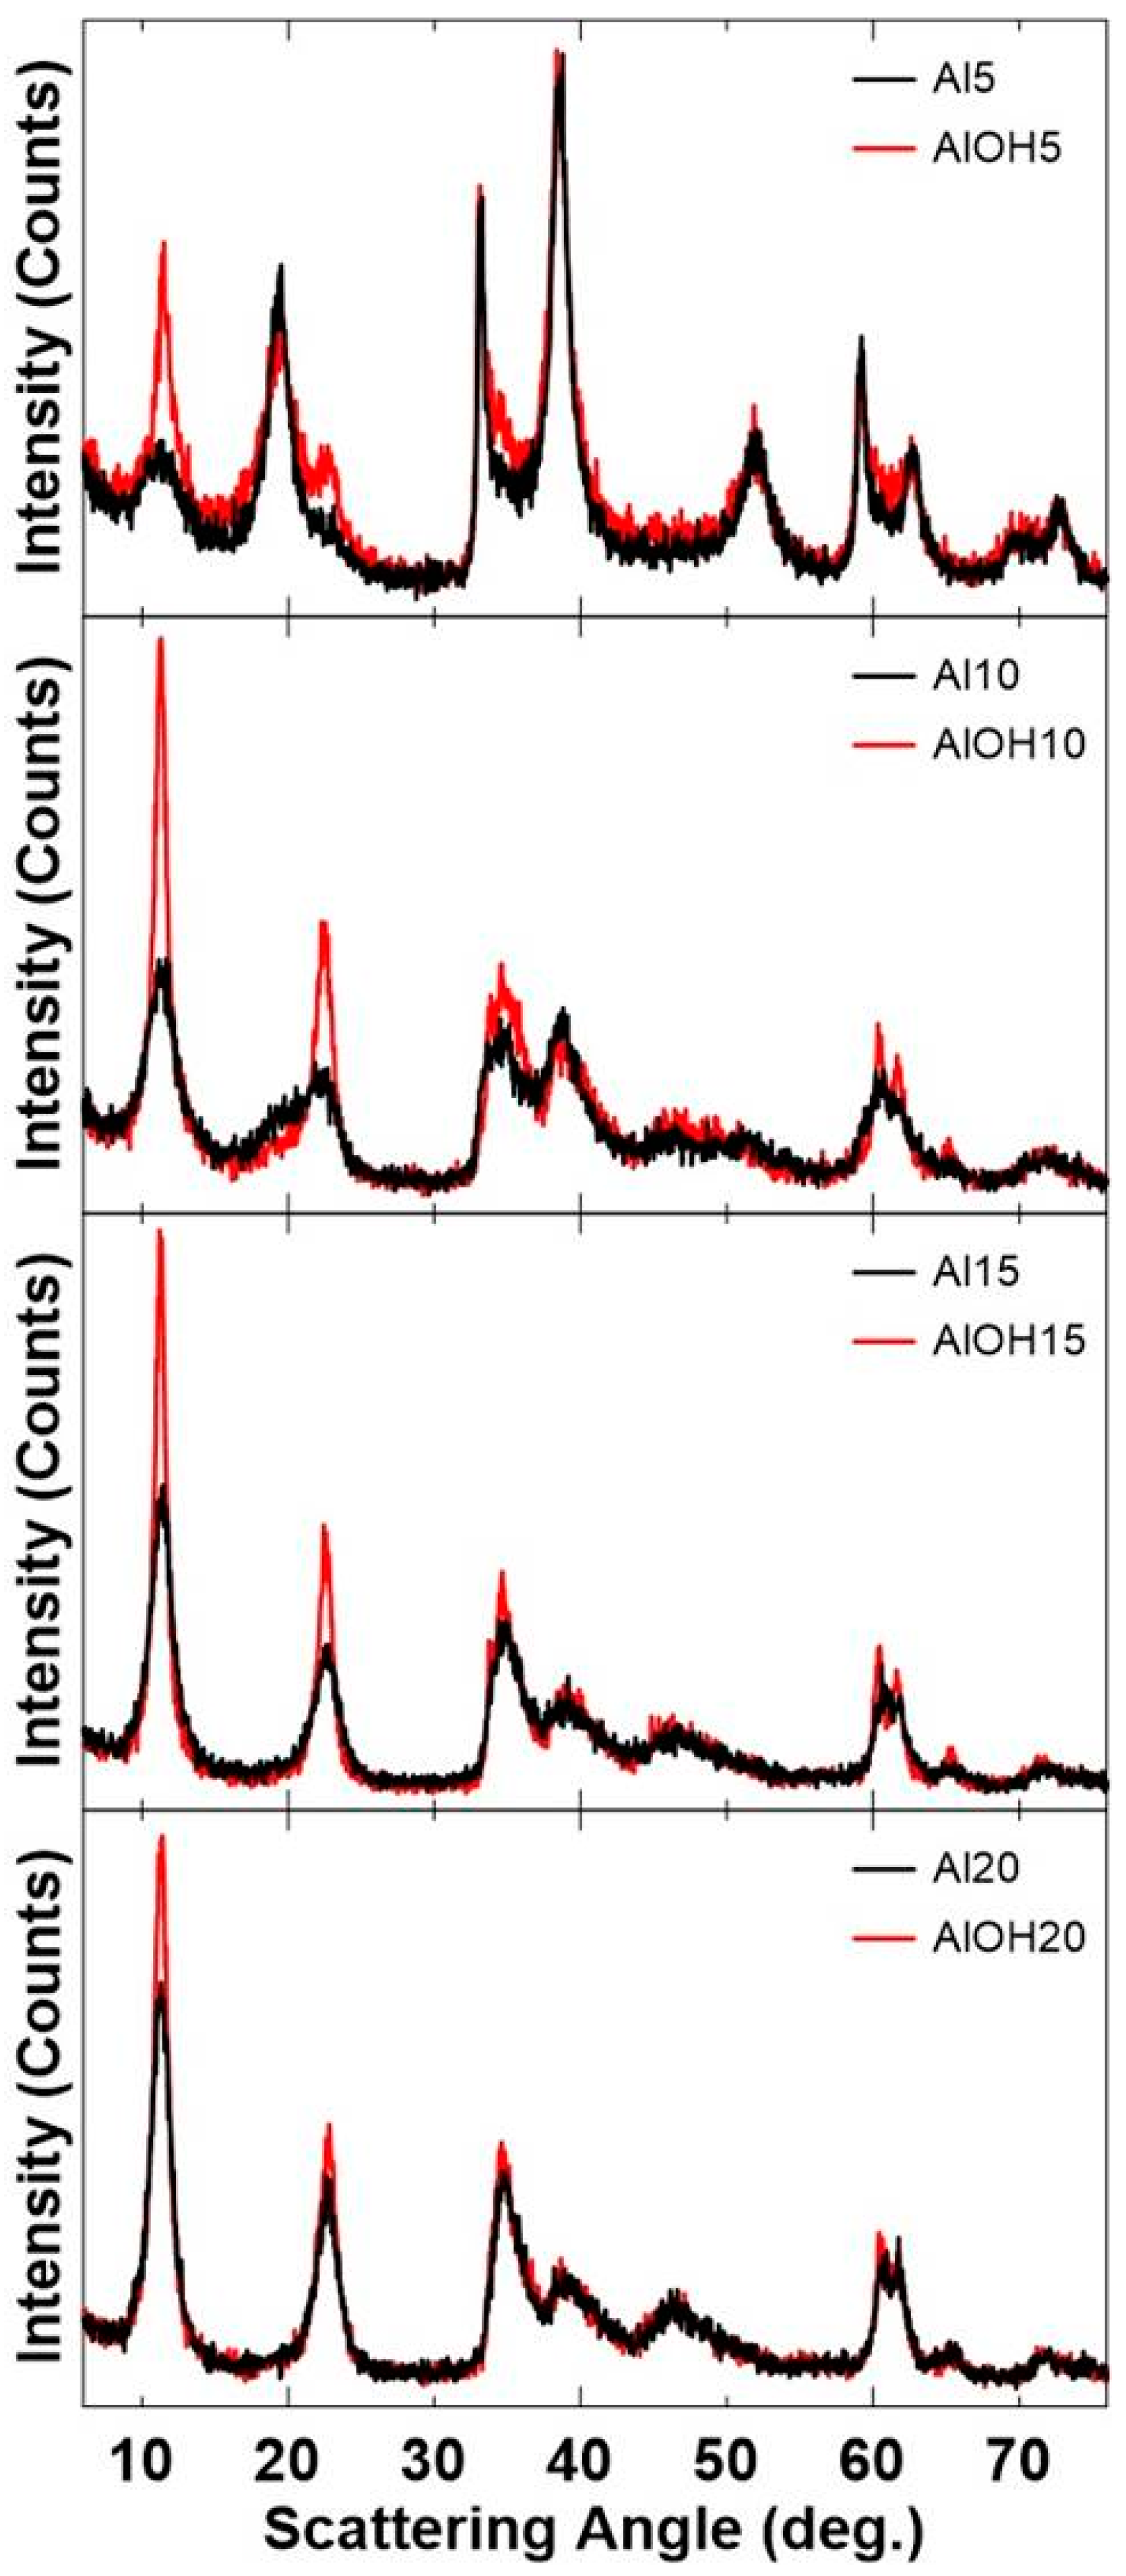
Figure 5 shows the comparison of the XRD patterns of the two series of samples by Al content. The AlOHx samples consistently exhibit larger, sharper peaks for the LDH phase than the Alx sample of the same Al content. This is most likely due to the AlOHx samples having larger grain sizes than the Alx samples. Smaller grain sizes from the Alx synthesis procedure can contribute to peak broadening as described by the Scherrer equation [44].
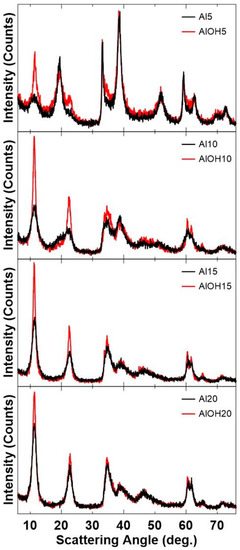
Figure 5.
XRD pattern comparisons of the Alx and AlOHx series by Al content.
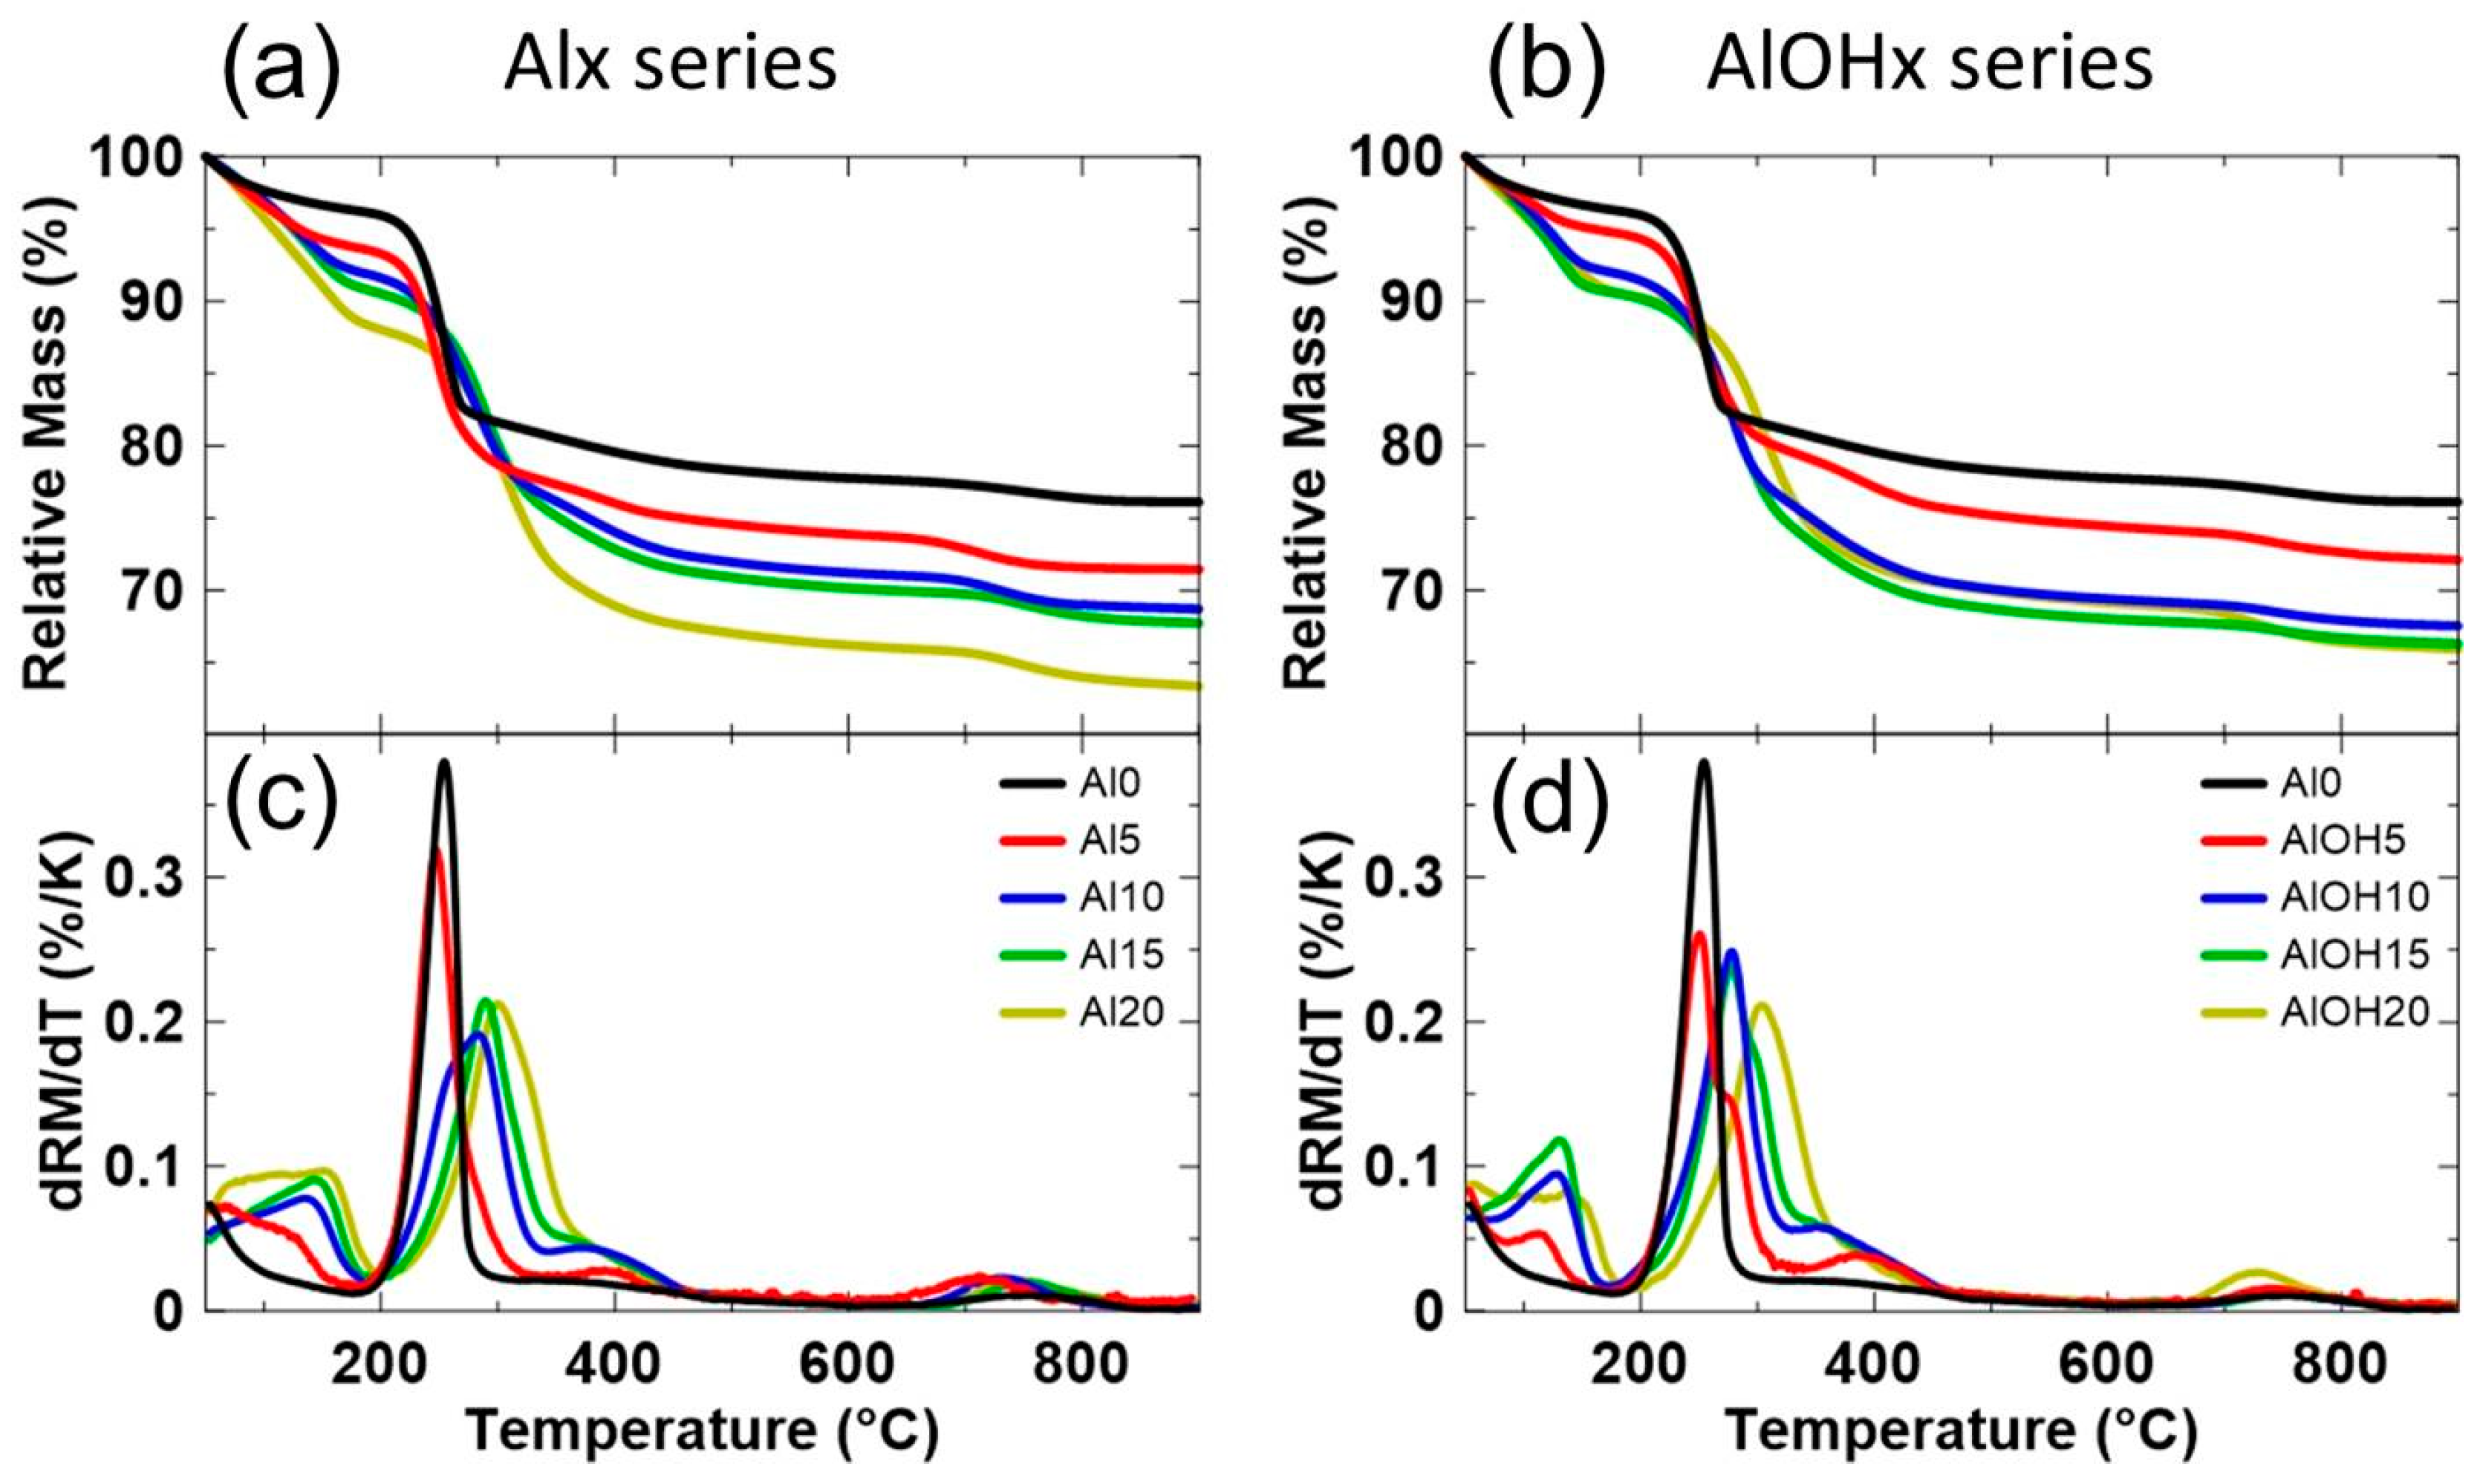
Figure 6 shows the normalized TGA results for the Alx series and the AlOHx series. The top panels (Figure 6a,b) show the relative mass loss as a function of temperature, while the bottom panels (Figure 6c,d) show the rate of change of relative mass with temperature plotted as a function of temperature (dRM/dT vs. T). The TGA results were normalized for ease of comparison of both the mass loss and the rate of mass loss.
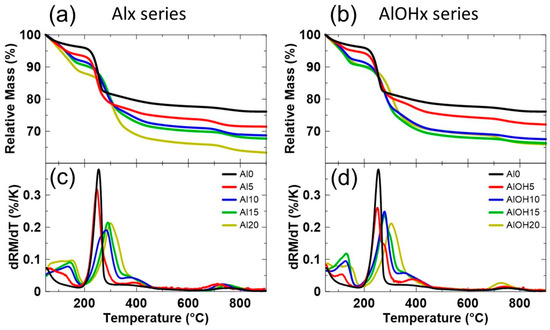
Figure 6.
Normalized TGA data (heated to 900 °C in air) for (a) the Alx series and (b) the AlOHx series are shown in the top panels. The bottom panels show the derivative of the normalized mass loss versus temperature for (c) the Alx series and (d) the AlOHx series.
There are a few stages of mass loss seen in Figure 6. The first stage, from the start of the TGA experiment until around 180 °C, is attributed to the loss of surface or intercalated water. It is expected that water molecules are evolved first before LDH anions due to the attractive forces of the negative charge of the LDH anions to the positive charge of the Al. Looking at dRM/dT vs. T in Figure 6c,d, the first stage of mass loss of the 20% Al samples continued well past 150 °C, although the water loss stage ended at 120 °C [13] or 150 °C [14,17] for past work. The second stage, from around 200 °C to 500 °C, is associated with the loss of LDH anions and decomposition of the material. A third stage, which may not be present in all materials, occurs around 650 °C to 800 °C and has been attributed to the loss of sulfate LDH anions [13].
Figure 6 shows a few trends as the Al content increased from 0% to 20%. The relative masses at 900 °C show that as Al content increased, the total mass loss increased as well. This is reasonable as the materials have more LDH when the Al content is higher, and the LDH anions are removed during heating, so there is more mass loss. While the mass loss trend of the Alx series (Figure 6a) is different than for the AlOHx series (Figure 6b), there does not seem to be a consistent trend in the differences. As Al content increased for both series, more mass was lost during the first stage of mass loss, and this can be seen more clearly in Figure 6c,d. This is likely due to an increase in the amount of intercalated water rather than surface water. With an increase in LDH content, there would be more layers that have been widened by an LDH anion that may be able to accommodate water. Another plausible reason may be that the layers incorporate solvated anions, and more LDH content or charge of the LDH anion will bring in more solvating water molecules. This will be discussed again later.
Figure 6c,d shows that increased Al content broadens the dRM/dT peak in the second mass loss stage and delays the onset of the peak to higher temperatures as well. The latter trend has been noted in the past that Al can impart thermal stability to both precursor [14,17] and lithiated materials [8,9,43,45,46].
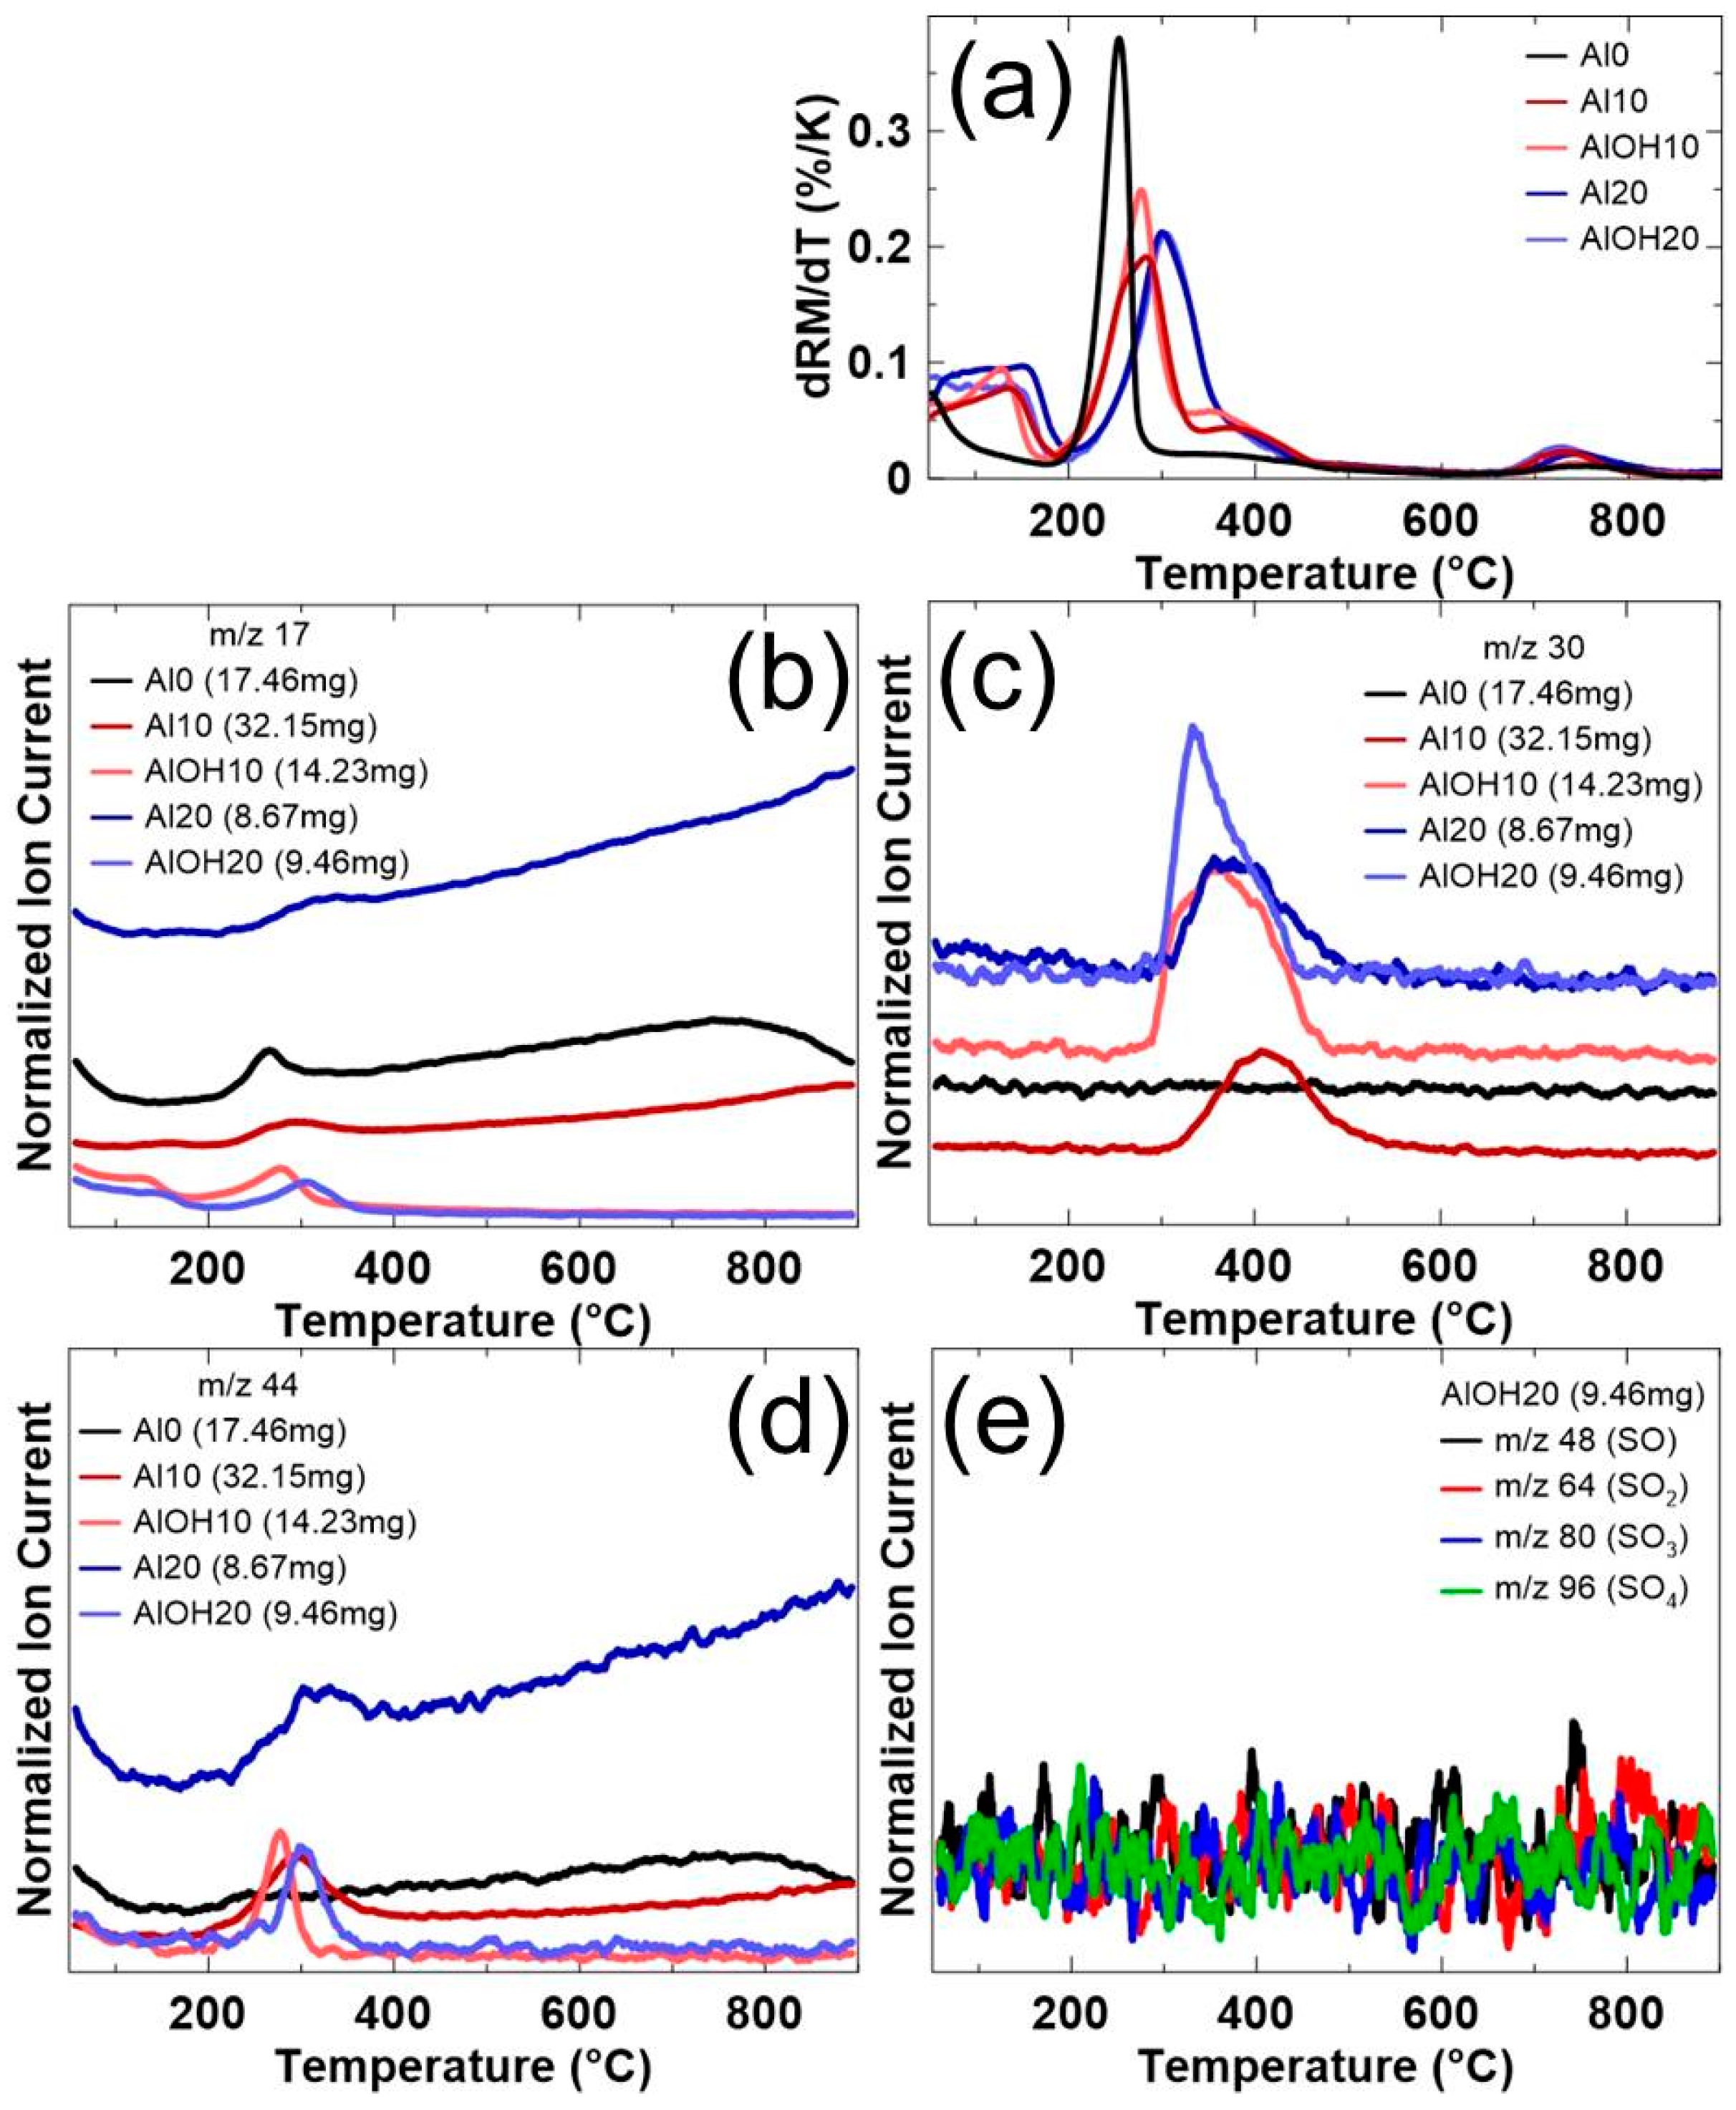
Figure 7 shows the TGA-MS results for the 0%, 10% and 20% Al samples. Figure 7a shows dRM/dT vs. T while Figure 7b–d shows the MS data for m/z ratios of 17 (Figure 7b), 30 (Figure 7c) and 44 (Figure 7d) which correspond to the species OH (from OH−), NO (from NO3−) and CO2 (from CO32−), respectively (the expected LDH anions are in brackets). Figure 7e shows the AlOH20 MS data for the m/z ratios of 48 (SO), 64 (SO2), 80 (SO3) and 96 (SO4). The MS ion current data in Figure 7b–e has been divided by the mass of the sample in each experiment so that the relative peak heights can be more easily compared. However, for completeness, the mass of each sample is listed in the figure legends. While all samples were tested with an air flow rate of 100 mL/min, the background differences likely stemmed from some difference in the air composition or air intake and are not expected to impact the experiment. However, the different backgrounds complicate any background subtraction procedure so the raw MS data (divided by sample mass) is shown.
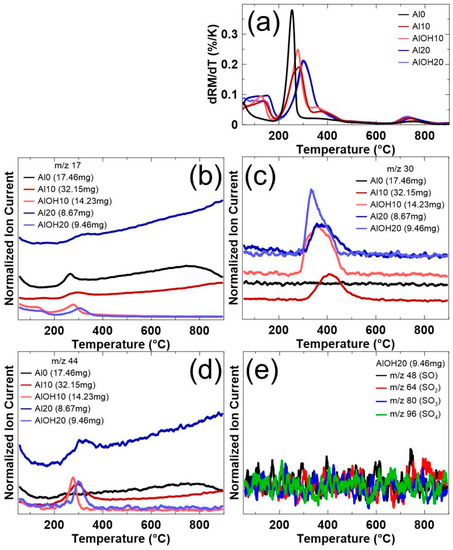
Figure 7.
(a) The derivative of the normalized mass loss of 0%, 10% and 20% Al samples plotted versus temperature. The corresponding normalized MS data (coupled with TGA, heated to 900 °C in air) for the m/z ratios of (b) 17 (OH), (c) 30 (NO) and (d) 44 (CO2) are shown. The normalized MS data for AlOH20 for various m/z ratios associated with sulfates are shown in (e).
Figure 7 shows which LDH anions are incorporated into the materials. Due to the synthesis process, it is possible for OH−, NO3−, CO32− and SO42− to be incorporated as LDH anions. Nitrate and sulfate ions come from the metal reagents, while hydroxide and carbonate ions come from the water or NaOH (carbonates from dissolved carbon dioxide in water or NaOH impurities). The decomposition of the hydroxide material itself evolves water, which can be observed in Figure 7b in both the first and second stage of mass loss, even at 0% Al. Due to this, the presence of OH− as an LDH anion gets obscured, and cannot be confirmed from this experiment. No nitrate species are evolved in the decomposition of the hydroxide material as seen with the Al0 sample, so the observation of the peaks in Figure 7c indicate the existence of NO3− as an LDH anion in these samples. Likewise, Figure 7d shows that CO32− ions are incorporated into the LDH phase. While Figure 6c,d shows a mass loss around 700 °C that is attributed to sulfate loss [13] for the AlOH20 sample, no peaks associated with sulfates can be seen in the MS data. However, it is known that metal sulfates are thermally stable [13,47,48], so perhaps the mass loss was related to the sulfate but did not evolve sulfates.
While it may be tempting to find trends about the amount and type of LDH anions that are evolved as Al content increases, the different backgrounds complicate the quantification. However, Figure 7 still confirms the presence of NO3− and CO32− LDH anions for 10% and 20% Al samples, while the status of OH− LDH anions is unknown and SO42− LDH anions are unlikely. Previous work has also confirmed the presence of the NO3− and CO32− LDH anions in samples with 5% and 10% Al, and a synthesis using deaerated water and metal nitrate reagents produced materials that contained NO3− LDH anions and virtually no CO32− LDH anions (and an unknown amount of OH− LDH anions) [17].
One interesting trend seen in Figure 7 is the timing of the evolution of nitrate anions (Figure 7c). While the hydroxide/water (Figure 7b) and carbonate (Figure 7d) evolution occur at the sharp peak of the material decomposition (Figure 7a), nitrates evolve at the tail end of the decomposition, around 100 °C after the sharp peak. This has been consistently observed in previous work [17] as well, and it is uncertain why nitrate evolution occurs so late in the decomposition of the material.
Figure 8 shows an analysis of the mass loss of the materials. Figure 8a shows the relative mass loss of the samples from 35 °C to 180 °C as determined by the TGA as a function of the Al content. Figure 8b shows the calculated stoichiometric ratio of intercalated water to Al as a function of the Al content. Figure 8c shows XRD patterns of AlOH5 and AlOH20 after heating to 900 °C in air, along with the reflections for NiAl2O4 (JCPDS #00-071-0965) and NiO (JCPDS #00-089-5881). Figure 8d shows the relative mass loss of the samples from 180 °C to 900 °C as determined by the TGA as a function of Al content, as well as the expected mass loss if the material had appropriate amounts of LDH balancing the excess charge from Al. The expected mass loss for three different LDH anions, NO3−, CO32− and OH−, is shown.
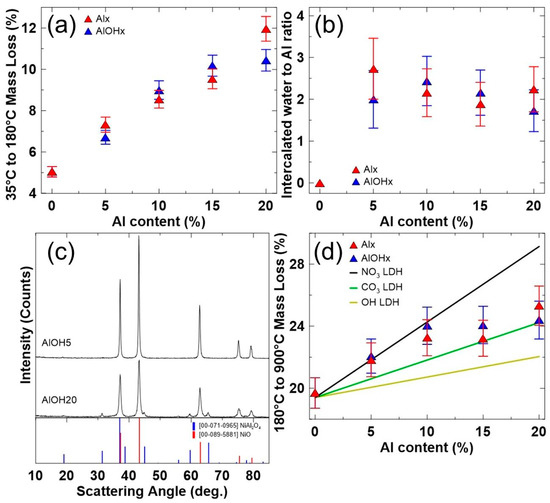
Figure 8.
(a) Measured mass loss (35 °C to 180 °C) as a function of Al content. (b) The calculated stoichiometric ratio of intercalated water to Al as a function of Al content. Intercalated water content calculations discussed in text. (c) XRD patterns (Cu Kα radiation) of heated AlOH5 and AlOH20 samples collected from 10°–85° along with the patterns of NiAl2O4 and NiO phases. Samples were heated to 900 °C in air. (d) Comparison of the measured mass loss (180 °C to 900 °C) as a function of Al content with the expected mass loss if the material had an LDH content equal to the Al content. The expected mass losses for three different LDH anions are shown.
Figure 8a shows the measured mass loss of the samples from 35 °C to 180 °C. This is expected to be the evolution of surface and intercalated water as discussed previously. The first mass loss stage is expected to follow the equation:
where y is the water content, including both surface and intercalated water. At 0% Al, there is no LDH phase, so all water evolved are surface water, not intercalated water. The amount of surface water was then assumed to be similar for all the samples measured, which may not be the case due to the particle size differences between the Alx series samples and AlOHx series samples. The surface water content was subtracted from the total calculated water content to obtain the intercalated water content plotted in Figure 8b. The calculated water content for a given mass loss is slightly different depending on the LDH anion considered, so a material with half nitrate and half carbonate LDH anions was used for the calculations and the difference stemming from a material incorporating only nitrates or only carbonates was accounted for in the uncertainty.
[Ni0.80Co0.15](1−x)/0.95Alx(OH)2(anionn−)x/n·yH2O →
[Ni0.80Co0.15](1−x)/0.95Alx(OH)2(anionn−)x/n + yH2O (x = 0–0.2),
The mass loss in Figure 8a increases roughly linearly as Al content increases and this supports the notion of an increasing amount of intercalated water rather than surface water. While particle size affects the amount of surface water, it can be seen in Figure 3 that particle sizes do not vary linearly. Figure 8b shows that the calculated intercalated water content tracks roughly double the Al content, regardless of which synthesis method was considered. This supports the likelihood of the LDH anion bringing in water molecules into the material (perhaps via solvation) rather than water molecules filling into the layers widened by LDH anions. Since the fraction of the LDH phase reaches 100% (Figure 4 and Figure 8d, as well as past work [13,14]), if water molecules only filled into layers, the amount of intercalated water would not increase linearly past 10% or 15% Al when the entire sample becomes the LDH phase.
Figure 8c shows that after the AlOH5 sample was heated to 900 °C in air, the hydroxide material decomposed to NiO, the rocksalt phase. This differs from past studies on the decomposition of hydroxide precursors of Al-doped LCO and NMC 111, where the hydroxides decomposed to a spinel phase [13,14]. While the past studies heated the materials to 500 °C in air and this study heated to 900 °C, it should be noted that no significant mass loss can be seen past 500 °C for either the NMC precursors [13] or the synthesized NCA precursors (Figure 6). A conversion from the spinel phase (M3O4) to the rocksalt phase (MO) should incur a mass loss of around 9% in oxygen, so it’s not expected that samples underwent a spinel to rocksalt phase transition after 500 °C. The difference in decomposition products is due to the higher Ni content in the material, which tends to decompose to a rocksalt phase, as opposed to Co and Mn, which tend to decompose to spinel phases [49,50].
The decomposition products of the AlOH20 phase match those of the NiO rocksalt phase as well as a NiAl2O4 spinel phase (Figure 8c). While layered Co oxides tend to decompose to the spinel phase [49], it is unlikely that this is the case in this material, as the AlOH5 sample has around 15% Co and 5% Al, while the AlOH20 sample has around 13% Co and 20% Al (Figure 2). The peaks that match NiAl2O4 are easily observable for the AlOH20 sample but barely discernable in the AlOH5 sample, which seems to represent more a function of 5% and 20% Al, rather than of 20% and 33% Al + Co.
Figure 8d compares the mass loss from 180 °C to 900 °C from the TGA experiments with the expected mass loss for [Ni0.80Co0.15](1−x)/0.95Alx(OH)2(anionn−)x/n (x = 0–0.2) decomposing to 1 − MO + MAl2O4 (M = Ni:Co (80/95):(15/95)). The three anions considered were OH−, NO3− and CO32−, the results for which are shown in Figure 8d as the black, green and yellow lines, respectively. The expected mass loss from SO42− as an anion (which would have more mass loss than NO3−) and the expected mass loss if there were no anions (which would not see an increase in mass loss as Al content increases) were two scenarios not considered in Figure 8d.
Figure 8d shows that mass loss from both the Alx series and AlOHx series are comparable when considering samples of the same Al content. This confirms the scenario discussed in Figure 5. Since the amount of LDH phase is similar, then the differences seen in Figure 5 stem from the Alx synthesis method producing particles with crystallite grains that are much smaller in size than the AlOHx method and broadening the peaks seen in the XRD patterns.
The experimental mass loss as a function of Al content seems to track well with the nitrate anion mass loss until around 10% Al, before maintaining similar mass losses until 20% Al where it has a similar mass loss as a sample with the carbonate anion. However, Figure 7c,d clearly shows the presence of nitrate and carbonate LDH anions in both the 10% and 20% Al samples, so the composition of the LDH is not as simple as saying that the material incorporates only nitrate anions up until 10% Al at which point it switches towards only carbonate anions until 20% Al. Previous work has also confirmed the presence of both nitrate and carbonate LDH anions in samples with 5% and 10% Al [17]. When the previous work synthesized a 5% Al sample using deaerated water and metal nitrate reagents, the mass loss of that sample was comparable to the 5% Al sample synthesized normally. This further supports a nitrate-dominant LDH anion composition at 5% Al. The mass loss seems to slow or stop at 10% Al, which has been observed in past studies but at an Al content of 1/6 for NMC 111 precursors [13] and an Al content of 20% for LCO precursors [14]. This was attributed to a limit of NO3− incorporation and a switch to a different mode of charge balancing.
4. Conclusions
The coprecipitation method was used to synthesize two series of [Ni0.80Co0.15](1−x)/0.95Alx(OH)2 (x = 0–0.2) materials by either combining all the metal reagents into one solution (Alx series) or having a separate Al nitrate in NaOH solution (AlOHx series) before addition into the reaction vessel. As the Al content increased, the LDH content increased as well. While both series produced samples near target compositions, the morphology of the Alx samples suggest the disruption of particle growth. Comparison of the Alx and AlOHx samples of the same Al content provide further support that Alx samples had much smaller particle sizes than AlOHx samples. Through the use of TGA-MS, NO3− and CO32− were confirmed as LDH anions, with OH− unknown and SO42− unlikely as LDH anions. Decomposition of the hydroxide produced a rocksalt phase and a spinel phase, with presumably all the Al in the spinel phase. Tracking the mass loss and MS data from the TGA-MS experiments may give some clues to the composition of the LDH as a function of Al content.
Author Contributions
Conceptualization, A.L. and J.R.D.; Investigation, A.L.; Methodology, A.L. and J.R.D.; Visualization, A.L.; Writing—original draft, A.L.; Writing—review & editing, A.L. and J.R.D.; Supervision, J.R.D.
Funding
The authors acknowledge NSERC and Tesla Canada for funding this work under the auspices of the Industrial Research Chairs Program. AL thanks the Walter C. Sumner Foundation for financial support.
Conflicts of Interest
The authors declare no conflict of interest.
References
- Lu, Z.; MacNeil, D.D.; Dahn, J.R. Layered Li[NixCo1−2xMnx]O2 Cathode Materials for Lithium-Ion Batteries. Electrochem. Solid-State Lett. 2001, 4, A200–A203. [Google Scholar] [CrossRef]
- MacNeil, D.D.; Lu, Z.; Dahn, J.R. Structure and Electrochemistry of Li[NixCo1−2xMnx]O2 (0≤x≤1/2). J. Electrochem. Soc. 2002, 149, A1332–A1336. [Google Scholar] [CrossRef]
- Linden, D.; Reddy, T.B. (Eds.) Linden’s Handbook of Batteries, 4th ed.; McGraw-Hill: New York, NY, USA, 2011. [Google Scholar]
- Rozier, P.; Tarascon, J.M. Review—Li-Rich Layered Oxide Cathodes for Next-Generation Li-Ion Batteries: Chances and Challenges. J. Electrochem. Soc. 2015, 162, A2490–A2499. [Google Scholar] [CrossRef]
- Xu, J.; Lin, F.; Doeff, M.M.; Tong, W. A review of Ni-based layered oxides for rechargeable Li-ion batteries. J. Mater. Chem. A 2017, 5, 874–901. [Google Scholar]
- Radin, M.D.; Hy, S.; Sina, M.; Fang, C.; Liu, H.; Vinckeviciute, J.; Zhang, M.; Whittingham, M.S.; Meng, Y.S.; Van der Ven, A. Narrowing the Gap between Theoretical and Practical Capacities in Li-Ion Layered Oxide Cathode Materials. Adv. Energy Mater. 2017, 1602888, 1–33. [Google Scholar] [CrossRef]
- Kim, J.; Lee, H.; Cha, H.; Yoon, M.; Park, M.; Cho, J. Prospect and Reality of Ni-Rich Cathode for Commercialization. Adv. Energy Mater. 2018, 8, 1–25. [Google Scholar]
- Madhavi, S.; Rao, G.V.S.; Chowdari, B.V.R.; Li, S.F.Y. Effect of aluminum doping on cathodic behaviour of LiNi0.7Co0.3O2. J. Power Sources 2001, 93, 156–162. [Google Scholar] [CrossRef]
- Guilmard, M.; Croguennec, L.; Delmas, C. Thermal Stability of Lithium Nickel Oxide Derivatives. Part II: LixNi0.70Co0.15Al0.15O2 and LixNi0.90Mn0.10O2 (x = 0.50 and 0.30). Comparison with LixNi1.02O2 and LixNi0.89Al0.16O2. Chem. Mater. 2003, 15, 4484–4493. [Google Scholar] [CrossRef]
- Lee, K.S.; Myung, S.T.; Moon, J.S.; Sun, Y.K. Particle size effect of Li[Ni0.5Mn0.5]O2 prepared by co-precipitation. Electrochim. Acta 2008, 53, 6033–6037. [Google Scholar] [CrossRef]
- Van Bommel, A.; Dahn, J.R. Synthesis of Spherical and Dense Particles of the Pure Hydroxide Phase Ni1/3Mn1/3Co1/3(OH)2. J. Electrochem. Soc. 2009, 156, A362–A365. [Google Scholar] [CrossRef]
- Van Bommel, A.; Dahn, J.R. Analysis of the growth mechanism of coprecipitated spherical and dense nickel, manganese, and cobalt-containing hydroxides in the presence of aqueous ammonia. Chem. Mater. 2009, 21, 1500–1503. [Google Scholar] [CrossRef]
- Zhao, X.; Zhou, F.; Dahn, J.R. Phases Formed in Al-Doped Ni1/3Mn1/3Co1/3(OH)2 Prepared by Coprecipitation: Formation of Layered Double Hydroxide. J. Electrochem. Soc. 2008, 155, A642–A647. [Google Scholar] [CrossRef]
- Luo, W.; Dahn, J.R. Preparation of Co1− zAlz(OH)2(NO3)z Layered Double Hydroxides and Li(Co1− zAlz)O2. Chem. Mater. 2009, 21, 56–62. [Google Scholar] [CrossRef]
- Zhao, M.Q.; Zhang, Q.; Huang, J.Q.; Wei, F. Hierarchical nanocomposites derived from nanocarbons and layered double hydroxides - Properties, synthesis, and applications. Adv. Funct. Mater. 2012, 22, 675–694. [Google Scholar] [CrossRef]
- Kim, Y.; Kim, D. Synthesis of high-density nickel cobalt aluminum hydroxide by continuous coprecipitation method. ACS Appl. Mater. Interfaces 2012, 4, 586–589. [Google Scholar] [CrossRef]
- Liu, A.; Zhang, N.; Li, J.; Casagrande, T.; Butcher, C.; Martinez, J.; Korinek, A.; Botton, G.; Dahn, J.R. Investigating the Removal of Layered Double Hydroxides in [Ni0.80Co0.15]0.95-xAl0.05+x(OH)2 (x = 0, 0.05) Prepared by Coprecipitation. J. Electrochem. Soc. 2018, 165, A2781–A2791. [Google Scholar] [CrossRef]
- Tessier, C.; Guerlou-Demourgues, L.; Faure, C.; Basterreix, M.; Nabias, G.; Delmas, C. Structural and textural evolution of zinc-substituted nickel hydroxide electrode materials upon ageing in KOH and upon redox cycling. Solid State Ionics 2000, 133, 11–23. [Google Scholar] [CrossRef]
- Huang, J.; Lei, T.; Wei, X.; Liu, X.; Liu, T.; Cao, D.; Yin, J.; Wang, G. Effect of Al-doped β-Ni(OH)2 nanosheets on electrochemical behaviors for high performance supercapacitor application. J. Power Sources 2013, 232, 370–375. [Google Scholar] [CrossRef]
- Su, L.; Ma, C.; Hou, T.; Han, W. Selective synthesis and capacitive characteristics of CoNiAl three-component layered double hydroxide platelets. RSC Adv. 2013, 3, 19807–19811. [Google Scholar] [CrossRef]
- Hall, D.S.; Lockwood, D.J.; Bock, C.; MacDougall, B.R. Nickel hydroxides and related materials: A review of their structures, synthesis and properties. Proc. R. Soc. A 2014, 471, 20140792. [Google Scholar] [CrossRef]
- Wang, X.; Lin, Y.; Su, Y.; Zhang, B.; Li, C.; Wang, H.; Wang, L. Design and synthesis of ternary-component layered double hydroxides for high-performance supercapacitors: Understanding the role of trivalent metal ions. Electrochim. Acta 2017, 225, 263–271. [Google Scholar] [CrossRef]
- Sarfraz, M.; Shakir, I. Recent advances in layered double hydroxides as electrode materials for high-performance electrochemical energy storage devices. J. Energy Storage 2017, 13, 103–122. [Google Scholar] [CrossRef]
- Latorre-Sanchez, M.; Atienzar, P.; Abellán, G.; Puche, M.; Fornés, V.; Ribera, A.; García, H. The synthesis of a hybrid graphene-nickel/manganese mixed oxide and its performance in lithium-ion batteries. Carbon 2012, 50, 518–525. [Google Scholar] [CrossRef]
- Seo, J.S.; Lee, J.W. Fast growth of the precursor particles of Li(Ni0.8Co0.16Al0.04)O2 via a carbonate co-precipitation route and its electrochemical performance. J. Alloys Compd. 2017, 694, 703–709. [Google Scholar] [CrossRef]
- He, K.; Ruan, Z.; Teng, X.; Zhu, Y. Facile synthesis and electrochemical properties of spherical LiNi0.85−xCo0.15AlxO2 with sodium aluminate via co-precipitation. Mater. Res. Bull. 2017, 90, 131–137. [Google Scholar] [CrossRef]
- Guilmard, M.; Pouillerie, C.; Croguennec, L.; Delmas, C. Structural and electrochemical properties of LiNi0.70Co0.15Al0.15O2. Solid State Ionics 2003, 160, 39–50. [Google Scholar] [CrossRef]
- Wu, S.H.; Yang, C.W. Preparation of LiNi0.8Co0.2O2-based cathode materials for lithium batteries by a co-precipitation method. J. Power Sources 2005, 146, 270–274. [Google Scholar] [CrossRef]
- Muto, S.; Tatsumi, K.; Kojima, Y.; Oka, H.; Kondo, H.; Horibuchi, K.; Ukyo, Y. Effect of Mg-doping on the degradation of LiNiO2-based cathode materials by combined spectroscopic methods. J. Power Sources 2012, 205, 449–455. [Google Scholar] [CrossRef]
- Ruan, Z.; Zhu, Y.; Teng, X. Effect of pre-thermal treatment on the lithium storage performance of LiNi0.8Co0.15Al0.05O2. J. Mater. Sci. 2016, 51, 1400–1408. [Google Scholar] [CrossRef]
- Zhang, H.Z.; Liu, C.; Song, D.W.; Zhang, L.Q.; Bie, L.J. A new synthesis strategy towards enhancing the structure and cycle stabilities of the LiNi0.80Co0.15Al0.05O2 cathode material. J. Mater. Chem. A 2017, 5, 835–841. [Google Scholar] [CrossRef]
- Huang, B.; Li, X.; Wang, Z.; Guo, H.; Xiong, X. Synthesis of Mg-doped LiNi0.8Co0.15Al0.05O2 oxide and its electrochemical behavior in high-voltage lithium-ion batteries. Ceram. Int. 2014, 40, 13223–13230. [Google Scholar] [CrossRef]
- Liu, B.S.; Wang, Z.B.; Yu, F.D.; Xue, Y.; Wang, G.J.; Zhang, Y.; Zhou, Y.X. Facile strategy of NCA cation mixing regulation and its effect on electrochemical performance. RSC Adv. 2016, 6, 108558–108565. [Google Scholar] [CrossRef]
- Tang, Z.F.; Bao, J.J.; Du, Q.X.; Shao, Y.; Gao, M.H.; Zou, B.K.; Chen, C.H. Surface Surgery of the Nickel-Rich Cathode Material LiNi0.815Co0.15Al0.035O2: Toward a Complete and Ordered Surface Layered Structure and Better Electrochemical Properties. ACS Appl. Mater. Interfaces 2016, 8, 34879–34887. [Google Scholar] [CrossRef]
- Tang, Z.F.; Wu, R.; Huang, P.F.; Wang, Q.S.; Chen, C.H. Improving the electrochemical performance of Ni-rich cathode material LiNi0.815Co0.15Al0.035O2 by removing the lithium residues and forming Li3PO4 coating layer. J. Alloys Compd. 2017, 693, 1157–1163. [Google Scholar] [CrossRef]
- Yoon, S.H.; Lee, C.W.; Bae, Y.S.; Hwang, I.; Park, Y.K.; Song, J.H. Method of Preparation for Particle Growth Enhancement of LiNi0.8Co0.15Al0.05O2. Electrochem. Solid State Lett. 2009, 12, A211–A214. [Google Scholar] [CrossRef]
- Xie, H.; Du, K.; Hu, G.; Duan, J.; Peng, Z.; Zhang, Z.; Cao, Y. Synthesis of LiNi0.8Co0.15Al0.05O2 with 5-sulfosalicylic acid as a chelating agent and its electrochemical properties. J. Mater. Chem. A 2015, 3, 20236–20243. [Google Scholar] [CrossRef]
- Duan, J.; Hu, G.; Cao, Y.; Tan, C.; Wu, C.; Du, K.; Peng, Z. Enhanced electrochemical performance and storage property of LiNi0.815Co0.15Al0.035O2 via Al gradient doping. J. Power Sources 2016, 326, 322–330. [Google Scholar] [CrossRef]
- Xie, H.; Hu, G.; Du, K.; Peng, Z.; Cao, Y. An improved continuous co-precipitation method to synthesize LiNi0.80Co0.15Al0.05O2 cathode material. J. Alloys Compd. 2016, 666, 84–87. [Google Scholar] [CrossRef]
- Duan, J.; Wu, C.; Cao, Y.; Huang, D.; Du, K.; Peng, Z.; Hu, G. Enhanced compacting density and cycling performance of Ni-riched electrode via building mono dispersed micron scaled morphology. J. Alloys Compd. 2017, 695, 91–99. [Google Scholar] [CrossRef]
- Purwanto, A.; Yudha, C.S.; Ubaidillah, U.; Widiyandari, H.; Ogi, T.; Haerudin, H. NCA cathode material: Synthesis methods and performance enhancement efforts. Mater. Res. Express 2018, 5, 122001. [Google Scholar] [CrossRef]
- Zhang, N.; Zhang, X.; Shi, E.; Zhao, S.; Jiang, K.; Wang, D.; Wang, P.; Guo, S.; He, P.; Zhou, H. In situ X-ray diffraction and thermal analysis of LiNi0.8Co0.15Al0.05O2 synthesized via co-precipitation method. J. Energy Chem. 2018, 27, 1655–1660. [Google Scholar] [CrossRef]
- Li, H.; Cormier, M.; Zhang, N.; Inglis, J.; Li, J.; Dahn, J.R. Is Cobalt Needed in Ni-Rich Positive Electrode Materials for Lithium Ion Batteries? J. Electrochem. Soc. 2019, 166, A429–A439. [Google Scholar] [CrossRef]
- Cullity, B.D.; Stock, S.R. Elements of X-ray Diffraction, 3rd ed.; Prentice Hall: Upper Saddle River, NJ, USA, 2001. [Google Scholar]
- Castro-García, S.; Castro-Couceiro, A.; Señarís-Rodríguez, M.A.; Soulette, F.; Julien, C.M. Influence of aluminum doping on the properties of LiCoO2 and LiNi0.5Co0.5O2 oxides. Solid State Ionics 2003, 156, 15–26. [Google Scholar] [CrossRef]
- Albrecht, S.; Kümpers, J.; Kruft, M.; Malcus, S.; Vogler, C.; Wahl, M.; Wohlfahrt-Mehrens, M. Electrochemical and thermal behavior of aluminum- and magnesium-doped spherical lithium nickel cobalt mixed oxides Li1-x(Ni1-y-zCoyMz)O2 (M = Al, Mg). J. Power Sources 2003, 119–121, 178–183. [Google Scholar] [CrossRef]
- Apte, N.G.; Kiran, E.; Chernosky, J.V. Thermal decomposition of aluminium-bearing compounds. J. Therm. Anal. 1988, 34, 975–981. [Google Scholar] [CrossRef]
- Olszak-Humienik, M.; Mozejko, J. Thermodynamic functions of activated complexes created in thermal decomposition processes of sulphates. Thermochim. Acta 2000, 344, 73–79. [Google Scholar] [CrossRef]
- Wang, L.; Maxisch, T.; Ceder, G. A first-principles approach to studying the thermal stability of oxide cathode materials. Chem. Mater. 2007, 19, 543–552. [Google Scholar] [CrossRef]
- Tian, C.; Lin, F.; Doeff, M.M. Electrochemical Characteristics of Layered Transition Metal Oxide Cathode Materials for Lithium Ion Batteries: Surface, Bulk Behavior, and Thermal Properties. Acc. Chem. Res. 2018, 51, 89–96. [Google Scholar] [CrossRef]

© 2019 by the authors. Licensee MDPI, Basel, Switzerland. This article is an open access article distributed under the terms and conditions of the Creative Commons Attribution (CC BY) license (http://creativecommons.org/licenses/by/4.0/).