Article

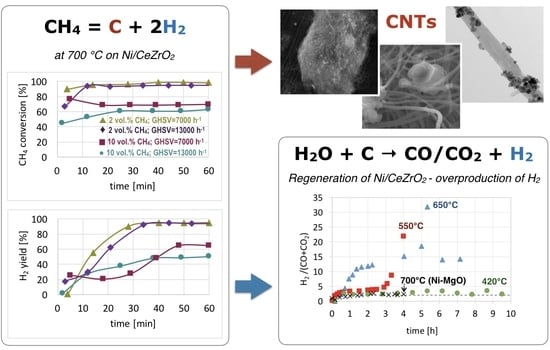
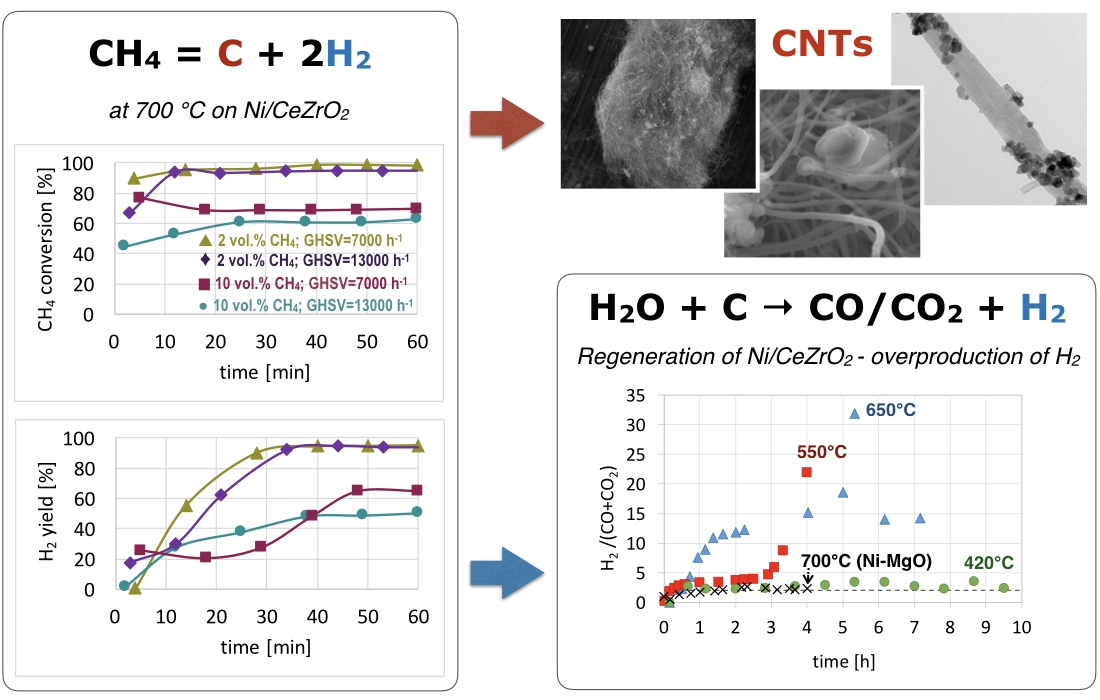
CNT and H2 Production During CH4 Decomposition over Ni/CeZrO2. I. A Mechanistic Study

Division of Chemistry and Technology of Fuels, Wroclaw University of Science and Technology, Gdanska 7/9, 50-344 Wroclaw, Poland
ChemEngineering 2019, 3(1), 26; https://doi.org/10.3390/chemengineering3010026
Submission received: 17 January 2019 / Revised: 27 February 2019 / Accepted: 28 February 2019 / Published: 7 March 2019

Abstract

:
This work presents a new insight into the potential of a Ni/CeZrO2 catalyst in two separate processes: (i) Chemical Vapor Deposition (CVD) using methane as a feedstock to obtain carbon nanotubes (CNTs) and H2, and (ii) catalyst regeneration with H2O that yields H2. The direct reaction of methane with H2O (steam methane reforming (SMR)) leads to H2 and CO (and CO2), whereas carbon deposition—regardless of its type—is an unwanted reaction. The concept presented in this work assumes dividing that process into two reactors, which allows one to obtain two valuable products, i.e., CNTs and H2. The literature data on CNT production via CVD ignores the issue of H2 formation. Moreover, there is no data concerning CNT production in fluidized bed reactors over ceria-zirconia supported metal catalysts. The results presented in this work show that CNTs can be formed on Ni/CeZrO2 during CH4 decomposition, and that the catalyst can be easily regenerated with H2O, which is accompanied by a high production of H2. The ability of Ni/CeZrO2 to be regenerated is its main advantage over the Ni-MgO catalyst that is popular for CNT production. This paper also shows that the Ni/CeZrO2 catalyst has the potential to be used for CNT and H2 production in a larger scale process, e.g., in a fluidized bed reactor.

Graphical Abstract

1. Introduction

The demand for hydrogen has been increasing in the last decades, not only because it is a component of synthesis gas and used in the hydrogenation processes, but also because it is a perfect energy carrier, e.g., in fuel cells (FC). It is predicted that, in the short term, the request for hydrogen production will continue to increase [1]. The cheapest option of H2 production is coal gasification, but the purification of raw gas for FC application is a great challenge, whereas H2 production from renewable sources has been considered to be economically justified only since the second half of the 21st century [2,3]. From the perspective of sustainability, there is a need to switch from fossils to renewable sources and raw waste materials. The ideal source of hydrogen is water. So far, water photo-splitting, photo-reforming, and water electrolysis [4,5,6,7] have been proposed. The great advantage of these methods is that they are environmentally friendly. However, in the short-term, they are often far from practical (water-splitting is still in the initial phase of development). Currently, approximately 85% of the total hydrogen is produced via the steam reforming of natural gas. Obtained gas, besides H2, also contains CO and CO2; therefore, this hydrogen cannot be used straight away as a fuel in fuel cells because it would poison Pt-based anodes. Hence, the gas for FC application requires purification of CO. The oxidation of CO to CO2 can be achieved, e.g., via a water gas shift (WGS) reaction (that also yields H2) or preferential CO oxidation (PROX).
Another reaction (besides the steam reforming of methane or WGS) that produces hydrogen is the decomposition of methane. This option allows one to obtain pure hydrogen without CO or CO2 emissions, since no oxidant, such as steam or oxygen, is used. Another advantage of this process is the possibility of the formation of structural carbon deposits, such as carbon nanotubes (CNTs). This can be achieved only if the process is carried out over a proper catalyst. Carbon nanotubes have attracted considerable attention due to their outstanding physical and chemical properties. Multi-walled (MWNT) or single-walled carbon nanotubes (SWNT) are expected to cause a significant breakthrough in electronics and engineering materials [8,9]. Various methods of CNT synthesis have been developed. High-quality CNTs can be synthesized by laser vaporization [10] and electric arc discharge [11], but these methods are not adaptable to industrial CNT production. Chemical vapor deposition (CVD) [12,13,14,15] is the most promising method for the large-scale production of CNTs. CVD requires a lower temperature of reaction and lower cost [16]. Currently, the critical problem for the commercial applications of CNTs is their large-scale production. The price of CNTs is high, and has recently decreased, but is still excessive for realistic industrialization.
The most popular catalysts utilized in CNT formation via the CVD method are Fe, Co, Mo, and Ni, supported on MgO, SiO2, Al2O3, CaO, and ZrO2 [17,18,19,20]. Nickel catalysts were found to be very active and stable. Moreover, they work in a wide range of temperatures [21,22]. The most popular support used in the CVD process is MgO, which presents some advantage over other supports. For example, MgO can be removed within a mildly acidic environment without damaging the CNTs [23].
The most common processes for the CVD growth of CNTs are fixed bed, floating catalyst, and fluidized bed [24]. Among these three methods, the most promising is the fluidized bed, which provides a sufficient growing space for CNTs, as well as proper mass and heat transfer, leading to a greater yield and a higher quality of obtained CNTs [25]. Many researchers prefer to produce CNTs on a large scale by utilizing fluidized bed reactors [26,27,28,29,30,31,32,33,34]. Some companies have even commercialized CNT production with a fluidized bed process [35]. However, all the products of the present fluidized bed process are agglomerated CNT products. Vertically aligned CNTs have been obtained in a fluidized bed reactor by Zhang et al. [31]. Maghsoodi et al. [25] have studied the continuous production of CNTs via the CVD of methane over the Fe/MgO catalyst in a fluidized bed reactor at 900 °C. They obtained MWNTs of about 20 nm in size, as well as SWNTs of 1.0–1.2 nm in diameter. Corrias et al. [27] proved the high efficiency of the CVD fluidized bed process to manufacture CNTs. They obtained a carbon yield of over 95%, with selectivity to CNTs close to 100%. Hsieh et al. [28] investigated the production of high-quality CNTs over Fe and Ni-Al2O3 mixture catalysts in the reaction decomposition of acetylene in a fluidized bed reactor at 700–850 °C. Compared to CNTs grown in a fixed bed reactor, the CNTs produced in a fluidized bed reactor showed higher purity. Their observations revealed that fluidization is an essential factor in the growth process of well-defined CNTs. The activity of the Fe–Al2O3 catalyst was found to be higher than that of the Ni–Al2O3 catalyst. All presented research focuses on CNT production, disregarding the issue of hydrogen formation and its further processing.
There is no data about the production of CNTs in fluidized bed reactors over ceria-zirconia supported metal catalysts. In general, these catalysts are known for being resistant to carbon deposition. Metal supported CeZrO2 catalysts are known for their high activity, e.g., in reforming reactions or WGS [36,37,38]. As studied in this work, a Ni catalyst supported on a commercial ceria-zirconia has already been found active in the steam reforming of toluene and 1-methylnapthalene [39,40], and WGS. In specific conditions, the catalyst does not lose its activity, despite some carbon deposition. Moreover, owing to its high oxygen storage capacity (OSC), high oxygen mobility, and excellent redox properties of ceria-zirconia, the catalyst is able to dissociatively adsorb H2O, providing very high hydrogen production. Some experiments of CH4 decomposition and H2O dissociation on powder Ni/CeZrO2 have already been performed [41]. Hybrids materials composed of CNTs and Ni/CeZrO2 have shown a good performance in the WGS reaction [42].
Hence, it is interesting to use a Ni/CeZrO2 catalyst to (i) produce CNTs and hydrogen via CVD using methane as a feedstock, and afterward (ii) to regenerate the spent catalyst with H2O with a simultaneous production of H2. Presented in this work, mechanistic studies of these reactions, conducted by tests on a laboratory scale using a “micro-reactor”, have shown the potential of Ni/CeZrO2 for further applications in fluidized bed reactors.

2. Experimental

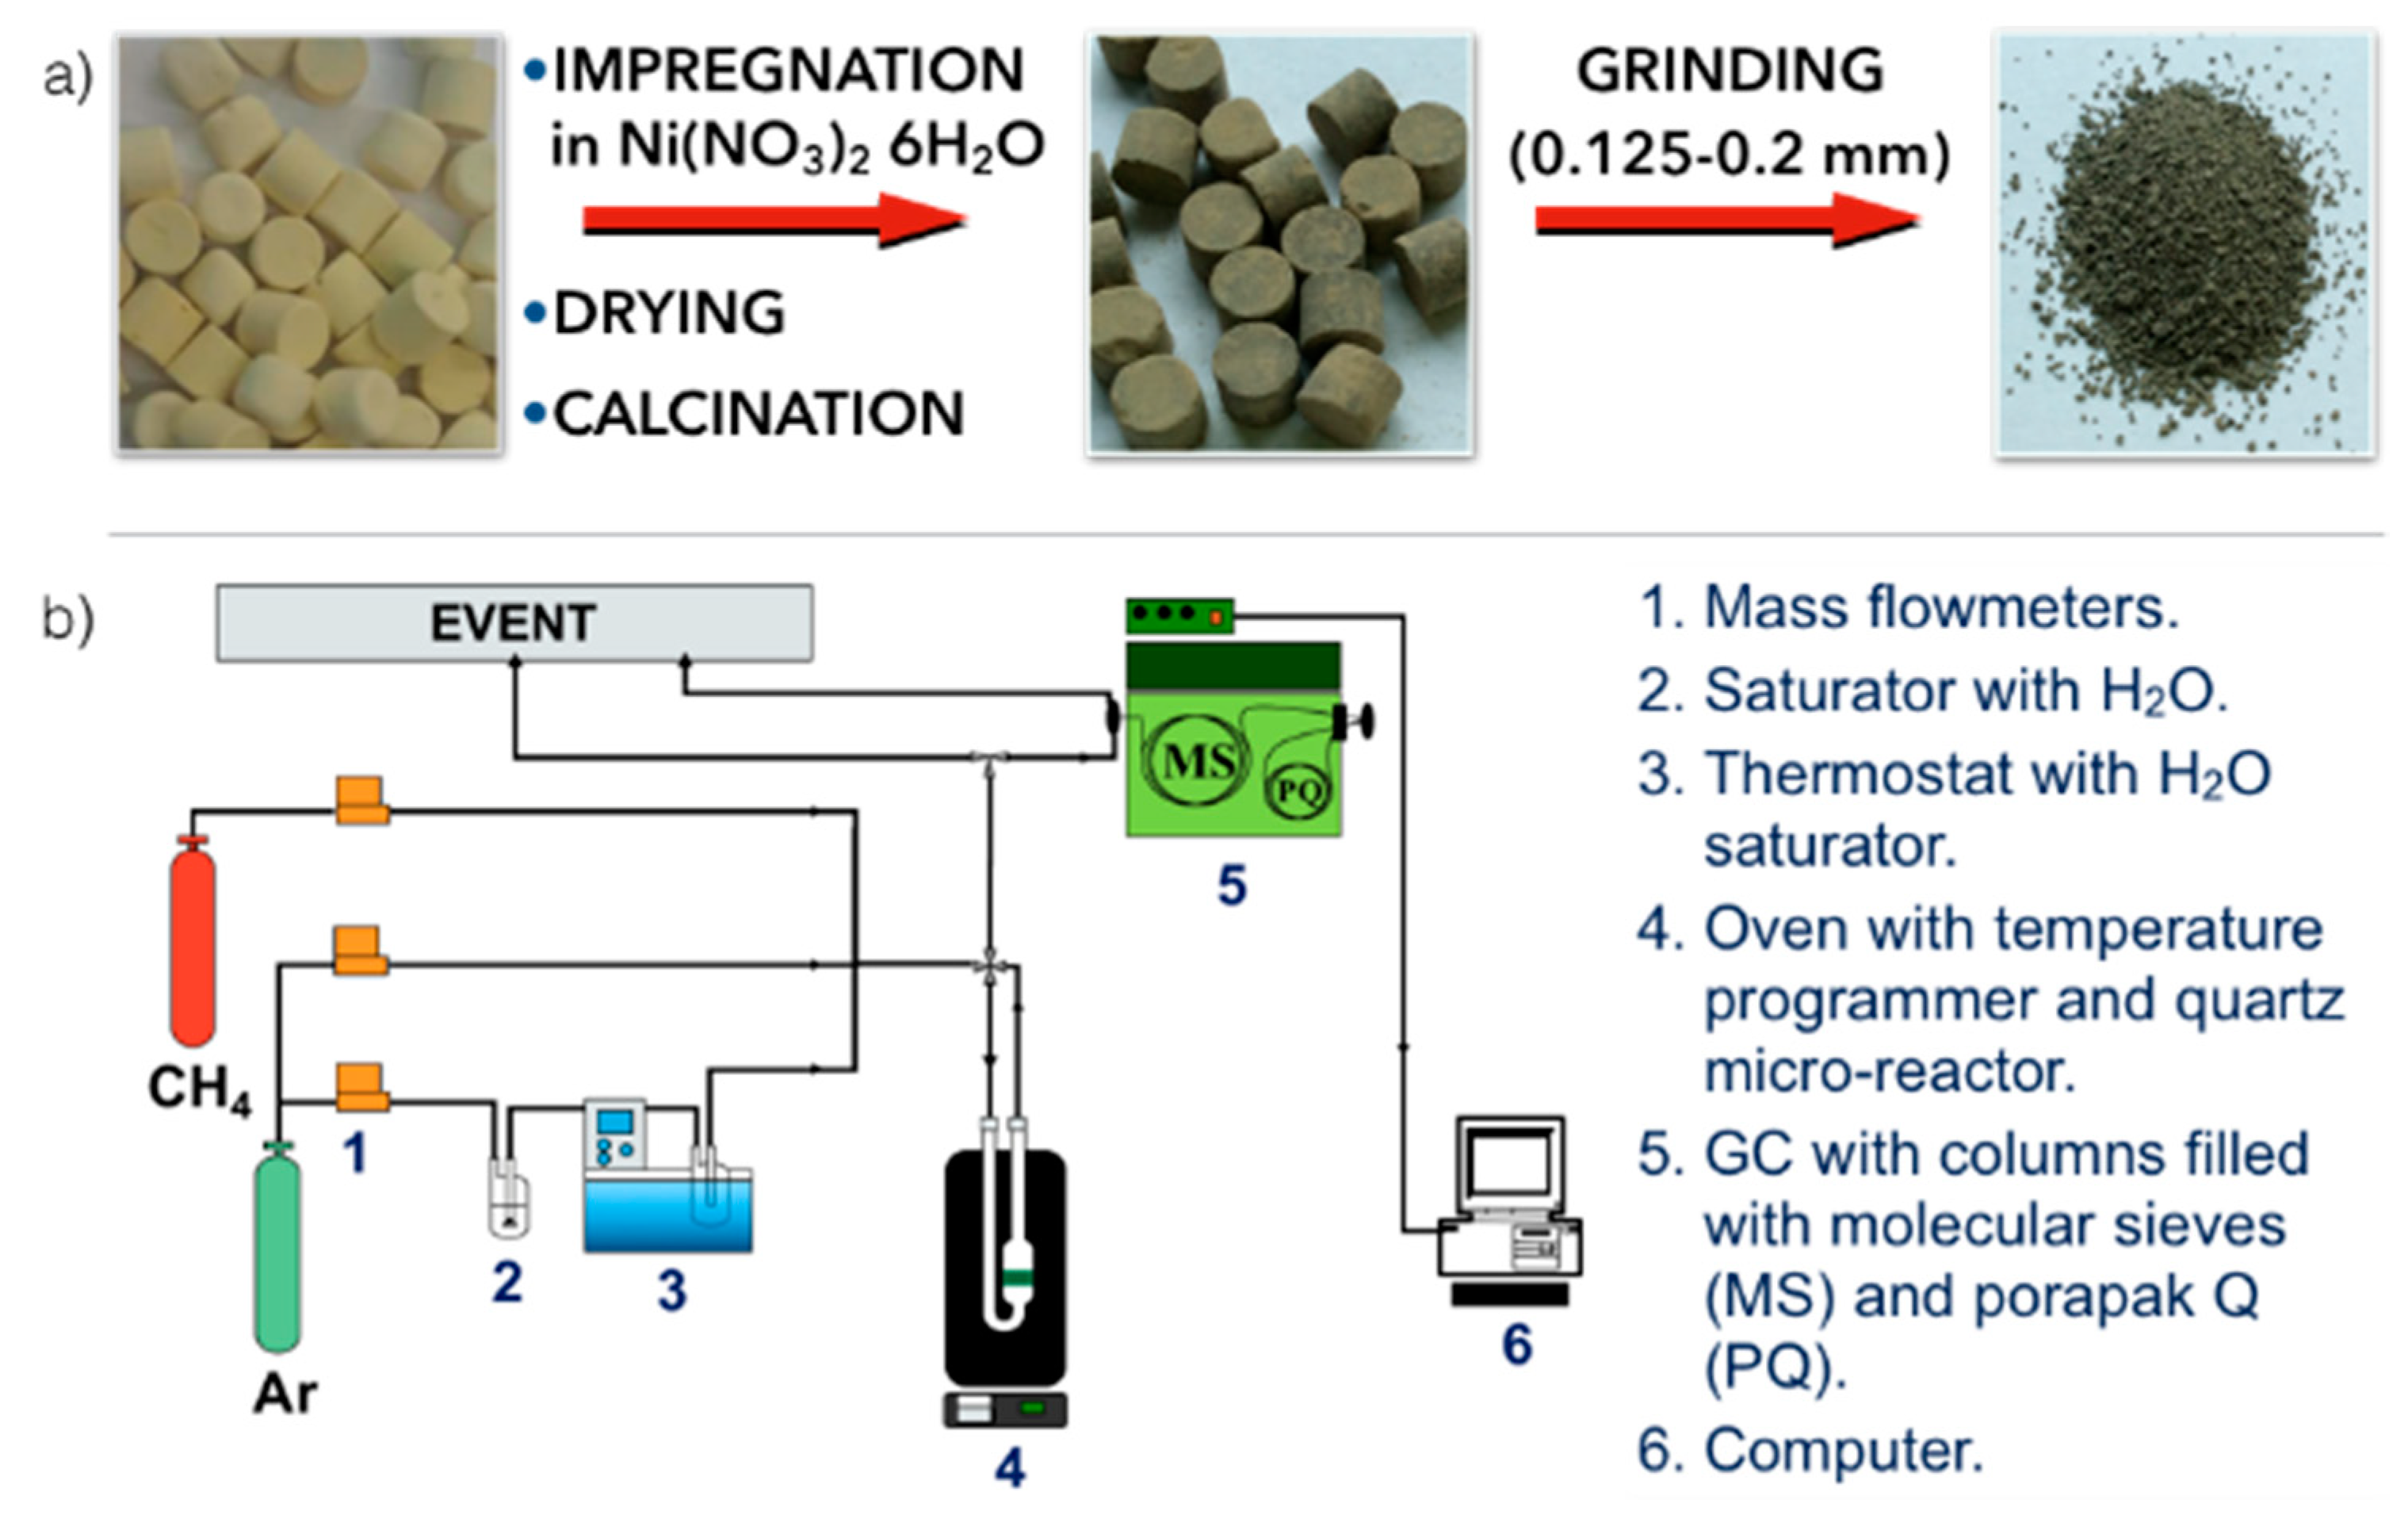
2.1. Preparation of the Formed Ni/CeZrO2 Catalyst

The CeZrO2 powder (ACTALYS 921, Rhodia Catalyst, France), having the SBET = 180 m2/g and containing 68 % of Ce and 32% of Zr, was formed in pellets (W × H = 5 mm × 4 mm) with the addition of 2 wt.% of graphite. The yellow CeZrO2 pellets (SBET = 110 m2/g) were impregnated with Ni(NO3)2·6H2O aqueous solution, dried in two steps (at room temperature overnight and 120 °C for 12 h) and calcined at 700 °C for 5 h (Figure 1). The nominal Ni loading in the pellets was 10 wt.%. The obtained Ni/CeZrO2 was then crushed and sieved to obtain a 0.125–0.2 mm fraction that was used for the further characterization and testing of CH4 decomposition.
The Ni-MgO catalyst (used as a reference catalyst in this work) was obtained using the sol-gel method. Nickel and magnesium nitrates (Ni(NO3)2·6H2O and Mg(NO3)2·6H2O) were dissolved with citric acid in deionized water and stirred at room temperature for 24 h. Obtained green sol was heated at 70 °C until it transformed into a gel which was then dried at 120 °C overnight. Next, the resulting green foam was calcined at 700 °C for 5 h to obtain a light brown powder. In the next step, the Ni-MgO solid solution was formed under the pressure of 40 Kp/cm and crushed in a mortar to obtain a fraction of 0.125–0.2 mm. The Ni content in the catalyst was 43 wt.%.

2.2. Tests of CH4 Decomposition and Catalyst Regeneration in H2O

A series of tests of CH4 decomposition over Ni/CeZrO2 and Ni-MgO catalysts was performed in a quartz reactor of 1.2 cm diameter that was placed in an oven with T regulator (Figure 1). Catalyst samples were subjected to tests of (i) CH4 decomposition of CNTs and H2, and (ii) subsequent regeneration in H2O. Both types of tests were conducted in temperature programmed (TP) conditions, raising the temperature from RT (for CH4 decomposition) or 100 °C (for catalyst regeneration in H2O) to 900 °C, with a heating rate of 10 °C/min. Tests of CH4 decomposition on Ni/CeZrO2 and Ni-MgO were performed in a flowing 2 vol.% CH4/Ar and at a gas hourly space velocity (GHSV) of 7000 h−1. Prior to some experiments, the catalyst was reduced by 5 vol.% H2/Ar at 700 °C for 2 h. The Ni/CeZrO2 was also subjected to tests in steady-state conditions in flowing 2 and 10 vol.% CH4/Ar and GHSV = 7000 and 13,000 h−1. Regeneration of catalysts was carried out in flowing 2.8 vol.% H2O/Ar at GHSV = 5000 h−1. The inlet and outlet gas composition were determined using a gas chromatograph equipped with a TCD.

2.3. Catalyst Characterization

The crystal structures of the Ni/CeZrO2 and Ni-MgO catalysts were determined by a powder XRD diffractometer using Panalytical X’Pert Pro, Co-K radiation (λ = 0.1789 nm) and a Siemens 500D diffractometer employing Cu-K radiation (λ = 0.154 nm), respectively. The crystallographic structures of the samples and Miller indices (hkl) of the diffraction lines were determined using bibliographic data (JCPDS published by the Joint Committee on Powder Diffraction Standards). Thermogravimetric analyses of spent Ni/CeZrO2 and Ni-MgO catalysts were performed using a Metter-Toledo apparatus. Analyses were conducted in flowing air with a linear temperature increase from RT to 950 °C with a heating rate of 10 °C/min. Scanning electron microscopy of Ni/CeZrO2 was performed using the Quanta 250 FEG microscope. The micrographs were obtained under a low vacuum (80 Pa) with an acceleration voltage of 10 kV from secondary electrons collected by Large Filed Detector (LFD). High-resolution transmission electron microscopy (HRTEM) of Ni/CeZrO2 was performed using the JEOL-JEM 2011 HR apparatus associated with a top entry device operating at 200 kV. The specific surface area (SSA) of Ni/CeZrO2 was measured using the Quantachrome Autosorb iQ by physical adsorption of N2 at the temperature of liquid nitrogen. The SSA was determined using the Brunauer-Emmett-Teller (BET) equation. Prior to measurements, samples were outgassed in a vacuum at 150 °C for 12 h.

3. Results and Discussion

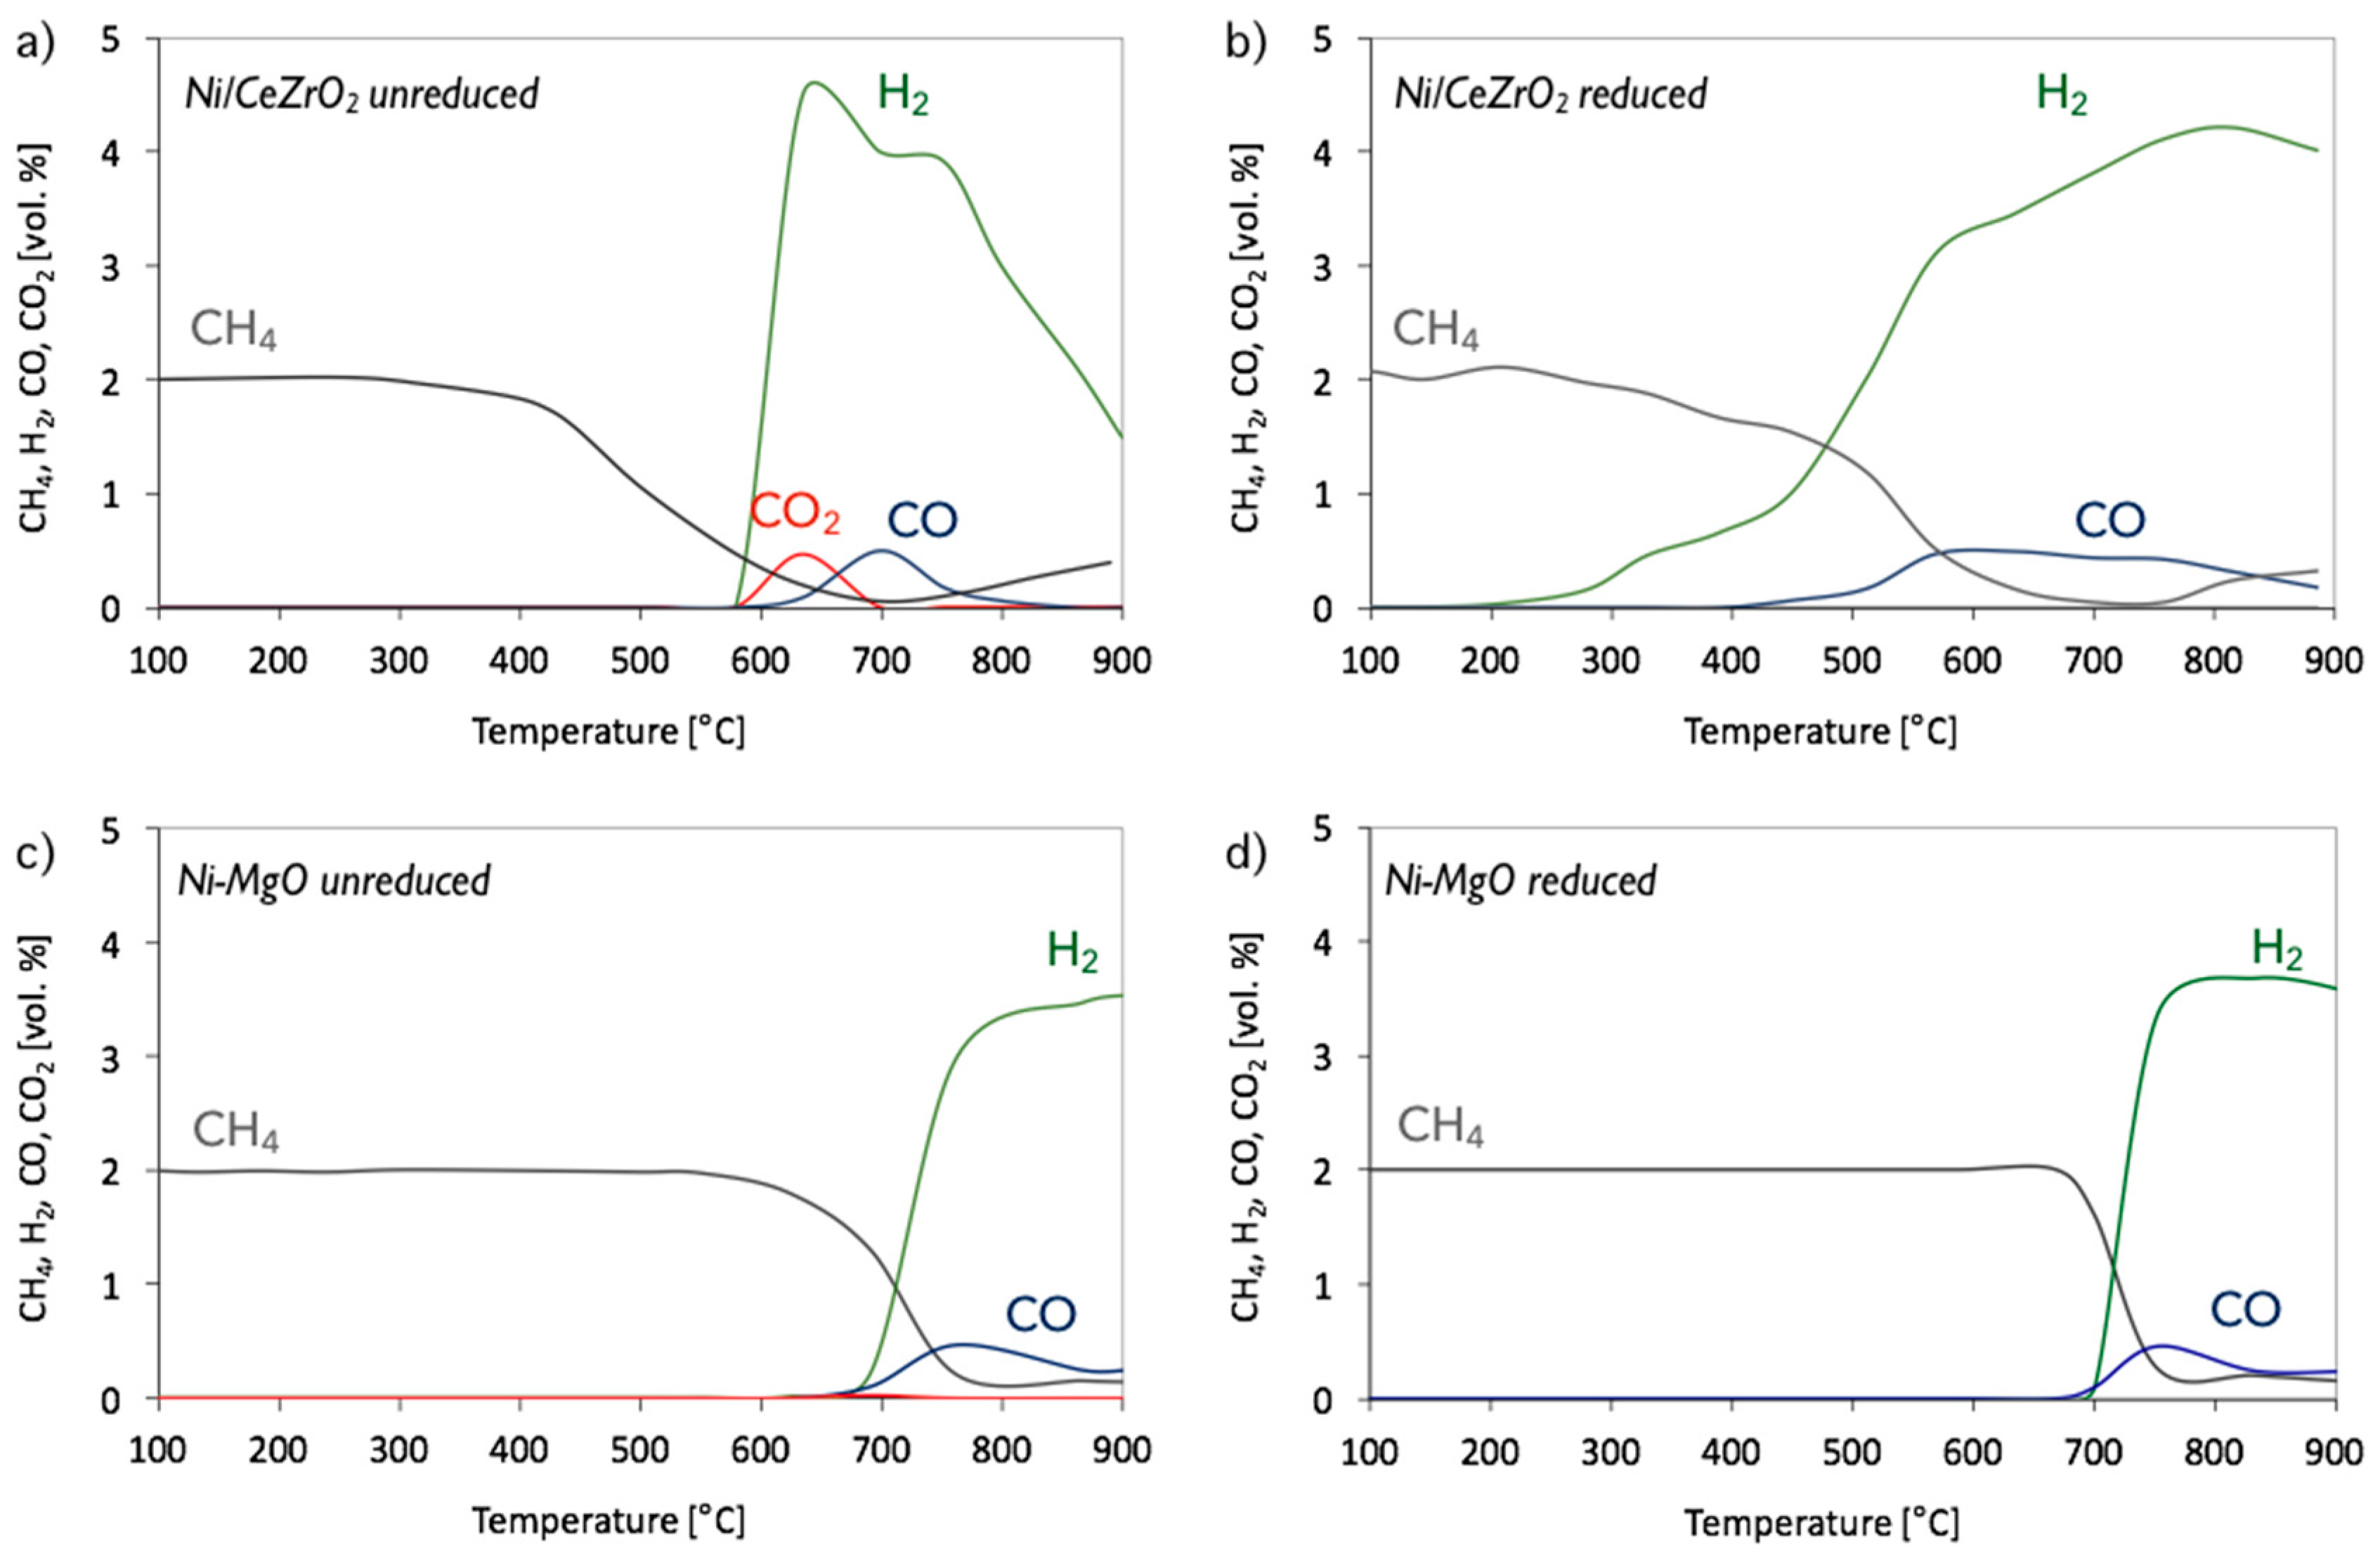
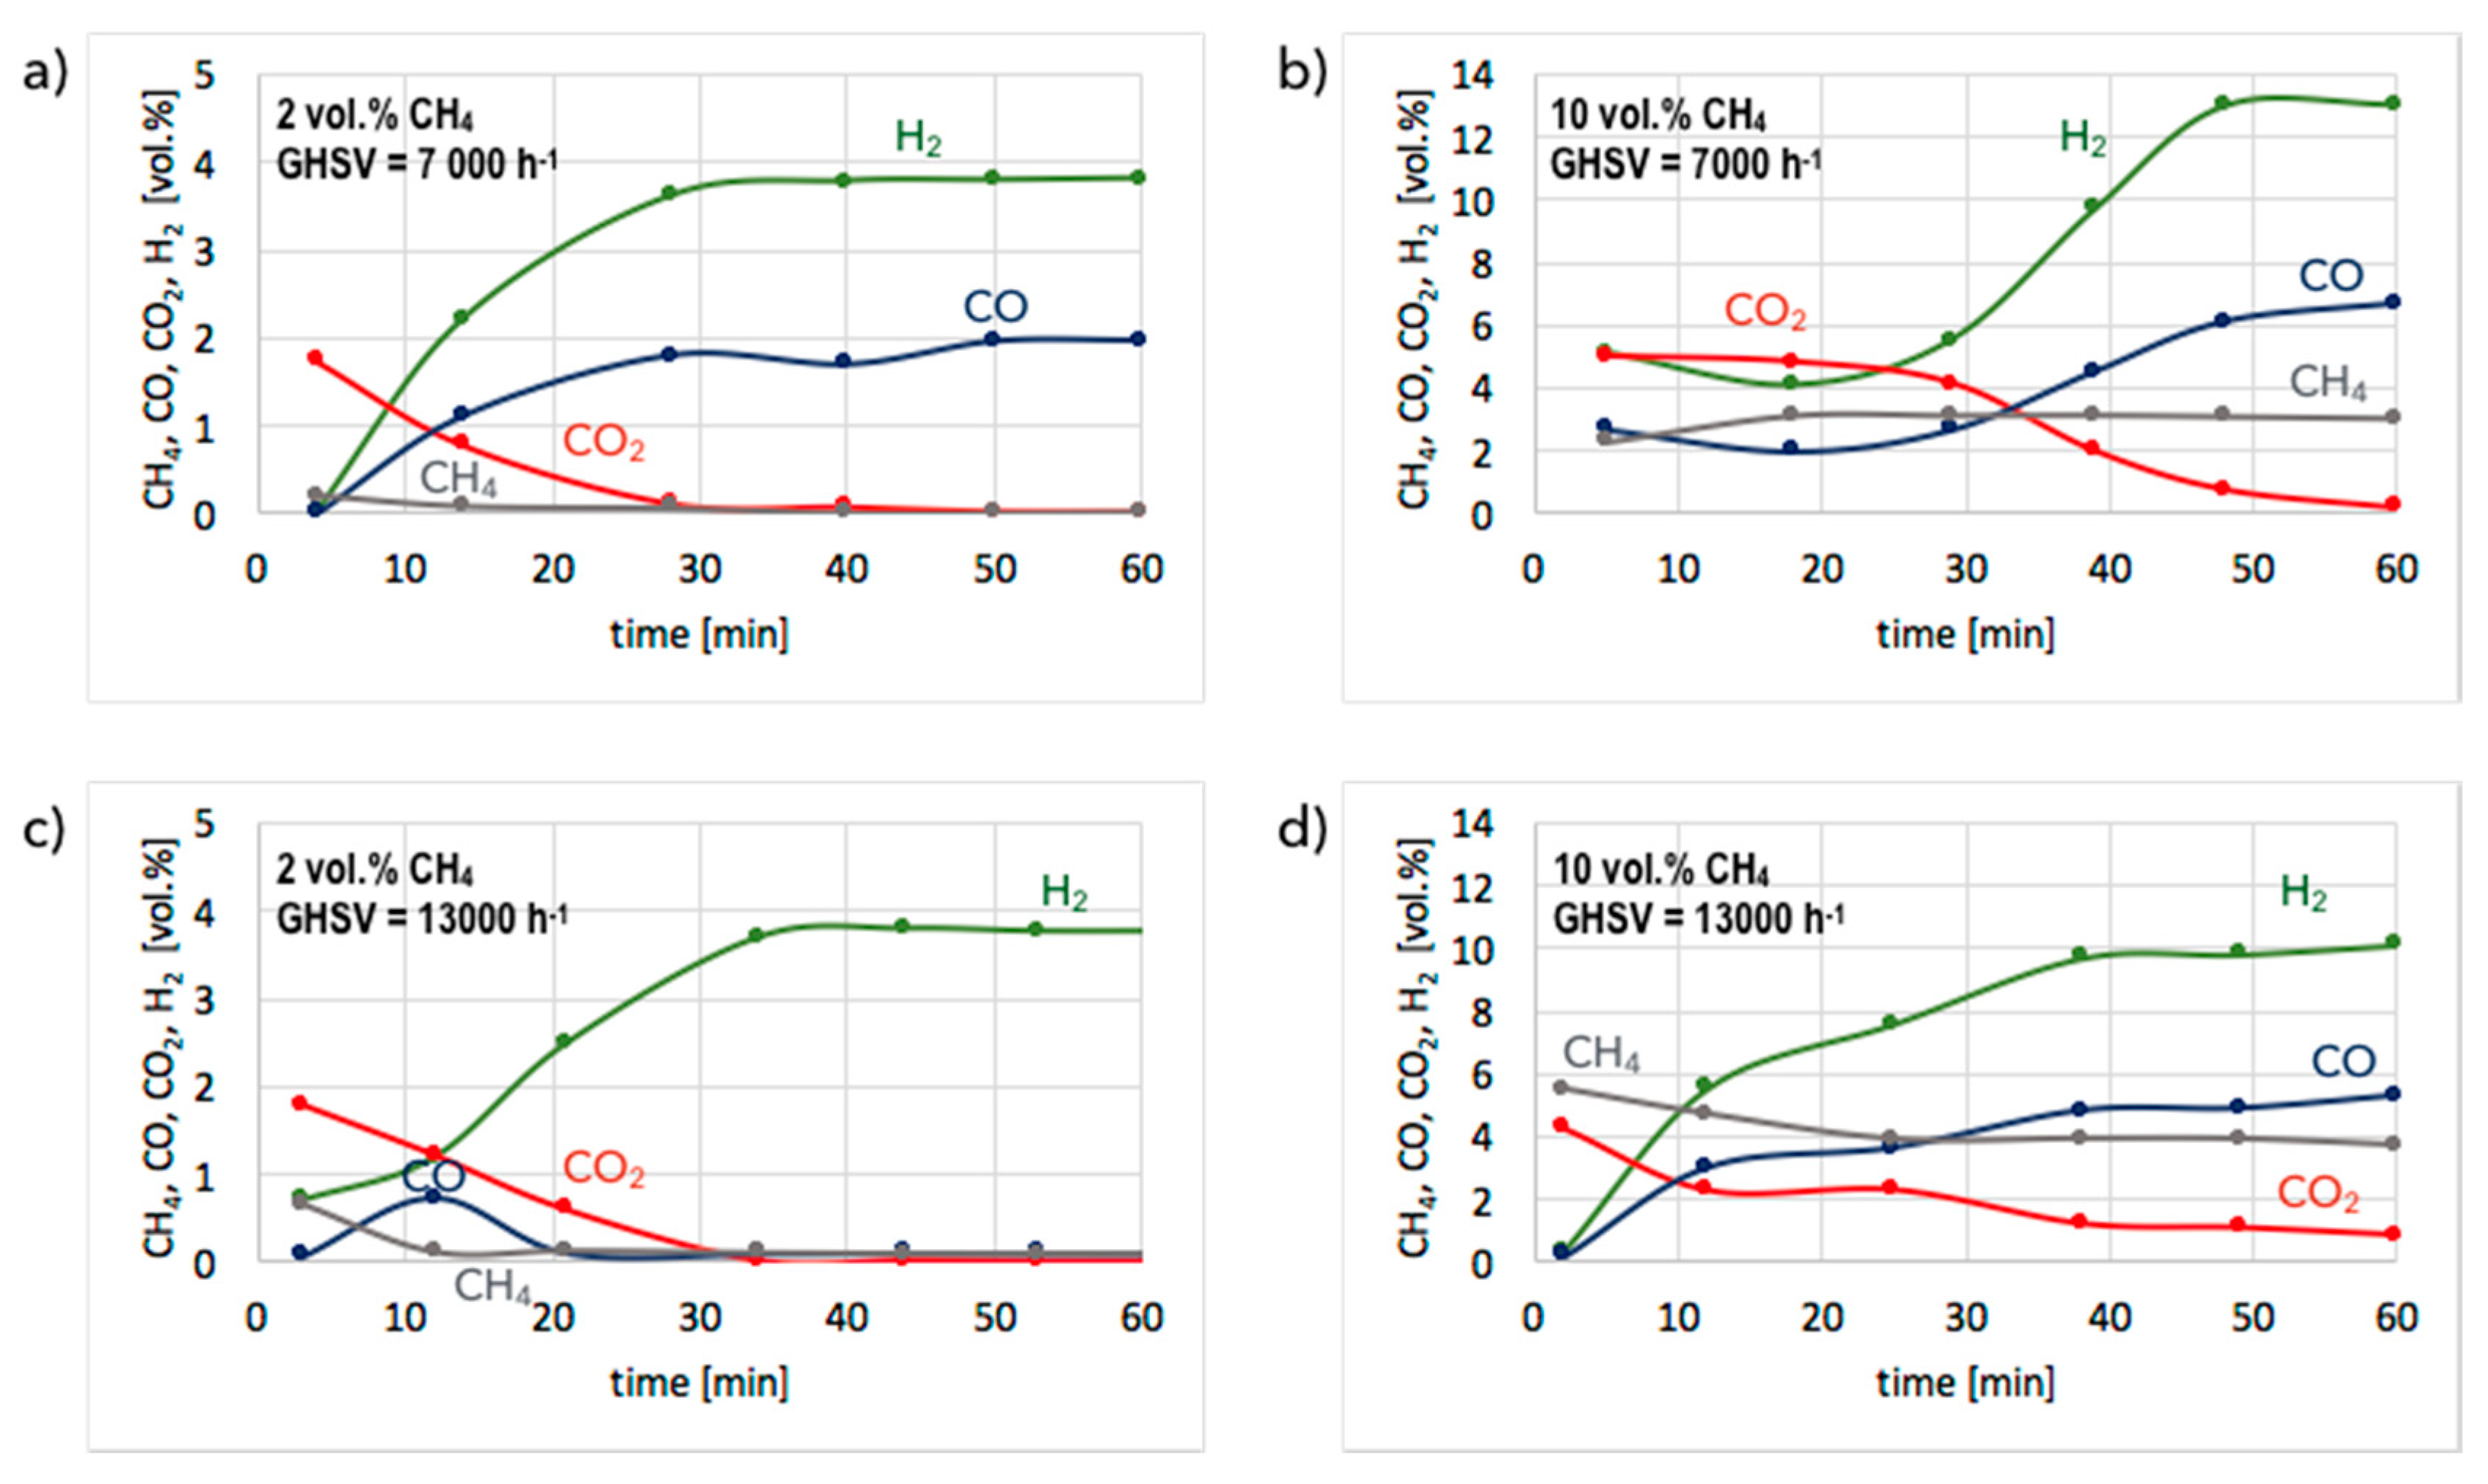
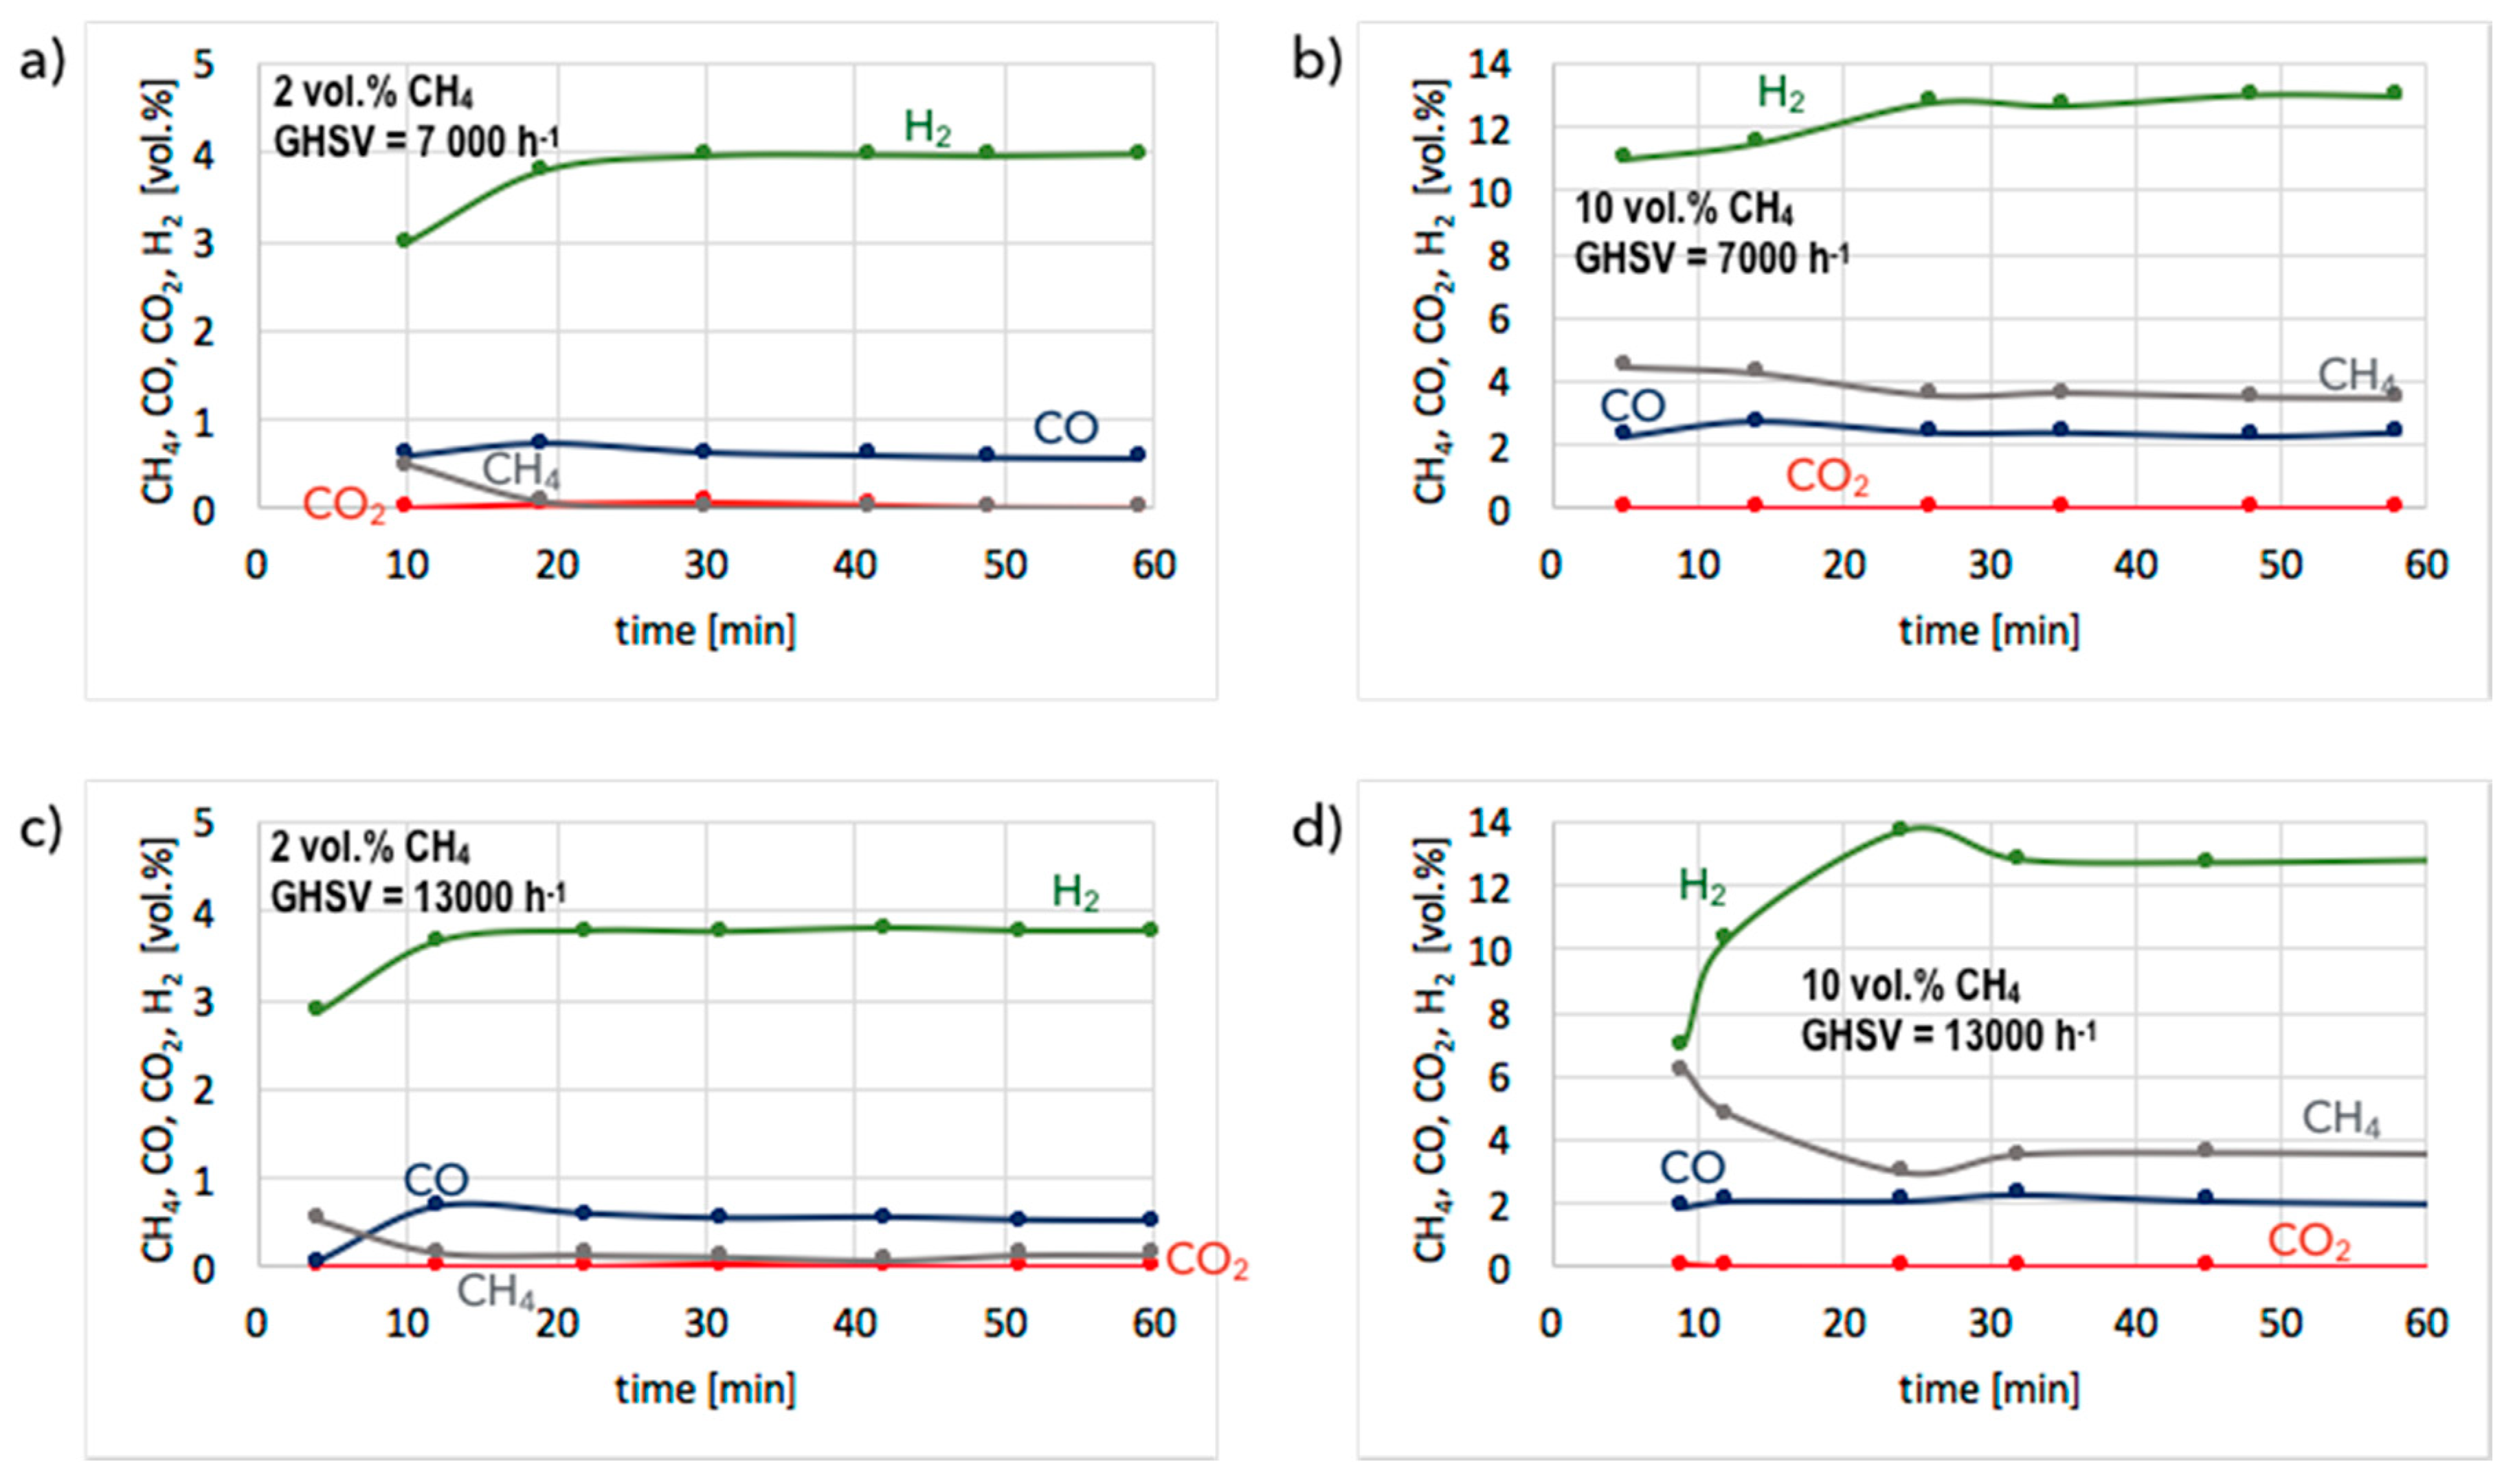
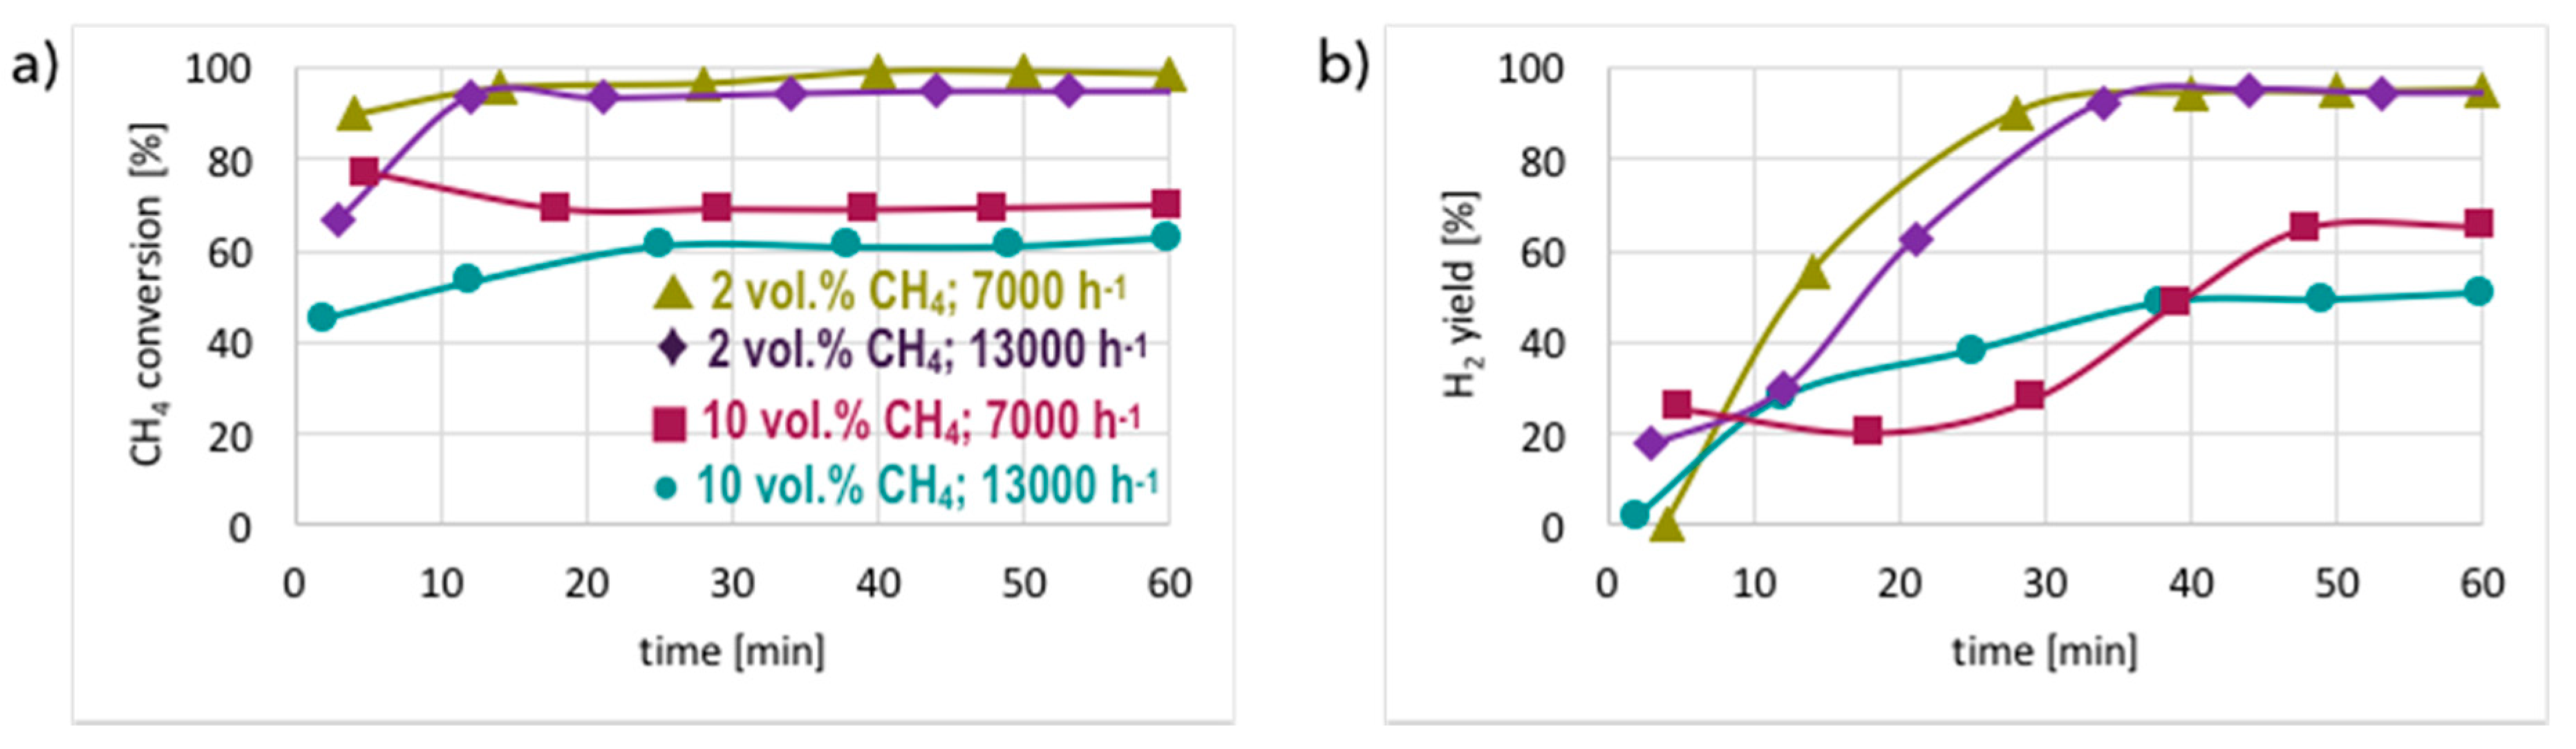
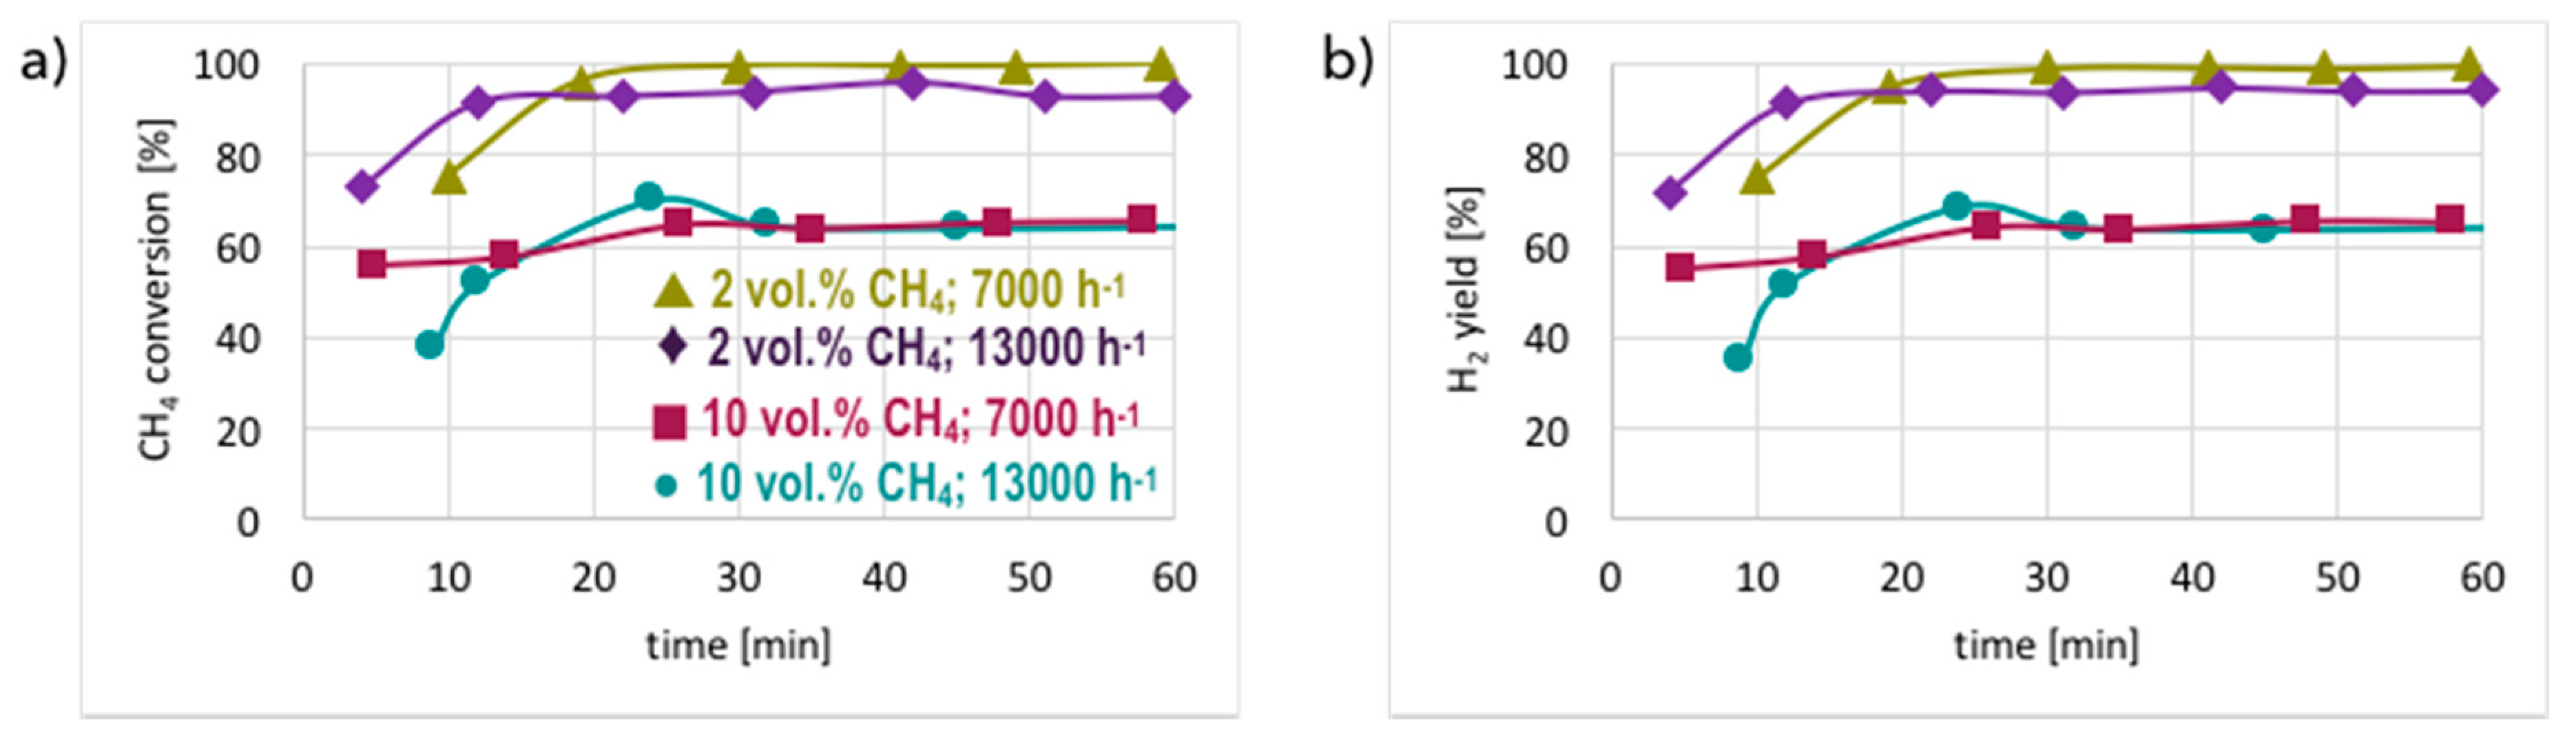
3.1. CH4 Decomposition to CNTs and H2

The tests of CH4 decomposition in temperature-programmed (TP) mode were carried out over unreduced and pre-reduced Ni/CeZrO2 and Ni-MgO catalysts to determine the temperature region at which those reactions can occur. For determining the time needed either for optimal CNT production or catalyst regeneration, tests in isothermal conditions were performed. Figure 2 shows the evolution of CH4, CO, CO2, and H2 as a function of temperature during methane decomposition. It can be seen that temperature profiles for unreduced and pre-reduced Ni/CeZrO2 differ from each other. The decomposition of CH4 is a few-step dehydrogenation, which requires the presence of reduced metal sites. Hence, as is seen in Figure 2a, the NiO in unreduced Ni/CeZrO2 first undergoes reduction to Ni with CH4 (evidenced by CO2 formation from 580 °C; Equation (1)). Immediately after, methane dehydrogenates to release H2 and form carbon species on Ni sites (Equation (2)). However, ceria-zirconia, owing to its high oxygen content and high oxygen mobility, is able to oxidize hydrocarbons to CO2 and H2O. Thus, the release of CO2 to the gas phase can be partly ascribed to the reduction of CeZrO2 (Equation (3)). The presence of CO in the gas phase could be due to the partial oxidation of CH4 by the lattice oxygen from the ceria-zirconia (Equation (4)) or oxidation of the carbon species deposited on the Ni (Equation (5)). As presented in Figure 2b, the pre-reduction of Ni/CeZrO2 allows the temperature of the methane dehydrogenation on Ni (Equation (6)) to significantly decrease as low as 200 °C, where H2 formation starts. The reduction of CeZrO2 with H2 is only partial (Equation (7)). Therefore, the oxygen remaining in the lattice can still be used either for CH4 or C oxidation to CO (Equations (4) and (5)), which is observed in the gas phase from 400 °C.
4NiO + CH4 = 4Ni + CO2 + 2H2O
CH4 + Ni → Ni(C) + 2H2
2CeZrO2 + xCH4 = 2CeZrO(2−2x) + xCO2 + 2xH2O
CeZrO2 + xCH4 = CeZrO(2−x) + xCO + 2xH2
CeZrO2 + Ni(C) = CeZrO(2−x) + xCO + Ni
NiO + H2 = Ni + H2O
CeZrO2 + xH2 = CeZrO(2−x) + xH2O
The decomposition of CH4 on Ni-MgO takes place at higher temperatures than in cases of Ni/CeZrO2. Moreover, as can be seen in Figure 2c,d, catalyst pre-reduction does not have a significant impact on its performance. In both unreduced and reduced Ni-MgO, dehydrogenation of CH4 occurred from ca. 690 °C. Insignificant production of CO2 was observed on unreduced Ni-MgO at 690 °C.
The results of tests carried out over unreduced and pre-reduced Ni/CeZrO2 at 700 °C in flowing 2 and 10 vol.% CH4/Ar and at GHSV = 7000 and 13,000 h−1 are presented in Figure 3 and Figure 4, whereas CH4 conversions and H2 yields for both forms of the catalyst are presented in Figure 5 and Figure 6. As previously mentioned, CH4 decomposition over unreduced Ni/CeZrO2 is preceded by a reduction of NiO to zero-valent Ni. That is the reason for significant CO2 production from the beginning of the test on the unreduced catalyst (Figure 3). The presence of reduced metal sites allows hydrocarbon adsorption and its subsequent dehydrogenation, which manifests itself in H2 production that increases with the time of the experiment. At the same time, carbon deposits are formed on Ni (denoted Ni(C)). Catalyst pre-reduction allows the immediate dehydrogenation of CH4. This process is why no, or insignificant, CO2 is formed during tests on pre-reduced Ni/CeZrO2 (Figure 4).
The presented results indicate that significantly better results in terms of CH4 conversion are obtained for low concentrations of methane in the reaction mixture (i.e., 2 vol.% CH4/Ar). Pre-reduced or not, the Ni/CeZrO2 does not contain a sufficient number of active sites for the complete conversion of CH4 when its concentration in the feed is 10 vol.%. Moreover, it does not matter, from the perspective of methane conversion and H2 yield, whether the catalyst was pre-reduced or not. In both cases, 100% CH4 conversion and 100% H2 yield were achieved after 1 h in flowing 2 vol.% CH4/Ar at GHSV = 7000 h−1. The increase of GHSV to 13,000 h−1 resulted in a slight decrease (to ca. 90%) of methane conversion and H2 yield. However, H2 formation on the unreduced Ni/CeZrO2 stabilized after approximately 30 minutes, because at the beginning of the test the catalyst surface was being reduced, and the active sites for CH4 dehydrogenation were just being formed. The difference in CH4 conversion and H2 yield at different GHSVs was more visible during tests carried out under flowing 10 vol.% CH4/Ar. The performance of unreduced Ni/CeZrO2 was better when the GHSV was lower. It can be seen in Figure 3 that a lower GHSV (higher contact time) facilitates the oxidation of surface carbon species deposited on Ni, renovating the same active sites for CH4 dehydrogenation. The impact of GHSV on catalyst performance was insignificant for the pre-reduced Ni/CeZrO2.
The initial state of the catalyst (unreduced or pre-reduced) has an impact on the CO and CO2 presence in the product gas. It is obvious that the presence of CO2 in the gas phase is due to catalyst reduction by methane, which is the reason for its absence during tests on the pre-reduced catalyst. CO is produced on both catalysts, but is significantly higher on the unreduced one because of a higher content of oxygen in the ceria-zirconia lattice. As mentioned before, oxygen can oxidize either CH4 or carbon species deposited on Ni (Equations (4) and (5)).
The increase in the catalyst mass after the above-described tests is presented in Table 1. Carbon deposition on Ni/CeZrO2 after a 1 h test in flowing 2 vol.% CH4/Ar was very small: up to 2.5% for the unreduced catalyst and up to 3.6% for the pre-reduced one. Higher amounts of carbon deposits were noticed after tests carried out in flowing 10 vol.% CH4/Ar. The maximal, but not satisfactory, mass increase that resulted from carbon deposition was noticed for pre-reduced Ni/CeZrO2 after a test carried out under GHSV = 7000 h−1. In general, a higher number of active sites for CH4 decomposition will lead to a higher amount of carbon deposits, but a study performed on powder Ni/CeZrO2 with Ni loading of 10 and 30 wt.% did not show significantly higher carbon build-up on the catalyst surface (Table S1). At such a high metal loading, Ni particles formed large agglomerates; thus, the number of Ni particles accessible for CH4 adsorption and dehydrogenation was lower than expected.
Thermogravimetric analysis of the unreduced Ni/CeZrO2 after a 1 h test of CH4 decomposition carried out in flowing 10 vol.% CH4/Ar at GHSV = 7000 h−1 (Figure 7a) showed a 12% mass decrease, of which 8.3% was carbon deposits. The sample contained about 2.8% of amorphous carbon (DTG, negative peak at 400 °C) and 5.5% of structural carbon (negative peak at 600 °C). On the contrary, the TGA for Ni-MgO after CH4 decomposition at the same conditions revealed that carbon content in the sample was as high as 79% (which corresponds to 8.9 mol C/mol Ni—over 2 times higher than for Ni/CeZrO2). Deposited carbon was in most structural (peak at 715 °C on the DTG curve in Figure 7b).
The XRD of Ni/CeZrO2 and Ni-MgO catalysts are presented in Figure 8. Typical reflections for the CeZrO2 phase can be observed on diffractograms for pristine CeZrO2 (Figure S1), and fresh and spent Ni/CeZrO2 catalysts (Figure 8a). The presence of NiO in the fresh catalyst (curve “i”), as well as its reduction to Ni (curve “ii”), is proven by the appearance of reflections at ca. 43, 51, and 75° (NiO) and 52 and 61° (Ni). No reflections indicating the presence of structural carbon (CNTs) can be observed at ca. 26°, which is due to its very low content in the sample. The diffractogram of fresh Ni-MgO (Figure 8b, curve “i”) displays only peaks characteristic of the solid Ni-MgO solution. The reduction of the catalyst in flowing H2 and CH4 led to the formation of Ni phase (peaks at ca. 45, 52, and 74°); however, the Ni-MgO phase was still occurring. Unlike the case of Ni/CeZrO2, the diffractogram of the Ni-MgO catalyst after CH4 decomposition displayed a peak at ca. 26°, thereby providing the evidence for the presence of structural carbon deposits.
The SEM observations of the Ni/CeZrO2 catalyst before and after CH4 decomposition are presented in Figure 9. Due to the low carbon amount in the sample after 1 h tests, it was impossible to detect carbon using SEM. In order to determine particular types of carbon species on the catalyst surface after CH4 decomposition, the SEM observations were performed for the catalyst sample after 3 h of CH4 decomposition. As presented in Figure 9b, some grains of Ni/CeZrO2 were covered with filamentous carbon deposits. However, those covered with carbon deposit grains were detected only in the same regions of the sample, whilst most of the catalyst particles remained unaffected. The SEM analysis revealed the presence of filamentous carbon of different curvatures and lengths (Figure 9c,d), whereas TEM (Figure 10) proved that these were CNTs (the presence of parallel graphene layers). The external diameters of detected multiwall CNTs were up to 64 nm. It was also observed that Ni/CeZrO2 nanoparticles were attached to CNT walls. Those in situ formed hybrid materials (i.e., Ni/CeZrO2@CNT) can reveal catalytic activity, e.g., in water gas shift [42] or methane dry reforming (Figure S2).
The Ni/CeZrO2 catalyst was also subjected to N2 sorption in order to determine its textural properties. The specific surface area (SSA), pore volume, and mean pore size are presented in Table 2. It can be observed that the textural properties of the catalyst did not change after its reduction in H2. However, the increase of specific surface area can be observed for the Ni/CeZrO2 sample spent in CH4 decomposition. The increase in SSA, as well as the decrease in mean pore size, can be explained by the presence of CNTs in the sample (also proven by TGA and microscopic observations).

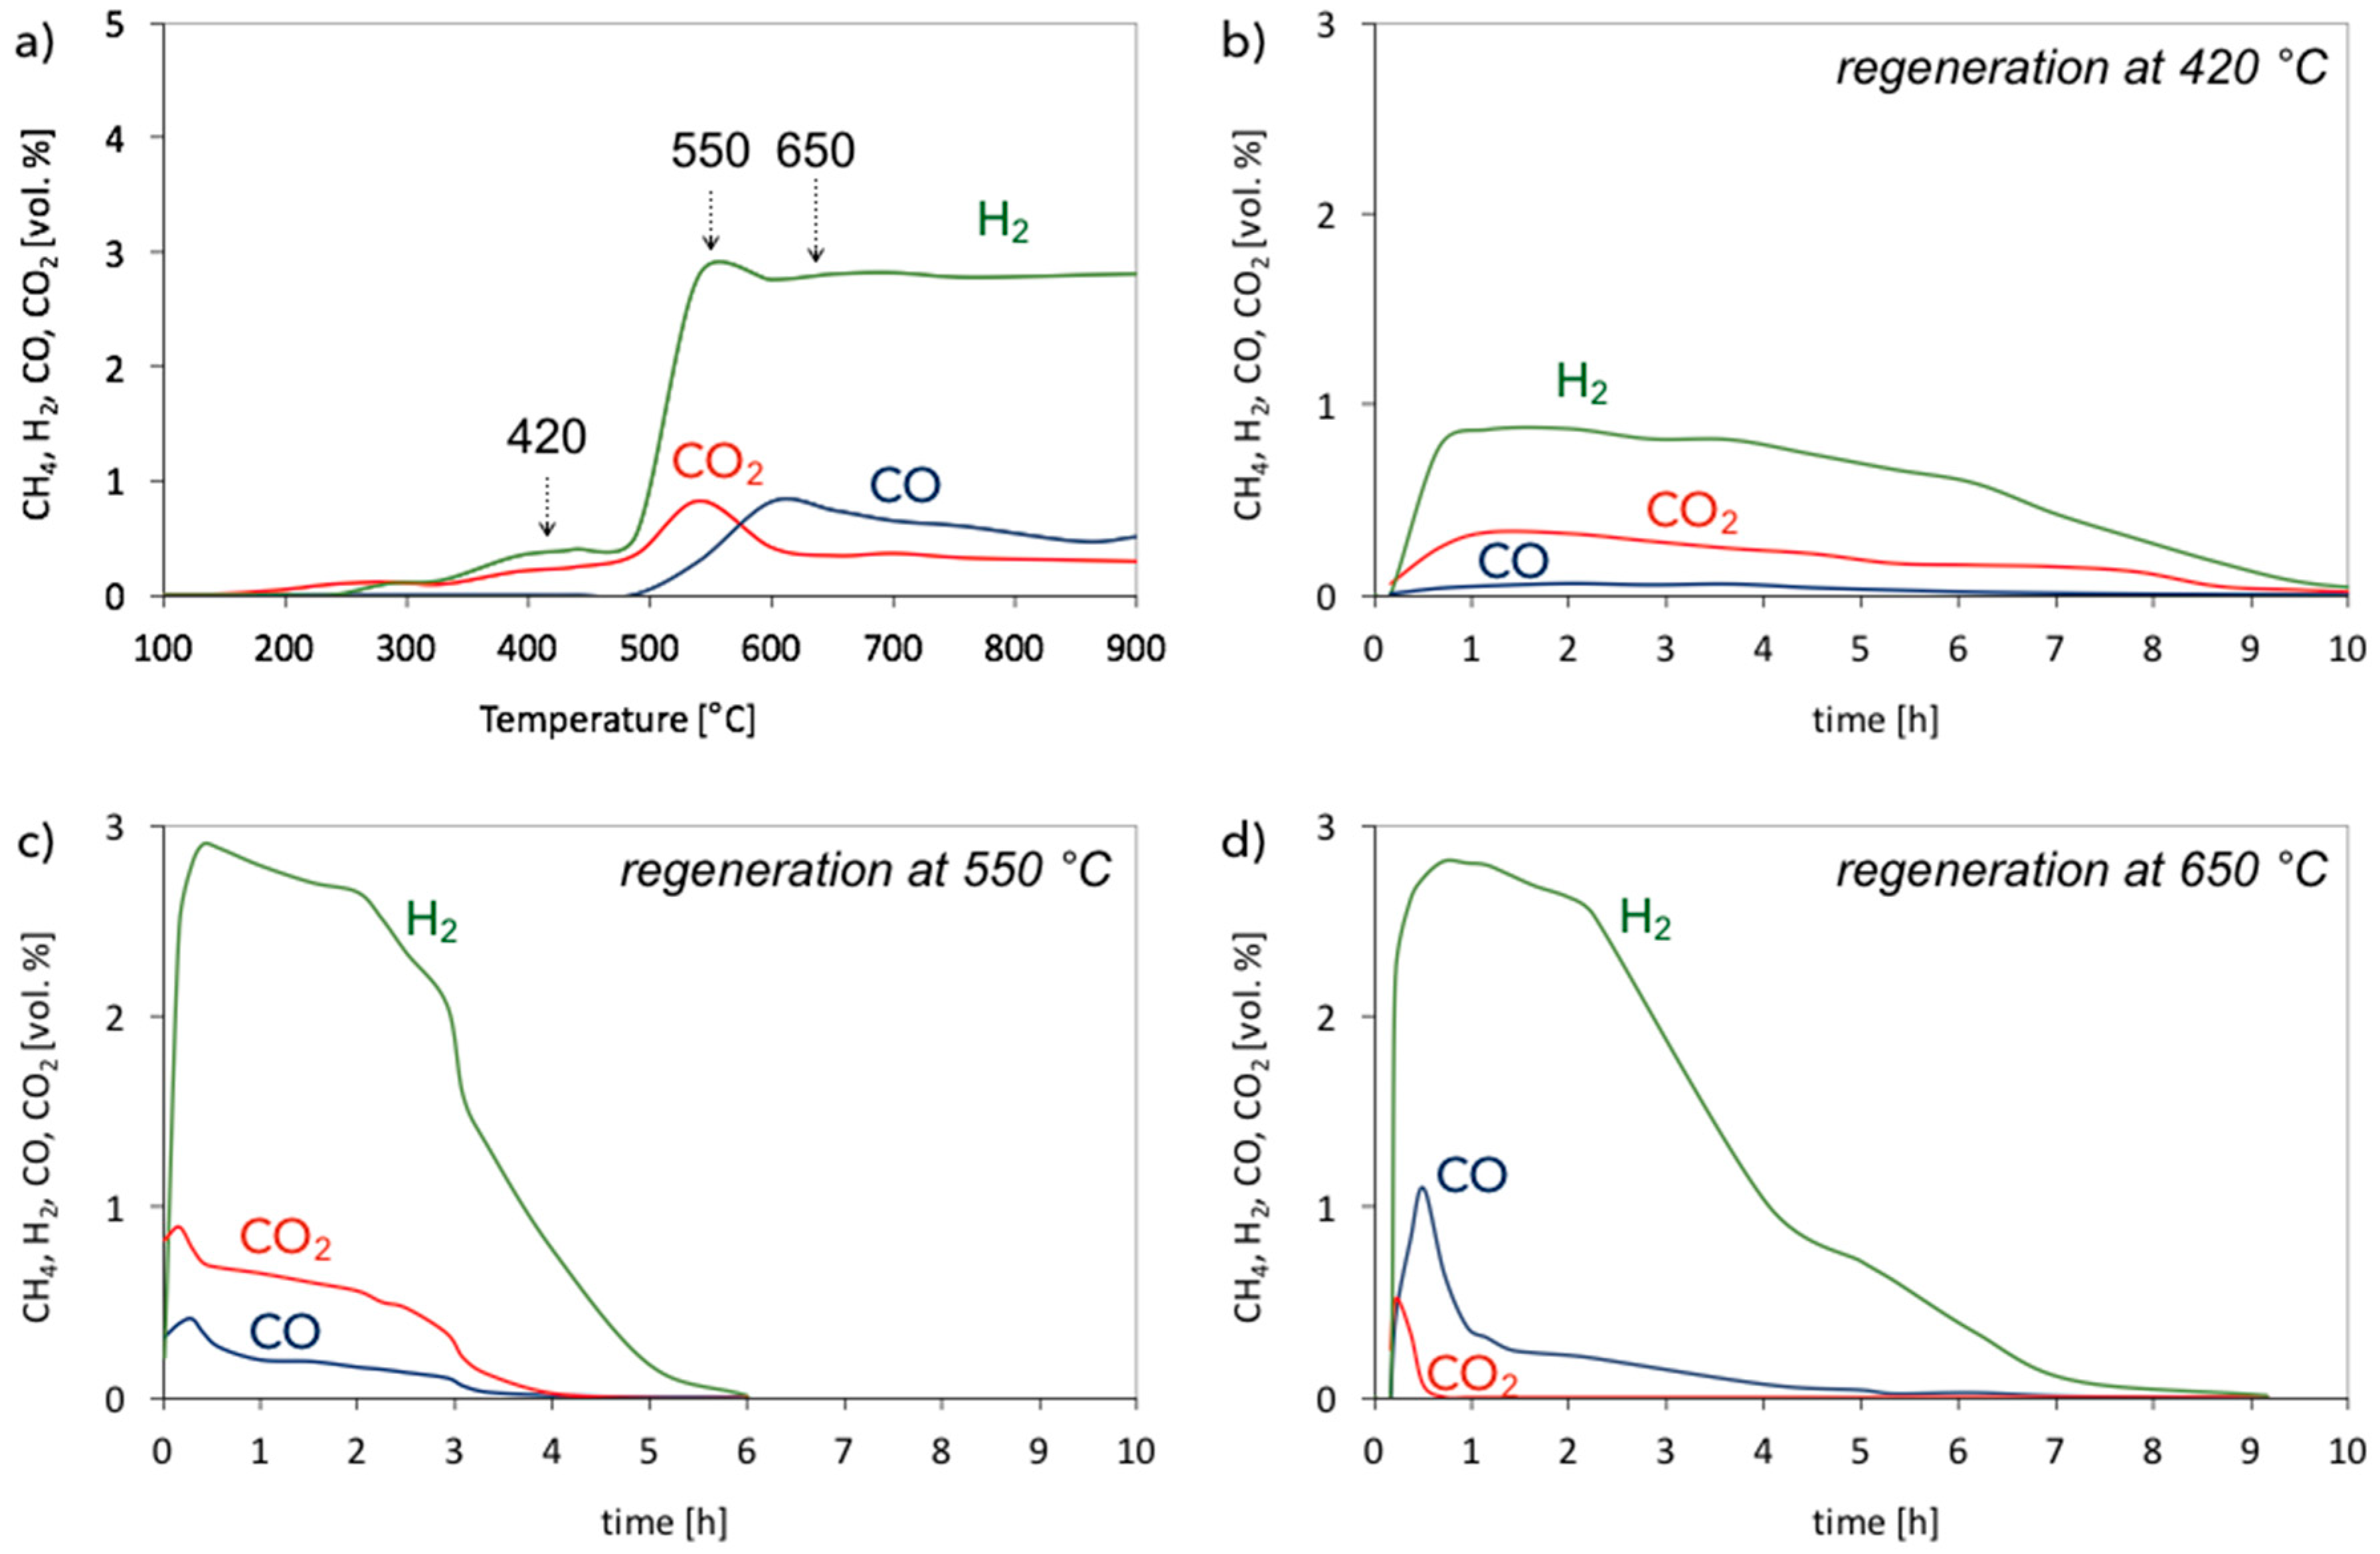
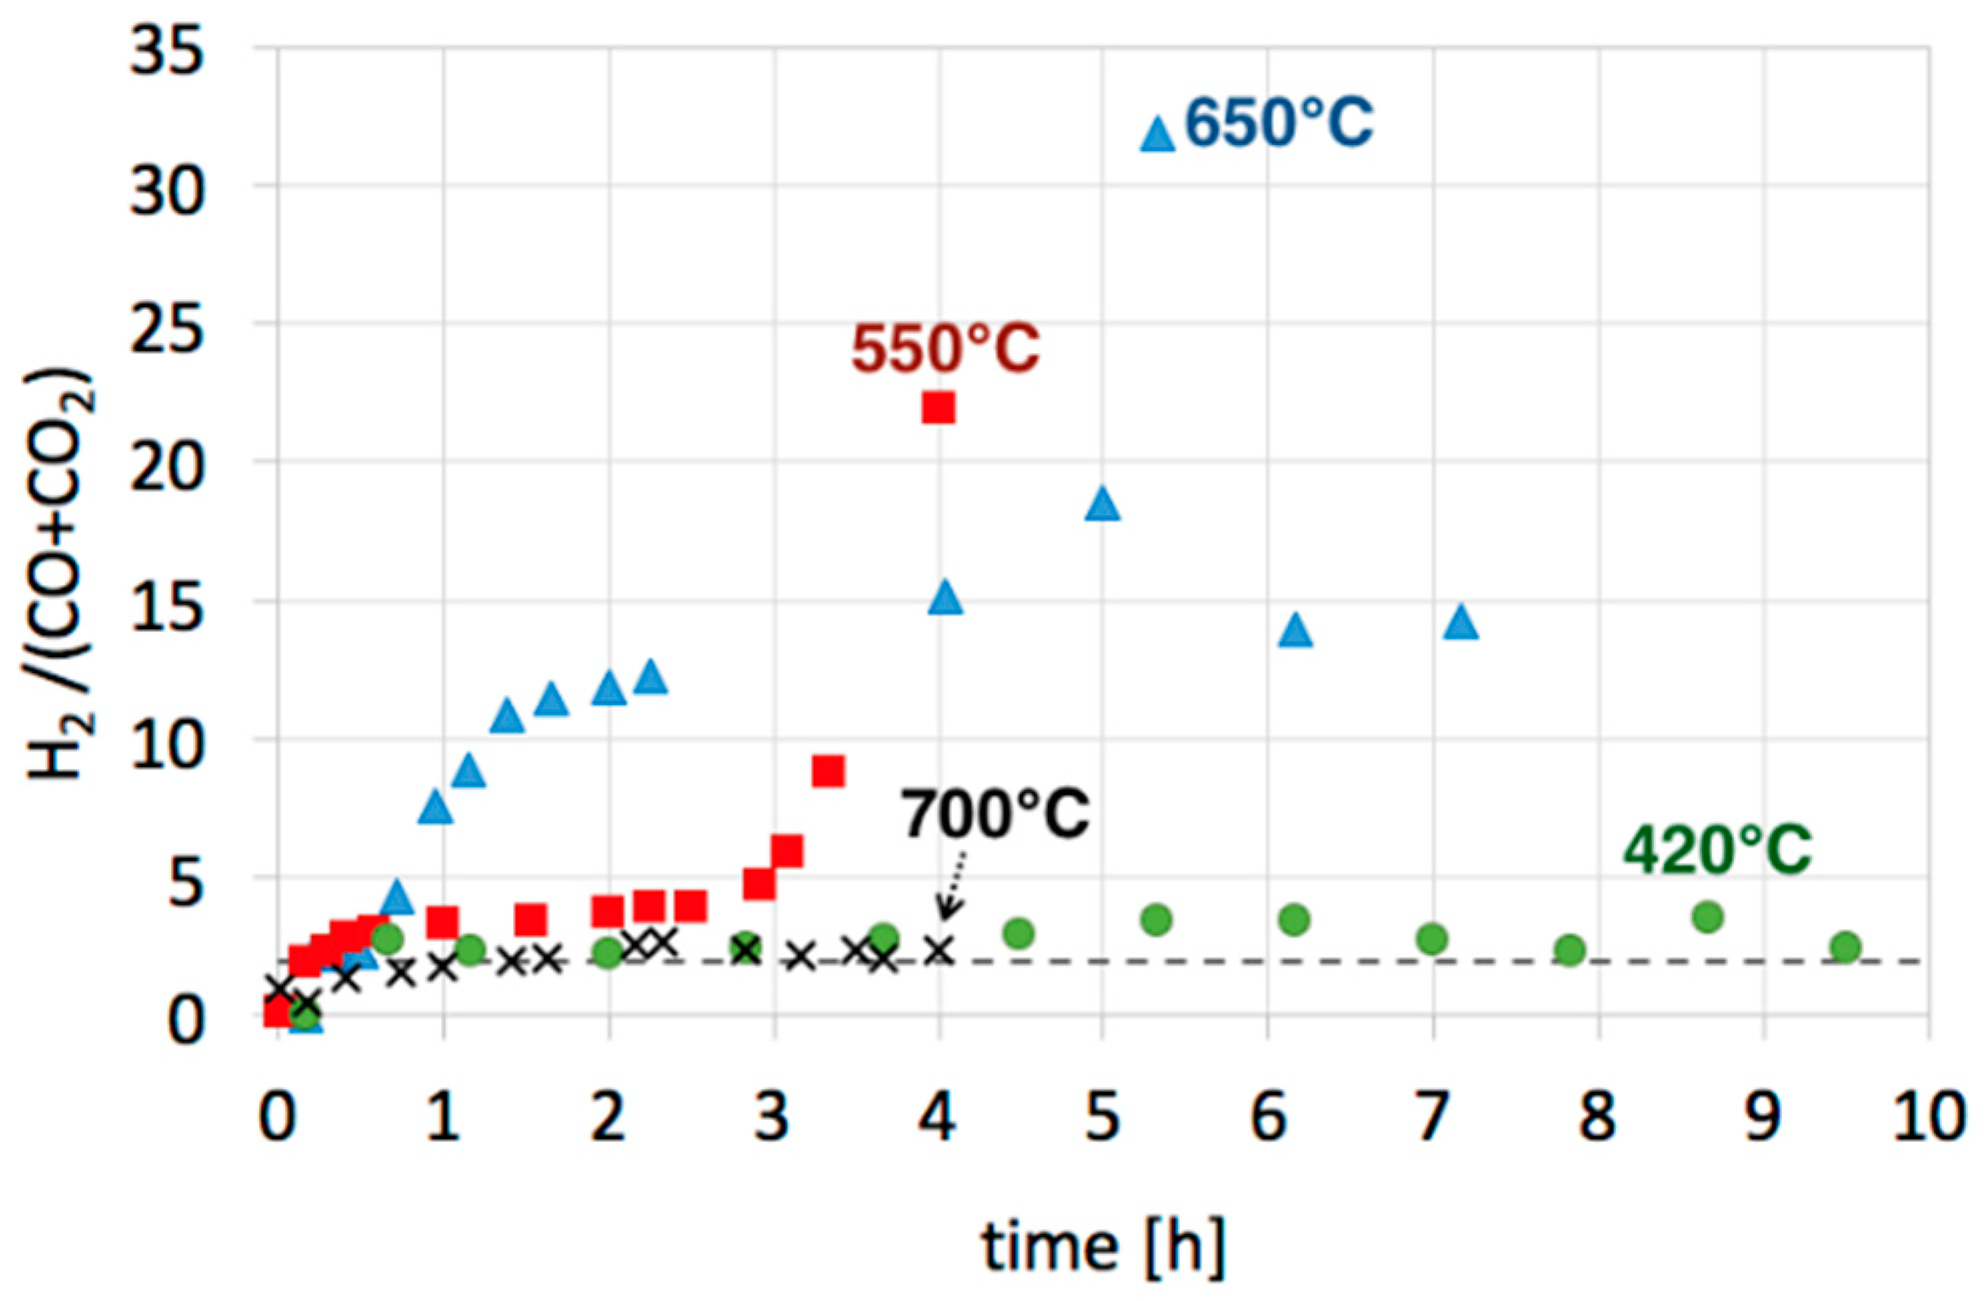
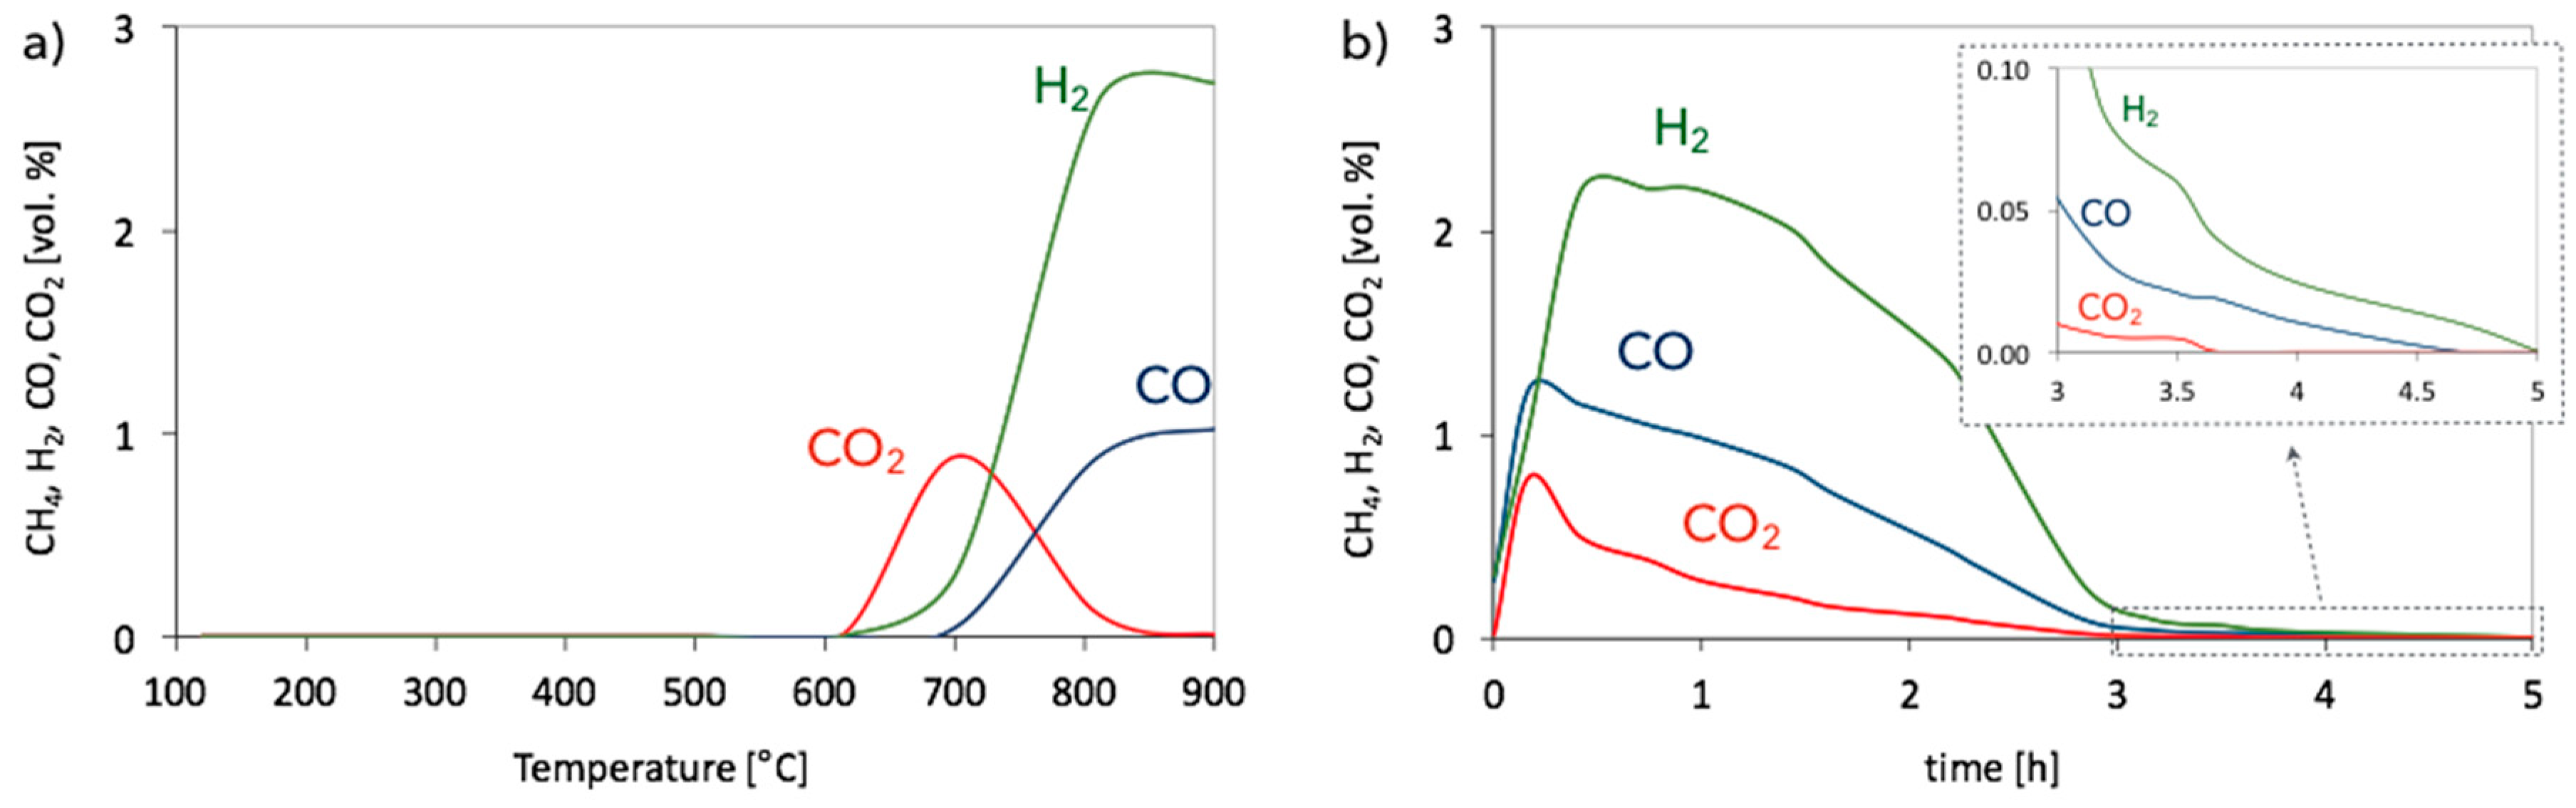
3.2. Catalyst Regeneration with H2O

The samples of Ni/CeZrO2 and Ni-MgO spent in the reaction of CH4 decomposition at 700 °C were subjected to treatment with flowing 2.8 vol.% H2O/Ar in temperature programmed conditions and in isotherms. These tests aimed at determining the optimal temperature of catalyst regeneration with H2 production.
The temperature profile of Ni/CeZrO2 regeneration with H2O is presented in Figure 11a. It reveals that carbon deposits present on catalyst surface are oxidized with a significant production of H2 from ca. 500 °C; however even at lower temperatures some oxidation takes place. The formation of CO2 is observed from temperatures as low as 150 °C. The presence of CO2, the gas phase, at low temperatures may be due to the desorption of carbonates from the CeZrO2 surface, which is followed with the formation of oxygen vacancies (*) that are active sites (e.g., for the adsorption and dissociation of H2O (Equation (8)). Hydrogen release to the gas phase is observed from 250 °C. Beside oxygen vacancies, H2O dissociates on Ni sites (also denoted “*” in Equation (8)). Oxygen species (O*) adsorbed on catalyst surfaces as a result of H2O dissociation are used for the oxidation of reactive carbon species (*C) to CO2 (Equations (9)–(11)). The ability of ceria-zirconia support to oxidize carbon deposits on Ni/CeZrO2 using lattice oxygen has been proven by an experiment carried out in flowing Ar (Figure S3). The most reactive carbon deposits are oxidized first, i.e., the amorphous carbon is oxidized up to ca. 500 °C, whereas CNTs are oxidized above this temperature. From ca. 500 °C, a significant increase in H2 and CO2 formation is observed.
H2O + * = O* + H2
C* + O* = CO* + *
CO* = CO + *
CO + O* = CO2 + *
H2O + Ni = NiO + H2
Figure 11b–d present the evolution of H2, CO, and CO2 as a function of time during catalyst regeneration at three temperatures: (i) at 420 °C, because there is no CO formation on TP profile, (ii) at 550 °C, which is the temperature of maximal H2 formation, and (iii) at 650 °C, where CO formation dominates over CO2 production.
The regeneration of Ni/CeZrO2 at 420 °C takes place slowly and with low H2 and CO2 formation. Carbon species oxidize mainly to CO2, but some CO production is also observed. Maximal conversion of H2O to H2 is 30%. After oxidation of the surface carbon species (i.e., after 9 h of regeneration, where neither CO2 nor CO is observed in the gas phase) H2O oxidizes Ni to NiO, which yields pure H2 (Equation (12)). The conversion of H2O is only 0.9% because the rate of Ni oxidation is low, whereas, catalyst regeneration at 550 °C is faster and allowed almost 100% H2O conversion during the first 2 h of the test run. The oxidation of the carbon deposits takes place with the formation of H2, CO2, and CO. The most significant production of H2, CO2, and CO occurs in the first hours. At that time, the most reactive carbon deposits are oxidized. Simultaneously, structural carbon (CNTs) is oxidized, but because it is less reactive, its removal with H2O requires more time. After 5 h of the test run, no CO2 and CO is observed in the gas phase, and only H2 formation is noticed. The oxidation of Ni to NiO at 550 °C occurs faster than at 420 °C; therefore, H2O conversion is also higher (7% from the fifth hour of the test run). During catalyst regeneration at 650 °C, the formation of CO dominates over CO2. Hydrogen production is very high—almost 100% of H2O is converted in the first 2 h of the test run and then decreases due to the reduction of carbon deposits. Total removal of the deposits at 650 °C is reached after 8 h of the test run.
To summarize, catalyst regeneration at 420 °C allows oxidizing only reactive, amorphous carbon deposits. It also produces the lowest amount of CO. Regeneration carried out at 550 and 650 °C yields almost 100% H2O conversion in the first 2 h of the test run, later it decreases. More CO2 is produced during regeneration at 550 °C, while the process carried out at 650 °C leads mainly to CO (except for H2, whose production is the most important). Regeneration of Ni/CeZrO2 at 550 °C seemed to be finished after 5 h (no CO2 and CO detected in the gas phase), while the process carried out at 650 °C led mainly to CO (except for H2, whose production was the most important). The shorter time of carbon deposits oxidation at 550 °C indicates that not all deposits were removed from the catalyst; 550 °C is probably too low for oxidation of the least reactive structural carbon deposits. The most resistant to oxidation with H2O are probably the CNTs that had the loosest contact with the Ni/CeZrO2 catalyst. Complete regeneration and re-oxidation of Ni/CeZrO2 was achieved only at 650 °C. After that regeneration test, the catalyst changed its color from black (after CH4 decomposition) to green-grey, as presented in Figure 1. The XRD analysis (Figure 8a, curve “iv”) also proved the regeneration of Ni/CeZrO2 and re-oxidation of Ni to NiO.
Hydrogen production during the regeneration of Ni/CeZrO2 with H2O was very high—higher than the hydrogen production arising from the oxidation of carbon deposits to CO and/or CO2. For producing 1 mole of CO, 1 mole of H2O is required (Equation (17); elementary steps are described by Equations (13) and (14)). However, to produce 1 mole of CO2, 2 moles of H2O are needed (Equation (16); elementary steps described by Equations (13), (14) and (15)). Knowing the composition of the gas mixture at the outlet of reactor, we can calculate how much H2 was produced in each reaction. However, looking at the H2/(CO + CO2) ratio during regeneration tests at 420, 550, and 650 °C (Figure 12), it can be noticed that this ratio was higher than its maximal theoretical value, i.e., 2 (Equation (16); assuming that all CO is converted to CO2). Hence, the formation of H2 that is not linked to CO or CO2 production (Equations (16) and (17)) indicates its overproduction owing to H2O dissociation on (i) oxygen vacancies of CeZrO2 that lead to re-oxidation of Ce3+ to Ce4+, and (ii) zero-valent Ni (Equation (12)) that leads to NiO.
2H2O + 2* = 2H2 + 2O*
C + O* = CO + *
CO + O* = CO2 + *
2H2O + C = 2H2 + CO2  H2/(CO + CO2) = 2
H2O + C = CO + H2
The results of regeneration tests for Ni-MgO are presented in Figure 13. The temperature profile for catalyst regeneration after CH4 decomposition (Figure 13a) shows that carbon deposits are oxidized from 600 °C, which manifests itself with CO2 formation, followed by H2 desorption to the gas phase. The formation of CO is observed from ca. 700 °C. Thus, regeneration of Ni-MgO with H2O requires higher temperatures than the regeneration of Ni/CeZrO2. In the case of the Ni-MgO catalyst, only the Ni phase takes part in H2O dissociation. The regeneration of Ni-MgO in isothermal conditions was performed at 700 °C. At this temperature, all carbon species deposited on the catalyst surface should be removed. It can be observed in Figure 13b that carbon deposits were oxidized with H2O to CO2, CO, and H2 during the first 3.5 h of the test run. Later, only small amounts of CO and H2 were detected. Finally, at the end of the process, only H2 was formed, owing to the Ni re-oxidation to NiO. It was proven by XRD (Figure 8b, curve “iv”) that H2O treatment at 700 °C removed carbon deposits from the catalyst (no reflection at ca. 26°); however, the Ni phase can still be observed on diffractogram, which shows that it was only partly re-oxidized to NiO.

4. Conclusions

In order to assess the potential of Ni/CeZrO2 for CNTs and H2 production in fluidized bed reactors, the formed (and crushed) catalyst was subjected to tests of CH4 decomposition followed by regeneration with H2O.
The decomposition of CH4 to H2 and carbon deposits occur from 580 °C on unreduced Ni/CeZrO2 and from 200 °C on pre-reduced Ni/CeZrO2. Catalyst pre-reduction significantly decreases the temperature of CH4 dehydrogenation, due to the presence of zero-valent Ni. Nevertheless, catalyst pre-reduction is not important for the sake of H2 production, which is the highest in the same temperature region as for unreduced catalyst, i.e., above 600 °C. Hence, the in-situ reduction of the Ni/CeZrO2 catalyst with CH4 is a reasonable solution (the process is more efficient because it does not waste valuable H2).
It was found that very high CH4 conversion and H2 yield can be achieved during the decomposition of CH4 at a low concentration in the feed (e.g., 2 vol.% in Ar). However, this process results in very low carbon deposition. An increase in CH4 concentration in the feed results in higher carbon deposition on Ni/CeZrO2, at the cost of CH4 conversion and H2 yield, which is caused by an insufficient number of Ni active sites.
The characterization of spent Ni/CeZrO2 revealed that obtained carbon deposits comprised both the amorphous and structural carbon. The presence of CNTs was proven by TEM.
Regeneration of the Ni/CeZrO2 catalyst with H2O is possible from ca. 400 °C. At lower temperatures, H2O oxidizes only the amorphous carbon species (at 420 °C) or CNTs that are in contact with Ni/CeZrO2 particles (at 550 °C). Oxidation of all carbon deposits with H2O, including the CNTs that detached from the catalyst particles, requires higher temperatures (e.g., 650 °C). Moreover, it was found that formation of H2 during the regeneration of Ni/CeZrO2 is not linked exclusively to carbon oxidation, but also comes from H2O dissociation on (i) the oxygen vacancies of CeZrO2 (re-oxidation of Ce3+ to Ce4+), and (ii) zero-valent Ni (re-oxidation to NiO). Complete regeneration of Ni/CeZrO2 was achieved at 650 °C, which was proven by XRD.
Regeneration of the Ni-MgO catalyst occurs at higher temperatures than the regeneration of Ni/CeZrO2. Carbon deposits were removed from Ni-MgO at 700 °C; however, the catalyst was not re-oxidized completely. Hydrogen production during Ni-MgO regeneration with H2O comes only from the oxidation of carbon deposits and partial re-oxidation of the Ni phase.
The presented results show that the Ni/CeZrO2 catalyst has the potential to be used for H2 and CNT production using CH4 and H2O. The possibility of very high H2 production is the main advantage of Ni/CeZrO2 catalyst over Ni-MgO. The cognition of catalyst behavior was helpful for determining some parameters of CH4 decomposition and catalyst regeneration in a fluidized bed reactor.

Supplementary Materials

The following are available online at https://www.mdpi.com/2305-7084/3/1/26/s1, Figure S1: XRD of CeZrO2 support, Figure S2: CH4 and CO2 conversion during dry reforming of methane over Ni/CeZrO2@CNT hybrid catalyst, Figure S3: Temperature profile for spent Ni/CeZrO2 in flowing Ar, Table S1: Weight increase for powder Ni/CeZrO2 after decomposition of 10 vol.% CH4/Ar at 500, 600, and 700 °C for 3 h.

Funding

This research was funded by Ministerstwo Nauki i Szkolnictwa Wyzszego: IP2014 026273 and statutory activity subsidy for the Faculty of Chemistry of Wrocław University of Science and Technology, Narodowe Centrum Nauki: UMO 2011/03/N/ST5/04658.

Acknowledgments

This work was financed by the Ministry of Science and Higher Education (Iuventus Plus, 2015-2017, IP2014 026273), and statutory activity subsidy for the Faculty of Chemistry of Wrocław University of Science and Technology. Studies on CH4 decomposition on powder catalysts were financed by the National Science Centre (contract no. UMO 2011/03/N/ST5/04658).

Conflicts of Interest

The author declares no conflict of interest.

References

  1. Serrano, D.P.; Botas, J.A.; Guil-Lopez, R. H2 Production from Methane Pyrolysis Over Commercial Carbon Catalysts: Kinetic and Deactivation Study. Int. J. Hydrog. Energy 2009, 34, 4488–4494. [Google Scholar] [CrossRef]
  2. Zarębska, K.; Pernak-Misko, K. Zgazowanie węgla—perspektywa dla gospodarki wodorowej. Gosp. Sur. Min. 2007, 23, 243–255. [Google Scholar]
  3. Molenda, J. Fundamentalne znaczenie badań naukowych dla rozwoju gospodarki wodorowej. Polityka Energetyczna 2008, 11, 61–68. [Google Scholar]
  4. Rajeshwar, K. Hydrogen generation at irradiated oxide semiconductor–solution interfaces. J. Appl. Electrochem. 2007, 37, 765–787. [Google Scholar] [CrossRef]
  5. Gallo, A.; Marelli, M.; Psaro, R.; Gombac, V.; Montini, T.; Fornasiero, P.; Pievo, R.; Dal Santo, V. Bimetallic Au–Pt/TiO2 photocatalysts active under UV-A and simulated sunlight for H2 production from ethanol. Green Chem. 2012, 14, 330–333. [Google Scholar] [CrossRef]
  6. Laguna-Bercero, M.A. Recent advances in high temperature electrolysis using solid oxide fuel cells: A review. J. Power Sources 2012, 203, 4–16. [Google Scholar] [CrossRef] [Green Version]
  7. Millet, P.; Ngameni, R.; Grigoriev, S.A.; Mbemba, N.; Brisset, F.; Ranjbari, A.; Etievant, C. PEM water electrolyzers: From electrocatalysis to stack development. Int. J. Hydrog. Energy 2010, 35, 5043–5052. [Google Scholar] [CrossRef]
  8. Huczko, A. Nanorurki Węglowe. Czarne Diamenty XXI Wieku. BEL Studio, Poland. 2004. Available online: http://polona.pl/item/4535131 (accessed on 28 April 2018).
  9. Thompson, B.C.; Moulton, S.A.; Gilmore, K.J.; Higgins, M.J.; Whitten, P.G.; Wallach, G.G. Carbon nanotube biogels. Carbon 2009, 47, 1282–1291. [Google Scholar] [CrossRef]
  10. Kokai, F.; Takahashi, K.; Kasuya, D.; Ichihashi, T.; Yudasaka, M. Synthesis of single-wall carbon nanotubes by millisecond-pulsed CO2 laser vaporization at room temperature. Chem. Phys. Lett. 2000, 332, 449–454. [Google Scholar] [CrossRef]
  11. Zhao, X.; Ohkohchi, M.; Inoue, S.; Suzuki, T.; Kadoya, T.I.; Ando, Y. Large-scale purification of single-wall carbon nanotubes prepared by electric arc discharge. Diam. Relat. Mater. 2006, 15, 1098–1102. [Google Scholar] [CrossRef]
  12. Bacs, R.R.; Laurent, C.; Peigney, A.; Bacsa, W.S.; Vaugien, T.; Rousset, A. High specific surface area carbon nanotubes from catalytic chemical vapor deposition process. Chem. Phys. Lett. 2000, 323, 566–571. [Google Scholar] [CrossRef] [Green Version]
  13. Tran, K.Y.; Heinrichs, B.; Colomer, J.F.; Pirard, J.P.; Lambert, S. Carbon nanotubes synthesis by the ethylene chemical catalytic vapour deposition (CCVD) process on Fe, Co, and Fe–Co/Al2O3 sol–gel catalysts. Appl. Catal. A Gen. 2007, 318, 63–69. [Google Scholar] [CrossRef]
  14. Zhu., J.; Yudasaka, M.; Iijima, S. A catalytic chemical vapor deposition synthesis of double-walled carbon nanotubes over metal catalysts supported on a mesoporous material. Chem. Phys. Lett. 2003, 380, 496–502. [Google Scholar] [CrossRef]
  15. Vahlas, C.; Caussat, B.G.; Serp, P.; Angelopoulos, G.N. Principles and Applications of CVD Powder Technology. Mater. Sci. Eng. R Rep. 2006, 53, 1–72. [Google Scholar] [CrossRef]
  16. Nagaraju, N.; Fonseca, A.; Konya, Z.; Nagy, J.B. Alumina and silica supported metal catalysts for the production of carbon nanotubes. J. Mol. Cat. A Chem. 2002, 181, 57–62. [Google Scholar] [CrossRef]
  17. Qingwen, L.; Hao, Y.; Yan, C.; Jin, Z.; Zhongfan, L. A scalable CVD synthesis of high-purity single-walled carbon nanotubes with porous MgO as support material. J. Mater. Chem. 2002, 12, 1179–1183. [Google Scholar] [CrossRef]
  18. Park, J.B.; Choi, G.S.; Cho, Y.S.; Hong, S.Y.; Kim, D.; Choi, S.Y.; Lee, J.H.; Cho, K.I. Characterization of Fe-catalyzed carbon nanotubes grown by thermal chemical vapor deposition. J. Cryst. Growth 2002, 244, 211–217. [Google Scholar] [CrossRef]
  19. Emmenegger, C.; Bonard, J.M.; Mauron, P.; Sudan, P.; Lepora, A.; Grobety, B.; Zuttel, A.; Schlapbach, L. Synthesis of carbon nanotubes over Fe catalyst on aluminium and suggested growth mechanism. Carbon 2003, 41, 539–547. [Google Scholar] [CrossRef]
  20. Pinheiro, J.P.; Schouler, M.C.; Gadelle, P. Nanotubes and nanofilaments from carbon monoxide disproportionation over Co/MgO catalysts: I. Growth versus catalyst state. Carbon 2003, 41, 2949–2959. [Google Scholar] [CrossRef]
  21. Takenaka, S.; Kobayashi, S.; Ogihara, H.; Otsuka, K. Catalytic deuteration of cyclohexanone and allied reactions over platinum metals. J. Catal. 2003, 217, 79–87. [Google Scholar] [CrossRef]
  22. Flahaut, E.; Peigney, A.; Laurent, C.; Rousset, A. Synthesis of single-walled carbon nanotube–Co–MgO composite powders and extraction of the nanotubes. J. Mater. Chem. 2000, 10, 249–252. [Google Scholar] [CrossRef] [Green Version]
  23. Li, Y.L.; Kinloch, I.A.; Shaffer, M.S.P.; Geng, J.; Johnson, B.; Windle, A.H. Synthesis of single-walled carbon nanotubes by a fluidized-bed method. Chem. Phys. Lett. 2004, 384, 98–102. [Google Scholar] [CrossRef]
  24. Hao, Y.; Qunfeng, Z.; Fei, W.; Weizhong, Q.; Guohua, L. Agglomerated CNTs synthesized in a fluidized bed reactor: Agglomerate structure and formation mechanism. Carbon 2003, 41, 2855–2863. [Google Scholar] [CrossRef]
  25. Maghsoodi, S.; Khodadadi, A.; Mortazavi, Y. A novel continuous process for synthesis of carbon nanotubes using iron floating catalyst and MgO particles for CVD of methane in a fluidized bed reactor. Appl. Surf. Sci. 2010, 256, 2769–2774. [Google Scholar] [CrossRef]
  26. Wang, Y.; Wei, F.; Luo, G.; Yu, H.; Gu, G. The large-scale production of carbon nanotubes in a nano-agglomerate fluidized-bed reactor. Chem. Phys. Lett. 2002, 364, 568–572. [Google Scholar] [CrossRef]
  27. Corrias, M.; Caussat, B.; Ayral, A.; Durand, J.; Kihn, Y.; Alck, P.; Serp, P. Carbon nanotubes produced by fluidized bed catalytic CVD: First approach of the process. Chem. Eng. Sci. 2003, 58, 4475–4482. [Google Scholar] [CrossRef]
  28. Hsieh, C.T.; Lin, Y.T.; Chen, W.Y.; Wei, J.L. Parameter setting on growth of carbon nanotubes over transition metal/alumina catalysts in a fluidized bed reactor. Powder Technol. 2009, 192, 16–22. [Google Scholar] [CrossRef]
  29. Weizhong, Q.; Tang, L.; Zhanwen, W.; Fei, W.; Zhifei, L.; Guohua, L.; Yongdan, L. Production of hydrogen and carbon nanotubes from methane decomposition in a two-stage fluidized bed reactor. Appl. Catal. A Gen. 2004, 260, 223–228. [Google Scholar] [CrossRef]
  30. Wang, Y.; Wei, F.; Gu, G.; Yu, H. Agglomerated carbon nanotubes and its mass production in a fluidized-bed reactor. Phys. B 2002, 323, 327–329. [Google Scholar] [CrossRef]
  31. Zhang, Q.; Zhao, M.Q.; Huang, J.Q.; Liu, Y.; Wang, Y.; Qian, W.Z.; Wei, F. Vertically aligned carbon nanotube arrays grown on a lamellar catalyst by fluidized bed catalytic chemical vapor deposition. Carbon 2009, 47, 2600–2610. [Google Scholar] [CrossRef]
  32. See, C.H.; Dunens, O.M.; MacKenzie, K.J.; Harris, A.T. Process Parameter Interaction Effects during Carbon Nanotube Synthesis in Fluidized Beds. Ind. Eng. Chem. Res. 2008, 47, 7686–7692. [Google Scholar] [CrossRef]
  33. Son, S.Y.; Lee, Y.; Won, S.; Lee, D.H.; Kim, S.D.; Sung, S.W. High-Quality Multiwalled Carbon Nanotubes from Catalytic Decomposition of Carboneous Materials in Gas–Solid Fluidized Beds. Ind. Eng. Chem. Res. 2008, 47, 2166–2175. [Google Scholar] [CrossRef]
  34. Liu, X.B.; Sun, H.; Chen, Y.; Lau, R.; Yang, Y.H. Preparation of large particle MCM-41 and investigation on its fluidization behavior and application in single-walled carbon nanotube production in a fluidized-bed reactor. Chem. Eng. J. 2008, 142, 331–336. [Google Scholar] [CrossRef]
  35. Global Carbon Nanotubes Market—Industry Beckons. Available online: http://www.nanowerk.com/spotlight/spotid=23118.php (accessed on 28 April 2018).
  36. Li, Y.; Fu, Q.; Flytzani-Stephanopoulos, M. Low-temperature water-gas shift reaction over Cu- and Ni-loaded cerium oxide catalysts. Appl. Catal. B Environ. 2000, 27, 179–191. [Google Scholar] [CrossRef] [Green Version]
  37. Diaz, E.; de Rias, B.; Lopez-Fonsees, R.; Ordonez, S. Characterization of ceria–zirconia mixed oxides as catalysts for the combustion of volatile organic compounds using inverse gas chromatography. J. Chromatogr. A 2006, 1116, 230–239. [Google Scholar] [CrossRef] [PubMed]
  38. Shah, P.R.; Kim, T.; Zhou, G.; Fornasiero, P.; Gorte, R.J. Evidence for Entropy Effects in the Reduction of Ceria–Zirconia Solutions. Chem. Mater. 2006, 18, 5363–5369. [Google Scholar] [CrossRef]
  39. Łamacz, A.; Krztoń, A.; Djéga-Mariadassou, G. Steam reforming of model gasification tars compounds on nickel based ceria-zirconia catalysts. Catal. Today 2011, 176, 347–351. [Google Scholar] [CrossRef]
  40. Łamacz, A.; Krztoń, A.; Musi, A.; Da Costa, P. Reforming of Model Gasification Tar Compounds. Catal. Lett. 2009, 128, 40–48. [Google Scholar] [CrossRef]
  41. Łamacz, A.; Krztoń, A. Hydrogen production by catalytic decomposition of selected hydrocarbons and H2O dissociation over CeZrO2 and Ni/CeZrO2. Int. J. Hydrog. Energy 2013, 38, 8772–8782. [Google Scholar] [CrossRef]
  42. Łamacz, A.; Matus, K.; Liszka, B.; Silvestre-Albero, J.; Lafjah, M.; Dintzer, T.; Janowska, I. The impact of synthesis method of CNT supported CeZrO2 and Ni-CeZrO2 on catalytic activity in WGS reaction. Catal. Today 2018, 301, 172–182. [Google Scholar] [CrossRef]
Figure 1. Scheme of (a) preparation of Ni/CeZrO2 catalyst and (b) installation for catalytic tests.
Chemengineering 03 00026 g001
Figure 2. The composition of the outlet gas during CH4 decomposition in temperature-programmed conditions over (a) unreduced Ni/CeZrO2, (b) pre-reduced Ni/CeZrO2, (c) unreduced Ni-MgO and (d) pre-reduced Ni-MgO. Test conditions: 2 vol.% CH4/Ar.
Chemengineering 03 00026 g002
Figure 3. Gas composition at reactor outlet during tests of CH4 decomposition on unreduced Ni/CeZrO2 at gas hourly space velocity (GHSV) = 7000 h−1 (a,b) and 13,000 h−1 (c,d). Reaction mixture: 2 vol.% CH4/Ar (a,c) and 10 vol.% CH4/Ar (b,d).
Chemengineering 03 00026 g003
Figure 4. Gas composition at reactor outlet during tests of CH4 decomposition on pre-reduced Ni/CeZrO2 at GHSV = 7000 h−1 (a,b) and 13,000 h−1 (c,d). Reaction mixture: 2 vol.% CH4/Ar (a,c) and 10 vol.% CH4/Ar (b,d).
Chemengineering 03 00026 g004
Figure 5. CH4 conversion (a) and H2 yield (b) during tests carried out on unreduced Ni/CeZrO2 in flowing 2 and 10 vol.% CH4/Ar, and at GHSV = 7000 and 13,000 h−1.
Chemengineering 03 00026 g005
Figure 6. CH4 conversion (a) and H2 yield (b) during tests carried out on pre-reduced Ni/CeZrO2 in flowing 2 and 10 vol.% CH4/Ar, and at GHSV = 7000 and 13,000 h−1.
Chemengineering 03 00026 g006
Figure 7. TGA for (a) Ni/CeZrO2 and (b) Ni-MgO catalyst after CH4 decomposition (T = 700 °C; 10 vol.% CH4/Ar; GHSV = 7000 h−1; t = 1 h).
Chemengineering 03 00026 g007
Figure 8. XRD for (a) Ni/CeZrO2 and (b) Ni-MgO: (i) fresh, (ii) pre-reduced in H2, (iii) after CH4 decomposition, (iv) after subsequent regeneration with H2O. The peaks of the CeZrO2 phase in (a) were denoted “CZ”.
Chemengineering 03 00026 g008
Figure 9. SEM of Ni/CeZrO2 (a) before and (bd) after CH4 decomposition at T = 700 °C under flowing 10 vol.% CH4/Ar for t = 3 h.
Chemengineering 03 00026 g009
Figure 10. TEM of Ni/CeZrO2 catalyst after CH4 decomposition at T = 700 °C under flowing 10 vol.% CH4/Ar for t = 3 h.
Chemengineering 03 00026 g010
Figure 11. Regeneration of Ni/CeZrO2 in 2.8 vol.% H2O/Ar in (a) temperature programmed conditions, and at (b) 420 °C, (c) 550 °C and (d) 650 °C.
Chemengineering 03 00026 g011
Figure 12. H2/(CO + CO2) ratio during regeneration of Ni/CeZrO2 at 420 °C (), 550 °C () and 650 °C (), and Ni-MgO at 700 °C (✕).
Chemengineering 03 00026 g012
Figure 13. Regeneration of Ni-MgO in 2.8 vol.% H2O/Ar in (a) temperature programmed conditions and (b) at 700 °C.
Chemengineering 03 00026 g013
Table 1. Increase in Ni/CeZrO2 mass after tests of CH4 decomposition (T = 700 °C; t = 1 h).
CatalystCH4 (vol.%)GHSV (h−1)△m (%)C/Ni (mol/mol)
unreduced270002.11.1
unreduced213,0002.51.3
unreduced1070008.34.5
unreduced1013,0007.94.2
pre-reduced270003.61.9
pre-reduced213,0003.11.7
pre-reduced1070009.04.8
pre-reduced1013,0008.84.7
Table 2. Textural properties of fresh, spent, and regenerated Ni/CeZrO2.
Ni/CeZrO2:SSA (m2/g)Pore Volume (cc/g)Pore Size (nm)
fresh780.2513.2
pre-reduced in H2740.2513.1
after CH4 decomposition *830.2611.4
regenerated in H2O **950.2813.1
* 10 vol.% CH4/Ar; 700 °C/3 h; GHSV = 7000 h−1, ** 2.8 vol.% H2O/Ar; 650 °C.

