Abstract
In the present study, the ANEMONA.XLT tool, an Excel template that was designed for calculation of enzyme kinetic parameters, has been successful adapted to some proposed models for dry reforming reaction, such as Eley-Rideal or Langmuir-Hinshelwood kinetic models. Model discrimination by non-linear regression analysis has been applied to data from the literature; the predicted kinetic parameters that were obtained using ANEMONA.XLT were fully comparable with those already published. Thus, the template can be a helpful and user-friendly alternative tool for researchers who do not have advanced skills in computer programming.
1. Introduction
In the last decade the growing energy demand, furnished primarily from fossil fuels, have created environmental issues due to the generation of greenhouse gases (CO2 and CH4). The reduction of CO2 and CH4 emissions into the atmosphere and their possible recycling, induced a growing interest in dry reforming (DR) reaction (CO2 + CH4 → 2H2 + 2CO; ΔH°298 K = 247 kJ/mol), able to produce syngas, a building block for the synthesis of different chemicals and oxygenated fuels [1,2,3]. Besides, CH4 and CO2 gases are the main constituents of biogas, a fuel that is produced extensively by various anaerobic biological waste treatments. The biogas quality is often adequate to DR reaction but its use can be enhanced through the mentioned process [4,5]. Common catalysts for DR reaction are composed either by noble metals (Pt, Rh, Ru, Ir) or transition metals, such as Ni, Co and Fe. The major problem encountered in the process is the rapid catalyst deactivation by carbon deposition. Although noble metals are very active and more coke-resistant than Ni-based catalysts, the former systems are preferred to noble metal-based samples, as they are cheaper and widely available, making DR reaction a more industrially-viable process. To study the mechanisms of DR reaction and to determine the related kinetic parameters is fundamental for developing effective catalytic systems and consequently for commercializing methane-reforming technologies. Kinetic analysis, performed in order to find the suitable mechanistic model that adequately describes the reaction rate and defines the chemical process, can be used for the optimization of the catalyst design.
Generally, there are three typical kinetic models that are applied to describe reforming reactions: Power law, Eley-Rideal and Langmuir Hinshelwood models [6,7]. The Power law model, in the form of:
(where; ri, rates of consumption of CH4 and CO2; m and n, reaction orders; A, pre-exponential factor; Ea, apparent activation energy; R, universal gas constant; T, reaction temperature; pCH4 and pCO2, partial pressure of CH4 and CO2, respectively), has the advantage of simplicity in its application and determination, but it concerns only the overall activation energy and reaction orders and, besides, it is valid for only a narrow range of partial pressures. In the Eley-Rideal models, it is assumed that one reactant is associatively adsorbed onto the catalyst surface at thermodynamic equilibrium, while the second reagent remains in the gas phase; the slow reaction between the adsorbed species with the gaseous reactant is the rate determining step (RDS). For the basic reaction , the generalized rate equation can be represented as:
where kref is the thermodynamic equilibrium constant of the reforming reaction. Alternatively, one or two elementary reactions are assumed as RDS in Langmuir Hinshelwood models, generalized as:
while the others are at thermodynamic equilibrium. The elementary reactions steps are generally derived from the dissociative adsorption of both reactants, i.e., CH4 decomposition and CO2 decomposition/activation [8].
In order to evaluate the correct rate expression that most adequately describes the process, it is needed a discrimination between the different proposed models by fitting the experimental data. Many commercial software packages (Polymath, Mathcad, Matlab) can be used, but they often require some knowledge of mathematics, data management is not easy, they tend to display data-results-analysis in multiple and separate windows that can lead to confusion and, furthermore, they are expensive. To overcome these issues, we have tested the ANEMONA.XLT program [9], a free Excel template, for its suitability to estimate kinetic parameters by fitting literature data to some typical kinetic models that were proposed for the DR reaction.
The ANEMONA.XLT program, as developed by Hernández and Ruiz [9] for the specific calculation of enzyme kinetic parameters, is a collection of mathematical models corresponding to mono- or pseudo-monosubstrate reactions (Michaelis–Menten, double Michaelis–Menten, Hill model, substrate inhibition) and the most common bisubstrate mechanisms (ping-pong, ordered, and random). These models can be easily modified according to the different kinetic models, such as those proposed for DR reactions, as evidenced in this note.
2. Background
A brief description of some representative kinetic models that were proposed for the DR reaction considered in this study are shown below. In the Eley-Rideal mechanism, initially proposed by Mark et al. [10], associatively adsorption of one reactant on the catalyst surface at adsorption equilibrium is assumed. Reaction of the adsorbed species with the remaining reactant in gas phase, that leads to the product formation, is the RDS. Theoretically, both reactants can be adsorbed species [7]. For the bimolecular reaction between CO2 adsorbed on the catalyst surface and un-adsorbed CH4 in the gas phase, the rate equation is the following:
where k is the rate constant for DR reaction, KCO2 is the adsorption constant of CO2, pCH4 and pCO2 indicate the partial pressure of CH4 and CO2, respectively. In the Eley-Rideal model, the rate depends on the concentration of the un-adsorbed species and the extent of the surface coverage of the adsorbed species. Assuming the CO2 adsorption on the surface and un-adsorbed CH4 in the gas phase, the rate equation becomes: . The balance between the fraction of occupied sites θCO2 () and the fraction of vacant sites θx by application of the MARI (most abundant reaction intermediate) concept, tha rate equation results in the formulated Model 1.
Alternatively, a heterogeneous Eley-Rideal model has been proposed by Olsbye et al. [11]. The model involves the CH4 adsorption on the catalyst surface and its dissociation into CHx and H; the reaction between CHx and CO2,g became the RDS (at low pressure of CO2). The related kinetic expression is represented by the following equation:
where KCH4 is the rate constant for CH4 adsorption. Similarly the previous concepts, applied to CH4 adsorbed on the surface, can be extended to the Model 2.
Langmuir-Hinshelwood rate models are generally proposed for reaction mechanisms that involve the dissociative adsorption of CH4 and CO2 followed by the surface reactions of the adsorbed species (rate determining step) to produce H2 and CO.
A stepwise mechanism, where in the RDS the CH4 is decomposed to hydrogen and active carbon followed by the direct and fast conversion of this active carbon to CO2 and 2CO, is represented as [11,12]:
while the associative adsorption of CH4 and CO2 molecules on a single site can be described as [6]:
The acid or basic functionalities of the catalyst support can influence the reaction mechanism with a bi-functional pathway where CH4 and CO2 are activated on different sites and the reaction intermediates react at the metal-support interfacial sites. Basic supports, like La2O3, enhance the non-dissociative CO2 adsorption in the form of carbonates or bicarbonates [13,14]; this mechanism, with a two-step single site as RDS, can be represented by the following reactions:
These include the CH4 activation on metal catalyst (S) and the reaction of La2O2CO3 with C deposited on Ni particles at the interface between Ni and La2O2CO3 as rate determining steps. Hence, the related rate equation can be written as:
where K1 and K3 denote the adsorption equilibrium constant for CH4 and CO2, respectively; k2 is the rate constant of methane decomposition (craking) on the metallic surface, while k4 is the rate constant of the reaction between the surface carbonate species and the C deposited on the catalytic surface [15,16].
Sierra Gallego et al. [17] for the Ni/La2O3 catalyst obtained from LaNiNO3 perovskites structure, proposed an additional dual active site mechanism involving analogous reaction steps:
where S1 and S2 represent metallic nickel and support La2O3 active sites, respectively. The related rate of methane conversion assumes the following form:
All of these selected models, which can be considered as representatives of the process, have been introduced into the ANEMONA.XLT tool in order to verify the suitability of the program. The existing models have been properly modified; the experimental data (rateCH4, reagents partial pressure and reaction temperature) employed for the fitting procedure have been derived from the related literature [15,17,18,19,20].
3. Results
Table 1 summarizes the results obtained by fitting the experimental data reported by Özkara-Aydinoğlu and Aksoylu [18] and Ayodele et al. [19] to models from 1 to 4; the goodness of fit is evaluated by the variance of experimental error (σ2) and/or Root mean square deviation (Rmsd), in accordance to what the authors reported in the original articles.

Table 1.
Model parameters predicted by ANEMONA.XLT template compared with analogous literature data.
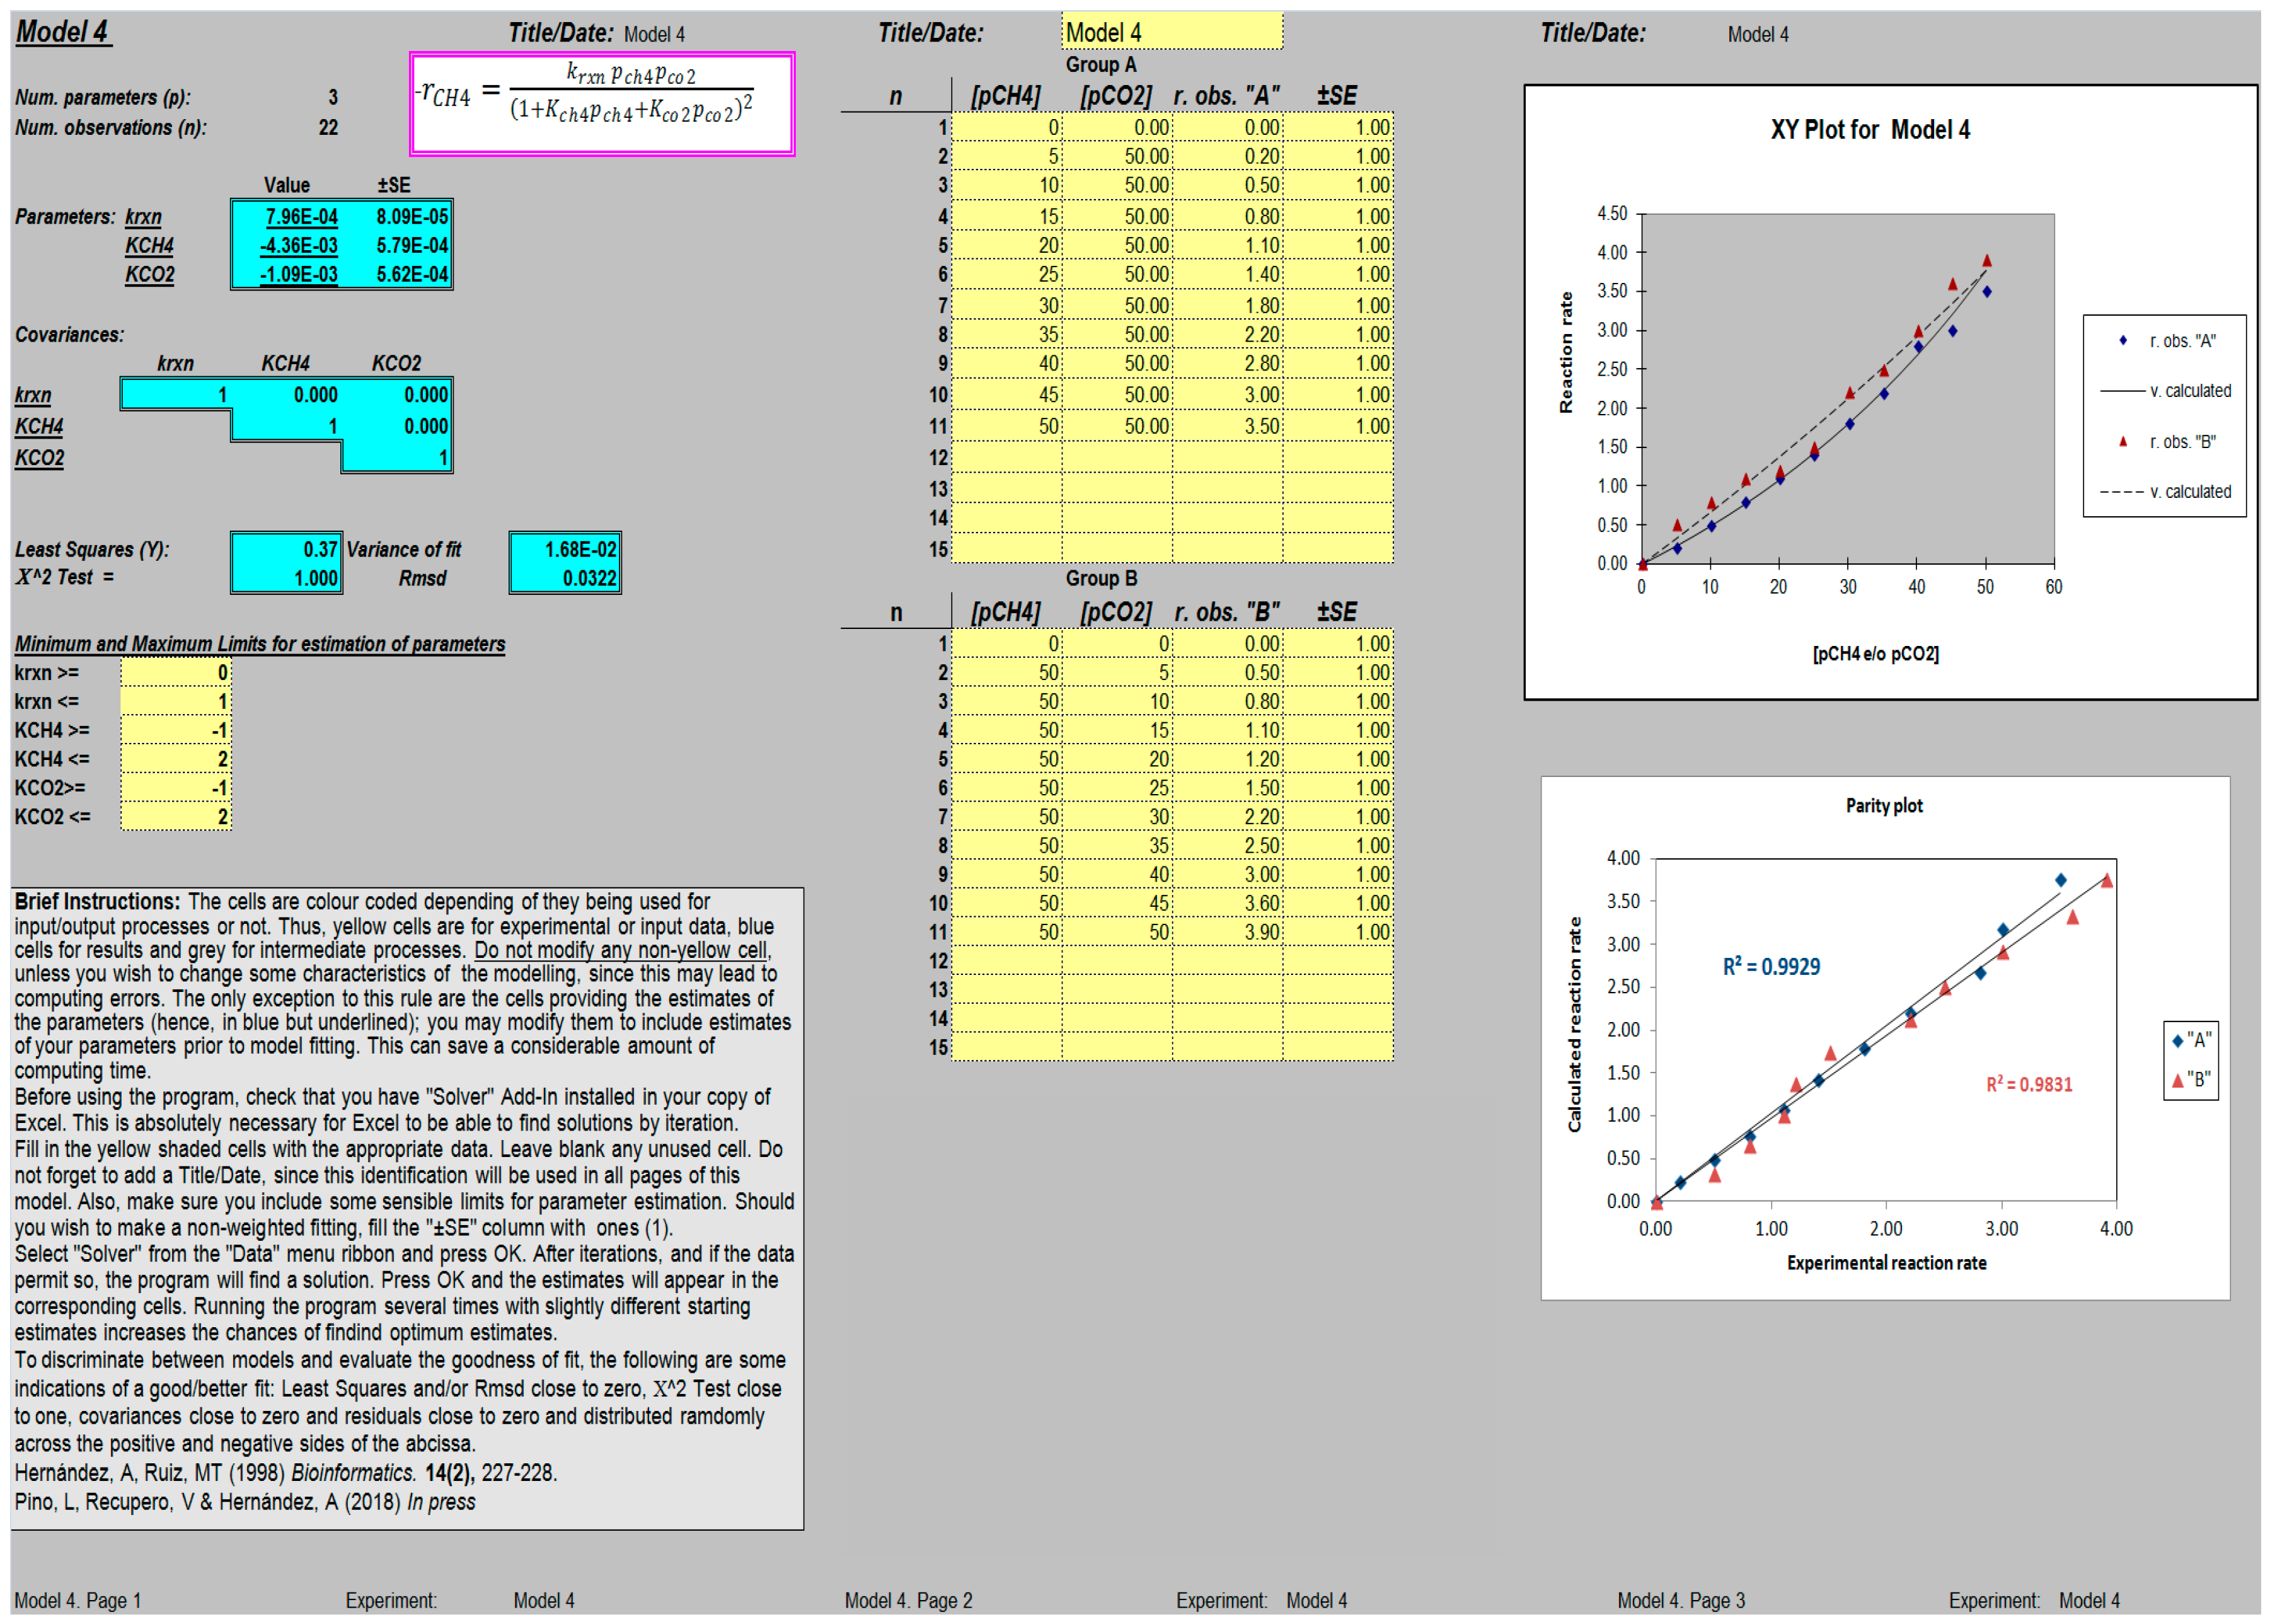
When compared side by side, the estimations of the parameters obtained using the ANEMONA tool were in accordance with those reported by the authors, taking into account the possible inaccuracy of our starting data. A screen capture of the sheet fitting Model 4 after convergence is presented in Figure 1. It is interesting to note that the presence of graph plots (parity plot, analysis of residuals) represents a simple way to visualize the effects on the fit of any variation in the values of the parameter estimated.
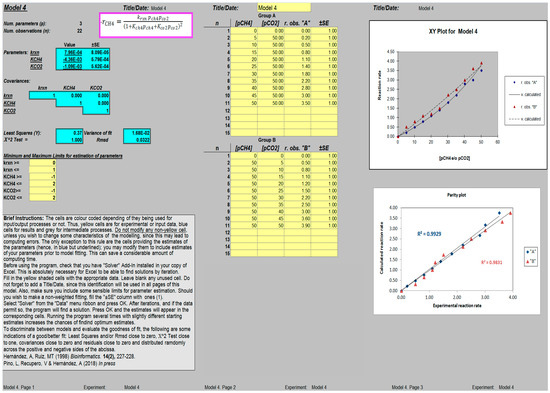
Figure 1.
Screen capture of a worksheet template for the determination of kinetic parameters (k, KCH4 and KCO2; Model 4 [19]); after reaching convergence, the variance of the fit and Rmsd values, together with additional graphs showing the original data vs. the independent variables (pCH4 and/or pCO2) and a parity plot (experimental vs. calculated rate), are displayed.
The related parity plot depicted in Figure 2, where the experimental reaction rate (at increasing reaction temperatures) is related to the calculated rate, demonstrates the appreciable quality of the fitting with R2 ranging from 0.970 to 0.985.

Figure 2.
Parity plot for the rate of CH4 consumption, at increasing reaction temperatures, when comparing experimental data [19] with estimates obtained using ANEMONA after fitting Model 4 for the methane dry reforming reaction.
Models 5 and 6 involving the prediction of four parameters (K1, k2, K3, and k4) become a more complex mathematical model. Model 5 has been applied by Múnera et al. [15] to catalytic systems, including a catalytic active phase (Rh) supported on La2O3; the authors derive the equilibrium constant K3, related to the adsorption equilibrium of CO2 on the support (Equation (3)), from thermodynamic data reported in literature by Shirsat et al. [21]:
On this basis, the predicted parameter values by application of the ANEMONA tools are summarized in Table 2, along with the parameter estimations by the cited authors [15].
Table 2.
Model parameters predicted by ANEMONA.XLT template from Models 5 and 6.
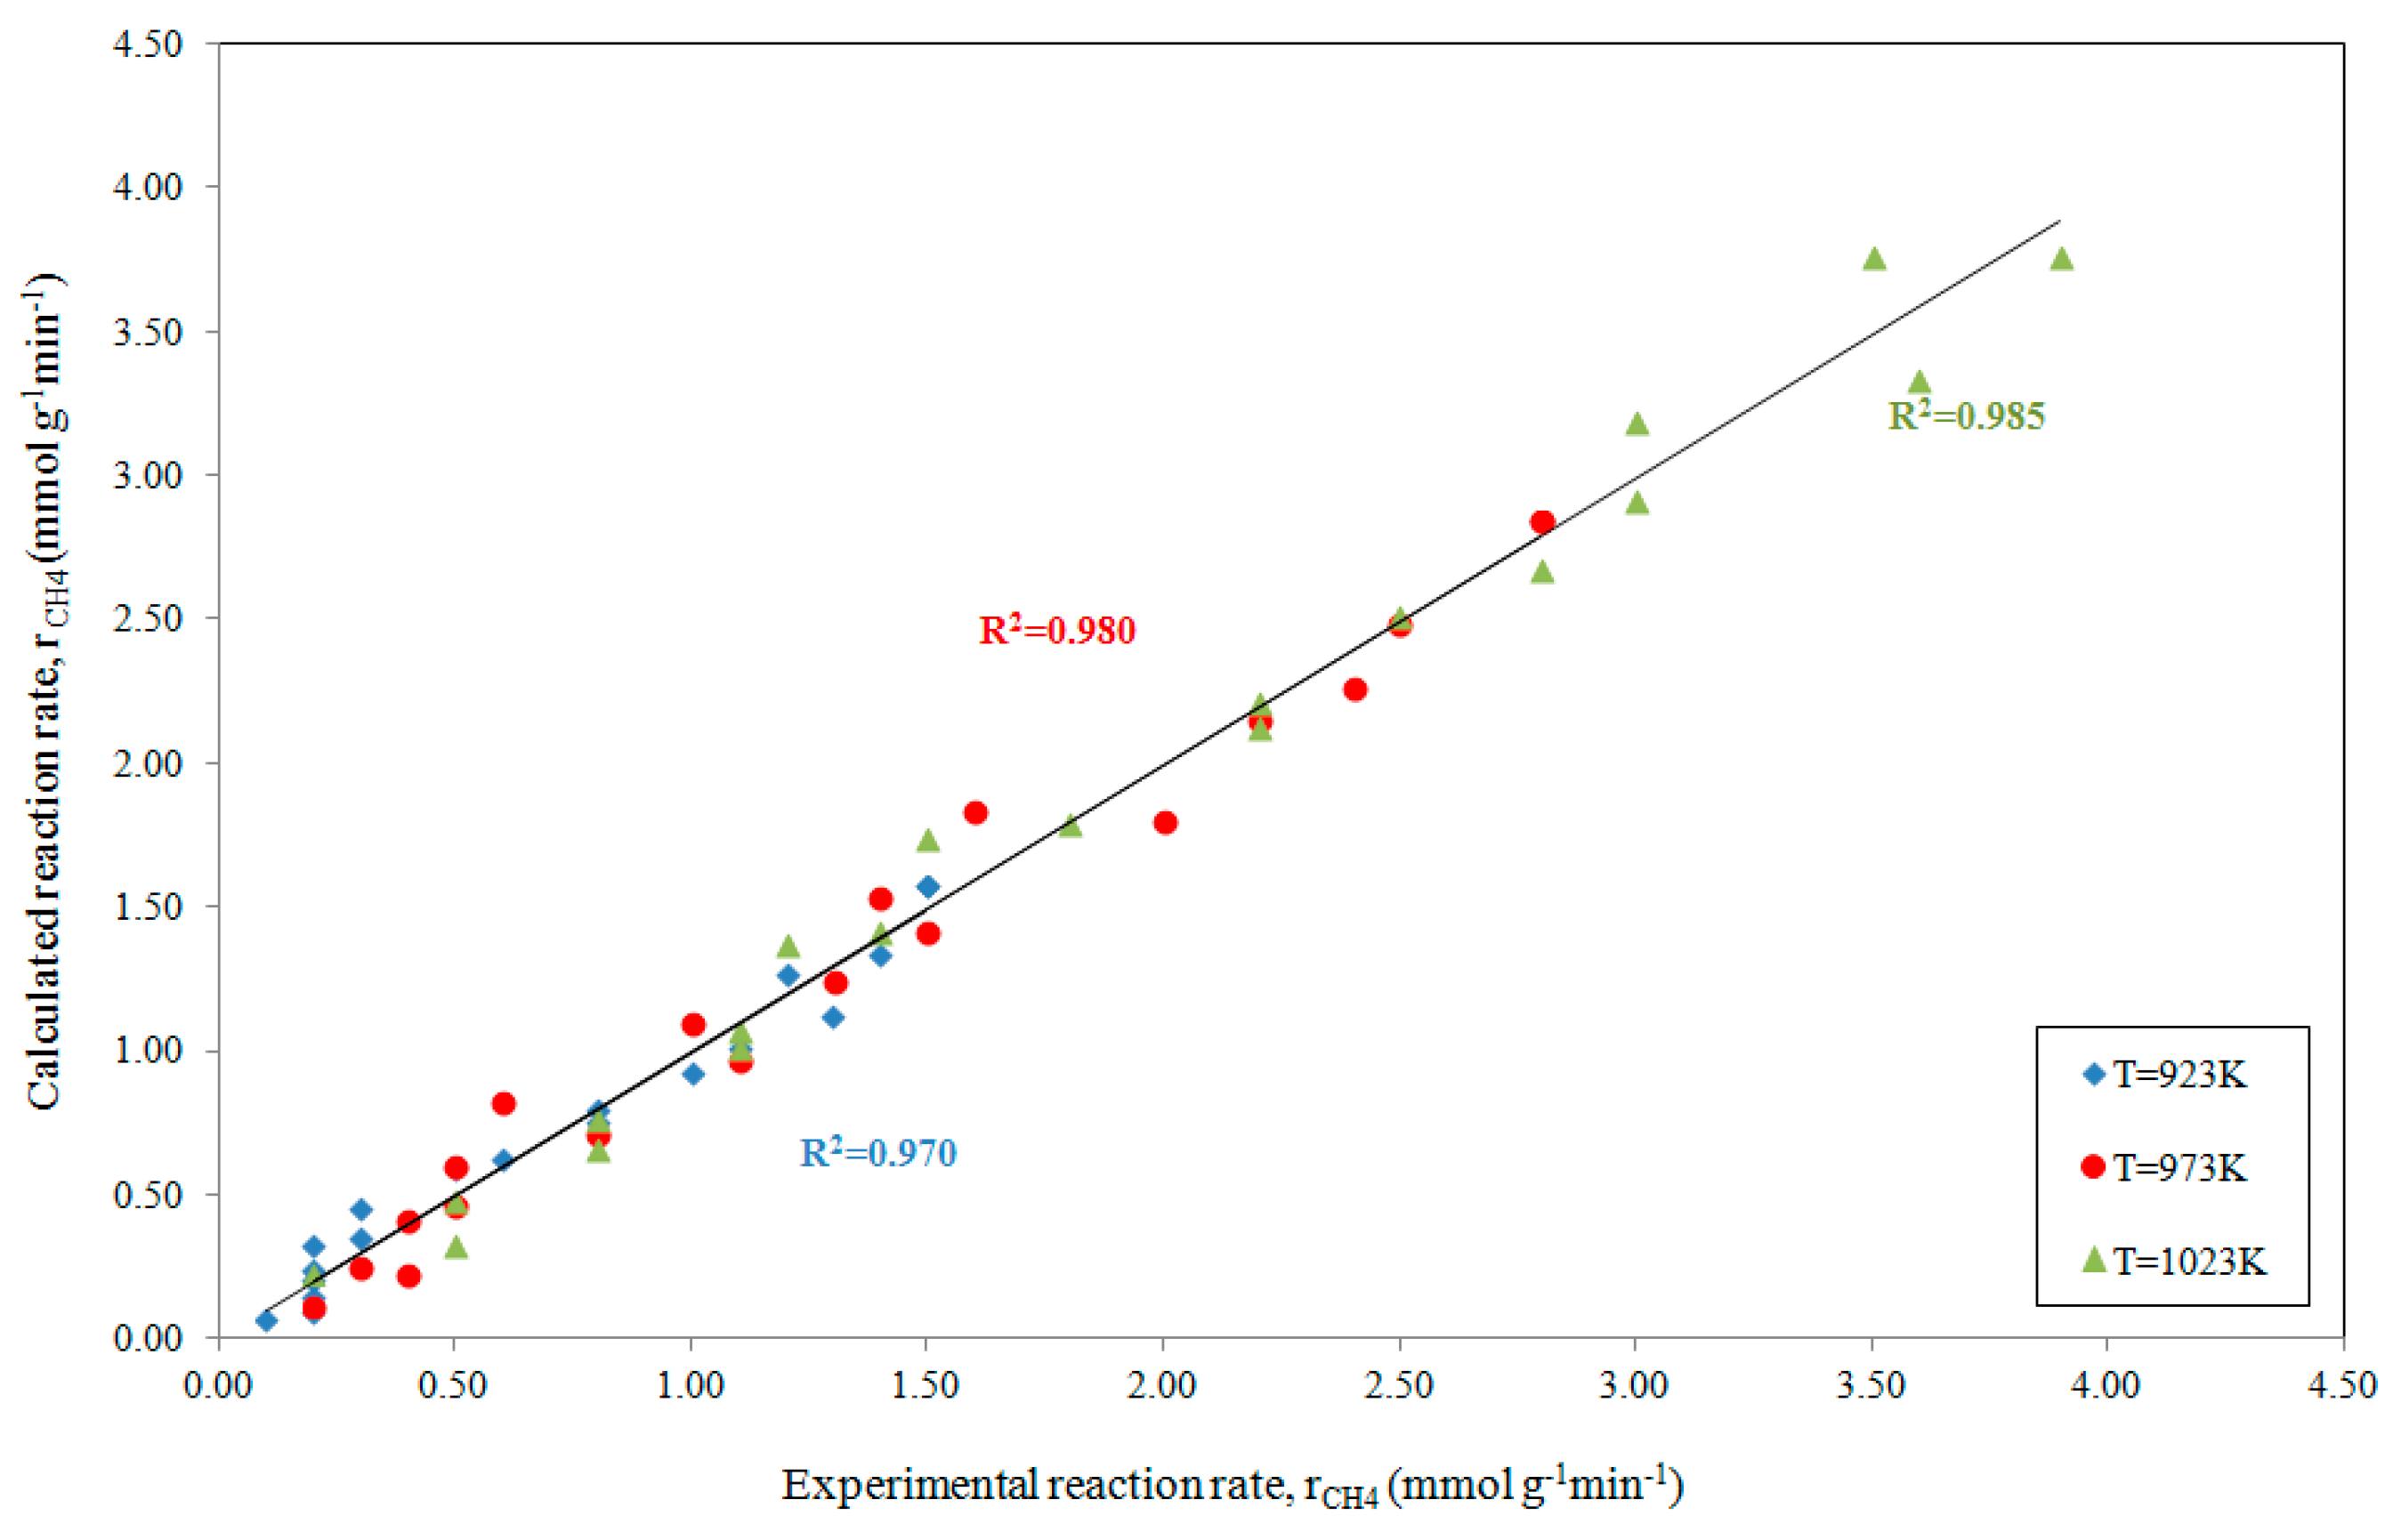
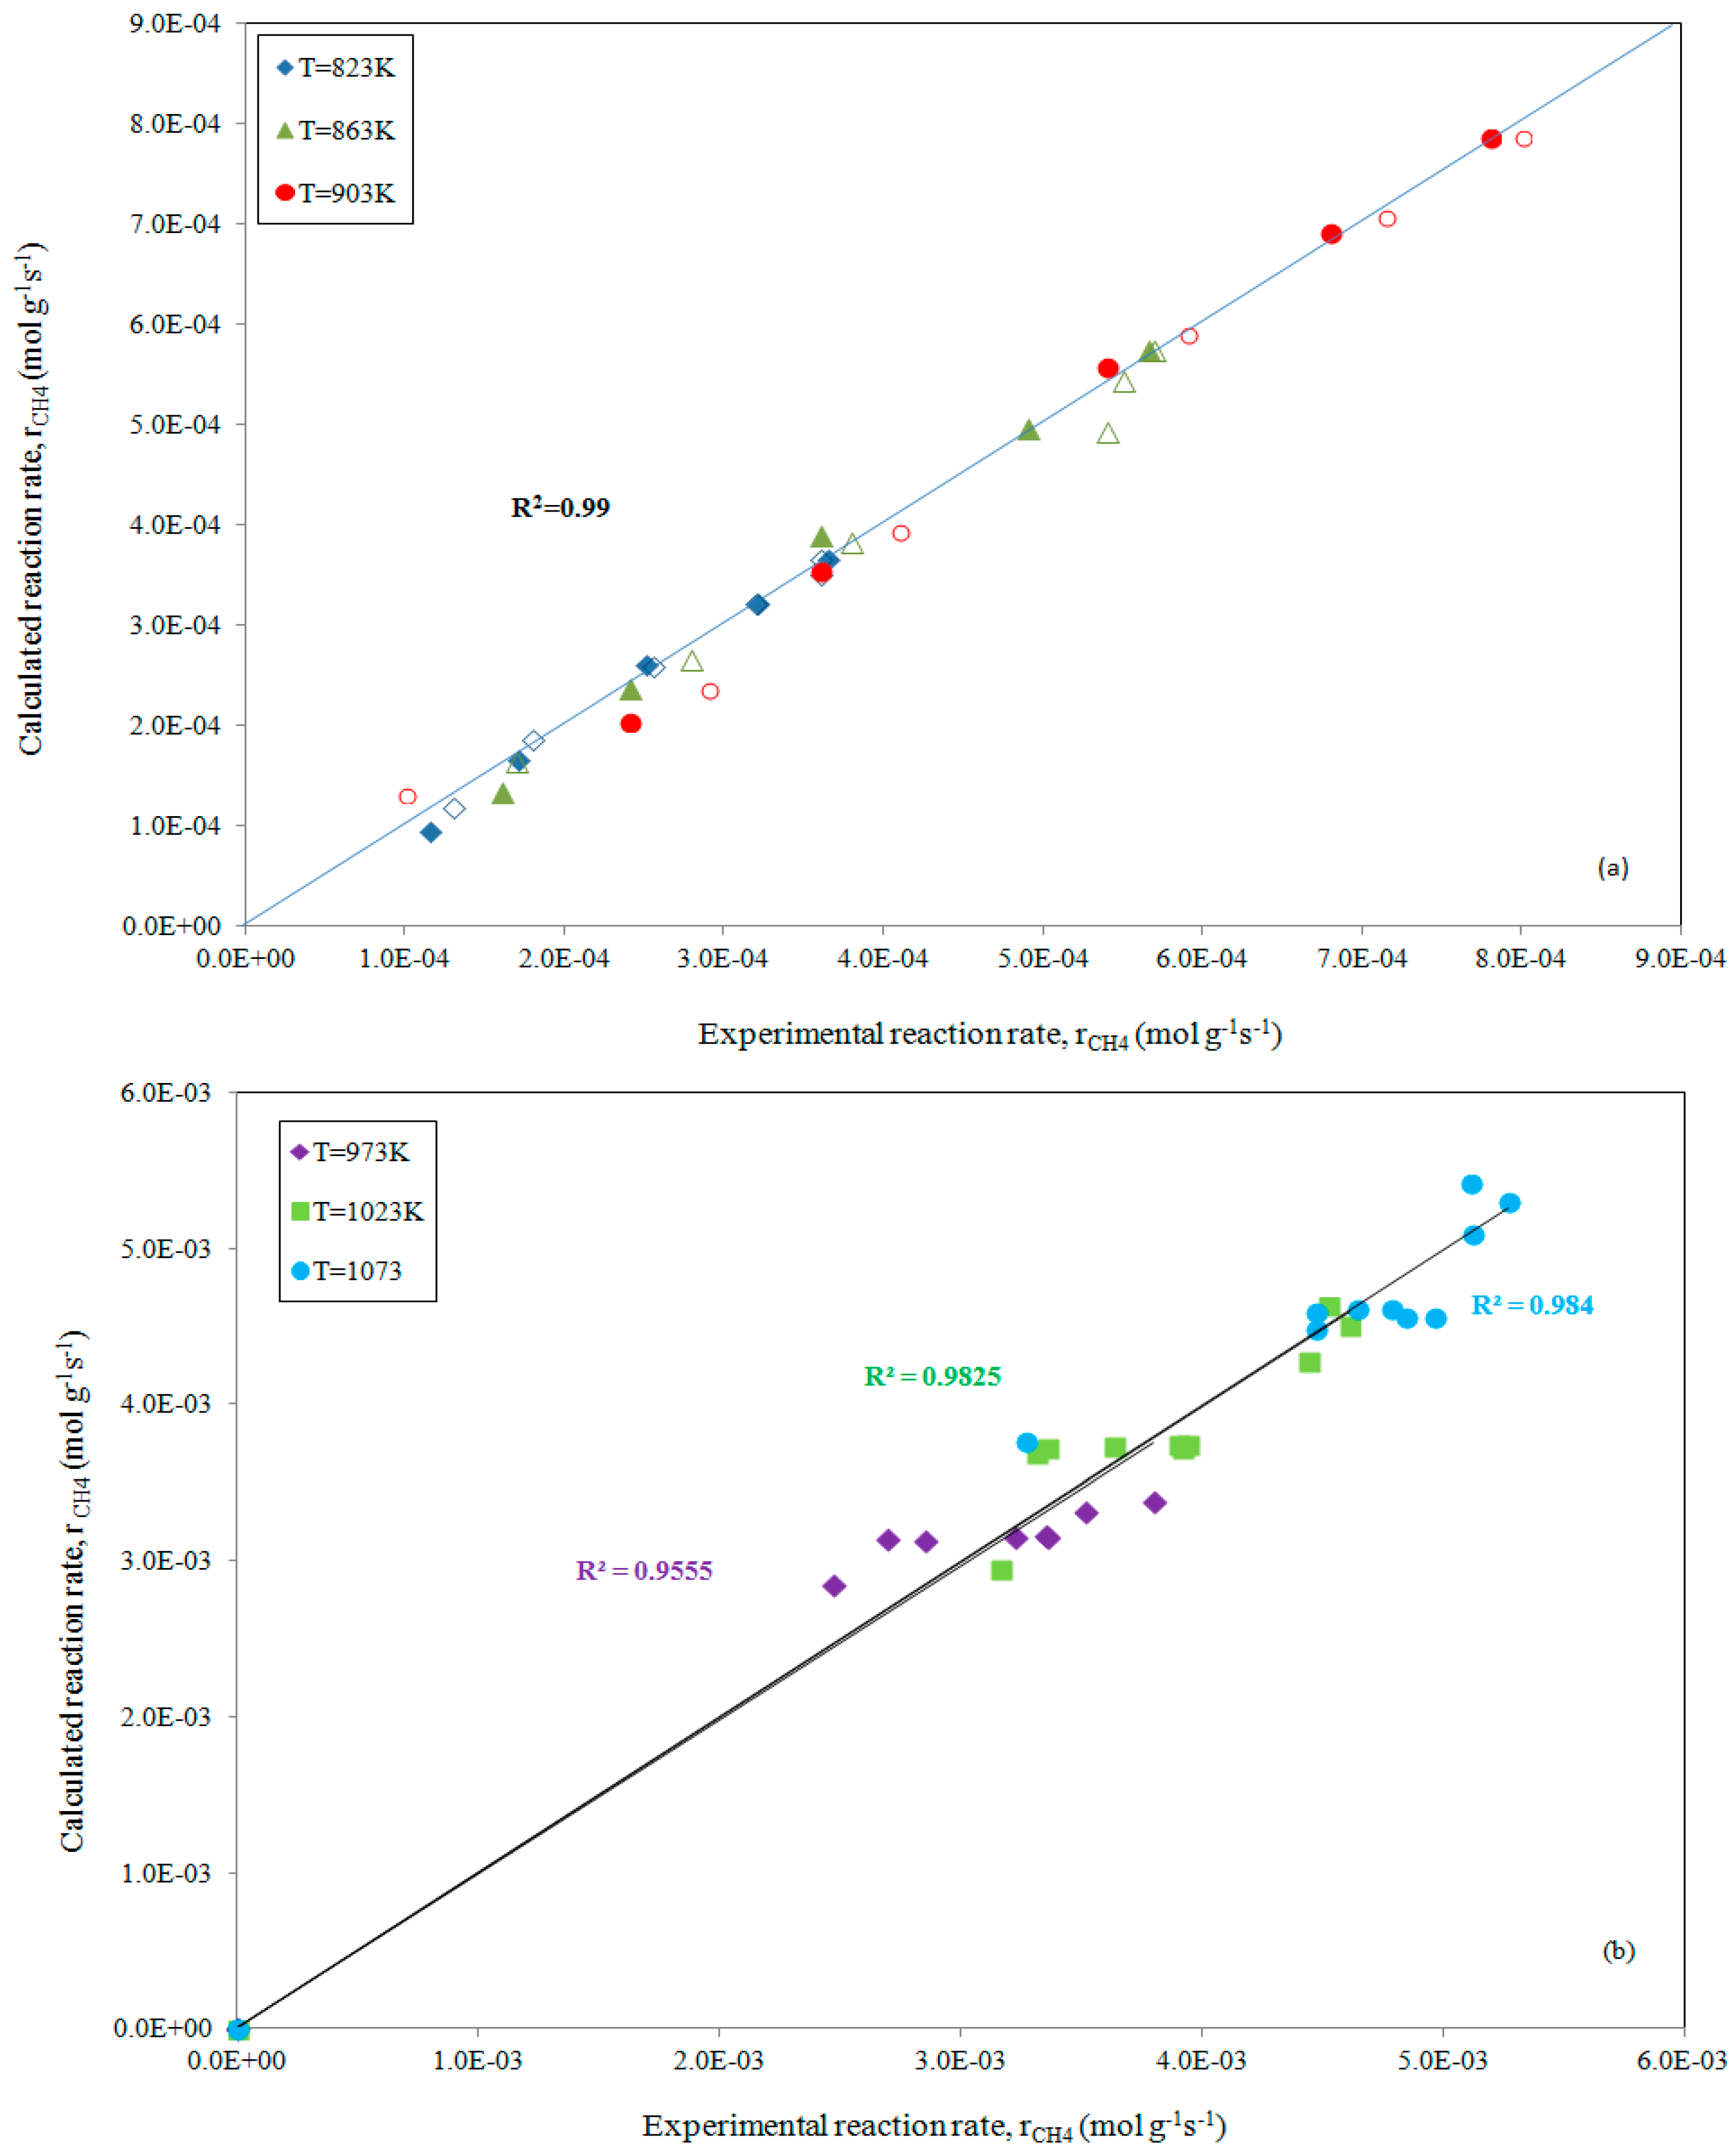
The slight differences between our predicted data and those that were reported earlier can be ascribed to different factors (fitting procedure and/or inaccuracy of our starting data); while a good fitting, with R2 = 0.99, emerges from the parity plot that is depicted in Figure 3a.
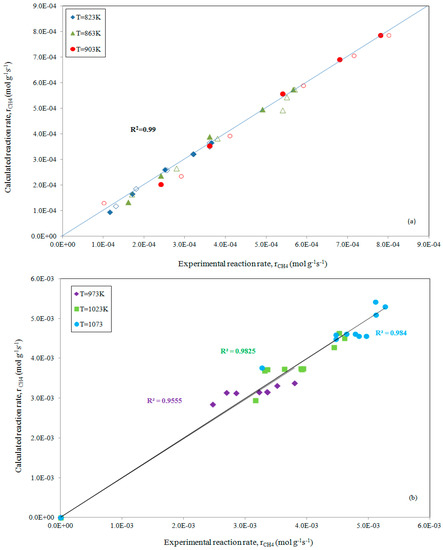
Figure 3.
Parity plot for the rate of CH4 consumption, at increasing reaction temperatures while maintaining pCO2 (full symbols) or pCH4 constant (empty symbols), comparing experimental data [15] and estimates obtained using ANEMONA after fitting Model 5 for the methane dry reforming reaction (a) and for experimental data from Reference [20] (b), respectively.
Similarly, the prediction of all the parameters present in Model 5 has been carried out by fitting the experimental data reported by Fan et al. [20] with a bimetallic Ni-Co/MgO-ZrO2 catalyst. The fitting results, as reported in Table 2 and depicted in Figure 3b, confirm the appreciable reliability of the ANEMONA.
The complexity of Model 6 is solved by Sierra Gallego et al. [17] introducing in the model the value K1k2 ( from previous literature [13]; the individually derived kinetic constants are reported in Table 2. Clearly, the estimations evaluated by ANEMONA were in accordance with those that were reported by the authors in the original article.
4. Advantages and Limitations
The reliability of the ANEMONA tool is dependent on the input parameters; indeed, if the initial parameters are inappropriate, the iteration process can result in a wrong solution. Similar published data, or alternatively, educated guesses can be used. The standard procedure consists in the variation of these data up and down, the repetition of the non-linear estimation, checking and discarding both estimations and initial guesses that produce absurd fitting and focusing on the estimated parameters with good fittings (i.e., little differences between the estimations and the experimental data).
The next step will be to check the physical significance of the fitted parameters; for example, if the adsorption equilibrium constant is one of the derived parameters, the fitted value must decrease with increasing temperature, because the adsorption is an exothermic process. As we have shown in this report, ANEMONA.XLT is flexible enough to be useful in the estimation of kinetic parameters, not only for biochemical reactions, but also for purely chemical ones. The only limitation is the availability of a reasonable mathematical model.
5. Conclusions
In this study, the suitability and adaptability of the Excel template, ANEMONA.XLT, with the purpose of fitting experimental data to some kinetic models proposed for dry reforming reactions, has been evidenced; the reliability of the tools was demonstrated by successful comparison of the results of the analysis using ANEMONA.XLT with those that were reported in the literature obtained with other software packages. The estimated parameters were considered satisfactory and, therefore, ANEMONA.XLT can be a reliable tool for the routine model discrimination pertaining reforming reactions as well as a fast and easy one to use.
Author Contributions
L.P. has adapted the ANEMONA.XLT tool to dry reforming kinetic models and written the paper; A.H. contributed to the algorithm design and revised the manuscript; V.R. has given his overall supervision.
Funding
This work was funded by the Fundação de Amparo à Pesquisa do Estado de São Paulo (FAPESP) through grant number 2014/10443-0.
Availability
The program is available from: https://github.com/oilarrak/ANEMONA.
Conflicts of Interest
The authors declare no conflict of interest.
References
- Abdullah, B.; Ghani, N.A.A.; Vo, D.-V.N. Recent advance in dry reforming of methane over Ni-Based catalysts. J. Clean. Prod. 2017, 162, 170–185. [Google Scholar] [CrossRef]
- Pakhare, D.; Spivey, J. A review of dry (CO2) reforming of methane over noble metal catalysts. Chem. Soc. Rev. 2014, 43, 7813–7837. [Google Scholar] [CrossRef] [PubMed]
- Pino, L.; Italiano, C.; Vita, A.; Laganà, M.; Recupero, V. Ce0.70La0.20Ni0.10O2-δ catalyst for biogas dry reforming: Influence of reduction temperature on the catalytic activity and stability. Appl. Catal. B 2017, 218, 779–792. [Google Scholar] [CrossRef]
- Goula, M.A.; Charisiou, N.D.; Papageridis, K.N.; Delimitis, A.; Pachatouridou, E.; Iliopoulou, E.F. Nickel on alumina catalysts for the production of hydrogen rich mixtures via the biogas dry reforming reaction: Influence of the synthesis method. Int. J. Hydrog. Energy 2015, 40, 9183–9200. [Google Scholar] [CrossRef]
- Das, S.; Ashok, J.; Bian, Z.; Dewangan, N.; Wai, M.H.; Du, Y.; Borgna, A.; Hidajat, K.; Kawi, S. Silica-Ceria sandwiched Ni core-shell catalyst for low temperature dry reforming of biogas: Coke resistance and mechanistic insights. Appl. Catal. B 2018, 230, 220–236. [Google Scholar] [CrossRef]
- Iyer, M.V.; Norcio, L.P.; Kugler, E.L.; Dadyburjor, D.B. Kinetic modelling for methane reforming with carbon dioxide over a mixed-metal carbide catalyst. Ind. Eng. Chem. Res. 2003, 42, 2712–2721. [Google Scholar] [CrossRef]
- Kathiraser, Y.; Oemar, U.; Saw, E.T.; Li, Z.; Kawi, S. Kinetic and mechanistic aspect for CO2 reforming of methane over Ni based catalysts. Chem. Eng. J. 2015, 278, 62–78. [Google Scholar] [CrossRef]
- Bao, Z.; Lu, Y.; Yu, F. Kinetic study of methane reforming with carbon dioxide over NiCeMgAl bimodal pore catalyst. AIChE J. 2017, 63, 2019–2029. [Google Scholar] [CrossRef]
- Hernández, A.; Ruiz, M.T. An Excel template for calculation of enzyme kinetic parameters by non-linear regression. Bioinformatics 1998, 14, 227–228. [Google Scholar] [CrossRef] [PubMed]
- Mark, M.F.; Mark, F.; Maier, W.F. Reaction kinetics of the CO2 reforming of methane. Chem. Eng. Tecnol. 1997, 20, 361–370. [Google Scholar] [CrossRef]
- Olsbye, U.; Wurtzel, T.; Mleczko, L. Kinetic and reaction engineering studies of dry reforming of methane over a Ni/La/Al2O3 catalyst. Ind. Eng. Chem. Res. 1997, 36, 5180–5188. [Google Scholar] [CrossRef]
- Wang, S.; Lu, G.Q. A comprensive study on carbon dioxide reforming of methane over Ni/γ-Al2O3 catalysts. Ind. Eng. Chem. Res. 1999, 38, 2615–2625. [Google Scholar] [CrossRef]
- Verykios, X.E. Catalytic dry reforming of natural gas for the production of chemicals and hydrogen. Int. J. Hydrog. Energy 2003, 28, 1045–1063. [Google Scholar] [CrossRef]
- Carrara, C.; Múnera, J.; Lombardo, E.A.; Cornaglia, L.M. Kinetic and stability studies of Ru/La2O3 used in the dry reforming of methane. Top. Catal. 2008, 51, 98–106. [Google Scholar] [CrossRef]
- Múnera, J.F.; Cornaglia, L.M.; Vargas Cesar, D.; Schmal, M.; Lombardo, E.A. Kinetic studies of the dry reforming of methane over the Rh/La2O3-SiO2 catalyst. Ind. Eng. Chem. Res. 2007, 46, 7543–7549. [Google Scholar] [CrossRef]
- Moradi, G.R.; Rahmanzadeh, M.; Sharifnia, S. Kinetic investigation of CO2 reforming of CH4 over La-Ni based perovskite. Chem. Eng. J. 2010, 162, 787–791. [Google Scholar] [CrossRef]
- Sierra Gallego, G.; Batiot-Dupeyrat, C.; Barrault, J.; Mondragόn, F. Dual active-site mechanism for dry methane reforming over Ni/La2O3 produced from LaNiO3 perovskite. Ind. Eng. Chem. Res. 2008, 47, 9272–9278. [Google Scholar] [CrossRef]
- Özkara-Aydinoğlu, S.; Aksoylu, A.E. A comparative study on the kinetics of carbon dioxide reforming of methane over Pt-Ni/Al2O3 catalyst: Effect of Pt/Ni ratio. Chem. Eng. J. 2013, 215–216, 542–549. [Google Scholar] [CrossRef]
- Ayodele, B.V.; Abdullah, S.B.; Cheng, C.K. Kinetics and mechanistic studies of CO-rich hydrogen production by CH4/CO2 reforming over praseodymia supported catalysts. Int. J. Hydrog. Energy 2017, 42, 28408–28424. [Google Scholar] [CrossRef]
- Fan, M.-S.; Abdullah, A.Z.; Bathia, S. Utilization of Greenhouse Gases through Dry Reforming: Screening of Nickel-Based Bimetallic Catalysts and Kinetic Studies. Chem.Sus.Chem. 2011, 4, 1643–1653. [Google Scholar] [CrossRef]
- Shirsat, A.N.; Ali, M.; Kaimal, K.N.G.; Bharadwaj, S.R.; Das, D. Thermochemistry of La2O2CO3 decomposition. Thermochim. Acta 2003, 399, 167–170. [Google Scholar] [CrossRef]
© 2018 by the authors. Licensee MDPI, Basel, Switzerland. This article is an open access article distributed under the terms and conditions of the Creative Commons Attribution (CC BY) license (http://creativecommons.org/licenses/by/4.0/).