Article

Demonstration of the Use of 3D X-ray Tomography to Compare the Uniformity of Catalyst Coatings in Open-Cell Foams

1
Laboratoire de Génie des Procédés Catalytiques, Institut de Chimie de Lyon, Université de Lyon, UMR 5285-CNRS-CPE Lyon-UCBL, 69100 Villeurbanne, France
2
MATEIS, INSA Lyon-Université Claude Bernard Lyon I-CNRS, Université de Lyon, 69100 Villeurbanne, France
*
Author to whom correspondence should be addressed.
ChemEngineering 2018, 2(4), 52; https://doi.org/10.3390/chemengineering2040052
Submission received: 2 October 2018 / Revised: 24 October 2018 / Accepted: 26 October 2018 / Published: 30 October 2018

Abstract

:
Coating open-cell foams by a catalytic layer is a necessary step to obtain structured catalytic foam reactors. The dip-coating method, consisting of immersing the foam in a suspension or in a sol-gel, is generally used to obtain the coating. The excess of liquid has to be evacuated from the foam to obtain a thin layer. Different methods to remove this excess of liquid have been investigated in the present work. The objective was to show that 3D X-ray tomography coupled to image analysis could be a tool to discriminate the methods by analysing the spatial localisation of the catalyst layer throughout the whole foam samples. A simple blowing by air in every direction seems to not be appropriate to obtain uniform coatings.

Graphical Abstract

1. Introduction

Monolithic catalysts have been studied for decades, not only as catalytic converters of exhaust gas in cars, but also for various gas/solid and gas/liquid/solid reactions [1,2,3]. Open-cell foams have more recently demonstrated their potential to serve as structures to replace monoliths in catalytic reactors. Many examples of catalyst-coated foams have also been published for gas/solid and gas/liquid/solid reactions [4,5,6]. Using catalyst-coated foams in chemical reactor engineering has thus become a standard in laboratories to improve mass and heat transfer and avoid high pressure drops [7,8]. Nevertheless, catalyst-coated foams are not readily available materials that can be found in catalogues. Every lab has acquired a know-how to obtain coated foams. Many protocols are based on the use of a solid suspension (sometimes a sol-gel) which is applied by dip-coating [9,10,11,12]. An important part of the know-how is related to the removal of the excess suspension, to avoid clogging the pores of the foam and to obtain the desired thickness and uniformity. Recent advances have made the use of 3D X-ray tomography more accessible to chemical engineers. The method was used to characterize heat transfer [13,14], to check the defects of a fabrication [15,16], and for hydrodynamic characterizations [17,18]. Concerning the coating characterization, a sample of commercial catalytic monolith for automotive exhaust gas after treatment was scanned by X-ray microtomography to obtain realistic 3D images of the coated layer [19]. More recently, it has been used by the group of Lange [20,21] to check the thickness distribution throughout a whole foam. It was also used to check the quality and uniformity of a ZSM-5 coating on SiC foams [22]. In the present work, we also use the 3D microtomography tool to estimate the coating thickness and we go further, by comparing several methods that can be used at lab scale to remove the excess suspension from an open cell foam. Our objective was to find the best method to provide a uniform coating throughout real structured material that will be used in actual reactors. The local measurement of the layer thickness can offer a crucial advantage to take into account correctly, for example, transfer limitation or local flow restrictions. We demonstrate here that the tomography analysis of coated foams makes possible the control of the catalyst distribution/localization on the structured surface and the choice of the best method to reach uniform coatings. The method is applied to catalytic coatings in the present article but could be applied to other thin films [23].

2. Material and Methods

2.1. Open Cell Foams

The substrates that were chosen to host porous films were open cell foams of different materials. Aluminum foams were provided by ERG Materials and Aerospace Corp. (Oakland, CA, USA), SiC foams were from SICAT (Strasbourg, France) and FeCrAl from Porvair Selee Corp. (Hendersonville, NC, USA).
The foams were cut in parallelepipeds in the case of the preliminary work (10 mm × 14.5 mm × 19 mm) and then cylinders of 20 mm diameter per 20 mm long were used in the second part.
Al and SiC foams were simply degreased in acetone and dried before coating. FeCrAl foams were thermally treated at 1100 C under air flow for 15 min to allow the formation of alumina whiskers on the surface.

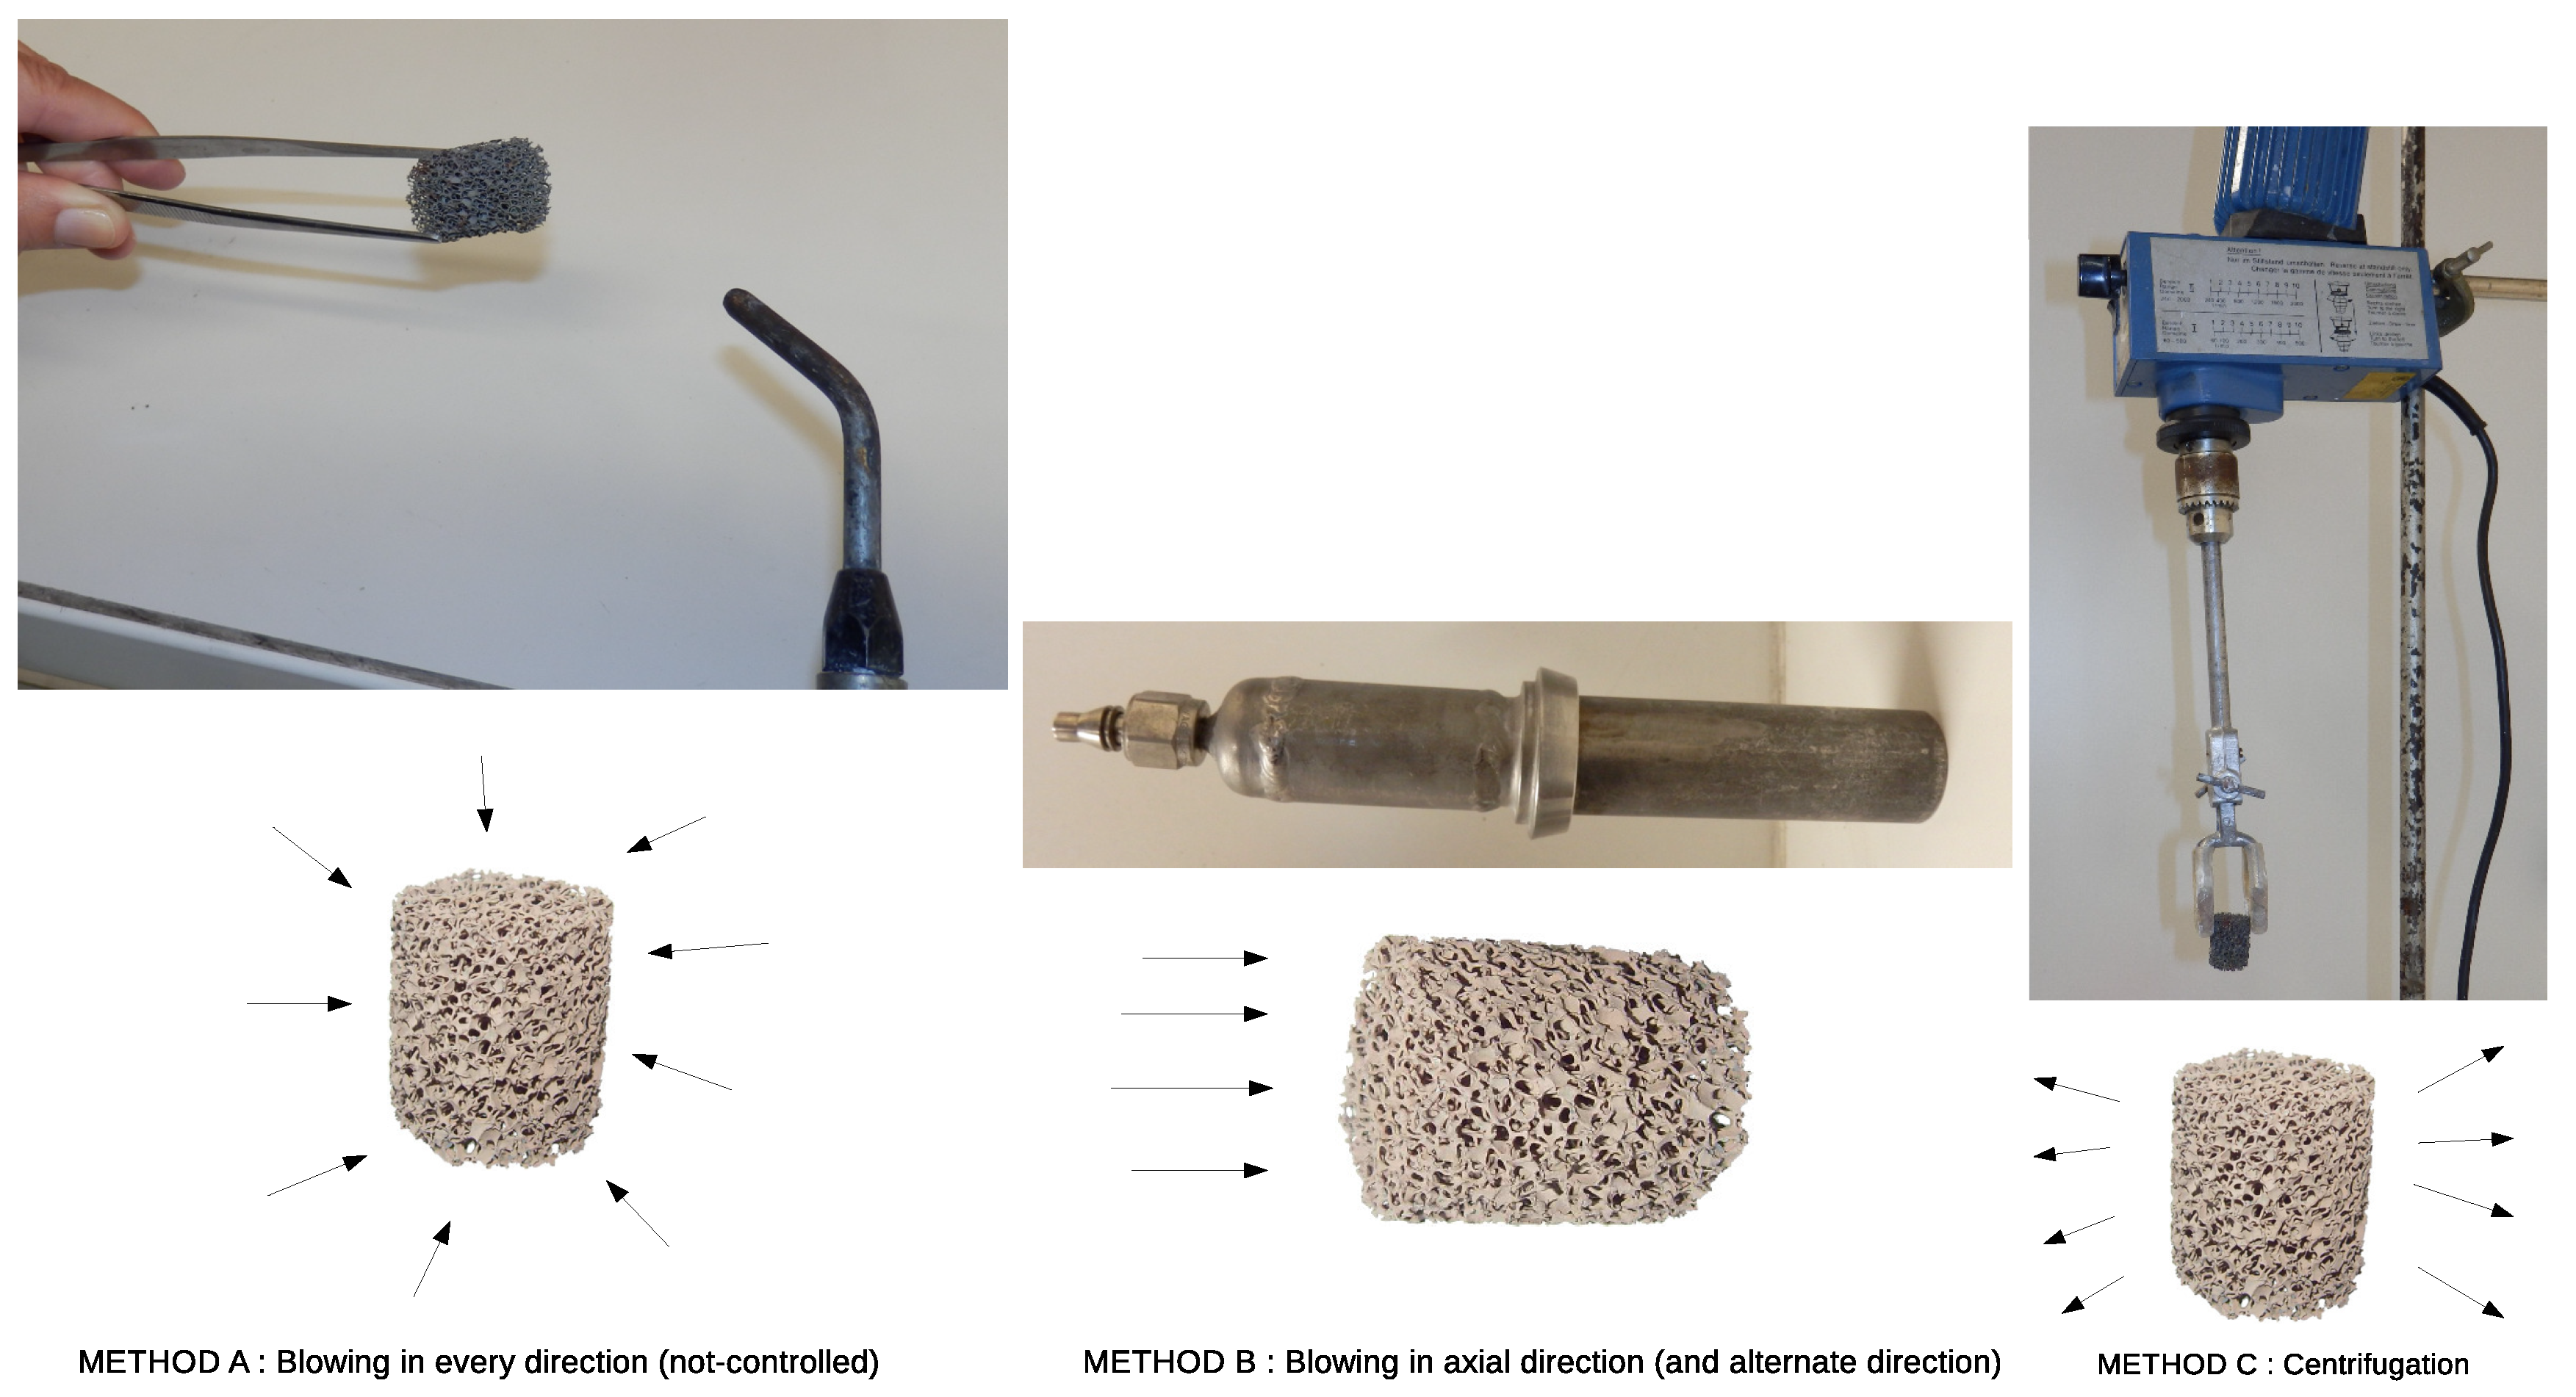
2.2. Coating Protocols

The porous films were obtained by dip-coating the open cell foams in an aqueous suspension containing the catalyst (or catalyst support) to be coated and some additives. Depending on the targeted coating, one (only) of the two following suspensions was used:
  • The alumina suspension was prepared according to previous studies [24,25] and is briefly reminded here. A slurry containing water (20 g), nitric acid (0.6 mL) and γ -aluminum oxide powder (30 g) is stirred and further ball-milled to obtain a homogeneous non-settling suspension of 0.66 g/cm 3 .
  • The bismuth molybdenum oxide suspension is prepared by ball-milling the catalyst (15 g) in a mixture of water (12.5 g), Ludox AS40 (12.5 g) and PEG 200 (0.15 g) during 45 min at 300 rpm.
Whatever the material to coat, the suspension was applied to the foam substrate by the dip-coating method. It consisted of immersing the foam in the chosen suspension and, after withdrawal, removing the excess of suspension to avoid pore plugging. The coating has to cover the foam struts, as a uniform and thin layer of a few tens of micrometers, but it should not obstruct the pores. Three methods have been used to evacuate the excess suspension out of the foam pores (Figure 1):
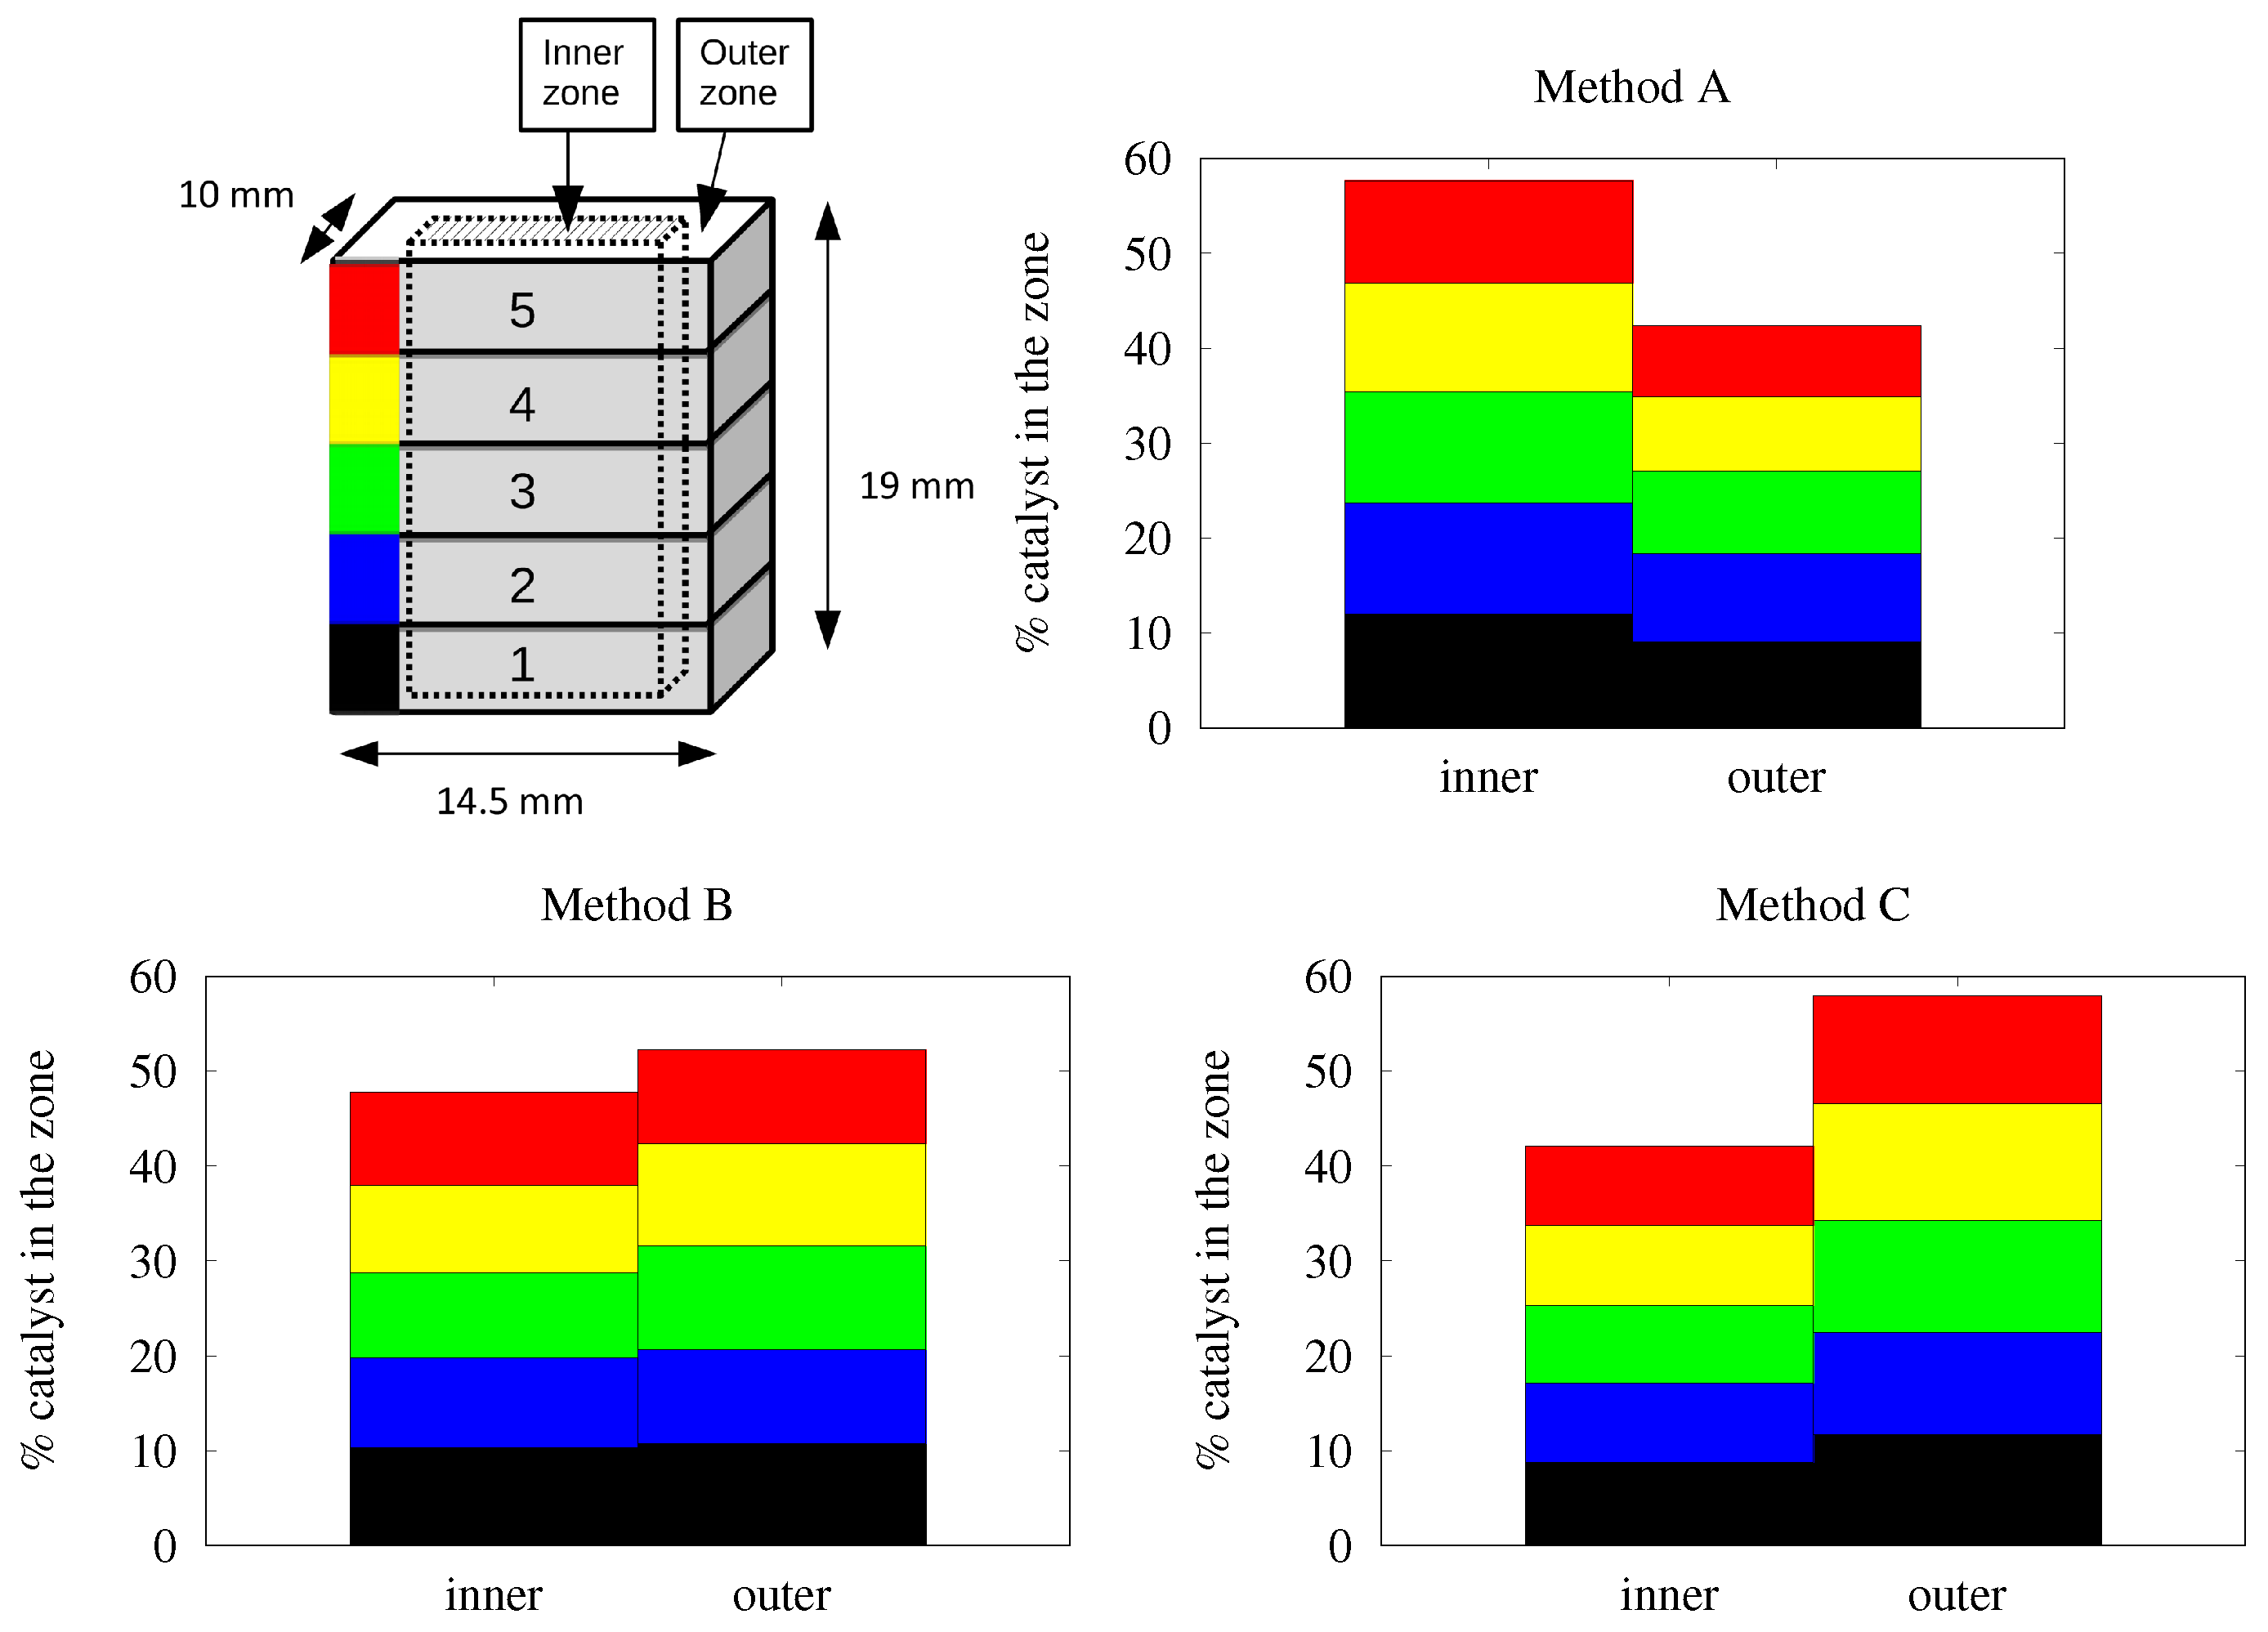
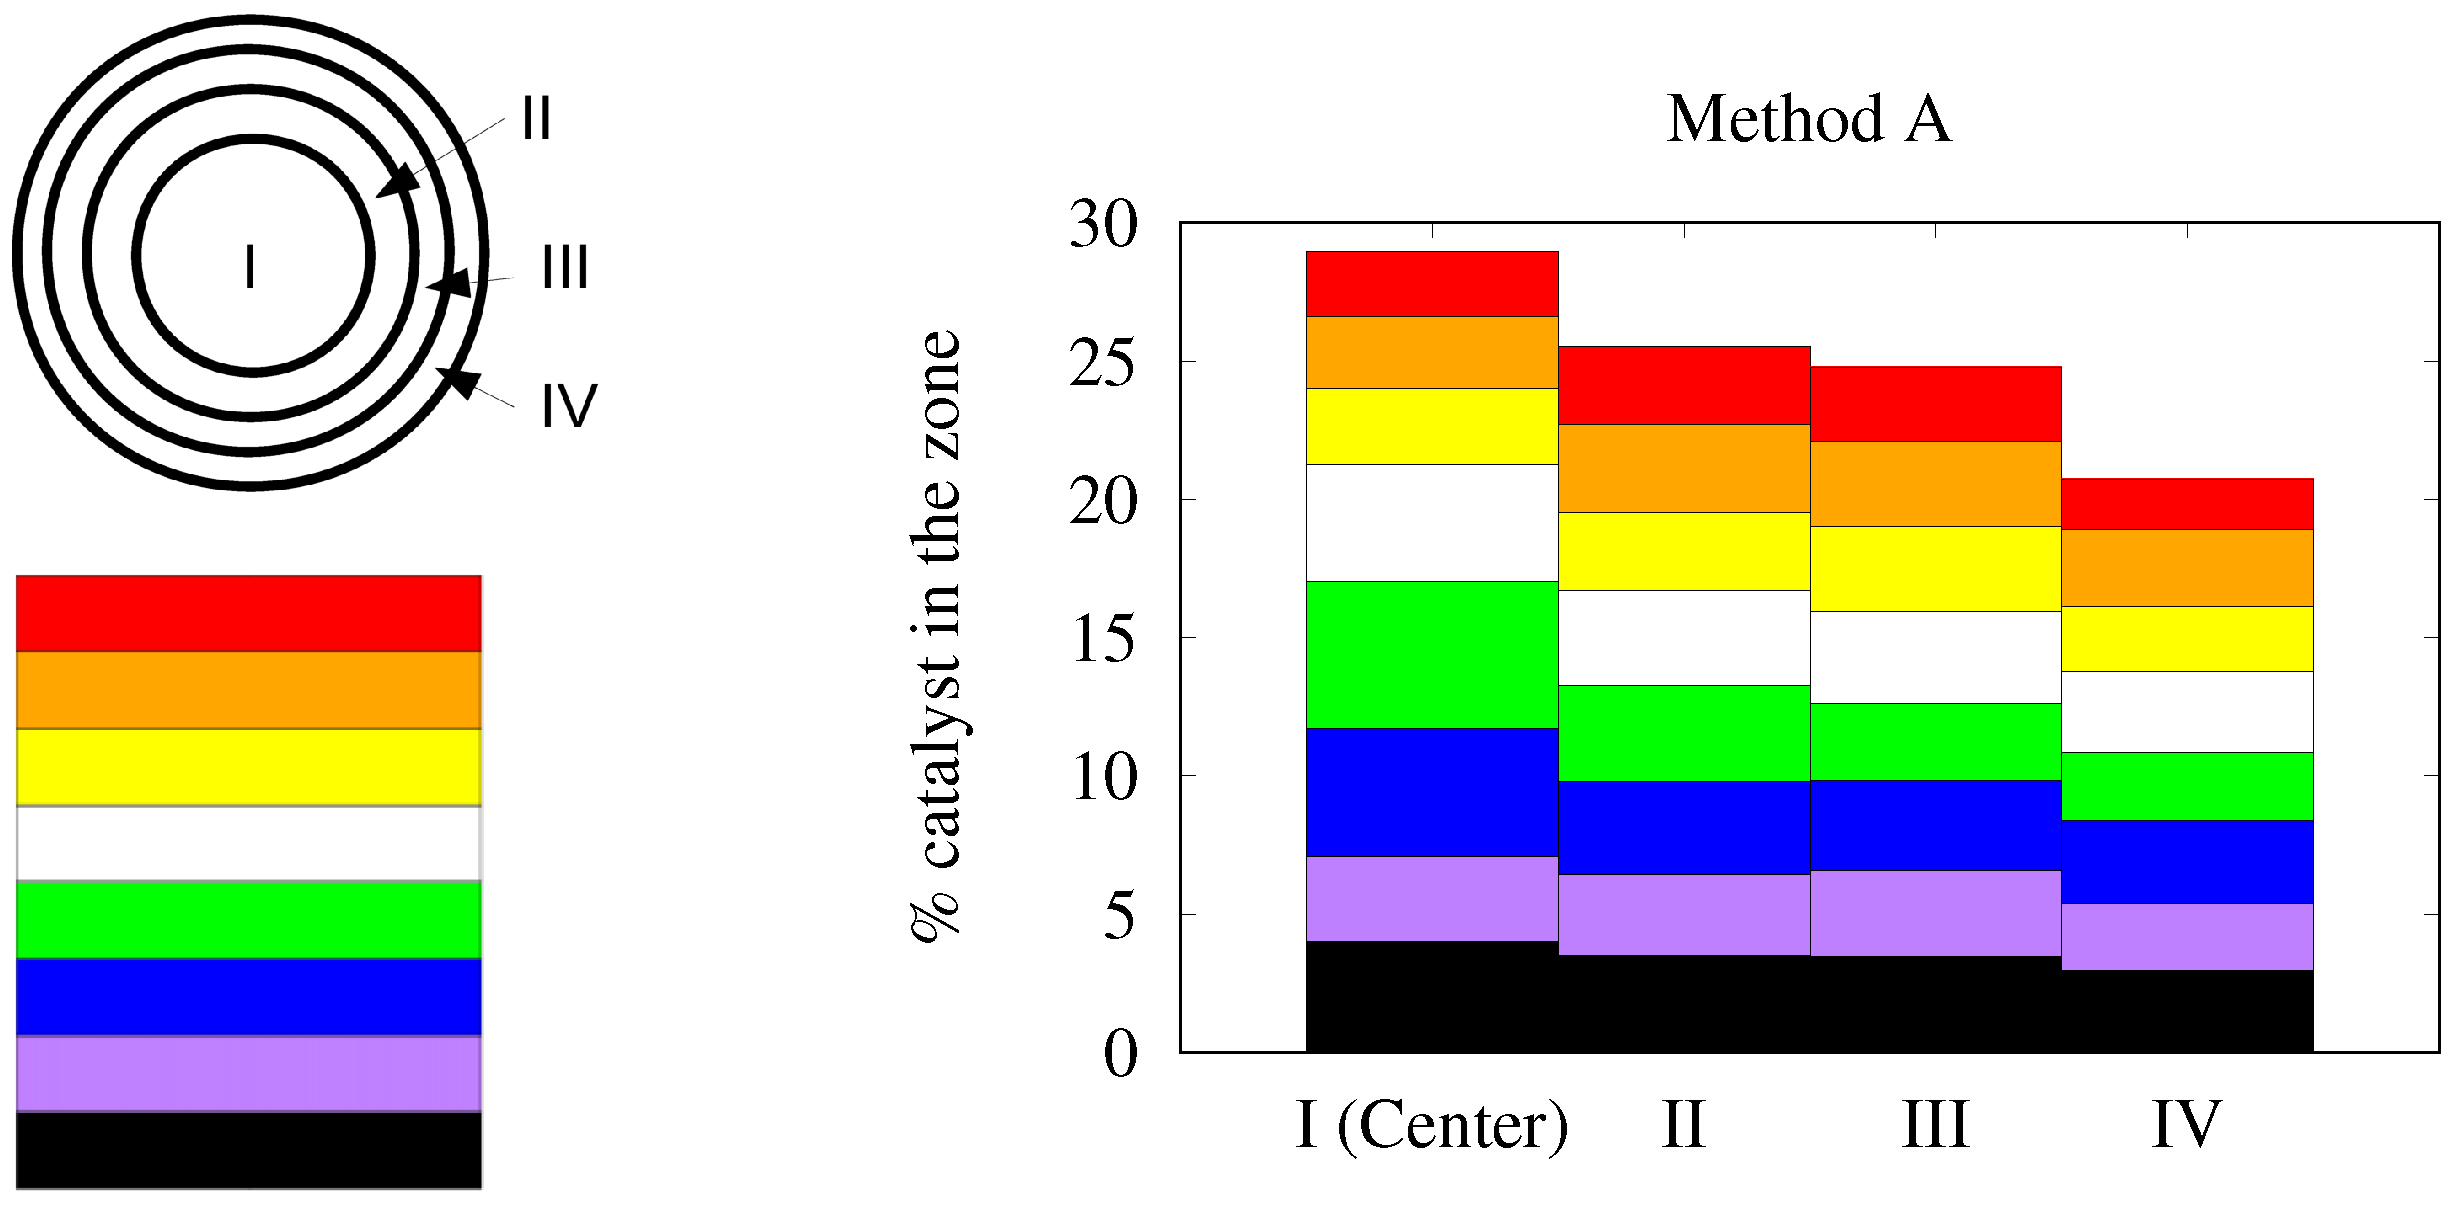
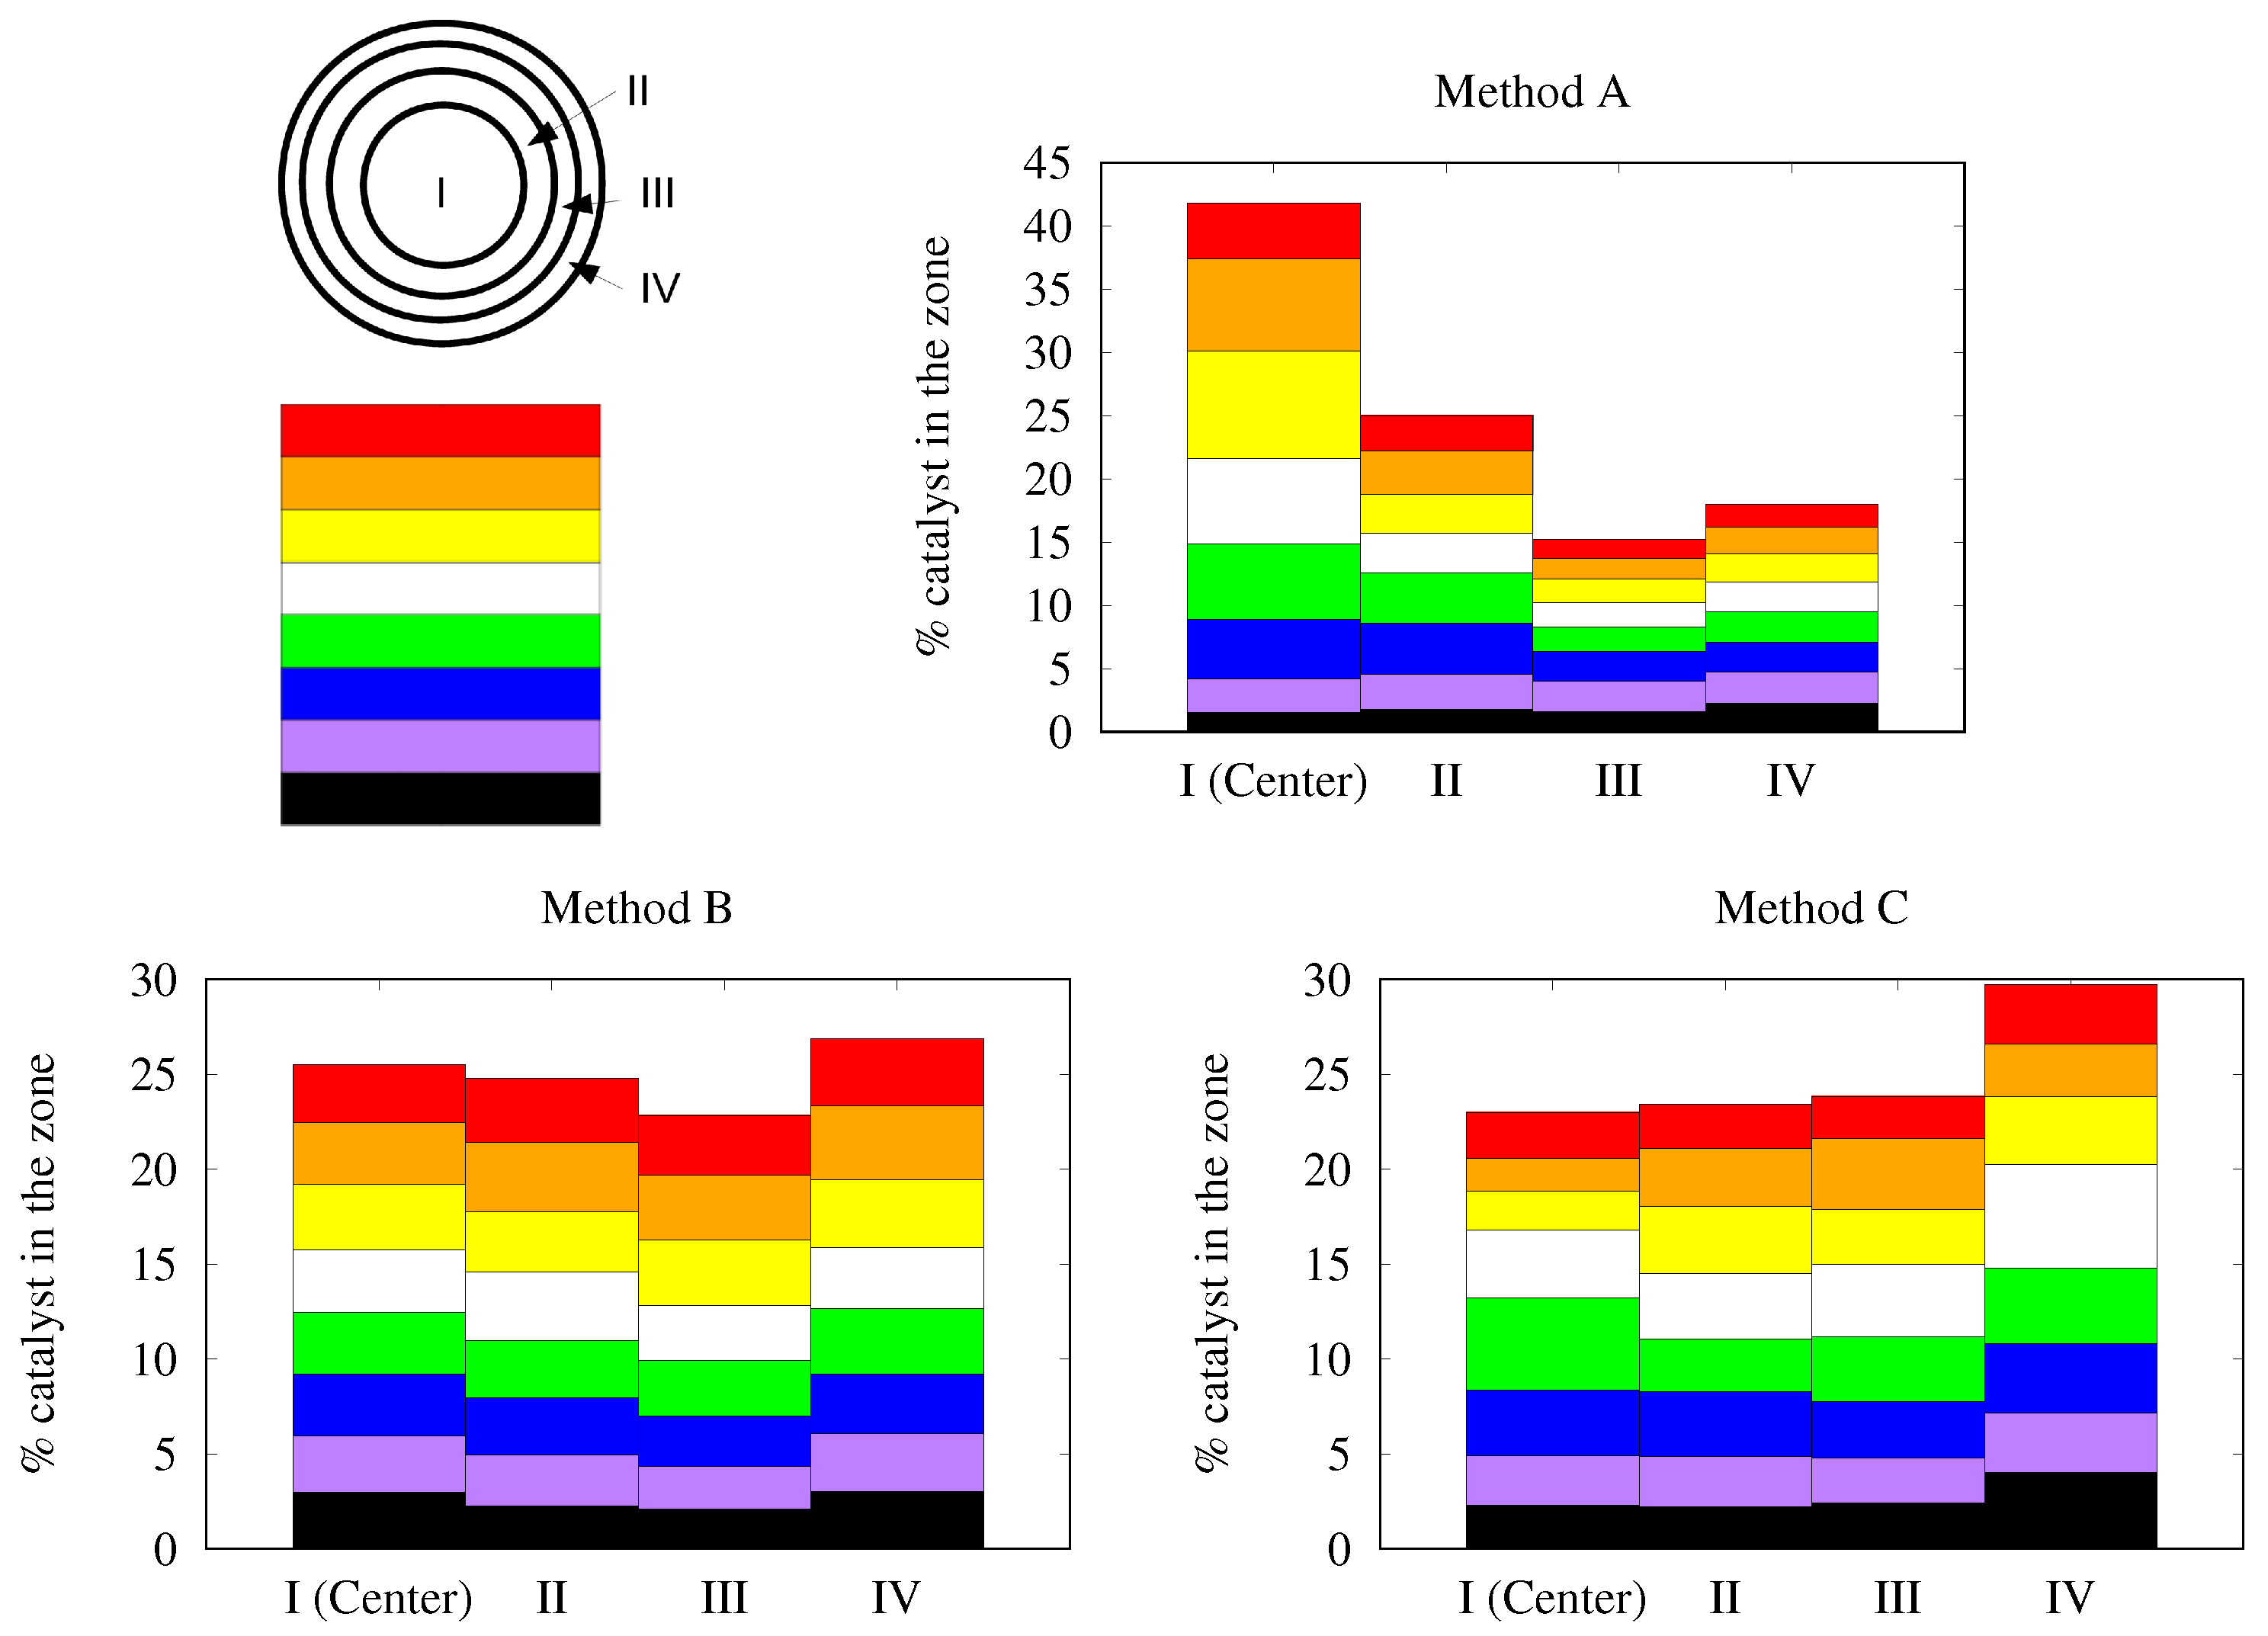
  • blowing air manually in every direction (axially and radially) with a flow-rate of 30 to 45 L/min with the object at 6–8 cm from the air gun (diameter of the air gun = 3 mm). It has to be mentioned that this method is not reproducible at all and is totally dependent of the experimenter, despite it being the most widely used method (Method A).
  • immobilizing the foam in a tube and blowing with air axially, with a flow-rate of 30 to 45 L/min in a cylinder of 2 cm diameter, the object being at 10 cm from the air gun (Method B).
  • spin-drying/centrifuging at 400 to 800 rpm (Method C).
Note that, for Method B applied to a non cylindrical foam sample, it was covered by polyurethane to avoid free space between the foam sample and the tube.
After the coating step, the foams were dried at 120 C under air flow during 4 h. They were further treated at 500 C under air flow during 4 h.

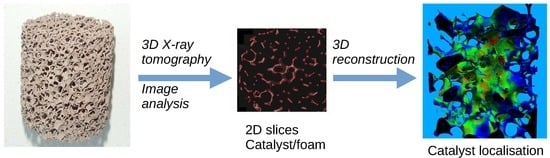
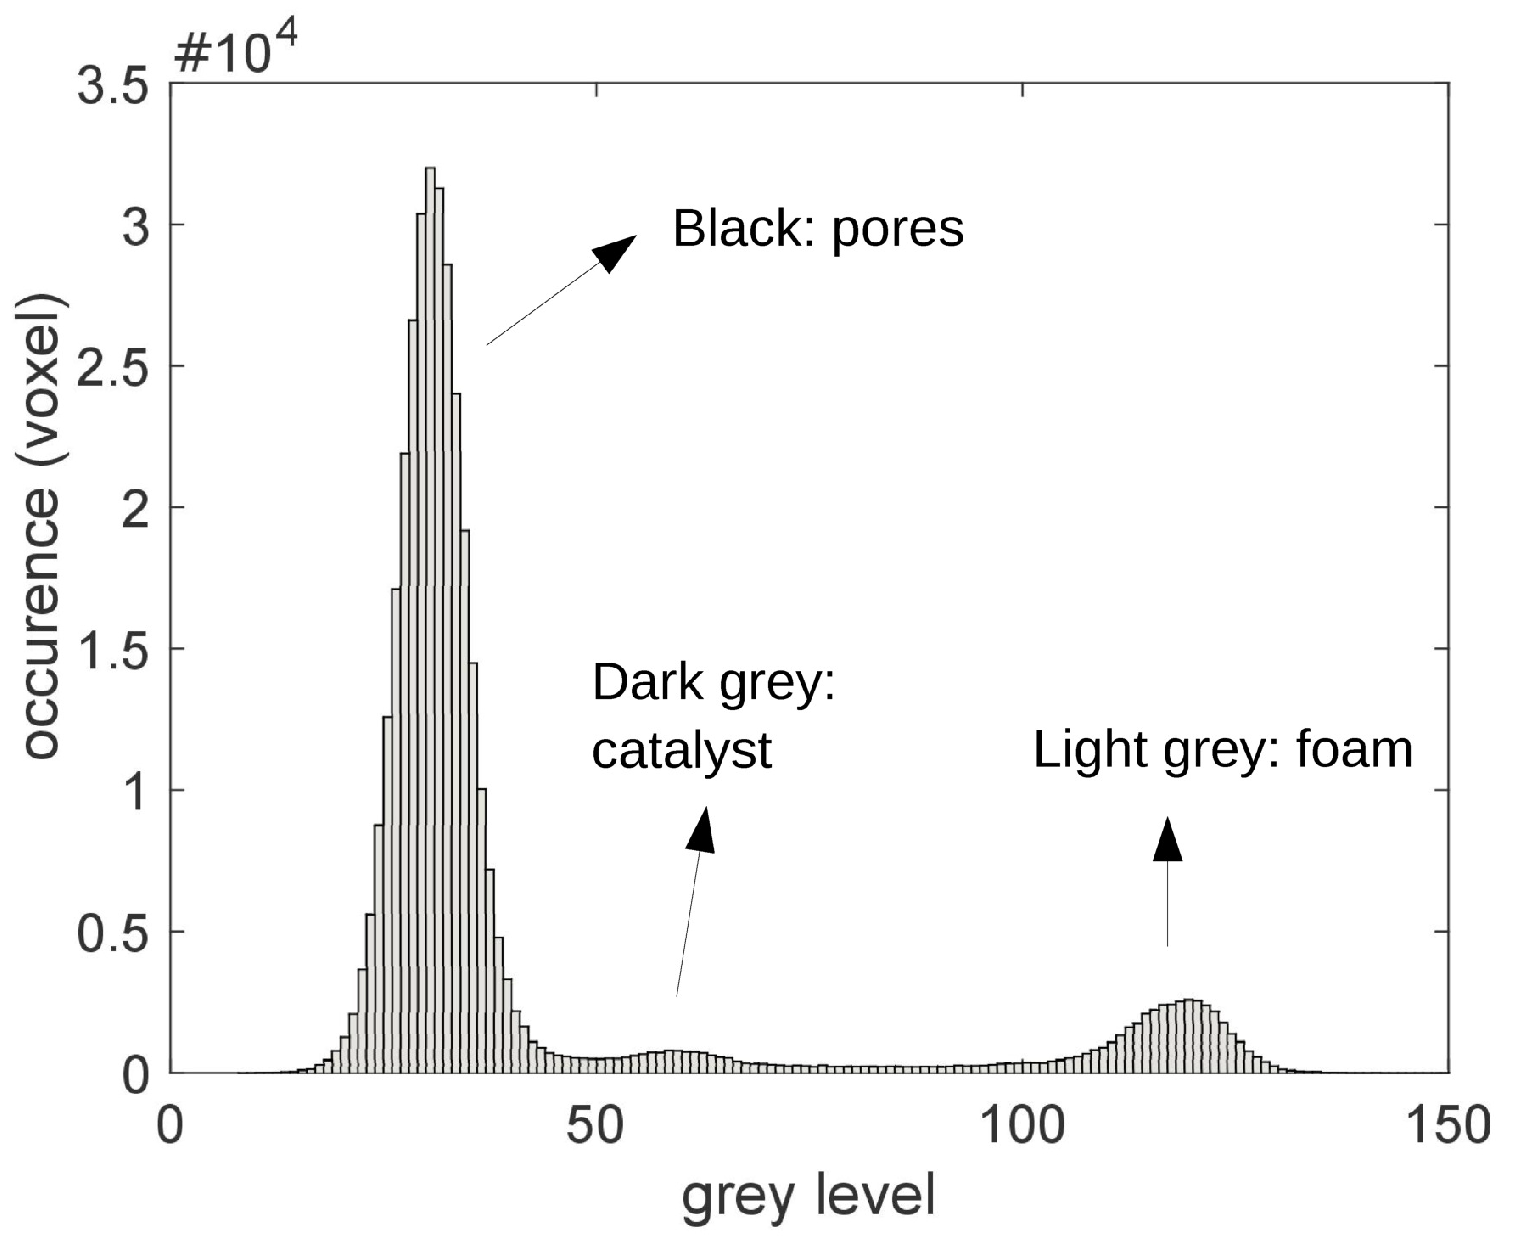
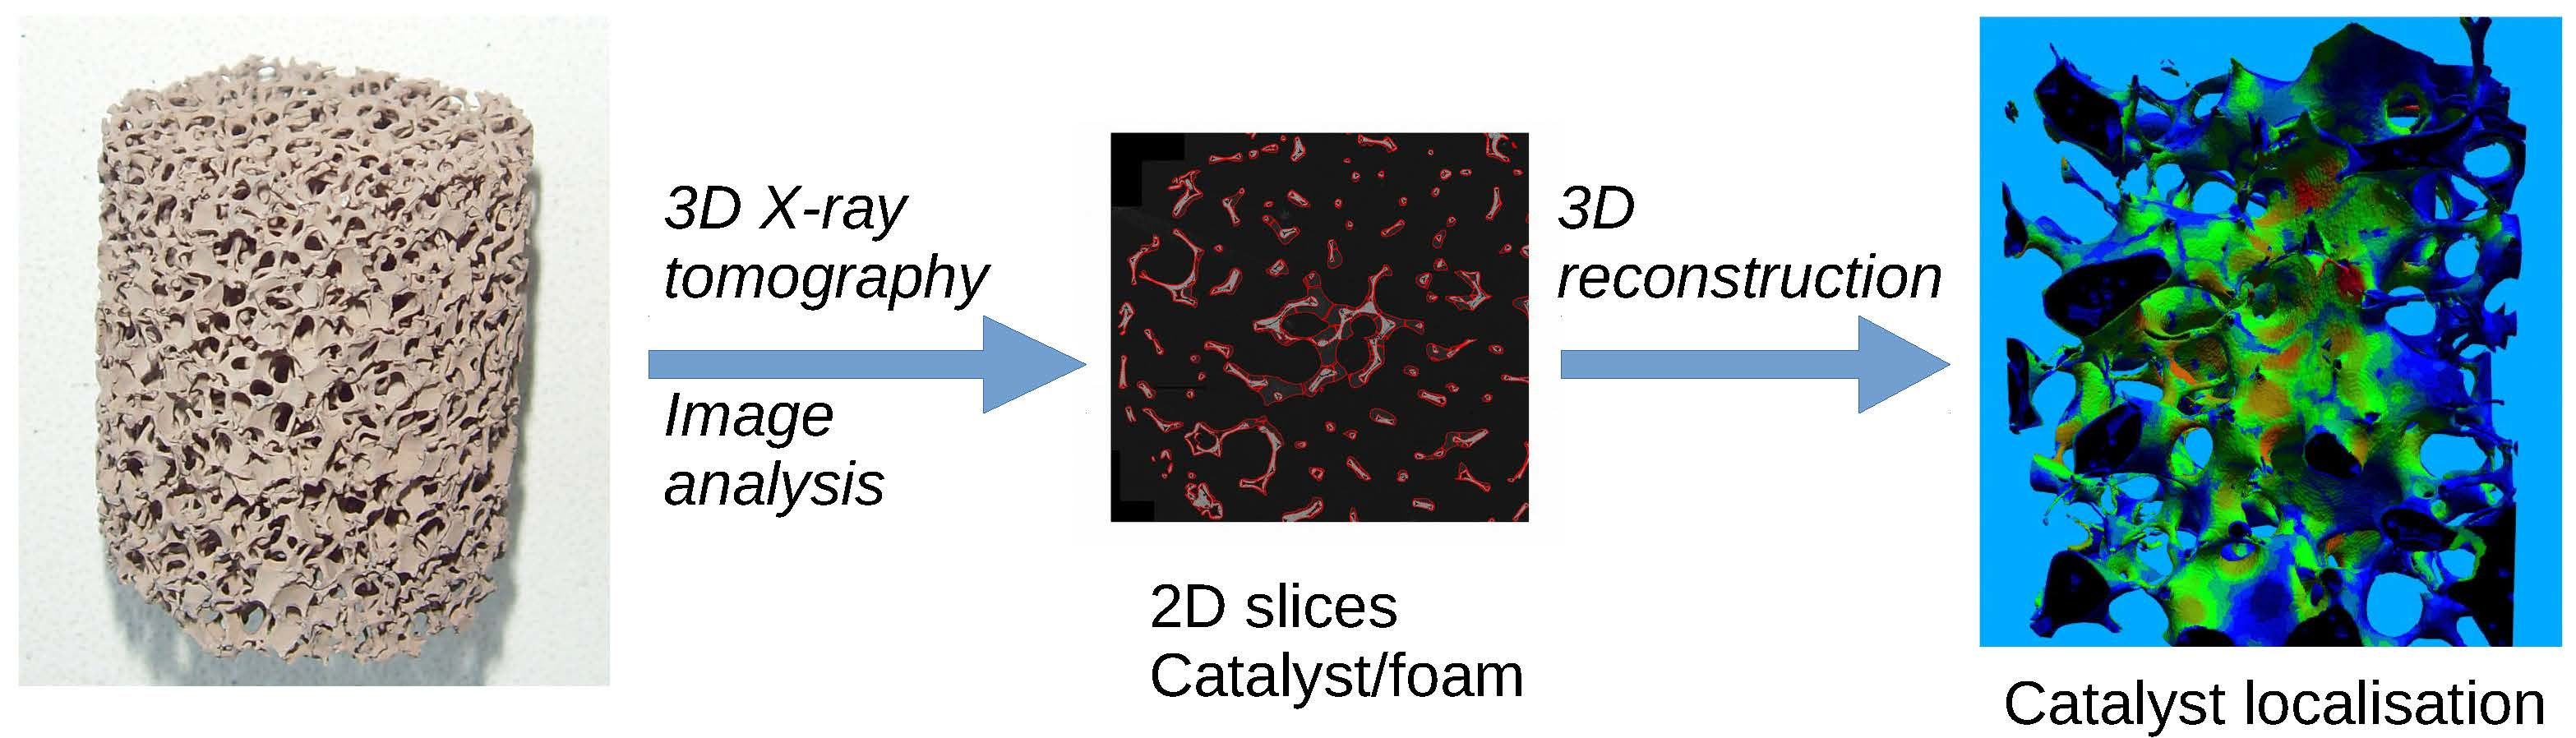
2.3. Characterization of the Catalyst Layer Distribution

The samples have been characterized by X-ray tomography followed by image analysis and 3D reconstruction. X-ray tomography was performed in the MATEIS laboratory at INSA-Lyon, on v|tome|x s apparatus manufactured by Phoenix X-ray, a GE company (Wunstorf, Germany). After 3D volume reconstruction, we obtain a 3D volume of 1300 × 1300 × 1300 voxels with a voxel size of 12 μ m.
Image processing analysis was performed using Matlab (version R2017b). The first step is to threshold images. In the example presented in Figure 2, three grey level zones can be differentiated. As the catalyst fills only a few pixels, it is difficult to perform the thresholding automatically. Thus, the two threshold levels used to separate the three zones are selected manually by visualisation checking.
After that, the numbers of pixels of each phase (pores in black, foam in light grey, catalyst layer in dark grey) are counted, and the catalyst distribution into the sample can be estimated. The layer thickness can not be obtained from one unique slice due to the 3D geometry of the foam. The thickness must be measured perpendicularly to the foam surface. For each foam pixel close to a catalyst layer pixel, the number of catalyst pixels in the perpendicular direction is estimated by successive erosion in 3D. Thus, for each foam pixel at the surface, we obtained information of the thickness of the catalyst layer. For the SiC foam, a supplementary image treatment is necessary to fill the porosity of the foam struts. This is done by 3D closing operation with a well chosen structured element. The objective was to estimate the uniformity of the layer thickness by analysing the catalyst repartition throughout the foam samples.

3. Results and Discussion

3.1. Properties of the Bare Foam

Using image analysis, open porosities and specific surface areas available to the fluid have first been determined (Table 1). In the case of FeCrAl foam, the supplier indicated 93% porosity. Image analysis gives a lower value because the strut internal porosity (not accessible to the fluid) was removed from the calculations.

3.2. Preliminary Experiments—Alumina Layer on Aluminum Parallelepipedic Foam

After dip-coating, drying and calcination, aluminum foam coated with an alumina layer are obtained. One picture is presented in Figure 3.
In that case, the contrast between both phases (aluminum and alumina) is appropriate for image analysis (see one image obtained by X-ray tomography in Figure 4).
The aluminum foam was numerically divided into 10 zones of equal volume to get an information on the uniformity of the alumina coating (inner and outer regions each divided into five stacks, see Figure 5). First, the comparison of the coating occurrence in the inner and outer regions, only the Method B shows similar amounts of catalyst. In the case of Method A, most of the catalyst has been concentrated in the centre of the sample, whereas, in the case of Method C, the centrifuge force has evacuated the catalyst from the central region. Concerning the axial repartition of the catalyst, the comparison of the five coloured bars in each region does not allow at this sample scale to distinguish the different axial repartitions of the catalyst.

3.3. Different Couples Catalyst-Foam in Cylindrical Geometry

One objective was to show that the X-ray tomography could help characterizing the coating thickness and uniformity for different catalysts on various foam materials. As it was seen from reduced-size samples (previous paragraph) that blowing in a constraint flow in a tube seemed to lead to a better uniformity of the coating, it was decided to perform the further studies in cylindrical foams that would be more easily inserted in a tube.

3.3.1. Alumina/FeCrAl

In the case of alumina coated on FeCrAl foams, the contrast of the coating was not sufficient to allow its visualisation (see Figure 6). As a reminder, in the case of observation of metallic sample in a lab tomography, the X-ray absorption is mostly due to the photoelectric effect, which is described by: μ ρ Z E 3 , with μ the absorption coefficient of the Beer–Lambert formula, Z the atomic number, ρ the density of the material and E the energy of the X-ray source. A volume of X-ray tomography corresponds to the calculated value of μ at each point (voxel) of the volume (only true in the case of monochromatic X-ray source, but the tendency is mostly OK in polychromatic sources).
In case of Al2O3 (atomic number of Al: 13) and FeCrAl (atomic number of Fe: 26), the ratio of absorption coefficients is too important to allow an absorption contrast in X-ray tomography. The method is not appropriate for that case study.

3.3.2. Alumina/SiC

Another experiment was performed with a SiC foam coated with alumina. In this case, the contrast allows for differentiating the coating layer from the foam structure because the atomic numbers (Si: 14, Al: 13) in both zones are not too far from each other (Figure 7). However, the thresholding is difficult because of the porous structure of SiC material. Following the 3D closing operation explained above, the coating thickness has been obtained in the case of the random air blowing method (Figure 8). Thirty-two zones have been examined: eight in the axial direction per four in the radial direction (Figure 8). The axial zones have been represented by different colours for a better readability, the radial ones by numbers: I in the centre to IV for the external crown. The 32 zones present the same volume. The difference in the histograms thus represents the non-uniformity of the coating. It appears that a more important amount of catalyst is located in the central zone of the cylinder (I) than in the crown. Indeed, in the blowing method, the air flow forces the excess suspension to move from the external region to the internal one.
The thickness range throughout the sample has been determined from image analysis and is presented in Figure 9 in the case of excess suspension removal by centrifugation. The distribution of the thickness is rather wide with a node at 24 μ m and a mean value at 45 μ m. Some very thick zones have been observed with a thickness higher than 200 μ m.

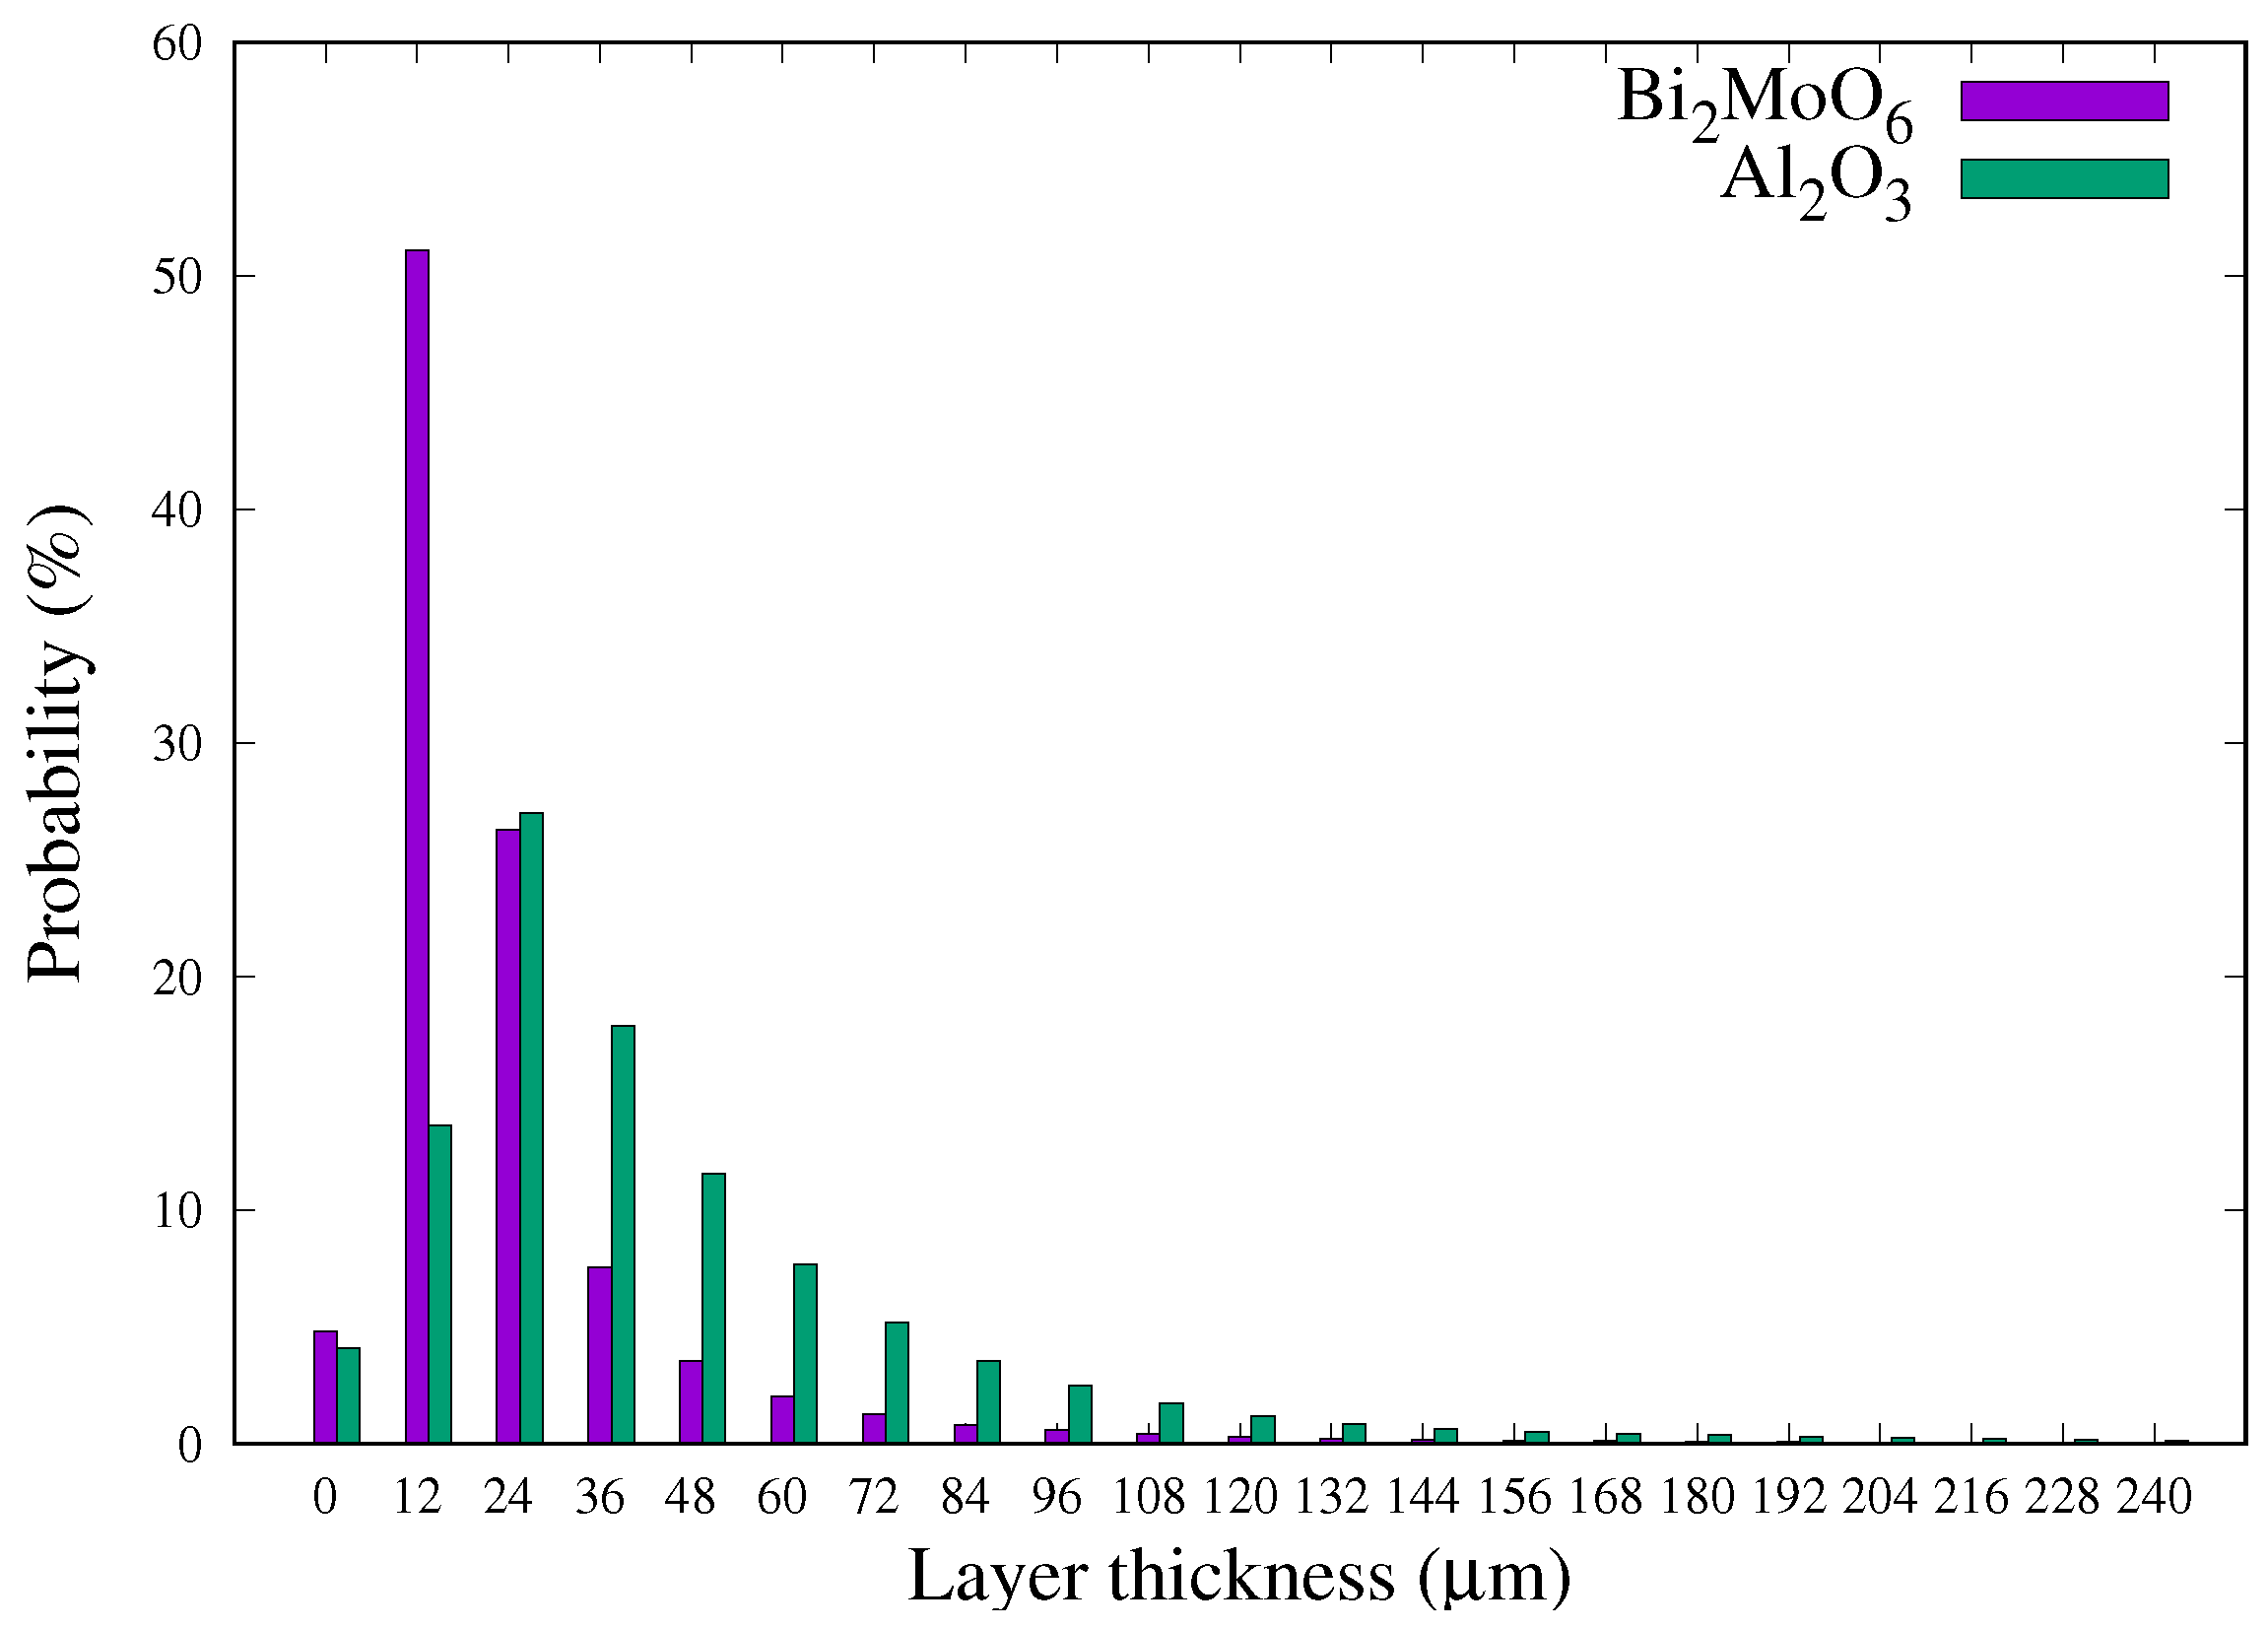
3.3.3. Bi2MoO6/FeCrAl

A Bi2MoO6 catalyst presenting atoms with atomic numbers higher than the FeCrAl substrate (but a lower density) was also studied. In that case, no problem of contrast was observed and an automatized thresholding between both zones was possible (Figure 10).
The percentage of catalyst present in different zones of the cylindrical samples has been determined by image analysis for the three methods aiming at removing the excess of suspension. It should be noted that a simple weighing of the three samples would not have allowed to differentiate the three methods as the same mass of coating was present on the three samples.
The objective was to identify whether one of the methods could easily lead to a uniform film layer. The results obtained after image analysis of the 3D tomography of the cylinders obtained by the three methods are presented in Figure 11. It appears very clearly that a similar amount of catalyst (25% of the coating) is present on each radial zone (I to IV) only for Method B. In that case, the amount on each axial zone (coloured bars) is also very uniform. Conversely, Methods A and C lead to a thickness gradient. The thickness increases from the centre to the border in the case of centrifugation (Method C) where the amount of catalyst is 28% on the crown (IV) and only 22% on the core cylinder (I). On the contrary, more than 40% of the catalyst is located in the central zone (I) in the case of Method A, as previously seen with Al2O3/SiC.
To explain the uniform distribution of the catalyst obtained with Method B, a tentative explanation was based on the value of the Reynolds number in the foam. Using the pore window diameter as the characteristic size, Re of 80 to 110 were obtained, but these values are too far from a turbulent regime (see [26] for the Re range in foams). The uniform distribution is thus most probably due to a better control in the air distribution.
The thickness range throughout the sample has also been determined in the case of centrifugation (see Figure 9). Contrary to Al2O3/SiC, it shows a weak distribution of the thickness with a node at 12 μ m and a mean value at 25 μ m. This is due to a lower viscosity of the BiMoO6 suspension.

3.3.4. Perspective Use of Contrast Agent

It was shown previously that, in some cases, the contrast between the coating and the substrate was too high and the coating can not be distinguished from the porosity. We observed that, even though alumina can not be seen on FeCrAl foams, Pd/alumina becomes a little more visible (the picture is however still not contrasted enough to be presented). We thus thought that impregnating the coating with a contrasting agent could be an option for the characterization of the thickness distribution, as a control sample. A first experiment was performed by using sodium polytungstate. It increased the brightness of the coating layer. An on-going study aims at showing whether the use of this additive modifies the rheological properties of the suspension, and thus the thickness of the layer or not. If not, it could be used to characterize the layer of a witness sample.

4. Conclusions

X-ray microtomography has been applied to characterize the thickness of catalyst-coatings on various foams. Different methods aiming at evacuating the excess of suspension used for the dip-coating process were evaluated as an illustration of what can be obtained. A simple blowing with air in all the directions appears as the worst solution, leading to a thick layer of catalyst in the core of the object and a very thin layer on the external parts of the object. Centrifugation has a tendency to produce the opposite effect, with more catalyst on the outer part than in the centre. However, all these tendencies may depend on the rheological properties of the suspension and a further study of the role of this parameter should be performed. Finally, evacuating the excess of suspension in coated cylinders can be uniformly performed with an axial forced air flow. This method is appropriate for cylinders limited to 2 cm long, which is generally the case for all the materials commercially available.

Author Contributions

A.D. and S.P. performed the coating experiments, J.L. acquired the X-ray tomography images, M.-L.Z. performed the image analysis, V.M., S.P. and M.-L.Z. analysed the data, V.M. and M.-L.Z. wrote the paper.

Funding

This research received the funding of Institut de Chimie de Lyon (COSA project).

Acknowledgments

Institut de Chimie de Lyon is gratefully thanked. CNRS, CPE Lyon and UCBL are acknowledged for their financial support.

Conflicts of Interest

The authors declare no conflict of interest.

References

  1. Sanchez, M.J.F.; Gonzalez Bello, O.J.; Montes, M.; Tonetto, G.M.; Damiani, D.E. Pd/Al2O3-cordierite and Pd/Al2O3-Fecralloy monolithic catalysts for the hydrogenation of sunflower oil. Catal. Commun. 2009, 10, 1446–1449. [Google Scholar] [CrossRef]
  2. Govender, S.; Friedrich, H.B. Monoliths: A Review of the Basics, Preparation Methods and Their Relevance to Oxidation. Catalysts 2017, 7, 62. [Google Scholar] [CrossRef]
  3. Fishwick, R.P.; Natividad, R.; Kulkarni, R.; McGuire, P.A.; Wood, J.; Winterbottom, J.M.; Stitt, E.H. Selective hydrogenation reactions: A comparative study of monolith CDC, stirred tank and trickle bed reactors. Catal. Today 2007, 128, 108–114. [Google Scholar] [CrossRef]
  4. Tourvieille, J.N.; Philippe, R.; de Bellefon, C. Milli-channel with metal foams under an applied gas–liquid periodic flow: External mass transfer performance and pressure drop. Chem. Eng. J. 2015, 267, 332–346. [Google Scholar] [CrossRef]
  5. Li, Y.; Zhang, Q.; Chai, R.; Zhao, G.; Cao, F.; Liu, Y.; Lu, Y. Metal-foam-structured Ni–Al2O3 catalysts: Wet chemical etching preparation and syngas methanation performance. Appl. Catal. A Gen. 2016, 510, 216–226. [Google Scholar] [CrossRef]
  6. Truong-Phuoc, L.; Truong-Huu, T.; Nguyen-Dinh, L.; Baaziz, W.; Romero, T.; Edouard, D.; Begin, D.; Janowska, I.; Pham-Huu, C. Silicon carbide foam decorated with carbon nanofibers as catalytic stirrer in liquid-phase hydrogenation reactions. Appl. Catal. A Gen. 2014, 469, 81–88. [Google Scholar] [CrossRef]
  7. Tschentscher, R.; Nijhuis, T.A.; van der Schaaf, J.; Schouten, J.C. Glucose Oxidation in Slurry Reactors and Rotating Foam Reactors. Ind. Eng. Chem. Res. 2012, 51, 1620–1634. [Google Scholar] [CrossRef]
  8. Benamara, N.; Assoua, D.; Jaffeux, L.; Vanoye, L.; Simescu-Lazar, F.; Zanota, M.L.; Bornette, F.; Meille, V.; Pitault, I. A New Concept of Stirred Multiphase Reactor Using a Stationary Catalytic Foam. Processes 2018, 6, 117. [Google Scholar] [CrossRef]
  9. Leon, M.A.; Tschentscher, R.; Nijhuis, T.A.; van der Schaaf, J.; Schouten, J.C. Rotating Foam Stirrer Reactor: Effect of Catalyst Coating Characteristics on Reactor Performance. Ind. Eng. Chem. Res. 2011, 50, 3184–3193. [Google Scholar] [CrossRef]
  10. Giani, L.; Cristiani, C.; Groppi, G.; Tronconi, E. Washcoating method for Pd/gamma-Al2O3 deposition on metallic foams. Appl. Catal. B 2006, 62, 121–131. [Google Scholar] [CrossRef]
  11. Montebelli, A.; Visconti, C.G.; Groppi, G.; Tronconi, E.; Kohler, S.; Venvik, H.J.; Myrstad, R. Washcoating and chemical testing of a commercial Cu/ZnO/Al2O3 catalyst for the methanol synthesis over copper open-cell foams. Appl. Catal. A Gen. 2014, 481, 96–103. [Google Scholar] [CrossRef]
  12. Simescu-Lazar, F.; Chaieb, T.; Pallier, S.; Veyre, L.; Philippe, R.; Meille, V. Direct coating of carbon-supported catalysts on monoliths and foams—Singular behaviour of Pd/MWCNT. Appl. Catal. A Gen. 2015, 508, 45–51. [Google Scholar] [CrossRef]
  13. Bianchi, E.; Heidig, T.; Visconti, C.G.; Groppi, G.; Freund, H.; Tronconi, E. An appraisal of the heat transfer properties of metallic open-cell foams for strongly exo-/endo-thermic catalytic processes in tubular reactors. Chem. Eng. J. 2012, 198–199, 512–528. [Google Scholar] [CrossRef]
  14. Bianchi, E.; Heidig, T.; Visconti, C.G.; Groppi, G.; Freund, H.; Tronconi, E. Heat transfer properties of metal foam supports for structured catalysts: Wall heat transfer coefficient. Catal. Today 2013, 216, 121–134. [Google Scholar] [CrossRef]
  15. Klumpp, M.; Inayat, A.; Schwerdtfeger, J.; Körner, C.; Singer, R.F.; Freund, H.; Schwieger, W. Periodic open cellular structures with ideal cubic cell geometry: Effect of porosity and cell orientation on pressure drop behavior. Chem. Eng. J. 2014, 242, 364–378. [Google Scholar] [CrossRef]
  16. Adam, M.; Kocanis, S.; Fey, T.; Wilhelm, M.; Grathwohl, G. Hierarchically Ordered Foams Derived from Polysiloxanes with Catalytically Active Coatings. J. Eur. Ceram. Soc. 2014, 34, 1715–1725. [Google Scholar] [CrossRef]
  17. Leveque, J.; Philippe, R.; Zanota, M.L.; Meille, V.; Sarrazin, F.; Baussaron, L.; de Bellefon, C. Hydrodynamics and mass transfer in a tubular reactor containing foam packings for intensification of G-L-S catalytic reactions in co-current up-flow configuration. Chem. Eng. Res. Des. 2016, 109, 686–697. [Google Scholar] [CrossRef]
  18. Zalucky, J.; Claußnitzer, T.; Schubert, M.; Lange, R.; Hampel, U. Pulse flow in solid foam packed reactors: Analysis of morphology and key characteristics. Chem. Eng. J. 2017, 307, 339–352. [Google Scholar] [CrossRef]
  19. Novak, V.; Koci, P.; Gregor, T.; Choi, J.; Stepanek, F.; Marek, M. Effect of cavities and cracks on diffusivity in coated catalyst layer. Catal. Today 2013, 216, 142–149. [Google Scholar] [CrossRef]
  20. Lali, F.; Böttcher, G.; Schöneich, P.; Haase, S.; Hempel, S.; Lange, R. Preparation and characterization of Pd/Al2O3 catalysts on aluminum foam supports for multiphase hydrogenation reactions in rotating foam reactors. Chem. Eng. Res. Des. 2015, 94, 365–374. [Google Scholar] [CrossRef]
  21. Lali, F.; Gärtner, S.; Haase, S.; Lange, R. Preparation Method for Ruthenium Catalysts Supported by Carbon-Coated Aluminum Foams. Chem. Eng. Technol. 2015, 38, 1353–1361. [Google Scholar] [CrossRef]
  22. Ou, X.; Xu, S.; Warnett, J.M.; Holmes, S.M.; Zaheer, A.; Garforth, A.A.; Williams, M.A.; Jiao, Y.; Fan, X. Creating Hierarchies Promptly: Microwave-Accelerated Synthesis of ZSM-5 Zeolites on Macrocellular Silicon Carbide (SiC) Foams. Chem. Eng. J. 2017, 312, 1–9. [Google Scholar] [CrossRef]
  23. Eslamian, M. Inorganic and Organic Solution-Processed Thin Film Devices. Nano-Micro Lett. 2016, 9, 3. [Google Scholar] [CrossRef]
  24. Meille, V.; Pallier, S.; Santa Cruz Bustamante, G.V.; Roumanie, M.; Reymond, J. Deposition of γ-Al2O3 layers on structured supports for the design of new catalytic reactors. Appl. Catal. A 2005, 286, 232–238. [Google Scholar] [CrossRef]
  25. Meille, V.; Pallier, S.; Rodriguez, P. Reproducibility in the preparation of alumina slurries for washcoat application—Role of temperature and particle size distribution. Colloids Surf. A 2009, 336, 104–109. [Google Scholar] [CrossRef]
  26. Della Torre, A.; Montenegro, G.; Tabor, G.R.; Wears, M.L. CFD Characterization of Flow Regimes inside Open Cell Foam Substrates. Int. J. Heat Fluid Flow 2014, 50, 72–82. [Google Scholar] [CrossRef]
Figure 1. Methods to evacuate the excess of suspension.
Chemengineering 02 00052 g001
Figure 2. Example of grey levels found in coated foams (here Al2O3 on an aluminum foam).
Chemengineering 02 00052 g002
Figure 3. Macro photographs of an aluminum foam. (Left): pristine foam; (Right): foam coated with an alumina layer.
Chemengineering 02 00052 g003
Figure 4. X-ray picture of Alumina layer on aluminum foam-Black: void, dark grey: catalyst, light grey: foam.
Chemengineering 02 00052 g004
Figure 5. Zones of thickness measurement and distribution of the Al2O3 layer thickness for the 3 methods in the parallelepipedic Al sample.
Chemengineering 02 00052 g005
Figure 6. X-ray picture of alumina layer on FeCrAl foam.
Chemengineering 02 00052 g006
Figure 7. X-ray picture of alumina layer on SiC foam.
Chemengineering 02 00052 g007
Figure 8. Zones of thickness measurement and distribution of the Al2O3 layer thickness on SiC foam cylinder for the air blowing method.
Chemengineering 02 00052 g008
Figure 9. Range of thickness values in the cases of Al2O3/SiC foam and Bi2MoO6/FeCrAl.
Chemengineering 02 00052 g009
Figure 10. X-ray picture of Bi2MoO6 on FeCrAl foam.
Chemengineering 02 00052 g010
Figure 11. Zones of thickness measurement and distribution of the Bi2MoO6 layer thickness on FeCrAl foam cylinder for the three methods.
Chemengineering 02 00052 g011
Table 1. Characteristics of the different open cell foams, determined by image analysis of X-ray tomography. * PPI is for “pores per inch”.
MaterialVoid Fraction %Specific Surface Area m 2 /m 3 Cell Size μ m
Al−40PPI *9015001400
FeCrAl−40PPI9114601350
SiC−50PPI8922701100

