Article

Composition of Probabilistic Preferences in Multicriteria Problems with Variables Measured in Likert Scales and Fitted by Empirical Distributions

by
Luiz Octávio Gavião
1,
Annibal Parracho Sant’Anna
2,*,
Gilson Brito Alves Lima
2 and
Pauli Adriano de Almada Garcia
3
1
Science & Technology Division, Brazilian War College, Rio de Janeiro 22291-090, Brazil
2
Industrial Engineering Department, Fluminense Federal University, Niterói 24220-240, Brazil
3
Administration Department, Fluminense Federal University, Volta Redonda 27213-145, Brazil
*
Author to whom correspondence should be addressed.
Standards 2023, 3(3), 268-282; https://doi.org/10.3390/standards3030020
Submission received: 21 May 2023 / Revised: 30 June 2023 / Accepted: 7 July 2023 / Published: 17 July 2023

Abstract

:
The aim of this article is to demonstrate the advantages of the Composition of Probabilistic Preferences method in multicriteria problems with data from Likert scales. Multicriteria decision aids require a database as a decision matrix, in which two or more alternatives are evaluated according to two or more variables selected as decision criteria. Several problems of this nature use measures by Likert scales. Depending on the method, parameters from these data (e.g., means, modes or medians) are required for calculations. This parameterization of data in ordinal scales has fueled controversy for decades between authors who favor mathematical/statistical rigor and argue against the procedure, stating that ordinal scales should not be parameterized, and scientists from other areas who have shown gains from the process that compensates for this relaxation. The Composition of Probabilistic Preferences can allay the protests raised and obtain more accurate results than descriptive statistics or parametric models can bring. The proposed algorithm in R-code involves the use of probabilities with empirical distributions and fitting histograms of data measured by Likert scales. Two case studies with simulated datasets having peculiar characteristics and a real case illustrate the advantages of the Composition of Probabilistic Preferences.

1. Introduction

In this article, we propose the use of the Composition of Probabilistic Preferences (CPP) in multicriteria aid problems that measures their variables on Likert scales. In general, Likert scale responses are summarized as means, used as input in some decision support models. Adapting the spectrum of Likert scale responses to a probability distribution, thereby averting the controversies surrounding the use of descriptive statistics derived from Likert scales, is the innovation of the current study. This Likert scale approach in multicriteria decision aid methods has not been found in the literature so far. The contribution of the research lies in the ability of CPP to mitigate the controversies about the use of Likert scales for decision aid problems and to obtain more accurate results than descriptive statistics or parametric models can bring.
The authors’ motivation was to demonstrate how CPP is tailored to solve these controversies, based on its own features. CPP is the most suitable method for this approach, as only CPP uses probability distributions as inputs in its algorithm [1,2]. A description of Likert scales, the controversies in the literature, and the advantages of approaching the problem with CPP are presented below.
Likert scaling was introduced by Rensis Likert in 1932 [3] and is the most widely used psychometric scale in survey research, where respondents indicate their levels of agreement with a statement and label them on a scale [4,5]. For example, a five-point Likert scale could be labeled as “1” (totally disagree), “2” (disagree), “3” (neutral), “4” (agree), and “5” (strongly agree). Depending on what is being measured, the scale labels may be worded differently. Likert also considered the questionnaire responses through normal distributions, resorting to the use of means and standard deviation, for example, to draw conclusions [3].
In multicriteria decision aid problems, it is necessary to compose a decision matrix, in which two or more alternatives are evaluated according to two or more variables selected as decision criteria [1]. To solve the problem, those variables must be measured on some scale so that a calculation algorithm can generate results and reach the objective of the research. Several studies on multicriteria decision aid problems use variables measured by Likert scales [6,7,8,9].
From a statistical point of view, a Likert scale is considered an ordinal scale, as described in Table 1 [10]. Therefore, the use of parametric models (like the normal distribution, which depends on the mean and standard deviation of the data) with variables measured on ordinal scales is an error [11,12,13,14]. This common practice in scientific studies was even described as the first mathematical “sin” on a list of seven [15]. A brief discussion about the controversies of this use of Likert scales is presented here.
The research was guided by three questions: (1) How do the main controversies about the use of Likert scales to support decisions evolve? (2) Which methodological changes in CPP can enhance the use of data based on Likert scales? (3) What are the practical advantages of using empirical distributions in CPP?

2. Main Statistical Controversies

In general, the main criticism is the lack of mathematical/statistical rigor in relation to the measurement of variables on an ordinal scale. In this case, it is inappropriate to calculate averages, standard deviations, and other measures of central tendency to draw conclusions that have little or no meaning in the real world. For example, if a certain surgical procedure is rated on a four-point psychometric scale (e.g., poor, fair, good, or excellent), it would not make sense to average the responses to the procedure, yielding a “fair and medium” result [15].
However, there are several authors who defend the use of descriptive statistics and parametric models in structured problems with Likert scales. Some argue that the use of scales with more than five points can better approximate the results to a normal distribution [16,17], or favor parametric models over nonparametric ones [18]. Other authors have mentioned the amount of research that “violates” the principles of statistics and obtained satisfactory results [19], the constraints on the use of parametric models with Likert scales [20], or the context in which such restrictions were proposed for the use of these scales [21], criticizing the relaxation of mathematical rigor to the detriment of practical benefits.
The parameterization of data measured on ordinal scales has fueled controversy for decades between authors who favor mathematical/statistical rigor and argue against the procedure, considering that ordinal scales should not be parameterized, and academics from other areas who have reported gains in their studies that compensate for the relaxation of this rigor. We selected some studies defending the use of more flexible measures of central tendency in data generated by Likert scales and others against the relaxation of mathematical/statistical rigor in these problems to provide a better understanding of the arguments.
One of the most interesting papers on this controversy is from Thomas [21]. The author describes these discussions in the early 1900s, when physics was the model science and measurement followed mathematical principles to draw empirical conclusions about psychological data. Thomas [21] argued that psychology should treat measurement as the recording of empirical facts, which may not meet the mathematical properties of real numbers. There was then some error of interpretation, adaptation, or an excess of rigor in the use of the four measurement scales (nominal, ordinal, interval, and ratio), proposed by Stevens [10], according to Table 1.
Thomas [21] pointed out that the article of Stevens [10] helped create a bridge to the use of mathematics to draw empirical conclusions about data without the properties of real numbers. However, this study was a product of its time and urged limitations on the mathematical operations for each scale, without explicitly anchoring those limitations in mathematics. Thomas [21] continued this criticism, noting that Stevens’s scales are flawed and encouraging the production of academic works that do not conform to the epistemology of science or the logic of mathematics. Other authors have focused their research on finding solutions that allow the use of parameters based on Likert scales. Wu and Leung [16] tried to adapt ordinal scales as interval scales, increasing the number of points on the scale, preferably to eleven, to facilitate the adjustment of data to normal and other parametric distributions. Along the same lines, Awang et al. [17] explored a parametric model of structural equations to suggest the use of ten-point Likert scales instead of the traditional five-point scales, to obtain more consistent results. Harpe [20] reviewed the literature, and based on empirical evidence, concluded that parametric analytical approaches are acceptable as long as certain criteria are met. The author also explored histogram densities, similar to the proposal of this article, but with adjustments to normal distributions instead of nonparametric ones. Mircioiu and Atkinson [22] analyzed ordinal data on Likert scales with high response rates, demonstrating that analysis using nonparametric methods causes a loss of information. The addition of parametric methods, graphical analysis, subset analysis, and data transformation lead to deeper analysis and better conclusions.
The authors who defend greater mathematical/statistical rigor condemn the use of models and parametric measures with data collected from Likert scales, regardless of the number of points on the scale. Pornel and Saldaña [23] discussed the characteristics and proper use of a Likert scale, examining 53 theses and dissertations in the Philippines. They identified four common misuses of the Likert scale, namely: an unjustified length of the scale; asymmetrical verbal anchoring; uneven spacing in the verbal anchor; and unjustified interpretation of the mean. Jamieson [24] emphasized the common practice of assuming that the Likert scale is an interval scale, condemning the calculation of parametric measures and exemplifying the means and standard deviations, since these are typical of ordinal scales. Allen and Seaman [25] followed the same line. Sullivan and Artino [26] analyzed research in the medical field and made the use of parametric tests more flexible, although they also criticized the use of means and standard deviations.
As can be seen, the subject is still controversial in the scientific literature [27,28]. Two partial conclusions can be drawn from the studies for and against the full use of statistical tools with data measured on Likert scales: (1) the nonparametric approach avoids difficulties present in parametric procedures; and (2) the ranking of alternatives is consistent with the possible answers of ordinal scales, as defined by Stevens [10].
The use of CPP fulfills these needs, since it is flexible regarding the choice of parametric or nonparametric models and can be used to define the probability of an alternative being better or worse than others, which corresponds to the empirical possibilities described in the ordinal scale of Stevens [10]. We present two cases to illustrate these characteristics numerically in Section 5.
There are basically three advantages in the algorithm proposed here: (1) it is a nonparametric procedure, maintaining adherence to statistics with regard to the treatment of data on ordinal scales, without resorting to parameters to solve the problem (e.g., mean, deviation-default); (2) it dispenses with assigning numerical values to the Likert scale, since the frequency of responses to each item of the scale is sufficient; and (3) it explores an important property of the CPP, which probabilistically models responses to consider the uncertainty intrinsic to human opinion or judgment due to prejudices, doubts, and biases, among other aspects that indicate a nondeterministic approach to the problem. The main disadvantage of this approach with CPP relates to the complexity of the calculations, compared to the simple use of descriptive statistics, available in commercial spreadsheet-like applications. However, this disadvantage was mitigated by publishing the proposed software as open source on the Zenodo.org platform [29] (and making it available in Appendix A here).

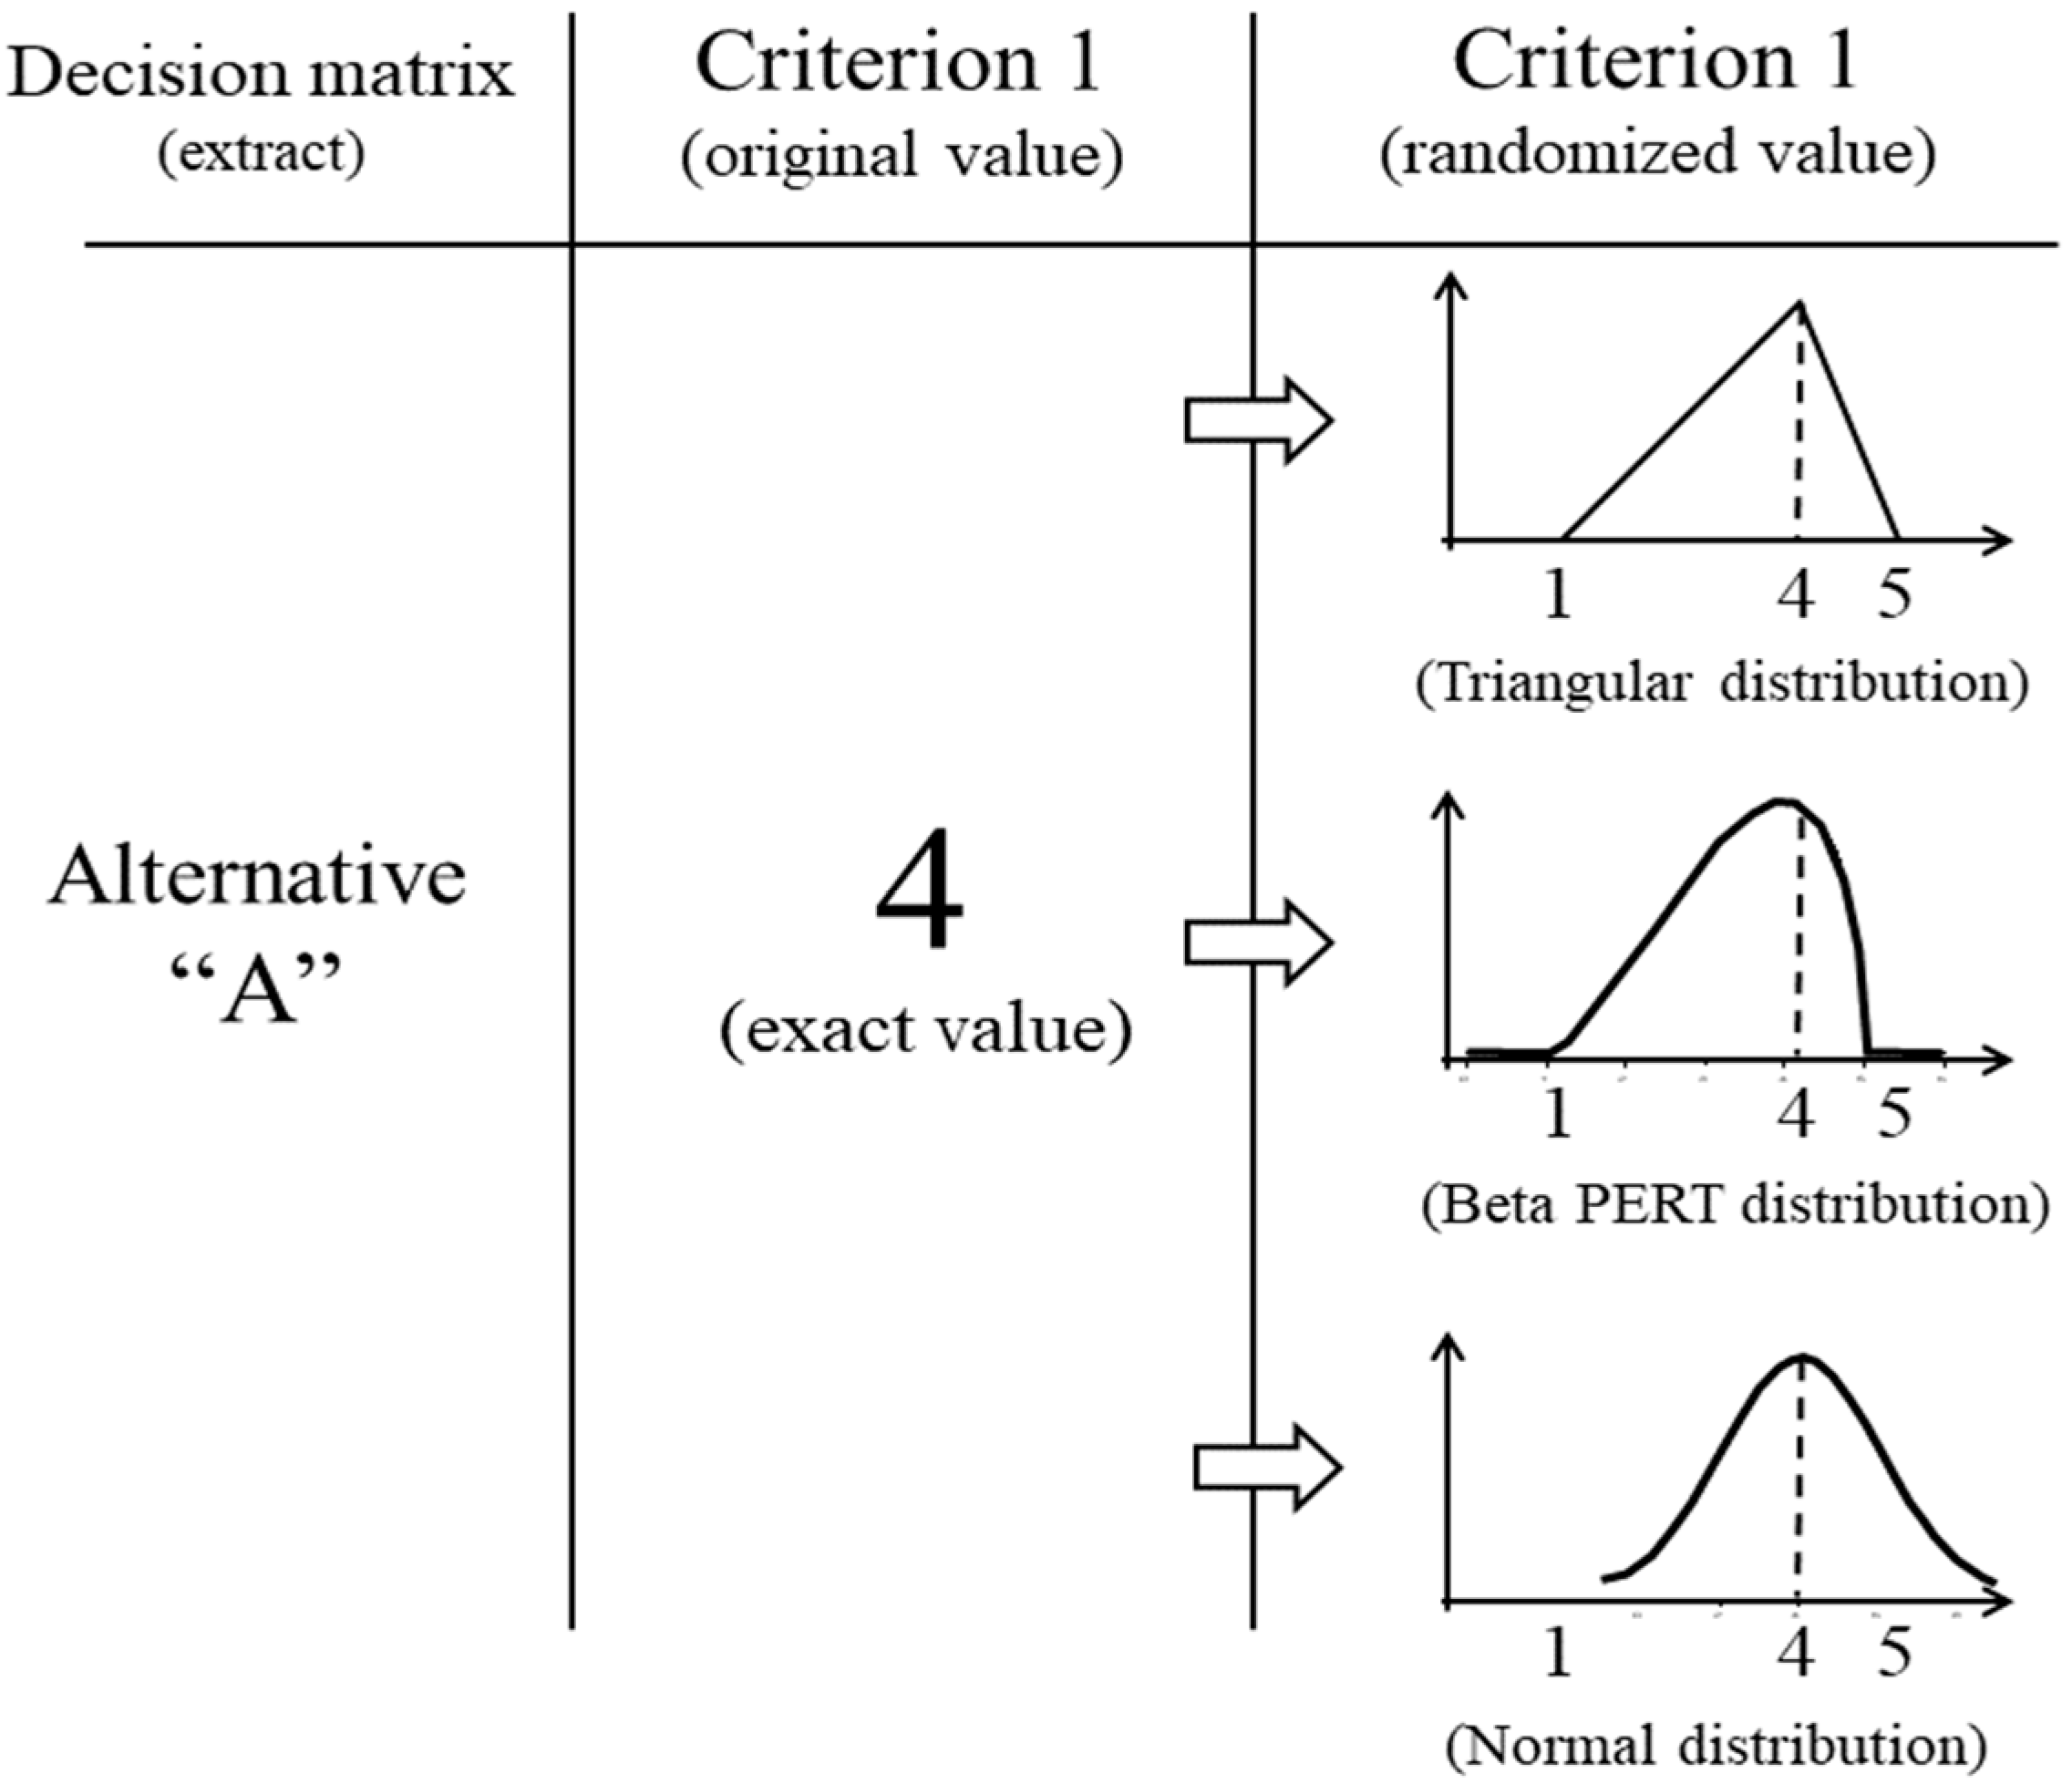
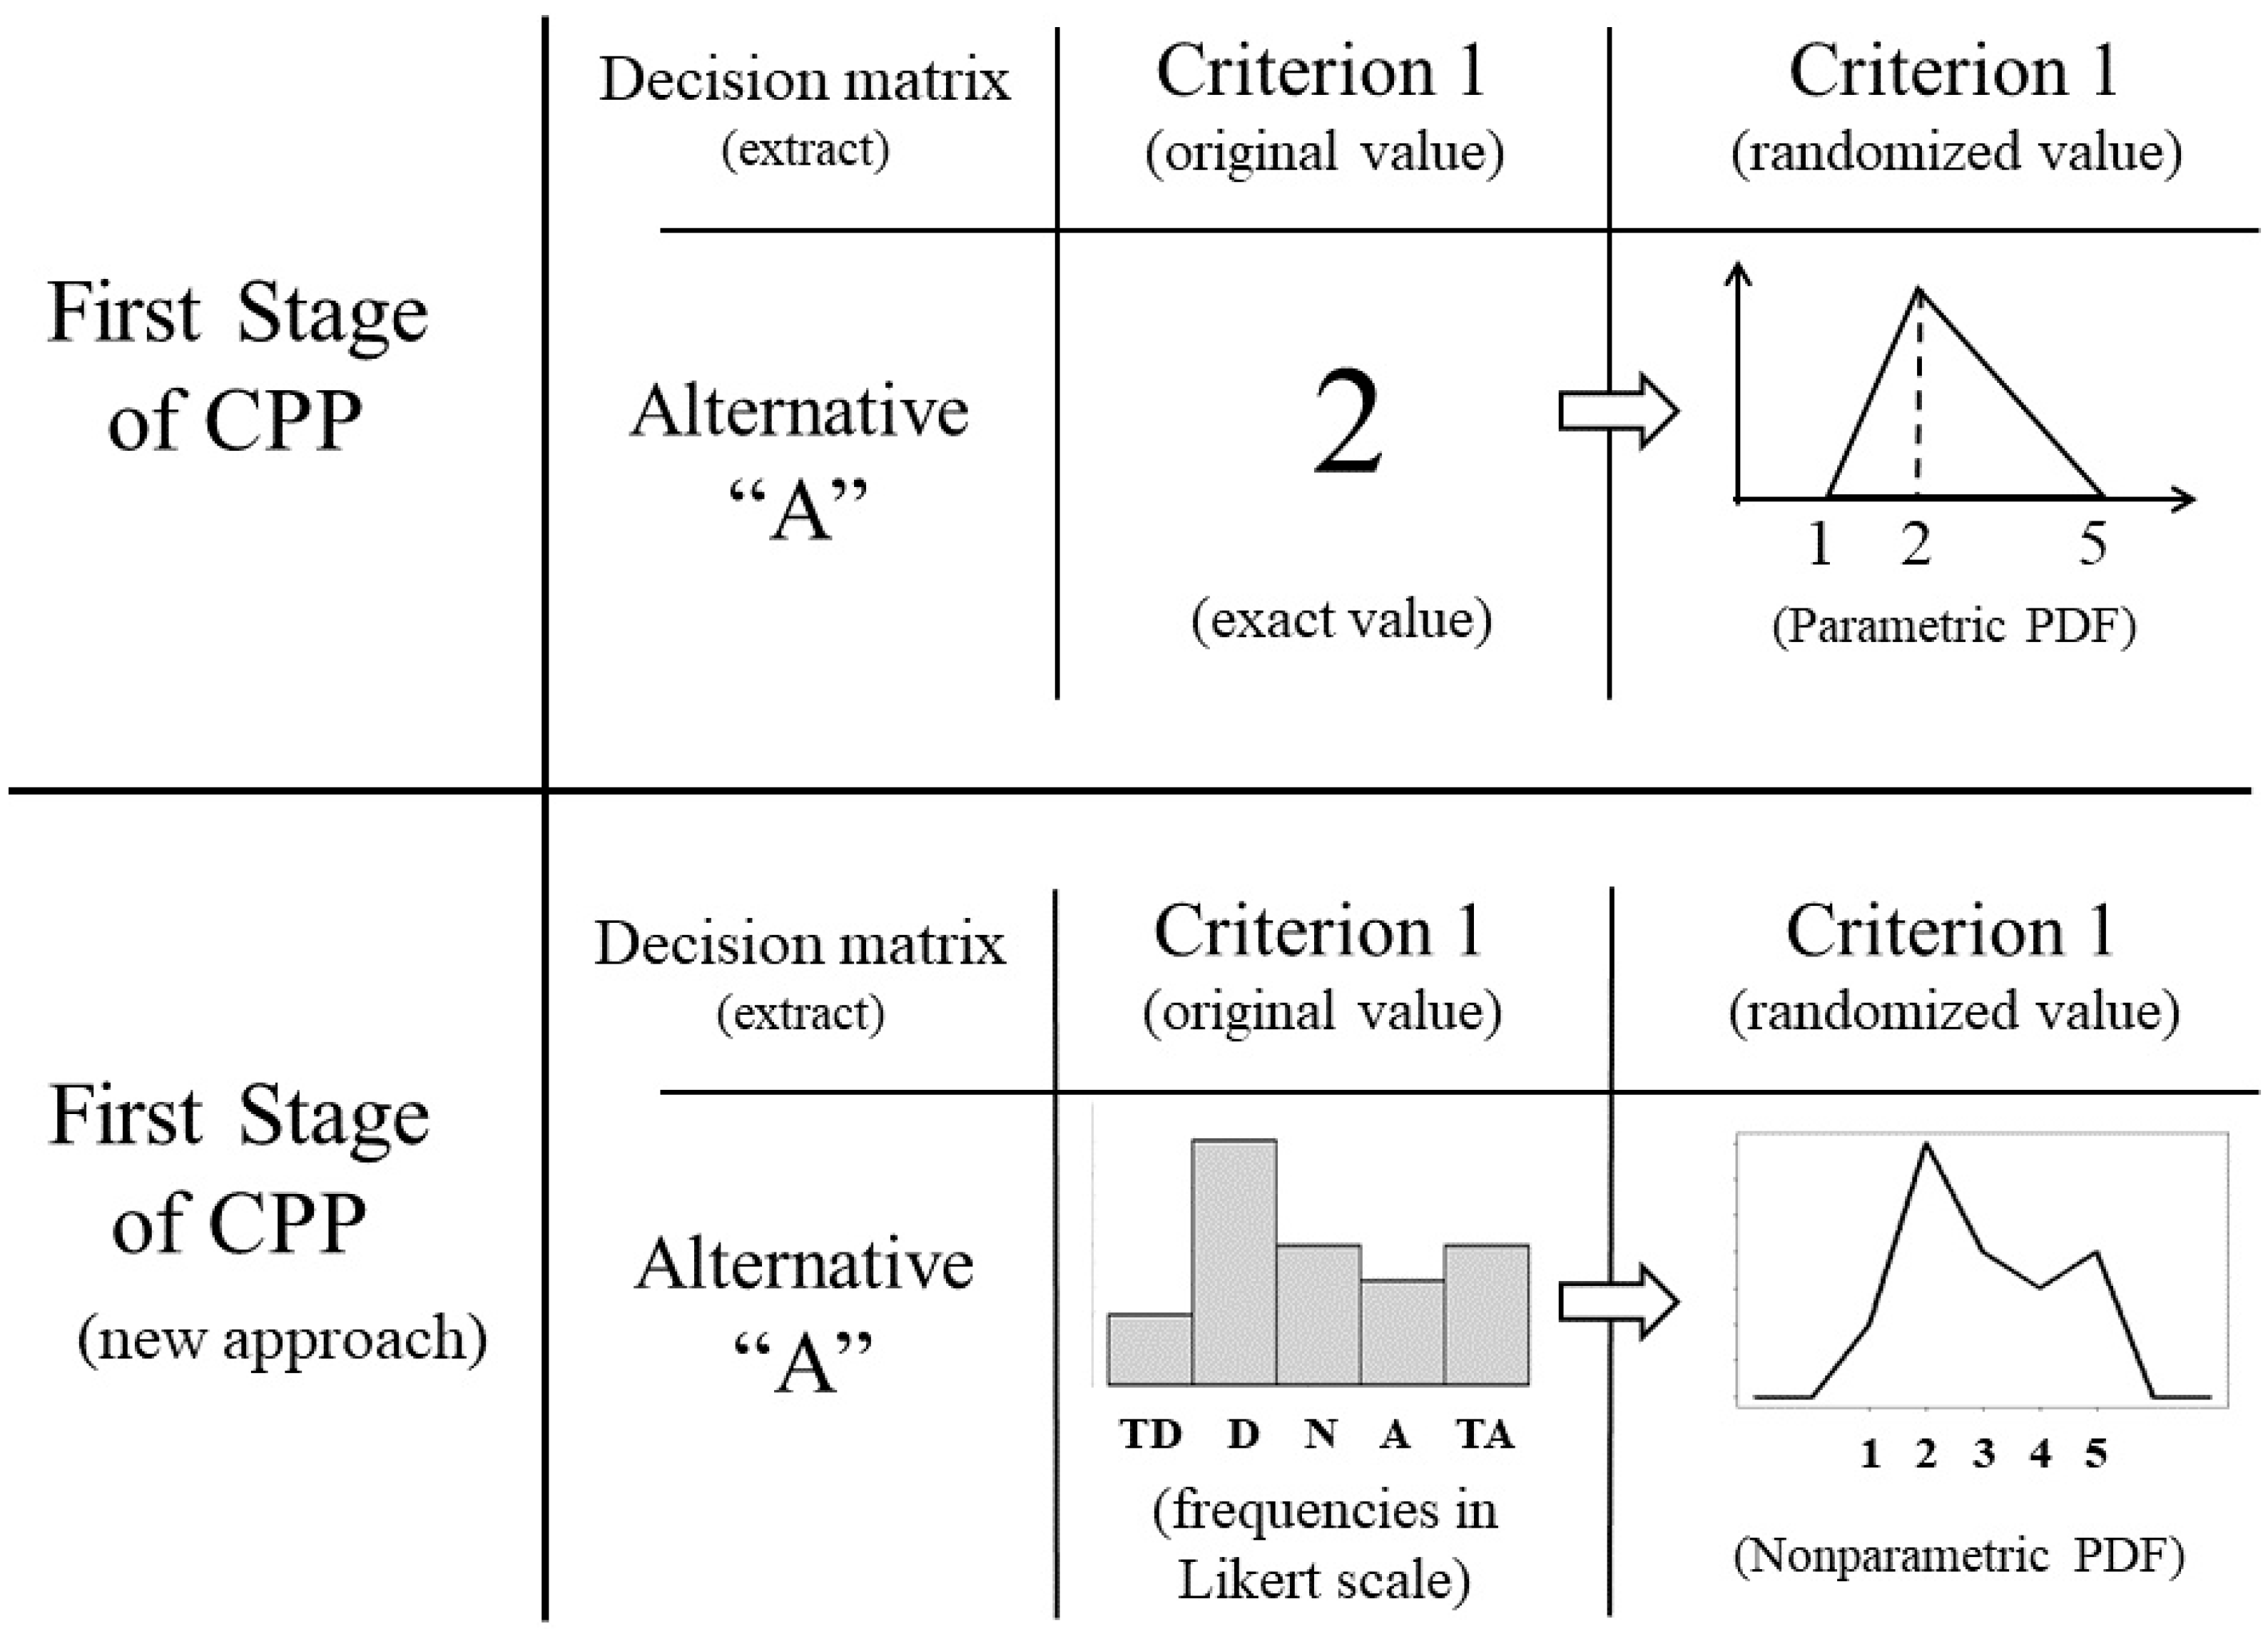
3. The Basics of CPP

The proposed model is based on CPP, originally developed by Sant’Anna and Sant’Anna [30] and later expanded by Sant’Anna [1]. This method incorporates the probabilistic nature of preference assessment into the multicriteria decision aid problem. The probabilistic characteristic can arise because of inaccuracies caused by subjective factors, leading decision makers to attribute different meanings to the same attributes of alternatives in different circumstances, or because of measurement errors that affect the evaluations of such attributes.
An initial and critical step in CPP is the transformation of the numerical vector, containing the evaluations of the various alternatives according to each criterion, into a vector containing preference probabilities. This transformation of exact values into probabilities is illustrated in Figure 1, where different distributions emulate the preferences of an expert. The exact value that corresponds to an expert’s assessment becomes the mode of a distribution of preferences, which varies between the extremes of the assessments by the criterion. To illustrate this procedure, the exact value “4” attributed to Alternative A and the range from “1” to “5” of Criterion 1 are converted into three probability distributions: a Triangular distribution of parameters (1, 4, 5), which indicate the minimum value “1”, the mode “4”, and the maximum value “5”; a Beta PERT distribution with those same parameters plus a fourth one, called shape, that emulates the variation in values around the mode; and a Normal distribution, of parameters (4, 2), where “4” is the mean and “2” simulates the standard deviation of evaluations on the same criterion. Any type of probability distribution can be used with CPP, both parametric and non-parametric, giving the method a significant versatility.
After randomizing the variables, CPP makes a relative comparison among the alternatives’ performances in each criterion. In this second stage, it is possible to verify, for example, to what extent each alternative could maximize or minimize its random performance to all the others. The calculation, for each criterion, is performed by integrating a function that corresponds to the product of the probability density of the alternative considered and the cumulative function of the other alternatives, as described by Equations (1) and (2). In the calculus of probabilities of the maximization and minimization—that is, the i-th alternative is superior (PMaxij) and inferior (PMinij) to all the others according to the j-th criterion—the evaluation of each alternative is represented by a random vector X; the functions of the i-th alternative are indexed by “i” and the functions of all the others by “−i”. The Cumulative Distribution Function (CDF) is represented by Fx, the Probability Density Function (PDF) by fx, and the domain of the random variable X is represented by DX [31].
P M a x i j = D X i [ F X i ( x i ) ]   f X i ( x i ) d x i
P M i n i j = D X i [ ( 1 F X i ( x i ) ) ]   f X i ( x i ) d x i
In the last stage, the probabilities of each alternative being the best or worst in each criterion are combined in different ways, providing different points of view for decision-making. For instance, PMax and PMin can be composed by axis (progressive–conservative/optimist–pessimist) [32], by principles of concentration/dilution [33], by Choquet capacities [34], by the Gini index [35], by classes [2], and associated with other methods [36]. Automation of the complete CPP procedure is available with open access in the “CPP” package [37]. This research focuses on the first stage of CPP, as detailed in the next section.

4. Materials and Methods

The new approach, in the lower portion of Figure 2, proposes a nonparametric procedure for the first stage of CPP, for cases in which the respondents’ original assessments are based on a Likert scale. Instead of considering each respondent’s preference for conversion into a parametric distribution, the histogram of the dataset is transformed into a nonparametric distribution. This conversion of the histogram into a nonparametric distribution is found in the literature [38,39,40,41], but its adaptation to CPP is unprecedented.
In Figure 2, we see that the measure of descriptive statistics (e.g., means) used to represent a spectrum of responses in the Likert scale is discarded. The histogram of responses is fitted to a probability distribution, reflecting the full density of data, not just one measure.
This approach values CPP. The choice of nonparametric PDF avoids the controversy described in Section 2, as it does not use descriptive statistics to extract parameters from the dataset. In addition, the new model simplifies CPP calculations in problems with a high number of respondents. For example, hundreds of evaluations of an alternative in a criterion can be generalized in a single histogram, avoiding the same number of calculations or the need to resort to a measure of central tendency to represent them.
The nonparametric distribution chosen in this approach is an empirical distribution, in which each point on the Likert scale is associated with a probability, calculated from the responses obtained from questionnaires or interviews. The R software version 4.3.1 provides several applications for fitting data to probability functions. The empirical distributions fitted here are based on the “mc2d” package [42].
The two subsequent stages of CPP remain unchanged and are described in detail in several published articles and books, with a wide range of applications, including sports science [35], management systems [43,44], security and defense [45], public health and social assistance [46,47], risk management [48], and bioenergy processes [36].
Table 2 reports the pseudocode used to calculate the preference probabilities, referring to the second stage of the CPP, according to the proposed approach. The calculations were performed with the R software. The third stage of the CPP was not included in the algorithm, since the examples in this article refer to the evaluation of alternatives under only one criterion. This final aggregation of the third stage of CPP requires evaluations of two or more criteria, beyond the scope of this proposal.
The code registered on the Zenodo.org platform offers two functions: “PMax.Emp.Likert” to calculate the joint probabilities of maximizing the alternatives and “PMin.Emp.Likert” for minimizing the alternatives. Both are required for certain CPP compositions [1]. However, additional care must be taken when applying them to problems of ranking alternatives evaluated on Likert scales, related to the type of evaluation criterion. The “benefit” criteria indicate that higher scores on the scale are better for the decision. In this case, evaluations with a value of “5” are more important than those with a value of “4”, and so on. On the other hand, the “cost” criteria indicate that lower scores on the scale are better for the decision. Finally, it should be noted that the joint probabilities of maximizing and minimizing, considering three or more alternatives, are not complementary.

5. Applications

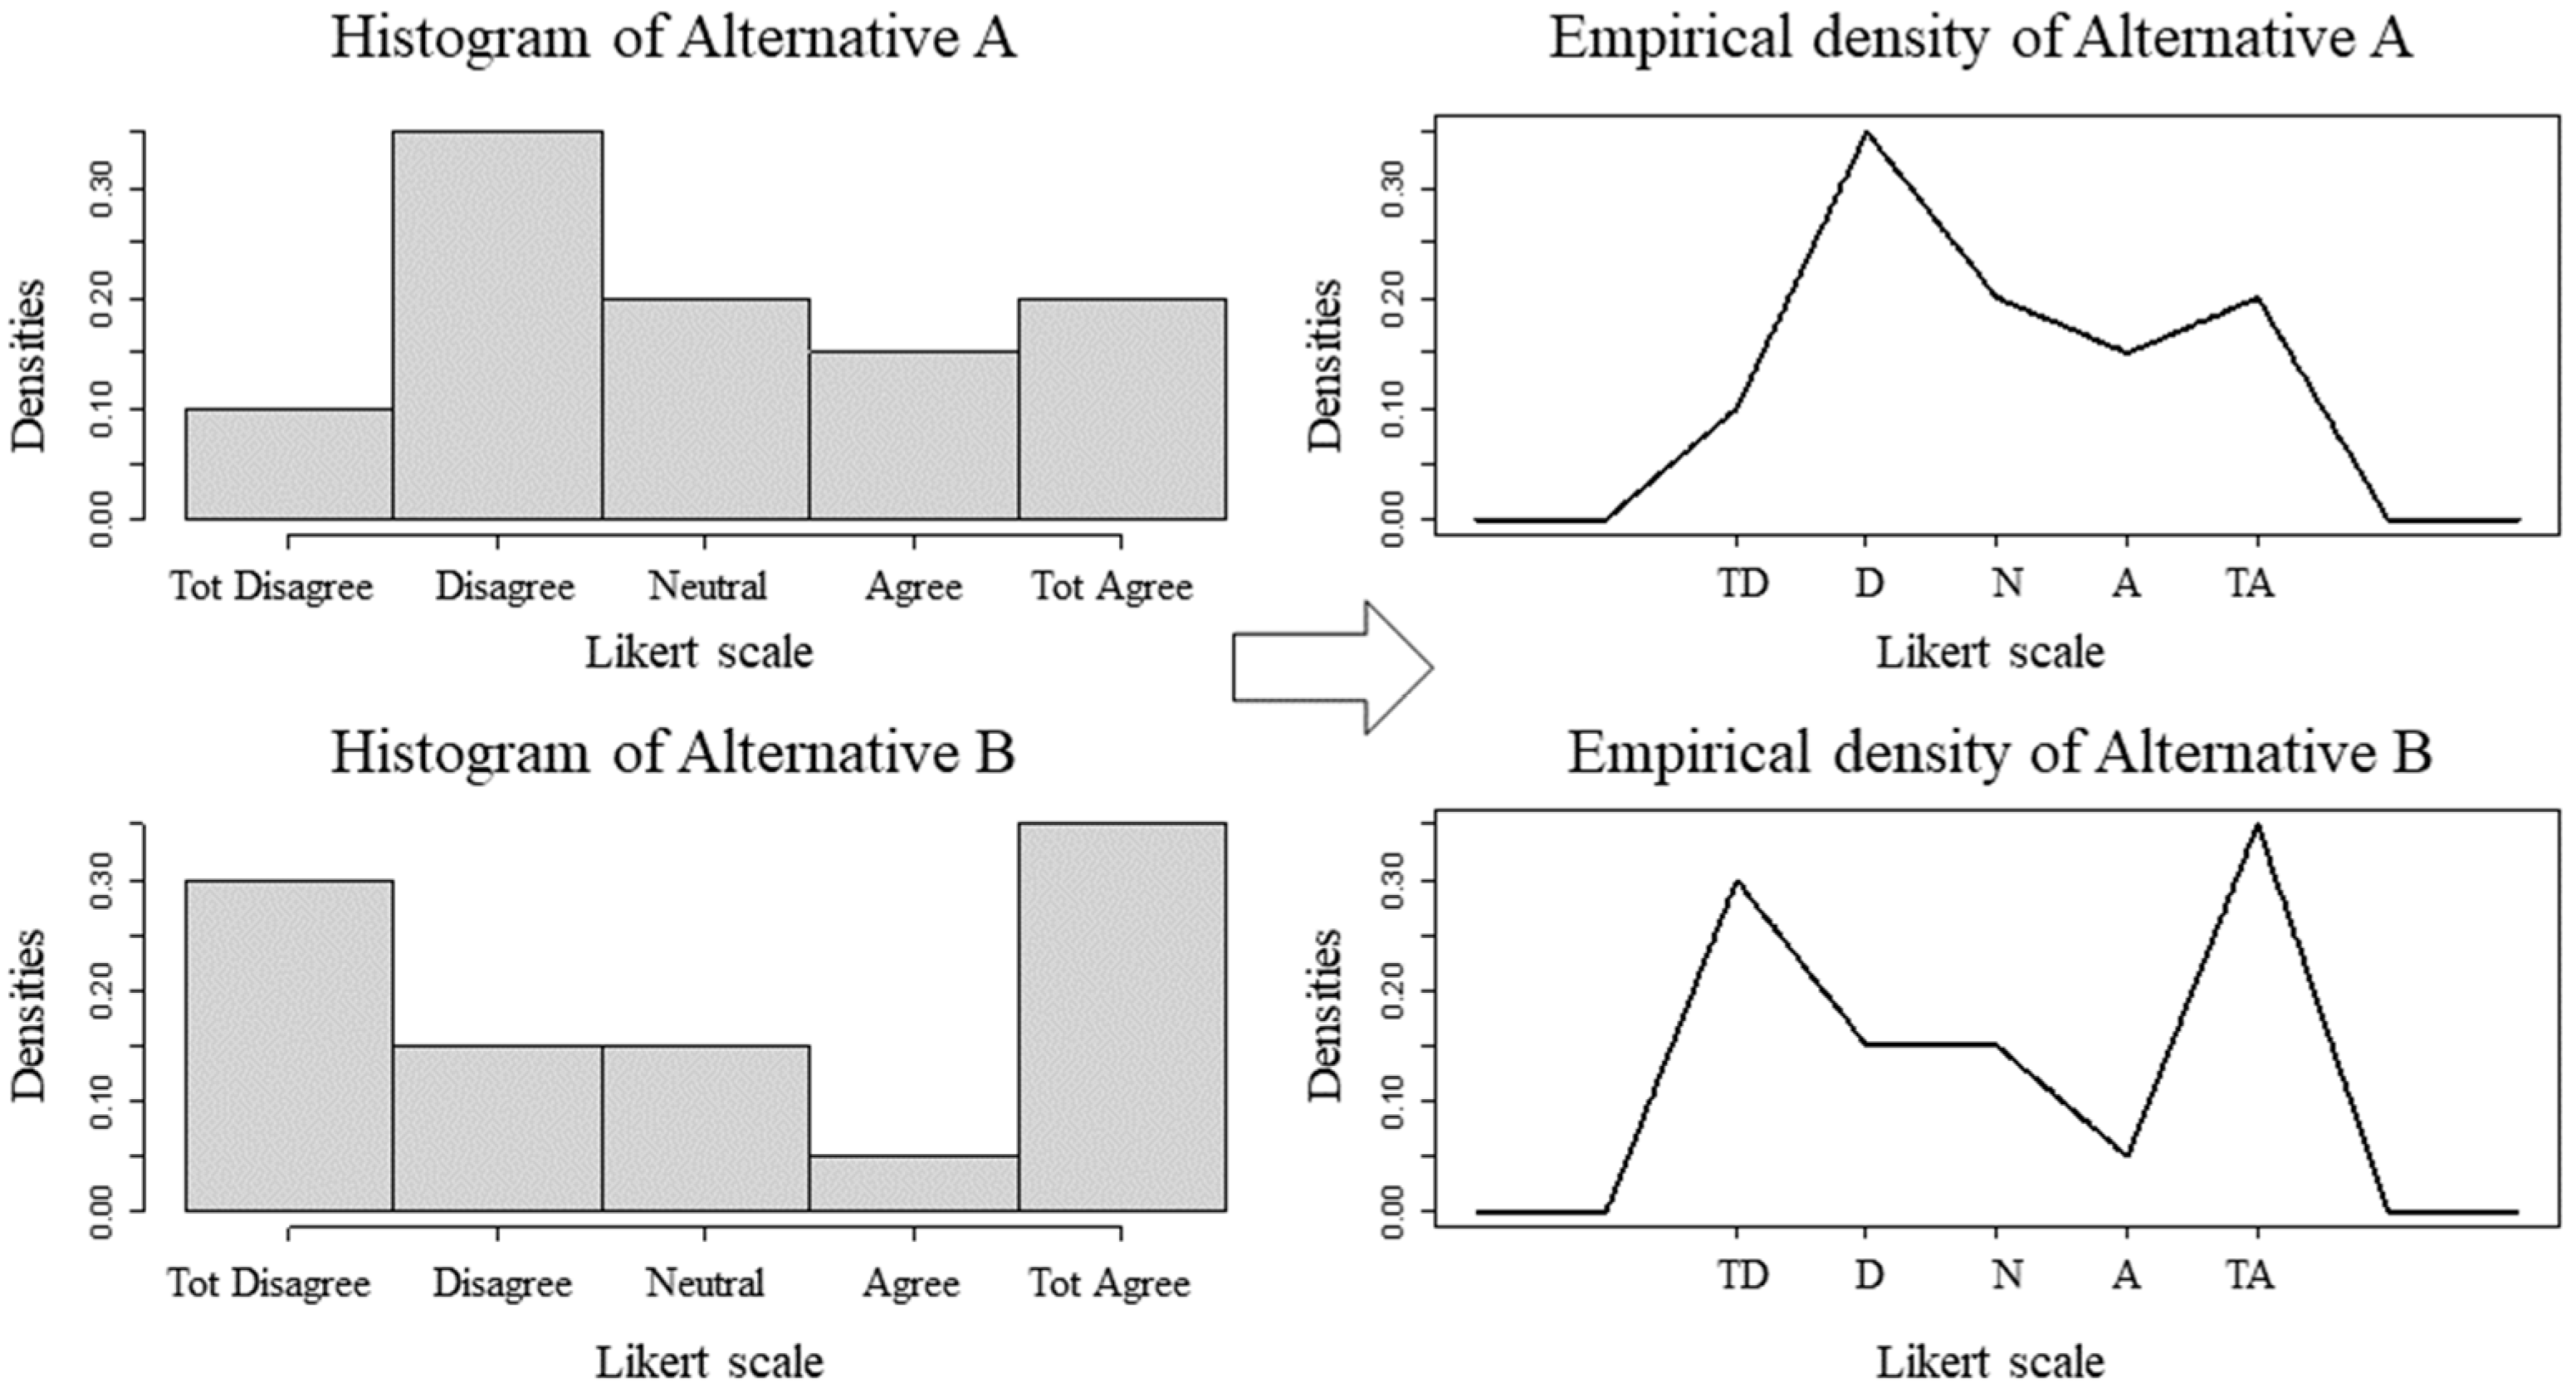
5.1. Dataset with the Same Means and Medians

We generated two datasets to illustrate the usefulness of the proposal in multicriteria decision aid problems with the alternatives measured by Likert scales. The first case contains ten alternatives, evaluated by 500 respondents, on a symmetrical five-point scale: “totally disagree”, “disagree”, “neutral”, “agree”, and “totally agree”. The peculiar aspect of this case is that the responses of the ten alternatives (“A” to “J”) have the same average and the same median for any scale of values assigned to the five points, as long as they are equidistant. For example, if the five points assume values from “1” to “5”, the mean and median will be equal to “3”; if the points assume values (1, 3, 5, 7, and 9), the mean and median will be “5”. We chose this setup to demonstrate the limitation of descriptive statistics in comparison with the proposed model. Equations (1)–(10) indicate the frequencies of responses for each alternative, in which the first represents the option “totally disagree” and the last “totally agree”. For example, Alternative “A” received 50 “totally disagree”, 175 “disagree” responses, and so on.
A = {50, 175, 100, 75, 100}
B = {150, 75, 75, 25, 175}
C = {100, 100, 125, 50, 125}
D = {100, 100, 75, 150, 75}
E = {75, 50, 200, 150, 25}
F = {25, 175, 175, 25, 100}
G = {75, 0, 325, 50, 50}
H = {100, 100, 100, 100, 100}
I = {125, 75, 125, 25, 150}
J = {150, 0, 175, 50, 125}
Figure 3 illustrates the histograms of Alternatives “A” and “B”, in which each column indicates the proportion of choice of the respective scale point, in relation to the 500 responses. The curve to the right of each histogram is the empirical PDF, which is nonparametric in nature. An interesting aspect to visualize is that the PDFs are unique for each dataset, differentiating them even for the situation of equality of their means and medians. This kind of data “DNA” is sensitive to CPP, as its calculations depend on the PDF and its related cumulative function (CDF) to identify which alternative is likely to be superior or inferior to the others.
The PDF of the histograms in Figure 3 was defined by the “dempiralC” function, available in the “mc2d” package [42], according to Equation (13), where “x” are the scale values and “p” denotes their probabilities of occurrence, based on their frequencies. The “p” values are normalized to give the distribution one unit of area. The functions “dempiralC” and “pempiricalC” (CDF) were used in the calculations of PMax and PMin, according to the R code in Appendix A.
f ( x ) = p i + ( x x i x i + 1 x i ) ( p i + 1 p i ) ,   x i < x < x i + 1
Once the probability distributions that fit the evaluations represented by the histograms have been defined, the next step of CPP refers to the calculation of the probabilities that the alternatives maximize or minimize their preferences, considering the type of criterion. Based on the code registered on the Zenodo.org platform, the functions “PMax.Emp.Likert” and “PMin.Emp.Likert” were applied to the ten alternatives, generating the results in Table 3. The highest frequency of extreme values of Alternative “B”, with 150 “totally disagree” and 175 “totally agree” responses, were decisive for its priority, both to maximize and minimize its preference over the others.

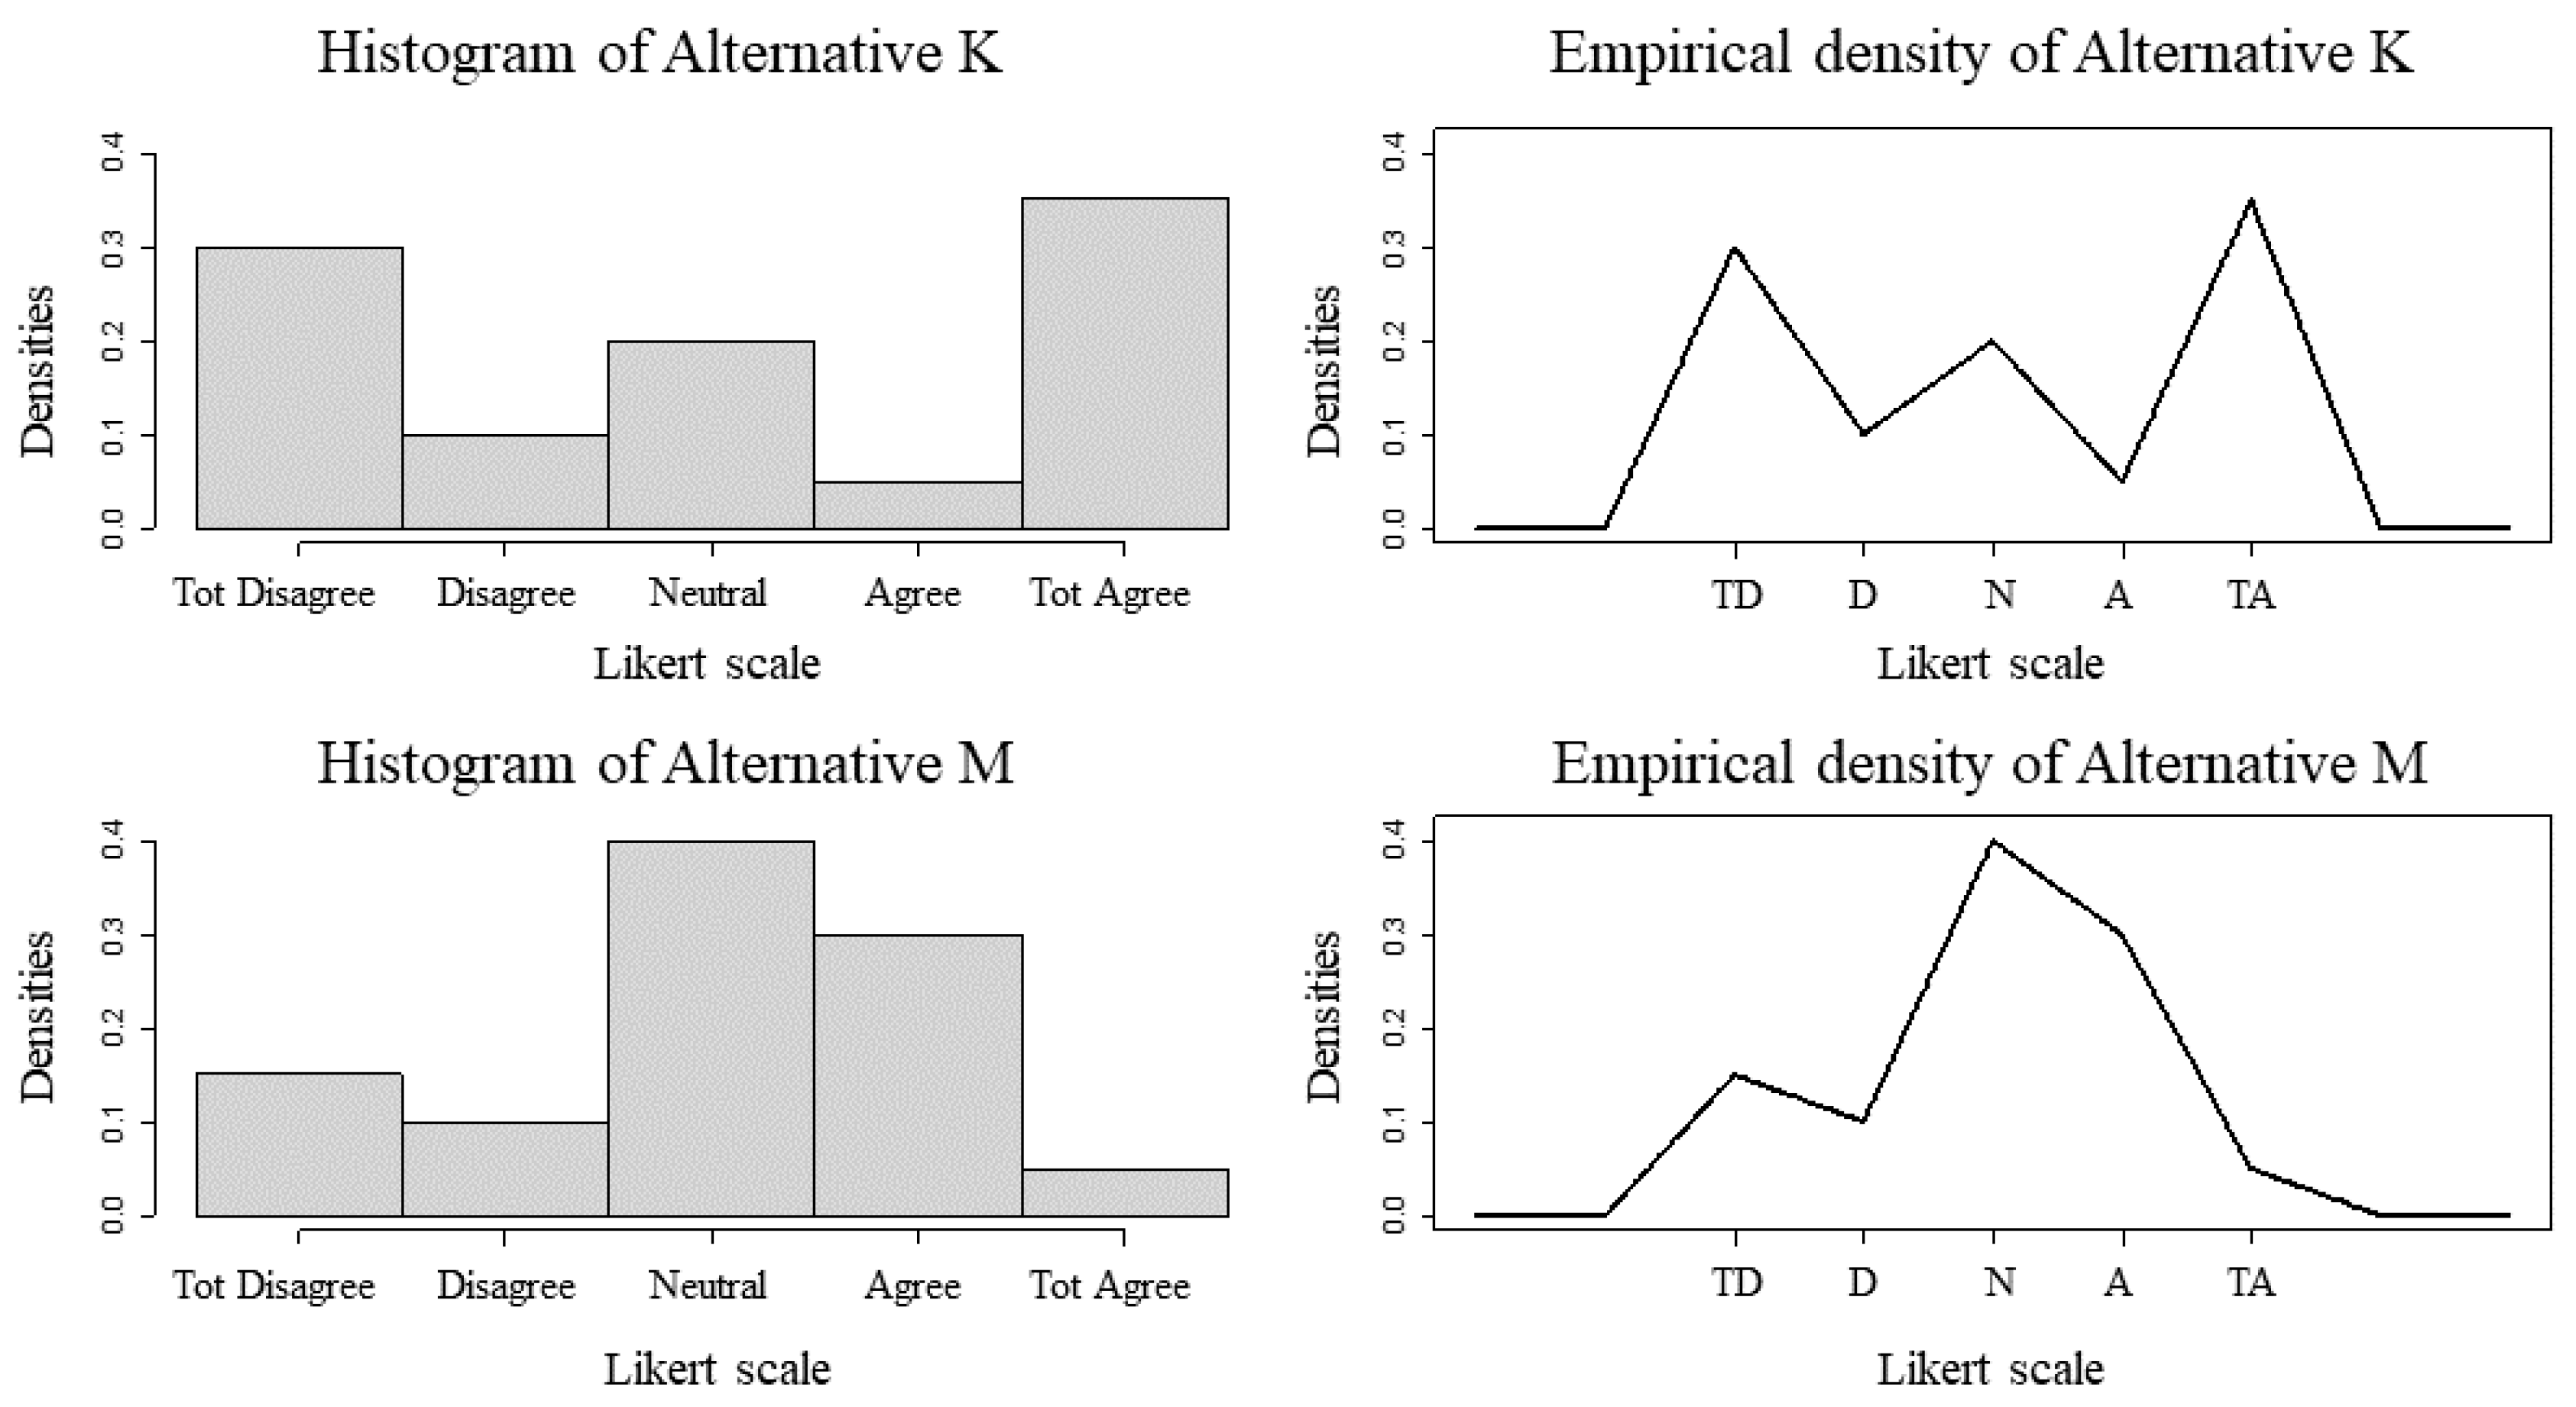
5.2. CPP Sensitivity to Likert Scale Cardinality

The second illustration of the usefulness of the model proposed here explores two alternatives (“K” and “M”), with variants K* and M*, according to the frequencies indicated in Equations (12)–(15). Alternatives “K” and “M” were rated on a five-point scale and alternatives K* and M* on a nine-point scale. The extreme options remain with the indications “totally disagree” and “totally agree” and the intermediate ones as “neutral”. The K* and M* frequencies repeat the values of the “K” and “M” evaluations, respectively, only representing greater rigor on the part of the evaluators by using the nine-point scale. Both “K” and “M” and K* and M* have the same medians, but different means and modes, which would be enough to define the priority for K or K*, if decision making prioritized these measures of descriptive statistics.
K = {150, 50, 100, 25, 175}
M = {75, 50, 200, 150, 25}
K* = {150, 50, 100, 25, 175, 0, 0, 0, 0}
M* = {75, 50, 200, 150, 25, 0, 0, 0, 0}
Figure 4 and Figure 5 describe the histograms and empirical densities of alternatives K and M and their variants K* and M*, respectively.
In the literature review, we identified studies that sought to make the use of descriptive statistics more flexible in problems with Likert scales of higher cardinality, arguing that ten-point [17] or eleven-point [16] scales, for example, would be sufficient to relax the mathematical rigor/statistics of the scales of Stevens [10]. This application shows that the CPP is able to confirm this argument, but without resorting to statistical parameters for decision making.
Table 4 indicates that the expansion of the Likert scale points was not enough to change the parameters of the variables (median, mean, and mode) in order to change the decision. However, the change in scale gives a new density to the data, even if the density profiles of K* and M* are similar (shifted to the left) to the respective ones of K and M. The CPP is able to capture this change in scale due to its nonlinear property, valuing the highest evaluations in the PMax calculations and valuing the smallest ones in the PMin calculations, as described in Gavião et al. [31]. Thus, in the new nine-point scale, the PMax of Alternative K* becomes higher than that of M*, confirming the order of priority indicated by means and modes, without eliciting the historical critiques of using descriptive statistics in ordinal scales.

5.3. Unified Health System (SUS)

The national health system in Brazil is called the Unified Health System (SUS in the Portuguese abbreviation), ranging from basic care to complex procedures such as organ transplants. The SUS guarantees full, universal, and free access to the country’s population. Its chain of health units includes federal university hospitals, which are reference centers of medium and high complexity for the SUS. In addition, these hospitals are important training centers for human resources in the health area and provide support to teaching, research, and extension of the federal institutions of higher education to which they are linked.
The network of federal university hospitals comprises 51 hospitals linked to 36 federal universities. Of these, 41 hospitals are linked to the Brazilian Hospital Service Company (Ebserh). This company was created by the federal government and is responsible for the management of federal university hospitals. Among the attributions assumed by Ebserh are the coordination and evaluation of execution of the hospitals’ activities; technical support for the elaboration of management improvement instruments; and the distribution of resources to the hospitals. Several reports of satisfaction surveys carried out by Ebserh are made available for public access (https://www.gov.br/ebserh/pt-br/acesso-a-informacao/participacao-social/ouvidoria-geral/pesquisas-de-satisfacao, accessed on 11 April 2023).
In 2022, Ebserh published a panel of results with the satisfaction rates of different users of university hospitals, which included resident physicians in their units. The study consolidated the responses on a nine-point Likert scale, but drew conclusions based on calculating the averages of these responses. Thus, in this case study, we sought to apply the proposed method to reassess the final ranking of teaching hospitals, based on the opinion of resident physicians.
Table 5 presents the results of calculating the PMax for each hospital, compared with the final ranking tallied by Ebserh. Kendall’s ordinal statistical correlation was applied to the two rankings, indicating a moderate relationship of 49.2%. Three hospitals had the same position in the satisfaction assessment, while 18, highlighted in this table, improved their order in the probabilistic calculations. The results illustrate the greater discriminant power of CPP for the final calculation. This is relevant, since these 18 hospitals could have priority in the distribution of public resources or in public educational policies, receiving new diagnostic equipment and medicines, among other benefits.

6. Conclusions

The purpose of this article was to illustrate with examples the advantages of CPP in multicriteria decision aid problems that have used databases measured on Likert scales. Criticisms and controversies about the use of descriptive statistics with Likert scales have fueled the debate for decades in the scientific literature; however, CPP offers a model with full adherence to the characteristics of an ordinal scale, without involving any of the points raised for and against the use of data with that type of scale. CPP can be used with empirical distributions that are nonparametric, or for data adjustment without the need to resort to data parameters, using only the histogram. Two numerical examples and a real case were used to demonstrate the usefulness and advantages of the proposal.
The research was guided by three questions. The first aimed to highlight the main controversies in the literature surrounding the use of Likert scales for decision support. This issue was discussed in Section 2. It was demonstrated how proponents and opponents have maintained their positions for decades. This highlighted the significance of developing a strategy that does not oppose either party. The second question asked how the use of CPP could strengthen analyses based on the use of Likert scales. Methodological changes in CPP that enhance the use of Likert scales were detailed. The changes were graphically illustrated in Section 4. This contributed to the comprehension of the whole method, which was introduced in Section 3. The third question addressed the advantages of the proposed approach. Its benefits were demonstrated in three different applications presented in Section 5.
The main limitation of the proposal is the complexity of calculations that involve any mathematical model compared to the simple use of means, standard deviations, and other statistical measures from Likert scales. On the other hand, this disadvantage was mitigated by publishing the proposed software as open source on the Zenodo.org platform [29] and making it available in Appendix A. The research also did not advance on the type of management decisions that could result from the new ranking of hospitals, as it is not included in its scope.
The code in R language was used to calculate the most important parameters of the proposal, namely the probabilities of preference for the alternatives in the criteria. To complete the CPP application, it is necessary to collect data pertaining to multiple criteria and compose the probabilities according to some rule. In this article, we did not extend the analysis to this last stage, instead identifying the literature on different forms and models of CPP for this conclusion, including the “CPP” package of the R software.
A possible deepening of this study is utilizing other nonparametric distributions, such as kernel density models, and comparing the results with those of the empirical distribution explored here.

Author Contributions

Conceptualization, L.O.G. and A.P.S.; methodology, L.O.G. and A.P.S.; software, L.O.G., A.P.S., G.B.A.L. and P.A.d.A.G.; validation, L.O.G., A.P.S., G.B.A.L. and P.A.d.A.G.; formal analysis, L.O.G. and A.P.S.; investigation, L.O.G.; resources, L.O.G., A.P.S., G.B.A.L. and P.A.d.A.G.; data curation, L.O.G. and A.P.S.; writing—original draft preparation, L.O.G. and A.P.S.; writing—review and editing, L.O.G., A.P.S., G.B.A.L. and P.A.d.A.G.; visualization, L.O.G.; supervision, A.P.S. All authors have read and agreed to the published version of the manuscript.

Funding

This research received no external funding.

Institutional Review Board Statement

Not applicable.

Informed Consent Statement

Not applicable.

Data Availability Statement

Not applicable.

Conflicts of Interest

The authors declare no conflict of interest.

Appendix A

Probabilistic Preferences in Likert Scales with Empirical Distributions.
This R-code is intended for multicriteria decision support problems solved by the Composition of Probabilistic Preferences (CPP). The two functions calculate the joint probabilities of alternatives maximizing (PMax) and minimizing (PMin) their preferences in a criterion. The measures of the problem’s decision matrix are the frequencies of responses to the Likert scale values used in the questionnaires.
This R-code is registered (DOI: 10.5281/zenodo.7950538) [29]
# Function 1: joint probabilities of an alternative maximize preferences by criterion
PMax.Emp.Likert = function (values,probs) {
require(mc2d)
PMax = rep(0,nrow(probs))
for (i in 1:nrow(probs)) {
PMax[i] = (integrate(Vectorize(function(x) {prod(pempiricalC(x, min(values), max(values), values, prob = probs[−i,])) * dempiricalC(x, min(values), max(values), values, prob = probs[i,])}), min(values) − 3, max(values) + 3))$value}
PMax
r = rank(−PMax)
Result = list(PMax = PMax, Rank = r)
Result}
# Function 2: joint probabilities of an alternative minimize preferences by criterion
PMin.Emp.Likert = function (values,probs) {
require(mc2d)
PMin = rep(0,nrow(probs))
for (i in 1:nrow(probs)){
PMin[i] = (integrate(Vectorize(function(x) {prod(1-pempiricalC(x, min(values), max(values), values, prob = probs[−i,])) * dempiricalC(x, min(values), max(values), values, prob = probs[i,])}), min(values) − 3, max(values) + 3))$value}
PMin
r = rank(−PMin)
Result = list(PMin = PMin, Rank = r)
Result}
# Example:
values = 1:5 # equidistant values of the Likert scale, used to evaluate alternatives
prob.a = c(2, 7, 4, 3, 4) # frequency of responses for each Likert scale value
prob.b = c(6, 3, 3, 1, 7)
prob.c = c(4, 4, 5, 2, 5)
prob.d = c(4, 4, 3, 6, 3)
prob.e = c(3, 2, 8, 6, 1)
probs = rbind(prob.a, prob.b, prob.c, prob.d, prob.e) # matrix of frequencies and values
PMax.Emp.Likert (values,probs)
PMin.Emp.Likert (values,probs)

References

  1. Sant′Anna, A.P. Probabilistic Composition of Preferences, Theory and Applications, 1st ed.; Springer: New York, NY, USA, 2015. [Google Scholar]
  2. Gavião, L.O.; Sant’Anna, A.P.; Garcia, P.A.A.; Silva, L.C.E. Multi-criteria decision support to criminology by Graph Theory and Composition of Probabilistic Preferences. Pesqui. Oper. 2021, 41, e249751. [Google Scholar] [CrossRef]
  3. Likert, R. A technique for the measurement of attitudes. Arch. Psychol. 1932, 22, 5–55. [Google Scholar]
  4. Li, Q. A novel Likert scale based on fuzzy sets theory. Expert Syst. Appl. 2012, 40, 1609–1618. [Google Scholar] [CrossRef]
  5. Anjaria, K. Knowledge derivation from Likert scale using Z-numbers. Inf. Sci. 2022, 590, 234–252. [Google Scholar] [CrossRef]
  6. Karuppiah, K.; Sankaranarayanan, B. An integrated multi-criteria decision-making approach for evaluating e-waste mitigation strategies. Appl. Soft Comput. 2023, 144, 110420. [Google Scholar] [CrossRef]
  7. Alshamsi, A.M.; El-Kassabi, H.; Serhani, M.A.; Bouhaddioui, C. A multi-criteria decision-making (MCDM) approach for data-driven distance learning recommendations. Educ. Inf. Technol. 2023, 28, 1–38. [Google Scholar] [CrossRef]
  8. Daniel, M.; Ahammed, M.M.; Shaikh, I.N. Selection of Greywater Reuse Options Using Multi-criteria Decision-making Techniques. Water Conserv. Sci. Eng. 2023, 8, 2. [Google Scholar] [CrossRef]
  9. Wang, S.; Li, L.; Liu, C.; Huang, L.; Chuang, Y.-C.; Jin, Y. Applying a multi-criteria decision-making approach to identify key satisfaction gaps in hospital nurses’ work environment. Heliyon 2023, 9, e14721. [Google Scholar] [CrossRef]
  10. Stevens, S.S. On the Theory of Scales of Measurement. Science 1946, 103, 677–680. [Google Scholar] [CrossRef]
  11. Williams, M.N. Levels of measurement and statistical analyses. Meta-Psychology 2021, 5, 1–14. [Google Scholar] [CrossRef]
  12. Bishop, P.A.; Herron, R.L. Use and Misuse of the Likert Item Responses and Other Ordinal Measures. Int. J. Exerc. Sci. 2015, 8, 297–302. [Google Scholar]
  13. Tanujaya, B.; Prahmana, R.C.I.; Mumu, J. Likert scale in social sciences research: Problems and difficulties. FWU J. Soc. Sci. 2022, 16, 89–101. [Google Scholar]
  14. Hair, J.F.; Black, W.C.; Babin, B.J.; Anderson, R.E. Multivariate Data Analysis, 8th ed.; Cengage Learning EMEA: London, UK, 2018. [Google Scholar]
  15. Kuzon, W.; Urbanchek, M.; McCabe, S. The seven deadly sins of statistical analysis. Ann. Plast. Surg. 1996, 37, 265–272. [Google Scholar] [CrossRef] [Green Version]
  16. Wu, H.; Leung, S.-O. Can Likert Scales be Treated as Interval Scales?—A Simulation Study. J. Soc. Serv. Res. 2017, 43, 527–532. [Google Scholar] [CrossRef]
  17. Awang, Z.; Afthanorhan, A.; Mamat, M. The Likert scale analysis using parametric based Structural Equation Modeling (SEM). Comput. Methods Soc. Sci. 2016, 4, 13–21. [Google Scholar]
  18. Baran, T. Comparison of parametric and non-parametric methods to analyse the data gathered by a likert-type scale. In Handbook of Research on Applied Data Science and Artificial Intelligence in Business and Industry; IGI Global: Hershey, PA, USA, 2021; pp. 414–430. [Google Scholar]
  19. Norman, G. Likert scales, levels of measurement and the “laws” of statistics. Adv. Health Sci. Educ. 2010, 15, 625–632. [Google Scholar] [CrossRef]
  20. Harpe, S.E. How to analyze Likert and other rating scale data. Curr. Pharm. Teach Learn 2015, 7, 836–850. [Google Scholar] [CrossRef]
  21. Thomas, M.A. Mathematization, Not Measurement: A Critique of Stevens’ Scales of Measurement. J. Methods Meas. Soc. Sci. 2019, 10, 76–94. [Google Scholar] [CrossRef]
  22. Mircioiu, C.; Atkinson, J. A comparison of parametric and non-parametric methods applied to a Likert scale. Pharmacy 2017, 5, 26. [Google Scholar] [CrossRef] [Green Version]
  23. Pornel, J.B.; Saldaña, G.A. Four common misuses of the Likert scale. Philipp. J. Soc. Sci. Humanit. 2013, 18, 12–19. [Google Scholar]
  24. Jamieson, S. Likert scales: How to (ab) use them? Med. Educ. 2004, 38, 1217–1218. [Google Scholar] [CrossRef] [PubMed]
  25. Allen, I.E.; Seaman, C.A. Likert scales and data analyses. Qual. Prog. 2007, 40, 64–65. [Google Scholar]
  26. Sullivan, G.M.; Artino, A.R., Jr. Analyzing and interpreting data from Likert-type scales. J. Grad. Med. Educ. 2013, 5, 541–542. [Google Scholar] [CrossRef] [PubMed] [Green Version]
  27. Alabi, A.T.; Jelili, M.O. Clarifying likert scale misconceptions for improved application in urban studies. Qual. Quant. 2023, 57, 1337–1350. [Google Scholar] [CrossRef]
  28. Schrum, M.L.; Ghuy, M.; Hedlund-Botti, E.; Natarajan, M.; Johnson, M.J.; Gombolay, M.C. Concerning Trends in Likert Scale Usage in Human-robot Interaction: Towards Improving Best Practices. ACM Trans. Human-Robot Interact. 2023, 12, 1–32. [Google Scholar] [CrossRef]
  29. Gavião, L.O.; Sant′Anna, A.P.; Lima, G.B.A.; Garcia, P.A.A. Probabilistic Preferences of Likert Scale Data by Empirical Distributions; Version 2.0.; Zenodo.org: Geneve, Switzerland, 2023; p. 1. [Google Scholar]
  30. Sant′Anna, A.P.; Sant′Anna, L.A.F.P. Randomization as a stage in criteria combining. In Proceedings of the International Conference on Industrial Engineering and Operations Management—VII ICIEOM, Salvador, Brazil, 4–8 October 2001; pp. 248–256. [Google Scholar]
  31. Gavião, L.O.; Sant’Anna, A.P.; Lima, G.B.A.; de Almada Garcia, P.A.; de Sousa, A.M. Selecting distribution centers in disaster management by Network Analysis and Composition of Probabilistic Preferences. In Industrial Engineering and Operations Management; Amorim, A.M.T.T., Barbastefano, R.G., Scavarda, L.F., Reis, J.C.G.D., Amorim, M.P.C., Eds.; PUC-RJ: Rio de Janeiro, Brazil, 2020; pp. 1–11. [Google Scholar]
  32. de Souza, F.H.; Gavião, L.O.; Sant’Anna, A.P.; Lima, G.B. Prioritizing risks with composition of probabilistic preferences and weighting of FMEA criteria for fast decision-making in complex scenarios. Int. J. Manag. Proj. Bus. 2021, 15, 572–594. [Google Scholar] [CrossRef]
  33. Sant′anna, A.P.; Gavião, L.O.; Lima, G.B.A. Alternatives for the composition of interactive environmental impact factors. Pesqui. Oper. 2022, 42, e247786. [Google Scholar] [CrossRef]
  34. Sant′anna, A.P.; Gavião, L.O.; Sant’anna, T.L. Multi-criteria classification of reward collaboration proposals. IISE Trans. 2023. [Google Scholar] [CrossRef]
  35. Gavião, L.O.; Sant′anna, A.P.; Lima, G.B.A.; Garcia, P.A.A. Evaluation of soccer players under the Moneyball concept. J. Sports Sci. 2019, 38, 1221–1247. [Google Scholar] [CrossRef]
  36. Gavião, L.O.; Meza, L.A.; Lima, G.B.; Sant’Anna, A.P.; de Mello, J.C.B.S. Improving discrimination in efficiency analysis of bioethanol processes. J. Clean. Prod. 2017, 168, 1525–1532. [Google Scholar] [CrossRef]
  37. Gavião, L.O.; Sant′Anna, A.P.; Lima, G.B.A.; Garcia., P.A.A. CPP: Composition of Probabilistic Preferences; R Package Version 0.1.0.; R Foundation for Statistical Computing: Vienna, Austria, 2022; pp. 1–24. [Google Scholar]
  38. Wandresen, R.R.; Netto, S.P.; Koehler, H.S.; Sanquetta, C.R.; Behling, A. Nonparametric method: Kernel density estimation applied to forestry data. Floresta 2019, 49, 561–570. [Google Scholar] [CrossRef]
  39. Jiang, T.; Li, D. Approximation of Rectangular Beta-Laguerre Ensembles and Large Deviations. J. Theor. Probab. 2013, 28, 804–847. [Google Scholar] [CrossRef] [Green Version]
  40. Chalabi, Y.; Scott, D.J.; Würtz, D. The Generalized Lambda Distribution as an Alternative to Model Financial Returns. Inst Für Theor Phys Univ Auckland: Zürich, Auckland. Available online: www.Rmetrics.Org/Sites/Default/Files/Glambda.Pdf; www.rmetrics.org/sites/default/files/2009-01-glambdaDist.pdf (accessed on 30 June 2023).
  41. Zhou, Z.; Azam, S.S.; Brinton, C.; Inouye, D.I. Efficient Federated Domain Translation. In Proceedings of the International Conference on Learning Representations, Kigali, Rwanda, 1–5 May 2023; pp. 1–31. [Google Scholar]
  42. Pouillot, R.; Delignette-Muller, M.L. Evaluating variability and uncertainty separately in microbial quantitative risk assessment using two R packages. Int. J. Food Microbiol. 2010, 142, 330–340. [Google Scholar] [CrossRef]
  43. Garcia, P.A.A.; Sant’Anna, A.P. Vendor and logistics provider selection in the construction sector: A Probabilistic Preferences Composition approach. Pesqui. Oper. 2015, 35, 363–375. [Google Scholar] [CrossRef] [Green Version]
  44. Sant′anna, A.P.; Meza, L.A.; Ribeiro, R.O.A. Probabilistic composition in quality management in the retail trade sector. Int. J. Qual. Reliab. Manag. 2014, 31, 718–736. [Google Scholar] [CrossRef]
  45. Gaviao, L.O.; Sant′Anna, A.P.; Lima, G.B.A.; Garcia, P.A.A.; Kostin, S.; Asrilhant, B. Selecting a Cargo Aircraft for Humanitarian and Disaster Relief Operations by Multicriteria Decision Aid Methods. IEEE Trans. Eng. Manag. 2019, 67, 631–640. [Google Scholar] [CrossRef]
  46. Sant′Anna, A.P.; Faria, F.; Costa, H.G. Aplicação da Composição Probabilística e do método das K-Médias à classificação de municípios quanto à oferta de creches. Cad. Do IME-Série Estatística 2013, 34, 17. [Google Scholar]
  47. Gavião, L.O.; Silva, R.F.d.; Sant’Anna, A.P.; Lima, G.B.A. Ordenação de Municípios por Potencial de Contaminação de Águas com Fármacos Oncológicos por Composição Probabilística de Preferências.; XLVIII Simpósio Brasileiro de Pesquisa Operacional: Vitória, Brazil, 2016; p. 12. [Google Scholar]
  48. Garcia, P.A.A.; Garcia, V.S.; Saldanha, P.L.C.; Jacinto, C.M.C. Combined use of composition of probabilistic preferences and entropy weighting for failure mode prioritization. In Proceedings of the European Safety and Reliability Conference—ESREL, Zurich, Switzerland, 7–10 September 2015; CRC Press: Boca Raton, FL, USA, 2015; pp. 381–386. [Google Scholar]
Figure 1. CPP—first stage.
Standards 03 00020 g001
Figure 2. New approach of the first stage. Abbreviations: TD (totally disagree), D (disagree), N (neutral), A (agree), TA (totally agree).
Standards 03 00020 g002
Figure 3. Histograms and densities of alternatives “A” and “B”. Abbreviations: TD (totally disagree), D (disagree), N (neutral), A (agree), TA (totally agree).
Standards 03 00020 g003
Figure 4. Histograms and densities of alternatives “K” and “M” (5-point scale). Abbreviations: TD (totally disagree), D (disagree), N (neutral), A (agree), TA (totally agree).
Standards 03 00020 g004
Figure 5. Histograms and densities of alternatives “K*” and “M*” (9-point scale). Abbreviations: TD (totally disagree), D (disagree), N (neutral), A (agree), TA (totally agree).
Standards 03 00020 g005
Table 1. Types of scales [10].
ScaleBasic Empirical OperationsPermissible Statistics
NominalDetermination of equalityNumber of cases
Mode
Contingency correlation
OrdinalDetermination of greater or lessMedian
Percentiles
IntervalDetermination of equality of intervals or differencesMean
Standard deviation
Product-moment correlation
RatioDetermination of equality of ratiosCoefficient of variation
Table 2. Pseudocode for Second Stage of the CPP.
Empirical Probabilities of Preference on Likert Scales
1. Description: ranking alternatives evaluated on a criterion
2. Variables
   >values—vector with numerical sequence of Likert scale options
   >freqs—Likert scale option frequency matrix:
       -matrix rows: problem alternatives
       -matrix columns: frequencies of Likert scale options
3. Commands
   >open the R software console
   >install the R software “mc2d” library
   >load the database “values” and “freqs”
   >run the “PMax.Emp.Likert” function, for “benefit” type criteria
   >run the “PMin.Emp.Likert” function, for “cost” type criteria
   >rank alternatives in the criteria
4. End
Table 3. Results of the second stage of the CPP.
AlternativePMaxPMin
A0.089813320.09327040
B0.156620320.16098827
C0.108038230.10993096
D0.105993130.10154487
E0.067473780.06140966
F0.070625730.07502867
G0.051763730.04871787
H0.106710080.10557457
I0.125019710.12782754
J0.117940920.11570593
Table 4. Results of the second stage of the CPP.
ScalesAlternativeMedianMeanModePMaxPMin
5 pointsK33.0550.46673570.5332673
M3330.53326730.4667357
9 pointsK*33.0550.56372780.4362749
M*3330.43627490.5637278
Table 5. Case study results.
HospitalLikert Scale
(% of Evaluations)
PMaxRank PMaxRank EbserhEbserh Result (%)
12345
CHC-UFPR819552163.09 × 10−2112166.9
CH-UFC67657254.61 × 10−23582.2
CHU-UFPA4171452132.57 × 10−2192464.3
HC-UFG7161052142.79 × 10−2152266.3
HC-UFMG411561193.66 × 10−27879.9
HC-UFPE51995892.09 × 10−2272067.3
HC-UFTM8111156142.85 × 10−2141870.1
HC-UFU8171153112.34 × 10−2212563.6
HDT-UFT01268201.21 × 10−2351077.8
HE-UFPEL2231325193.37 × 10−283444.4
HUAB-UFRN681254213.86 × 10−251572.2
HUAC-UFCG012567173.33 × 10−210681.4
HUAP-UFF102575091.99 × 10−2302957.9
HUB-UnB421853142.73 × 10−2162365.3
HUCAM-UFES39659234.27 × 10−24781.4
HU-FURG1319944163.00 × 10−2122859.4
HUGD-UFGD1728103871.59 × 10−2333544.1
HUGG-Unirio823154881.78 × 10−2313155
HUGV-UFAM112495151.47 × 10−2343254.3
HUJB-UFCG011078112.65 × 10−217188.9
HUJM-UFMT71146992.30 × 10−222978
HUL-UFS1938102951.15 × 10−2363631.8
HULW-UFPB517558152.99 × 10−2131272.7
HUMAP-UFMS71736492.22 × 10−2231372.5
HUOL-UFRN6161055132.65 × 10−2181967.8
HUPAA-UFAL61566592.20 × 10−2241671.4
HUPES-UFBA152265171.77 × 10−2323057
HUSM-UFSM29162264.82 × 10−22286.3
HU-UFJF39764173.37 × 10−291177.3
HU-UFMA1423845102.13 × 10−2263354.1
HU-UFPI37862203.82 × 10−26482.5
HU-UFS11786492.17 × 10−2251472.4
HU-UFSC72275692.06 × 10−2292663
HU-UFSCar170050336.52 × 10−21383.3
HU-UNIVASF2221350132.50 × 10−2202760.4
MCO-UFBA82106382.07 × 10−2281770.8
Disclaimer/Publisher’s Note: The statements, opinions and data contained in all publications are solely those of the individual author(s) and contributor(s) and not of MDPI and/or the editor(s). MDPI and/or the editor(s) disclaim responsibility for any injury to people or property resulting from any ideas, methods, instructions or products referred to in the content.

