Article

Flood–Ebb and Discharge Variations in Observed Salinity and Suspended Sediment in a Mesotidal Estuary

Department of Civil and Disaster Prevention Engineering, National United University, Miaoli 360302, Taiwan
*
Author to whom correspondence should be addressed.
Standards 2022, 2(2), 209-225; https://doi.org/10.3390/standards2020016
Submission received: 7 February 2022 / Revised: 8 May 2022 / Accepted: 9 May 2022 / Published: 7 June 2022
(This article belongs to the Special Issue Feature Papers to Celebrate the Inaugural Issue of Standards)

Abstract

:
To explore the spatial and temporal variations in salinity and suspended-sediment concentration in the Danshuei River estuary of northern Taiwan, two intensive field surveys were conducted in July 2016 and 2019 to assign high- and low-flow conditions, respectively. According to the analysis of tidal characteristics, the duration during ebb tide was longer than that during flood tide, while the maximum ebb discharge was higher than the maximum flood discharge, causing the occurrence of tidal asymmetry during ebb and flood tides. The barotropic forcing dominated during high flow, resulting in lower salinity and a shorter distance of saltwater intrusion. Based on the analyzed results using stratification indices, most of the time was spent in the state of partial mixing at the Guandu Bridge and good mixing at the Taipei Bridge during high flow, while most of the time was spent in the states of partial mixing and good mixing at both Guandu Bridge and Taipei Bridge during low flow. More stratification occurred during high flow at high slack tide compared to that during low flow. The freshwater discharges from upriver reaches controlled the suspended-sediment concentration (SSC) in tidal estuaries. The higher SSC appeared downstream of the tidal estuary at ebb tide during high flow. Observations also revealed that there was an estuarine turbidity maximum at the bottom layer of Guandu Bridge.

1. Introduction

Estuaries and tidal rivers are often densely populated and well-developed commercial areas because of their abundant water, convenient shipping, and high water-use value. Many famous ports such as Shanghai, Baltimore, and Hamburg, and national capitals such as Washington, London, and Taipei are all located in estuaries or tidal rivers. In the second half of the last century, due to the development of industry and commerce, the large population concentration, and the high utilization of rivers by humans, the water bodies of many estuaries and tidal rivers have become overloaded. Not only have the aquatic environment and water resources been destroyed, but they can even cause serious pollution. Poor water quality seriously affects human health and urban landscapes and even results in ecosystem destruction [1,2,3,4].
Tidal rivers are transitional waters where rivers flow into the ocean. This transitional water system connects rivers and oceans with two different characteristics. In the tidal reach, the dynamic factors of the ocean and the river both exist and act at the same time, forming a special process of riverbed evolution. The salt-intrusion section in the lower reaches of the tidal river is called the estuary. Generally, among the various dynamic factors in the estuary area, the main effect is dominated by the freshwater discharge and the tide of the river. In each section of the tidal river, the magnitude of the main effect caused is different because of changes in topography, landform, and river course. Therefore, estuaries are all intertwined with the characteristics of physics, biogeochemistry, and ecology [5,6,7,8,9].
The hydrodynamic conditions of estuaries and tidal rivers possess the characteristics of inland rivers, in which freshwater discharge is subject to seasonal variations during flood and dry periods, and oceanic characteristics, such as the rise and fall of tides and variations in spring and neap tides, and the impact of wind shear on velocity fields. In the estuarine area, due to the interaction of freshwater and seawater, there are other issues, such as estuarine circulation, salt and freshwater mixing, and saltwater intrusion, which are far more complicated than streams and rivers. Therefore, to understand the water quality of estuaries and tidal rivers, understanding the hydrodynamics in estuaries and tidal rivers, including freshwater discharge, tidal fluctuations, saltwater intrusion, and salt and freshwater mixing, is a necessary first step [10,11,12,13,14,15,16,17,18].
In addition to salt intrusion in tidal estuaries, sediment transport is also an important physical phenomenon. Dynamic estuarine processes dominate the distribution and transport of suspended sediment. Understanding suspended-sediment transport is of crucial importance for monitoring water quality and predicting the impacts of suspended sediment on marine ecosystems, particularly the occurrence of estuarine turbidity maxima (ETM) in tidal estuaries [19,20,21,22,23,24,25].
Researchers have developed several different kinds of models to investigate the hydrodynamics, salt intrusion, and suspended sediment in tidal estuaries [26,27,28,29,30,31]. Before the development and application of numerical models, field observations to collect model-validation data are essential [32,33,34]. Hsu et al. [35] conducted monthly field surveys in the Danshuei River estuary in 2003. They found that the water column (i.e., salinity) was well mixing at the slack before ebb (SBE) and highly stratified at the slack before flood (SBF) at the river mouth. The water column was highly stratified both at the SBE and SBF at the Guandu Bridge. A local turbidity maximum in the bottom water at the Guandu Bridge occurred resulting from deep depression of the bathymetric feature.
Based on field measurements to collect in situ datasets during low- and high-flow conditions, the main objective of this study was to investigate the variations in salinity and suspended-sediment concentration that are subjected to the effects of flood–ebb and freshwater discharge in the Danshuei River estuary of northern Taiwan and to reinforce the possibility of applying hydrodynamic and sediment transport models.

2. Materials and Methods

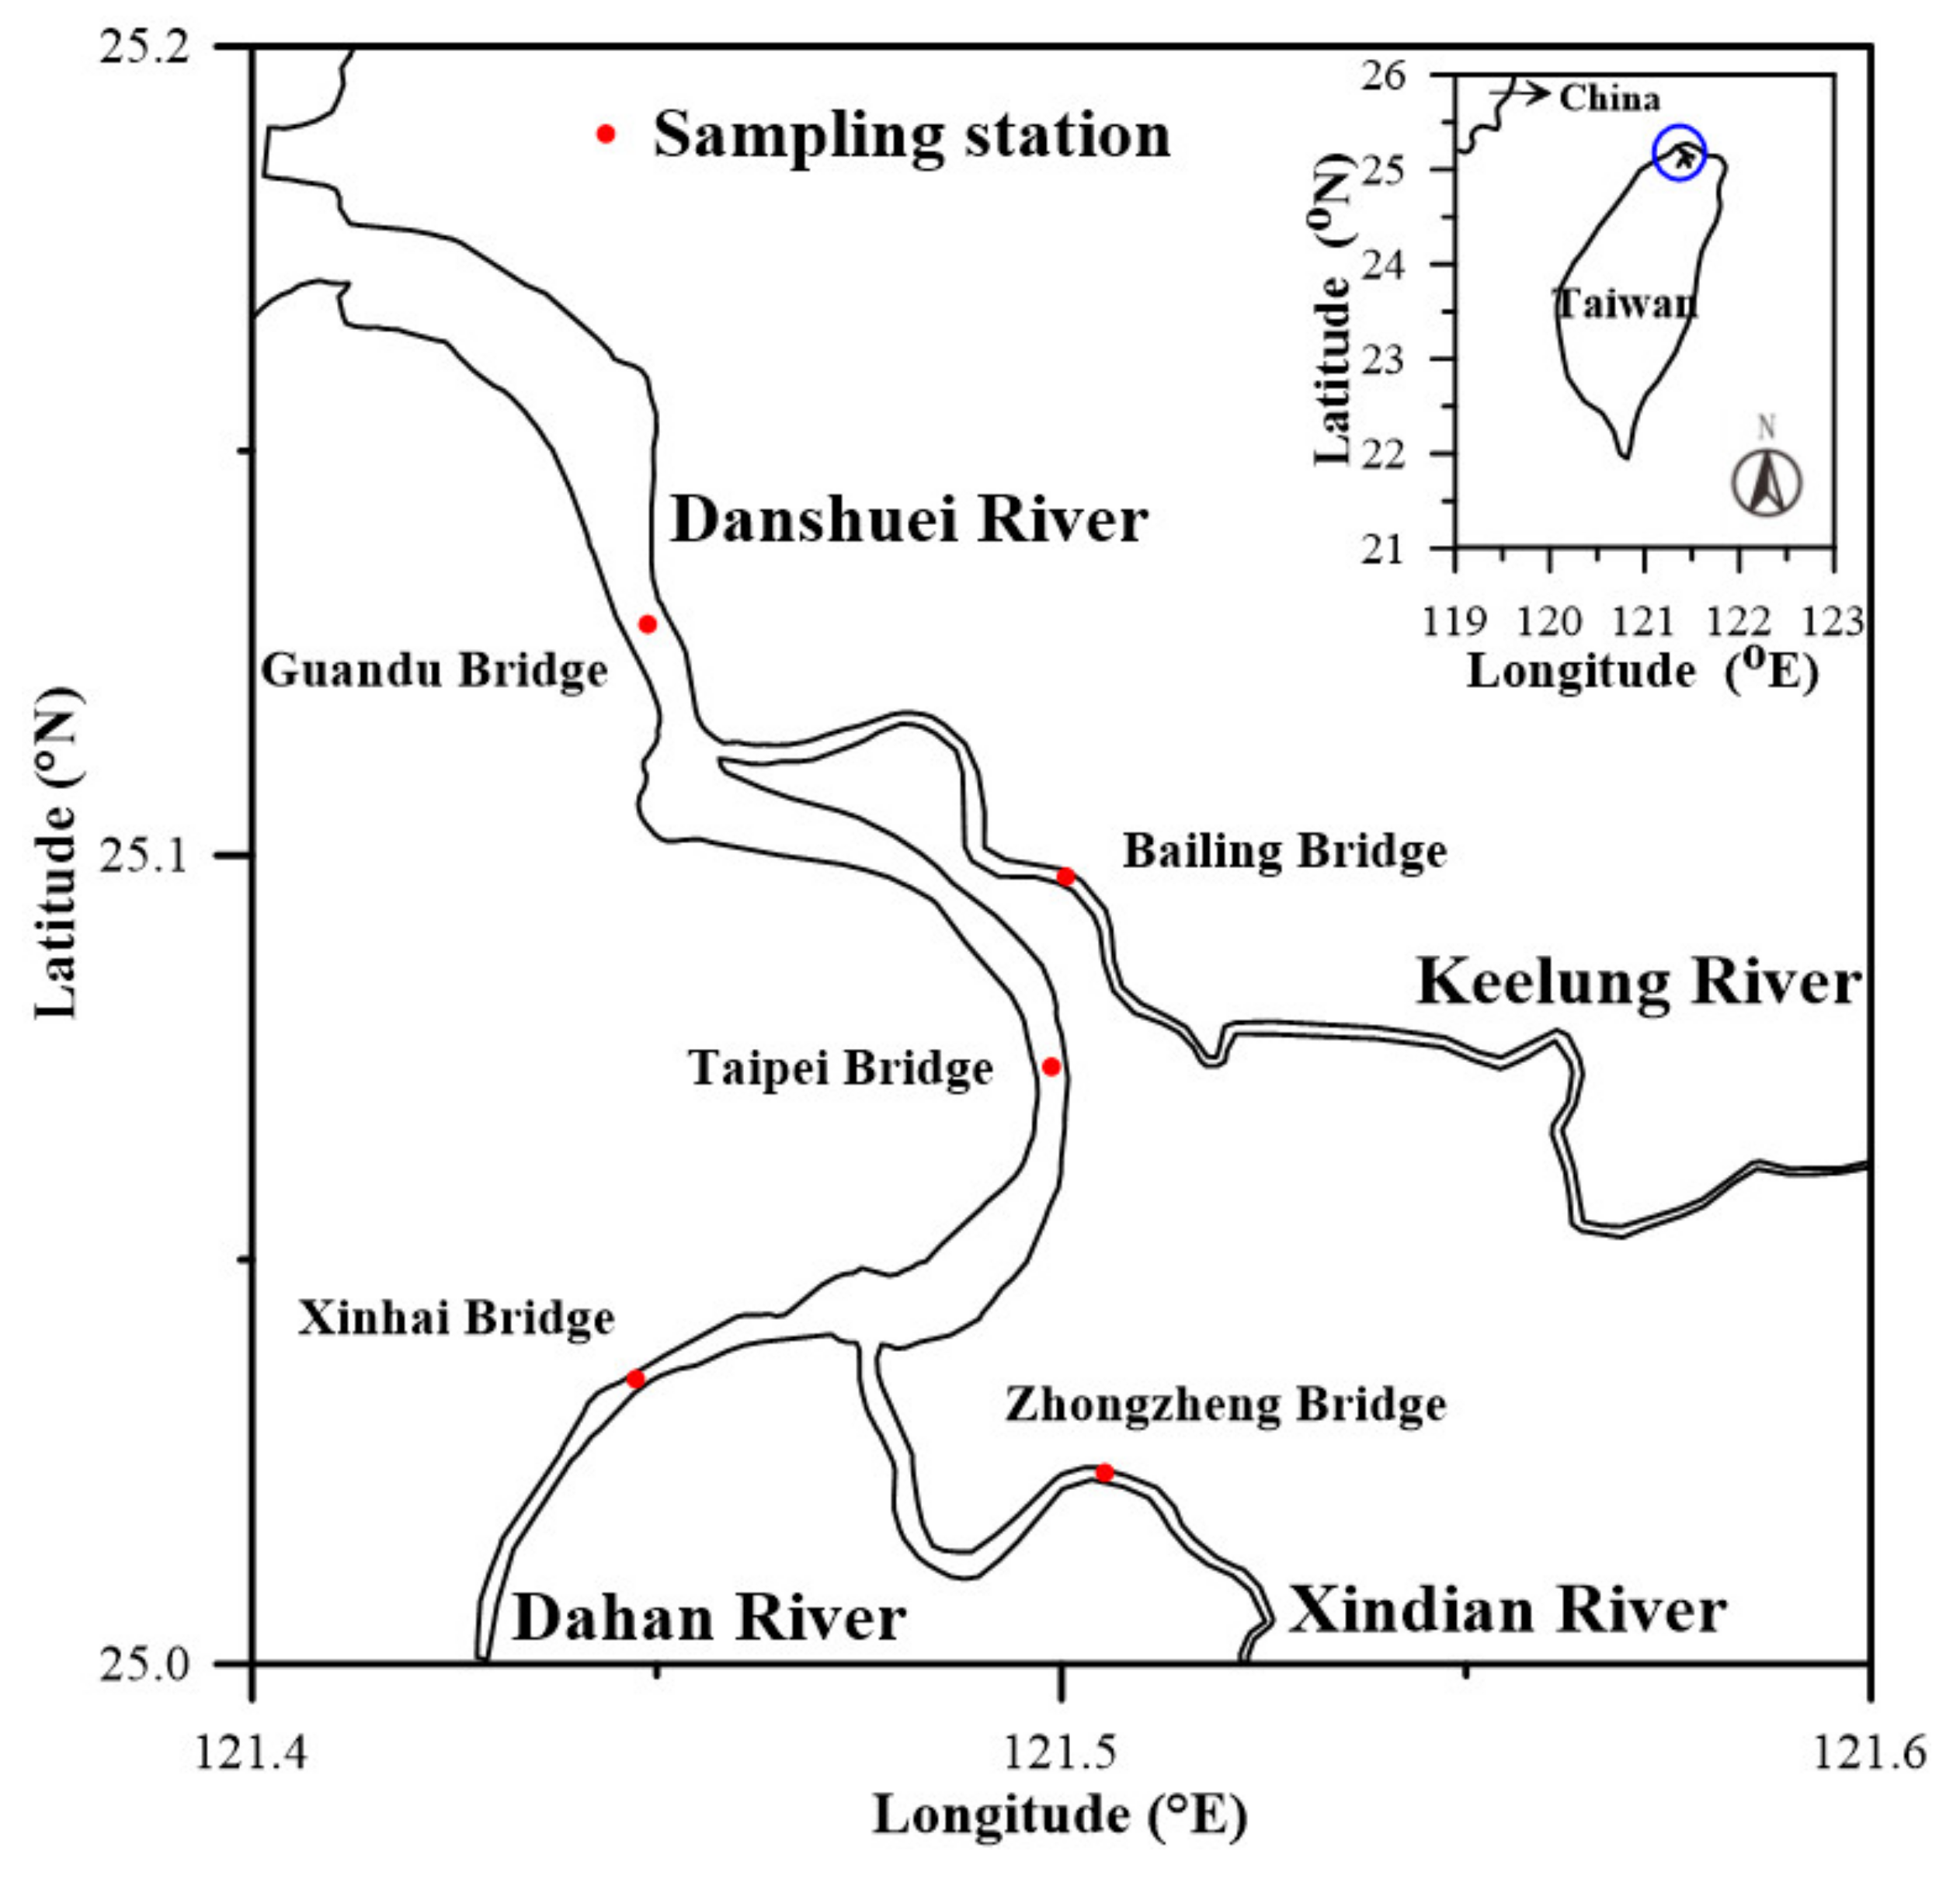
2.1. Description of Study Area

The study area is located in the Danshuei River estuary, which is the largest tidal river in northern Taiwan and consists of three major tributaries, including the Dahan River, Xindian River, and Keelung River (see Figure 1). The watershed area of the Danshuei River is 2728 km2, and the total river length is approximately 327.6 km. The mean river discharges of the Dahan River, Xindian River, and Keelung River are 38.99 m3/s, 69.73 m3/s, and 25.02 m3/s, respectively. A Q75 flow equal to or exceeding 75% of time is defined as the low-flow condition. The Q75 river discharges at the three tributaries are 3.74 m3/s, 11.6 m3/s, and 3.5 m3/s, respectively [36].
The tidal power of the Danshuei River originates from the open sea, and the tidal wave propagates upstream from the river mouth. The tidal elevation is mainly dominated by semidiurnal tides (M2 and S2), the mean tidal range is approximately 2.22 m, and the spring tidal range reaches 3.1 m [37].
The salinity distribution of the Danshui River is mainly affected by tidal variations, and the limit of salt intrusion of each tributary is quite different during the slack before ebb and the slack before flood. In addition, the salinity distribution is also controlled by the river discharge and moves upstream and downstream accordingly [38]. Suspended particles in water bodies are affected by tides and salinity. The position of the turbidity maximum in suspended sediments is often located at the Guandu Bridge and upstream reaches, which are approximately 20 km away from the river mouth in the Dahan River and approximately 23 km away from the river mouth in the Keelung River. In the upstream reaches, the cause of the turbidity maximum would be closely related to the limit of salt intrusion, where the residual current is close to zero, allowing the suspended sediment to settle more easily. The other reason would be a high concentration of suspended sediment carried by the upstream reaches. The deep riverbed and the strong residual circulation that occurred at Guandu Bridge resulted in a turbidity maximum [35].

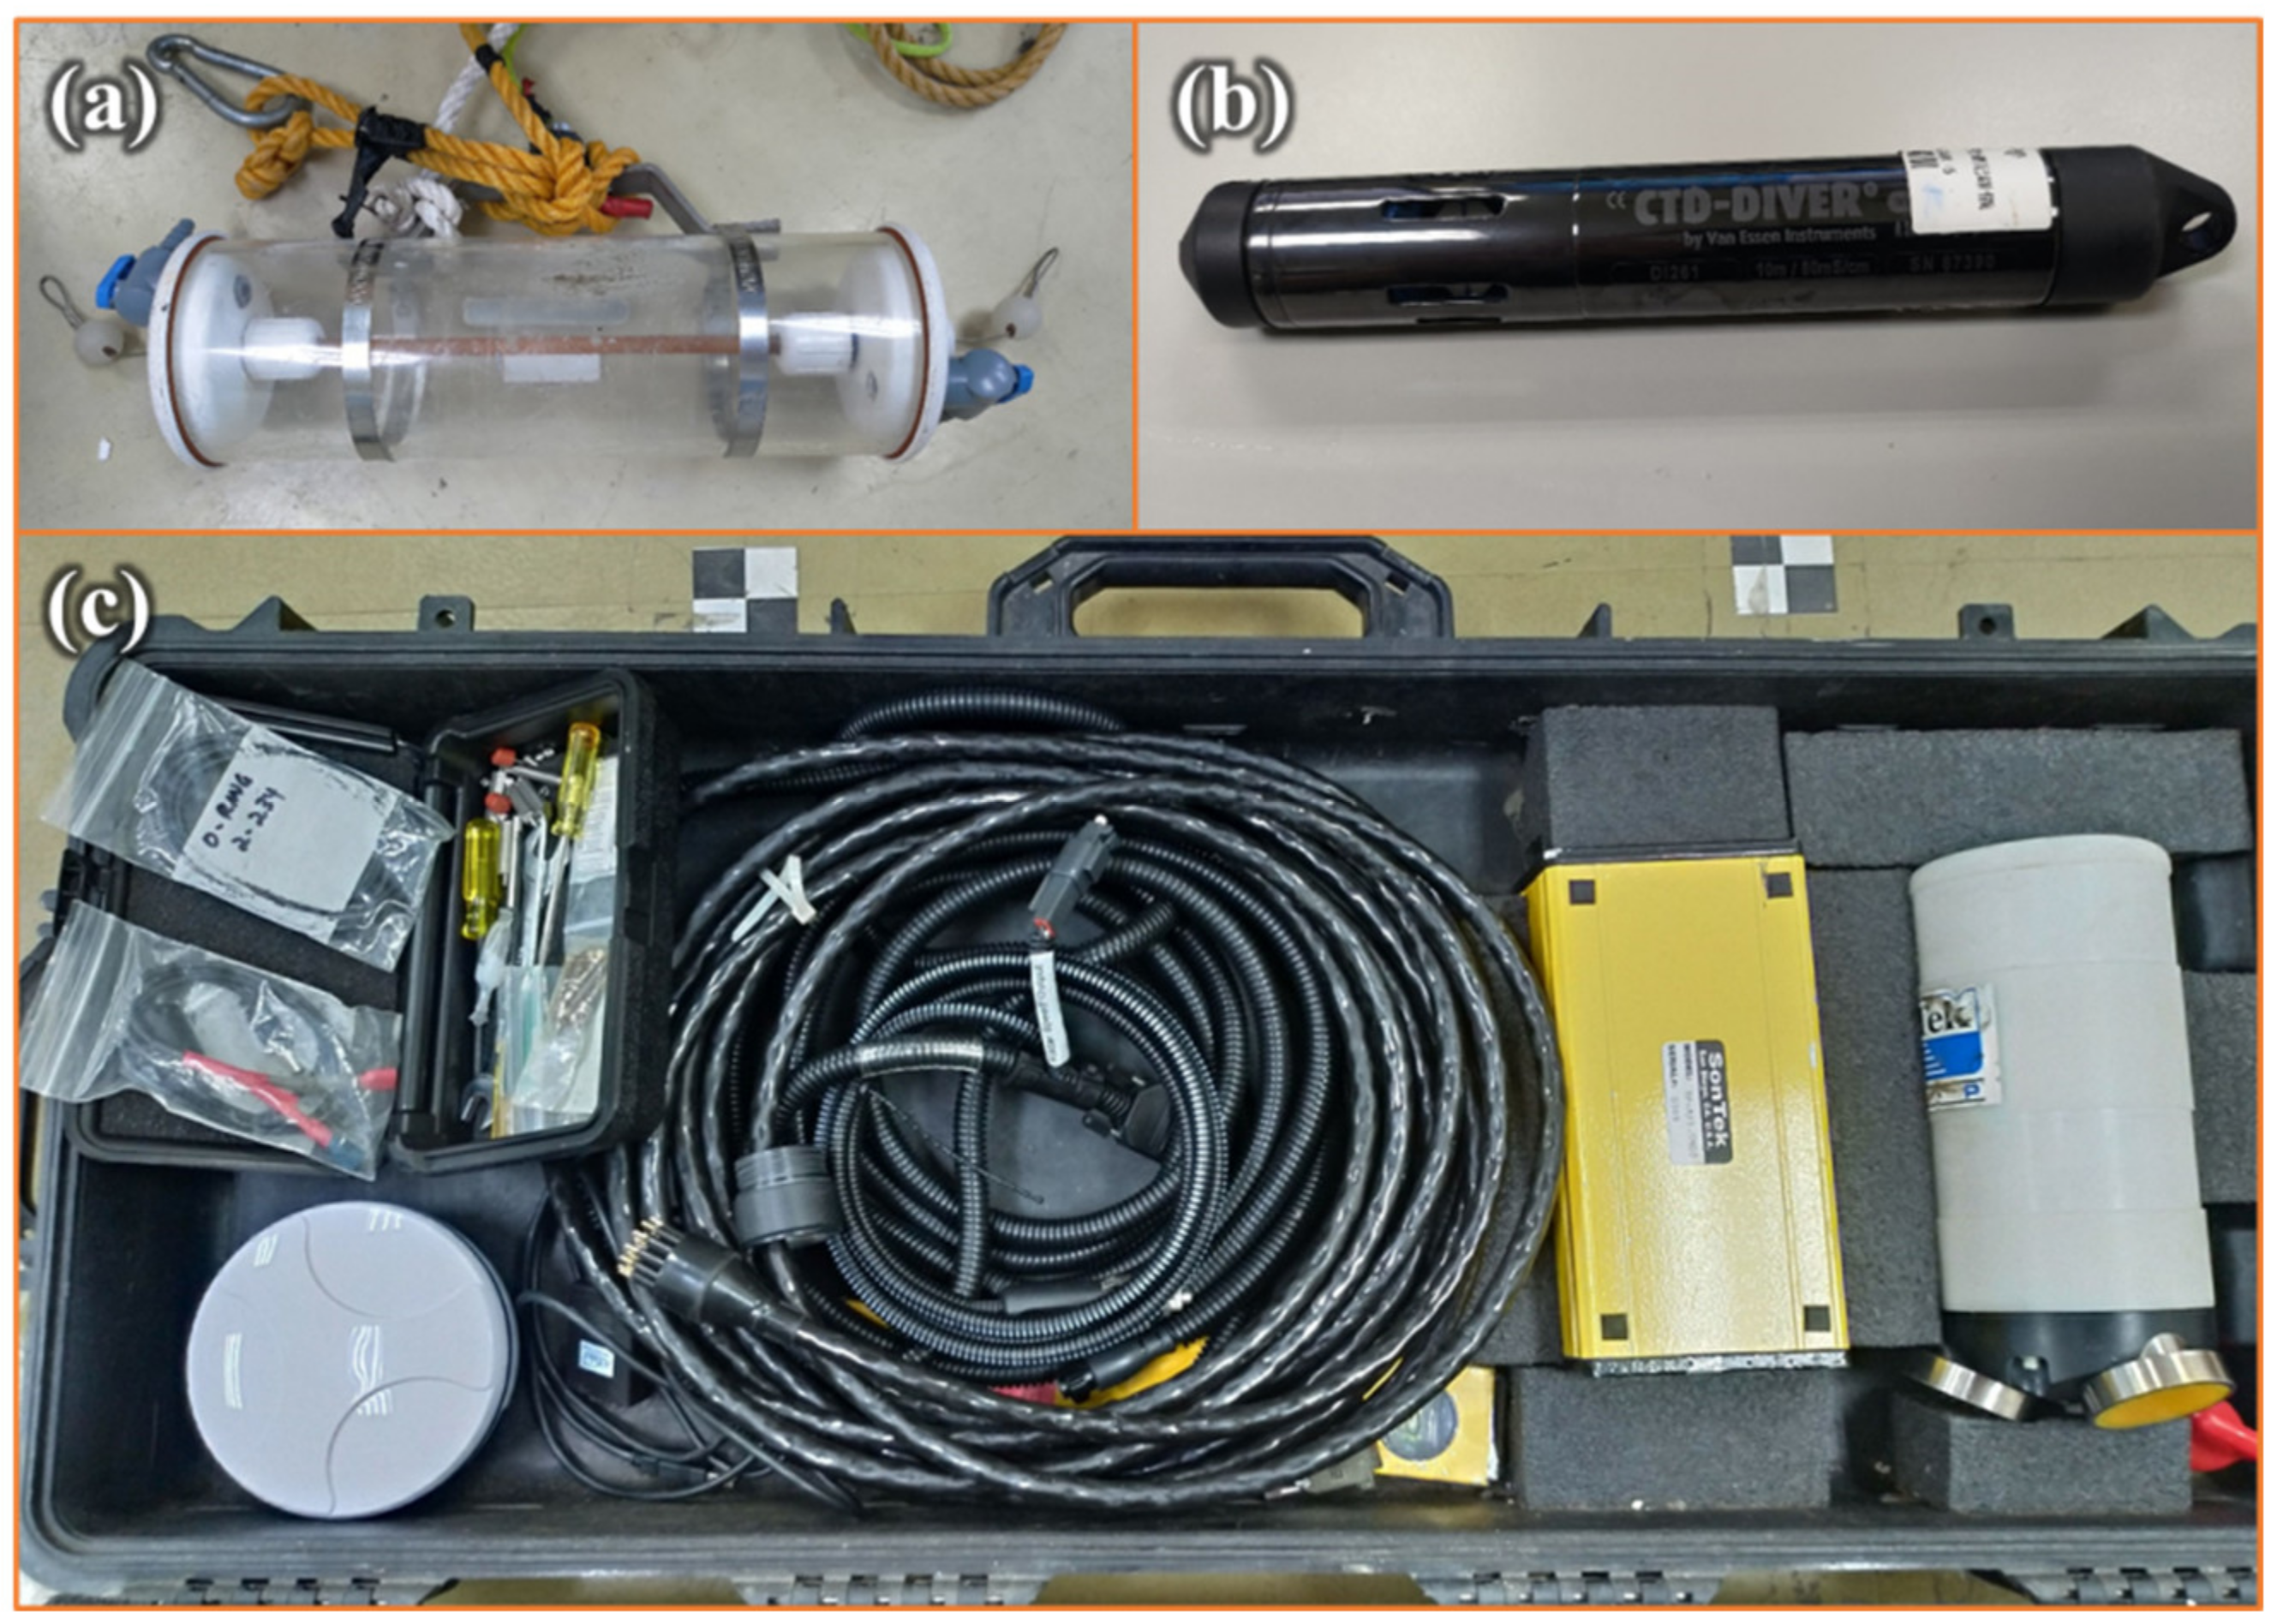
2.2. Field Survey and Data Collection

Two intensive field measurements at five transects were taken on 4 July 2016, and 17 July 2019, to represent high-flow and low-flow periods. The freshwater discharges from the upstream reaches of the Dahan River, Keelung River, and Xindian River were 23.75 m3/s, 6.48 m3/s, and 135.91 m3/s, respectively, during high flow and 4.3 m3/s, 3.28 m3/s, and 19.6 m3/s, respectively, during low flow. Because the total river discharge (i.e., 166.14 m3/s) from the tributaries on July 4, 2016 was higher than the total river discharge with mean river discharge (i.e., 133.74 m3/s), the river discharges on 4 July 2016 were recognized as the high-flow condition. The total river discharge (i.e., 28.17 m3/s) on 17 July 2019 was similar to the Q75 low-flow condition, therefore this date was regarded as the low-flow period. The measured stations covered the Guandu Bridge, Taipei Bridge, and Xinhai Bridge in the Danshuei River/Dahan River, the Bailling Bridge in the Keelung River, and the Zhongzheng Bridge in the Xindian River. The survey periods of two intensive field measurements were from 4 am to 8 pm and the measurement was conducted every hour.
The water samples for total suspended-solid (TSS) concentration and salinity were collected in the field and measured in the laboratory. The sample for TSS was mixed by shaking and then filtered using a weighted standard glass-fiber (0.7 µm pore size) filter. The residue retained on the filter was dried to constant weight at 103 °C to 105 °C. The increase in weight of the filter was assumed to represent the TSS [39]. The vertical salinity was measured with a conductivity–temperature–depth (CTD) sensor for each intensive survey. During each survey, a 600 Hz acoustic Doppler current profiler (ADCP) (RD Instrument, Inc. Poway, CA, USA) was used to measure velocity. The RiverSurveyor Live software was used for data repossessing of ADCP. Figure 2 illustrates the instrumentation photographs used in the field survey.

2.3. Stratification Indices

Three stratification indices were utilized in this study to assess the stratification conditions according to the measured salinity and SSC in an estuary: the salinity stratification parameter (N), the bulk/layer Richardson number, RiL, and the gradient Richardson number, Rig.
  • Salinity stratification parameter (N)
An acceptable definition of an estuarine stratification parameter based on the vertical structure of salinity proposed by Hansen and Rattray [40] is widely used. The parameter is a nondimensional index that can be defined as:
N = S b o t t S s u r f S m
where Ssurf and Sbott denote the salinity at the surface and bottom layers, respectively, and Sm is the average salinity between the surface and bottom layers (= 1 2 ( S s u r f + S b o t t ) ). Prandle [41] defined that when the stratification index (N) is less than 0.1, it represents a well-mixed water column. When the N value ranges between 0.1 and 1.0, the column is partially mixed. A water column with an N value greater than 1 is highly stratified in the presence of a salt wedge.
2.
Bulk/layer Richardson number (RiL)
The velocity and density data were used to estimate the layered Richardson number (RiL), quantitatively identifying the mixing condition through the water column. The number can be defined as follows.
R i L = g h ρ b o t t ρ s u r f u ¯ 2 ρ
where ρ s u r f and ρ b o t t denote the water densities at the surface and bottom layers, respectively, h represents the water depth, g is the gravitational acceleration, u ¯ expresses the depth averaged velocity, and ρ denotes the water density containing salinity and suspended sediments (= ρ 0 + 0.78   S + 0.62   C , ρ 0 = 1000   kg / m 3 ) [42]. When the RiL value is less than 2, strong mixing occurs; when the RiL value ranges between 2 and 20, it indicates a density interface that is modified by mixing; when the RiL value is greater than 20, stable density stratification without mixing occurs [43].
3.
Gradient Richardson number (Rig)
The gradient Richardson number, Rig, is another parameter used to assess the state of mixing/stratification of a fluid. This parameter can be written as
R i g = g ρ z ρ ( u z ) 2
where ρ z denotes the vertical gradient of density and u z expresses the vertical gradient of horizontal velocity. Miles [44] and Geyer and Smith [45] recommended that when the Rig value is greater than 0.25, a stable salinity stratification is present. When the Rig value is less than 0.025, the water column tends to experience tidal mixing.

2.4. Barotropic and Baroclinic Modes

To examine the mechanics between incoming tide and river discharge, two terms affecting the water motion in the momentum balance equation, the barotropic and baroclinic pressure gradients, are explored. To evaluate the dominant term, barotropic and baroclinic pressure gradients must be separated to estimate their relative effect on the water motion. These two terms can be defined as follows:
1 ρ 0 p x = g η x + g ρ 0 [ z η ρ x d z ]
where x denotes the along-channel direction, z expresses the vertical direction, η represents the water surface elevation, and p is the water pressure. In Equation (4), the barotropic term is g η x and the baroclinic term is g ρ 0 [ z η ρ x d z ] .

3. Results

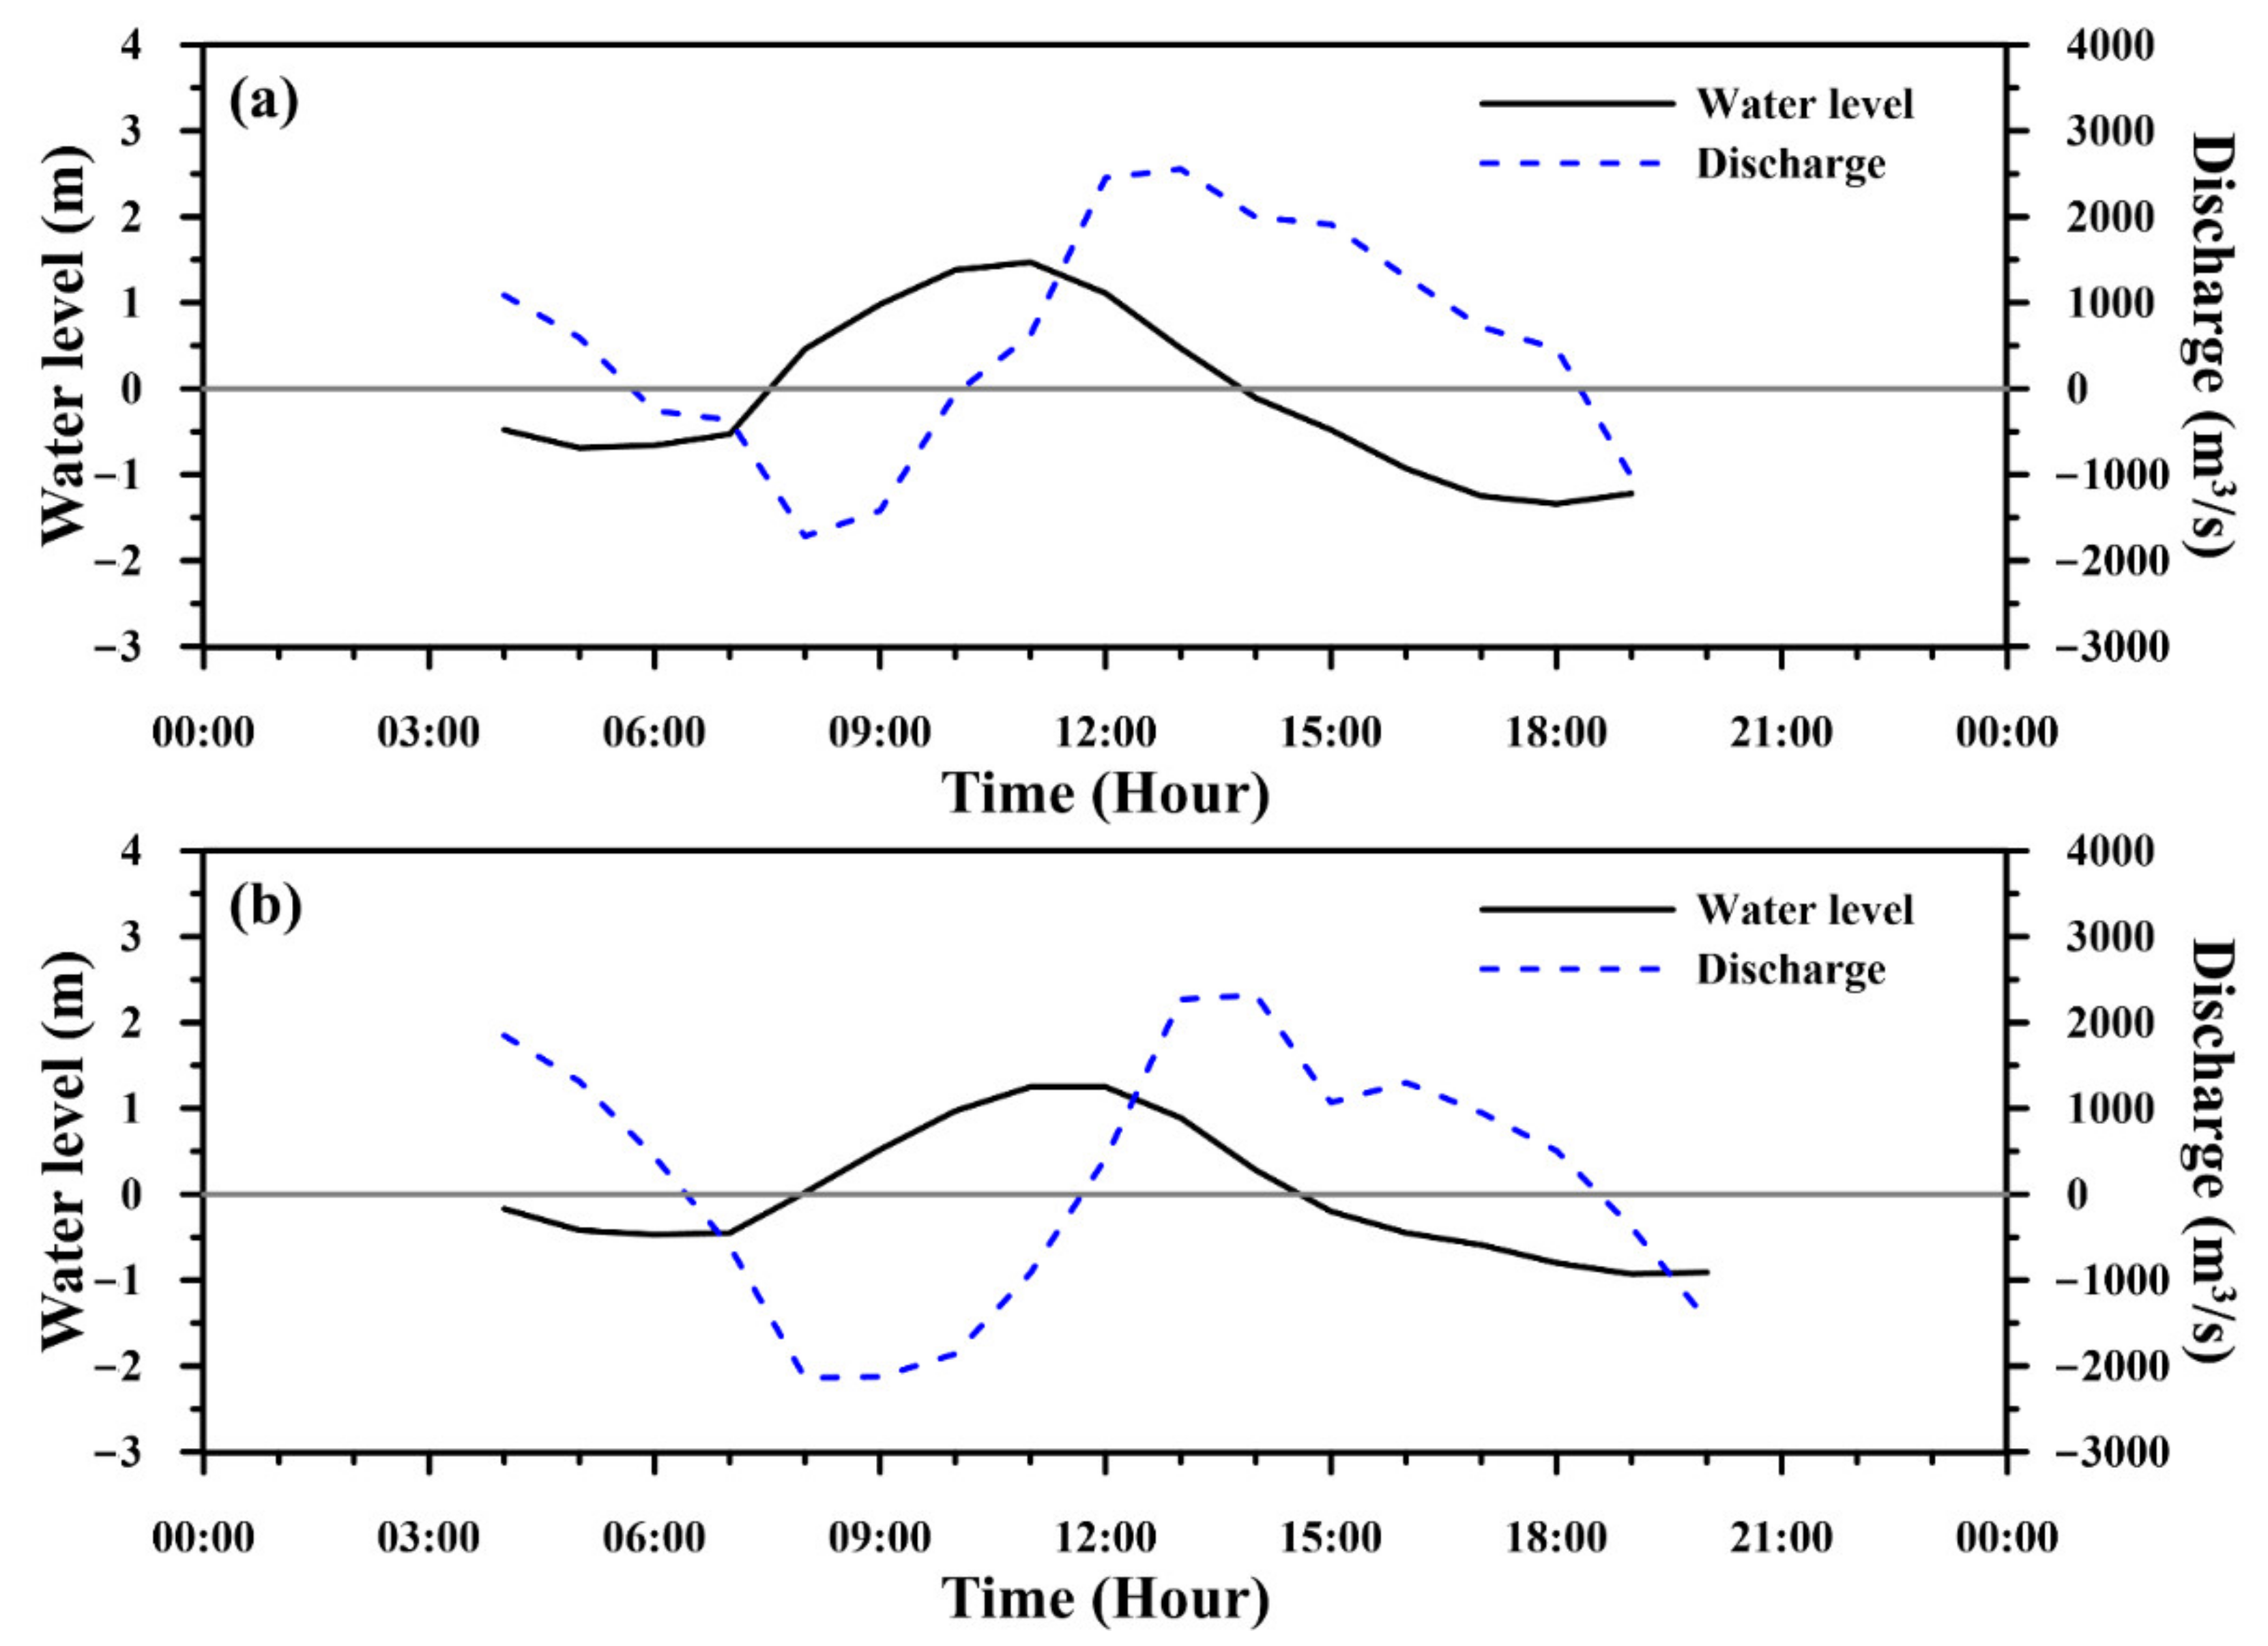
3.1. Tidal Characteristics

Tidal dynamics play a crucial role in influencing the salinity and SSC at various temporal and spatial scales. Therefore, the tidal characteristics should be explored and analyzed first. According to the water level and discharge collected at the Guandu Bridge during low- and high-flow periods, the different tidal dynamics on 4 July 2106 and 17 July 2019 are illustrated in Figure 3. The duration during ebb tide was longer than that during flood tide, and the maximum ebb discharge was higher than the maximum flood discharge. The tidal asymmetry occurring during ebb and flood tides is caused by the interaction between the tidal effect and river flow [46]. The duration of ebb tide on 4 July 2016 was longer compared to that on 17 July 2019 because of the higher river flow.
The barotropic term (i.e., 4.14 × 10⁴ m/s2) was larger than the baroclinic term (i.e., 1.45 × 10⁻⁴ m/s2) on July 4, 2016 during high flow, resulting in a longer ebb tide, while the barotropic term (i.e., 1.29 × 10⁻⁴ m/s2) was smaller than the baroclinic term (i.e., 1.7 × 10⁻⁴ m/s2) on 19 July 2019 during low flow, causing a relatively shorter ebb tide (Figure 3).

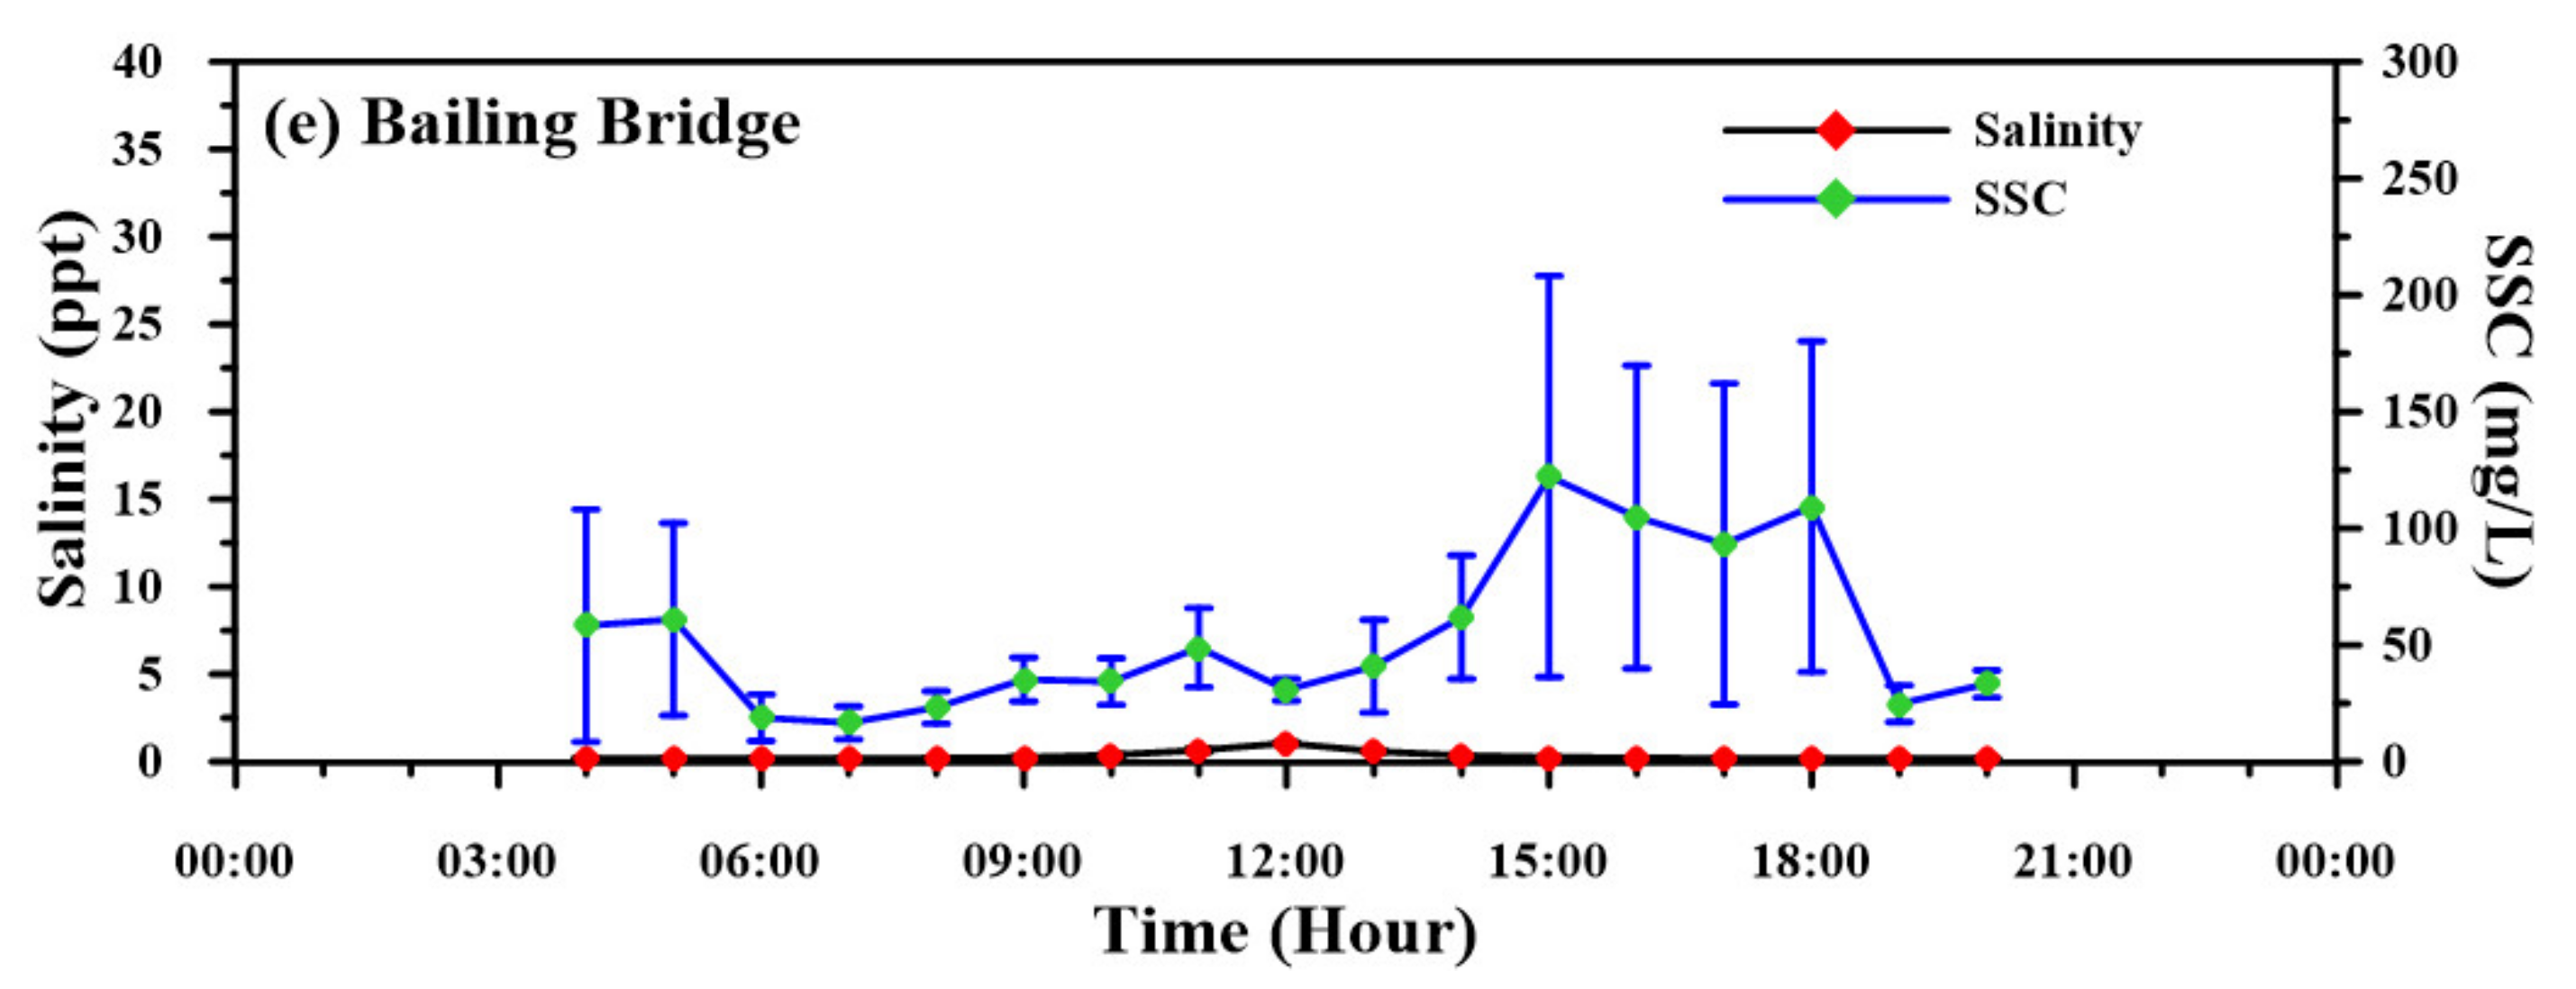
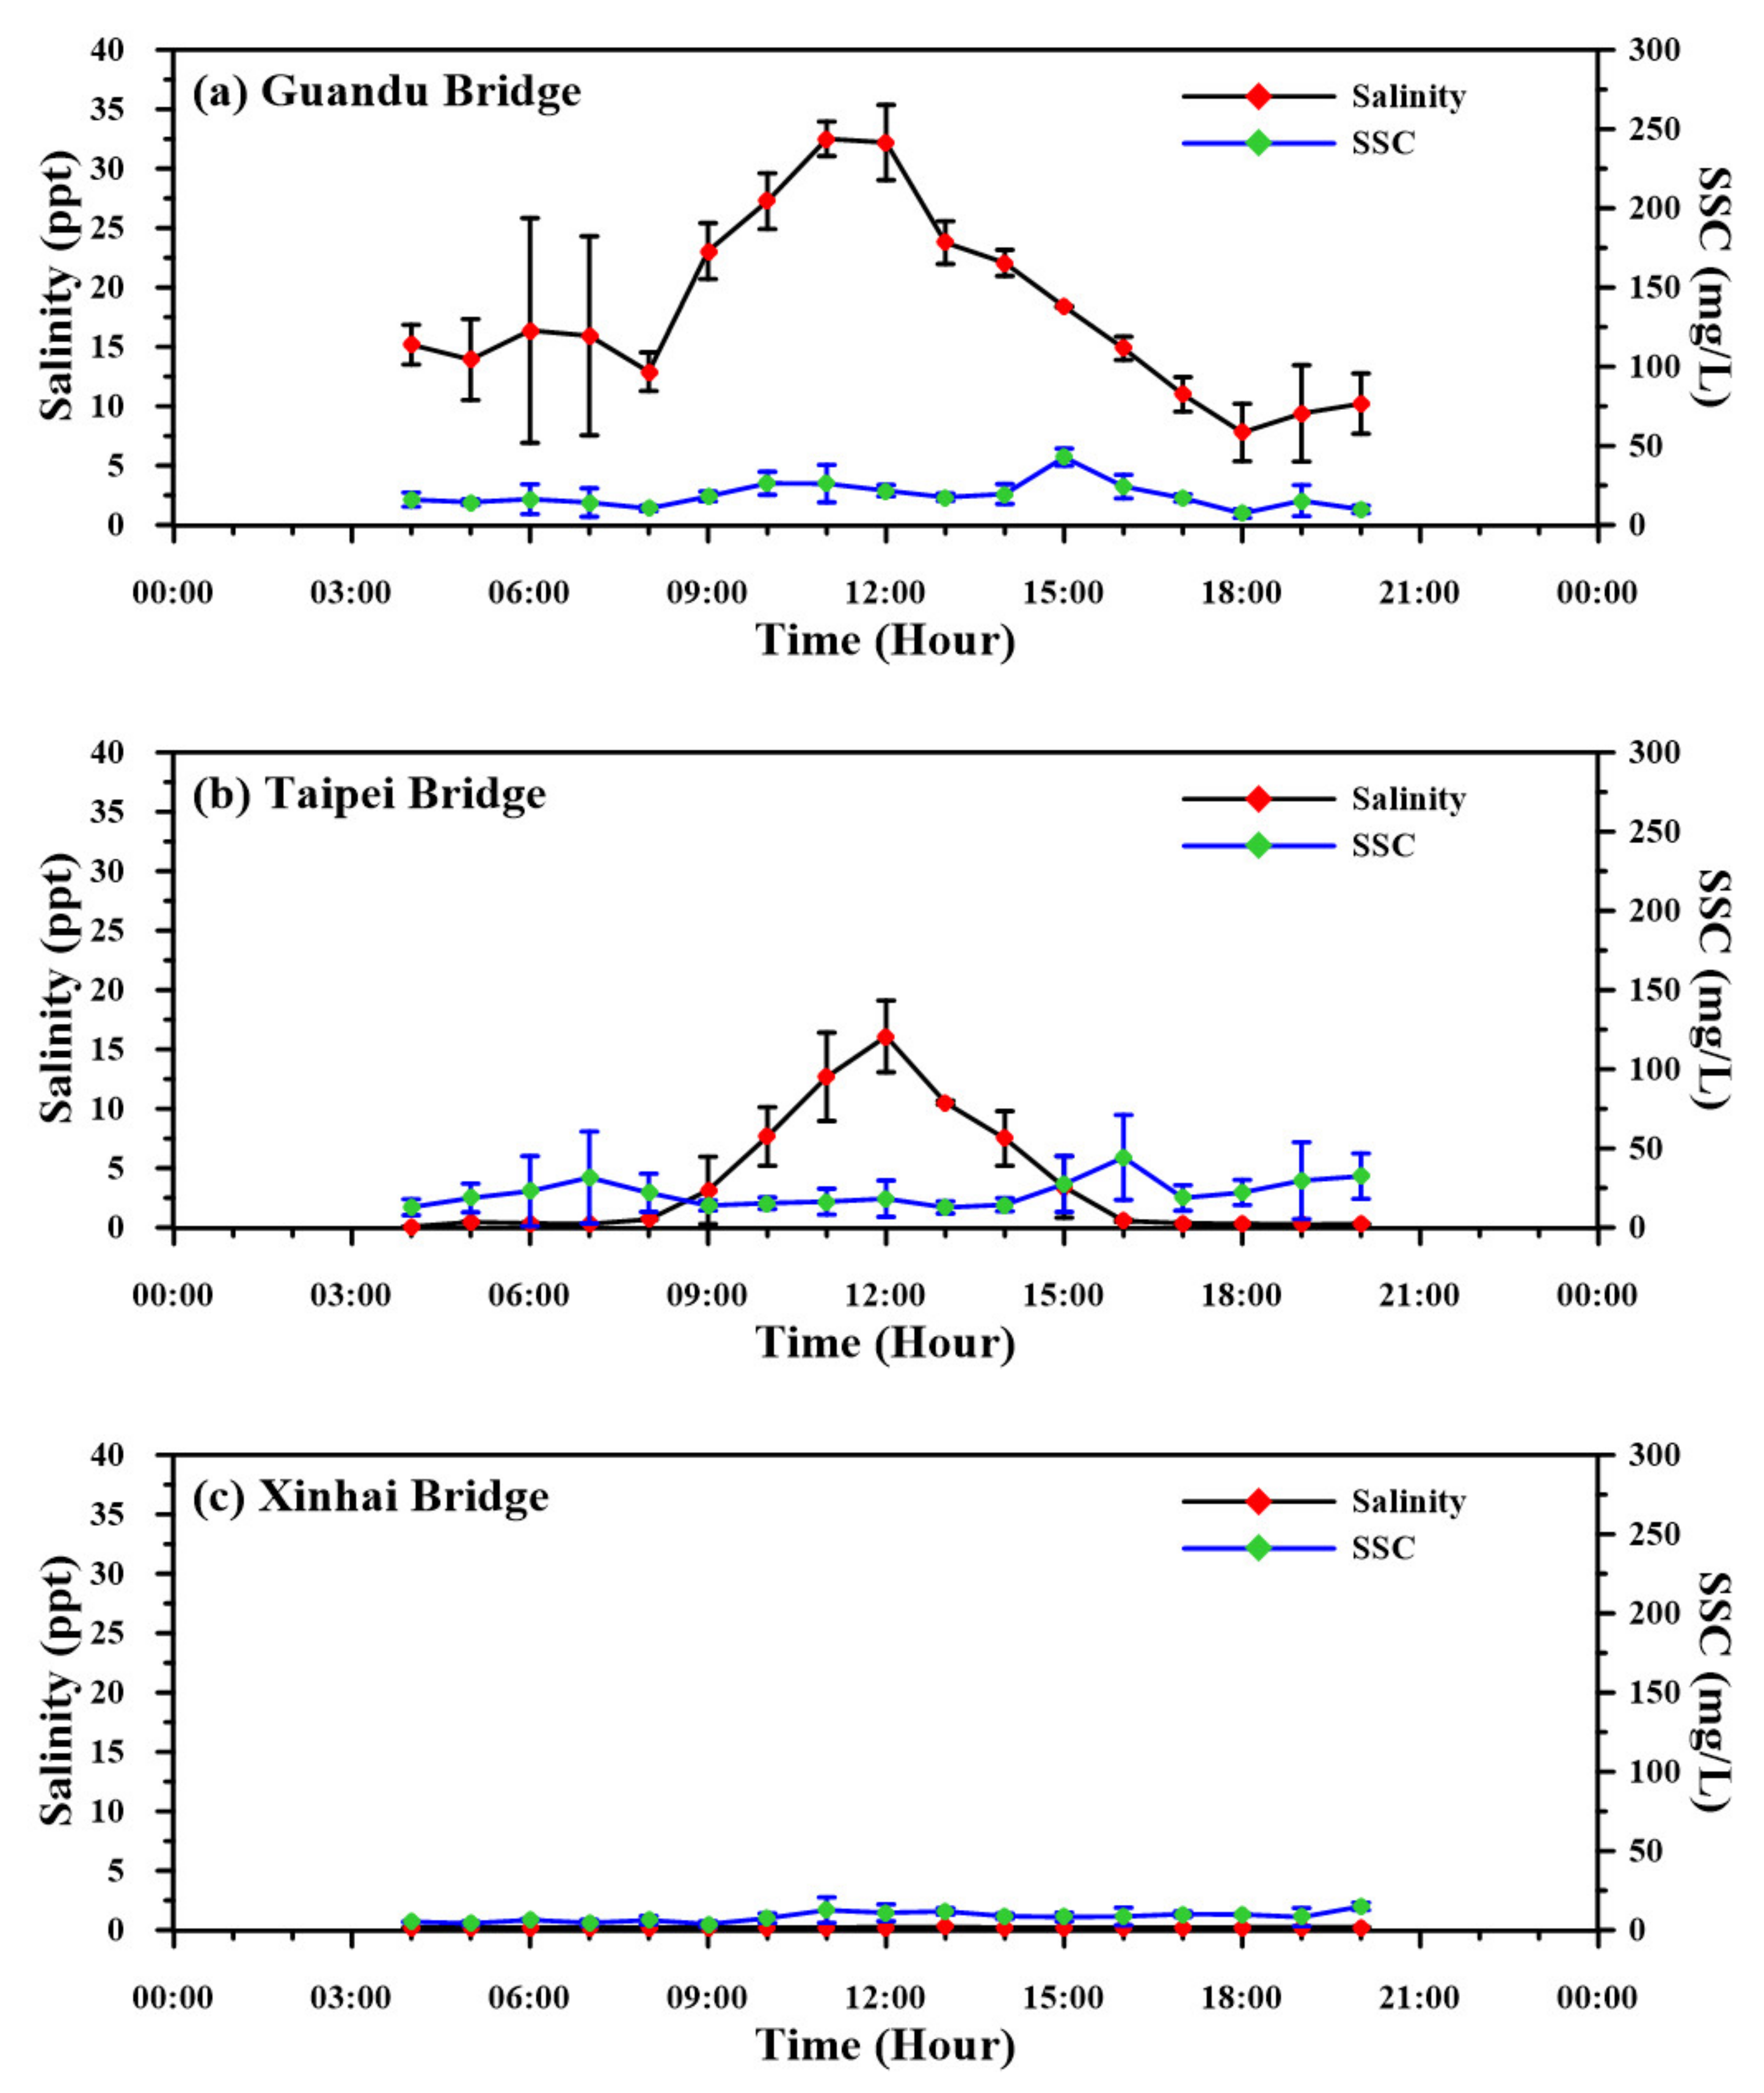
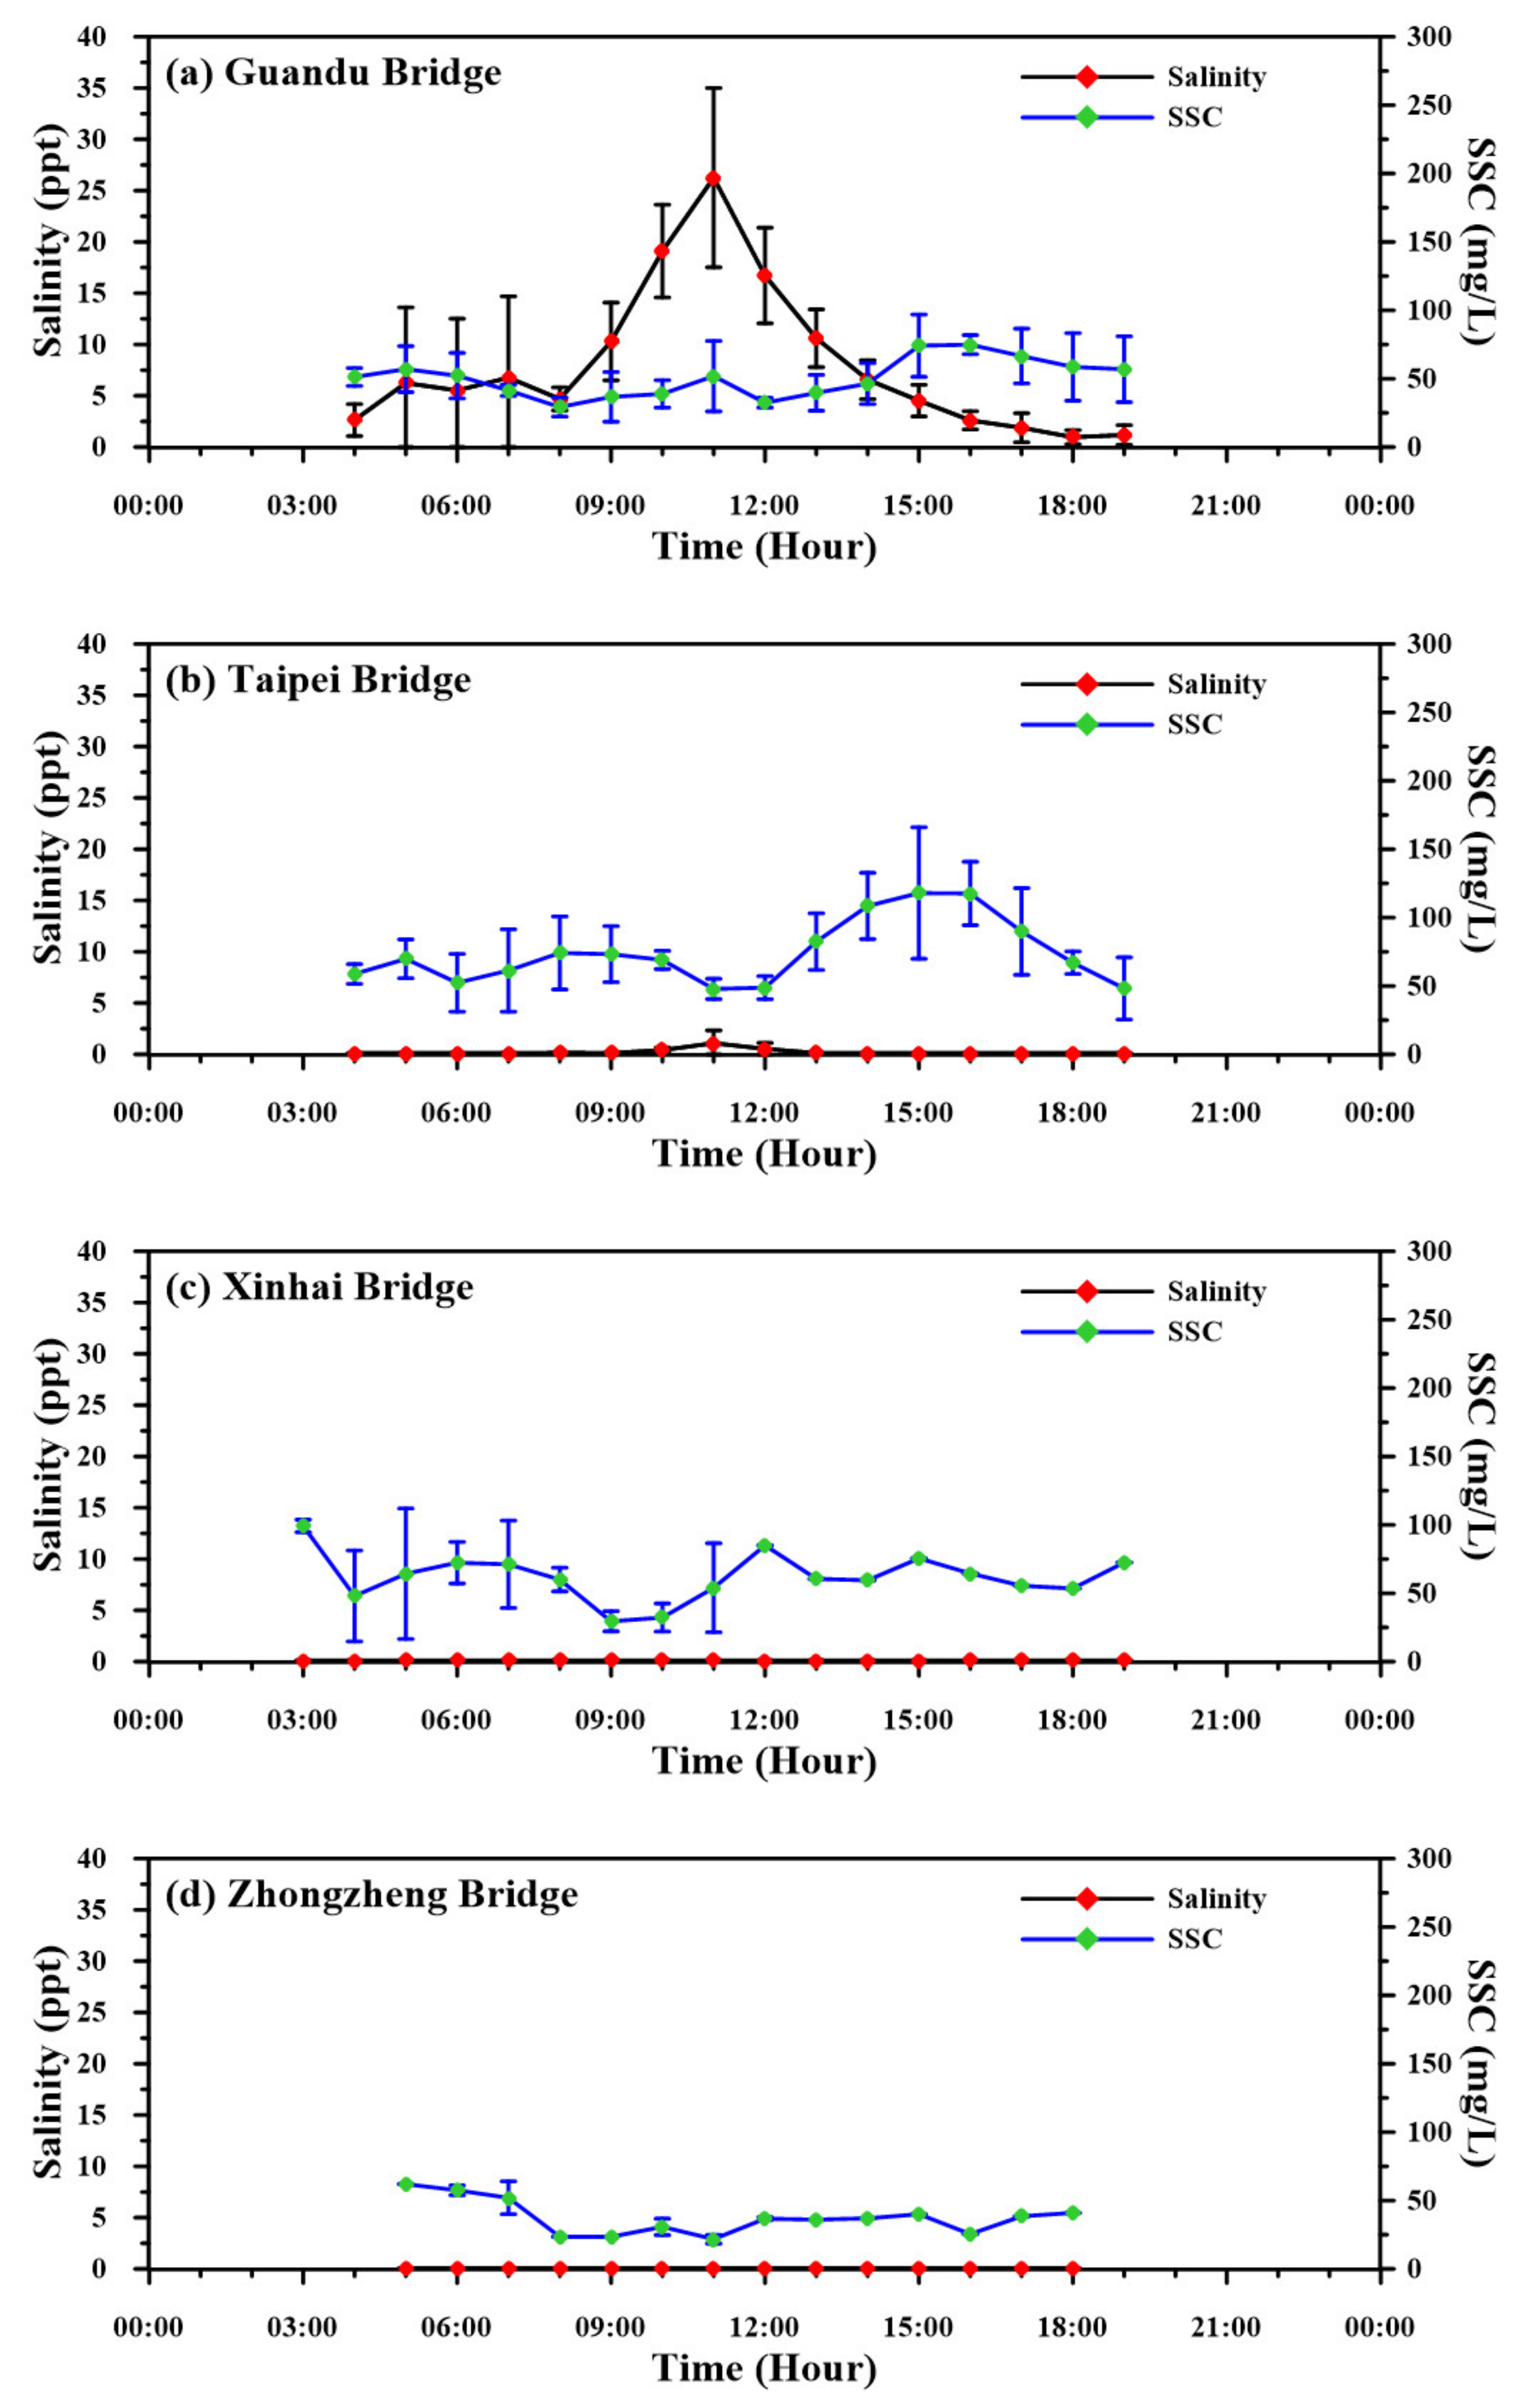
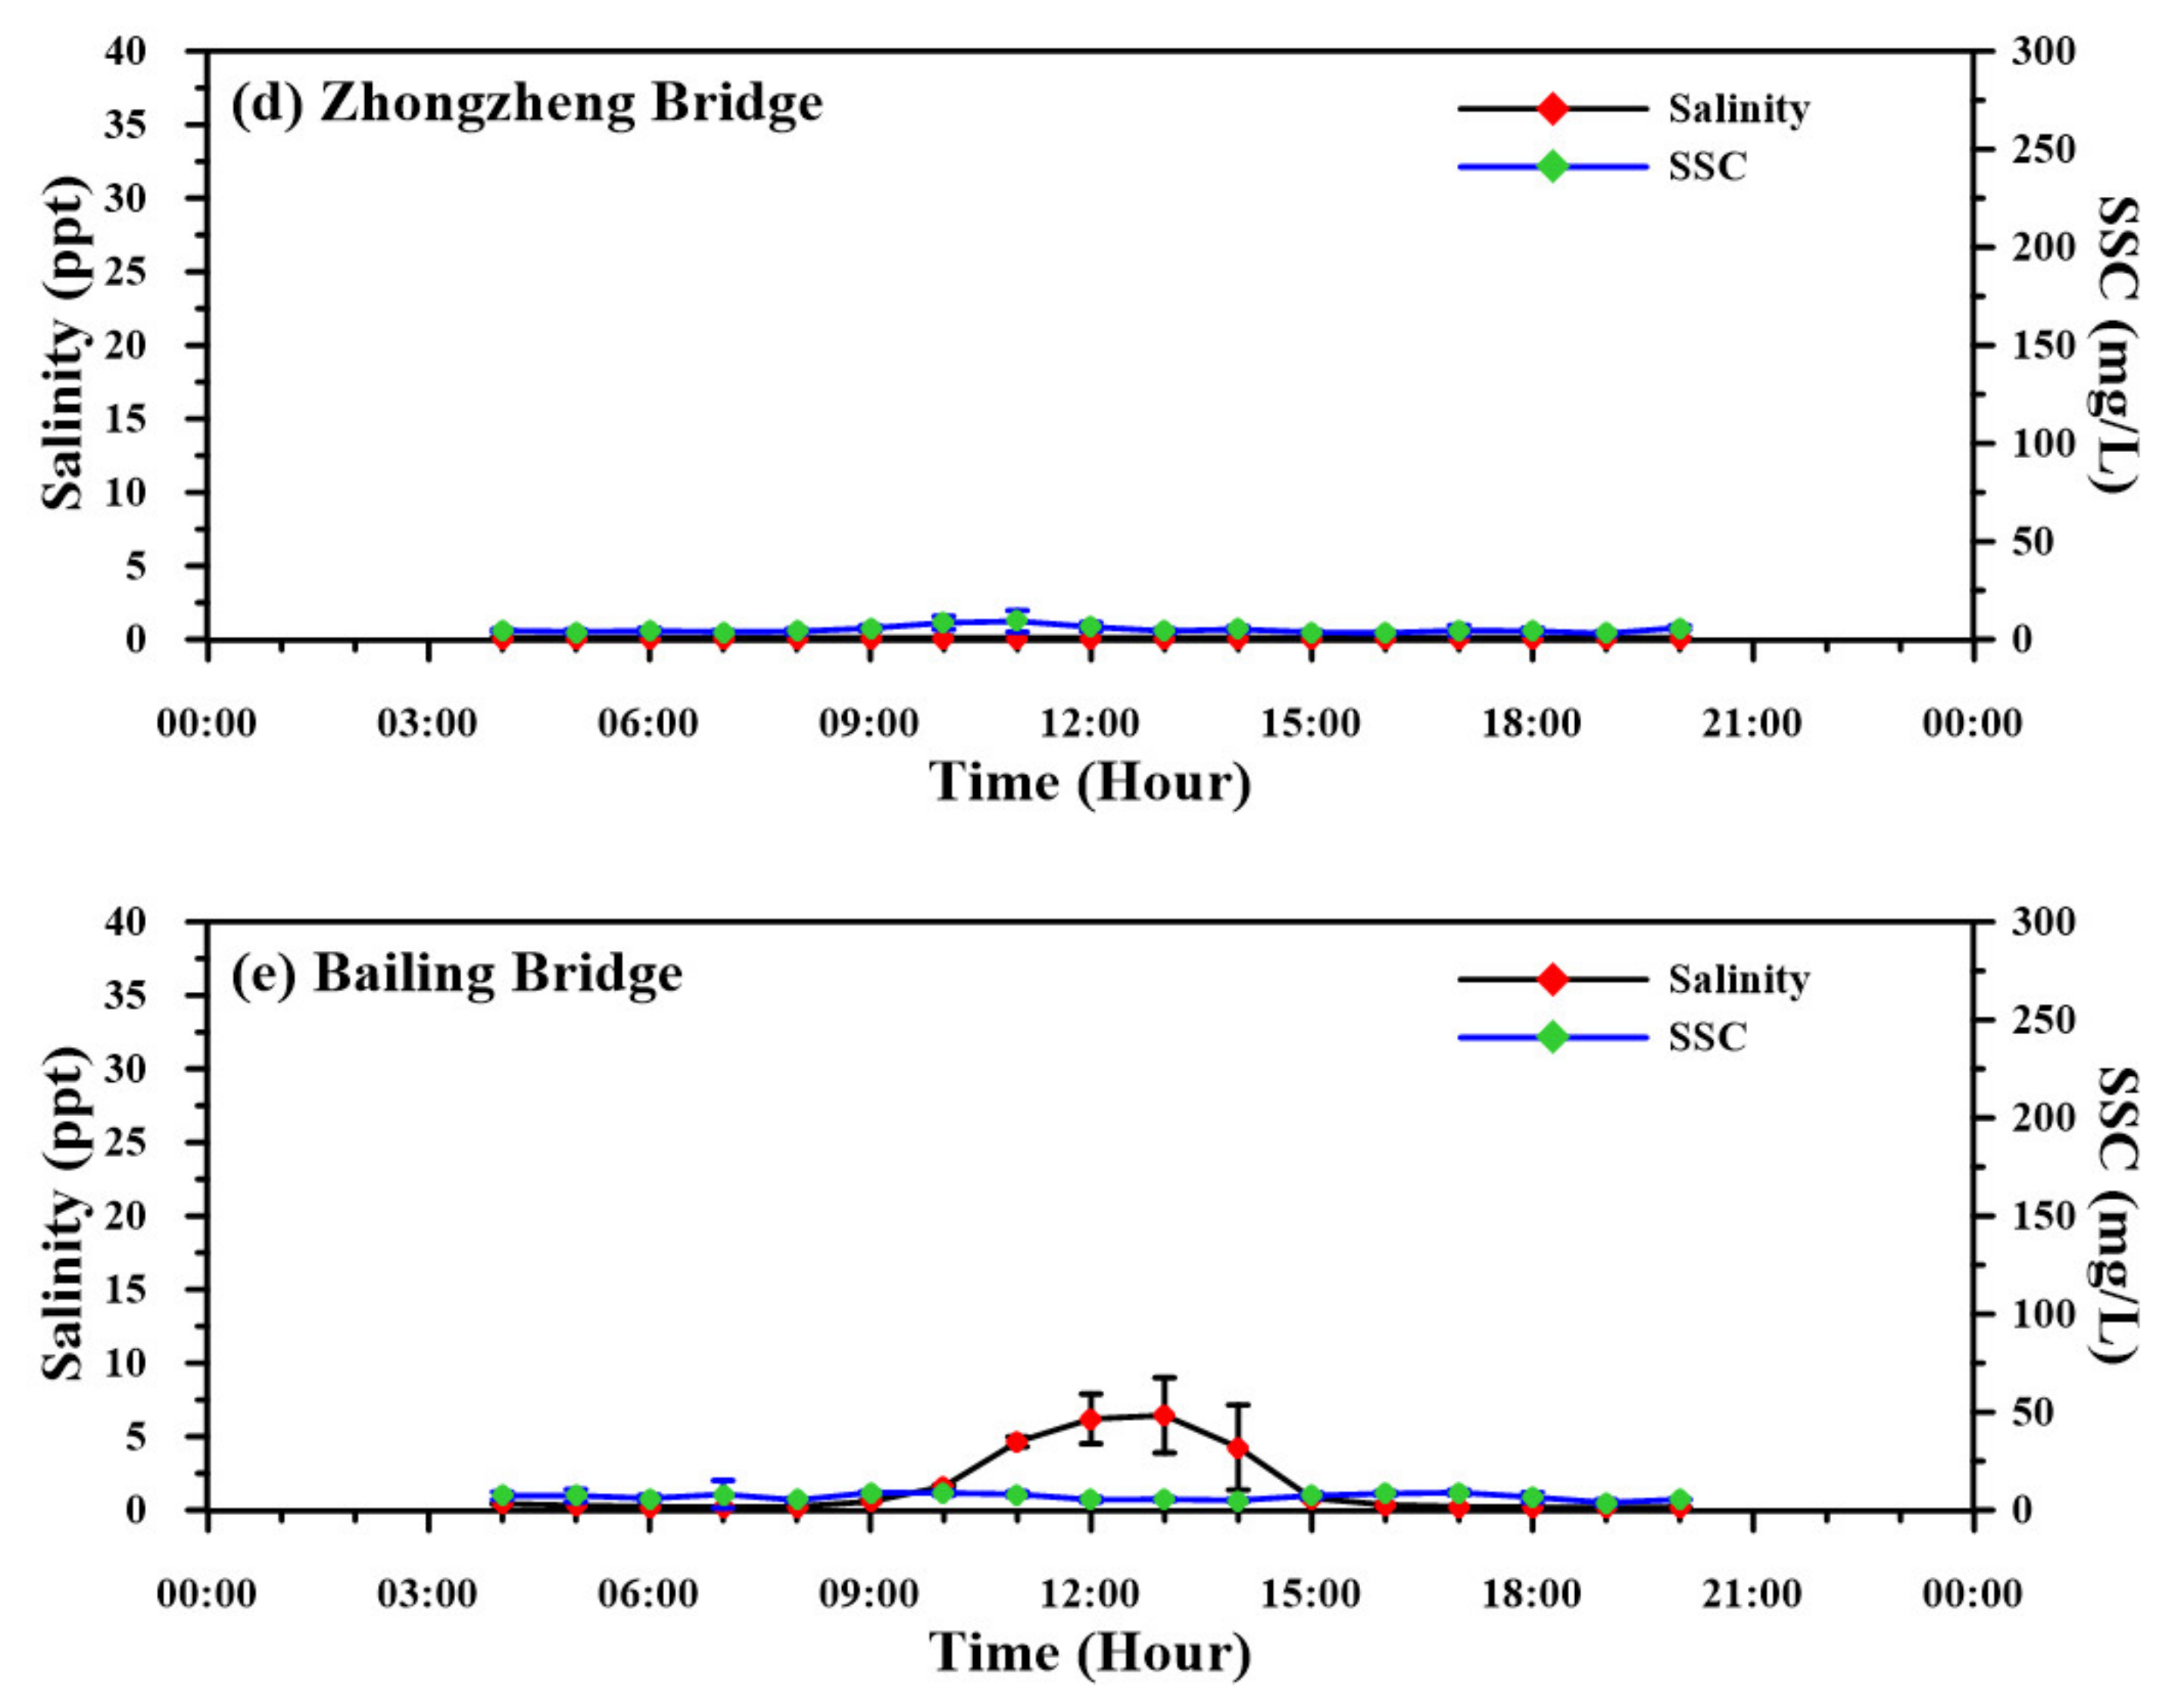
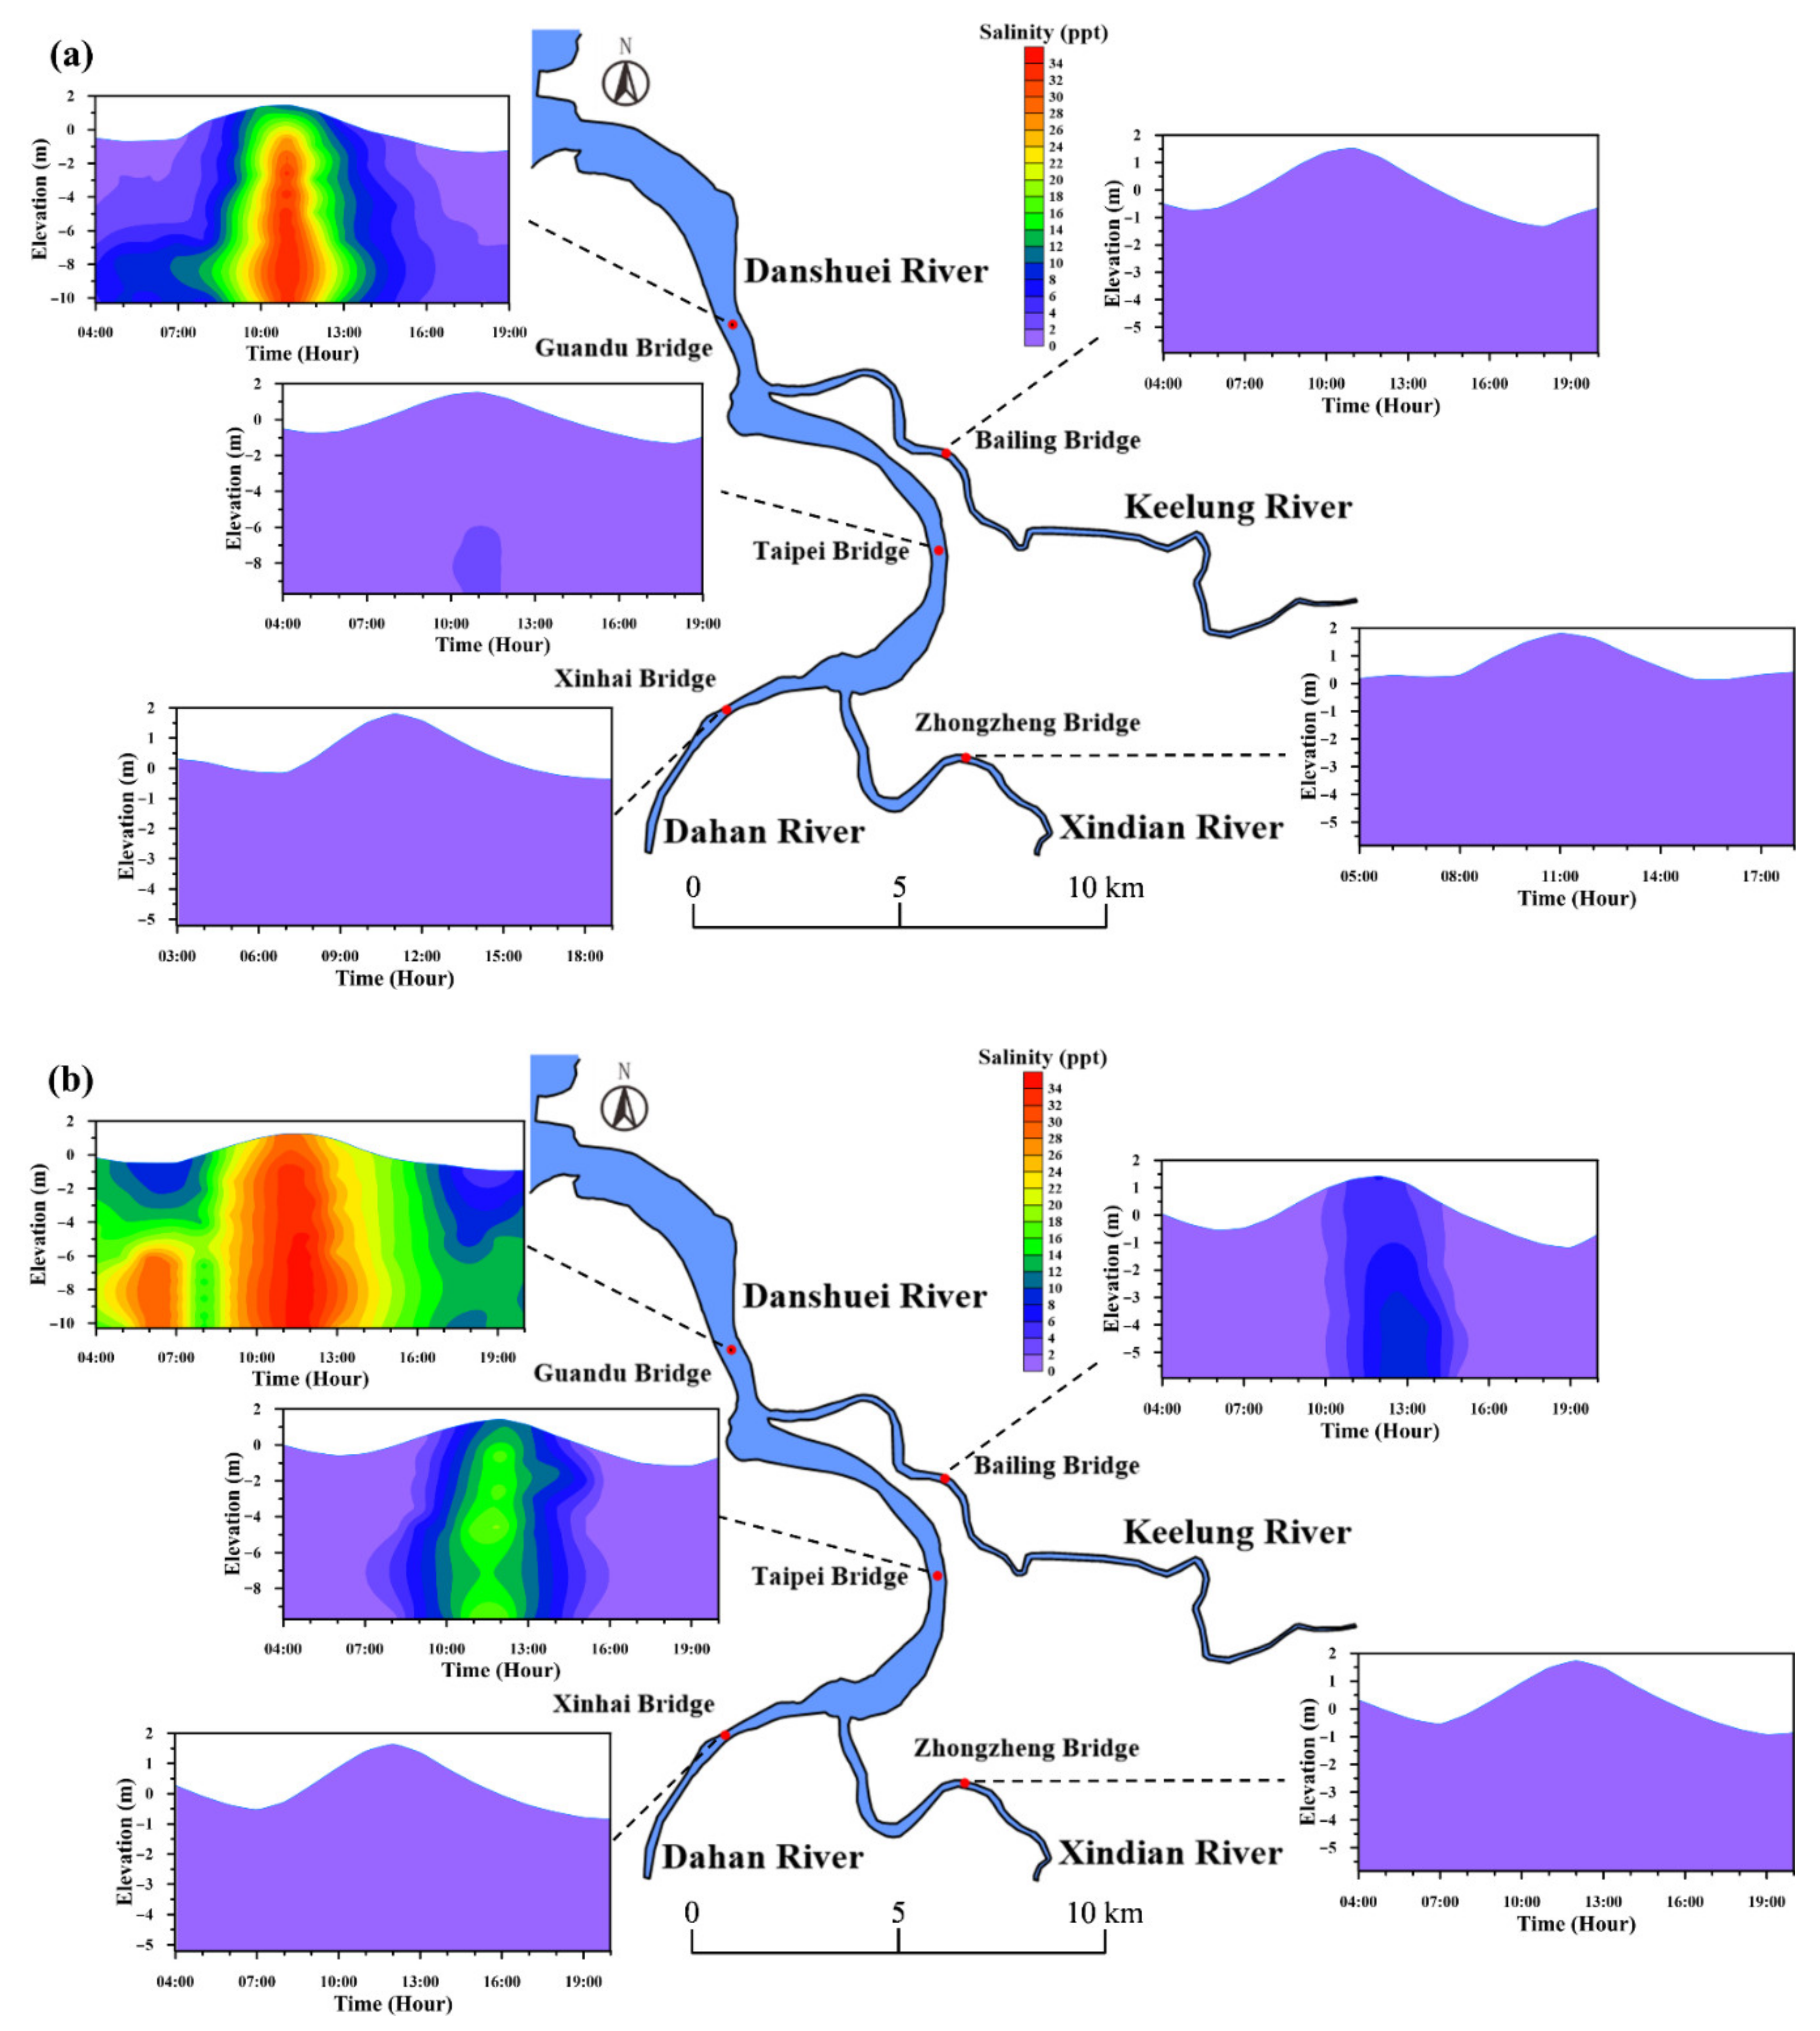
3.2. Salinity and Suspended-Sediment Concentration

The temporal variations in salinity and suspended-sediment concentration (SSC) on 4 July 2016 and 17 July 2019 for each measured station are illustrated in Figure 4 and Figure 5, respectively. The figures show the vertically averaged concentrations of salinity and suspended sediment plus and minus one standard deviation for each measured time. The salinity during flood tide was higher than that during ebb tide in the downstream reaches, but the salinity was low during flood and ebb tides at the Xinhai Bridge, Zhongzheng Bridge, and Bailling Bridge resulting from the limit of saltwater intrusion. The time variation of salinity at the Taipei Bridge became low during high flow (Figure 4b) compared to its temporal variations during low flow (Figure 5b). This means that the high river flow pushed the limit of saltwater intrusion to further downstream. The time variation of salinity at the Guandu Bridge during high flow (Figure 4a) was also lower than that during low flow (Figure 5a).
In general, the time variation of SSC during high flow (Figure 4) was higher than that during low flow (Figure 5). The high flow induced more sediment resuspension from the bottom layer resulting in the higher SSC compared to the low flow. Furthermore, a high SSC was found in the downriver reaches compared to the upriver reaches. Because of tidal asymmetry, the suspended sediment migrates downstream and is transported to the open seas.
The vertical distributions of salinity and SSC at high slack tide at the Guandu Bridge and Taipei Bridge during high- and low-flow conditions are depicted in Figure 6. The vertical stratification of salinity at the Guandu Bridge at high slack tide during high flow compared to low-flow conditions (Figure 6a) is readily apparent. Partially mixed salinity occurred at the Taipei Bridge during low flow, and the salinity during high flow was lower than that during low flow (Figure 6b). Stratified conditions for SSC also appear at both the Guandu Bridge and Taipei Bridge during high- and low-flow conditions (Figure 6c,d). However, it should be noted that there was more stratification of SSC displayed at the bottom layer compared to the surface layer at Guandu Bridge (Figure 6c).

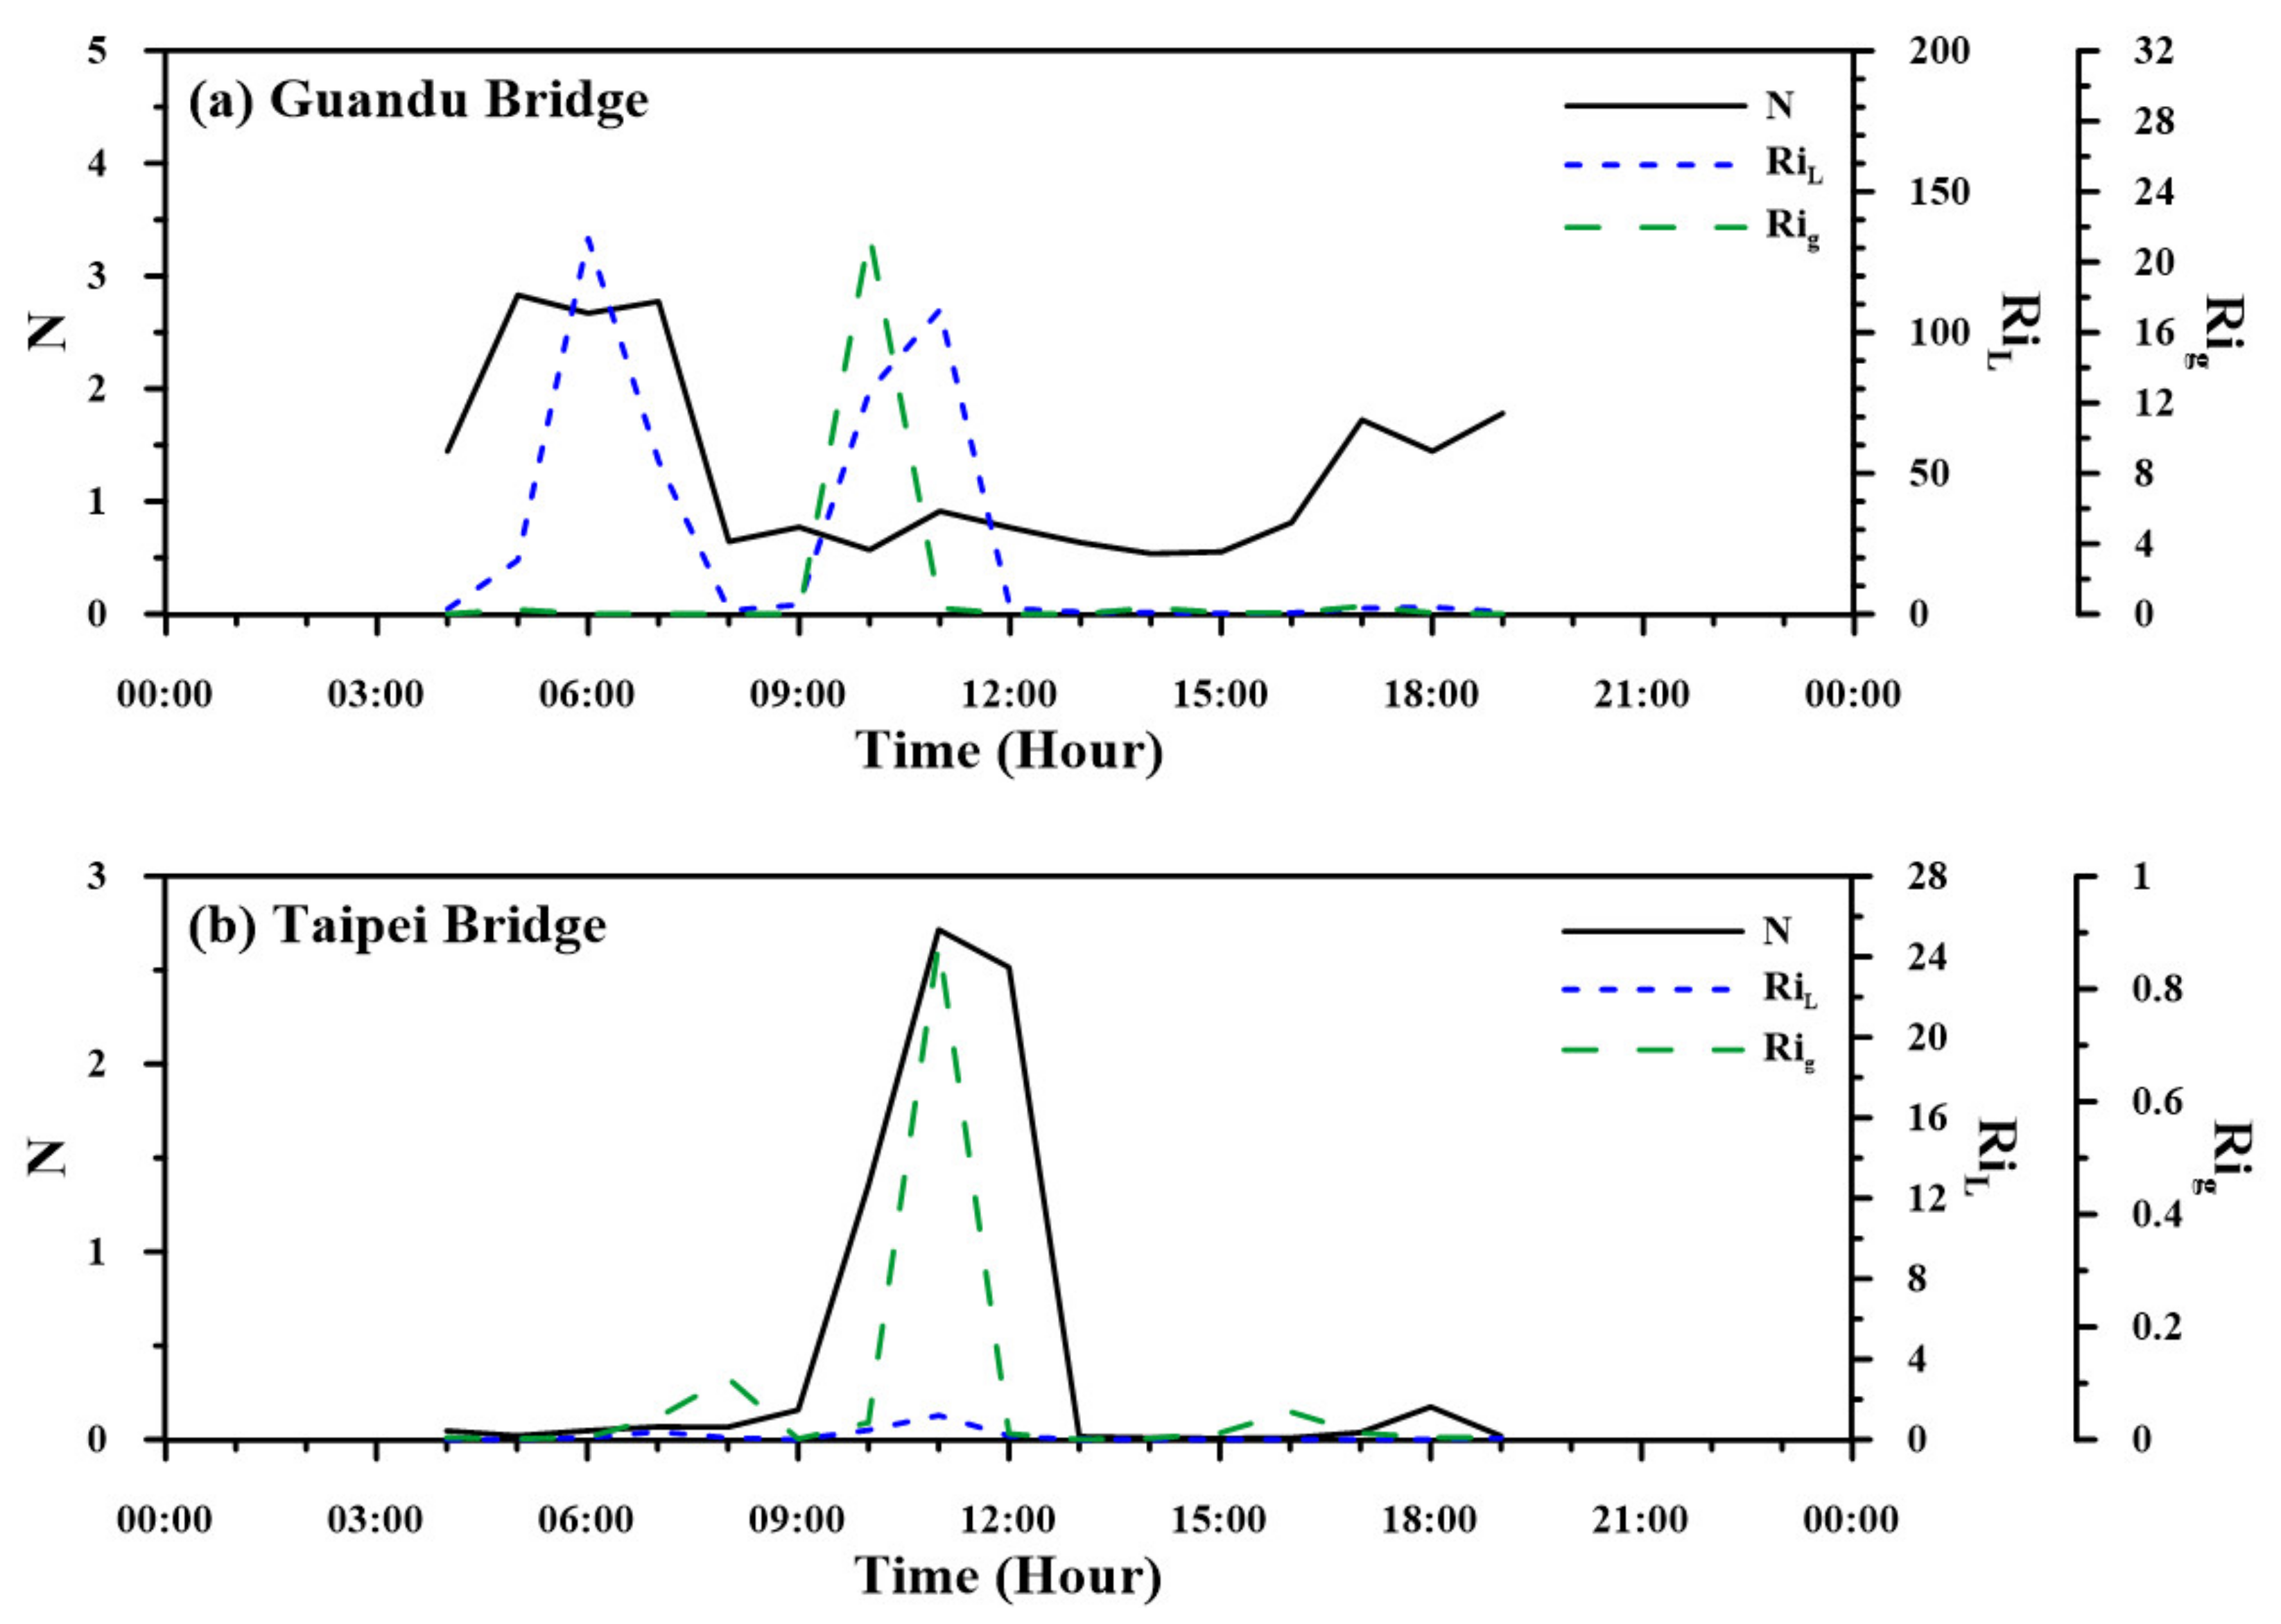
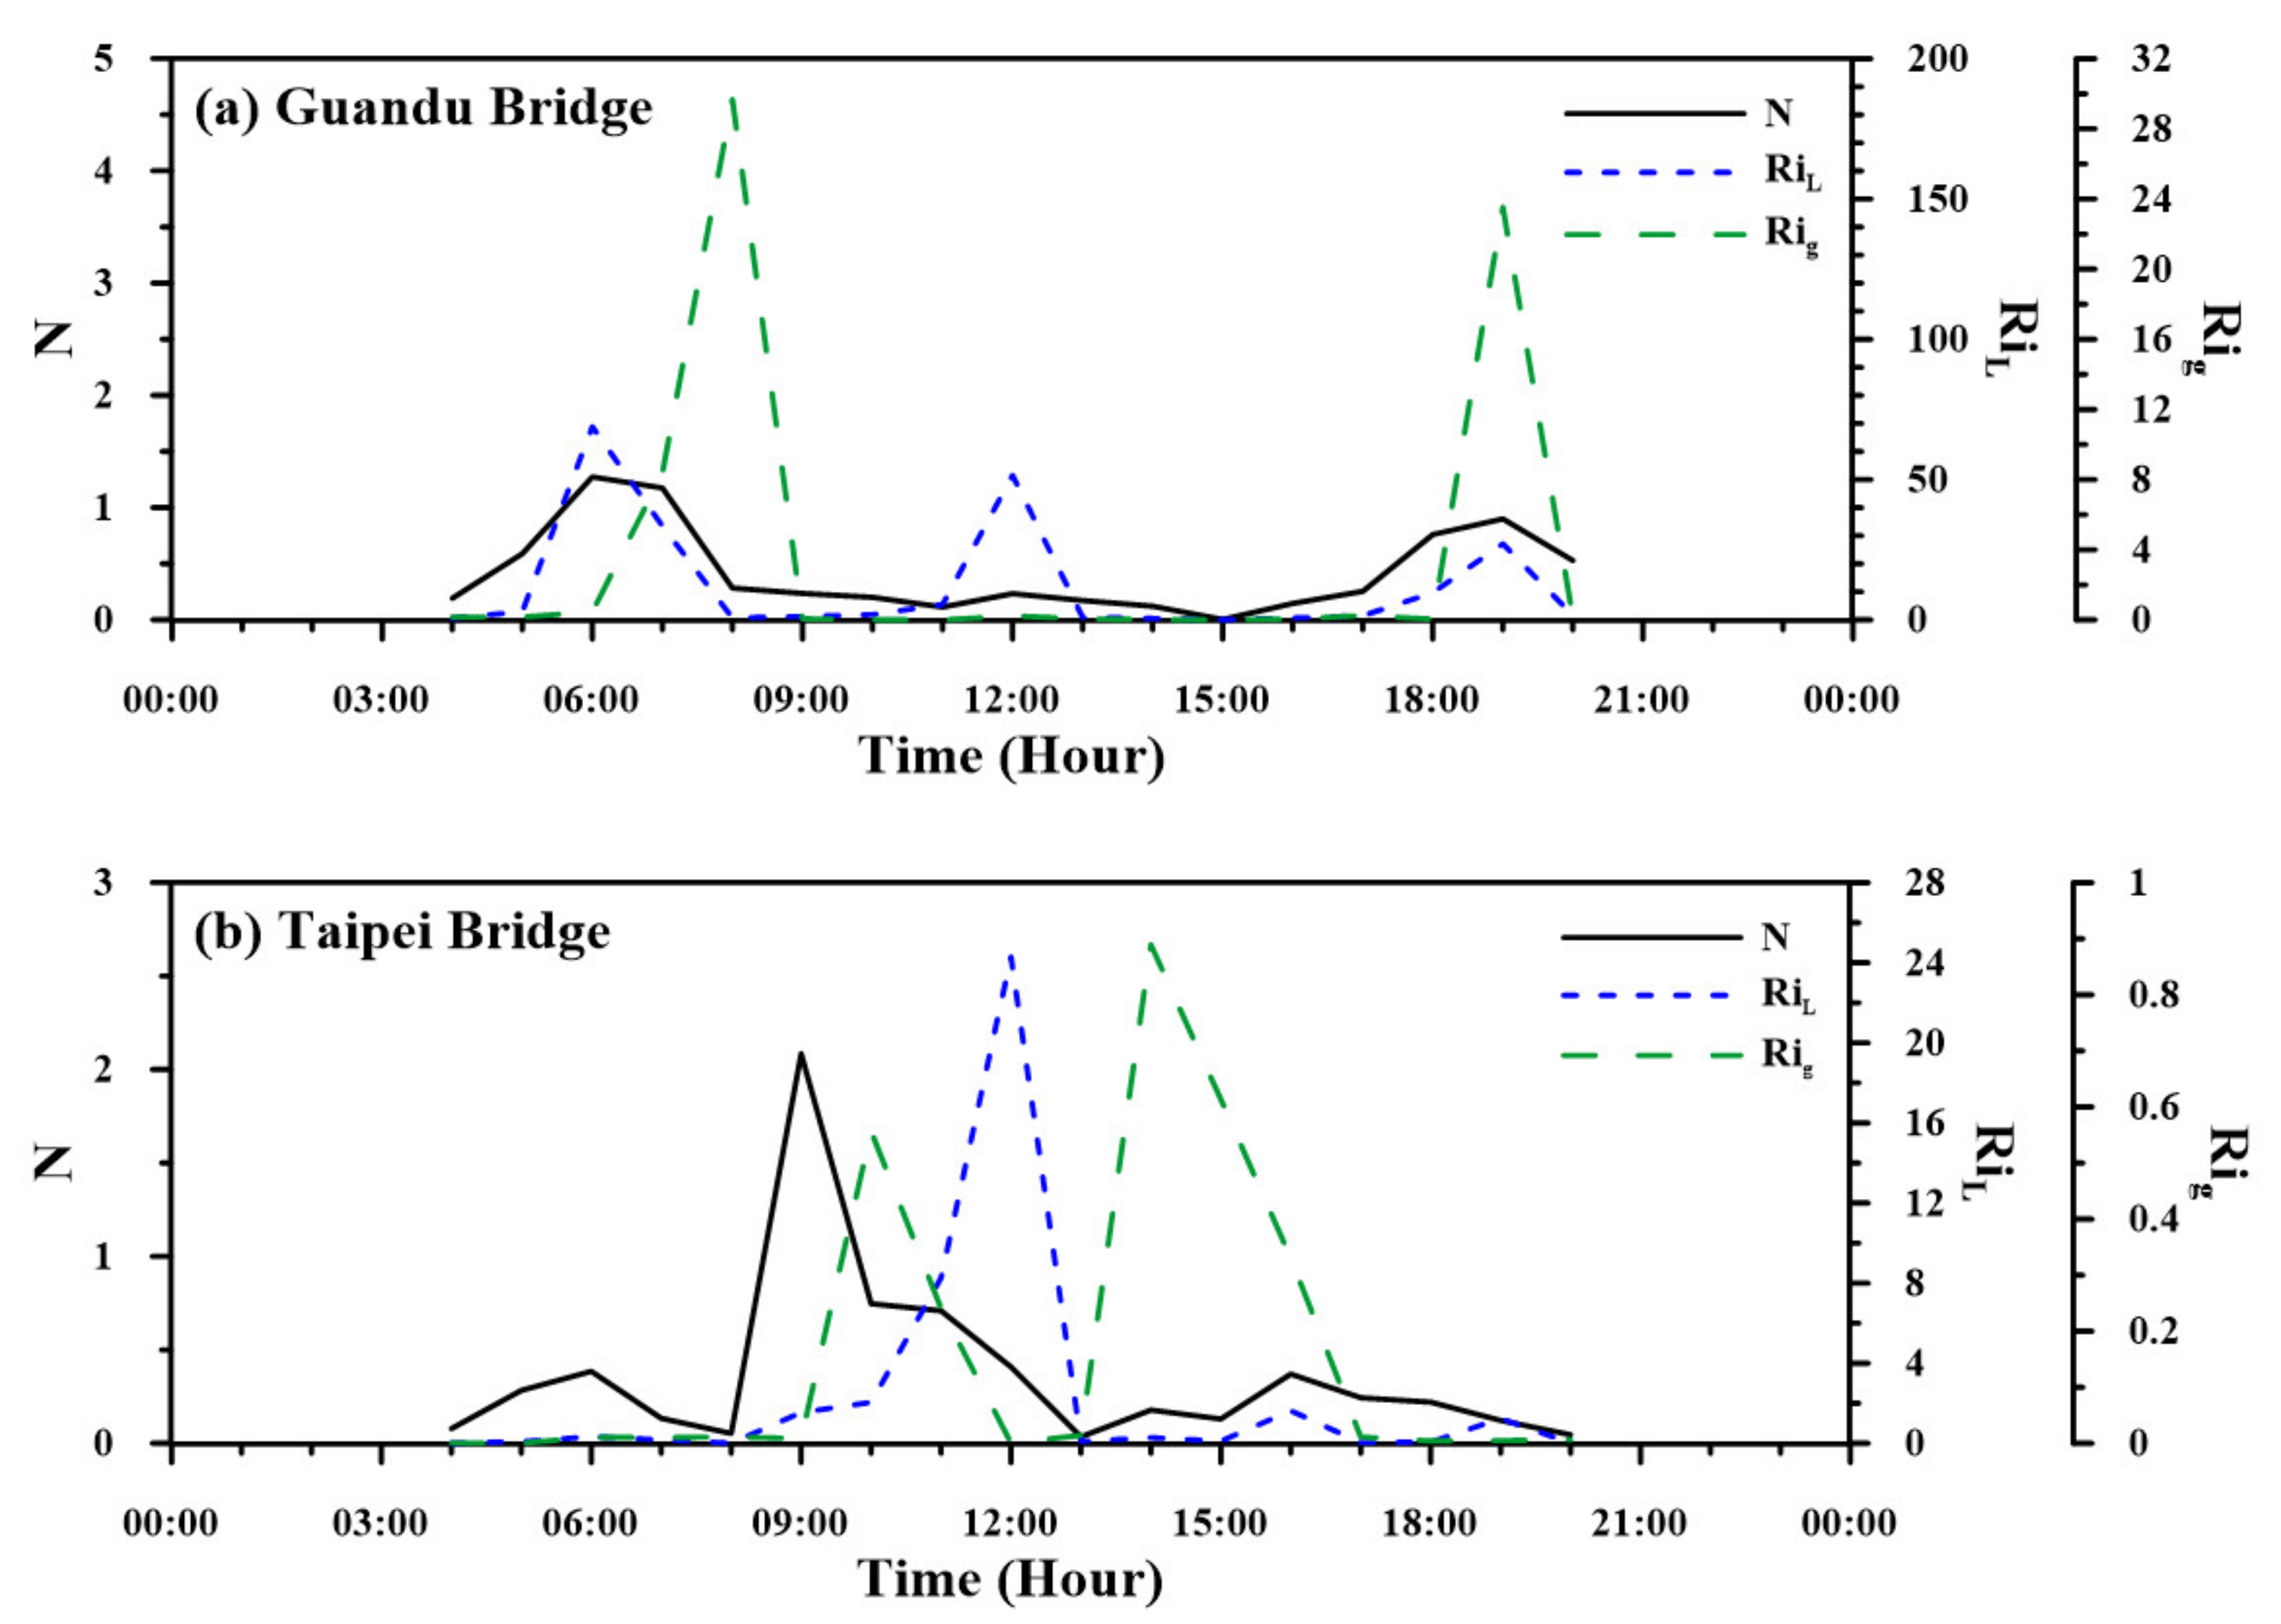
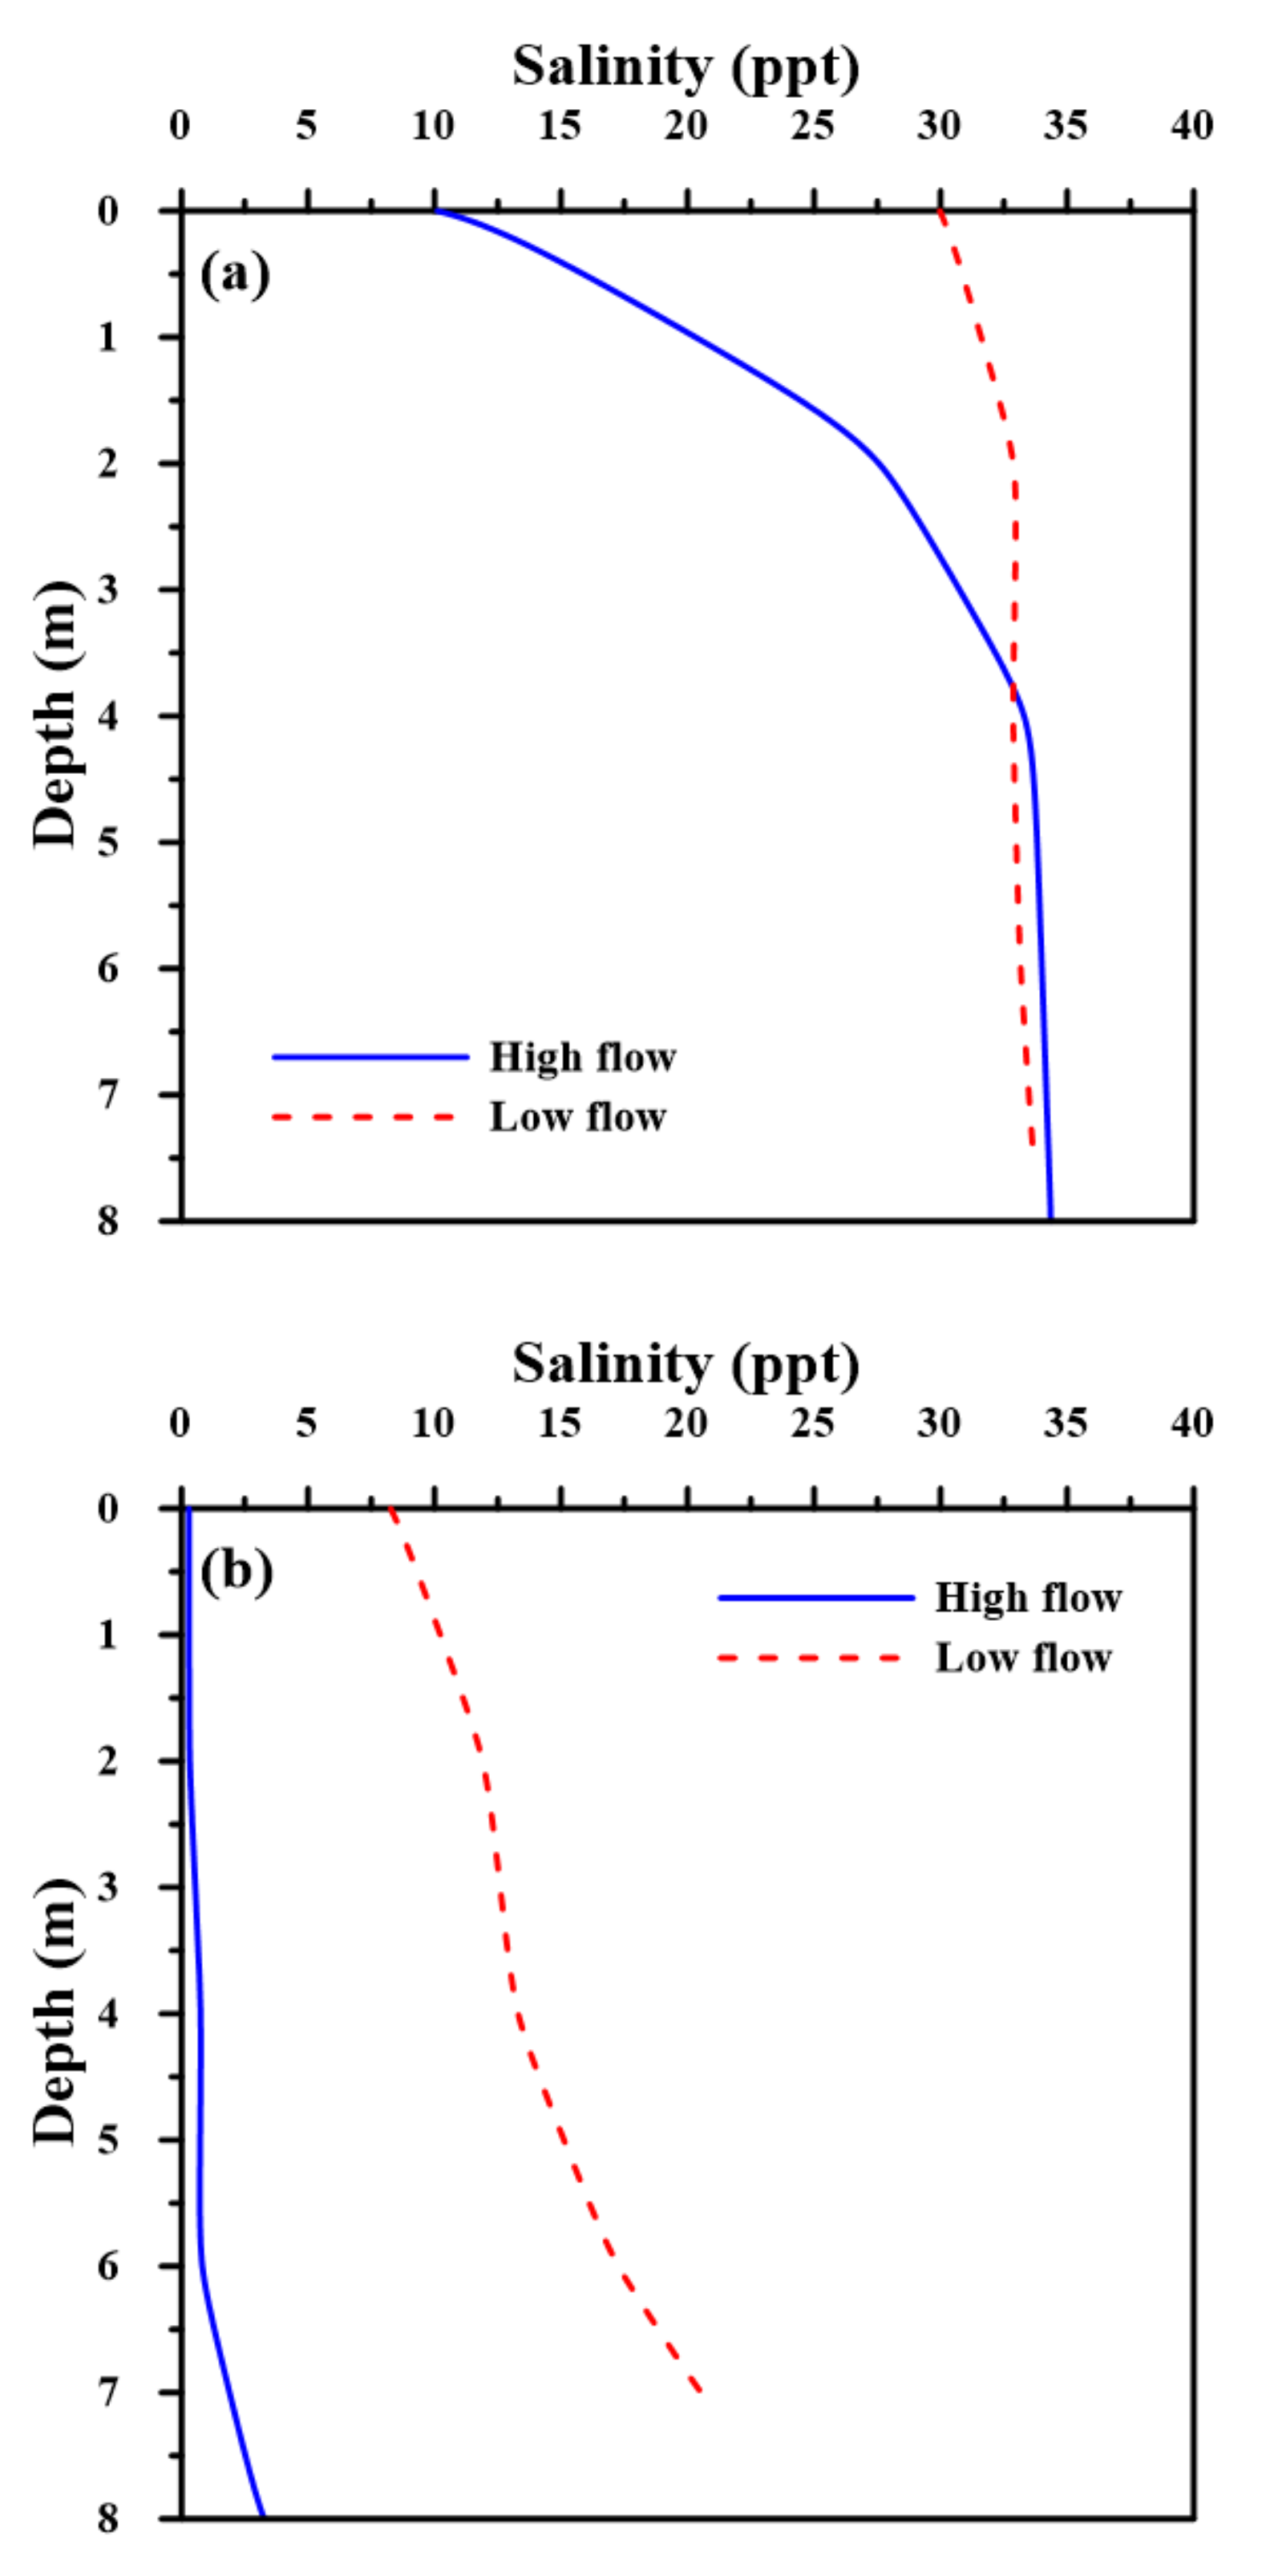
3.3. Stratification Variability

To comprehend the stratification variations in tidal estuaries, three related parameters, N, RiL, and Rig, were determined. Figure 7 and Figure 8 depict the time variation of these parameters on 4 July 2016 and 17 July 2019, respectively. According to the stratification criteria displayed in Figure 7, conditions mostly stayed between stratification and partially mixed at the Guandu Bridge and exhibited good mixing at the Taipei Bridge during high flow. During low flow (Figure 8), conditions were mostly between partially mixed and well-mixed at the Guandu Bridge and Taipei Bridge.
The salinity stratification parameter (N) utilizes the vertical salinity profile to judge the stratification state in the water column. This parameter is simple but does not consider the contribution of the suspended-sediment concentration. The gradient Richardson number is very sensitive to the interval of vertical measurement and the accuracy of velocity; therefore, a small deviation in velocity causes a huge range of Rig values [43]. Compared to N and Rig, the bulk/layer Richardson number, RiL, is more practical for examining the stratification variability.

4. Discussion

4.1. Estuarine Circulation and Mixing Conditions

According to the modeling results reported by Hsu et al. [37] and Liu [47], estuarine circulation was found in the lower reaches of the tidal estuarine zone and depended on the river discharges. The estuarine circulation usually occurred at Guandu Bridge, which has a deep channel at approximately 11 m and was also displayed at the Taipei Bridge during low flow. Based on the time-series variations in salinity during high- and low-flow conditions (Figure 4 and Figure 5), we inferred that estuarine circulation occurred at the Guandu Bridge during both flow conditions but did not occur during high-flow conditions at the Taipei Bridge.
A reduction in vertical mixing led to extended salinity-induced stratification during low flow, as denoted by the stratification parameter (N) and bulk/layer Richardson number (RiL) in Figure 7 and Figure 8. Such salinity-induced stratification defines the occurrence of estuarine circulation. The well-mixed condition clearly occurred at the Taipei Bridge during high flow (Figure 6b and Figure 7b).

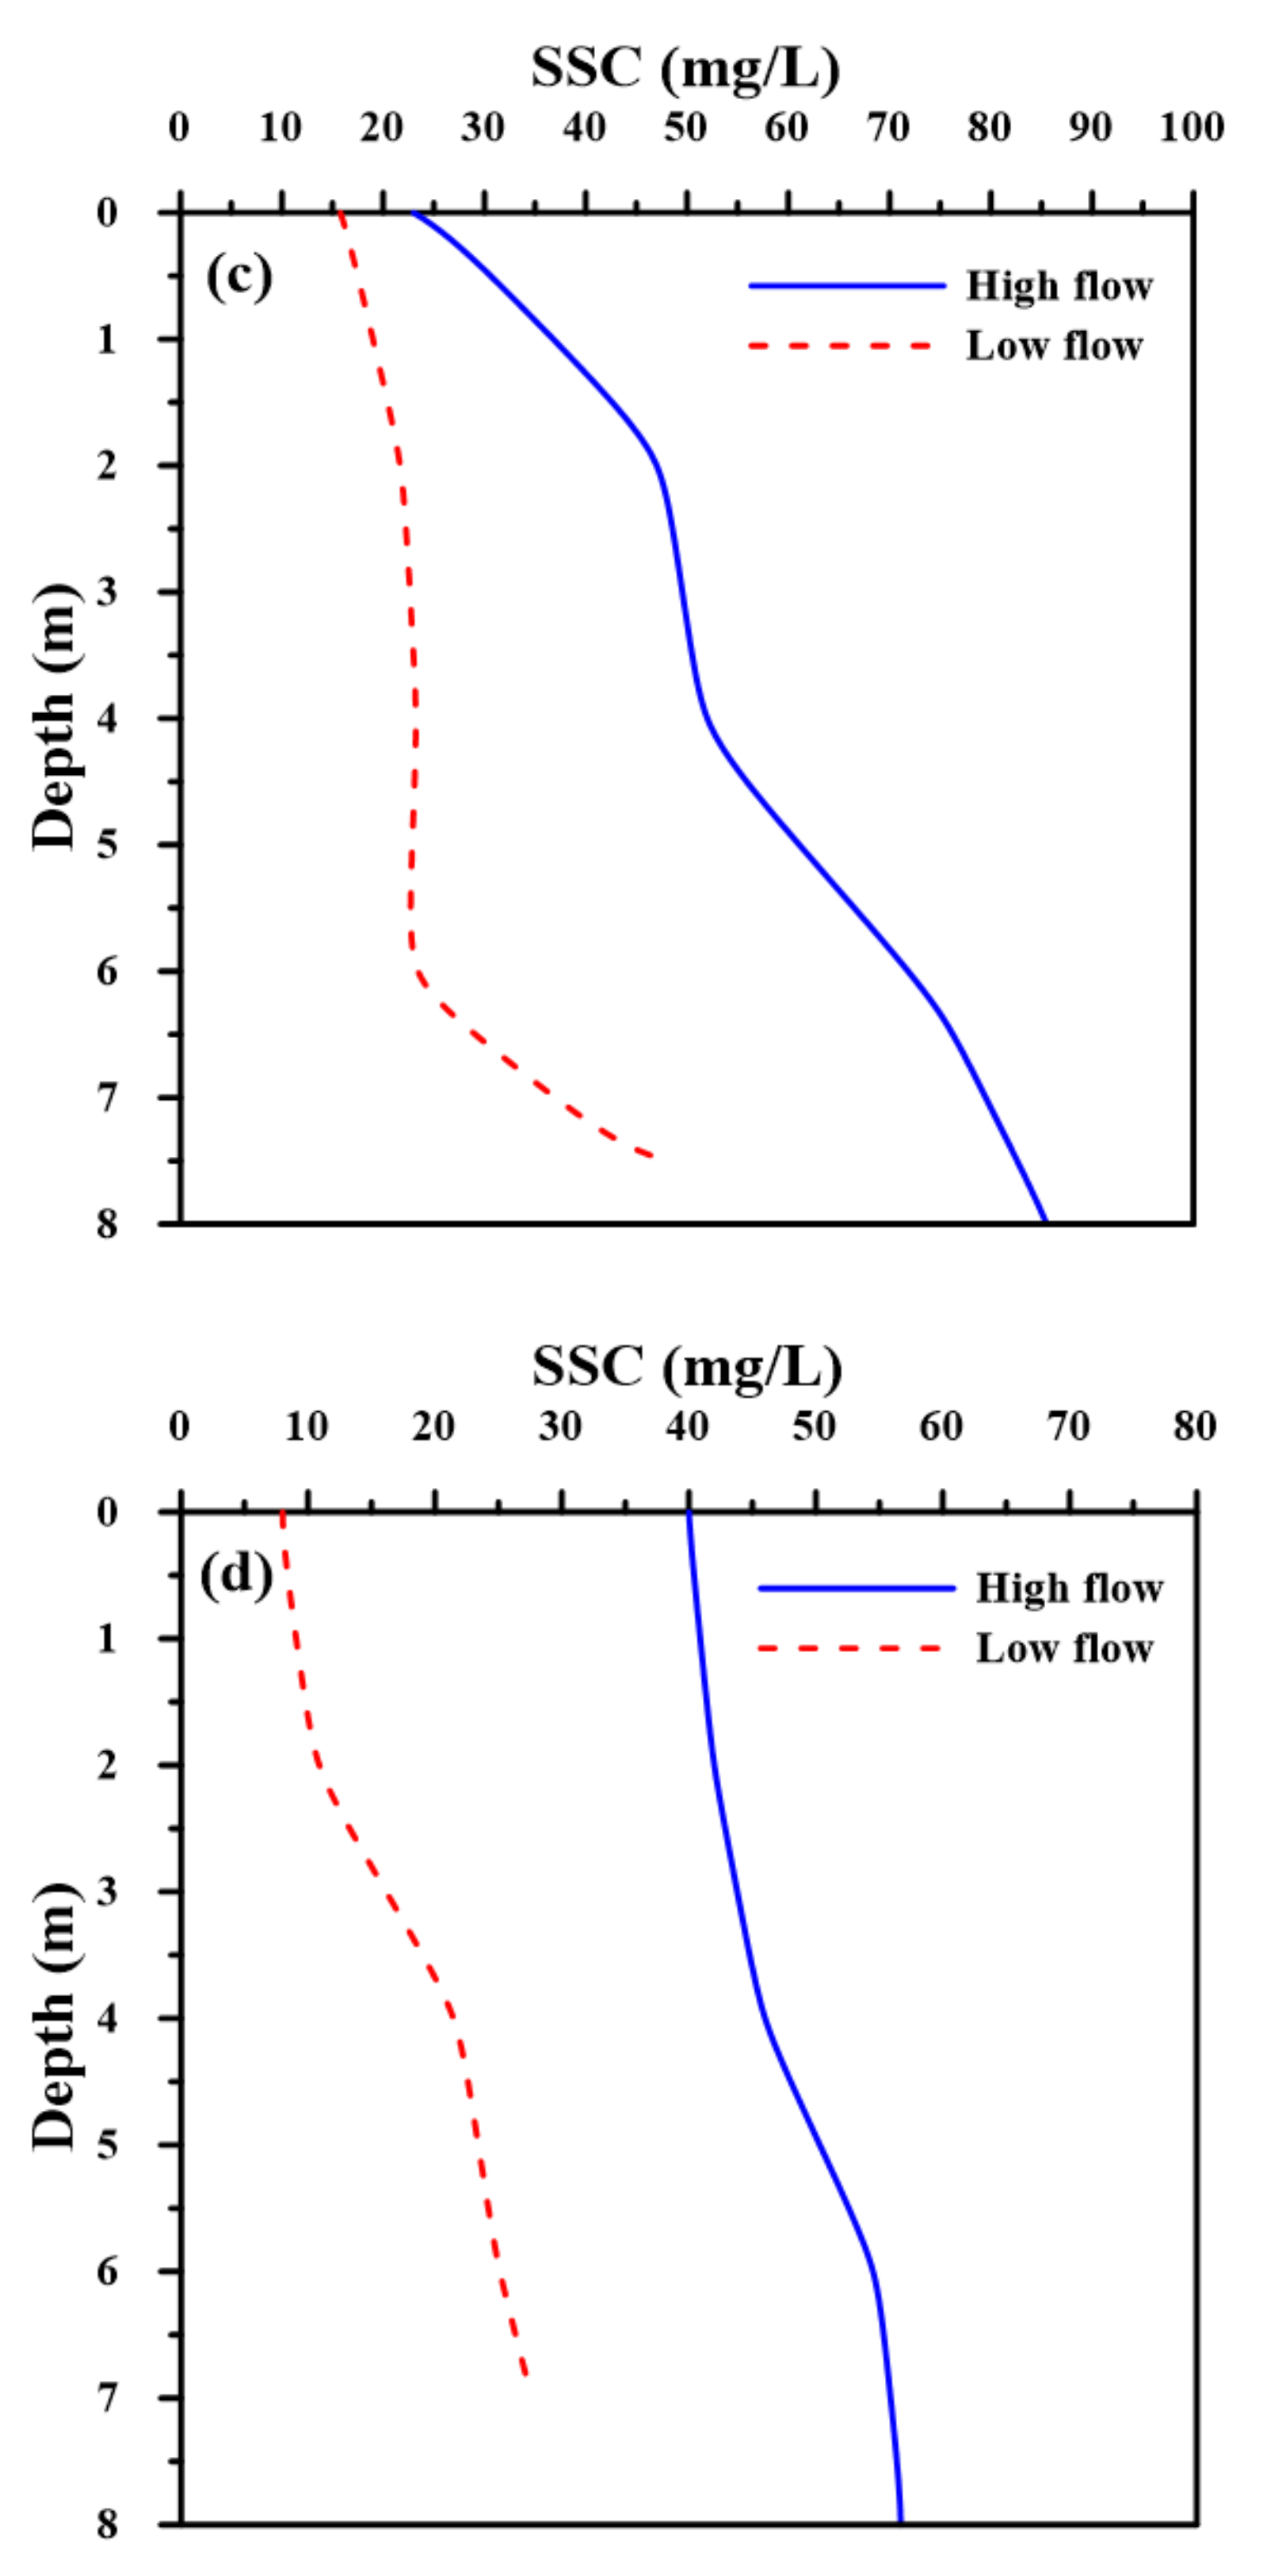
4.2. Longitudinal Changes in Salinity and SSC

To easily examine the longitudinal changes in salinity and SSC along the channel, the time-series variations in salinity and SSC along the channel are depicted in Figure 9 and Figure 10, respectively. The vertical salinity variations over time displayed stratification during low flow at the Guandu Bridge and Taipei Bridge compared to the high-flow condition. Except for the Guandu Bridge and Taipei Bridge, the other stations exhibited a well-mixed state. The salinity during flood tide was higher than that during ebb tide (Figure 9). A high SSC was also found in the downstream reaches during high flow compared to the SSC along the channel during low flow. The SSC during ebb tide was higher than that during flood tide in the lower reaches (Figure 10). However, the flood–ebb and river discharge dominated the saltwater intrusion along the channel, while the river discharge conspicuously controlled the SSC.
Several reports have documented that the incoming tide, river discharge, near-bed water velocities, sediment grain size, and waves affect the suspended-sediment concentration in tidal estuaries [32,48,49,50,51]. The wave effect on SSC in the Danshuei River estuary can be negligible because of the barrier of the mountain. The near-bed velocity controls sediment erosion, and grain size affects sediment deposition. However, these two factors are not considered in this study. Due to the tidal asymmetry dominated by ebb velocity, the net suspended-sediment transport was landward [52]. According to the measured results displayed Figure 6c and Figure 10, the estuarine turbidity maximum would appear at the bottom layer of the Guandu Bridge because of local deepening of the bed [35].

4.3. Possibility of Modeling and Future Work

Model simulations using the observed salinity and SSC in tidal estuaries can assist researchers in understanding sediment dynamics [53,54]. The suspended-sediment transport in the models was greatly determined by bed erosion and sediment resuspension. The so-called erosion-limited approach considers bed erosion and sediment resuspension to be closely related to bed shear stress. An additional factor affecting SSC is the settling velocity, which results from flocculation processes [31,55,56,57]. These fundamental factors may be considered in the modeling process to reflect sediment transport and dynamics.
The SSC in the Danshuei River estuary was only on the scale of tens to hundreds of mg/L. However, the high concentration of suspended sediment in the lower estuarine zone would have an impact on water quality and ecosystems, so it is in the process of model development. To achieve the goal of integrating observational data and models, it is necessary to couple hydrodynamic, water quality, and ecological models to refine the temporal and spatial resolutions. Cross-disciplinary researchers would join the model development to participate in future research and discussion.

5. Conclusions

The distribution of salinity and suspended sediment in tidal estuaries is affected by different interrelated factors. The relative importance of each factor is difficult to quantify, partly because of the lack of observation and partly because of the complex nature of the processes and the coupling among them. However, as a conservative quantity, exploring the salinity distribution is easier than comprehending the more complex and dynamic distribution of suspended sediment.
The study presents the results of intensive surveys of salinity and suspended sediment in the Danshuei River estuary during high- and low-flow conditions. The salinity at the Guandu Bridge exhibited good mixing during low flow and stratification during high flow at high slack tide. The salinity was low at both flood and ebb tides at the Xinhai Bridge, Zhongzheng Bridge, and Bailling Bridge resulting from the limit of saltwater intrusion. The high freshwater discharges resulted in lower salinity because barotropic forcing dominated, while the low freshwater discharges caused higher salinity and longer saltwater intrusion because baroclinic forcing dominated. According to the stratification indices, the results revealed that mostly partial mixing occurred at the Guandu Bridge and good mixing occurred at the Taipei Bridge during high flow, while mostly partial mixing and good mixing occurred at both the Guandu Bridge and Taipei Bridge during low flow.
A high SSC was found in the downstream reaches during high flow compared to the SSC along the channel during low flow. The SSC during ebb tide was higher than that during flood tide in the lower reaches. The results indicated that river discharge obviously controlled the SSC in tidal estuaries. Based on two intensive surveys, an estuarine turbidity maximum occurred at the bottom layer of Guandu Bridge resulting from the local deepening reaching 11 m. The processes affecting SSC on different spatial and temporal scales remain complex and worth exploring. Further work will focus on the improvement of measurement techniques and model development.

Author Contributions

Conceptualization, W.-C.L.; methodology, W.-C.L. and H.-M.L.; software, H.-M.L. and W.-C.H.; validation, W.-C.L., H.-M.L. and W.-C.H.; formal analysis, H.-M.L. and W.-C.H.; investigation, W.-C.L.; resources, W.-C.L.; data curation, H.-M.L. and W.-C.H.; writing—original draft preparation, W.-C.L.; writing—review and editing, W.-C.L., H.-M.L. and W.-C.H.; visualization, H.-M.L.; supervision, W.-C.L.; project administration, W.-C.L.; funding acquisition, W.-C.L. All authors have read and agreed to the published version of the manuscript.

Funding

This research was funded by the Ministry of Science and Technology, Taiwan (MOST 106-2621-M-239-001).

Institutional Review Board Statement

This study did not require ethical approval.

Informed Consent Statement

Not applicable.

Data Availability Statement

The measured data are subject to request.

Acknowledgments

The financial support is greatly appreciated. The authors would like to express their appreciation to two anonymous reviewers who provided useful comments to substantially improve this manuscript.

Conflicts of Interest

The authors declare no conflict of interest.

References

  1. Liu, W.C.; Huang, W.C. Modeling the transport and distribution of fecal coliform in tidal estuary. Sci. Total Environ. 2012, 431, 1–8. [Google Scholar] [CrossRef]
  2. Skerratt, J.; Wild-Allen, K.; Rizwi, F.; Whitehead, J.; Coughanowr, C. Use of a high resolution 3D fully coupled hydrodynamic, sediment and biogeochemical model to understand estuarine nutrient dynamics under various water quality scenarios. Ocean Coast. Manag. 2013, 83, 52–66. [Google Scholar] [CrossRef]
  3. Xu, M.; Chua, V.P. A numerical study on land-based pollutant transport in Singapore coastal waters with a coupled hydrologic-hydrodynamic model. J. Hydro-Environ. Res. 2017, 14, 119–142. [Google Scholar] [CrossRef]
  4. Liu, Q.; Chai, F.; Dugdale, R.; Chao, Y.; Xue, H.; Rao, S.; Wilkerson, F.; Farrara, J.; Zhang, H.; Wang, Z.; et al. San Francisco Bay nutrients and plankton dynamics as simulated by a coupled hydrodynamic-ecosystem model. Cont. Shelf Res. 2018, 161, 29–48. [Google Scholar] [CrossRef]
  5. Chen, W.B.; Liu, W.C.; Hsu, M.H. Water quality modeling in tidal estuarine system using a three-dimensional model. Environ. Eng. Sci. 2011, 28, 443–458. [Google Scholar] [CrossRef]
  6. Das, A.; Justic, D.; Inoue, M.; Hoda, A.; Huang, H.; Park, D. Impact of Mississippi River diversions on salinity gradients in a deltaic Louisiana estuary: Ecological and management implications. Estuar. Coast. Shelf Sci. 2012, 111, 17–26. [Google Scholar] [CrossRef]
  7. Azevedo, I.C.; Bordalo, A.A.; Duarte, P. Influence of freshwater inflow variability on the Douro estuary primary productivity: A modelling study. Ecol. Model. 2014, 272, 1–15. [Google Scholar] [CrossRef]
  8. Liu, W.C.; Chan, W.T. Assessment of climate change impacts on water quality in a tidal estuarine system using a three-dimensional model. Water 2016, 8, 60. [Google Scholar] [CrossRef] [Green Version]
  9. Naithani, J.; de Brye, B.; Buyze, E.; Vyverman, W.; Legat, V.; Deleersnijder, E. An ecological model for the Scheldt estuary and tidal rivers ecosystem: Spatial and temporal variability of plankton. Hydrobiologia 2016, 775, 51–67. [Google Scholar] [CrossRef]
  10. Gong, W.; Shen, J.; Jia, L. Salt intrusion during the dry season in the Huangmaohai Estuary, Pearl River Delta, China. J. Mar. Syst. 2013, 111–112, 235–252. [Google Scholar] [CrossRef]
  11. Zarzuelo, C.; Lopez-Ruiz, A.; Diez-Minguito, M.; Ortega-Sanchez, M. Tidal and subtidal hydrodynamics and energetics in a constricted estuary. Estuar. Coast. Shelf Sci. 2017, 185, 55–68. [Google Scholar] [CrossRef]
  12. Du, J.; Park, K.; Shen, J.; Dzwonkowski, B.; Yu, X.; Yoon, B., II. Role of baroclinic processes on flushing characteristics in a highly stratified estuarine system, Mobile Bay, Alabama. J. Geophys. Res. Ocean 2018, 123, 4518–4537. [Google Scholar] [CrossRef] [Green Version]
  13. Garel, E.; Cai, H. Effect of tidal-forcing variations on tidal properties along a narrow convergent estuary. Estuar. Coast. 2018, 41, 1924–1942. [Google Scholar] [CrossRef] [Green Version]
  14. Ijaz, M.W.; Mahar, R.B.; Ansari, K.; Siyal, A.A. Optimization pf salinity intrusion control through freshwater and tidal inlet modification for the Indus River Estuary. Estuar. Coast. Shelf Sci. 2019, 224, 51–61. [Google Scholar] [CrossRef]
  15. Sherin, V.R.; Durand, P.; Papa, F.; Islam, A.S. Recent salinity intrusion in the Bengal delta: Observations and possible causes. Cont. Shelf Res. 2020, 202, 104–142. [Google Scholar] [CrossRef]
  16. Wang, L.; Li, L.; He, Z.; Kalhoro, N.A.; Xu, D. Numerical modelling study of seawater intrusion in Indus River Estuary, Pakistan. Ocean Eng. 2019, 184, 74–84. [Google Scholar] [CrossRef]
  17. He, W.; Jiang, A.; Zhang, J.; Xu, H.; Xiao, Y.; Chen, S.; Yu, X. Comprehensive hydrodynamic fitness of an estuary channel and the effect of a water diversion inflow. Estuar. Coast. 2022, 45, 382–392. [Google Scholar] [CrossRef]
  18. Ross, L.; Alahmd, S.; Smith, S.M.C.; Roberts, G. Tidal and subtidal transport in short, tidally-driven estuaries with low rates of freshwater input. Cont. Shelf Res. 2021, 224, 104453. [Google Scholar] [CrossRef]
  19. Shi, J.Z. Tidal resuspension and transport processes of fine sediment within the river plume in the partially-mixed Changjiang River estuary, China: A personal perspective. Geomorphology 2010, 121, 133–151. [Google Scholar] [CrossRef]
  20. Meselhe, E.A.; Georgiou, I.; Allison, M.A.; McCorquodale, J.A. Numerical modeling of hydrodynamics and sediment transport in lower Mississippi at a proposal delta building diversion. J. Hydrol. 2012, 472–473, 340–354. [Google Scholar] [CrossRef]
  21. Uncles, R.J.; Stephens, J.A.; Harris, C. Towards predicting the influence of freshwater abstractions on the hydrodynamics and sediment transport of a small, strongly tidal estuary: The Devonshire Avon. Ocean Coast. Manag. 2013, 79, 83–96. [Google Scholar] [CrossRef]
  22. Van, C.P.; Gourgue, O.; Sassi, M.; HoitinkTon, A.J.F.; Deleersnijder, E.; Soares-Frazao, S. Modeling fine-grained sediment transport in the Mahakam land-sea continuum, Indonesia. J. Hydro-Environ. Res. 2016, 13, 103–120. [Google Scholar]
  23. Miguel, L.L.A.J.; Castrol, J.W.A.; Nehama, F.P.J. Tidal impact on suspended sediments in the Macuse estuary in Mozambique. Reg. Stud. Mar. Sci. 2017, 16, 1–14. [Google Scholar] [CrossRef]
  24. Hesse, R.F.; Zorndt, A.; Frohle, P. Modelling dynamics of the estuarine turbidity maximum and local net deposition. Ocean Dyn. 2019, 69, 489–507. [Google Scholar] [CrossRef]
  25. Yan, Y.; Song, D.; Bao, X.; Wang, N. The response of turbidity maximum to peak river discharge in a macrotidal estuary. Water 2021, 13, 106. [Google Scholar] [CrossRef]
  26. Pinto, L.; Fortunato, A.B.; Zhang, Y.; Oliveria, A.; Sancho, F.E.P. Development and validation of a three-dimensional morphodynamic modelling system for non-cohesive sediments. Ocean Model. 2012, 57–58, 1–14. [Google Scholar] [CrossRef]
  27. Gourgue, O.; Baeyens, W.; Chen, M.S.; de Brauwere, A.; de Brye, B.; Deleersnijder, E.; Elskens, M.; Legat, V. A depth-averaged two-dimensional sediment transport model for environmental studies in the Scheldt Estuary and tidal river network. J. Mar. Syst. 2013, 128, 27–39. [Google Scholar] [CrossRef] [Green Version]
  28. Wang, D.; Cao, A.; Zhang, J.; Fan, D.; Liu, Y.; Zhang, Y. A three-dimensional cohesive sediment transport model with data assimilation; Model development, sensitivity analysis and parameter estimation. Estuar. Coast. Shelf Sci. 2018, 206, 87–100. [Google Scholar] [CrossRef]
  29. Grasso, F.; Le Hir, P. Influence of morphological changes on suspended sediment dynamics in a macrotidal estuary: Diachronic analysis in the Seine Estuary (France) from 1960 to 2010. Ocean Dyn. 2019, 69, 83–100. [Google Scholar] [CrossRef] [Green Version]
  30. Krvavica, N.; Ruzic, I. Assessment of sea-level rise impact on salt-wedge intrusion in idealized and Neretva River Estuary. Estuar. Coast. Shelf Sci. 2020, 234, 106638. [Google Scholar] [CrossRef] [Green Version]
  31. Zhu, C.; van Maren, D.S.; Guo, L.; Lin, J.; He, Q.; Wang, Z.B. Effects of sediment-induced density gradients on the estuarine turbidity maximum in the Yangtze Estuary. J. Geophys. Res. Ocean 2021, 126, e2020JC016927. [Google Scholar] [CrossRef]
  32. Wang, Y.P.; Voulgaries, G.; Li, Y.; Yang, Y.; Gao, J.; Chen, J.; Gao, S. Sediment resuspension flocculation, and settling in a macrotidal estuary. J. Geophys. Res. 2013, 118, 5591–5608. [Google Scholar] [CrossRef]
  33. Gong, W.; Jia, L.; Shen, J.; Liu, J.T. Sediment transport in response to changes in river discharge and tidal mixing in a funnel-shaped micro-tidal estuary. Cont. Shelf Res. 2014, 76, 89–107. [Google Scholar] [CrossRef]
  34. Li, M.; Chen, Z.; Finlayson, B.; Wei, T.; Chen, J.; Wu, X.; Xu, H.; Webber, M.; Barnett, J.; Wang, M. Water diversion and sea-level rise: Potential threats to freshwater supplies in the Changjiang River estuary. Estuar. Coast. Shelf Sci. 2015, 156, 52–60. [Google Scholar] [CrossRef]
  35. Hsu, M.H.; Wu, C.R.; Liu, W.C.; Kuo, A.Y. Investigation of turbidity maximum in a mesotidal estuary, Taiwan. JAWRA J. Am. Water Resour. Assoc. 2006, 42, 901–914. [Google Scholar] [CrossRef]
  36. Liu, W.C.; Ke, M.H.; Liu, H.M. Response of salt transport and residence time to geomorphologic changes in an estuarine system. Water 2020, 12, 1091. [Google Scholar] [CrossRef]
  37. Hsu, M.H.; Kuo, A.Y.; Kuo, J.T.; Liu, W.C. Procedure to calibrate and verify numerical models of estuarine hydrodynamics. J. Hydraul. Eng. 1999, 125, 166–182. [Google Scholar] [CrossRef]
  38. Liu, W.C.; Hsu, M.H.; Wu, C.R.; Wang, C.F.; Kuo, A.Y. Modeling salt water intrusion in Tanshui River estuarine system-Case-study contrasting now and then. J. Hydraul. Eng. 2004, 130, 849–859. [Google Scholar] [CrossRef]
  39. U.S. Environmental Protection Agency (USEPA). Methods for Chemical Analysis of Water and Waste; U.S. Environmental Protection Agency: Washington, DC, USA, 1983.
  40. Hansen, D.V.; Rattray, M. New dimension in estuary classification. Limnol. Oceanogr. 1966, 11, 319–326. [Google Scholar] [CrossRef]
  41. Prandle, D. Estuaries: Dynamic, Mixing, Sedimentation and Morphology; Cambridge University Press: Cambridge, UK, 2009; 236p. [Google Scholar]
  42. Guan, W.; Kot, S.; Wolanski, E. 3-D fluid-mud dynamics in the Jiaojiang Estuary. Estuar. Coast. Shelf Sci. 2005, 65, 747–762. [Google Scholar] [CrossRef]
  43. Dyer, K.R.; New, A.L. Intermittency in estuarine mixing. In Estuarine Variability; Wolfe, D.A., Ed.; Academic Press, Inc.: Cambridge, MA, USA, 1986; pp. 321–329. [Google Scholar]
  44. Miles, J.W. On the stability of heterogeneous shear flows. J. Fluid Mech. 1961, 10, 496–508. [Google Scholar] [CrossRef] [Green Version]
  45. Geyer, W.R.; Smith, J.D. Shear stability in a highly stratified estuary. J. Phys. Oceanogr. 1987, 17, 1668–1679. [Google Scholar] [CrossRef] [Green Version]
  46. Chen, W.B.; Liu, W.C. Modeling investigation of asymmetric tidal mixing and residual current in a partially stratified estuary. Environ. Fluid Mech. 2016, 16, 167–191. [Google Scholar] [CrossRef]
  47. Liu, W.C. Modelling circulation and vertical mixing in estuaries. Proc. Inst. Civ. Eng. Marit. Eng. 2006, 159, 67–76. [Google Scholar] [CrossRef]
  48. Moskalski, S.; Torres, R. Influences of tides, weather, and discharge on suspended sediment concentration. Cont. Shelf Res. 2012, 37, 36–45. [Google Scholar] [CrossRef]
  49. Mitchell, S.B.; Green, M.O.; MacDonald, I.T.; Pritchard, M. Field studies of estuarine turbidity under different freshwater flow conditions, Kaipara River, New Zealand. Estuar. Coast. Shelf Sci. 2017, 198, 542–554. [Google Scholar] [CrossRef] [Green Version]
  50. Yang, H.F.; Yang, S.L.; Xu, K.H. River-sea transitions of sediment dynamics: A case study of the tide-impacted Yangtze River estuary. Estuar. Coast. Shelf Sci. 2017, 196, 207–216. [Google Scholar] [CrossRef]
  51. Restrepo, J.C.; Schrottke, K.; Traini, C.; Bartholomae, A.; Ospino, S.; Ortiz, J.C.; Otero, L.; Orejarena, A. Estuarine and sediment dynamics in a microtidal tropical estuary of high fluvial discharge: Magdalena River (Colombia, South America). Mar. Geol. 2018, 398, 86–98. [Google Scholar] [CrossRef]
  52. Li, Z.; Jia, J.; Wang, Y.P.; Zhang, G. Net suspended sediment transport modulated by multiple flood-ebb asymmetries in the progressive tidal wave dominated partially stratified Changjiang Estuary. Mar. Geol. 2022, 443, 106702. [Google Scholar] [CrossRef]
  53. Le Hir, P.; Cayocca, F. 3D application of the continuous modelling concept to mud slides in open seas. In Proceedings in Marine Science; Winterwerp, J.C., Kranenburg, C., Eds.; Elsevier: Amsterdam, The Netherlands, 2002; pp. 545–562. [Google Scholar]
  54. Cheng, P.; Wilson, R.E.; Chant, R.J.; Fugate, D.C.; Flood, R.D. Modeling influence of stratification on lateral circulation in a stratified estuary. J. Phys. Oceanogr. 2009, 39, 2324–2337. [Google Scholar] [CrossRef]
  55. Zhang, W.; Zheng, J.; Ji, X.; Hoitink, A.J.F.; van der Vegt, M.; Zhu, Y. Surficial sediment distribution and the associated net sediment transport pattern in the Pearl River Estuary, South China. Cont. Shelf Res. 2013, 61–62, 41–51. [Google Scholar] [CrossRef]
  56. Brouwer, R.L.; Schramkowski, G.P.; Dijkstra, Y.M.; Schuttelaars, H.M. Time evolution of estuarine turbidity maxima in well-mixed, tidally dominated estuaries: The role of availability- and erosion-limited conditions. J. Phys. Oceanogr. 2018, 48, 1629–1650. [Google Scholar] [CrossRef]
  57. Van Maren, D.; Vroom, J.; Fettweis, M.; Vanlede, J. Formation of the Zeebrugge coastal turbidity maximum: The role if uncertainty in near-bed exchange processes. Mar. Geol. 2020, 425, 106186. [Google Scholar] [CrossRef]
Figure 1. Map of the tidal Danshuei River system and sampling stations.
Standards 02 00016 g001
Figure 2. Instrumentation photographs (a) water collector, (b) conductivity–temperature–depth (CTD) sensor, and (c) acoustic Doppler current profiler (ADCP).
Standards 02 00016 g002
Figure 3. Water level and discharge at Guandu Bridge on (a) 4 July 2016, and (b) 17 July 2019. Note that the positive and negative discharges represent the flow downriver and upriver, respectively.
Standards 02 00016 g003
Figure 4. Salinity and suspended-sediment concentration on 4 July 2016, at (a) Guandu Bridge, (b) Taipei Bridge, (c) Xinhai Bridge, (d) Zhongzheng Bridge, and (e) Bailing Bridge. The mean value ± one standard deviation for each measured time is shown.
Standards 02 00016 g004aStandards 02 00016 g004b
Figure 5. Salinity and suspended-sediment concentration on 17 July 2019 at (a) Guandu Bridge, (b) Taipei Bridge, (c) Xinhai Bridge, (d) Zhongzheng Bridge, and (e) Bailing Bridge. The mean value ± one standard deviation for each measured time is shown.
Standards 02 00016 g005aStandards 02 00016 g005b
Figure 6. Vertical distributions of (a,b) salinity and (c,d) SSC during high- and low-flow conditions at high slack tide at (a,c) Guandu Bridge and (b,d) Taipei Bridge.
Standards 02 00016 g006aStandards 02 00016 g006b
Figure 7. Temporal variations in stratification parameters on 4 July 2016 at (a) Guandu Bridge and (b) Taipei Bridge.
Standards 02 00016 g007
Figure 8. Temporal variations in stratification parameters on 17 July 2019 at (a) Guandu Bridge and (b) Taipei Bridge.
Standards 02 00016 g008
Figure 9. Time-series variations in salinity along the channel on (a) 4 July 2106 and (b) 17 July 2019.
Standards 02 00016 g009
Figure 10. SSC time-series variations along the channel on (a) 4 July 2016 and (b) 17 July 2019.
Standards 02 00016 g010
Publisher’s Note: MDPI stays neutral with regard to jurisdictional claims in published maps and institutional affiliations.

